n annual rural sanitation survey (narss) · national report national annual rural sanitation survey...
TRANSCRIPT

National Report National Annual Rural Sanitation Survey (NARSS), Round-2, 2018-2019
CONTENTS PAGE i
पेयजल और स्वच्छता मंत्रालय MINISTRY OF DRINKING WATER AND SANITATION
NATIONAL ANNUAL RURAL SANITATION SURVEY (NARSS) ROUND-2 (2018-19)
NATIONAL REPORT
Submitted to
Ministry of Drinking Water and Sanitation (MDWS),
Government of India, Pt Deendayal Antyodaya Bhawan, 4th Floor, CGO Complex, Lodi Road, New Delhi-110003
Prepared by Independent Verification Agency (IVA)

National Report National Annual Rural Sanitation Survey (NARSS), Round-2, 2018-2019
CONTENTS PAGE ii
CONTENTS

National Report National Annual Rural Sanitation Survey (NARSS), Round-2, 2018-2019
CONTENTS PAGE iii

National Report National Annual Rural Sanitation Survey (NARSS), Round-2, 2018-2019
CONTENTS PAGE iv
LIST OF TABLES
LSIT OF FIGURES

National Report National Annual Rural Sanitation Survey (NARSS), Round-2, 2018-2019
CONTENTS PAGE v

National Report National Annual Rural Sanitation Survey (NARSS), Round-2, 2018-2019
CONTENTS PAGE vi
LSIT OF ANNEXURE TABLES

National Report National Annual Rural Sanitation Survey (NARSS), Round-2, 2018-2019
CONTENTS PAGE vii

National Report National Annual Rural Sanitation Survey (NARSS), Round-2, 2018-2019
EXECUTIVE SUMMARY PAGE 8
EXECUTIVE SUMMARY
o accelerate the efforts to achieve universal sanitation coverage and to put focus on safe sanitation, the
Prime Minister of India launched the Swachh Bharat Mission on 2nd October 2014. Swachh Bharat Mission
aims to achieve Swachh Bharat by 2019, as a fitting tribute to the 150th Birth Anniversary of Mahatma Gandhi,
which in rural areas shall mean improving the levels of cleanliness in rural areas through Solid and Liquid Waste
Management activities and making Gram Panchayats Open Defecation Free (ODF), clean and sanitized. ODF
would mean the termination of feco-oral transmission, defined by, a) no visible feces found in the
environment/village and, b) every household as well as public/community institution(s) using safe technology
option for disposal of feces. The World Bank is supporting the Government of India’s initiative of ‘Swachh Bharat
Mission Support Operation’ which comprised of two categories of activities: Performance incentives for
sanitation improvement in rural areas;
Technical Assistance for strengthening institutional capacities on program management, advocacy, and
communications, and implementing a credible and robust monitoring & evaluation system to measure results of
SBM-G.
To execute the activities, World Bank decided to reward the performance of states basis of achieving key
sanitation outcomes which were measured through four disbursement linked indicators1
1. DLI #1: Reduction in the prevalence of Open Defecation
2. DLI #2: Sustaining ODF Status in villages
3. DLI #3: Increase in population with access to Solid & Liquid Waste Management
4. DLI #4: Operationalization of Performance Incentive Grant Scheme by MDWS
Aligned with the requirement of the programme, the Ministry of Drinking Water & Sanitation selected M/s IPE
Global in association with Hindustan Thompson Associates Private Limited, represented by KANTAR PUBLIC (A
specialist unit of HTA Pvt ltd /IMRB International division) as an Independent Verification Agency (IVA) to conduct
National Annual Rural Sanitation Survey (NARSS) for measuring the performance of each state with respect to
the above mentioned DLIs.
The report is based on The National Annual Rural Sanitation Survey (NARSS)- Round-2 (2017-18) which was
conducted between November 2018 to February 2019. The primary objective of the survey was to measure the
Disbursement Linked Indicators (DLIs) in the Round-2 against the baseline which was already in place after NARSS
Round-1 survey. The NARSS Round-2 DLI report is intended to work as a reference point for the World Bank
project support to the Swacch Bharat Mission (Gramin).
1 World Bank; Report No: 93632-IN, Project Appraisal Document for the Swachh Bharat Mission Support Operation; 2015
T

National Report National Annual Rural Sanitation Survey (NARSS), Round-2, 2018-2019
EXECUTIVE SUMMARY PAGE 9
The survey components included sampled household survey and village survey which gathered information on
various aspects of the sanitation related indicators under the purview of Disbursement Linked Indicators (DLIs).
These indicators were primarily focusing on (i) DLI#1: Reduction in the prevalence of Open Defecation (ii) DLI#1:
Sustaining ODF status in villages, and (iii) DLI#3: Increase in population with Solid Liquid Waste Management
practices. The village component of the survey was designed to capture the data pertaining to the sanitation
aspect of the Schools, Anganwadi Centers, Public Toilets and Public Spaces. The entire survey process, from the
questionnaire design to field work and quality check was supervised by the Expert Working Group (EWG), under
the chairmanship of Prof. Amitabh Kundu and co-chairmanship of Dr. NC Saxena. The EWG included
representatives of the World Bank, UNICEF, Water Aid, BMGF, NSSO and India Sanitation Coalition among others.
The NARSS survey covered rural areas of 29 states and 3 Union Territories, with total proposed sample size of
92040 households as per the calculated sample size required by the study, proportionately distributed across
6136 villages. The sample framework was approved by the Expert Working Group set up to guide and steer the
National Annual Rural Sanitation Survey. Altogether 6136 villages and 92411 Households were covered.
The National Annual Rural Sanitation Survey (NARSS) was designed to verify the sanitation related indicators
which primarily focuses on availability and access to the safe, hygienic and functional sanitation facilities and
solid and liquid waste (SLWM) management practices. The main objectives of the NARSS are as under:
a) To collect data on availability, accessibility, cleanliness/ hygiene, functionality and usage of the toilets of
the household and public institutions.
b) To verify the actual sanitation coverage in rural areas in terms of availability and accessibility of toilets.
c) To verify access to the safe, hygienic and functional status of sanitation facilities.
d) To gather information on safe waste disposal practices across ODF and Non-ODF categories of the
villages.
e) To measure the community managed sanitation systems focusing on scientific solid and liquid waste
management systems for overall cleanliness in rural areas.
f) To gather information on instances of open defecation in public places and solid and liquid waste disposal
mechanism in the village.
NARSS SAMPLING METHODOLOGY
NARSS survey is a cross-sectional survey and covers ODF and Non-ODF rural areas across 29 states & 3 UTs in
India. This report is based on the information gathered from 92411 households, 6002 schools, 6082 Anganwadi
Centres, 1091 Public toilets and 6136 Public spaces from 6136 PSUs. Two types of sampled villages- ODF verified
and Non-ODF (including ODF declared but not verified) were covered in the survey. The sample size for each
state is statistically significant and is proportionate to the total rural households in that state/ UT. Within each
state/ UT, the sample size is statistically significant for ODF verified and non-ODF categories and is proportionate
to the total rural households in ODF verified and non-ODF villages in that state/ UT. MIS data from MDWS with
cut-off date of 6th June 2018, as approved by the EWG, was used to determine the proportion of rural population
living in ODF and Non-ODF areas in each state/ UT.

National Report National Annual Rural Sanitation Survey (NARSS), Round-2, 2018-2019
EXECUTIVE SUMMARY PAGE 10
About 200 households were listed in each village (over 12 lakhs households across the country). A total of 20
households (15 targeted + 5 additional HHs as a replacement) were selected systematically from each of the PSU.
The total number for selection of households for main interview was revised in consultation with MDWS
(Meeting on 27th January 2019) in the mid-way of data collection which also includes the selection of 24
household including 20% buffer basis the size of the PSUs wherein the total households in the village is more
than 750. Out of 24 households, 20 households were canvassed for main interview while remaining 4 HHs were
put as substitute.) Selection of different number of households as per the size of the village will help in comparing
the key sanitation indicators and also to make the sample more representative of the universe.
Along with households, the village components like Schools, Anganwadi, Public/ Community Toilets and Public
spaces were also selected using systematic random sampling in the same village for the survey. The sampling
design undertaken in this survey yields results within a 95% confidence interval and within 5% of margin of error.
The sampling methodology used was Probability Proportion to Size (PPS). This report provides the detailed
description of survey findings pertaining to key areas of interest for rural sanitation. The survey specifically
covered the verification of toilet accessibility to the safe, functional, hygienic sanitation facilities by the
households and village level public facilities.
QUALITY CONTROL
Several quality control measures were put in place to ensure that uniform procedures across the states and UTs
are preserved. These included:
• Preparing comprehensive manuals including Interviewer’s manual & Supervisor’s manual.
• Multiple levels of monitoring and supervisions of the field work including monitoring by the supervisors,
state coordinators from the Kantar Public; monitoring by senior staff from the state offices of the Kantar
Public; field monitoring by core team members of the Kantar Public, in addition to monitoring of field
activities by senior members of MDWS and representatives of The World Bank. Immediate corrective
measures were taken in case there were any deviations from the survey protocols.
• The field supervisors in each interviewing team were required to observe interviews in a sub-sample of
households and to conduct back-checks with respondents as a further check on the quality of field work.
• Use of computer assisted personal interviewing (CAPI) and the transfer of field data to the server on a
daily basis was instrumental in remotely monitoring of progress of field activities. Use of dashboard data
to run the extensive data quality checks of the data and to provide real-time feedback to field teams to
help improve data quality.
• To ensure uniformity in the implementation of the field work protocols in every state, a training of
trainers was conducted at MDWS. The core team members and state coordinators of Kantar Public
participated in the TOT. These trained persons were responsible for organizing state level training
programmes in local and regional languages for minimum three days including one day’s field practice
which were supervised by the senior members of the MDWS, a representative of the World Bank and
core team members of Kantar Public & IPE Global.
• Field check tables were produced on a regular basis to identify any inconsistency that might have
occurred in eliciting information and recording question responses. Information from the field check

National Report National Annual Rural Sanitation Survey (NARSS), Round-2, 2018-2019
EXECUTIVE SUMMARY PAGE 11
tables was fed back to state coordinators so that corrective actions could be taken immediately, and
performance of the teams could be improved.
SUMMARY OF FINDINGS OF DLI
SBM (G) performance of the states was measured through their performance on the disbursement linked
indicators (DLIs) through the NARSS Round-1 survey which intended to provide the baseline values. The
performance of DLI helped in setting benchmark for the distribution of financial incentives to states, which was
directly proportional to the actual DLI performance of the states. The different DLIs were calculated basis the set
of robust parameters agreed in the NARSS protocol and approved by EWG, and even if any of the prescribed
criteria for qualifying the ODFness were not followed, the villages were declared as non-ODF. The detailed
description of DLI and its calculation process has been given in separate chapter. The State-wise performance of
the states against the DLIs is as below:

Interim Report National Annual Rural Sanitation Survey (NARSS), Round-2, 2018-2019
EXECUTIVE SUMMARY PAGE 12
DLIs Scores- India & States
States
DLI 1 DLI 2 DLI 3
NARSS 1 NARSS 2 NARSS 1 NARSS 2 NARSS 1 NARSS 2
%
Rural population using safe,
functional & hygienic toilets
%
Rural population using safe,
functional & hygienic toilets
%
Rural population
living in ODF verified villages
%
Rural population
living in ODF verified villages
%
Rural population practicing
SLWM
%
Rural population practicing
SLWM
India 62.3 545247322 82.7 728144072 95.3 155002809 90.4 362183642 28.3 255782608 63.3 557730094
A & N Islands 65.3 209858 97.8 315987 - - 96.4 311369 61.9 199071 69.7 225299
Andhra Pradesh 68.6 24871405 88.6 32323304 100.0 2925952 92.4 23060424 26.2 9504471 54.8 19998231
Arunachal Pradesh 58.2 463366 91.5 713673 - - 94.1 357903 0 0 45.4 354065
Assam 75.4 20808860 86.5 24043997 76.5 2815534 75.0 4582597 22.6 6236156 18.7 5198706
Bihar 36.6 34646067 60.1 57413557 90.5 3231747 43.6 2398461 6.1 5785870 24.6 23476481
Chhattisgarh 87.7 17318659 98.8 19594157 100.0 8759842 96.4 19117296 46.2 9116970 78.8 15640215
D & N Haveli 98.8 148905 100.0 141066 - - 100 141066 8.4 12594 97.2 137152
Goa 89.9 665445 78.2 573382 - - - - 18.1 133882 48.5 355992
Gujarat 92.4 34090725 98.2 36435167 95.4 26414631 96.7 35866251 69.2 25538996 97.0 35988071
Haryana 92.6 16435512 98.4 17546598 100.0 10718836 95.8 17073616 72.4 12864052 98.5 17559418
Himachal Pradesh 99.0 6264767 98.7 6276861 96.9 5738361 91.6 5828758 89.3 5651344 93.9 5976219
Jammu & Kashmir 38.7 3510916 82.2 7495867 - - 77.9 2420215 9.8 890966 45.0 4106235
Jharkhand 45.2 11792424 64.0 16876179 92.9 3666489 68.9 4763648 19.8 5163520 47.9 12618423
Karnataka 63.9 24517550 81.3 31237063 100.0 3940279 91.5 22252271 21.6 8296703 42.8 16464194
Kerala 100.0 26883783 99.5 26912694 99.1 19036553 98.7 26695957 91.8 24684134 88.9 24040915
Madhya Pradesh 65.6 37351056 80.8 46534660 100.0 4574803 86.8 15920074 30.0 17061416 45.9 26432685
Maharashtra 69.8 43802548 85.3 53617466 95.0 10459673 93.5 42157166 35.8 22462903 80.6 50651985
Manipur 74.4 1468998 94.3 1882958 - - 97.1 950137 0 0 51.9 1035224
Meghalaya 89.7 1990351 90.0 2015747 74.7 882659 93.5 1082851 76.0 1687258 58.3 1306022
Mizoram 86.9 418741 88.9 428727 87.3 165556 93.4 222705 50.1 241215 93.3 449886
Nagaland 72.7 1455860 89.6 1810964 - - 90.6 992486 13.6 272582 68.0 1375006
Odisha 53.9 19007503 55.0 19486627 96.3 2479985 88.7 3518915 11.3 3976215 22.3 7887730
Puducherry 55.4 289553 78.1 419133 - - - - 1.9 9980 22.7 121769
Punjab 67.3 11584799 84.4 14503631 99.6 2850318 78.5 7531631 38.1 6554735 60.6 10414312
Rajasthan 73.2 41322126 91.3 52121678 88.2 11085919 90.9 39214603 29.7 16763722 86.6 49466533
Sikkim 98.7 550507 98.2 550958 96.0 411413 95.5 535774 91.3 509369 99.2 556559
Tamil Nadu 54.6 14933905 82.5 21959798 83.8 1423383 73.3 3705449 16.7 4565382 77.7 20695059
Telangana 69.0 15994491 90.6 21172815 100.0 3775110 84.3 8208972 38.3 8891676 56.2 13118205
Tripura 57.5 1783687 85.2 2663262 - - - - 8.1 250080 19.1 595549
Uttar Pradesh 41.9 72354266 83.4 145867439 100.0 4475009 87.3 23888795 22.7 39196890 81.3 142133894
Uttarakhand 86.3 6534497 97.6 7437881 97.0 2476082 90.4 6886967 61.1 4625312 93.4 7118563
West Bengal 76.7 51776196 85.0 57770777 95.2 22694674 89.5 42497288 21.7 14635143 62.2 42231497

Interim Report National Annual Rural Sanitation Survey (NARSS), Round-2, 2018-2019
EXECUTIVE SUMMARY PAGE 13
LESSON LEARNED & WAY FORWARD ON NARSS
Over the period of operationalization of NARSS Round-1, some important lessons were learnt which helped
improve the NARSS Round 2. Key lessons learnt include:
• Improving introduction to the Survey: The surveyors were found to be referring SBM while giving
introduction to the survey respondent. By taking note of this when it was found that reference of SBM
during introduction may dilute the effect of NARSS as being independent survey, the word SBM was
struck off.
• While listing exercise, the household recorded locked were decided to be revisited before final
submission into the CAPI. This broadened the sample frame up-to some extent and made the household
sample through SRS more representative.
• Segmentation of village with more than 200 households, the operational protocol guided that the main
segment of the village will automatically be selected, and the second segment will be selected as per
randomization. The protocol revisited by the researcher and corrected in a way that could make the
segmentation and selection only on random basis.
• Likewise, for the village level public facility interview, the initial guideline was to conduct interview in the
higher facility eg. School with higher level of education or Anganwadi centre catering services to the
higher population. It was later noted that the selection of facility (School, AWC & Public toilet) for
conducting interview should be through random selection only which provides more representativeness
to the available facility in the sampled village.
• Probing techniques in accessibility questions of household and village level survey questionnaire were
improved when it was observed that there is a scope of improvement. Sometimes, the respondent made-
out of the question posed to them that the interviewers are enquiring about availability of the toilet
which was not the case whatsoever.
• Interviewers started using probing methods as to which types of toilet technology was used.
Several insights and learnings have emerged out of the National Annual Rural Sanitation Survey which should
emerge as the priority actions for the Ministry for future years. The key lessons emerging out of NARSS include
focussing IEC interventions on safe disposal of human excreta in villages, prioritising solid and liquid waste
management arrangements in villages, retrofitting of toilets for ensuring safe disposal of human excreta etc.
MDWS would have to develop interventions and monitor its implementation so that these areas are addressed.
Summary of the lesson learnt from NARSS Round-1 & discussion took place between IVA and MDWS
The followings key points were taken into consideration at the time of data collection, which were emphasized
by the MDWS while discussing the quality assurance aspect of the survey.
• While canvassing the accessibility questions of the household module, probing techniques were
adopted. The idea was if the respondents were unable to comprehend the questions, the probing helped
them understand the accessibility questions properly.
• Before interviewing the respondent, a walk around the household premises if feasible is necessary, so
that nothing could be missed out while recording the responses.

Interim Report National Annual Rural Sanitation Survey (NARSS), Round-2, 2018-2019
EXECUTIVE SUMMARY PAGE 14
• Ensured in-depth understanding of all aspect of questionnaire. Background of each sanitation related
indicators were understood by the field teams.
• In few instances, it was observed that in response to the questions of accessibility of toilet, the
respondent shown the shared toilet while they have had their own toilet which was under construction.
The provision of capturing of toilet photographs added after interviewing functionality part of the
questionnaire.

Interim Report National Annual Rural Sanitation Survey (NARSS), Round-2, 2018-2019
CHAPTER-1: INTRODUCTION PAGE 15
CHAPTER-1: INTRODUCTION 1.1. BACKGROUND AND CONTEXT
o accelerate the efforts to achieve universal sanitation coverage and to put focus on safe sanitation, the
Prime Minister of India launched the Swachh Bharat Mission on 2nd October 2014. Swachh Bharat Mission
aims to achieve Swachh Bharat by 2019, as a fitting tribute to the 150th Birth Anniversary of Mahatma Gandhi,
which in rural areas shall mean improving the levels of cleanliness in rural areas through Solid and Liquid Waste
Management activities and making Gram Panchayats Open Defecation Free (ODF) clean and sanitized. ODF
would mean the termination of faeco-oral transmission, defined by, a) no visible faeces found in the
environment/village and b) every household as well as public/community institution(s) using safe technology
option for disposal of faeces.
India through the launch of Swacch Bharat Mission (SBM) has created that rare window of opportunity that could
improve the quality of life for its 1.2 billion citizens and lay the foundations for a truly prosperous future–a future
that will impact the country and its people for generations to come. The Hon’ble Prime Minister, in his
Independence Day speech on 15 August 2014, espoused the need for a clean India. He called for Swachh Bharat,
a massive mass movement that seeks to engage everyone in the task of cleaning homes, work places, villages,
cities and surroundings, in a collective quest.
The Strategy was to move towards a ‘Swachh Bharat’ by making it a massive mass movement that seeks to
engage everyone in the task of cleaning homes, work places, villages, cities and surroundings, in a collective
quest. The focus has been to provide flexibility to State governments, as sanitation is a State subject, to decide
on their implementation policy, use of funds and mechanisms, considering the state specific requirements. This
was to enable States to develop an Implementation Framework that can utilize the provisions under the Mission
effectively and maximize the impact of the interventions. The Government of India’s role is to complement the
efforts of the State governments through the focused programme being given the status of a Mission, recognizing
its dire need for the country.
Behaviour change has been the key differentiator of Swachh Bharat Mission and therefore emphasis is placed
on Behaviour Change Communication (BCC). BCC is not a 'stand-alone' separate activity to be done as a
'component' of SBM-G, but about mobilizing and nudging communities into adopting safe and sustainable
sanitation practices through effective BCC. The approach was to adopt Community Approaches to Sanitation
(CAS) focusing heavily on triggering entire communities and on achieving collective behavioural change.
Emphasis was placed on awareness generation, triggering mindsets leading to community behaviour change and
demand generation for sanitary facilities in houses, schools, Anganwadis, places of community congregation, and
for Solid and Liquid Waste Management activities. Since Open Defecation Free villages cannot be achieved
without all the households and individuals conforming to the desired behaviour of toilet use every day and every
time, community action and generation of social norms are key.
Swacch Bharat Mission is at a unique juncture where historic changes related to collective behaviour change and
improving the practice of defecation unfolded in lakhs of villages across States. A number of India’s states took
T

Interim Report National Annual Rural Sanitation Survey (NARSS), Round-2, 2018-2019
CHAPTER-1: INTRODUCTION PAGE 16
pioneering bold new initiatives to tackle the menace of open defecation, many of sector’s long-standing
challenges and are making great strides towards collective and sustainable sanitation and hygiene outcomes.
1.2. PURPOSE AND OBJECTIVES OF NARSS
The World Bank is supporting the Government of India’s initiative of ‘Swachh Bharat Mission Operation’ which
comprised of two categories of activities:
a) Performance incentives for sanitation improvement in rural areas;
b) Technical Assistance for strengthening institutional capacities on program management, advocacy, and
communications, and implementing a credible and robust monitoring & evaluation system to measure
results of SBM-G.
To execute the activities, the Government of India, Ministry of Drinking Water and Sanitation and the World Bank
agreed for the World Bank support on SBMSO, to reward the performance of states basis of achieving key
sanitation outcomes which were measured through four disbursement linked indicators2
1. DLI #1: Reduction in the prevalence of Open Defecation
2. DLI #2: Sustaining ODF Status in villages
3. DLI #3: Increase in population with access to Solid & Liquid Waste Management
4. DLI #4: Operationalization of Performance Incentive Grant Scheme by MDWS
Aligned with the requirement of the programme, the Ministry of Drinking Water & Sanitation selected an
Independent Verification Agency (IVA) IPE Global in consortium with Kantar Public to conduct National Annual
Rural Sanitation Survey (NARSS) for measuring the performance of each state with respect to the above
mentioned DLIs.
As did NARSS Round-1, information on open defecation incidence, the levels of ODF status sustaining among the
villages which have already been verified as ODF and solid & liquid waste management related indicators were
generated that formed the basis for release of performance incentives to the states.
The National Annual Rural Sanitation Survey (NARSS) was designed to verify the sanitation related indicators
which primarily focuses on availability and access to the safe, hygienic and functional sanitation facilities,
sustaining ODF status of the villages and improved solid and liquid waste (SLWM) management. The main
objectives of the NARSS are as under:
a. To collect data on availability, accessibility, cleanliness/ hygiene, functionality and usage of the
toilets of the household and public institutions.
b. To verify the actual sanitation coverage in rural areas in terms of availability, accessibility and
usage of toilets.
c. To gather information on safe waste disposal practices across ODF and Non-ODF categories of
the villages.
d. To measure the community managed sanitation systems focussing on scientific solid and liquid
waste management systems for overall cleanliness in rural areas.
e. To gather information on instances of open defecation in public places and solid and liquid waste
disposal mechanism in the village.
2 World Bank; Report No: 93632-IN, Project Appraisal Document for the Swachh Bharat Mission Support Operation; 2015

Interim Report National Annual Rural Sanitation Survey (NARSS), Round-2, 2018-2019
CHAPTER-1: INTRODUCTION PAGE 17
Geographically, the survey was conducted in the rural areas of 29 Indian states and 3 Union Territories (UTs).
The total sample size targeted at the national level was 92040 HHs as per the calculated sample size required
for the survey, proportionately distributed across 6,136 villages (Primary Sampling Units). Details of state wise
sample allocation have been given in the subsequent chapter.
1.3. APPROACH TO THE SURVEY
As did National Annual Rural Sanitation Survey, Round-1 (done by the Independent Verification Agency or IVA),
the National Annual Rural Sanitation Survey, Round-2 was expected to provide the estimates for the key
indicators to measure progress on DLIs and other key results. It has provided the progress against baseline on
DLIs - namely, changes in indicator values.
World Bank Disbursement
Linked Indicator
1
2
3
NARSS measures the outcomes basis World Bank’s Disbursement
Linked Indicators (DLI)

Interim Report National Annual Rural Sanitation Survey (NARSS), Round-2, 2018-2019
CHAPTER-2: METHODOLOGY AND APPROACH PAGE 18
CHAPTER-2: METHODOLOGY & APPROACH 2.1. SURVEY DESIGN
he annual rounds of the NARSS is a cross sectional survey. NARSS 2 was conducted between November
2018 to February 2019. Different components of NARSS are pictorially described below:
In the village categories (ODF villages and non-ODF villages), besides toilet access, functionality, hygienic
condition, usage, safe disposal of excreta and information on safe disposal mechanisms of solid and liquid waste
management at the village/ household level was collected through CAPI (Computer Assisted Personal Interview)
platform.
2.2. TARGET RESPONDENTS
Listing: The key respondents for the listing exercise were any adult member of the household (aged more than
18 years) who provided basic information with respect to the head of the household & other information.
Household Survey: The key respondents for the household survey were an adult member of the household (aged
more than 18 years) who provided comprehensive information with respect to the household level sanitation
practices. However, the teams tried to conduct the household level interviews with the head of the household
and other members whoever was available during the survey. The other members of the household were
interviewed only for usage of the toilet.
Village Survey: The key respondents were school headmaster/ head teacher, the Anganwadi Worker (AWW)/
Helper and/ or the key officials such as Sarpanch/ Gram Panchayat (GP) secretary or other prominent people in
the village.
NARSS Survey
Household Listing Household Survey Village Survey
ODF Verified Villages Non ODF Villages
T

Interim Report National Annual Rural Sanitation Survey (NARSS), Round-2, 2018-2019
CHAPTER-2: METHODOLOGY AND APPROACH PAGE 19
2.3. SAMPLING METHODOLOGY
Sampling frame of NARSS covers all the 29 States and 3 Union Territories (Andaman and Nicobar Islands, Dadra
and Nagar Haveli and Puducherry). In Round-2, total sample size at the national level was 6,136 villages covering
92,040 households comprised of two sample streams viz., ODF (verified) and non-ODF (including ODF declared
but not verified). A three-stage sampling procedure was adopted to select sample households across the states
where villages were primary sampling units (PSUs).
Stage 1: Allocation of samples in the states/UTs As a first step, total study target sample size (92,040 HHs) has been allocated to each state/UT based on the
proportion of rural household of the state and UT as per IMIS data received from NIC & MDWS with the cut-off
date considered as 6th June 2018.
The state wise sample was further adjusted to ensure allocation of minimum sample size to each state/UT to
keep margin of error within 5 percent.
As a next step within the selected village, the one which were having less than or equal to 200 household,
complete listing of the village was carried out and a total number of 18 households got selected following
systematic random sampling procedure including 20% buffer, out of which first 15 households were canvassed
subject to the availability of reliable informant in those households and remaining 3 households were used as a
substitute sample if necessary. The selection criteria of the household revised in consultation with client (MDWS
& World Bank) and that the selection of 20 households (15 targeted + 5 additional HHs as a replacement) were
done for the PSUs with less than 750 HHs while 24 households were sampled including 20% buffer in the PSUs
which were having more than 750 households. Out of 24 HHs, 20 households were surveyed and remaining 4
households were used as substitute. The discussion of revision of selection criteria of household was held on 27th
January 2019 at Ministry of Drinking Water & Sanitation.
Those villages wherein more than 200 households were found, were segmented and 2 segments were eventually
selected randomly for house-listing exercise.
The below table provides the detail of final adjusted villages and sample HHs covered in each study state/UT.
Below table provides sample distribution in proportionate to the state population post adjustment of minimum
sample size for desired statistical sample requirement at state level.
State level sample distribution by total villages and households
S. No State/ Union Territory
IMIS -2018 Villages (PSUs) HHS
Total Villages Total Rural Households
Total Total
INDIA 6,01,909 15,76,02,132 6,136 92,040
1 ANI 192 37,359 26 390
2 ANDHRA PRADESH 18,841 71,04,047 271 4065
3 ARUNACHAL PRADESH 5,389 1,84,493 52 780
4 ASSAM 25,503 53,00,987 189 2835
5 BIHAR 38,803 1,60,90,363 566 8490
6 CHHATTISGARH 18,769 48,44,733 184 2760
7 DADRA & NAGAR HAVELI 69 33,324 26 390

Interim Report National Annual Rural Sanitation Survey (NARSS), Round-2, 2018-2019
CHAPTER-2: METHODOLOGY AND APPROACH PAGE 20
S. No State/ Union Territory
IMIS -2018 Villages (PSUs) HHS
Total Villages Total Rural Households
Total Total
8 GOA 375 1,83,308 26 390
9 GUJARAT 18,261 50,85,069 194 2910
10 HARYANA 6,908 26,82,748 102 1530
11 HIMACHAL PRADESH 15,921 14,33,781 55 825
12 JAMMU & KASHMIR 7,565 14,48,501 80 1200
13 JHARKHAND 29,598 40,02,257 152 2280
14 KARNATAKA 26,983 70,33,759 268 4020
15 KERALA 2,027 46,82,727 178 2670
16 MADHYA PRADESH 50,228 90,59,667 324 4860
17 MAHARASHTRA 40,500 1,10,57,664 421 6315
18 MANIPUR 2,556 4,42,646 52 780
19 MEGHALAYA 6,028 4,42,833 52 780
20 MIZORAM 695 1,21,576 52 780
21 NAGALAND 1,451 2,55,675 52 780
22 ODISHA 47,415 80,50,105 283 4245
23 PUDUCHERRY 265 88,163 26 390
24 PUNJAB 13,726 28,48,863 108 1620
25 RAJASTHAN 42,869 1,04,13,770 396 5940
26 SIKKIM 441 55,364 26 390
27 TAMIL NADU 12,524 93,72,405 332 4980
28 TELANGANA 11,009 43,30,292 165 2475
29 TRIPURA 1,178 6,83,663 26 390
30 UTTAR PRADESH 98,807 2,50,43,365 888 13320
31 UTTARAKHAND 15,473 15,14,656 58 870
32 WEST BENGAL 41,540 1,36,73,969 506 7590
* States/UTs wherein adjustment was done for minimum sample coverage requirement considering within 5% margin of error.
Stage 2: Village Selection
As a second step, allocated samples to each state/UT (as shown in table-2 above) has been further
proportionately distributed between ODF verified and Non-ODF villages within state/UT based on proportion of
ODF verified HHs and Non-ODF HHs. MIS data received from NIC of MDWS (as on 6th June 2018) (this date is a
cut-off date for the extraction of data) has been utilized for allocation of samples between ODF and Non-ODF
components. The below table provide distribution of villages between ODF and Non-ODF villages within state.
Considering that study has been designed to provide a statistically significant estimate for ODF and Non-ODF
separately at 95 % confidence interval (CI) and 5% margin of error (MOE), we have further adjusted samples
between ODF and Non-ODF category in states with MOE found to be greater than 5%. The states wherein either
ODF villages or Non-ODF villages were found in the sample frame. The sample was drawn from their respective
village category.
Sample distributions within state by ODF & Non-ODF Villages
S. No State/ Union Territory Total ODF Verified sample Non-ODF sample
Villages HHs MoE (%)
Villages HHs MoE (%)
Villages HHs MoE (%)
INDIA 6,136 92,040 2,891 43,365 3,245 48,675
1 ANI 26 390 4.96 26 390 4.96 0 0 NA
2 ANDHRA PRADESH 271 4065 1.54 182 2730 1.88 89 1335 2.68
3 ARUNACHAL PRADESH 52 780 3.51 26 390 4.96 26 390 4.96

Interim Report National Annual Rural Sanitation Survey (NARSS), Round-2, 2018-2019
CHAPTER-2: METHODOLOGY AND APPROACH PAGE 21
S. No State/ Union Territory
Total ODF Verified sample Non-ODF sample
Villages HHs MoE (%)
Villages HHs MoE (%)
Villages HHs MoE (%)
4 ASSAM 189 2835 1.84 42 630 3.90 147 2205 2.09
5 BIHAR 566 8490 1.06 31 465 4.54 535 8025 1.09
6 CHHATTISGARH 184 2760 1.87 184 2760 1.87 0 0 NA
7 DADRA &NAGAR HAVELI 26 390 4.96 26 390 4.96 0 0 NA
8 GOA 26 390 4.96 0 0 NA 26 390 4.96
9 GUJARAT 194 2910 1.82 194 2910 1.82 0 0 NA
10 HARYANA 102 1530 2.51 102 1530 2.51 0 0 NA
11 HIMACHAL PRADESH 55 825 3.41 55 825 3.41 0 0 NA
12 JAMMU & KASHMIR 80 1200 2.83 26 390 4.96 54 810 3.44
13 JHARKHAND 152 2280 2.05 40 600 4.00 112 1680 2.39
14 KARNATAKA 268 4020 1.55 173 2595 1.92 95 1425 2.60
15 KERALA 178 2670 1.90 178 2670 1.90 0 0 NA
16 MADHYA PRADESH 324 4860 1.41 102 1530 2.51 222 3330 1.70
17 MAHARASHTRA 421 6315 1.23 301 4515 1.46 120 1800 2.31
18 MANIPUR 52 780 3.51 26 390 4.96 26 390 4.96
19 MEGHALAYA 52 780 3.51 26 390 4.96 26 390 4.96
20 MIZORAM 52 780 3.51 26 390 4.96 26 390 4.96
21 NAGALAND 52 780 3.51 26 390 4.96 26 390 4.96
22 ODISHA 283 4245 1.50 32 480 4.47 251 3765 1.60
23 PUDUCHERRY 26 390 4.96 0 0 NA 26 390 4.96
24 PUNJAB 108 1620 2.43 60 900 3.27 48 720 3.65
25 RAJASTHAN 396 5940 1.27 302 4530 1.46 94 1410 2.61
26 SIKKIM 26 390 4.96 26 390 4.96 0 0 NA
27 TAMIL NADU 332 4980 1.39 65 975 3.14 267 4005 1.55
28 TELANGANA 165 2475 1.97 68 1020 3.07 97 1455 2.57
29 TRIPURA 26 390 4.96 0 0 NA 26 390 4.96
30 UTTAR PRADESH 888 13320 0.85 133 1995 2.19 755 11325 0.92
31 UTTARAKHAND 58 870 3.32 58 870 3.32 0 0 NA
32 WEST BENGAL 506 7590 1.12 355 5325 1.34 151 2265 2.06
Necessary adjustment has been made to sampling methodology to ensure State-wise margin of error to be less
than 5%. This was done by increasing the number of villages for few States, which had higher MoE. In some of
the large states, ODF verified HH proportion was quite less, hence an adjustment is done in order to keep margin
of errors below five percent in sub-samples. The states coming under category are ANI, Arunachal Pradesh, Dadra
& Nagar Haveli, Goa, J&K, Manipur, Meghalaya, Mizoram, Nagaland, Puducherry & Sikkim. For rest of the states
no adjustment is necessary to contain the margin of error within the limit of five percent for both the sub-
samples. However, for those smaller States where total rural HH population for the whole universe is less (both
verified and Non ODF) it is almost impossible to maintain margin of error below 5 in sub samples. Therefore, for
these small states margin of error was maintained at the overall level only. This sampling methodology is
consistent to the general approach adopted for large scale surveys such as NSSOs. In Round-2, each state had
sufficient number of ODF PSUs in sample frame to get the desired number of ODF PSUs in each state.
Process of village selection: The process of village selection has been explained below for ODF and Non-ODF
categories separately.
a) ODF villages
The following was the key steps involved in the sampling methodology for the sub-component 1 i.e. ‘ODF verified
village’:

Interim Report National Annual Rural Sanitation Survey (NARSS), Round-2, 2018-2019
CHAPTER-2: METHODOLOGY AND APPROACH PAGE 22
1. Generation of the sampling frame based on the list of the ODF verified villages as per IMIS data by each
of the selected state/UT.
2. Selection of the required ODF verified villages (refer Table-2) through the PPS (Probability Proportion to
Size) sampling technique:
Steps involved in PPS sampling
1. Arranging of the state-wise list of ODF villages in the ascending order of village HHs (after excluding the
villages having less than 50 HHs) and calculating the cumulative sum of the HH sizes
2. Computing a sampling interval (SI) by dividing the cumulative HHs with the total number of ODF verified
villages to be sampled in the state
3. Choosing a random number between 1 and the sampling interval from a random table. This would serve
as the Random start (RS) or in other words, is the first selected village
4. Next, the SI is added to the RS to identify the second selected village. In a similar manner, the SI gets
added to each of the previous number to identify the villages till the required number of villages are
selected.
b) Non ODF villages and Non-verified ODF villages
The following were the key steps involved in the sampling methodology for the sub-component 2 i.e. Non-ODF
village (i.e. any village which is not verified ODF and not declared):
1. Generation of the sampling frame based on the list of the Non-ODF villages as per IMIS data by each of
the selected state/UT
2. Selection of the required non-ODF villages (refer Table-2) through the PPS (Probability Proportion to Size)
sampling technique.
3. In NARSS Year-1, we had approximately 70% of the total sample in non-ODF category, hence, in order to
ensure the geographical representation; an additional sampling stage (NSS region) was included while in
NARSS Year-2, approximately 50 % of the total sample lying in ODF verified and non-ODF categories,
hence, direct PPS sampling technique was applied to achieve the required samples in the states as we
applied in sample selection of ODF verified category.
Stage 3: Household selection
Mapping and listing: In each of the selected villages (ODF and Non-ODF), team members were given the number
of households of the PSUs as per IMIS 2018 as a reference with cut-off date of 6th June 2018. In case, the number
of estimated HHs were less than the household number given in IMIS data, lister probed the key informants to
ensure that all the hamlets of the sampled villages were included while estimating the total number of HHs in
the villages. If still deviation persisted, then lister further confirmed the number with other key informants to
doubly ensure prior to initiating the listing exercise. It preceded the process of HH selection for the main
interviews.
After completion of listing exercise, the data submitted by pressing Submit button. The CAPI then threw 18
sampled HHs selected through systematic random selection Only 15 HHs were interviewed while 3 HHs were
kept as replacement. In later stage of the survey, the EWG proposed to to exceed the selection of household to
20 (15 HHs were interviewed in main survey while 5 HHs were kept for replacement) (Discussion held on 27th Jan

Interim Report National Annual Rural Sanitation Survey (NARSS), Round-2, 2018-2019
CHAPTER-2: METHODOLOGY AND APPROACH PAGE 23
2019). 24 households (15 HHs were interviewed in main survey while 5 HHs were kept for replacement) were
selected in those PSUs wherein the total number of HHs were more than 750.
As a part of the HH listing, the team listed out and mapped all types of settlement in the identified villages to
completely cover the village geographically (main village/ hamlets/ satellite settlements etc.) and socially
(clusters of HHs by different caste, tribe etc). The process of segmentation has been described below:
Village segmentation process
Village Category
Households Number & Selection of Hamlets
1 Households less than or up to 200 1 (Full PSU to be covered)
2 Households from 201 to 2000 Segmentation done with each segment having approximately 100 households. 2 segments to be selected randomly through CAPI
3 Households above 2000
The village segregated into 4 parts equally (Quartile approach) considering the number of households residing in all the natural segments
One such segment/part was further selected randomly through CAPI
Finally, the selected segment was considered as the village for further segmentation as described in category #2 village
It is important to note that approximately equal segments of 100 households were created for all the villages
wherever segmentation was required. However, creating an equal segment of 100 HHs was not possible always
in a field setting. Hence, a minimum of 180 to 200 HHs were listed for those villages where equal segment of 100
HHs could not be created.
While doing sampling by PPS technique, there were high probabilities that most of the large villages get sampled.
For the villages which had more than 2000 HHs, a quartile approach was used, since undertaking a segmentation
exercise was a cumbersome process as key informant had little awareness about all the settlements in a such
large village. Villages having more than 2000 HHs were divided into four quartiles (each quartile had almost an
equal number of the HHs) and one quartile was selected randomly for the survey for undertaking further
segmentation as explained above.
Segmentation of village (before listing exercise)
Since village size varies considerably within each state and to have uniformity in operational/implementation
of data collection, segmentation exercise was used. In current survey, if sample villages had less than or equal
to 200 households, a complete household listing was done. The process of segmentation was carried out only
in the large PSUs i.e. in the ones which had more than 200 households.

Interim Report National Annual Rural Sanitation Survey (NARSS), Round-2, 2018-2019
CHAPTER-2: METHODOLOGY AND APPROACH PAGE 24
Selection of Households:
Post completion of listing exercise in a village by using CAPI, the application did random selection and provided
a serial number to the selected households. A total of 20 households (15 targeted + 5 additional HHs as a
replacement) were selected systematically from each of the PSU.
(The total number for selection of households for main interview was revised in consultation with MDWS
(Meeting on 27th January 2019) in the mid-way of data collection which also includes the selection of 24
household including 20% buffer basis the size of the PSUs wherein the total households in the village is more than
750. Out of 24 households, 20 households were canvassed for main interview while remaining 4 HHs were put as
substitute.) Selection of different number of households as per the size of the village will help in comparing the
key sanitation indicators and to make the sample more representative of the universe.
Those villages wherein more than 200 households were found, were segmented and 2 segments were eventually
selected randomly for house-listing exercise.
The random selections of households were done using CAPI application.
Step 1: Sample Frame Development in the sampled villages (Listing)
• Detailed map of village was drawn to show different segment within the village, before interviewer started
listing of households.
• In each of the selected villages (ODF and Non ODF), a detailed listing of the households has been carried
out by using CAPI to generate the sample frame for the household selection for HH interviews.
• During this exercise, the team collected only the name of the Head of the HHLD and address/Landmark of
the HHLD.
Step 2: Household selection for Main survey
• After completion of listing exercise, the systematic random selection of households has been done by using
CAPI in each village.
• A total of 20 households (15 targeted + 5 additional HHs as a replacement) has been selected in each of the
village for the main survey.
• 24 households selected including 20% buffer basis the size of the PSUs wherein the total households in the
village is more than 750.
• HOUSEHOLD survey was conducted in the selected households from the listing exercise using CAPI
interviewing technique.

Interim Report National Annual Rural Sanitation Survey (NARSS), Round-2, 2018-2019
CHAPTER-2: METHODOLOGY AND APPROACH PAGE 25
2.4. COMPONENTS OF VILLAGE LEVEL SURVEYS The village level survey was pertaining to identify the toilet access in public institutions and observe the
prevalence of open defecation in open spaces. Components of village level survey comprised of Government
School, Anganwadi Center, Public toilet (one from each village) and Public place. Observation of each component
was undertaken separately subject to availability in the villages. This component was conducted to ascertain
whether there was proper usage and safe confinement of excreta in accordance to the ODF definition and
according to guidelines.
2.5. SURVEY QUESTIONNAIRES Six survey questionnaires (Household listing Questionnaire, Household Questionnaire, Anganwadi
Questionnaire, School Questionnaire, Public/Community toilet Questionnaire and Public spaces sanitation
Questionnaire) were canvassed in 10 local languages (English, Hindi, Gujarati, Marathi, Kannada, Malayalam,
Tamil, Telugu, Bengali, Odiya and Assamese) for different regions/states using Computer Assisted Personal
Interviewing (CAPI).
NARSS primarily focused on access, functionality and usage of toilet by the individual (Household & Public
facilities both) besides verifying the solid & liquid waste management practices. Head of the household or any
other household member eligible to participate in the survey has been interviewed for administering household
schedule. Family roster was used to enlist the usual members of the family and each member’s defecation
practices were recorded at appropriate places of the questionnaire. Besides interviewing head of the household
or any other eligible member of the household, all eligible household members were interviewed, wherever
possible, for the usage pattern of household toilet. Village level schedules were also administered to observe the
different set of sanitation related parameters covering AWC, school, public toilet and public space sanitation.
Geo-tagged pictures of the facilities observed were also captured. The details of survey tools have been described
below:
Complete Household listing if size of the village lower than 200 HHs or 200 HHs
Segmentation in villages with size above 200 HHs
Equal segments of approx.100 households
2 segments automatically selected by CAPI
Household Selection

Interim Report National Annual Rural Sanitation Survey (NARSS), Round-2, 2018-2019
CHAPTER-2: METHODOLOGY AND APPROACH PAGE 26
1. HH listing schedule: Information required to produce the sampling-frame, found after identifying
available households through listing exercise to select households from the selected village.
2. HH survey schedule: This schedule collected information on self-reported HH level sanitation
arrangements, defecation practices of each usual resident, availability and safety of sanitation facilities
accessible to the household, and associated practices e.g. handling/ disposal of child faeces less than 3
years old, wherever applicable.
3. Anganwadi schedule: This schedule collected information on availability, accessibility to the toilet,
functionality, hygiene, usage and practices adopted for disposal of human excreta.
4. School schedule: This schedule collected information mainly on availability of the school toilets,
accessibility to the toilet, functionality, hygiene, usage, hand- washing and practices adopted for disposal
of human excreta.
5. Public/ Community Toilet schedule: This schedule collected information on availability, functionality,
usage, availability of water and practices adopted for disposal of human excreta and user fee charged.
6. Public spaces sanitation schedule: This schedule collected information on any visible signs of open
defecation and visible accumulated solid/liquid waste; and availability of OD incidences.
2.6. TRAINING MANUALS Training manuals were developed to help interviewers understand the survey protocols and tools by describing
the technical aspects in pictorial way, wherever applicable. Two manuals were prepared, one for interviewers /
supervisors regarding guidelines to be followed for house listing and main surveys (household and village) and
second was for using CAPI (This was an operational manual for using CAPI application).
2.7. CAPI APPLICATION, SERVER AND SURVEY DASHBOARD
IVA’s IT team catered its services to all CAPI related aspects of NARSS which consisted of CAPI application
development, modifications in CAPI application after pre-test, server management and dashboard development.
Team also provided troubleshooting techniques and support during the entire data collection process. Translated
versions of questionnaires were used as interface by interviewers while conducting the interviews in CAPI. CAPI
also had provision of geo-tagging the sanitation facilities and capturing photographs wherever required as per
the survey schedule.
A dedicated server was used to store data in encrypted format. Limited user dashboard (password protected)
provided a real-time monitoring of the survey progress and status of key indicators. The server had two
important features (A) Status report for Main Survey and Back Check Survey on real time and (B) Visual form of
report for all 3 DLI indicators at different level i.e. State, district & ODF/Non-ODF.

Interim Report National Annual Rural Sanitation Survey (NARSS), Round-2, 2018-2019
CHAPTER-2: METHODOLOGY AND APPROACH PAGE 27
2.8. PROJECT IMPLEMENTATION AND DATA COLLECTION 2.8.1. Recruitment of field team
2.8.2. Training of field teams
Trainings were conducted in different stages. In the first stage, training of trainers (TOT) was conducted in Delhi.
Trainees were all the state coordinators and zonal coordinators who were subsequently responsible for giving
trainings to the state level field teams. These trainings were also attended by national team members for
uniformity in coordination. During this training, the participants were briefed about the technical and operational
components, interviewing skills and protocols of the NARSS. In the second phase, state level trainings were
conducted to train field interviewers and supervisors as per the manuals. On the last day of training, a mock test
was conducted among the trainees to assess the understanding of survey and its procedures. A test module was
Recruitment
• Maximum resources were recruited from the panel of Kantar Public those were experienced in social
studies and preference was given to those who worked for WASH studies.
• Orientation for a day of all trainees before main briefing was conducted.
• 1st level of screening was done based on qualification (Graduate and above) & survey experience in
social studies
• Final screening was done basis score marks (above 80) obtained after completion of training
• Final list of surveyors along with photo roll was shared with MDWS for approval
Setting the selection criteria
Identifying from existing pool and references
Verification of Qualification
Screening before recruitment
RECRUITMENT APPROACH
• Simultaneous mobilization of field teams
• Preference given to the person having experience in sanitation survey and in handling CAPI who did NARSS Round-1. (KANTAR Empanelled team).
• Screening by State Coordinators
• 10% buffer human resources were recruited
• Shortlisting of interviewers from existing pool belonging to local areas
• Technical assessment on key concepts of the
Listing and Mapping Survey
o Involvement of male/female interviewers
o A total of 90 listing teams formed
Main Survey
o Involvement of male/female interviewers
o A total of 90 main survey teams formed

Interim Report National Annual Rural Sanitation Survey (NARSS), Round-2, 2018-2019
CHAPTER-2: METHODOLOGY AND APPROACH PAGE 28
used to scrutinize the capability of trainees and final selection of the teams. Further, field practice sessions of
administering survey protocols using CAPI instruments were also conducted.
-National Level Training for NARSS Round-2, held on 24th October 2018
-State level training conducted by IVA
-State level training attended by the representative of the World Bank & MDWS

Interim Report National Annual Rural Sanitation Survey (NARSS), Round-2, 2018-2019
CHAPTER-2: METHODOLOGY AND APPROACH PAGE 29
2.8.3. Survey Team Structure Research team alignment
2.8.4. Data Collection Procedure Components of the data collection process
Team Leader
Deputy Team Leader
National Coordinator
Zonal Coordinator North
State Coordinators
for 10 States/UTs
Zonal Coordinator South
State Coordinators 7 states/UTs
Zonal Coordinator East & North East
State Coordinators 10 states/UTs
Zonal Coordinator West
State Coordinators 5 states/UTs
IT Manager
Data Analyst
1 2 3 4 5 6
• HH Selection by CAPI software – zero selection bias • Online Availability of listing and Main Data – Closer Monitoring
Programme
Manager
Cloud based server
Key Highlights

Interim Report National Annual Rural Sanitation Survey (NARSS), Round-2, 2018-2019
CHAPTER-3: SAMPLE WEIGHTS ESTIMATION PAGE 30
CHAPTER-3: SAMPLE WEIGHTS ESTIMATION 3.1. SAMPLE WEIGHTS ESTIMATION
1. Objective of weightage calculation: he basic objective of weighting sample data is appropriately assign weights to each surveyed household to
make estimates representative of the population of interest. When sample units have been selected with
differing probabilities, it is common to weight the results inversely proportional to the unit selection
probabilities, i.e., the design weight, to reflect the actual situation in the population.
2. Process:
In NARSS we have used “multiplier” approach for weighing purpose which is mostly used in large scale surveys.
In this approach, we arrive at multiplier for each stage of random sampling. During the sampling process, a three-
staged sampling methodology had been utilized as shown
below:
Stage 1: Selection of PSUs
Stage 2: Selection of segments within each PSU
Stage 3: Selection of household from each of the selected segments
Thus, the sampling weight was generated as products of inverse of probabilities of selection of units at each
stage. The following figure depicts the weighing process which was adopted in each level of sampling.
After calculation of aggregate multiplier (r) through multiple stages, the weights have been normalized through using the following formula: - Where,
r = Aggregate multiplier for each PSU SS= State level sample size achieved Z=Sum of weighted no. of interview Done
𝑾𝒆𝒊𝒈𝒉𝒕 𝑵𝒐𝒓𝒎𝒂𝒍𝒊𝒛𝒂𝒕𝒊𝒐𝒏
= (𝑃𝑤 ∗ 𝑆𝑤 ∗ 𝐻ℎ𝑤) ∗ 𝑇𝑜𝑡𝑎𝑙 𝑠𝑡𝑎𝑡𝑒 𝑎𝑐ℎ𝑖𝑒𝑣𝑒𝑚𝑒𝑛𝑡− 𝑆𝑆/𝑆𝑢𝑚 𝑜𝑓 𝑤𝑒𝑖𝑔ℎ𝑡𝑒𝑑 𝑛𝑢𝑚𝑏𝑒𝑟 𝑜𝑓 𝑖𝑛𝑡𝑒𝑟𝑣𝑖𝑒𝑤𝑠 𝑑𝑜𝑛𝑒
𝑃𝑆𝑈 𝑀𝑢𝑙𝑡𝑖𝑝𝑙𝑖𝑒𝑟 (𝑃𝑤) =𝑆𝑡𝑎𝑡𝑒 𝑇𝑜𝑡𝑎𝑙 𝑂𝐷𝐹 𝐻𝐻𝐿𝐷′𝑠 (𝑆ℎ)
𝑇𝑜𝑡𝑎𝑙 𝐿𝑖𝑠𝑡𝑒𝑑 𝐻𝐻𝐿𝐷′𝑠 (𝐿ℎ) ∗ 𝑁𝑜. 𝑜𝑓 𝑂𝐷𝐹 𝑃𝑆𝑈 𝑠𝑒𝑙𝑒𝑐𝑡𝑒𝑑 𝑖𝑛 𝑠𝑡𝑎𝑡𝑒 (𝑂𝑝)
𝐻𝑜𝑢𝑠𝑒ℎ𝑜𝑙𝑑 𝑀𝑢𝑙𝑡𝑖𝑝𝑙𝑖𝑒𝑟 (𝐻ℎ𝑤) =𝑁𝑜. 𝑜𝑓 𝐿𝑖𝑠𝑡𝑒𝑑 ℎ𝑜𝑢𝑠𝑒ℎ𝑜𝑙𝑑𝑠 𝑖𝑛 𝑃𝑆𝑈 (𝐻𝑗)
𝑁𝑜. 𝑜𝑓 ℎ𝑜𝑢𝑠𝑒ℎ𝑜𝑙𝑑𝑠 𝑖𝑛𝑡𝑒𝑟𝑣𝑖𝑒𝑤𝑒𝑑 (ℎ𝑗)
𝑆𝑒𝑔𝑚𝑒𝑛𝑡 𝑀𝑢𝑙𝑡𝑖𝑝𝑙𝑖𝑒𝑟 (𝑆𝑤) =𝑁𝑜. 𝑜𝑓 𝑠𝑒𝑔𝑚𝑒𝑛𝑡𝑠 𝑖𝑛 𝑎 𝑃𝑆𝑈 (𝑆𝑝)
𝑁𝑜. 𝑜𝑓 𝑠𝑒𝑔𝑚𝑒𝑛𝑡𝑠 𝑠𝑒𝑙𝑒𝑐𝑡𝑒𝑑 (𝑠𝑝)
Aggregate multiplier (r) =1
𝐿ℎ ∗ 𝑂𝑝/𝑆𝐻 *
1
𝑠𝑝/𝑆𝑝 *
1
ℎ𝑗/𝐻𝑗
Rw*Pw*Sw*Hhw
T

Interim Report National Annual Rural Sanitation Survey (NARSS), Round-2, 2018-2019
CHAPTER-4: EVOLUTION OF NARSS-2 FROM NARSS-1 PAGE 31
CHAPTER-4: EVOLUTION OF NARSS-2 FROM NARSS-1 4.1. IMPROVEMENTS IN NARSS 2 BASIS LEARNING FROM NARSS 1
Following major improvements were ensured in NARSS Round 2 basis learning from NARSS Round 1:
A. Introduction of the Survey
Using reference to SBM for introductions was seen to be leading to some bias in responses during interview. So,
it was agreed that the surveyors would do some general introduction about the purpose of the survey, rather
than referring to SBM.
Modification- Accordingly, the introduction was changed in the tool and script as well for NARSS Round 2. The
required changes were also incorporated in the training manual. The edited part of introduction used during
NARSS round 2 was as below:
Greetings!
My name is _____________, and I am working as an interviewer with Kantar Public, a leading research
organization. At present, we are conducting a survey to assess the sanitation behaviour of the population. We
wish to know about you, your family, and your village, and would like to spend about 15 minutes with you. We
are talking to several people in this and other villages. Talking to us or not is your decision.
During training, the surveyors were thoroughly trained not to refer to SBM, it was also done when mocks were
arranged.
B. Listing and Segmentation
a) Village Maps: Instructions were to prepare village maps on a white sheet, in consultation with the Gram
Pradhan. It was learnt that some peripheral cluster of Households (HHs)/habitations to the main village
could have been left out during the segmentation process in Round -1.
Changed in tool and script
Enumerators were trained on new
introduction without mentioning SBM
General Introduction in place of SBM
introduction

Interim Report National Annual Rural Sanitation Survey (NARSS), Round-2, 2018-2019
CHAPTER-4: EVOLUTION OF NARSS-2 FROM NARSS-1 PAGE 32
Modification - An individual sheet for framing the lay out map of the village was used to draw in a separate white
sheet. The map included all the hamlets (falling in the village) as it is located along with natural boundary. After
that artificial segmentation was done as per given criteria with the help of key informants of the village. (Drawing
of map with the help of google earth seemed not feasible for segmentation since the size for segments could not
be assessed while a natural boundary may be determined, hence the map was made manually by each team in
the village.)
b) Segmentation: Segmentation of the village with > 200 households must be done randomly as per the
protocol, selected by the CAPI. Numbering shall follow from top left or NE and clockwise. The manual
said differently that the main segment shall be necessarily selected. The manual has to be corrected, and
all instructions had to be given for random sampling of segments using CAPI.
Modification -The selections of segments which were covered in listing exercise, was automated by CAPI
program without the main segment being selected purposively. The information about the process of
segmentation has passed on to the field team not to make any bias based on caste and religion. The random
selection of segments was done by CAPI irrespective of geography of the village. Appropriate changes were made
in the manual explaining all the hamlets will have an equal chance of being selected.
Also, surveyors were trained/oriented that, during segmentation, they should take care not to do/refer about
religion/caste-based grouping of settlements.
C. Marking Households:
For differentiating households for Round-2, the convention NRD-2 (N- for NARSS, RD – for round, 2 for round 2)
was proposed.
Modification- A random starting point was taken to start the listing exercise and all the residential structures
within each locality/selected segment was assigned a unique number, starting from ‘001’. The numbers were
marked on the front wall/door of the structure by using a marker or chalks. A standard practice of marking the
Appropriate changes have been made in
the manual explaining all the
hamlets will have an equal chance of being selected
Segmentation of the village with > 200 households to be done randomly

Interim Report National Annual Rural Sanitation Survey (NARSS), Round-2, 2018-2019
CHAPTER-4: EVOLUTION OF NARSS-2 FROM NARSS-1 PAGE 33
structures during the listing exercise was emphasized & followed such as “NRD-2/001” for structure number
indicating an arrow towards the structure numbers are increasing.
The explanation on marking the structures were shared with all state teams and adhered in the due course of
data collection.
D. Using Buffer Households:
The buffer households were to be used – only as a replacement of non-available sampled households. However,
NARSS -1 data set showed many villages having more than 15 records and many villages had less than 15
records. This was addressed during training for NARSS-2 and during survey.
Modification- After selection of HH through CAPI, 1st 15 household was taken as original sample while rest 3 was
used as substitute sample to cover up the non-response rate. During the training, due emphasis had given in
each location in documenting the selection of HH. However, it was further discussed & proposed to take 5
additional household as buffer and final coverage was ensured to minimum 15 HHs in each selected PSU. Though
the suggestion of considering 5 buffers was added in later stage (almost in the verge of the completion of the
survey). The decision of 5 buffer households was taken by EWG to make replacement if the sampled households
were found locked during main survey.
E. Random selection of Schools/AWCs:
As per the Protocol, (see clause 6.3, page 13 of the Protocol). School/AWC shall be randomly selected. This was
not adhered in NARSS 1 while the public institutions were selected based on different criteria (highest grade of
school, population covered by AWC etc.)
Modification-The selection of AWC and schools was done through CAPI program. The selected School could be
either higher or lower educational level whichever is selected through random process while AWC was also
selected irrespective of population catered by the facility.
F. Public Toilets:
Differentiate between public toilets and cluster toilets, in round 1, in few villages, public toilet data reported
although there were no public toilets in these villages. This had come up because of inadequate clarity among
the surveyors to distinguish between Public & cluster toilet.
Modification- The difference between cluster & public toilet were briefed to all the state teams during training.
The following definition was further used in the survey and trained the surveyors consequently.
G. Row Toilet/ Cluster Toilet:
The toilets made for group of the HHs in any patch of the village will be considered as Row/ Cluster toilet while
these toilets are not to be considered as community/ Public toilet.
H. Addition of Supplementary questions:
NARSS 1 experienced some denial factors in response by the HH (denial of having toilets despite having one).
The four supplementary questions which was used as rider when the respondents say that they don’t have toilet.
In 6006 PSUs out of 6136, the supplementary questions were asked from household respondent.

Interim Report National Annual Rural Sanitation Survey (NARSS), Round-2, 2018-2019
CHAPTER-4: EVOLUTION OF NARSS-2 FROM NARSS-1 PAGE 34
Modification- Four supplementary questions pertaining to the accessibility of the toilet facilities, was
incorporated in the CAPI and asked in case of respondent reported to have no access of toilet, however in few
villages, these questions could not be administered since the FW had already started.
I. Closed pit:
Picture of closed pit was not included in the training manual and good numbers of such response came out in
NARSS 1.
Modification- The picture of “closed pit” was incorporated in the manual and described the basic features of the
closed pit.
J. Survey process
Locked status- NARSS 1 experienced instances of lock of public institutions surveyed in few villages. This gave
the inadequate picture of over all out comes of NARSS due to exclusion of data came as non-response or invalid.
Action: While surveying, if the institutional/School/Public toilets were locked, the surveyors made all attempts
to revisit again to complete the survey when they were open.
Solid Waste Disposal System- The surveyors were trained to correlate the responses from the HH’s regarding
SW disposal, to check whether there is a system existing in the village/segment for common collection and
disposal mechanism.
Female Surveyors- Deployment of adequate female surveyors in the survey, subject to taking care of issues like
safety, security to them, and practicality of survey implementation. Total 14.4 percent of female investigators
were deployed in the field across the states.
Action: Due effort was given to deploy the female investigators subject to safety measures and operational
feasibility.
Training Evaluation- One-pager evaluation paper for the trainees was used to measure the understanding of
survey aspects. This had included issues pertaining to survey like segmentation, listing issues, etc., and to test
the surveyors’ understanding.

Interim Report National Annual Rural Sanitation Survey (NARSS), Round-2, 2018-2019
CHAPTER-5: QUALITY CONTROL MECHANISMS PAGE 35
CHAPTER-5: QUALITY CONTROL MECHANISMS 5.1. QUALITY CONTROL MECHANISMS
o oversee and support the entire NARSS process, from the questionnaire design to field work and quality
check, an Expert Working Group (EWG) was constituted under the chairmanship of Prof. Amitabh Kundu
and Co-chairmanship of Dr. NC Saxena. The EWG included representatives of the World Bank, UNICEF, Water
Aid, BMGF, NSSO and representative of Niti Aayog, and India Sanitation Coalition among others. Quality
assurance steps were taken at each stage of survey to ensure high-quality data generation.
Participation in Training by EWG & MDWS: To strengthen the survey process and monitoring the state level
training, the member of EWG and MDWS participated in training of interviewers and supervisors and visited
teams during the field practice. These visits were aimed to ensure that the protocols laid out for NARSS Round-
2 being followed while training the field teams. Multiple visits at the field during data collection and back- checks
across the states were also made by the MDWS and EWG members and an emphasis were put in place that the
survey teams who imparted in standardized state level training, adhering to the protocols and exhibit the highest
level of integrity and professionalism while being at the field.
Quality control mechanism at IVA: To ensure quality assurance over the overall survey process and to ensure
continuous feedback, a detailed quality control and feedback mechanism had been designed at the level of IVA.
This ensured collection of good quality data. IVA created mechanisms to track the surveyors visit to the field and
provided evidence to MDWS on key aspects like time taken in completion of the survey, geo-tagging of locations
and pictures. All the interviews had a start time and end time along with the length of the interviews. The quality
control included quality check mechanisms at following stages:
a. Inputs Stage
b. Data collection Stage
c. Data validation Stage
The quality checks were performed over all the key-activities of the project viz. recruitments, field trainings, data
collection, team movement, data compilation etc.
a. Inputs Stage
The recruitment and engagement of teams were the key focus during preparatory stage to ensure that field
teams are:
➢ The enumerators and supervisors were hired taking into consideration their educational background,
experience and other relevant qualifications.
➢ Adequately skilled with survey procedures during trainings.
➢ Before the launch of actual field work just after the training, all the participants undergone for an
evaluation test with the help of a set of questionnaires.
➢ Final selection of the surveyors who scored satisfactory marks
T

Interim Report National Annual Rural Sanitation Survey (NARSS), Round-2, 2018-2019
CHAPTER-5: QUALITY CONTROL MECHANISMS PAGE 36
Standardization of trainings: Since the trainings were proceeded in phases hence standardization of the training
content was important. Considering this, all the trainings were organized by proposed survey team who were
the part of centralized training of trainers (TOT) held in New Delhi. This ensured the standardization and
consistency during the field trainings. Routing through them, communication of same set of protocols/guidelines
was ensured in all the field trainings.
b. Data Collection Stage
The data collection across the country was conducted by 182 field teams. Each team consisted of one field
supervisor and four enumerators. The number of interviewing teams in each state varied according to the sample
size. The field supervisor was responsible for overall management of the field teams. In addition, the field
supervisor conducted spot-checks to verify the accuracy of key information.
During the data collection period IVA submitted weekly progress reports to MDWS on aspects of the total
coverage, back check results, challenges encountered, and the ways challenges were addressed and
troubleshooting practices.
The definition of Household which was critical in this survey, was defined as per National Sample Survey
classification and was included in the training manual for clear understanding of the surveyors. A Unique Numeric
identification code for each questionnaire and surveyor/supervisors was inbuilt in CAPI.
The quality at data collection stage was primarily determined by following key aspects in each of the phases of
data collection.
Listing Phase
➢ Accuracy of selected PSU
➢ Complete listing of all the settlement/selected segment
➢ Correctness of information captured pertaining to listed HHs
Main Survey Phase
➢ Coverage of selected HHs
➢ Correctness of information captured
➢ Adherence to ethical protocol and guidelines
➢ Regularity of data upload
Village Level Survey Phase
➢ Survey completeness in identified School /Anganwadi.
➢ Correctness of information captured pertaining to selected school, Anganwadi worker/ASHA,
Sarpanch/GP Secretary or other prominent people in the village.
➢ Ensuring geo-tagged photographs for each survey category of the sampled villages.

Interim Report National Annual Rural Sanitation Survey (NARSS), Round-2, 2018-2019
CHAPTER-5: QUALITY CONTROL MECHANISMS PAGE 37
Data Transmission: Server Management & Development of Dashboard C. Data Validation Stage:
Apart from quality controls at data collection level, IVA also ensured that the data is compiled and integrated
error free. A robust data monitoring and validation system was placed to ensure data quality. Sample back-checks
visits were also made by IVA as well as MDWS teams to verify field data quality.
On a regular basis, the field teams synced all the completed interviews to the cloud- based server. Supervisors
maintained record of all the completed interviews in their log sheet used for reporting and checks. It was state
coordinators’ responsibility to monitor the coverage, quality and logistical aspects of the data collection activity
by doing frequent field visits and checking the data on the server regularly. In addition to this, surprise field visits
were also made by zonal coordinator/ national team on random basis.
Listing • Process of formations of segments • Complete listing of all the settlement along with structure
numbers • Correctness of information captured pertaining to listed HHs
Village Level Survey • Completeness of identification of School /Anganwadi/ Public Toilet • Ensuring geo-tagged photographs for each of places with visible
faeces if any
Main Survey • Coverage of selected HHs • Correctness of information captured in the household survey • Regularity of data upload
Accompaniment & Back Check by Supervisor & State Coordinators
Quality Checks • Concurrent trend analysis on critical indicator • Sharing the list of critical villages with all State Coordinators for
back check • Surprise visit to the critical states • Sharing of feedback on efficiency and quality based on variance
analysis • Random checks using GPS codes to ensure correctness of village
selection • Developing field work progress report and sharing with MDWS.
Central Team-IVA, MDWS & EWG

Interim Report National Annual Rural Sanitation Survey (NARSS), Round-2, 2018-2019
CHAPTER-5: QUALITY CONTROL MECHANISMS PAGE 38
The quality monitoring during the entire course of data collection followed the protocol given below.
Quality Control Data collection quality checks
Team Supervisor ➢ All PSUs were checked by him; ensured proper listing and main data collection, timely submission of all collected data
➢ 15 % accompaniments of each interviewers during main interviews ➢ 8 % back check of each interviewers during main interviews ➢ Monitoring field plan and progress report
State Coordinator ➢ Overall quality and coordination at state level ➢ 5 % back check and accompaniments ➢ Addressing concurrent issues in the state
Zonal Manager ➢ Overall quality at zone level ➢ Planning and execution of debrief session ➢ Random scrutiny and surprise field visits
Central Team ➢ 3% telephonic verification and back check Generation of Variance Report ➢ Field visit to 2% of PSUs

Interim Report National Annual Rural Sanitation Survey (NARSS), Round-2, 2018-2019
CHAPTER-5: QUALITY CONTROL MECHANISMS PAGE 39
5.2. Outcome of Quality checks
1. Input Stage
Evaluation of sampling
The sampling strategy has evaluated before the start of the survey to assess the appropriateness of the
stratification, the adequacy of the representation of the population and the size and distribution of the samples
selected.
✓ A summary statistic (IMIS) from SBM (G) with cut-off date of 6th June 2018.
✓ Pre-test of tool- to indicate the "stability" of the instrument
✓ Overview of population composition (urban/rural, ODF/Non ODF)
✓ Sampling frame and number of stages of sampling was reviewed by MDWS & EWG – the sampling
frame(s) cover all the target populations, representativeness etc
✓ Stratification within the sampling frame
✓ Sampling units at each stage: known selection probability
✓ Size of sampling units at each stage: ensure all sampling units have a measure of size that exceeds a
predetermined minimum
✓ Size of sample selected
✓ Probability weight for household
✓ Probability weight for respondent
Translation of tools
Translation of the survey tool in regional language is one of the imperative tasks which includes the importance
of maintaining the equivalence of concepts and ensure a procedure that identifies possible pitfalls and avoids
distortion of the meaning of each question. Following steps was adopted to ensure the quality measures:
✓ Translation of all kind of survey tool (Household & Village survey & Training Manual) was done to
produce a locally understandable questionnaire
✓ The original intent of the questions was translated with the best possible equivalent terms in the local
language
✓ Question-by-question specifications was aimed to convey the original meaning of the questions and pre-
coded response options
✓ The questionnaire was translated by health and survey experts who have a basic understanding of the
key concepts of the subject-matter content.
✓ Later, a set of selected key terms and those that proved to be problematic during the first direct
translation was further checked by regional offices and suggested changes was incorporated
✓ Finally, the translated version was shared with MDWS for their review.
Training of State Coordinators & Surveyors
Training of survey team is the key to quality. Training is an ongoing process that is conducted before and during
the data-collection process, and end with a detailed feedback session after the fieldwork period is completed.
Training for NARSS was provided at all levels of the survey team involved in the survey, from interviewers to
trainers and supervisors, as well as to the central team overseeing the process nationally. This was done to ensure
that all involved persons are clear with regard to their role in ensuring good quality of data.
To fulfil the part of the training purpose, IVA & MDWS has organized National workshop for State Coordinators
from all participating countries and produced various training materials, including a training video and an

Interim Report National Annual Rural Sanitation Survey (NARSS), Round-2, 2018-2019
CHAPTER-5: QUALITY CONTROL MECHANISMS PAGE 40
educational compact disk covering all sanitation aspects issues. The purpose of overall training was aimed to
meet the following parameters:
✓ Ensure a uniform application of the survey materials and CAPI
✓ Explain the rationale of the study and study protocol
✓ Motivate interviewers
✓ Provide practical suggestions
✓ Improve the overall quality of the data
To fulfil the part of the training purpose, IVA & MDWS has organized National workshop for State Coordinators
from all participating states and produced various training materials, including a training module covering all
sanitation aspects issues pertaining to NARSS. The workshop was held in Delhi before the state training started
in each location.
Selection of survey teams
✓ The preference of using experienced interviewers as well as people who are familiar with the topic of
the survey was important for NARSS, hence preliminary selection of interviewers was done on the basis
of required qualification and be fluent in the main or regional language of the state
✓ In each training location, state offices have carried out formal assessment of the surveyors before they
appeared for the training. The characteristics of the interviewers (age, sex, education, professional
training, employment status, past survey experience, and so on) was assessed and recorded on a
separate database.
✓ The training methods included as much role playing in interviews as possible (with a minimum of one
per interviewer). This method provided the assimilation of interviewing techniques more effectively
✓ For role playing to be effective, different kind of scenarios (wrt access, functionality of toilet etc) was
prepared in advance of the training so that the different branching structures of the interview, the nature
of explanations that are permitted, and anticipated problems during an interview with difficult
respondents can be illustrated
✓ As recommended by MDWS, a booster session was also organised in each state during the data-
collection period. The booster session served to review various aspects of data collection, focusing on
those undertakings that were proving complex and difficult or those guidelines that are not being
adhered to sufficiently by interviewers.
✓ This session was also helped to provide feedback on how much has been achieved and the positive
aspects, including feedback from the supervisors and central survey team to the interviewers, as well as
from interviewers to the supervisors and survey team.
✓ All the trainees were evaluated in order to determine whether they are capable of interviewing
effectively and what, if any, particular support or orientation was required. The assessment was
conducted on last day of training by using an evaluation paper.
✓ The assessment of trainees (supervisor & interviewers) was conducted by central survey team and
MDWS.
2. Data Collection Stage
To plan and manage the survey implementation is a complex task, logistically and otherwise. It requires much
preparation, scheduling and moving around of forces in the field to obtain the desired sample. Strategically,
survey implementation is a key element that determines whether survey data is of a good quality or not. Hence

Interim Report National Annual Rural Sanitation Survey (NARSS), Round-2, 2018-2019
CHAPTER-5: QUALITY CONTROL MECHANISMS PAGE 41
to ensure the quality checks, IVA had adopted different type of quality measures during data collection. Following
measures were carried out in the due course of NARSS.
Accompaniment
NARSS was implemented with a composition of 4 interviewers and 1 supervisor. Each interviewer spent 2-3 days
to cover all the survey component and achieved the desired sample in each PSU.
• Supervisor was mainly responsible to set out the daily work at the beginning of the workday with the
interviewers and reviewed the results at the end of the day. In this review, interviewers were briefed
their supervisors about their interviews and results.
• Supervisors examined the completed interviews in the CAPI console and log sheet to make sure that the
interviewer’s selection of the household has been done correctly and that the questionnaire is both
complete and accurately coded
• Correctness in preparing lay out map and segmentation was also checked by Supervisor during
accompaniment.
A daily logbook was also maintained to monitor the progress of the survey work in every state survey center.
Following elements were recorded as a part of log sheet:
✓ The number of respondents approached
✓ Interviews completed and incomplete interviews
✓ The response, refusal and non-contact rates
While accompanying the interviewer, supervisor observed the way of administering the questionnaire and any
kind of biases was led by the interviewer (i. e naming of SBM, interpretation of responses shared by the
respondent etc). Supervisors were also made effort to reconvince the non-response cases such as refusal
conversions for both household & village survey.
Back Check
This check was done by in person or by phone and structured to ensure that the initial interview has been
conducted properly. The recheck interview in the same selected household was done through a back check CAPI
link and covered the critical questions along with some basic demographic information. In NARSS, apart from
team supervisor (Back-checked- % households of total back-checked), central IVA team (% households back-
checked of total back-checked) and State coordinators (% households back-checked of total back-checked) had
carried out several field visits in different states to oversee the progress of work and quality checks. EWG &
MDWS also did the random visits in couple of states along with IVA team.
During back-check survey of the PSUs and household, the following points were observed by the team:
1. Clusters and hamlets of the PSUs.
2. Segmentation and boundaries.
3. House-listing and structure number.
4. Sampled households and log sheets maintained by the field team.
5. Whether the field team visited the selected household for the main survey.
6. Whether photographs of the toilets taken during household survey.
7. Ownership of the toilet
8. Accessibility to the toilet.
9. Disposal methods of excreta
Role of supervisor- Supervisors did back-check of the sampled households based on the log sheet entry which
had the records of all the selected household wherein the main survey was already done by the interviewer. All

Interim Report National Annual Rural Sanitation Survey (NARSS), Round-2, 2018-2019
CHAPTER-5: QUALITY CONTROL MECHANISMS PAGE 42
back-check interview conducted by the supervisor was freshly done through CAPI console and uploaded in the
server.
Role of central IVA team- The central IVA team based on the raw data available through dashboard, undertook
the following action:
1. Created run tine report which presented erroneous trend of data.
2. Identified the PSUs or Households with unusual data trends.
3. Sharing of anomaly report with respective state IVA offices for physical verification.
4. Based on the run-time report of key sanitation indicators, the central IVA teams made field visit plan for
back-checks of PSUs and households.
5. Anomaly report, wherein the codes recorded during data collection were not in-sync with its
corresponding questions, was shared with state coordinators. Based on the anomaly report, the state
coordinators revisited the households which seemed to be inconsistent in responses. The data was
collected through back-check CAPI link and got it uploaded to the server.
6. Variance Report was generated basis the main raw data and back-check data available on server. If any
variance was observed between two data sets, over-writing of data took place. Here variance was
defined as below:
• During main survey- No access to the toilet facilities reported, however, accessibility to the toilet
was recorded during back-check visit in the same HH or village facility (Vis-à-vis).
• Usage of the toilet was not reported by few or all members of HH. In back-check visit, toilet was
used (Vis-à-vis).
• Toilets were reported to be non-functional/ unsafe technology/ un-hygienic during main survey
but during back-check, the toilets were found to be functional/ safe/ hygienic (Vis-à-vis).
Role of MDWS- As a part of data quality assurance measures, the MDWS constituted internal quality control
teams to oversee the compliance of quality assurance protocols. The MDWS quality assurance team also
reviewed raw data and reports and also the issues triggered through dashboard. The team planned their field
visit for back-checks. For back-check visit, the MDWS teams were facilitated through real time information of
field movement of teams. The feedback/ issues of field data collection were communicated to the IVA and that
IVA reviewed and took corrective action immediately. The preventive action plan for systematic errors/ mistakes
were prepared and communicated to the field teams for maintaining a standardization of data collection process.
Prominent issues found in back-check and measures taken for quality control
As a part of quality assurance of NARSS survey, certain points were taken into consideration while conducting
the back-check survey of the households which were already covered in the main survey team visit. Any variation
recorded during the back-check, eventually led the action taken by the back-check teams. The points are
mentioned as given below:
1. The visited PSUs were verified through the village source whether the sampled PSUs were covered or
not.
2. Sampled households were verified through the listing document and proper numbering of the structure
were observed.
3. Details of Member of the households were checked.

Interim Report National Annual Rural Sanitation Survey (NARSS), Round-2, 2018-2019
CHAPTER-5: QUALITY CONTROL MECHANISMS PAGE 43
4. Accessibility of toilets were verified. (If variance was found in the back-check, the same was over-wrote
in main data)
5. Functionality, hygienic conditions, usage of toilets, water availability, littering and water logging were
also observed and verified through back-check.
6. Technology used in the toilets were observed and verified.
The IVA and MDWS both did telephonic back-check and physical back-check visit to the field. The details of back-
check and accompaniment done by various team members out of the total back-check (8.6%) and
accompaniment (16.2%) are given as below:
All India (BC +AC) % Total number of
back-check done
% Back-check done
Total number of
accompaniments done
% Accompaniment
done
% of telephonic back-check of the total HH
done
BC by Field Supervisor 7142 89.9 14240 95.1 0
State Coordinator/Field Manager
605 7.6 620 4.1 0
IVA Central team 200 2.5 110 0.7 0
MDWS 2% 0 0 3%
Total QC checks 7947 100 14970 100
Accompaniment by supervisors
in 16.2% of total inyterviews
8.6 % interviews back-checked
after completion of
household interviews
2% villages back-checked by
MDWS
3% households back-checked telephonically
by MDWS

Interim Report National Annual Rural Sanitation Survey (NARSS), Round-2, 2018-2019
CHAPTER-5: QUALITY CONTROL MECHANISMS PAGE 44
3. Data Validation Stage
Post upload, central IVA team had performed a rigor analysis to assess the variation of responses collected by
interviewer and supervisor. This analysis included the following action points and measures:
Stage Actions Level Mode Corrective measures
I
• Creation of run time report with erroneous trend
Central IVA Team
Dashboard and Raw data
• Team discussion was held with interviewers with respect to understanding the procedures employed in the field when a term, phrase or question is not understood. These reviews were done periodically based on the extent to which interviewers are required to explain and interpreting the questions to respondents.
• Over-write the responses in case of more than 30 % anomaly found in critical indicators
• Identified the PSUs or Households with unusual data trends
• Sharing of anomaly report with respective state offices for physical verification
II • Revisit the households
which seemed to be inconsistent in responses
State Coordinators/ Supervisors
In person through CAPI link
III • Variance Report -HH &
Village
Central IVA Team
Uploaded
Further to describe the above table, once the data was at dashboard, programs checked for inconsistencies,
missing values, problems with identification numbers or test/re-test cases. These programs produced a report
to be sent back to the states as part of weekly status. Basic descriptive statistics were used to determine the
response distributions and identify any skewed distributions, odd results and outliers.
IVA central team sent such critical cases to states. The states reverted with corrections and/or explanations in
accordance with the feedback, any corrections received from the IVA states are applied to the data.
5.3. Important quality measures undertaken
A. Geotagged photographs and their linkage to the sanitation assets checked
The following features are in place with Kantar to check the correctness of geotagged photographs and their
linkages to the sanitation assets of household and village observed during survey:
I. Each photograph captured while conducting household or village interviews for every asset
(Accessibility, Functionality, Hygienic condition, usage of toilet and safe disposal practices), were
tagged with CAPI generated unique identification numbers with specific question numbers. For
instance, during household interview, all the photographs captured have had the same unique ID as
tagged with household interview.
II. This system indicated that the photographs belonged to which household or village interview. In this
way, the quality team identified the photos corresponding to its interview.
III. Every household and village interviews were tagged with unique ID, which was in-built in CAPI
programming. Each asset (Accessibility, Functionality, Hygienic condition, usage of toilet and safe
disposal practices) observed during the survey of either household or village, have got specific
question numbers which helps identifying the types of assets being observed.
IV. However, for all assets, the unique ID (which remains the identification of the HH or village
interview) remained same which was tagged with photographs.

Interim Report National Annual Rural Sanitation Survey (NARSS), Round-2, 2018-2019
CHAPTER-5: QUALITY CONTROL MECHANISMS PAGE 45
V. Besides this, geo-coordinates were also tagged with each photograph captured during the survey
which indicated the location of interview in the village.
B. Whether unique codes were used for CAPI, surveyor, the questionnaire and the interview
Unique identification code was in-built programming of CAPI for household & village questionnaires. Besides,
interview ID (for both household and village components), an automated CAPI ID was also generated through
CAPI. The surveyors ID was allotted by Kantar State office. This helped identifying specific interview which took
place in its specific villages and states.
C. Whether the geolocations of the surveyors were used to track their work
Each CAPI machines used in the NARSS survey, were enabled with GPS location. The field team who possessed
the CAPI could have been easily tracked as to where the interviews were conducted by them. Before initiating
the interview, the interviewer had to feed the interviewer’s ID in the CAPI which specifically indicated that the
particular CAPI was used by some already identified interviewer. This helped the quality team to track the work
of a particular interviewer, once the data was synchronized with the cloud server.
D. Actions of ACQA team of IVA
ACQA team is quality assurance team who did visit the field to conduct sample quality back-checks and to
accompany the field teams to observe the interview and identify if the teams were following survey protocols
and if the data collection teams faced any challenges in technical or operational aspect of the survey.
The ACQA team adopted the following measures of data quality assurance:
a. Digital checks- Under the digital checks, the data quality was monitored through the data
itself. The points which were taken into consideration while doing digital checks are as
follows:
I. Length of Interview (LOI): For this, the data was reviewed to check if the interview
conducted in the field took enough time (length of interview) to engage the respondent
to complete the interview. If the LOI was less than 10 minutes, actions were warranted.
II. Time gap between two interviews: Once the interview was completed, the interviewer
proceeded to initiate another household or village interview. Therefore, time gap
between the interview was also monitored. If the time gap between two interviews was
found unreasonable, the quality check team took required steps as to where the
problems existed, and which team did the mistake by identifying through CAPI code &
interviewer’s ID.
III. Odd hours: The field teams can only conduct interview between 6 am to 11 pm. The
quality check teams identified from the dataset if any of the interview was conducted
other than the prescribed hours. If any such cases were reported through the dataset,
the interviews were rejected.
IV. Unusual productivity checks: Every team member was assigned with the reasonable
tasks which were to be completed on daily basis. If any unusual things in terms of loads
of work, came across while reviewing the dataset, were identified and subjected to
scrutiny by the state office of Kantar.

Interim Report National Annual Rural Sanitation Survey (NARSS), Round-2, 2018-2019
CHAPTER-5: QUALITY CONTROL MECHANISMS PAGE 46
V. Photographs based authenticity checks: As discussed earlier, each photograph captured
while conducting household or village interviews, were tagged with system generated
unique identification numbers. For instance, during household interview, all the
photographs captured have had same unique ID as tagged with household interview.
This was how the quality team identified the photos corresponding to its interview.
VI. GPS based location checks: GPS based location checks were done to ensure that the
interviews conducted were happened to be in sampled PSUs only. This was done
through plotting of geo-coordinates to arrive at the exact location where the teams were
supposed to visit.
Overview of quality check process: Based on the digital check, either the interview got
rejected or accepted for further telephonic back-checks or personal back-checks.
b. Physical checks- The physical checks comprised of the following tasks which were to be
undertaken while doing quality checks:
I. Telephonic back-checks: Quality assurance teams did random telephonic back-checks
and recorded the responses of the respondents. Basis the data captured, variance report
was generated and shared with client. MDWS teams also did telephonic back-checks at
random basis.
II. In person back-checks: Core team members of NARSS conducted back-check visit to the
field to verify that the data collection teams visited the field and that the quality data
was collected by them. Back-check visits were undertaken across all states where NARSS
survey was conducted.
E. Preventive action plan for systematic errors / mistakes and communicating errors/ mistakes frequently
to the field teams
The agency took following action to prevent the systematic errors/ mistakes committed by the field data
collection teams:
I. Once the CAPI was synchronized at the end of the day after data collection, the data was saved
at the cloud server securely and eventually got displayed on dashboard.
II. The data was analysed for the key indicators and if the core team members identified any
mistakes or error, the state teams were intimated through conference call to address the issue
and to closely monitor the team which were found to be having the tendency of committing
mistakes.
III. Based on the observation, key performance question data feedbacks were shared regularly with
the field teams.
IV. If any anomaly in data was identified, a con-call was fix up taking the field teams into loop and
discussed the issues. Sometimes, the MDWS teams were also the part of con-call while discussing
with the field teams.
V. State field teams also relied on KOOL (Kantar Operations Online) software (owned by Kantar)
with inbuilt feature of throwing inconsistency reports of the key sanitation indicators.
VI. KOOL software was integrated with the survey dashboard and based on the inconsistency checks
through this software, the concerned team came into action and did revisit to the PSUs as and
when required.

Interim Report National Annual Rural Sanitation Survey (NARSS), Round-2, 2018-2019
CHAPTER-5: QUALITY CONTROL MECHANISMS PAGE 47
VII. The core team members of the NARSS survey received dashboard (Other than survey
dashboard) from analysis team on daily basis to review the key indicators of NARSS and recorded
the inconsistency and eventually took the state field team into loop to apprise then the trend of
the data and asked them to take corrective actions.
F. Action plan in consultation with MDWS team for following points
a. Quality of the data collected
The following actions were taken based on the discussions happened with MDWS:
I. Weekly progress report, weekly quality check reports and variance reports were shared with
MDWS team for their review.
II. In quality check reports, the MDWS team was conveyed with incident log which comprises of a
particular area/PSU’s complexity faced by our local teams while the teams stayed at the PSUs.
III. In case of non-cooperation from the village heads, the same were communicated to the state
coordinators and finally to the MDWS team.
IV. Sometimes, the PSUs were also replaced due to the issues discussed above.
V. The replacement was done from the buffer PSU list.
VI. In response to the incident log, the MDWS team, at regular interval, provided feedback to the
agency which were further taken up to the field team to take the stock of that and to
strengthen the field survey data collection planning.
b. Efficiency of the training, trainers and field management
The field training reports were submitted to the MDWS
i. The training report consisted of the number of field team participated and selected for final
survey, duration of training, methods of training, details of core team members and participant
from the MDWS and EWG members, total modules covered, and details of field practice which
was taken place in the non-sampled villages.
ii. The trainers who conducted training at the state level, were participant of the TOT conducted
by the MDWS and that they had best understanding of the sanitation related surveys and
programmes.
iii. The state field office of the agency had prior experience of managing manpower of large-scale
surveys of the similar kinds.
c. Efficiency and skills of the manpower after the trainings
i. At the end of the state level training, the team’s performance was evaluated through a set of
questionnaires based on core area of the study.
ii. The final selection of the teams was made by evaluating the minimum understanding of the
project.
d. Overall responsiveness of the project teams
i. As and when the field teams were intimated for the mistakes, the teams responded effectively
and tried their best to go by the survey protocols and to collect the high-quality data.

Interim Report National Annual Rural Sanitation Survey (NARSS), Round-2, 2018-2019
CHAPTER-5: QUALITY CONTROL MECHANISMS PAGE 48
e. Transparency and flexibility
i. The data collection teams got clarity of the NARSS project and as to how to capture high quality
data from the field.
ii. For day to day activity, the teams got in touch with supervisors and state coordinators and in
case of need, they sought help from them in terms of operational issues which they came across
while being at the field.
f. Timelines of activity completion
i. The field teams strictly adhered with the timeline which was set-up for the project to get
completed.
ii. Field progress report was shared with MDWS which comprised of the coverage report and
number of teams working in the field at real time.
Data Overwriting Protocol:
Data overwriting is required once any household are back checked either by Supervisor or by any senior person
from research / ministry. To do the back check we have developed separate back check link which is functional
and through this link we are able to re-collect entire information for a HH and for village tool as well.
All the data which are collected by a FLP (investigator) is stored on our secured server, similarly back check data
(collected by supervisor / IVA core team member / MDWS personal) will also be stored same server.
Steps which was adopted has furnished below:
1. Normal Back check
➢ Supervisor / IVA core team member / MDWS personal did back check with a separate back check link
and collected the data
➢ The collected stored on server.
➢ At the back-end we generated a variance report on regular basis.
➢ If any variance was observed between two data sets, the interviewer data was replaced by the back-
check data.
2. Back check which is being carried out by looking at the data for any PSU
➢ Data which was available on dashboard was analysed by IVA core team member
➢ PSU which behaved like outlier (variation more than 30 percent) was sent back for further verification.
➢ Supervisor / State coordinator /Zonal coordinator / revisited the PSU
➢ During back-check same back check link was used
➢ After they re-collected the data similar process as stated above in point no 1 was adopted for data
overwriting.
Data Cleaning and Transfer Protocol: Before uploading data to National Informatics Centre (NIC) server,
variables were recoded, cleaned as per the logical checks and the identifiers used. Pictorial flow of the data
management is shown in the figure given below:
Process of data cleaning and transfer protocol

Interim Report National Annual Rural Sanitation Survey (NARSS), Round-2, 2018-2019
CHAPTER-5: QUALITY CONTROL MECHANISMS PAGE 49
Data Collection
NARSS Server
Back check ➢ State
Coordinator ➢ Supervisor Accompaniment
IVA central team
➢ Generation of Variance report
➢ Team wise update/ feedbacks sharing to the field team
➢ Trend analysis on key indicators
Through Dashboar
d (with coverage)
MDWS (Via a
separate login ID)

Interim Report National Annual Rural Sanitation Survey (NARSS), Round-2, 2018-2019
CHAPTER-6: DLI COMPUTATION AND VALUES- INDIA & STATES PAGE 50
CHAPTER-6: DLI COMPUTATION AND VALUES- INDIA & STATES 6.1. DLI CALCULATION NOTE FOR NARSS ROUND-2
1. Objective
he World Bank through the ‘Swachh Bharat Mission Support Operation’ supports following two categories
of activities:
a) Performance incentives for sanitation improvement in rural areas; (US$ 1475 Million)
b) Technical Assistance for strengthening institutional capacities on program management, advocacy,
and communications, and implementing a credible and robust monitoring & evaluation system to
measure results of SBM-G. (US$ 25 Million)
The Bank Program (PforR component of the Operation) supports the entire national SBM-G program by
channelling US$1.475 billion through the incentive grant window of SBM-G in support of the national program’s
objective of recognizing and rewarding the performance of states on achieving key sanitation outcomes. Program
funds will be disbursed to MDWS on achievement of Disbursement Linked Indicators (DLIs) and MDWS will
release grant funds to states, based on their performance.
2. About Disbursement Linked Indicator (DLI)
SBM-G performance of the states against the disbursement linked indicators (DLI) is to be measured through
conducting national annual rural sanitation survey (NARSS). Distribution of financial incentives to states would
be proportional to the actual performance of the states. The four DLIs identified for this purpose are:
➢ DLI #1: Reduction in the prevalence of Open Defecation
➢ DLI #2: Sustaining ODF Status in villages
➢ DLI #3: Increase of rural population with Solid Liquid Waste Management
➢ DLI #4: Operationalization of Performance Incentive Grants by MDWS
As per the requirements of SBMSO, the National Annual Rural Sanitation Survey (NARSS) has been conducted by
an Independent Verification Agency (IVA) for ensuring credibility and objectivity of survey results.
3. Process of DLI Computation
For each of the DLIs, there are certain performance parameters specified in the Operations Manual of SBMSO,
which have been captured in the NARSS survey protocol, for measurement by the IVA. Population in absolute
number for the Universe is derived from the DLI proportion extrapolated to the MoSPI 2018 total projected rural
population of states and union territories. (Source MDWS). For DLI-2, since MoSPI does not project population
projections for ODF villages, their proportionate share is considered as explained under DLI-2
Appropriate weights have been applied for deriving the values at Universe level, based on sample observations.
Details are in Annex-1.
DISBURSEMENT LINKED INDICATOR #1
Indicator - Reduction in the prevalence of Open Defecation
Rationale – This DLI focuses on the reduction in the prevalence of OD based on the rural population having
access to sanitation facilities and using them always, as per the definitions in the Operations Manual.
T

Interim Report National Annual Rural Sanitation Survey (NARSS), Round-2, 2018-2019
CHAPTER-6: DLI COMPUTATION AND VALUES- INDIA & STATES PAGE 51
Based on these definitions, a group of parameters have been agreed in the NARSS protocol for determining DLI
1, which are as below:
✓ Access to a toilet
✓ Functionality of the toilet
✓ Toilets with safe disposal mechanism of human excreta
✓ Toilet is hygienic
✓ Usage of a Toilet always and
✓ Safe disposal of Child faeces
Process of Calculating DLI# 1- Following processes has been followed to calculate DLI 1:
DISBURSEMENT LINKED INDICATOR #2: Indicator- Sustaining ODF Status in villages
Rationale- DLI 2 measures rural Population of ODF villages showing sustained ODF status.
This DLI measures performance of a sub-set of villages, which are already verified by the SBM-G teams as ODF,
that are called ODF verified villages, as on June 6, 2018 – the cut-off date suggested by the EWG.
The DLI has been calculated based on the parameters suggested in the NARSS protocol for defining an ODF
Village. This includes the following:
✓ All Households have Access to a toilet
✓ All members of a Household always use the toilet
✓ Child faeces is safely disposed
✓ Schools have access to toilet and is in use
✓ AWC have access to toilet and is in use
✓ All toilets are functional
✓ All toilets have safe disposal mechanism
➢ Step 1 – Count of total Population (Child + Adult) – derived after removing those HHs where the enumerator/HH could not establish the technology type. (Denominator)
➢ Step 2 – Numerator established using count of adult population, always using functional, hygienic and safe toilet.
➢ Step 3 – In some HHs (6.5%), which reported having a septic tank toilet without soak pit, the safe disposal mechanism could not be established. In such cases, the analysis adopted a similar approach for estimating the safe sanitation as followed by UNICEF/WHO Joint Monitoring Program, when sufficient information is not available (i.e., considering 50% of such cases as having safe disposal mechanisms)
➢ Step 4 – Further count of child population in the above households where disposal of faeces is through safe methods (Buried in the ground & Put into the toilet) have been included in the numerator.
➢ Step 5 – Added Adult and child population that came from step 3 and Step 4 also in the numerator
➢ Step 6 –Converted the number into percentage DLI#1=Count of total population always using toilet (Step 5) ÷ Count of total population (step 1)
Using the above, NARSS-2 assessed that 82.7 % of rural population of India i.e. 72,81,44,072 are using
toilets that are safe, functional, hygiene.

Interim Report National Annual Rural Sanitation Survey (NARSS), Round-2, 2018-2019
CHAPTER-6: DLI COMPUTATION AND VALUES- INDIA & STATES PAGE 52
✓ All toilets are Hygienic and
✓ There is absence of visible faeces in village surroundings and places which were used historically for
open defecation
Considerations- All parameters are binary in nature hence any village which has failed on any of the above
criteria has been considered as not confirming to the ODF status.
Also, as per the EWG meeting held in December 2017, a maximum of 5% margin of error shall be granted at the
aggregate level in a village to neutralize response error and accordingly the status of usage would be determined
to determine the ODF status of the village.
Process of Calculating DLI# 2- Following process has been followed to calculate DLI# 2:
Population projection of DLI#2 as per MoSPI 2018
To arrive at the extrapolated population for DLI#2, i.e., population living in ODF villages, the following steps
have been undertaken:
To arrive at the extrapolated population for DLI#2, i.e., population living in ODF villages, the following steps
have been undertaken:
❖ A- Total population surveyed (ODF+Non-ODF)
❖ B- ODF population (Besides the population living in the villages not qualifying ODF condition)
❖ C- Total ODF population verified through NARSS
❖ D- Calculation of DLI#2 score (% verified ODF population among ODF population) (C/B*100)
❖ E- % ODF population among total surveyed population (B/A*100)
❖ F- Rural population (MoSPI)
❖ G- Calculation of ODF universe by projecting to the MoSPI population (F*E/100)
❖ H- Projected ODF population (By projecting DLI#2 score to the ODF universe) (G*D/100)

Interim Report National Annual Rural Sanitation Survey (NARSS), Round-2, 2018-2019
CHAPTER-6: DLI COMPUTATION AND VALUES- INDIA & STATES PAGE 53
➢ Step 1 – Considered only ODF verified sampled villages (2891 villages) for computation of DLI # 2 ➢ Step 2 – Identified villages where more than one facility toilets were found to be locked
(0 Villages) and removed from denominator and numerator ➢ Step 3 – Identified villages where technology option is unknown in facility toilet (0 villages) ➢ Step 4 – Removed all ODF villages from HH data which were identified in step 2 & 3 ➢ Step 5 – Removal of all those HH where technology option for disposal of excreta were found to be unknown. (0 HH) ➢ Step 6 – Counted total number of adult and child population of remaining households (Number of HH derived from
step 5) (Denominator) ➢ Step 7– Removed villages as per the process given below, that do not meet the parameters under DLI.
HH Data – a. No access to toilet facility b. HH having access to toilet but fails the ODF status (Basis Functionality, Hygiene & safe Disposal of human
excreta) c. Found unsafe disposal of child faeces d. Less than 95 % individuals are using toilet always
Note: Even if 1 HH is failed under point a, b, c or d, entire village was removed from the numerator. Village data –
a) No Access to toilet facility by any of the public facility (Anganwadi and school). b) Public facility (School & AWC) having access to toilet but fails the ODF status (Basis Functionality, Hygiene,
Usage & safe Disposal of human excreta) c) Public toilet was found to be dysfunctional and unsafe disposal of human excreta. d) Public toilet failed basis on the usage of toilet. e) Any of the public places found with visible faeces in public space sanitation survey are not qualified under
ODF definition. ➢ Step 8 - Count total number of adult and child population after removing villages as described in step 7 (Numerator). ➢ Step 9 - % of adult and child population (step 8 and step 6)
DLI#2= Count of total number of adult and child population (step 9) ÷ count of total number of adult and child population (step 7)
➢ Step 1 – Considered only ODF verified sampled villages (2891 villages) for computation of DLI # 2 ➢ Step 2 – Identified villages where more than one facility toilets were found to be locked
(0 Villages) and removed from denominator and numerator ➢ Step 3 – Identified villages where technology option is unknown in facility toilet (0 villages) ➢ Step 4 – Removed all ODF villages from HH data which were identified in step 2 & 3 ➢ Step 5 – Removal of all those HH where technology option for disposal of excreta were found to be unknown. (0 HH) ➢ Step 6 – Counted total number of adult and child population of remaining households (Number of HH derived from
step 5) (Denominator) ➢ Step 7– Removed villages as per the process given below, that do not meet the parameters under DLI.
HH Data – e. No access to toilet facility f. HH having access to toilet but fails the ODF status (Basis Functionality, Hygiene & safe Disposal of human
excreta) g. Found unsafe disposal of child faeces h. Less than 95 % individuals are using toilet always
Note: Even if 1 HH is failed under point a, b, c or d, entire village was removed from the numerator. Village data –
f) No Access to toilet facility by any of the public facility (Anganwadi and school). g) Public facility (School & AWC) having access to toilet but fails the ODF status (Basis Functionality, Hygiene,
Usage & safe Disposal of human excreta) h) Public toilet was found to be dysfunctional and unsafe disposal of human excreta. i) Public toilet failed basis on the usage of toilet. j) Any of the public places found with visible faeces in public space sanitation survey are not qualified under
ODF definition. ➢ Step 8 - Count total number of adult and child population after removing villages as described in step 7 (Numerator). ➢ Step 9 - % of adult and child population (step 8 and step 6)
DLI#2= Count of total number of adult and child population (step 9) ÷ count of total number of adult and child population (step 7)

Interim Report National Annual Rural Sanitation Survey (NARSS), Round-2, 2018-2019
CHAPTER-6: DLI COMPUTATION AND VALUES- INDIA & STATES PAGE 54
DISBURSEMENT LINKED INDICATOR #3
Indicator- Increase of rural population with Solid Liquid Waste Management
Rationale- DLI 3 focuses on population with solid and liquid waste management
As per Operations Manual, DLI 3 is to be determined using a group of parameters included in the household
schedule and village schedule and are as below.
- Absence of garbage or litter piled up or dumped within the premise of the house
- Absence of stagnant waste water within the premise of the house
- Village level collection and treatment of solid and liquid waste
- Public places in a village show minimal level of littering
- Public places in a village show minimal level of water logging
- Disposal mechanism for solid waste at HH level
- Disposal mechanism for liquid waste at HH level
Considerations
a) Villages which have been observed to have minimal littering and minimal stagnant water were considered
as having improved SLWM and other PSUs will fail and that the population in such villages will not qualify.
b) Villages which have performed safe disposal of solid waste (Community level composting arrangement
(NADEP/ Vermi-compost etc.), community level waste collection arrangement & segregated waste collected
and safely managed).
c) Village which have performed safe disposal of waste water (Flows in some kind of safe system & some kind
of treatment- into drain, kitchen garden and soak pit)
d) Any HHs which were observed to have any garbage or litter piled up or dumped and having stagnant waste
water within the premises of the households will fail, and population in that household will not qualify.
e) In addition to cleanliness of the premises, the households which performed safe disposal of solid and liquid
waste, the population from such households were considered as having improved SLWM.
Using the above computation, DLI 2 value is based on an assessment that 90.4 % of the population i.e.
36,21,83,642 is living in ODF verified villages that meet criteria for sustained ODF.

Interim Report National Annual Rural Sanitation Survey (NARSS), Round-2, 2018-2019
CHAPTER-6: DLI COMPUTATION AND VALUES- INDIA & STATES PAGE 55
Process of Calculating DLI# 3
Following process has been followed to calculate DLI# 3:
➢ Step 1 – Identified villages where Public Spaces questionnaire is not done. (0 village) ➢ Step 2 – Counted total number of adult and child population in remaining villages and derived the Denominator. ➢ Step 3 – Identified the villages from Public Spaces Survey data, not qualifying the criteria of Solid & Liquid waste. i.e.
Coded “No” in Q8 & Q9 and solid and liquid waste disposal systems i.e. Coded 1, 2 or 3 in Q6 and 1 or 2 in Q7 respectively.
➢ Step 4 – Removed HHs from Household data for villages identified in step 3. ➢ Step 5 – Identified and removed the households where “Yes” is coded in both Q10 and Q12 of HH data - that means
garbage or litter piled up or dumped, stagnant waste water found within the premise of the house. ➢ Step 6 – Identified and removed the households where safe disposal mechanism was present for both solid and liquid
waste, i.e., coded “indiscriminate” in Q11 and Q13 of HH data ➢ Step 7 - Count of total number of adult and child population of remaining HH from step 7 (Numerator). ➢ Step 8 – % of adult and child population (Step 7 and step 2).
DLI#3-Count of total number of adult and child population (step 7) ÷ count of total number of adult and child population (step2)
Using the above computation, the DLI 3 was derived based on an assessment of 63.3% of rural population,
ie. 55,77,30,094 which are practicing solid & liquid waste management.

Interim Report National Annual Rural Sanitation Survey (NARSS), Round-2, 2018-2019
CHAPTER-6: DLI COMPUTATION AND VALUES- INDIA & STATES PAGE 56
DLI SCORE – NATIONAL & STATES - (NARSS 1 & NARSS 2)
States
DLI 1 DLI 2 DLI 3
NARSS 1 NARSS 2 NARSS 1 NARSS 2 NARSS 1 NARSS 2
%
Rural population using safe,
functional & hygienic toilets
%
Rural population using safe,
functional & hygienic toilets
%
Rural population
living in ODF verified villages
%
Rural population
living in ODF verified villages
%
Rural population practicing
SLWM
%
Rural population practicing
SLWM
India 62.3 545247322 82.7 728144072 95.3 155002809 90.4 362183642 28.3 255782608 63.3 557730094
A & N Islands 65.3 209858 97.8 315987 - - 96.4 311369 61.9 199071 69.7 225299
Andhra Pradesh 68.6 24871405 88.6 32323304 100.0 2925952 92.4 23060424 26.2 9504471 54.8 19998231
Arunachal Pradesh 58.2 463366 91.5 713673 - - 94.1 357903 0 0 45.4 354065
Assam 75.4 20808860 86.5 24043997 76.5 2815534 75.0 4582597 22.6 6236156 18.7 5198706
Bihar 36.6 34646067 60.1 57413557 90.5 3231747 43.6 2398461 6.1 5785870 24.6 23476481
Chhattisgarh 87.7 17318659 98.8 19594157 100.0 8759842 96.4 19117296 46.2 9116970 78.8 15640215
D & N Haveli 98.8 148905 100.0 141066 - - 100 141066 8.4 12594 97.2 137152
Goa 89.9 665445 78.2 573382 - - - - 18.1 133882 48.5 355992
Gujarat 92.4 34090725 98.2 36435167 95.4 26414631 96.7 35866251 69.2 25538996 97.0 35988071
Haryana 92.6 16435512 98.4 17546598 100.0 10718836 95.8 17073616 72.4 12864052 98.5 17559418
Himachal Pradesh 99.0 6264767 98.7 6276861 96.9 5738361 91.6 5828758 89.3 5651344 93.9 5976219
Jammu & Kashmir 38.7 3510916 82.2 7495867 - - 77.9 2420215 9.8 890966 45.0 4106235
Jharkhand 45.2 11792424 64.0 16876179 92.9 3666489 68.9 4763648 19.8 5163520 47.9 12618423
Karnataka 63.9 24517550 81.3 31237063 100.0 3940279 91.5 22252271 21.6 8296703 42.8 16464194
Kerala 100.0 26883783 99.5 26912694 99.1 19036553 98.7 26695957 91.8 24684134 88.9 24040915
Madhya Pradesh 65.6 37351056 80.8 46534660 100.0 4574803 86.8 15920074 30.0 17061416 45.9 26432685
Maharashtra 69.8 43802548 85.3 53617466 95.0 10459673 93.5 42157166 35.8 22462903 80.6 50651985
Manipur 74.4 1468998 94.3 1882958 - - 97.1 950137 0 0 51.9 1035224
Meghalaya 89.7 1990351 90.0 2015747 74.7 882659 93.5 1082851 76.0 1687258 58.3 1306022
Mizoram 86.9 418741 88.9 428727 87.3 165556 93.4 222705 50.1 241215 93.3 449886
Nagaland 72.7 1455860 89.6 1810964 - - 90.6 992486 13.6 272582 68.0 1375006
Odisha 53.9 19007503 55.0 19486627 96.3 2479985 88.7 3518915 11.3 3976215 22.3 7887730
Puducherry 55.4 289553 78.1 419133 - - - - 1.9 9980 22.7 121769
Punjab 67.3 11584799 84.4 14503631 99.6 2850318 78.5 7531631 38.1 6554735 60.6 10414312
Rajasthan 73.2 41322126 91.3 52121678 88.2 11085919 90.9 39214603 29.7 16763722 86.6 49466533
Sikkim 98.7 550507 98.2 550958 96.0 411413 95.5 535774 91.3 509369 99.2 556559
Tamil Nadu 54.6 14933905 82.5 21959798 83.8 1423383 73.3 3705449 16.7 4565382 77.7 20695059
Telangana 69.0 15994491 90.6 21172815 100.0 3775110 84.3 8208972 38.3 8891676 56.2 13118205
Tripura 57.5 1783687 85.2 2663262 - - - - 8.1 250080 19.1 595549

Interim Report National Annual Rural Sanitation Survey (NARSS), Round-2, 2018-2019
CHAPTER-6: DLI COMPUTATION AND VALUES- INDIA & STATES PAGE 57
States
DLI 1 DLI 2 DLI 3
NARSS 1 NARSS 2 NARSS 1 NARSS 2 NARSS 1 NARSS 2
%
Rural population using safe,
functional & hygienic toilets
%
Rural population using safe,
functional & hygienic toilets
%
Rural population
living in ODF verified villages
%
Rural population
living in ODF verified villages
%
Rural population practicing
SLWM
%
Rural population practicing
SLWM
India 62.3 545247322 82.7 728144072 95.3 155002809 90.4 362183642 28.3 255782608 63.3 557730094
Uttar Pradesh 41.9 72354266 83.4 145867439 100.0 4475009 87.3 23888795 22.7 39196890 81.3 142133894
Uttarakhand 86.3 6534497 97.6 7437881 97.0 2476082 90.4 6886967 61.1 4625312 93.4 7118563
West Bengal 76.7 51776196 85.0 57770777 95.2 22694674 89.5 42497288 21.7 14635143 62.2 42231497
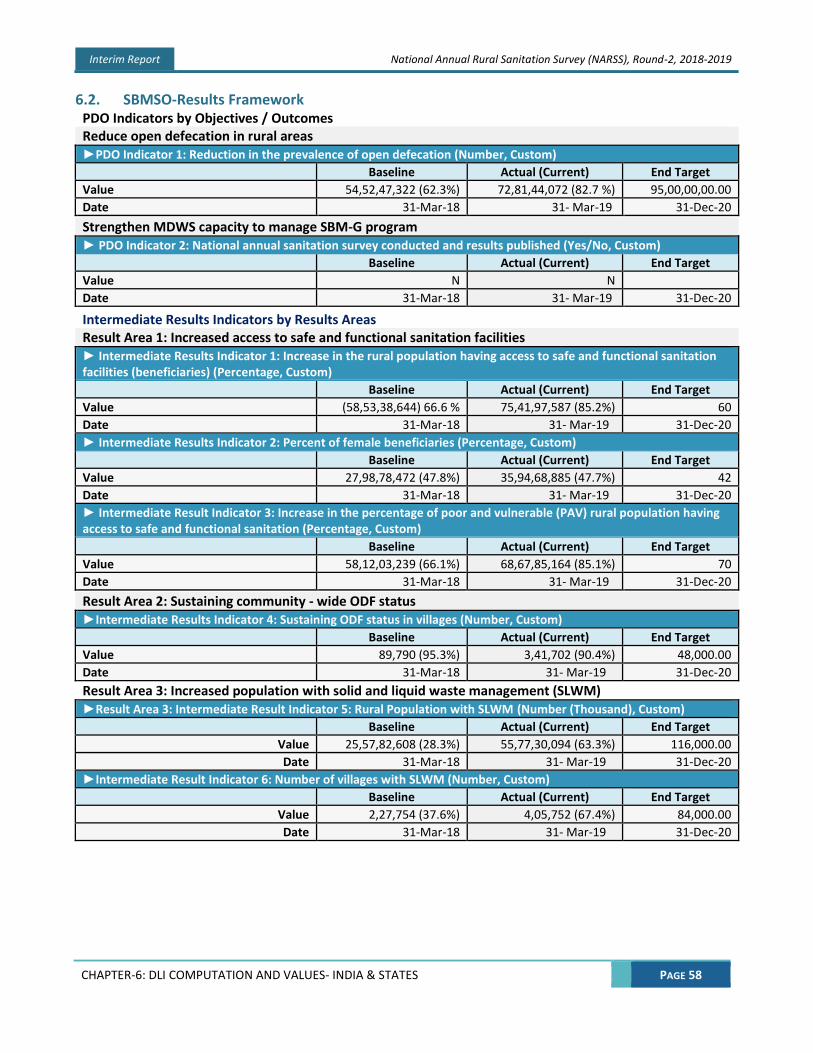
Interim Report National Annual Rural Sanitation Survey (NARSS), Round-2, 2018-2019
CHAPTER-6: DLI COMPUTATION AND VALUES- INDIA & STATES PAGE 58
6.2. SBMSO-Results Framework PDO Indicators by Objectives / Outcomes Reduce open defecation in rural areas ►PDO Indicator 1: Reduction in the prevalence of open defecation (Number, Custom)
Baseline Actual (Current) End Target
Value 54,52,47,322 (62.3%) 72,81,44,072 (82.7 %) 95,00,00,00.00
Date 31-Mar-18 31- Mar-19 31-Dec-20
Strengthen MDWS capacity to manage SBM-G program ► PDO Indicator 2: National annual sanitation survey conducted and results published (Yes/No, Custom)
Baseline Actual (Current) End Target
Value N N
Date 31-Mar-18 31- Mar-19 31-Dec-20
Intermediate Results Indicators by Results Areas Result Area 1: Increased access to safe and functional sanitation facilities ► Intermediate Results Indicator 1: Increase in the rural population having access to safe and functional sanitation facilities (beneficiaries) (Percentage, Custom)
Baseline Actual (Current) End Target
Value (58,53,38,644) 66.6 % 75,41,97,587 (85.2%) 60
Date 31-Mar-18 31- Mar-19 31-Dec-20
► Intermediate Results Indicator 2: Percent of female beneficiaries (Percentage, Custom)
Baseline Actual (Current) End Target
Value 27,98,78,472 (47.8%) 35,94,68,885 (47.7%) 42
Date 31-Mar-18 31- Mar-19 31-Dec-20
► Intermediate Result Indicator 3: Increase in the percentage of poor and vulnerable (PAV) rural population having access to safe and functional sanitation (Percentage, Custom)
Baseline Actual (Current) End Target
Value 58,12,03,239 (66.1%) 68,67,85,164 (85.1%) 70
Date 31-Mar-18 31- Mar-19 31-Dec-20 Result Area 2: Sustaining community - wide ODF status ►Intermediate Results Indicator 4: Sustaining ODF status in villages (Number, Custom)
Baseline Actual (Current) End Target
Value 89,790 (95.3%) 3,41,702 (90.4%) 48,000.00
Date 31-Mar-18 31- Mar-19 31-Dec-20
Result Area 3: Increased population with solid and liquid waste management (SLWM) ►Result Area 3: Intermediate Result Indicator 5: Rural Population with SLWM (Number (Thousand), Custom)
Baseline Actual (Current) End Target
Value 25,57,82,608 (28.3%) 55,77,30,094 (63.3%) 116,000.00
Date 31-Mar-18 31- Mar-19 31-Dec-20
►Intermediate Result Indicator 6: Number of villages with SLWM (Number, Custom)
Baseline Actual (Current) End Target
Value 2,27,754 (37.6%) 4,05,752 (67.4%) 84,000.00
Date 31-Mar-18 31- Mar-19 31-Dec-20

Interim Report National Annual Rural Sanitation Survey (NARSS), Round-2, 2018-2019
CHAPTER-6: DLI COMPUTATION AND VALUES- INDIA & STATES PAGE 59
Result Area 4: Strengthened capacity of MDWS in program management, advocacy, monitoring and evaluation (M&E) ► Intermediate Result Indicator 7: Program management unit strengthened and functional (Yes/No, Custom)
Baseline Actual (Current) End Target
Value N N Y
Date 31-Mar-18 31- Mar-19 31-Dec-20
►Intermediate Result Indicator 8: Monitoring and Evaluation Unit strengthened (Yes/No, Custom)
Baseline Actual (Current) End Target
Value N N N
Date 31-Mar-18 31- Mar-19 31-Dec-20
► Intermediate Result Indicator 9: IMIS improved and functional (Yes/No, Custom)
Baseline Actual (Current) End Target
Value Y Y Y
Date 31-Mar-18 31- Mar-19 31-Dec-20
► Intermediate Result Indictor 10: BCC campaign implemented at national level (Yes/No, Custom)
Baseline Actual (Current) End Target
Value Y Y Y
Date 31-Mar-18 31- Mar-19 31-Dec-20
►Intermediate Result Indicator 11: Report on grievances received and addressed (Yes/No, Custom)
Baseline Actual (Current) End Target
Value Y Y Y
Date 31-Mar-18 31- Mar-19 31-Dec-20
Intermediate Result Indicator 12: Report on annual program performance (Yes/No, Custom)
Baseline Actual (Current) End Target
Value N N Y
Date 31-Mar-18 31- Mar-19 31-Dec-20
Explanation on SBMSO results frame indicators are provided below:
Indicator Description Calculation Process
PDO Indicator 1: Reduction in the prevalence of open defecation
This indicator has been determined by the population always using safe, functional and hygienic toilet and child feces are also being disposed safely.
DLI # 1 Rural Population
Result Area 1 : Increased access to safe and functional sanitation facilities
Intermediate Results Indicator 1: Increase in the rural population having access to safe and functional sanitation facilities
This indicator has been determined by calculating the population those are having access to safe, functional and hygienic toilet.
DLI# 1 Rural Population without considering usage by an individual
Intermediate Results Indicator 2: Percent of female beneficiaries
This indicator has been determined by calculating the female population those are having safe, functional and hygienic toilet.
Denominator= DLI# 1 Rural population (adult male, adult female & all child) having access to safe, functional & hygienic sanitation Numerator= Total Female population (adult female + girl child) having access to safe, functional & hygienic sanitation

Interim Report National Annual Rural Sanitation Survey (NARSS), Round-2, 2018-2019
CHAPTER-6: DLI COMPUTATION AND VALUES- INDIA & STATES PAGE 60
Indicator Description Calculation Process
Intermediate Result Indicatior 3: Increase in the percentage of poor and vulnerable (PAV) rural population having access to safe and functional sanitation
This indicator has been determined by calculating the PAV household and those are having access to safe, functional and hygienic toilet.
Denominator= Total PAV rural population (All BPL and amongst APL, SC, ST, Landless, Small & Marginal farmer, Laborer with only Homestead Land/ Physically Handicapped and Women Headed Household Numerator= Total PAV rural population having access to safe, functional and hygienic toilet
Result Area 2: Sustaining community - wide ODF status
Intermediate Results Indicator 4: Sustaining ODF status in villages
This indicator gives status of ODF sustainability among ODF verified village. An ODF village sustains as ODF if it passes through all the criteria of ODFness. By failing any of the criteria as stated below has considered as Non ODF.
✓ Household having Access to a toilet,
✓ Safe disposal of Child faeces, ✓ School having access to toilet ✓ AWC having access to toilet ✓ Functionality of toilet ✓ Hygienic status of toilet ✓ Safe technology of the toilet ✓ Usage of toilet by individuals ✓ Absence of visible faeces in the
village.
Number of villages (n=341543) sustaining ODF Calculation was done as follows:
A- Total number of ODF villages (377813) as on 6th June 2018
B- DLI#2 Score = 90.4 C- Number of projected ODF
villages (341543)
Formula: C=(A*B)/100
Result Area 3: Increased population with solid and liquid waste management (SLWM)
Intermediate Result Indicator 5: Rural population with SLWM
This indicator has been decided by a group of parameters from household and village data such as, Absence of garbage or litter piled up or dumped within the premise of the house, Absence of stagnant waste water within the premise of the house, some kind of safe disposal methodology is adopted by the household to dispose solid and liquid waste, Public places in a village show minimal level of littering and Public places in a village show minimal level of water logging.
DLI # 3 Rural Population
Intermediate Result Indicator 6: Number of villages with SLWM (Number, Custom)
A Village with good SLWM has resolute if there are some safe disposal mechanism adopted by the village for disposal of solid and liquid waste and there are minimal littering and stagnant water around public places in the village.
Denominator-Total surveyed villages Numerator- Villages with safe disposal mechanism of solid & liquid waste and with minimal littering and stagnant water near public places

Interim Report National Annual Rural Sanitation Survey (NARSS), Round-2, 2018-2019
CHAPTER-7: PERFORMANCE OF STATES - KEY INDICATORS PAGE 61
CHAPTER-7: PERFORMANCE OF STATES - KEY INDICATORS 7.1. KEY FINDINGS OF NARSS 2018-19
1. ODF Survey An ODF-verified village is confirmed to be ODF if, during the survey, it is found that:
• All households and all public institutions surveyed found to be using safe technology for disposal of faeces
• No visible faeces found in the village surroundings 2622 villages (90.7%) of all 2891 ODF-verified villages surveyed were confirmed to be ODF. The remaining 269 villages (9.3%) were not confirmed ODF due to any of the following reasons:
1. Lower than 100% access to toilets in the village 2. Presence of unhygienic/dysfunctional/unsafe toilet in any household in the village 3. Non-usage of a toilet by the household members 4. Non-access of a toilet in schools or anganwadis 5. Presence of visible fecal matter in the village.
It may be noted that the average access to toilets in these 269 villages was about 93%.
93.3%
of verified Open
Defecation Free (ODF) villages were
confirmed as ODF

Interim Report National Annual Rural Sanitation Survey (NARSS), Round-2, 2018-2019
CHAPTER-7: PERFORMANCE OF STATES - KEY INDICATORS PAGE 62
% of ODF verified villages confirmed to be ODF
Other Attributes
ODF Villages: Other villages
`
***********
90.7
9.3
ODF Confirmed ODF Not confirmedBase: ODF verfied villages (2891)
School with access to
Toilet
School with access to
Toilet
School with access to
Toilet
School with access to
AWC with access
to Toilet
AWC with access
to Toilet
AWC with access
to Toilet
AWC with access
With no solid waste
With no solid waste
With no solid waste
With no solid waste
With no solid waste
With no solid waste
With no solid waste
With no solid waste
With no liquid waste
With no liquid waste
With no liquid waste
With no liquid waste
With no liquid waste
With no liquid waste
With no liquid waste
With no liquid waste
With no solid waste
With no solid waste
With no solid waste
With no solid waste
With no solid waste
With no solid waste
With no solid waste
With no solid waste
With no liquid waste
With no liquid waste
With no liquid waste
With no liquid waste
With no liquid waste
With no liquid waste
With no liquid waste
With no liquid waste
School with access to
Toilet
School with access to
Toilet
School with access to
Toilet
AWC with access to
Toilet
AWC with access to
Toilet
AWC with access to
Toilet
98.6
97.1
97.1
97.1
97.1
97.1
97.1
97.1
99.8
99.2
99.2
99.2
99.2
99.2
99.2
98.1
98.1
98.1
98.1
98.1
98.1
98.1
83.7
85.7
85.7
85.7
85.7
85.7
85.7
96.5
93.2
93.2
93.2
93.2
93.2
93.2
93.2
96.5
94.0
94.0
94.0
94.0
94.0
94.0
94.0
96.0
97.6
97.6
97.6
97.6
97.6
97.6
97.6
98.1
98.1
98.1
98.1
98.1
98.1
98.1

Interim Report National Annual Rural Sanitation Survey (NARSS), Round-2, 2018-2019
CHAPTER-8: PROFILE OF SAMPLED HOUSEHOLDS PAGE 63
CHAPTER-8: PROFILE OF SAMPLED HOUSEHOLDS HIGHLIGHTS 1. Average household size was found to be 4.3
2. 34.1% households were APL
3. 59.4% households were BPL
4. 15.14% of households having the children less than 3 years
8.1. INTRODUCTION his chapter presents information on the demographic and socioeconomic characteristics of the household
members in the surveyed households (N=92411) from 6136 PSUs, such as age, gender, number of children
aged below 3 years, social categories, economic status of households and average household size. This
information is useful for understanding the relationship between background characteristics that affect access
and use of toilets, hygiene and sanitation behaviour, and household’s solid and liquid waste management
mechanism.
8.2. SOCIO-ECONOMIC CHARACTERISTICS OF HEAD OF THE HOUSEHOLDS
8.2.1. Social category of head of the households
Social category wise analysis indicated that at an overall level, close to half of the households (43.1%) belonged
to the Other Backward Caste (OBC). Three out of ten households were of general category (29.6%) while 23.7
percent of the households belonged to Scheduled Caste. Category wise analysis indicated that in ODF areas,
majority of households were of other backward category (38.9%) followed by General category (32.4%) and ST
(13.6%) while in non-ODF areas, OBC households were in majority (46.9%) followed by general category
households (27.0%) and ST households (12.8%). The trend of the percentage of the households falling under
various social categories is same irrespective of the village category. Please refer annexure table-HH: 1 for
additional information.
Social categories of head of the household (%)
43.1
11.213.2
29.6
2.9
38.9
12.0 13.6
32.4
3.1
46.9
10.512.8
27.0
2.8
Other Backward Caste(OBC)
Scheduled Caste (SC) Scheduled Tribe (ST) General Caste Don’t Know/Can’t Say
Total ODF Non-ODF Base: All households (92411)
T

Interim Report National Annual Rural Sanitation Survey (NARSS), Round-2, 2018-2019
CHAPTER-8: PROFILE OF SAMPLED HOUSEHOLDS PAGE 64
8.2.2. Economic category of head of the households To gauge the socio-economic classification of the surveyed households, the head of the households were asked
about the economic category to which their household belonged to. Overall, close to six out of ten households
(59.4%) reported that their household was a below poverty line (BPL) household whereas one-third households
(34.1%) indicated to be an above poverty line (APL) household. 6.6 percent of the total sampled households did
not know their economic classification. Category wise analysis indicated that a similar trend was prevalent across
ODF and non-ODF areas, as could be seen in the table below. Please refer HH:2 & table:6 for additional
information.
Economic categories of head the households (%)
Socio-economic category of head the household
Socio-economic categories of head of the households
Particulars
Total ODF Non-ODF
Total number of households Total number of households Total number of households
Weighted Un-
weighted % Weighted
Un-weighted
% Weighted Un-
weighted %
Social Category
Other Backward Caste 39851 39271 43.1 17003 16670 38.9 22848 22601 46.9
Scheduled Caste 10350 10239 11.2 5259 5168 12 5090 5071 10.5
Scheduled Tribe 12187 12806 13.2 5952 6343 13.6 6235 6463 12.8
General Caste 27317 27360 29.6 14171 14179 32.4 13147 13181 27
Don’t Know/Can’t Say 2705 2735 2.9 1350 1375 3.1 1356 1360 2.8
Total 92411 92411 100 43735 43735 100 48676 48676 100
Economic Category
APL 31466 31392 34.1 15602 15614 35.7 15864 15778 32.6
BPL 54857 54999 59.4 25214 25268 57.7 29643 29731 60.9
Don’t Know 6087 6020 6.6 2919 2853 6.7 3169 3167 6.5
Total 92411 92411 100 43735 43735 100 48676 48676 100
APL, 34.1
BPL, 59.4
Don’t Know, 6.6
APL BPL Don’t Know Base: All households (92411)

Interim Report National Annual Rural Sanitation Survey (NARSS), Round-2, 2018-2019
CHAPTER-8: PROFILE OF SAMPLED HOUSEHOLDS PAGE 65
The table shows that of the total sampled households surveyed in the NARSS, in overall, the maximum number
of the households belonged to the OBC which is accounted to 43.1 percent followed by general and scheduled
tribe which constituted 29.6 percent and 13.2 percent respectively. The trend in similar across both village
category, however, the percent distribution varies across the category.
As far as the economic categories of the households are concerned, the majority belonged to the BPL category
which is 59.4 percent followed by the APL which account to be 34.1 percent. As seen in social category, in
economic category also, the trend of distribution of the households are similar across both the available village
categories. Refer table:6
8.3. Demographic characteristics of the survey population
8.3.1. Gender of the survey population
The data on the gender of the population, presented in the following table, indicated that higher number of the
male members were reported in the surveyed households than the female members which is 52.3 percent &
47.7 percent respectively. The percentage distribution of both genders is similar across ODF and Non-ODF villages
at national level. (Refer table:7)
Gender profile of the surveyed population (%)
8.3.2. Age group of the survey population
The figure illustrates the percent distribution of surveyed population by age-group. It shows that the children
under age 15 represents 24.6 percent of the surveyed population, while individual age 65 and older represents
5.9 percent of the surveyed population. Percent distribution of the population in the household belonging to the
ODF villages shows a slight change in trend wherein majority of the population (19.0%) belongs to the age group
of 15-24 years followed by the age group <15 years which represents 22.1 percent. In Non-ODF households also,
<15 age-group forms majority of the population with percentage of 26.7 percent. (Refer table:7)
52.347.7
52.347.7
Male Female
Gender of the surveyed population
ODF Non-ODF Base: All surveyed population (391595)

Interim Report National Annual Rural Sanitation Survey (NARSS), Round-2, 2018-2019
CHAPTER-8: PROFILE OF SAMPLED HOUSEHOLDS PAGE 66
Population Pyramid Percent distribution of the surveyed household population
Gender wise percentage distribution of surveyed population
Percentage distribution of gender of the surveyed population
Particulars
Total ODF Non-ODF
Weighted Number
Un-weighted Number
% Weighted Number
Un-weighted Number
% Weighted Number
Un-weighted Number
%
Male 205026 204758 52.3 94358 94148 52.3 110668 110610 52.3
Female 186904 186837 47.7 85941 85790 47.7 100963 101047 47.7
Total 391931 391595 100 180300 179938 100 211631 211657 100
Age group-wise percentage distribution of surveyed population
Particulars
Total ODF Non-ODF
Weighted Number
Un-weighted Number
% Weighted Number
Un-weighted Number
% Weighted Number
Un-weighted Number
%
<15 96441 96322 24.6 39919 39772 22.1 56522 56550 26.7
15-24 76166 76107 19.4 34343 34215 19.0 41823 41892 19.8
25-34 64757 64867 16.6 30801 30956 17.2 33956 33911 16.0
35-44 56423 56481 14.4 27372 27420 15.2 29051 29061 13.7
45-54 42992 42884 11.0 20813 20736 11.5 22178 22148 10.5
55-64 31774 31687 8.1 15289 15232 8.5 16485 16455 7.8
65-74 16962 16861 4.3 8472 8355 4.6 8489 8506 4.0
≥ 75 6417 6386 1.6 3290 3252 1.8 3126 3134 1.5
Total 391931 391595 100 180300 179938 100 211631 211657 100
Note: The percentage is based on un-weighted sample. The subsequent tables will be based on weighted sample unless otherwise specified.
26.7
19.8
16.0
13.7
10.5
7.8
4.0
1.5
22.1
19
17.2
15.2
11.5
8.5
4.6
1.8
3020100102030
<15
15-24
25-34
35-44
45-54
55-64
65-74
≥ 75 ODF Non-ODF
Age in years
Percent

Interim Report National Annual Rural Sanitation Survey (NARSS), Round-2, 2018-2019
CHAPTER-8: PROFILE OF SAMPLED HOUSEHOLDS PAGE 67
8.3.3. Average household size by gender & age group of the population The mean number of children below 3 years is 1.25 which slightly varies across the gender of the children in the
surveyed household. Mean number of individuals with the age of 3 or older is 4.05 with difference in mean across
the gender. Mean number of the male member across the village category is slightly higher than the mean
number of female members. (Refer table:8)
Average household size by gender & age group of the population
Mean & Standard deviation of the surveyed population
Particulars Total ODF Non-ODF
Mean SD Mean SD Mean SD
Average no. of children aged <3 years, mean (SD) 1.25 0.56 1.25 0.56 1.25 0.55
Average no. of male child aged <3 years, mean (SD) 0.68 0.61 0.70 0.61 0.66 0.60
Average no. of female child aged <3 years, mean (SD) 0.57 0.61 0.56 0.60 0.59 0.62
Average no. of adult aged ≥ 3 years mean (SD) 4.05 1.89 3.95 1.82 4.15 1.94
Average no. of males aged ≥ 3 years mean (SD) 2.12 1.19 2.06 1.13 2.17 1.23
Average no. of females aged ≥ 3 years mean (SD) 1.94 1.18 1.89 1.15 1.98 1.20
Average household size by gender profile of the population
Particulars Total ODF NON- ODF
Mean no of total Member 4.3 4.1 4.4
Mean no of total Male 2.2 2.1 2.3
Mean no of total Female 2.1 2 2.1
The table presents the detail of average household size across the states which were calculated basis total
member of the households captured in the survey. At overall level, average household size was calculated to be
4.3 with male member averaging 2.2 while female average is 2.1. The details of average male and female member
in ODF & Non-ODF villages are provided in the table for easy reference.

Interim Report National Annual Rural Sanitation Survey (NARSS), Round-2, 2018-2019
CHAPTER-9: AVAILABILITY AND STATUS OF TOILETS IN HOUSEHOLDS PAGE 68
CHAPTER-9: SURVEY FINDINGS OF HOUSEHOLDS
Key Findings
• Accessibility: Overall accessibility of the toilets for the households was found to be 93.3 percent, which was 98.0 percent in ODF villages and 89.1 percent in non-ODF villages.
• Functionality: At national level 98.6 percent of the toilets were found to be functional. In ODF villages it was higher with 99.7 percent toilets to be functional as compared to 97.5 percent in non-ODF villages.
• Hygienic Situation: 95.0 percent of the toilets were found to be hygienic at national level. 99.5 percent toilets in ODF villages were found to be hygienic as compared to 90.5 percent in non-ODF villages.
• Disposal Mechanism of Excreta: Safe Disposal mechanism for disposing of human excreta was found to be prevalent in 99.6 percent of the household surveyed. In ODF villages 100 percent reported the same whereas in non-ODF villages 99.1 percent reported the same. Safe Disposal mechanisms for disposing children’ excreta were followed in 75.4 percent of the households. In ODF villages 95.4 percent reported of disposing the children’ excreta through safe method whereas 59.9 percent in non-ODF villages reported the same.
• Technological options: Majority of toilet (99.6%) was found to be connected to a tank/ pit or to a sewer system.
• Usage of Toilets: A high toilet usage was found to be prevalent with 96.5 percent people reporting to be using the toilets always among those who had access to toilets.
• Solid and liquid waste management practices: Most of household premises were found to be free from garbage and litter. At a national level 97.5 percent of the household premises were found to be without garbage or litter. More than half of the households i.e. around 53.3 percent of the households reported of disposing the solid household waste outside to a common system. Similarly, disposal of waste water to a common system was found to be followed by 60.1 percent of the households. At mere number of household premises, presence of stagnant water was observed which was at 3.7 percent of the total households.

Interim Report National Annual Rural Sanitation Survey (NARSS), Round-2, 2018-2019
CHAPTER-9: AVAILABILITY AND STATUS OF TOILETS IN HOUSEHOLDS PAGE 69
9.1. INTRODUCTION his chapter presents information on key saniation indicators of the households. These indicators included
access, functionality, hygienic condition, availability of water for toilet usage, technological options used in
the toilet and solid & liquid waste management in rural households. In addition, this chapter also describes the
characteristics of the population covered under surveyed households with respect to the usage of the toilet and
the practice of safe disposal of excreta of childern <3 years.
Particulars Total ODF Non-ODF
Total number of households surveyed 92411 43735 48676
Total number of households with toilet access (Own, shared & Public toilet) 86199 42842 43356
Total Number of households with toilet access (Own & shared) * 84590 42347 42243
*For calculations of functionality, hygienic status, safe disposal of excreta, usage of toilet & availability of water, base (n=84590) will be used.
9.2. ACCESS TO TOILETS In the survey, the information on accessibility of toilet facility for the household was collected through a
combination of four responses which included i) Own toilet : Households having access to toilet which is
exclusively used by members of the household ii) Shared toilet: Household having access to toilet used by
multiple families iii) Community toilets: Households having access to a Public toilet facility (toilet is open to the
general public) and iv) No toilet access : Households do not have access to any toilet (family members usually
defecate in the bush, fields, or other locations).
Among all the surveyed households (n=92411), the households which had access to toilets represents 93.3 at
national level. Almost all the household in ODF villages (98.0%) have access to toilet while households of non-
ODF villages reported 89.1 percent toilet access.
ODF & Non-ODF households rely on different set-up of toilet facilities depending on ownership status. Main type
of toilet to which the ODF households getting access to, is own toilet (89.9%), shared toilet (6.9%) and community
toilet (1.1%). In Non-ODF households also, the trend of using the types of toilet is same, however, the percent of
households in own toilet is accounted to 73.9 percent, shared toilet (12.9%) and community toilet (2.3%). Overall,
6.7 percent of households do not have access to toilet facilities, meaning they practice open defecation.
State-wise analysis of data shows that the states of North-east (Manipur, Mizoram, Nagaland & Sikkim) & Dadra
and Nagar Haveli have all the households (100%) with access to toilet. At national level, the state which have
reported toilet access in more than 99 percent households but below 100 percent, are Kerala (99.9%), Tamilnadu
(99.7%), Haryana, Arunachal Pradesh & Meghalaya (99.6% each), Uttarakhand (99.5%) and ANI (99.2%). The
percent distribution of toilet access in four states have been reported below 90 percent. The states are J&K
(85.3%), Jharkhand (84.7%), Bihar (73.6%) and Odisha (72.2%). The households of ODF villages of Jharkhand
reported below 90 percent of toilet access which accounts to be 89.9 percent followed by Bihar (85.9%).
Surprisingly, across all states Bihar is the only state wherein ODF (85.9%) and Non-ODF (72.9%) households both
have reported low toilet access.
T
`

Interim Report National Annual Rural Sanitation Survey (NARSS), Round-2, 2018-2019
CHAPTER-9: AVAILABILITY AND STATUS OF TOILETS IN HOUSEHOLDS PAGE 70
The lowest access to toilet by the Non-ODF household was recorded in Odisha (68.9%). (Refer HH:3 in annexure
table)
Trends: Percentage of households practicing open defecation decreased from 24 percent in 2017-18 to 6.7 percent in 2018-19.
Accessibility by types of toilet (%)
Percentage of household with accessibility to the toilet by state/ UT
81.5
10.11.7
6.7
89.9
6.91.1 2.0
73.9
12.9
2.3
10.9
Own toilet Shared toilet Community Toilet No Access
Total ODF Non-ODF
Base: All households (92411)
Base: All Households (92411)

Interim Report National Annual Rural Sanitation Survey (NARSS), Round-2, 2018-2019
CHAPTER-9: AVAILABILITY AND STATUS OF TOILETS IN HOUSEHOLDS PAGE 71
9.3. PATTERNS OF HOUSEHOLD ACCESS BY SOCIO-ECONOMIC CHARACTERISTICS
The distribution of households by social categories shows that more than 9 households out of 10 have access to
toilet facilities. The households which belong to the general category have got highest access which constitutes
96.4 percent while 95 percent are scheduled caste, 92.1 percent are scheduled tribe, and 91.2 percent are other
backward caste.
The percentage of ODF households with access to the toilet facilities is on higher side (98.0%) as compared to
the Non-ODF households (89.1%).
Accessibility to the toilets among different social groups (%)
Accessibility of the toilets by socio- economic characteristics
Households with toilet access
Accessibility of toilets
Total ODF Non-ODF
Total Number of households
% Total
Number of households
% Total
Number of households
%
Base: All households 92411 43735 48676
Social Category
Other Backward Caste 36335 91.2 16456 96.8 19879 87.0
Scheduled Caste 9833 95.0 5203 98.9 4631 91.0
Scheduled Tribe 11226 92.1 5828 97.9 5398 86.6
General Caste 26335 96.4 14024 99.0 12311 93.6
Don’t Know/Can’t Say 2469 91.3 1331 98.6 1138 83.9
Total 86199 93.3 42842 98.0 43356 89.1
Economic Category
APL 29937 95.1 15355 98.4 14582 91.9
BPL 50549 92.1 24609 97.6 25940 87.5
Don’t Know 5712 93.8 2878 98.6 2834 89.5
Total 86199 93.3 42842 98.0 43356 89.1
The table depicts the accessibility status of the households by socio-economic categories. Out of the total
households which have got access to the toilet facilities, majority of the households belonged to the general
category which is accounted to 96.4 percent followed by the households belonged to the scheduled caste which
91.2
95.0
92.1
96.4
8.8
5.0
7.9
3.6
Other Backward Caste
Scheduled Caste
Scheduled Tribe
General Caste
Access to toilet No access to toilet
Base : All households with toilet access (86199)

Interim Report National Annual Rural Sanitation Survey (NARSS), Round-2, 2018-2019
CHAPTER-9: AVAILABILITY AND STATUS OF TOILETS IN HOUSEHOLDS PAGE 72
is 95.0 percent of the total accessible households. The number of households which are reported the lowest in
this category belonged to the other backward caste (91.2%). In ODF category, the percent distribution of the
households belonging to the different social category with toilet access is almost universal and that almost all
the households have access to the toilet except the household which belongs to other backward caste where the
accessibility percentage is lowest among other caste category.
Accessibility to the toilet facility also varies as per the economic categories of the households. The table depicts
that the households belonging to the APL category have got higher access as compared to the BPL category which
constitutes 95.1 percent in overall. The BPL households have got 92.1 percent toilet access. Please refer table:10
for detailed information.
9.4. FUNCTIONALITY OF THE HOUSEHOLD TOILETS
The functionality status of the toilet was determined by observing four components in the toilet. These
components were whether the i) pan/seat was completely broken ii) pan was choked iii) pits/tanks were
completely covered iv) pipes were broken or open. Based on the above parameters, overall functionality of the
households were reported to be 98.6 percent. Functionality status of households which belongs to the ODF
village represents 99.7 percent where almost all the households have got functional toilet. In households toilet
of the non-ODF villages, functionality status represents 97.5 percent.
State-wise analysis of data shows that the households of the majority of the states reported to have more than
98 percent functional toilet. Only few states like Madhya Pradesh (97.8%), Uttar Pradesh (97.7%), Assam (97.6%),
Punjab & Goa (97.3% each), Tamilnadu (96.9%), Jharkhand (96.4%) and Odisha (96%) have functionality status
below 98 percent.
Almost all the households across the states under ODF category have functional toilet except Jharkhand which
reported to have only 93.9 percent functional toilet. Households of non-ODF villages of Punjab represents 94.1
percent with functional toilet which is lowest in this village category. HH:5 presents the detail.
Functional status of the toilets (%)
98.6 99.7 97.5
Total ODF Non-ODF
Base: All household with toilet (84590)

Interim Report National Annual Rural Sanitation Survey (NARSS), Round-2, 2018-2019
CHAPTER-9: AVAILABILITY AND STATUS OF TOILETS IN HOUSEHOLDS PAGE 73
Proportion of HHs with functional status of toilet by different components (%) Base: All households with toilet access (n=84590)
9.5. AVAILABILITY OF WATER FOR TOILET USAGE Availability of water for toilets usage was observed for the household reported access to a toilet. The response
of the households was recorded by asking whether the toilet had any evidence of water supply, or household
had piped water supply in the toilet, or small water turf/tank next to the toilet, or bucket of water kept next to
the toilet, or presence of well or hand-pump in the house premises, or presence of any other water sources. The
dat shows that in India, almost all rural households across the different village category (99.7% each in ODF and
non-ODF village) had availability of water. Majority of the households had water available within the house
premises which represents 69.1 percent. The main source of water found within the premises of the house in
majority of the households across both the village category. However, the household belonging to the ODF village
represents 72.2 percent have water available within the premises of the house while Non-ODF household
represents 66 percent with water available with the premises. (HH:6 presents the detail).
Yes, 0.6
Yes, 0.1
Yes, 1
No, 99.4
No, 99.9
No, 99
Pan is completely choked
Total ODF Non-ODF
Yes, 0.3
Yes, 0.1
Yes, 0.5
No, 99.7
No, 99.9
No, 99.5
Pan is completely broken
Total ODF Non-ODF
Yes, 0.3
Yes, 0
Yes, 0.7
No, 99.7
No, 100
No, 99.3
Pipes are broken or open
Total ODF Non-ODF
Yes, 99.6
Yes, 99.9
Yes, 99.3No, 0.4
No, 0.1
No, 0.7
Pits/ tanks are completely covered
Total ODF Non-ODF

Interim Report National Annual Rural Sanitation Survey (NARSS), Round-2, 2018-2019
CHAPTER-9: AVAILABILITY AND STATUS OF TOILETS IN HOUSEHOLDS PAGE 74
Availability of water source (%)
TECHNOLOGICAL OPTIONS
The survey tried to verify whether safe technology is adopted in the household’s toilets for disposal. The
household toilets were observed to see whether the toilet is connected to a tank/pit or to a sewer system. The
household toilets which were found to be connected to a tank/ pit or to a sewer system at national level
represents 99.6 percent. In ODF household toilet, the percentage is same as in national level. However, the Non-
ODF household toilets represents 99.2 percent, connected to a tank/ pit or to a sewer system.
Percent distribution of household toilets connected to a tank/ pit or to a sewer system (%)
69.1 72.266.0
30.6 27.533.7
0.3 0.3 0.3
Total ODF Non-ODF
Yes –within the house/ premises Yes – from outside premises No- Water is not available for toilet usage
Base: All household with toilet (84590)
99.6
99.9
99.2
80.0 85.0 90.0 95.0 100.0
Total
ODF
NON ODF
No YesBase: All households with toilet (84590)

Interim Report National Annual Rural Sanitation Survey (NARSS), Round-2, 2018-2019
CHAPTER-9: AVAILABILITY AND STATUS OF TOILETS IN HOUSEHOLDS PAGE 75
9.5.1. Safe Disposal of Human Excreta
Almost all the households across both the village category, practiced safe disposal of excreta. All household
(100%) in ODF villages were reported to have practiced safe disposal which safe disposal practice in Non-ODF
household represents 99.1 percent.
There are only few states at an overall level which were reported to have safe disposal practice in less than 99
percent households. These states are Madhya Pradesh (98.9%), Jharkhand (98.5%), Meghalaya (98%) and Assam
(97.6%). All households in ODF villages were universally found to have practiced safe disposal of excreta except
the states like Andhra Pradesh & Madhya Pradesh (99.9% each) and Assam (99.8%). The percent distribution of
the households belonging to the Non-ODF villages of the states which shows safe disposal in less than 98 percent,
are West Bengal (97.6%), Assam (97%) and Meghalaya (96.1%). The different mechanisms of safe disposal
practices were described in the following figure. (Refer HH:9 in annexure table).
Household with safe disposal practices (%)
9.5.2. Hygienic situation of toilets
The survey also tried to look at the hygienic condition of the toilets across the rural households of different village
categories. Toilets were considered in hygienic condition based on set of criteria. The criteria were i) whether
the toilet was connected to a tank/pit or to a sewer system, ii) availability of fly proof seal (Water
trap/lid/other) in the toilet and iii) presence of no visible human excreta in the squatting area.
Based on the above criteria, the households which have toilets in hygienic condition at the national level
represents 95 percent. Hygienic condition of the toilet constitutes 99.5 percent of the ODF households while
3.31.4
5.1
34.1
44.3
23.9
19.5 19.8 19.2
29.1
17.2
41.1
0.5 0.6 0.4
13.1
16.7
9.4
Total ODF Non-ODF
Septic tank without soak pit Septic tank with a soak Pit Single leach pit toiletDouble leach pit toilet A closed drain with Sewer system Closed Pit
Base: All household with toilet (84590)
Safe disposal
Include septic tank with soak pit, single leach pit, double leach pit, closed drain with sewer system and
closed pit.
Sample: All household with toilet (84590)

Interim Report National Annual Rural Sanitation Survey (NARSS), Round-2, 2018-2019
CHAPTER-9: AVAILABILITY AND STATUS OF TOILETS IN HOUSEHOLDS PAGE 76
90.5 percent in Non-ODF households. At an overall level, states of Kerala, Gujarat and Haryana universally
reported to have hygienic household toilet while the states which have hygienic toilet in less than 90 percent
households are Goa (85.9%), Odisha (85.5%) and Jharkhand (84.4%). In ODF households, the state which
reported lowest percentage of hygienic toilet, is Jharkhand which account to be 94.1 percent. In Non-ODF village
category, the states which shows the hygienic toilet in less than 90 percent households, are Uttar Pradesh
(89.9%), Goa (85.9%), West Bengal (85.2%), Odisha (83.1%), Maharashtra (82.4%), Karnataka (82.1%) and
Jharkhand (80.5%). (Refer HH:8 of annexure table)
Distribution of household with hygienic toilet (%)
9.5.3. Disposal of Children excreta by the household with children < 3 years
Among the surveyed households (N=92411), 15.14% of the households having children aged less than 3 years
(n=13988) were asked about the disposal method for the faeces of the child. Based on the open-ended response
it was categorized whether the methods were safe way of disposing the faeces or unsafe method. The
respondents whose response recorded that, i) they put the faeces into the toilet or ii) buried it in the ground,
were considered as safe method of disposing the child’s excreta.
At the national level, almost all the household of ODF villages (95.4%) with children in the age-group of less than
3 years, disposed of the child excreta through safe method. The household of Non-ODF village represents only
59.9% which claims to have disposed of the child faces through safe methods.
State-wise analysis shows that the household of ODF villages where safe disposal of child excreta was reported
below 90 percent, were found in the states like Tamilnadu (86.8%), Assam (80.8%), Jharkhand (79.2%) and Bihar
(58%).
The states wherein less than 50 percent of Non-ODF households were practicing safe disposal of child faeces are,
Karnataka (45.6%), Jharkhand (44.2%), Bihar (41.4%), West Bengal (37.6%) and Odisha (27.1%).
95.0 99.590.5
5.0 0.59.5
Total ODF Non-ODF
Hygienic Un-Hygienic
Base: All household with toilet (84590)
Safe disposal of child faeces
Include Put into the toilet & Buried in the ground
Sample: All household with children aged less than 3 years (13988)

Interim Report National Annual Rural Sanitation Survey (NARSS), Round-2, 2018-2019
CHAPTER-9: AVAILABILITY AND STATUS OF TOILETS IN HOUSEHOLDS PAGE 77
Data analysis through different mechanism of disposing of the child faeces shows that the household of both the
category of village (ODF & Non-ODF villages) rely on disposal method by putting the faeces into the toilet which
represents 81.1 percent and 49.3 percent respectively. Overall, the household practicing the safe disposal
through putting into toilet represents 63.1 percent followed by buried in the ground which constitutes 12.3
percent. The other mechanisms have been showcased in the following figure. (Refer HH:10 of annexure table).
Methods followed to dispose child’s excreta (%)
9.6. USAGE OF TOILETS Using toilet always Besides the accessibility to the toilet facilities, some usage characteristics of the household members were
explored through the set of questions to explore whether the family members used toilet always or there is an
irregularity in usage. The household members who gave response that they use toilet always, were further
probed to understand the extent of use of household toilet. And the question posed was, whether they used
toilet mostly, rarely or never in the last 15 days.
The age group-wise toilet use has been presented in the following figure which exhibits that the individual in
age- group of 55- 64 years always used the household toilet represents 98.6 percent followed by the individual
in age group of 65 or more which constitutes 98.3 percent.
Individual in the age-group of 45-54 years associated with the ODF household and using the toilet always
reported to be 99.9 percent which is highest across the different age-group. The individual in the age-group of
55- 64 years who belongs to the Non-ODF household and using the toilet always constitutes 97.4 percent across
the different age-group. (Refer table:11).
Put into Toilet63%
Buried in the ground12%
Thrown in open area10%
Thrown into garbage14%
DKCS1%
Put into Toilet Buried in the ground Thrown in open area Thrown into garbage DKCS
Base : All households with children aged <3years- 13988

Interim Report National Annual Rural Sanitation Survey (NARSS), Round-2, 2018-2019
CHAPTER-9: AVAILABILITY AND STATUS OF TOILETS IN HOUSEHOLDS PAGE 78
Pattern of use of toilet (Always) by age groups of household members (%)
Using toilet always & often At the national level, the individuals were asked about the usage pattern of household toilet by providing some
more liberty if the individual using the toilet always. The respondent if answered that they did not always use
toilet, another follow-up question was asked if they use toilet often, rarely and never in last 15 days. The pattern
of usage of toilet by the individual who either responded always using toilet or they responded that not using
toilet always by often using it, put together and analysed. The data shows that majority of the individual falling
under the age-group of 55- 64 years who either always or often use the household toilet represent 98.8 percent
which is followed by 45-54 years of individual who constitutes 98.6 percent. The member of the household in
the age-group of 45-54 years and 55-64 years reported to be 99.9 percent each. In Non-ODF household, the
individual in the age-group of 55-64 years reported to be 97.7 percent who use household toilet always and
often. (Refer table:11)
Pattern of use of toilet (Always & often) by age groups of household members (%)
92.8 93.4 93.6 94.3 95.5 97.4 98.0 98.5 98.6 98.3
3 to 5 6 to 9 10 to 13 14 to 17 18 to 24 25 to 34 35 to 44 45 to 54 55 to 64 ≥ 65
Age groups (in years)
Base : All household members using toilet always (337387)
93.3 93.7 93.8 94.6 95.7 97.6 98.1 98.6 98.8 98.4
3 to 5 6 to 9 10 to 13 14 to 17 18 to 24 25 to 34 35 to 44 45 to 54 55 to 64 ≥ 65
Age groups (in years)
Base : All household members using toilet always & often (338066)

Interim Report National Annual Rural Sanitation Survey (NARSS), Round-2, 2018-2019
CHAPTER-9: AVAILABILITY AND STATUS OF TOILETS IN HOUSEHOLDS PAGE 79
Usage pattern of toilet by age-group of member of the household (%)
Usage pattern of toilet by age- group of members of the household
Particulars Always and Often Always
338066 337387
Age Total Yes (%) Total Yes (%)
3 to 5 years 15268 93.3 15195 92.8
6 to 9 years 21692 93.7 21614 93.4
10 to 13 years 24966 93.8 24888 93.6
14 to 17 years 26033 94.6 25961 94.3
18 to 24 years 47904 95.7 47794 95.5
25 to 34 years 59132 97.6 59037 97.4
35 to 44 years 51918 98.1 51856 98.0
45 to 54 years 39867 98.6 39827 98.5
55 to 64 years 29506 98.8 29467 98.6
65+ years 21779 98.4 21748 98.3
Total 338066 96.7 337387 96.5
Background characteristics of those who reported using toilet always and often (%)
Usage pattern of toilet by gender & socio-economic category of members of the household
Particulars
Always and Often Always
338066 337387
Total Yes (%) Total Yes (%)
Male 176196 96.6 175844 96.4
Female 161870 96.8 161543 96.6
Total 338066 96.7 337387 96.5
Social Category
Other Backward Caste 142704 96.1 142390 95.9
Scheduled Caste 38692 96.9 38620 96.7
Scheduled Tribe 43611 96.9 43516 96.7
General Caste 103655 97.4 103478 97.2
Don’t Know/Can’t Say 9405 96.7 9384 96.5
Total 338066 96.7 337387 96.5
Economic Category
APL 119159 97.4 118959 97.2
BPL 196752 96.4 196319 96.1
Don’t Know 22155 96.1 22109 95.9
Total 338066 96.7 337387 96.5
The prevalence of usage of the household toilet was analyzed based on the gender of the individual. The data
shows that 96.6 percent females used toilet always which is slightly higher than the male members (96.4%).
Those female members who used toilet always and often constitutes 96.8 percent which is again slightly higher
than the male (96.6%).
Socio-economic category wise analysis shows that the prevalence of usage of toilet among the individual
belonging to the general caste has highest percentage (97.2%) followed by scheduled caste and scheduled tribe
with 96.7 percent each at national level. The individuals of general caste have highest percentage (97.4%) who

Interim Report National Annual Rural Sanitation Survey (NARSS), Round-2, 2018-2019
CHAPTER-9: AVAILABILITY AND STATUS OF TOILETS IN HOUSEHOLDS PAGE 80
use the toilet always and often. This is followed by scheduled caste and scheduled tribe with 96.9 percent each
at national level.
The population who are economically well-of have got higher percentage of toilet use always (97.2%). Those
individual with APL category who use the toilet always and often constitutes 97.4 percent. (Refer table:12)
9.7. SOLID AND LIQUID WASTE MANAGEMENT PRACTICES 9.7.1. Disposal of solid waste by the households
In definitional terms, solid and liquid waste management (SLWM) is the collection, transport, processing,
recycling or disposal of waste materials, usually produced by human activity, to reduce their effect on human
health or local aesthetics or amenity3. Solid and Liquid Waste Management (SLWM) is one of the key
components of Swachh Bharat Mission (SBM-G), launched with the objective of bringing improvement in
cleanliness, hygiene and the general quality of life in rural areas. SLWM is the collection, transportation,
processing, recycling, treatment, and disposal of waste material in a scientific manner.4
To investigate the SLWM practices by households, it was observed whether any garbage or litter was piled up or
stagnant water within 10 feet around the premises of the household. The observation was done along with
capturing GPS enabled photographs. To make the process of categorisation unambiguous, following definition
was used to identify the waste. Litter would mean – solid waste (examples of solid waste include wastes from
kitchens, gardens, cattle sheds, agriculture, and materials such as metal, paper, plastic, cloth, and so on). They
are organic and inorganic materials with no remaining economic value to the owner produced by homes. It will
not include properly stored garbage in covered bins for disposal, properly collected cattle dung within the
premises of the house for agricultural and other uses.
The households across the village category were asked about the visibility of the garbage or litter within the
premises of the house. The national level data shows that 97.5 percent households did not report to have visible
garbage or litter within the premises which is 98.6 percent in ODF village while 96.5 percent in Non-ODF village.
(Refer HH:11 of annexure table)
The surveyed household were also enquired about the process they followed to dispose of the solid waste. The
responses were categorized as i) Indiscriminate (absence of formal arrangement) ii) Safely disposed within the
household iii) Disposed Outside to common system.
At national level, more than half of the households (53.3%) reported to have disposed of the waste outside to
common system and 42.5 percent reported that the waste was safely disposed within the household and around
3 http://www.mdws.gov.in/sites/default/files/SLWM_2.pdf
4 http://vikaspedia.in/energy/environment/waste-management/solid-and-liquid-waste-management-in-rural-
areas
Safe disposal of Solid waste
Include Safely disposed within the household & disposed outside to the common system
Sample: All household (92411)

Interim Report National Annual Rural Sanitation Survey (NARSS), Round-2, 2018-2019
CHAPTER-9: AVAILABILITY AND STATUS OF TOILETS IN HOUSEHOLDS PAGE 81
4.2 percent reported that disposal as Indiscriminate (there is no formal arrangement). The household of the ODF
villages majorly rely on one of the safe methods of solid waste disposal which is outside to the common system.
This method represents 49.7 percent while another method of safe disposal (Safely disposed within the
household) of solid waste which is the second most common method constitutes 45.4 percent.
Both method of solid waste disposal by ODF households shares almost 50 percent of the total household
practicing these methods. In Non-ODF households, the majority of the households rely on disposal practice by
dispose outside to the common system. (Refer HH:12 of annexure table)
By making the classification of safe and unsafe method of solid waste, the different safe methods were put
together to understand the safe method practice in better way. Thus, the total number of households at national
level which adopted the safe practice represents 95.8 percent. It is to be noted that comparatively higher number
of households (96.4 percent) of Non-ODF villages practiced safe disposal of solid waste than ODF households
(95.1 percent). (Refer HH:13 of annexure table)
Household with visibility of garbage or litter within the premise of the house (%)
Methods of solid waste disposal in the households (%)
97.5 98.696.5
Total ODF Non-ODF
Base: All households (92411)
Indiscriminate4%
Safely disposed within the household
43%Disposed Outside to
common system53%
Indiscriminate Safely disposed within the household Disposed Outside to common system
Base : All households (92411)

Interim Report National Annual Rural Sanitation Survey (NARSS), Round-2, 2018-2019
CHAPTER-9: AVAILABILITY AND STATUS OF TOILETS IN HOUSEHOLDS PAGE 82
Safe method of solid waste disposal by the household (%)
9.7.2. Disposal of waste water from households
To understand the disposal pattern of the waste water in the households, the premise of the household was
observed against presence of stagnant water. Apart from observing the stagnant water, the disposal methods
were also asked. The various methods of disposal of liquid waste were classified as i) Indiscriminate ii) Flows in
common system iii) Kitchen garden and iv) Soak Pit.
During survey, the household respondents were first asked if there is any visible stagnant water within the
premises of the house. The data analysis shows that in overall, 96.3 percent household did not report any visible
stagnant water within the premises of the house. The household of the ODF village reported to be 96 percent
while Non-ODF household accounted to be 96.5 percent. (Refer HH:14 of annexure table)
The households were further probed about the different method of disposing of the waste water which they
practice. To which, the majority of the household (60.1%) responded to have practiced one of the safe methods
of disposal of waste water at national level. The same method of disposal of waste water gives highest
representation across ODF and Non-ODF household also, however, the proportion of this method is slightly
higher (63.2%) in Non-ODF.
State-wise analysis shows that the method of disposal of waste water through flows into a common system
majorly used in Haryana (99.3%) and Punjab (96.6%) which is more than 90 percent at national level. The
household of all other states which practices the same method represents less than 90 percent. The states of
Meghalaya and Nagaland primarily practiced the disposal of waste water in Kitchen garden which are accounts
to be 86.2 percent 71.2 percent respectively. Meghalaya is the only state herein the households practiced the
disposal through Kitchen garden across ODF and Non-ODF village which accounts to be 80.6 percent and 91.8
percent respectively. (Refer HH:15 of annexure table)
In India, there are few states wherein the households of the ODF villages have comparatively lowest percentage
in safe disposal of liquid waste. These states are Chhattisgarh (85.9%) followed by Madhya Pradesh (85.3%),
Karnataka (75.7%) and ANI (74.8%). Other states represent more than 90 percent. The states wherein the
95.8 95.1 96.4
Total ODF Non-ODF
Total ODF Non-ODFBase: All household (92411)
Safe disposal of liquid waste
Include flows into a common system, kitchen garden & soak pit
Sample: All household (92411)
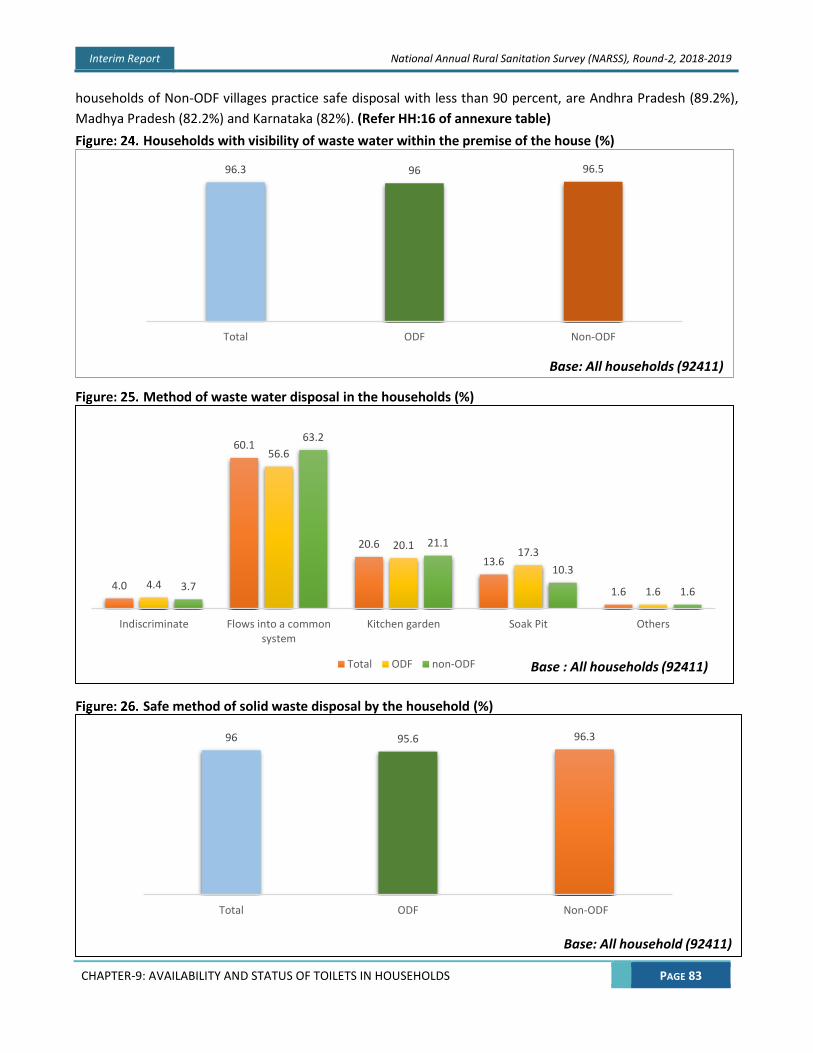
Interim Report National Annual Rural Sanitation Survey (NARSS), Round-2, 2018-2019
CHAPTER-9: AVAILABILITY AND STATUS OF TOILETS IN HOUSEHOLDS PAGE 83
households of Non-ODF villages practice safe disposal with less than 90 percent, are Andhra Pradesh (89.2%),
Madhya Pradesh (82.2%) and Karnataka (82%). (Refer HH:16 of annexure table)
Households with visibility of waste water within the premise of the house (%)
Method of waste water disposal in the households (%)
Safe method of solid waste disposal by the household (%)
96.3 96 96.5
Total ODF Non-ODF
Base: All households (92411)
4.0
60.1
20.6
13.6
1.64.4
56.6
20.117.3
1.63.7
63.2
21.1
10.3
1.6
Indiscriminate Flows into a commonsystem
Kitchen garden Soak Pit Others
Total ODF non-ODF Base : All households (92411)
96 95.6 96.3
Total ODF Non-ODF
Base: All household (92411)

Interim Report National Annual Rural Sanitation Survey (NARSS), Round-2, 2018-2019
CHAPTER-10: AVAILABILITY AND STATUS OF TOILETS IN THE SCHOOLS PAGE 84
CHAPTER-10: SURVEY FINDINGS OF SCHOOLS
Key Findings
• Distribution of types of school: Among all the schools surveyed, 1.8 percent were boy’s school 1.6 percent were girl’s school and 96.6 percent were co-educational schools. Analysis at educational level shows at an overall level that 45.2 percent were primary, 31.8 percent were Lower secondary, 11.1 percent schools were Secondary, and 11.8 percent were higher secondary.
• Accessibility: Accessibility to toilet was found to be in majority of the schools. 98.9 percent of the schools at an overall level had access to toilet whereas 99.8 percent schools in ODF villages had access to toilet. 98.1 percent Schools in non-ODF villages had access to toilet.
• Functionality: At national level, almost all toilets were found to be functional (98.5%). In ODF villages almost all the school toilets were found to be functional (99.8%). 97.3 percent toilets in schools of Non-ODF villages were found to be functional.
• Toilets for boys and girls: Separate toilets for girls and boys were found to be present at 88.4 percent of the co- educational schools. In the schools of ODF villages this was higher at 91.1 percent whereas in school of non-ODF villages, 86.0 percent of the co-educational schools had separate toilets. In ODF villages 1 functional toilet seat was available for 72 boys. In the non-ODF villages, 1 functional toilet seat was found to be shared by 89 boys. For girl students in schools of ODF villages 1 toilet seat was found for 61 girls whereas one functional toilet seat was available for 64 girls. In the schools of non-ODF villages, one toilet seat was shared by 79 girls whereas among 84 girls one functional toilet seat was available. Usability of the toilet was found to be more in girls’ toilet (97.8%) as compared to boys’ toilet (97.2%) and common toilets (97.6%).
• Hygiene: Almost all the school toilets of the ODF villages were found to be utilizing the technology. At an overall level, 99.1 percent of the schools reported that toilet was connected to tank/ pit or to a sewer system and 98.9 percent toilets had fly proof seal. Hygienic toilets were found at 98 percent of the school at an overall level. In the school of ODF villages, almost all the toilets (99.1%) were found to be hygienic.
• Safe disposal of human excreta: Safe disposal of human excreta was found to be prevalent at 99.2 percent of the schools at national level. In the schools of ODF villages, nearly all the school reported of disposing of the human excreta safely (99.9%). In non-ODF villages, 98.6 percent school reported to have disposed of the human excreta safely.

Interim Report National Annual Rural Sanitation Survey (NARSS), Round-2, 2018-2019
CHAPTER-10: AVAILABILITY AND STATUS OF TOILETS IN THE SCHOOLS PAGE 85
10.1. INTRODUCTION chools are common place for children to interact and learn about hygiene. Availability of toilets in
schools are very important component of school’s infrastructure. Non-availability of toilets in schools
and that children practicing open defecation may lead to many health hazards like diarrhoea besides
resulting in drop-out from school, particularly among girls.
This chapter provides information about the availability of toilets by gender, number of toilet seats available,
number of toilets functional, functionality & hygienic status of the toilet, usage status, access to water and
availability of hand washing facility.
In each sampled village where school was available, the interviewer interviewed the eligible respondent of the
school to collect the data. In case if more than one school was found in the village, the same information fed into
the CAPI which eventually provided random selection of the school wherein the interview took place. Besides,
interviewing the respondent for collecting sanitation related data, some observation-based information was also
collected.
Among the surveyed villages (n=6136), 97.8 percent villages (n=6002) have got schools. Out of the schools found
in the village, 98.9 percent schools (n=5936) have got access to the toilet facilities and that out of the total toilets
having access to the toilet facilities, 1.1 percent (n=66) toilets were found locked during the field survey while
rest of them were reported unlocked. The detailed information only gathered for those school which were found
unlocked (n=5870).
Particulars Total ODF Non-ODF
Total Villages surveyed 6136 2891 3245
Total number of schools found in village 6002 2828 3174
Total number of schools with toilet access 5936 2822 3114
Total number of school unlocked 5870 2816 3054
Total number of school locked 66 6 60
Total Number of Co-ed schools with toilet access 5734 2711 3023
Note: For the analysis of functionality, hygienic status, usage of toilet & evidence of handwashing practices, base (5870- Unlocked toilet) would be applied henceforth. While for separate section component of the toilet, base (5734- Toilet access) would be applied.
10.2. Types and categories of the schools
10.2.1. Categories For detailed discussion on extent of availability and status of the various components of the school toilet
pertaining to sanitation, the schools were further divided into three categories i) Boys schools ii) Girls schools
and iii) Co-educational schools. At the national level, 96.6 percent of schools were found to be co-educational.
In the same category, availability of boy’s school is slightly higher (1.8%) as compared to the girls’ school (1.6%).
Across both village category of the states, the trend of availability of boys’ and girls’ schools is same, however,
the percentage of availability of both boys’ and girls’ schools is slightly higher in schools found in ODF villages. In
ODF villages, the percentage of girls’ school is 1.9 and boys’ school is 2.1. In Non-ODF villages, the boys’ and girls’
schools are accounted to be 1.6 and 1.4 percent respectively.
S

Interim Report National Annual Rural Sanitation Survey (NARSS), Round-2, 2018-2019
CHAPTER-10: AVAILABILITY AND STATUS OF TOILETS IN THE SCHOOLS PAGE 86
Distribution of types of schools (%)
State-wise data analysis shows that in the state of Himachal Pradesh, Manipur, Mizoram, Nagaland, Sikkim,
Tripura, ANI and Dadra & Nagar Haveli, all the schools found across the ODF and Non-ODF villages are co-
educational schools. Haryana (89.2%) and Puducherry (88.5%) are the only states wherein the percentage of co-
educational school is below 90 percent at the national level.
Highest 15 percent of boys’ schools were reported to be in Jammu & Kashmir followed by Maharashtra (7.6%)
and Madhya Pradesh (6.9%) while lowest percentage of boys’ schools (0.3%) was reported to be in Rajasthan
under ODF village category. Under the same village category, highest 10 percent girls’ schools were reported to
be in Jammu & Kashmir, however in J&K, the number of boys’ and girls’ school is very low as compared to other
states. Jammu & Kashmir reported to have lowest percentage of co-ed schools (75%).
Under Non-ODF village category also, the percent distribution of boys’ school in Maharashtra (10.8%) is reported
to be high as seen in ODF village category, followed by Puducherry which represents 7.7 percent. In Rajasthan,
highest 4.3 percent girls’ schools were reported followed by Maharashtra (4.2%). In the same village category of
Maharashtra, lowest percentage of co-ed schools was recorded to be 85 percent. (Refer SCH:1 of annexure
table)
10.2.2. Educational Level
Among all the schools surveyed, 45.2 percent were primary schools, followed by lower secondary schools
(31.8%). Percent distribution of higher secondary and secondary grades is almost similar where higher secondary
grades school represents 11.8 percent and secondary grades school represents 11.1 percent.
96.6
1.6 1.8
Co-educational Girls' School Boys' School
Base : All villages with schools (6002)

Interim Report National Annual Rural Sanitation Survey (NARSS), Round-2, 2018-2019
CHAPTER-10: AVAILABILITY AND STATUS OF TOILETS IN THE SCHOOLS PAGE 87
Education level of schools (%)
In India, across ODF & Non-ODF villages, almost 5 out of 10 schools are primary grade schools, secondary grades
school represents slightly more than one-tenth of total schools, a gap of 10 percent is seen in the availability of
secondary grades schools where secondary grades school represents 26.2 percent in ODF villages while
secondary grades school represents 36.9 percent in Non-ODF villages. Contrary to this, higher secondary grades
school represents 17.1 percent in ODF villages while the same grade represents only 7.1 percent in Non-ODF
villages.
Slightly more than 7 out of 10 schools are primary grades school in the state of Manipur (72%) and West Bengal
(71.8%) under ODF village category. Almost all schools represent primary grade in Meghalaya which accounts to
be 95.5 percent under Non-ODF village category. Almost 7 out of 10 schools are secondary grade school in
Jharkhand (66.7%) under ODF while 6 schools out of 10 schools in Bihar (56.9%) are secondary grades school
under Non-ODF category. Half of the total school in Sikkim (50%) are secondary grade under ODF category
whereas slightly higher percentage of secondary grades (53.8%) were reported in Goa under Non-ODF village
category. Across both village category, more than half of the total higher secondary schools were reported in
Rajasthan where under ODF, higher secondary grades represent 55.2 percent while the same grade represents
54.3 percent under Non-ODF. (Refer SCH:1 of annexure table) for additional information.
45.2
31.8
11.1 11.8
46.1
26.2
10.6
17.1
44.4
36.9
11.67.1
Primary Lower Secondary Secondary Higher Secondary
Total ODF Non ODFBase : All villages with school-6002

Interim Report National Annual Rural Sanitation Survey (NARSS), Round-2, 2018-2019
CHAPTER-10: AVAILABILITY AND STATUS OF TOILETS IN THE SCHOOLS PAGE 88
Percentage of schools with accessibility to toilet by state/ UT (%)
10.3. Accessibility of the toilets in the schools In India, almost all schools in ODF villages have access to the toilet facility which represents (99.8%) while in Non-
ODF village category, 98.1 percent of schools have access to the toilet facility.
State level data analysis reveals that across ODF village category, there are only few states where the percent
distribution of accessibility is lower than 100 percent. These states are Maharashtra (99.7%), Chhattisgarh
(99.5%), Madhya Pradesh (99%), Punjab (98.3%), Jharkhand (97.2%) and Bihar (96.8%). Bihar is the only state
where the percentage of accessibility is lowest among other states.
In Non-ODF village category also, few states were reported to have less than 100 percent accessibility. These
states are West Bengal (97.9%), Odisha (97.6%), Karnataka (96.8%), Bihar (96%), Madhya Pradesh (95.5%),
Telangana (92.7%) and Andhra Pradesh (88.6%). Andhra Pradesh reported to have lowest accessibility
percentage among other states. (Refer SCH:2 of annexure table)
School with toilet access (%)
98.9
99.8
98.1
Non-ODF ODF India Base : All villages with schools - 6002
Base: All villages with schools (6002)

Interim Report National Annual Rural Sanitation Survey (NARSS), Round-2, 2018-2019
CHAPTER-10: AVAILABILITY AND STATUS OF TOILETS IN THE SCHOOLS PAGE 89
10.4. Separate toilets for boys and girls
The survey collected data on separate toilet arrangement in co-ed schools (n=5734). More than 9 out of 10 co-
ed schools under ODF village category and almost 9 schools out of 10 in Non-ODF village category have separate
toilets for boys and girls. Overall, 88.4 percent of co-ed schools in India have separate toilet for boys and girls.
Separate toilets for boys and girls (%)
In India, all co-ed schools with toilet of Haryana, Himachal Pradesh, ANI and Dadra & Nagar Haveli, have separate
toilets for boys and girls under ODF village category. In the same village category, J&K reported to have lowest
separate section in co-ed schools which accounts to be 60 percent. The states where separate sections of toilet
arrangement are reported higher than 90 percent, are Rajasthan (97.8%), Goa & Tamilnadu (96% each),
Puducherry (95.7%), Karnataka (94.3%), Uttar Pradesh (94.2%), Mizoram (92.3%) and Maharashtra (90.2%).
Under Non-ODF village category. Lowest percentage of separate section is reported in Meghalaya (50%). (SCH:4)
10.5. Adequacy of toilets
Adequacy of toilet facilities was calculated based on the total toilet seats available against total boys and girls
studying in the school.
In the schools of the ODF villages, one toilet seat was available for 67 boys. One functional toilet seat was
reported to be found for 72 boys. In the same village category, one toilet seat was available for 61 girls while one
functional toilet seat was available for 64 girls. In the non-ODF villages, a greater number of boys had to share a
single toilet seat (82 boys per toilet seat and 89 boys per functional toilet seat). In the schools of same village
category, one toilet seat was shared by 79 girls while one functional toilet was shared by 84 girls. The burden of
number of students sharing toilets is high amongst boys where a smaller number of toilet seats are available for
use. Please refer table-13 for detailed information
88.4 91.186
Total ODF Non-ODF
Base: All co-ed schools with toilet access - 5734

Interim Report National Annual Rural Sanitation Survey (NARSS), Round-2, 2018-2019
CHAPTER-10: AVAILABILITY AND STATUS OF TOILETS IN THE SCHOOLS PAGE 90
Availability of School toilets for students in ODF and Non-ODF region
Particulars Number of Students Number of Toilets
Seats
Number of Students for each
toilet seat
Number of Functional Toilet
Seat
Number of Student for each Functional Toilet
Seat
Village type ODF Non-ODF ODF Non-ODF ODF Non-ODF ODF Non-ODF ODF Non-ODF
Boys 295854 315244 4427 3837 66.8 82.2 4132 3546 71.6 88.9
Girls 284469 316201 4669 3991 60.9 79.2 4440 3744 64.1 84.5
Number of students sharing each toilet seat
10.6. Condition of school toilet
Out of the total girls’ toilet (n=93), 97.8 percent were found to be usable for girls and 97.2 percent usable for
boys’ out of total (n=107) boys’ toilet. In common category, 97.7% were in usable condition out of total (n=5670)
common toilet.
Condition of school toilets at national level (%)
Particulars Boy’s Toilet Girl’s Toilet Common Toilet
BASE: All unlocked school toilet (5870) 107 93 5670
% % %
Usable 97.2 97.8 97.6
Functional 99.1 98.9 98.5
Safe disposal 99.1 100 99.2
Hygienic 97.2 100 98
Water Available for hand washing 83.2 81.7 80.8
With their respective base of boys’, girls’ & common toilets, percentage of functionality is higher in boys’ toilet
than girls’ and common toilet category. All girls’ toilet shows safe disposal mechanism. All girls’ toilet reported
to be in hygienic condition. Water availability was comparatively more prevalent in boys’ toilet. Refer table-14
for detailed information
66.8 82.2
60.9
79.2
ODF Non-ODF
Toilet seat student ratio
Boys Girls

Interim Report National Annual Rural Sanitation Survey (NARSS), Round-2, 2018-2019
CHAPTER-10: AVAILABILITY AND STATUS OF TOILETS IN THE SCHOOLS PAGE 91
10.7. Functionality of toilets in the schools
Data collection of functionality focused on observation of different components of toilet seats and its auxiliary
system which make the toilet function properly and also making the structure in a way so that the excreta could
be disposed of safely. The components which were observed are a) Pan is completely broken b) Pan is
completely choked c) Pits/ tanks are completely covered d) Pipes are completely broken or open. Functional
toilets were considered only if the mentioned observed components were properly placed and were in order. In
this section, percentage of functional toilets are presented.
In India, all the surveyed states have functional school toilets under ODF category except few states wherein the
percentage of functional toilets is slightly dipped down. These states are West Bengal (99.7%), Andhra Pradesh
& Karnataka (99.4% each), Punjab (98.2%), Odisha (96.8%) and Bihar (96.7%). Bihar is reported to have lowest
percentage of functionality of toilet (96.7%) under ODF village category.
The states where the school toilets were found available under Non-ODF category, were reported to have
functional toilets universally by observation, however, few states like Telangana (98.9%), Bihar (97.4%), Madhya
Pradesh (97.1%), Goa (95%) and West Bengal (91.1%). Few more states where representation of functionality is
below 90 percent, are Odisha (88.1%), Andhra Pradesh (87.5%) & Karnataka (82.9%). Overall in Odisha, functional
status of the toilet represents 89.1 percent which is lowest among other states. Refer SCH:3 in annexure table
for detailed information
Functional toilet
Considered when pan is not completely broken, pan is not completely choked, pits/ tanks are completely
covered & pipes are not completely broken or open.
Sample: All unlocked school toilet (5870)

Interim Report National Annual Rural Sanitation Survey (NARSS), Round-2, 2018-2019
CHAPTER-10: AVAILABILITY AND STATUS OF TOILETS IN THE SCHOOLS PAGE 92
Functionality status of the toilet by state/ UT (%)
Percentage of schools with functional toilets (Base: 5870)
89.1
94.6
95.0
96.3
97.3
97.4
98.0
98.5
99.1
99.4
100.0
100.0
100.0
100.0
100.0
100.0
100.0
100.0
100.0
100.0
100.0
100.0
100.0
100.0
100.0
100.0
100.0
100.0
100.0
100.0
100.0
100.0
100.0
Odisha
Karnataka
Goa
Andhra Pradesh
West Bengal
Bihar
Madhya Pradesh
Total
Punjab
Telangana
A and N Islands
Arunachal…
Assam
Chhattisgarh
Dadra and…
Gujarat
Haryana
Himachal Pradesh
Jammu and…
Jharkhand
Kerala
Maharashtra
Manipur
Meghalaya
Mizoram
Nagaland
Puducherry
Rajasthan
Sikkim
Tamil Nadu
Tripura
Uttar Pradesh
Uttarakhand

Interim Report National Annual Rural Sanitation Survey (NARSS), Round-2, 2018-2019
CHAPTER-10: AVAILABILITY AND STATUS OF TOILETS IN THE SCHOOLS PAGE 93
Proportion of schools with functional status of toilet by different components (%) Base: All schools with toilet access (n=5870)
10.8. Usage of school toilets The usage of the school toilets was observed by the data during the survey. To quantify the toilet usage, toilets
were observed to see whether they were well-kept, regular in use with water inside or with water available
nearby the toilet.
At overall level, usage of the toilet represents 97.6 percent of total school toilets which is 99.6 percent of the
schools of ODF village category. Ninety-six percent school toilets under Non-ODF village category were reported
to be well kept, regular in use with water inside or with water available nearby the toilet. Usage of toilet in Odisha
represents 80.1 percent which is lowest among other states. State-wise data analysis shows that All school toilets
of ODF villages across all states were reported to be well kept and regular in use with some exception where few
of the states were reported to have decreased percentage of usage of toilet. The states are Chhattisgarh (99.5%),
West Bengal (99.1%), Karnataka (97.6%), Bihar (96.7%), ANI (96.2%) and Odisha (93.5%).
Yes, 0.4
Yes, 0.1
Yes, 0.7
No, 99.6
No, 99.9
No, 99.3
Pan is completely broken
Total ODF Non-ODF
Yes, 0.8
Yes, 0Yes, 1.4
No, 99.2
No, 100
No, 98.6
Pan is completely choked
Total ODF Non-ODF
Yes, 99.2
Yes, 99.8
Yes, 98.6No, 0.8
No, 0.2
No, 1.4
Pits/ tanks are completely covered
Total ODF Non-ODF
Yes, 0.5
Yes, 0Yes, 0.9
No, 99.5
No, 100
No, 99.1
Pipes are broken or open
Total ODF Non-ODF

Interim Report National Annual Rural Sanitation Survey (NARSS), Round-2, 2018-2019
CHAPTER-10: AVAILABILITY AND STATUS OF TOILETS IN THE SCHOOLS PAGE 94
Usage of toilet in schools (%)
In the states of Non-ODF village category where percentage of usage of toilet is below 95 percent, are West
Bengal (86.7%), Andhra Pradesh (85.9%), Odisha (78.3%) and Karnataka (50%). The states where usage of toilet
represents 95 percent or above but below 100 percent, are Bihar (98.4%), Madhya Pradesh (97.6%) and Goa
(95%). Please refer annexure table-SCH:12 for additional information.
10.9. Technology used
Technological options used in the school toilets were measured by observing whether the toilet is connected to
a tank/pit or to a sewer system. The toilets which were found to be open /unlocked were observed for the
presence of technology.
Data shows that majority of the school toilets (99.1%) were found to be connected to a tank/ pit or to a sewer
system while in the schools of ODF villages the percentage is 99.8 percent. In the schools of Non-ODF village
schools, this technology represents 98.6 percent.
At an overall level, few states where technology percentage is lower than 100 percent but above 99 percent, are
West Bengal & Telangana (99.4% each) and Punjab (99.1%). The states where technology option is used in less
than 99 percent schools are, Andhra Pradesh (98.8%), Madhya Pradesh (98%), Bihar (97.4%), Karnataka (96.2%),
Odisha (95.5%) and Goa (95%).
In India, the school toilets under ODF village category, shows the technological option being used universally
except in few states wherein the achievement of having the technology in toilet is lower than 100 percent. These
states are West Bengal (99.1%), Punjab (98.2%), Odisha (96.8%) and Bihar (96.7%). In the schools of Non-ODF
village category also, the technological option is used in majority of the states, however the states where the
percentage is lower, are Telangana (98.9%), Bihar (97.4%), Madhya Pradesh (97.1%), Odisha & Andhra Pradesh
(95.3% each), Goa (95%) and Karnataka (87.1%). Technological option used in Karnataka represents 87.1 percent
which is lowest among other states. Please refer annexure table-SCH:8 for additional information.
97.6 99.6 95.8
Usage of toilet
Total ODF Non-ODF
Base : All unlocked schools toilets - 5870

Interim Report National Annual Rural Sanitation Survey (NARSS), Round-2, 2018-2019
CHAPTER-10: AVAILABILITY AND STATUS OF TOILETS IN THE SCHOOLS PAGE 95
Technological options present in the school toilets (%)
10.10. Hand washing To obtain hand washing information, interviewers observed the places where school children most often washed
their hands. A place for hand washing was observed in 94.5 percent of schools. Soaps and water were observed
in 39.8 percent of the hand washing locations while 41 percent had water only. In schools where hand washing
practices were observed, 5.5 percent neither had soap nor water near the school toilet at an overall level.
Water availability in toilet (%)
The data of hand washing practices also provided the estimation of percentage of school where water was
available near the toilet. The estimation of availability of water was generated basis the responses of the schools,
reported to have i) only water available near the toilet ii) Both water and soap available near the toilet.
In India, more than 8 schools out of 10 had water near the school toilet. In ODF village category, water availability
near the school represents 87.1 percent while in Non-ODF village category, 75 percent of school had water
available near the toilet.
State-wise data analysis reveals that the states under ODF category where the percentage of school with water
is below 80 percent, are Gujarat (78.4%), Punjab (77.2%), ANI (76.9%), Assam (71.8%), Odisha (64.5%) and Dadra
99.1
99.8
98.6
Non-ODF ODF Total
Base : All unlocked school toilets - 5870
Water available
81%
Water not available19%
Base : All unlocked schools toilets- 5870

Interim Report National Annual Rural Sanitation Survey (NARSS), Round-2, 2018-2019
CHAPTER-10: AVAILABILITY AND STATUS OF TOILETS IN THE SCHOOLS PAGE 96
& Nagar Haveli (61.5%). In this village category, Manipur, Nagaland and Sikkim are the only three states where
water is available in all school toilets.
Under Non-ODF village category, the average percentage of school where water is available near toilet is 75
percent. On state level analysis, there are few states wherein availability of water was reported in more than 90
percent of school toilets are, Tamilnadu (92%), Punjab (91.8%) and Meghalaya (90.9%). School toilets with
availability of water in Odisha were reported to be 44.3 percent wherein the percentage is drastically very low
as compared to the other states. Please refer annexure table-SCH:9 & SCH:10 for additional information.
10.11. Hygienic practices observed
During survey, interviewers observed the hygienic status of toilet by looking at few parameters which were
considered to be important to term the toilet as hygienic. These components were i) the toilet was connected
to a tank/pit or to a sewer system ii) availability of fly proof seal (Water trap/lid/other) in the toilet and iii) no
visible human excreta was visible in the squatting area.
Hygienic situation of the toilets (%)
Based on the parameter defined, 98 percent of toilets were observed to be in hygienic condition. By observing
the percentage across the village category, 99.1 percent school toilets were found to be in hygienic condition
under ODF village category while hygienic percentage represented 97.1 percent under Non-ODF village category
at overall level.
State-wise data analysis shows that majority of school toilets found in ODF village category across the states
reported to be in hygienic condition except few states where the percentage of hygienic school toilet is below
100 percent. These states are Punjab (98.2%), Odisha (96.8%), Bihar (96.7%), Karnataka (96.4%) and West Bengal
(95.1%).
Likewise, in the school of Non-ODF village category also, all the toilets were observed to be in hygienic condition
in majority of the states. The state where hygienic toilets represent below 95 percent are, Odisha (90.2%), West
98 99.1 97.1
Total ODF Non-ODF Base : All unlocked school toilets - 5870
Hygienic toilet
Considered when toilet is connected to a tank/ pit or to a sewer system, fly proof seal available & human
excreta is not visible in squatting area.
Sample: All unlocked school toilet (5870)

Interim Report National Annual Rural Sanitation Survey (NARSS), Round-2, 2018-2019
CHAPTER-10: AVAILABILITY AND STATUS OF TOILETS IN THE SCHOOLS PAGE 97
Bengal (85.9%), Andhra Pradesh (84.4%) and Karnataka (77.1%). The states which were below 99 percent in
hygienic toilets are, Telangana (98.9%), Bihar (97.4%), Madhya Pradesh (97.1%) and Goa (95%). Please refer
annexure table-SCH:7 for additional information.
10.12. Disposal of human excreta in school toilets
Disposal methods of human excreta (%)
Disposal mechanism of excreta from the school toilets were observed during the survey. Overall, 99.2 percent of
the schools had safe method of disposing the excreta. The safe methods included disposing in Septic tank without
a soak Pit, Septic tank with a soak Pit, Single leach pit toilet, Double leach pit toilet, A closed drain with Sewer
system and closed Pit.
Overall at national level, the states wherein the safe disposal methods were being practiced in less than 98
percent of school toilets are, Bihar (97.4%), Karnataka (96.2%), Odisha (95.9%) and Goa (95%). In the school of
ODF village category, Punjab (98.2%) and Bihar (96.7%) are the states wherein the percentage of safe disposal
were practiced in less than 100 percent school toilets. Majority of the schools in Non-ODF village category also,
have the toilet universally disposing of the excreta through safe methods, while few states still have the school
toilets reported to have practiced safe disposal in less than 100 percent toilets. These states are, Telangana
(98.9%), Bihar (97.4%), Madhya Pradesh (97.1%), Odisha & Andhra Pradesh (95.3% each), Goa (95%) and
Karnataka (87.1%). Safe disposal method in Karnataka represents 87.1 percent which is lowest among the states
under Non-ODF village category. Please refer annexure table-SCH:11 for additional information.
8.9
39.7
13.0
26.7
1.3
9.7
1.6
52.0
10.9
19.7
1.6
14.115.6
28.4
15.0
33.0
1.0
5.6
Septic tank withoutsoak pit
Septic tank with asoak Pit
Single leach pit toilet Double leach pittoilet
A closed drain withSewer system
Closed Pit
Disposal methods of excreta
Total ODF Non-ODF
Safe disposal
Include septic tank with soak pit, single leach pit, double leach pit, closed drain with sewer system and
closed pit.
Sample: All unlocked school toilets (5870)

Interim Report National Annual Rural Sanitation Survey (NARSS), Round-2, 2018-2019
CHAPTER-10: AVAILABILITY AND STATUS OF TOILETS IN THE SCHOOLS PAGE 98
Condition of the school toilet observed – Functionality, Disposal Method and Hygiene (%).
States Total ODF Non ODF
Total Functional
Toilet Safe
Disposal Hygiene Total
Functional Toilet
Safe Disposal
Hygiene Total Functional
Toilet Safe
Disposal Hygiene
INDIA 5870 98.5 99.2 98.0 2816 99.8 99.9 99.1 3054 97.3 98.6 97.1 A and N Islands 26 100.0 100.0 100.0 26 100.0 100.0 100.0 0 0.0 0.0 0.0 Andhra Pradesh 244 96.3 98.8 95.9 180 99.4 100.0 100.0 64 87.5 95.3 84.4
Arunachal Pradesh 40 100.0 100.0 100.0 20 100.0 100.0 100.0 20 100.0 100.0 100.0 Assam 178 100.0 100.0 100.0 39 100.0 100.0 100.0 139 100.0 100.0 100.0
Bihar 532 97.4 97.4 97.4 30 96.7 96.7 96.7 502 97.4 97.4 97.4 Chhattisgarh 183 100.0 100.0 100.0 183 100.0 100.0 100.0 0 0.0 0.0 0.0 Dadra and Nagar Haveli 26 100.0 100.0 100.0 26 100.0 100.0 100.0 0 0.0 0.0 0.0
Goa 20 95.0 95.0 95.0 0 0.0 0.0 0.0 20 95.0 95.0 95.0 Gujarat 194 100.0 100.0 100.0 194 100.0 100.0 100.0 0 0.0 0.0 0.0
Haryana 102 100.0 100.0 100.0 102 100.0 100.0 100.0 0 0.0 0.0 0.0 Himachal Pradesh 42 100.0 100.0 100.0 42 100.0 100.0 100.0 0 0.0 0.0 0.0
Jammu and Kashmir 72 100.0 100.0 100.0 20 100.0 100.0 100.0 52 100.0 100.0 100.0 Jharkhand 141 100.0 100.0 100.0 35 100.0 100.0 100.0 106 100.0 100.0 100.0
Karnataka 239 94.6 96.2 90.8 169 99.4 100.0 96.4 70 82.9 87.1 77.1 Kerala 178 100.0 100.0 100.0 178 100.0 100.0 100.0 0 0.0 0.0 0.0
Madhya Pradesh 306 98.0 98.0 98.0 101 100.0 100.0 100.0 205 97.1 97.1 97.1 Maharashtra 420 100.0 100.0 100.0 300 100.0 100.0 100.0 120 100.0 100.0 100.0
Manipur 51 100.0 100.0 100.0 25 100.0 100.0 100.0 26 100.0 100.0 100.0 Meghalaya 46 100.0 100.0 100.0 24 100.0 100.0 100.0 22 100.0 100.0 100.0 Mizoram 52 100.0 100.0 100.0 26 100.0 100.0 100.0 26 100.0 100.0 100.0
Nagaland 52 100.0 100.0 100.0 26 100.0 100.0 100.0 26 100.0 100.0 100.0 Odisha 266 89.1 95.9 91.0 31 96.8 100.0 96.8 235 88.1 95.3 90.2
Puducherry 26 100.0 100.0 100.0 0 0.0 0.0 0.0 26 100.0 100.0 100.0 Punjab 106 99.1 99.1 99.1 57 98.2 98.2 98.2 49 100.0 100.0 100.0
Rajasthan 393 100.0 100.0 100.0 299 100.0 100.0 100.0 94 100.0 100.0 100.0 Sikkim 26 100.0 100.0 100.0 26 100.0 100.0 100.0 0 0.0 0.0 0.0
Tamil Nadu 299 100.0 100.0 100.0 50 100.0 100.0 100.0 249 100.0 100.0 100.0 Telangana 157 99.4 99.4 99.4 68 100.0 100.0 100.0 89 98.9 98.9 98.9
Tripura 26 100.0 100.0 100.0 0 0.0 0.0 0.0 26 100.0 100.0 100.0 Uttar Pradesh 885 100.0 100.0 100.0 132 100.0 100.0 100.0 753 100.0 100.0 100.0
Uttarakhand 57 100.0 100.0 100.0 57 100.0 100.0 100.0 0 0.0 0.0 0.0 West Bengal 485 97.3 100.0 92.6 350 99.7 100.0 95.1 135 91.1 100.0 85.9
All unlocked school toilets

Interim Report National Annual Rural Sanitation Survey (NARSS), Round-2, 2018-2019
CHAPTER-11: AVAILABILITY AND STATUS OF TOILETS OF AWC PAGE 99
CHAPTER-11: SURVEY FINDINGS OF ANGANWADI CENTRES
Key Findings
• Accessibility: Overall, 90.4 percent of Anganwadi centres had access to the toilet. Accessibility was higher (98.1%) in ODF villages than in Non-ODF villages (83.7%). One- third AWCs reported that the children go for open defecation (34.7%).
• Functionality: About 97.7 percent of toilets were functional. Functionality of toilet under ODF village category represents 99.8 percent.
• Hygiene: Overall, hygienic condition of the toilet was reported to be 95.9 percent. This represented 99.1 percent and 92.1 percent in ODF & Non-ODF AWCs toilet respectively.
• Usage status: At national level, 92.8 percent of the toilet in Anganwadi centres were observed to be in regular use and well kept. Data showed that 98.9 percent of toilets in ODF villages and 85.6 percent of toilets in Non-ODF villages were observed to be in good usage condition.
• Safe disposal of human excreta: At national level, 98.6 percent of Anganwadi centres were practicing safe disposal of human excreta. In ODF villages, 99.9 percent safe disposal of excreta was being practiced by AWCs while in non-ODF villages, the proportion was accounted to be 97.1 percent.
• Hand washing Practices: 92.6 percent of Anganwadi centres were observed to have the evidence of hand washing practices while 7.4 percent of the Anganwadi centres had neither soap not water being available near the toilet at an overall level.

Interim Report National Annual Rural Sanitation Survey (NARSS), Round-2, 2018-2019
CHAPTER-11: AVAILABILITY AND STATUS OF TOILETS OF AWC PAGE 100
11.1. INTRODUCTION nganwadi centers (AWCs) were opened to execute the Integrated Child Development Scheme (ICDS)
activities for children aged below 6 years. Pre-school education and mid-day meal are two major activities
apart from other health activities under the scheme. Infrastructural development of AWCs includes provision of
toilets for children at the centers.
This chapter provides the information about the availability, accessibility and functionality of toilets, hygiene and
sanitation practices followed in AWCs. Among the total surveyed villages (n=6136), 99.1% of the villages (n=6082)
were found to have AWCs. Of the total 6082 AWCs, 5550 AWCs were reported to have access to the toilet
facilities. Out of 4548 AWCs with toilet access, total 4482 were found unlocked and the survey happened in these
AWCs for data collection.
Particulars Total ODF Non-ODF
Total Villages surveyed 6136 2891 3245
Total number of AWCs found in village 6082 2867 3215
Total number of AWCs with toilet access* 4548 2433 2115
Total number of AWCs with toilet access including Q10** 5550 2835 2715
Total number of AWCs unlocked# 4482 2429 2053
Total number of AWCs locked 66 4 62
** Includes the AWC with toilet facilities & if AWC does not have toilet access and the children go to household toilet, school toilet or community toilet for defecation. All these cases will be considered as AWC with toilet access. This number will be used for calculating accessibility only. Q10 refers to the children visit to the places for defecation if AWC does not have access to toilet. * Other calculation will be based on this number only. # The entire analysis will be based on the sample of AWCs (n=4482) with unlocked toilet unless otherwise specified.
11.2. OWNERSHIP STATUS
Of the total AWCs (N=6082), the ownership status of AWC was checked by asking whether the AWC was running
in its own building or was running in a private building or house. The survey data revealed that at national level,
about three-fourth (70.5%) of the Anganwadi Centers were running in their own building. This percentage was
comparatively higher in the ODF villages (76.1%) than in non-ODF villages (65.4%). In Mizoram & Tripura, all
AWCs are running in their own building. The states wherein ownership represents more than 90 percent but less
than 100 percent are, Gujarat (98.5%), Nagaland (98.1%), Tamilnadu (96.7%), Karnataka (92.5%), Chhattisgarh &
Sikkim (92.3% each), Maharashtra (91.4%) and Kerala (91%). Ownership status with the center running in own
building represents 10.3 percent in Jammu & Kashmir which is lowest among other states at an overall level.
In ODF village category, there are few states where majority of AWCs are running in private building or house.
These states are J&K (84%), Himachal Pradesh (72.2%), Manipur (72%), Uttarakhand (67.2%), Punjab (66.7%) and
Bihar (61.3%). Please refer annexure table-AWC:1 for additional information.
A

Interim Report National Annual Rural Sanitation Survey (NARSS), Round-2, 2018-2019
CHAPTER-11: AVAILABILITY AND STATUS OF TOILETS OF AWC PAGE 101
Distribution of ownership status of Anganwadi Centres’ buildings (%)
11.3. ACCESSIBILITY TO THE TOILETS At national level,91.3 percent of Anganwadi Centers had access to toilet facility which was either in their own
premises or functioning in private buildings. Substantially higher number (98.9%) of Anganwadi Centers in ODF
villages had access to toilet while in non-ODF villages only 84.4 percent had the access to toilets.
In India, accessibility of AWCs under ODF village category represents more than 90 percent except Bihar wherein
accessibility accounts to be 74.2 percent. In the same village category, West Bengal (99.7%), Maharashtra (99.3%)
were reported with toilet accessibility between 99 to 100 percent.
Percentage of AWC with toilet access by state/ UT (%)
70.5
29.5
76.1
23.9
65.4
34.6
Own building Private building/house
Total ODF NON- ODF Base: All villages with AWCs - 6082
Base: All villages with AWC (6082)

Interim Report National Annual Rural Sanitation Survey (NARSS), Round-2, 2018-2019
CHAPTER-11: AVAILABILITY AND STATUS OF TOILETS OF AWC PAGE 102
The states under Non-ODF village category wherein the accessibility in AWCs are reported less than 80 percent
are, Odisha (79.9%), Jharkhand (71.1%), Karnataka (69.1%), Andhra Pradesh (65.2%), Bihar (63.8%) and
Telangana (53.6%). Rest of the states represents above 80 percent or more AWCs with accessibility. Please refer
annexure table-AWC:2 for additional information.
Accessibility of AWC in the surveyed villages (%)
The NARSS survey explored the places where the children can go for defecation in case the Anganwadi Centers
did not have access to the toilet. The survey findings indicated that at the national level, 25.2 percent of those
AWCs which do not have access to the toilet (n=1534), reported that children preferred to use either own house
toilet or nearby public toilets or school toilets in case of non-availability of toilets in Anganwadi Centers. The
children of About one-third of AWCs (34.7%) go for open defecation.
Under ODF village category, the children of 7.4 percent of the AWCs reported to go for open defecation while in
non-ODF villages, 45.5 percent of the AWCs were reported open defecation practices. Majority of the Anganwadi
Centers in ODF villages were reported to be “using own house toilets” (57.1%) followed by “school toilet” (30.9%)
and “nearby public toilet” (4.6%).
In non-ODF villages, 44.8 percent of the surveyed Anganwadi Centers reported to be relied on “Own house”
(35.9%), “School Toilet” (17.5%) or “Nearby Public Toilet” (1.2%) for the defecation.
Across all the states, the survey revealed that open defecation practices adopted by the children were very high
in Non-ODF villages (45.5%) as compared to the ODF villages (7.4%). Please refer annexure table-AWC:6 for
additional information.
Status of toilet access if no toilet access available in AWC (%)
91.398.9
84.4
Total ODF Non-ODF
Base: All villages with AWCs (6082)
2
21
4235
5
31
57
71
18
36
46
Nearby Public Toilet School Toilet Own House Open
Total ODF Non ODF
All villages with AWCs with no toilet access- 1534

Interim Report National Annual Rural Sanitation Survey (NARSS), Round-2, 2018-2019
CHAPTER-11: AVAILABILITY AND STATUS OF TOILETS OF AWC PAGE 103
Percentage of AWC with access to toilet by ownership status (%)
The percentage of toilet accessibility was higher in AWC running in own building than in private building. Overall,
80.4 percent AWC reported access which were running in own building while the percentage of AWC which were
running in private building was 61.3 percent.
In ODF village category, toilet accessibility was substantially higher than NON-ODF category, however, the AWC
which were running own building reported to have higher percentage of accessibility. (Refer AWC:3 in annexure
table)
11.4. FUNCTIONALITY OF THE TOILET
Functionality of Anganwadi toilet (%)
80.4
61.3
87.5
76.573.1
51.9
Own building Private building
Total ODF Non-ODFBase: All villages with AWCs- 6082
97.7 99.895.3
India ODF Non-ODF Base : All unlocked AWC toilet - 4482
Functional toilet
Considered when pan is not completely broken, pan is not completely choked, pits/ tanks are completely
covered & pipes are not completely broken or open.
Sample: All unlocked AWC toilet (4482)

Interim Report National Annual Rural Sanitation Survey (NARSS), Round-2, 2018-2019
CHAPTER-11: AVAILABILITY AND STATUS OF TOILETS OF AWC PAGE 104
Proportion of AWC with functional status by different components (%) Base: All AWCs with toilet access (n=4482)
The survey collected the detailed information with regards to the functionality of AWC toilet in sampled ODF and
Non-ODF villages. The finding revealed that overall 97.7 percent of the Anganwadi Centers have got functional
toilets. Result by ODF and non-ODF villages categories shows that proportion of functional toilets in Anganwadi
Centers of ODF villages was 99.8 percent while in Non- ODF villages this proportion was 95.3 percent. State-wise
analysis AWC of ODF villages suggested that almost all AWCs across states have functional toilets. Few States in
the same village category revealed the percentage of functionality to be below 100 percent. These states are,
West Bengal & Andhra Pradesh (99.3% each), Karnataka (99.2%), Punjab (97.7%) and Odisha (96.2%). The
functionality percentage in the state of Odisha represents the lowest proportion among other states.
The AWC surveyed under Non-ODF village category, reported to have overall 95.3 percent functional toilet. State-
wise analysis revealed that the states wherein the percentage of functional toilet of AWCs are below 95 percent,
are Jharkhand (94.7%), Maharashtra (94.1%), Andhra Pradesh (92.9%), Madhya Pradesh (92.3%), West Bengal
(87.2%), Odisha (74.6%) and Karnataka (70.4%). The percentage of functionality which lies between 98 to 100
Yes, 0.7
Yes, 0Yes, 1.5
No, 99.3
No, 100
No, 98.5
Pan is completely broken
Total ODF Non-ODF
Yes, 1.2
Yes, 0Yes, 2.6
No, 98.8
No, 100
No, 97.4
Pan is completely choked
Total ODF Non-ODF
Yes, 98.5
Yes, 99.8
Yes, 97.1No, 1.5
No, 0.2No, 2.9
Pits/ tanks are completely covered
Total ODF Non-ODF
Yes, 0.9
Yes, 0
Yes, 2
No, 99.1
No, 100
No, 98
Pipes are broken or open
Total ODF Non-ODF

Interim Report National Annual Rural Sanitation Survey (NARSS), Round-2, 2018-2019
CHAPTER-11: AVAILABILITY AND STATUS OF TOILETS OF AWC PAGE 105
percent reported to be in the states of Uttar Pradesh (99.6%), Tamilnadu (98.8%) and Rajasthan (98%). Please
refer annexure table-AWC:4 for additional information.
11.5. USAGE OF THE TOILET NARSS also collected data on usage of the toilet. At national level, the usage of the toilet was reported to be 92.8
percent. In ODF villages, the proportion of usage status of the toilet in AWC was 98.9 percent while in Non-ODF
villages the usage proportion was 85.6 percent. At overall level, along with the states wherein the usage of toilet
in AWC is universal, the majority of the states were reported to have the usage in more than 90 percent AWCs.
The states wherein the usability representation is below 90 percent are, Tripura (87.5%), Puducherry (86.4%),
Telangana (85.5%), Nagaland (84.4%), Jharkhand (82.8%), Madhya Pradesh (82.5%), Karnataka (80.7%), Odisha
(79.9%) and Assam (74.1%).
Usage status of toilet by state/ UT (%) Percentage of usage status of toilet in AWCs (Base: 4482)
100.0100.0100.0100.0100.0100.0100.0100.098.898.097.797.697.196.095.194.994.494.193.792.892.691.791.490.6
87.586.485.584.4
82.882.5
80.779.9
74.1
A & N IslandsArunachal Pradesh
Dadra And Nagar HaveliGujarat
HaryanaKeralaSikkim
UttarakhandChhattisgarh
MizoramManipur
MeghalayaRajasthan
Himachal PradeshMaharashtra
Uttar PradeshPunjab
Andhra PradeshWest Bengal
TotalJammu & Kashmir
GoaTamil Nadu
BiharTripura
PuducherryTelanganaNagaland
JharkhandMadhya Pradesh
KarnatakaOdishaAssam

Interim Report National Annual Rural Sanitation Survey (NARSS), Round-2, 2018-2019
CHAPTER-11: AVAILABILITY AND STATUS OF TOILETS OF AWC PAGE 106
In ODF village category, majority of the states reported to have usage of toilet in more than 95 percent of AWCs.
Only Telangana reported to be having 93.3 percent toilet usage in AWCs.
Under non-ODF villages, there are few states where usage of toilet in AWC is universal. These states are
Arunachal Pradesh, Mizoram & Meghalaya. The states wherein usage of toilet in AWCs were reported to be lying
between 90 to 100 percent are, Manipur (95.2%), Uttar Pradesh (94.1%), Goa (91.7%), J&K (90.9%) and Bihar
(90.1%). In the same village category, the percentage of usability is reported lowest 40.7 percent in Karnataka.
Please refer annexure table-AWC:5 for additional information.
11.6. HYGIENIC SITUATION OF AWC TOILETS
In India, more than 9 out of 10 AWC toilets were reported to be found in hygienic condition. Across the ODF and
Non-ODF village category, national level trend is prevalent, however, the percentage across both the village
category varies substantially. The hygienic condition of AWC toilet under ODF category represents 99.1 percent
while in Non-ODF village category, the percentage is 92.1 percent.
Hygienic situation of toilet (%)
Under ODF village category, wherein majority of the AWC toilets reported to be found hygienic universally,
however, few states which shows percentage of hygienic toilet in less than 100 percent AWCs, are Andhra
Pradesh (98.6%), Karnataka (97.6%), Odisha (96.2%), West Bengal (95.7%) and Punjab (95.3%). The AWCs of Non-
ODF category states which were reported to have hygienic toilet less than 90 percent are, Odisha (75.4%), West
Bengal (63.8%), Karnataka (59.3%) and Andhra Pradesh (47.6%). Majority of the states reported to have hygienic
status in more than 90 percent AWC toilets. Please refer annexure table-AWC:7 for additional information.
11.7. SAFE DISPOSAL OF HUMAN EXCRETA IN AWC TOILETS
Information collected on safe disposal of human excreta in the Anganwadi Centres revealed that overall, 98.6
percent of Anganwadi Centres were practicing safe disposal of human excreta. All AWC in majority of the states
were reported to be practicing safe disposal of excreta.
95.999.1
92.1
Hygienic condition
Total ODF Non- ODF Base: All unlocked AWC toilet -4482

Interim Report National Annual Rural Sanitation Survey (NARSS), Round-2, 2018-2019
CHAPTER-11: AVAILABILITY AND STATUS OF TOILETS OF AWC PAGE 107
Percentage of AWC with Safe disposal of excreta (%)
The states wherein the AWC reported safe disposal in more than 99 percent but less than 100 percent toilets
are, Rajasthan & Uttar Pradesh (99.6% each) and Tamilnadu & West Bengal (99% each). States with less than 99
percent but above 98 percent AWCs practicing safe disposal are, Punjab & Maharashtra (98.6% each), Andhra
Pradesh (98.4%) and Assam (98.3%). In ODF, only 3 states represent less than 100 percent AWCs practicing safe
disposal. The states are Andhra Pradesh (99.3%), Karnataka (99.2%) and Punjab (97.7%) while in Karnataka under
Non-ODF, reported to have lowest number of AWCs, practicing safe disposal.
This accounts to be 77.8 percent. Rest of the AWCs across the states either reported universal safe disposal
practice or reported safe disposal in higher than 90 percent of AWCs. The states where safe disposal was
exhibited between 95 percent to 100 percent of AWCs, are Uttar Pradesh (99.6%), Tamilnadu (98.8%), Rajasthan
(98%), Assam (97.8%), Bihar (96.7%), Goa (95.8%), West Bengal (95.7%), Manipur & Andhra Pradesh (95.2% each)
and Nagaland (95%). Please refer annexure table-AWC:8 for additional information.
98.6 99.9 97.1
Safe disposal
Total ODF Non ODF Base: All unlocked AWC toilet -4482

Interim Report National Annual Rural Sanitation Survey (NARSS), Round-2, 2018-2019
CHAPTER-11: AVAILABILITY AND STATUS OF TOILETS OF AWC PAGE 108
Condition of the toilets in AWCs – Functionality, Disposal method and Hygiene (%)
States
Total ODF Non-ODF
Functional Hygiene Safe
disposal Total Functional Hygiene
Safe disposal
Total Functional Hygiene Safe
disposal Total
TOTAL 97.7 95.9 98.6 4482 99.8 99.1 99.9 2429 95.3 92.1 97.1 2053
A & N Islands 100 100 100 19 100 100 100 19 0 0 0 0
Andhra Pradesh 97.8 87 98.4 185 99.3 98.6 99.3 143 92.9 47.6 95.2 42
Arunachal Pradesh 100 100 100 11 100 100 100 5 100 100 100 6
Assam 98.3 98.3 98.3 58 100 100 100 12 97.8 97.8 97.8 46
Bihar 96.9 96.9 96.9 192 100 100 100 10 96.7 96.7 96.7 182
Chhattisgarh 100 100 100 172 100 100 100 172 0 0 0 0
Dadra And Nagar Haveli 100 100 100 26 100 100 100 26 0 0 0 0
Goa 95.8 95.8 95.8 24 0 0 0 0 95.8 95.8 95.8 24
Gujarat 100 100 100 190 100 100 100 190 0 0 0 0
Haryana 100 100 100 100 100 100 100 100 0 0 0 0
Himachal Pradesh 100 100 100 50 100 100 100 50 0 0 0 0
Jammu & Kashmir 100 100 100 54 100 100 100 21 100 100 100 33
Jharkhand 96.6 96.6 96.6 87 100 100 100 30 94.7 94.7 94.7 57
Karnataka 90.6 86.2 92.8 181 99.2 97.6 99.2 127 70.4 59.3 77.8 54
Kerala 100 100 100 172 100 100 100 172 0 0 0 0
Madhya Pradesh 95.1 95.1 95.1 223 100 100 100 80 92.3 92.3 92.3 143
Maharashtra 98.6 98.6 98.6 347 100 100 100 262 94.1 94.1 94.1 85
Manipur 97.7 97.7 97.7 43 100 100 100 22 95.2 95.2 95.2 21
Meghalaya 100 100 100 42 100 100 100 23 100 100 100 19
Mizoram 100 100 100 49 100 100 100 26 100 100 100 23
Nagaland 97.8 97.8 97.8 45 100 100 100 25 95 95 95 20
Odisha 78.5 79.2 95.8 144 96.2 96.2 100 26 74.6 75.4 94.9 118
Puducherry 100 100 100 22 0 0 0 0 100 100 100 22
Punjab 98.6 97.2 98.6 72 97.7 95.3 97.7 43 100 100 100 29
Rajasthan 99.6 99.6 99.6 279 100 100 100 228 98 98 98 51
Sikkim 100 100 100 26 100 100 100 26 0 0 0 0
Tamil Nadu 99 99 99 315 100 100 100 65 98.8 98.8 98.8 250
Telangana 100 100 100 76 100 100 100 45 100 100 100 31
Tripura 100 100 100 24 0 0 0 0 100 100 100 24
Uttar Pradesh 99.6 97.3 99.6 807 100 100 100 128 99.6 96.8 99.6 679
Uttarakhand 100 100 100 52 100 100 100 52 0 0 0 0
West Bengal 96.5 88.1 99 395 99.3 95.7 100 301 87.2 63.8 95.7 94

Interim Report National Annual Rural Sanitation Survey (NARSS), Round-2, 2018-2019
CHAPTER-11: AVAILABILITY AND STATUS OF TOILETS OF AWC PAGE 109
11.8. EVIDENCES OF HAND WASHING PRACTICE
The data on handwashing practices provided estimation of percentage of AWC with water available near the
toilet. At overall level, more than 4 out of 10 AWCs were reported to have both soap and water available near
the toilet, followed by the AWCs toilet which had only water available near the toilet or water point. Only soap
was available in 11% of AWCs while lowest 7.4 percent AWC toilets had neither soap nor water.
Evidence of hand washing practices in AWCs (%)
Across the ODF and Non-ODF villages where AWCs were found, the trend of availability of water or detergent or
otherwise are same, however in ODF AWCs, the percentage of availability of both water and soap near the toilet
was reported higher than Non-ODF AWCs. Please refer annexure table-AWC:9 for additional information.
39.641.7
37.2
11.0 10.012.1
42.1 43.440.5
7.45
10.2
Total ODF NON ODF
Only water available Soap available Both water and soap available Neither soap nor water available
Base : All unclocked AWC toilets- 4482

Interim Report National Annual Rural Sanitation Survey (NARSS), Round-2, 2018-2019
CHAPTER-12: AVAILABILITY AND STATUS OF PUBLIC TOILETS PAGE 110
CHAPTER-12: SURVEY FINDINGS OF PUBLIC TOILETS
Key Findings
• Presence of Public toilets: At national level, 17.8 percent of the surveyed villages had public toilets. This proportion was higher in ODF villages than non-ODF category villages. This accounted to be 20.2 percent and 15.6 percent in ODF and non-ODF respectively.
• Separate Section of toilet: Results on separate section of toilet for men and women were reported higher in ODF villages which was accounted for 66.5 percent and 50.6 percent in non-ODF villages.
• Availability of water: The availability of water for use in the toilet was observed high in ODF (99.8%) than in non-ODF (86.4%).
• Functionality: Overall, 99 percent of the public toilets were observed to be functional. All toilets (100.0%) available in ODF village were observed to be functional while in Non-ODF village category, the functionality represents 97.5%.
• Usage status: In ODF category, 99.7 percent of the public toilets were found in regular use and well-kept condition.
• Safe disposal of human excreta: At national level, 99.2 percent of the public toilets were practicing safe disposal of human excreta. In ODF villages, all PTs (100.0%) were practicing safe disposal of excreta while 98 percent was reported in Non-ODF village category.
• Hand washing practices: Overall, 95.7 percent of the public toilets had the evidence of hand-washing practices which was 99.8 percent in ODF whereas 89.7 percent in non-ODF category.
• User fee: 85.3 percent of the total surveyed public toilets did not charge user fees. The percentage was 80.5 percent in ODF while 90.9 percent in Non-ODF.

Interim Report National Annual Rural Sanitation Survey (NARSS), Round-2, 2018-2019
CHAPTER-12: AVAILABILITY AND STATUS OF PUBLIC TOILETS PAGE 111
12.1. INTRODUCTION
ommunity toilets are an effective alternative for improving sanitation coverage among the densely
populated low-income communities. Besides meeting the requirements of landless, a community toilet
also has the advantage of being able to serve the floating population in public places such as markets, bus stands,
railway stations, hospitals, places of worship etc. Community toilets are mainly of two types: ‘pay and use’ and
‘no-pay and use’.
This chapter gives information about the functionality, availability of water and sanitary condition of community
toilets in rural India and states.
Particulars Total ODF Non-ODF
Total number of villages surveyed 6136 2891 3245
Total number of villages with Public toilets* 1091 585 506
Total number of unlocked public toilets** 981 583 398
Total number of locked public toilets 110 2 108
**For analysis of functionality, usage, disposal of excreta and handwashing practices, base (n=981) will be applicable. *For separate section analysis, base (n=1091) will be applicable.
12.2. AVAILABILITY OF PUBLIC/ COMMUNITY TOILETS
The survey data showed that in total sampled villages (n=6136), only 17.8 percent of the villages (n=1091) had
public toilets for people. Of the total village surveyed, 17.8 percent villages had public toilets at overall level. In
ODF, the percentage was 20.2 percent while in Non-ODF, the availability is reported in 15.6 percent villages.
States wherein availability of public toilets were reported in less than 10 percent of villages are, Uttarakhand
(8.6%), Uttar Pradesh (7.9%), Himachal Pradesh (7.3%), Chhattisgarh (7.1%), Madhya Pradesh (6.8%), Jharkhand
(4.6%), Telangana (4.2%), Bihar (3.4%), Odisha (3.2%) and Jammu & Kashmir (2.5%).
Interestingly, percentage of availability of public toilet across ODF & Non-ODF village in the state of Tamilnadu,
Nagaland & Mizoram, were reported to be highest among other states. The percentage of these states in ODF
village category is, 86.2 percent, 80.8 percent and 80.8 percent while in Non-ODF village category, the percentage
is 85.4 percent, 69.2 percent and 61.5 percent respectively. Please refer annexure table-PT:1 for additional
information.
Availability of public toilets in villages (%)
17.8
20.2
15.6
Total ODF Non-ODF
Base : All surveyed villages - 6136
C

Interim Report National Annual Rural Sanitation Survey (NARSS), Round-2, 2018-2019
CHAPTER-12: AVAILABILITY AND STATUS OF PUBLIC TOILETS PAGE 112
12.3. SEPARATE SECTION OF TOILETS The availability of separate sections for male and female in the public toilets were observed during the survey.
Of the total surveyed public toilets, 59.1 percent of public toilets had separate section for males and females.
Percentage of separate section in the states across ODF and non-ODF category reported substantial variation
which are accounted to be 66.5 percent and 50.6 percent respectively.
At overall level, Goa is the state where all public toilets (100%) were found to be having separate section. States
wherein separate section represented below 50 percent of the total public toilets, are Bihar (47.4%), Mizoram
(43.2%), Tamilnadu (39.8%), Nagaland (25.6%), Assam (23.8%) and Uttarakhand (20%).
The states under ODF village category, the percentage of separate section of public toilet which were reported
above 80 percent are, Odisha (100%), Andhra Pradesh & Gujarat (92% each) and Kerala (89.3%).
Under Non-ODF, the states wherein the percentage of separate section were reported universal are, Andhra
Pradesh (100%), Telangana (100%), Arunachal Pradesh (100%) and Goa (100%), however the number of total
public toilets found in these states are very low. If the separate section of public toilet is reported by number,
the states of Tamilnadu, followed by Uttar Pradesh, Maharashtra and Karnataka is leading among the states with
higher number of public toilets with separate sections. Lowest representation of separate section was reported
in Assam (21.1%). Please refer annexure table-PT:2 & PT:3 for additional information.
Public toilets with separate sections for men and women (%)
12.4. AVAILABILITY OF WATER
Of the total unlocked public toilets, 94.4 percent of the public toilets had water available for toilet use. In ODF
villages of the states, it was observed in 99.8 percent of public toilets while availability of water was reported to
be 86.4 percent in non-ODF villages.
50.6
66.5
59.1
49.4
33.5
40.9
Non-ODF
ODF
Total
Yes NoBase : All Public toilets - 1091

Interim Report National Annual Rural Sanitation Survey (NARSS), Round-2, 2018-2019
CHAPTER-12: AVAILABILITY AND STATUS OF PUBLIC TOILETS PAGE 113
Availability of water in public toilet by state/ UT (%)
Percentage of public toilet with availability of water (Base: 981)
Majority of the states at overall reported to have availability of water in all public toilets (100%). The states
wherein the representation of water availability is less than 80 percent are, Assam (77.8%), Madhya Pradesh
(77.3%), Tripura (75%) and Bihar (55.6%).
All public toilets across ODF states reported to have universal water availability except Tamilnadu where
representation is 98.2 percent which is close enough to be universal.
Representation of water availability at overall level under Non-ODF category is substantially low. Few states
reported to have water availability in public toilet below 80 percent. These states are Nagaland (78.6%),
Telangana, Arunachal Pradesh, Assam and Tripura (75% each), Karnataka (62.5%), Madhya Pradesh (54.5%) and
Bihar (50%). In the same village category, the states wherein the percentage is between 80 to 100 percent are,
Maharashtra (92.3%), Mizoram (91.7%), Tamilnadu (90.4%), Uttar Pradesh (89.5%) and Odisha (85.7%). Please
refer annexure table-PT:4 for additional information.
100.0100.0100.0100.0100.0100.0100.0100.0100.0100.0100.0100.0100.0100.0100.0100.0
99.397.0
94.492.291.490.690.0
87.585.7
83.380.0
77.877.3
75.055.6
0.00.0
A & N IslandsAndhra Pradesh
ChhattisgarhGoa
GujaratHaryana
Himachal PradeshJammu & Kashmir
JharkhandKerala
ManipurMeghalaya
RajasthanSikkim
UttarakhandWest BengalMaharastra
MizoramTotal
Tamil NaduNagaland
Uttar PradeshKarnataka
OdishaTelangana
Arunachal PradeshPuducherry
AssamMadhya Pradesh
TripuraBihar
Dadra And Nagar HaveliPunjab

Interim Report National Annual Rural Sanitation Survey (NARSS), Round-2, 2018-2019
CHAPTER-12: AVAILABILITY AND STATUS OF PUBLIC TOILETS PAGE 114
12.5. EVIDENCE OF HAND-WASHING PRACTICES
During the survey, the information was collected on the hand washing practices which intended to focus on the
evidences available near the toilet facilities. The information was collected with a set of questions (i) Only water
available near the toilet (ii) Soap available near the toilet (iii) Both soap and water available near the toilet (iv)
Neither soap nor water available near the toilet.
The survey data revealed that overall, 95.7 percent of the surveyed public toilet were observed to have either
only water or soap or both soap and water near the toilet facilities. In ODF villages of the states, the availability
of water or soap or both near the toilet facility was higher (99.8%) than in non-ODF villages (89.7%). Please refer
annexure table-PT:5 for additional information.
Percentage of public toilet with evidence of handwashing practices (%)
12.6. FUNCTIONALITY OF THE PUBLIC TOILETS
The survey explored the detailed information with regards to the functionality of the toilet in sampled public
toilets in both ODF and Non-ODF villages. The finding revealed that overall 99 percent of the public toilets were
functional. Results by ODF and non-ODF villages showed that, the proportion of functional public toilets in ODF
villages were 100.0 percent while in Non- ODF villages, it was 97.5 percent.
State-wise results revealed that majority of the states reported to have 100 percent functional toilets. The states
wherein representation of functionality is below 100 percent are, West Bengal (98.6%), Maharashtra (98.5%),
Uttar Pradesh (98.4%), Nagaland (97.1%), Madhya Pradesh (95.5%), Assam & Bihar (94.4%) and Karnataka
(93.3%).
In ODF village’s category, all the surveyed public toilet was functional. In Non-ODF village’s category, the states
which were reported the public toilet having representation of functionality below 100 percent are, Uttar
Pradesh (98.2%), Assam & Bihar (93.8% each), Nagaland (92.9%), Madhya Pradesh (90.9%), West Bengal (88.9%),
Maharashtra (84.6%) and Karnataka (75%). Please refer annexure table-PT:6 for additional information.
95.7
99.8
89.7
4.3
0.2
10.3
Total
ODF
Non-ODF
No handwashing observed Handwashing observed
Base: All unlocked public toilet (981)

Interim Report National Annual Rural Sanitation Survey (NARSS), Round-2, 2018-2019
CHAPTER-12: AVAILABILITY AND STATUS OF PUBLIC TOILETS PAGE 115
Functionality status of public toilet (%)
Proportion of PT with functional status of toilet by different components (%) Base: All PTs with toilet access (n=981)
99 100 97.5
Total ODF Non-ODF
Base: All unlocked public toilet (981)
Yes, 0.1
Yes, 0
Yes, 0.3
No, 99.9
No, 100
No, 99.7
Pan is completely broken
Total ODF Non-ODF
Yes, 0.4
Yes, 0
Yes, 1
No, 99.6
No, 100
No, 99
Pan is completely choked
Total ODF Non-ODF
Yes, 99.2
Yes, 100
Yes, 98
No, 0.8
No, 0
No, 2
Pits/ tanks are completely covered
Total ODF Non-ODF
Yes, 0.2
Yes, 0
Yes, 0.5
No, 99.8
No, 100
No, 99.5
Pipes are broken or open
Total ODF Non-ODF

Interim Report National Annual Rural Sanitation Survey (NARSS), Round-2, 2018-2019
CHAPTER-12: AVAILABILITY AND STATUS OF PUBLIC TOILETS PAGE 116
12.7. USAGE OF PUBLIC TOILET The survey findings revealed that across India, 94 percent of the total unlocked public toilets appeared to be well
kept and in regular use with water inside or nearby for toilet use. State-wise results showed that many states
were observed to have all the toilets (100.0%) in well-kept condition and in regular use. The state wherein the
representation of usage is between 80 to 100 percent are, Maharashtra (99.3%), Rajasthan (97.8%), Uttar
Pradesh (95.3%), Manipur (95.2%), Tamilnadu (91.8%), Nagaland (91.4%), Telangana (85.7%) and Karnataka
(83.3%). Usage percentage of public toilet below 70 % are reported in the states of Arunachal Pradesh (66.7%)
and Bihar (55.6%). All public toilets under ODF category across all states have 100 percent usage except the states
of Tamilnadu (98.2%) and Nagaland (95.2%).
In non-ODF village’s category, only few states have all public toilets in regular use and kept in good condition.
The states are, Andhra Pradesh, Meghalaya, Mizoram, West Bengal and Goa. Please refer annexure table-PT:7
for additional information.
Usage of public toilet (%)
9499.7
85.7
Total ODF Non-ODF
Base: All unlocked public toilet (981)

Interim Report National Annual Rural Sanitation Survey (NARSS), Round-2, 2018-2019
CHAPTER-12: AVAILABILITY AND STATUS OF PUBLIC TOILETS PAGE 117
Condition of the public toilets– Functionality, Disposal Method and Usage (%).
States
Total ODF Non-ODF
Functional Safe
Disposal Usage Total Functional
Safe Disposal
Usage Total Functional Safe
Disposal Usage Total
TOTAL 99.0 99.2 94.0 981 100.0 100.0 99.7 583 97.5 98.0 85.7 398
A & N Islands 100.0 100.0 100.0 15 100.0 100.0 100.0 15 0.0 0.0 0.0 0
Andhra Pradesh 100.0 100.0 100.0 26 100.0 100.0 100.0 25 100.0 100.0 100.0 1
Arunachal Pradesh 100.0 100.0 66.7 6 100.0 100.0 100.0 2 100.0 100.0 50.0 4
Assam 94.4 94.4 77.8 18 100.0 100.0 100.0 2 93.8 93.8 75.0 16
Bihar 94.4 94.4 55.6 18 100.0 100.0 100.0 2 93.8 93.8 50.0 16
Chhattisgarh 100.0 100.0 100.0 13 100.0 100.0 100.0 13 0.0 0.0 0.0 0
Dadra And Nagar Haveli 0.0 0.0 0.0 0 0.0 0.0 0.0 0 0.0 0.0 0.0 0
Goa 100.0 100.0 100.0 7 0.0 0.0 0.0 0 100.0 100.0 100.0 7
Gujarat 100.0 100.0 100.0 25 100.0 100.0 100.0 25 0.0 0.0 0.0 0
Haryana 100.0 100.0 100.0 19 100.0 100.0 100.0 19 0.0 0.0 0.0 0
Himachal Pradesh 100.0 100.0 100.0 4 100.0 100.0 100.0 4 0.0 0.0 0.0 0
Jammu & Kashmir 100.0 100.0 100.0 2 100.0 100.0 100.0 2 0.0 0.0 0.0 0
Jharkhand 100.0 100.0 80.0 5 100.0 100.0 100.0 3 100.0 100.0 50.0 2
Karnataka 93.3 100.0 83.3 30 100.0 100.0 100.0 22 75.0 100.0 37.5 8
Kerala 100.0 100.0 100.0 75 100.0 100.0 100.0 75 0.0 0.0 0.0 0
Madhya Pradesh 95.5 95.5 77.3 22 100.0 100.0 100.0 11 90.9 90.9 54.5 11
Maharashtra 98.5 98.5 99.3 137 100.0 100.0 100.0 124 84.6 84.6 92.3 13
Manipur 100.0 100.0 95.2 21 100.0 100.0 100.0 10 100.0 100.0 90.9 11
Meghalaya 100.0 100.0 100.0 8 100.0 100.0 100.0 6 100.0 100.0 100.0 2
Mizoram 100.0 100.0 100.0 33 100.0 100.0 100.0 21 100.0 100.0 100.0 12
Nagaland 97.1 97.1 91.4 35 100.0 100.0 95.2 21 92.9 92.9 85.7 14
Odisha 100.0 100.0 75.0 8 100.0 100.0 100.0 1 100.0 100.0 71.4 7
Puducherry 100.0 100.0 80.0 5 0.0 0.0 0.0 0 100.0 100.0 80.0 5
Punjab 0.0 0.0 0.0 0 0.0 0.0 0.0 0 0.0 0.0 0.0 0
Rajasthan 100.0 100.0 97.8 45 100.0 100.0 100.0 37 100.0 100.0 87.5 8
Sikkim 100.0 100.0 100.0 9 100.0 100.0 100.0 9 0.0 0.0 0.0 0
Tamil Nadu 100.0 100.0 91.8 243 100.0 100.0 98.2 56 100.0 100.0 89.8 187
Telangana 100.0 100.0 85.7 7 100.0 100.0 100.0 3 100.0 100.0 75.0 4
Tripura 100.0 100.0 75.0 4 0.0 0.0 0.0 0 100.0 100.0 75.0 4
Uttar Pradesh 98.4 98.4 95.3 64 100.0 100.0 100.0 7 98.2 98.2 94.7 57
Uttarakhand 100.0 100.0 100.0 5 100.0 100.0 100.0 5 0.0 0.0 0.0 0
West Bengal 98.6 98.6 100.0 72 100.0 100.0 100.0 63 88.9 88.9 100.0 9

Interim Report National Annual Rural Sanitation Survey (NARSS), Round-2, 2018-2019
CHAPTER-12: AVAILABILITY AND STATUS OF PUBLIC TOILETS PAGE 118
12.8. SAFE DISPOSAL OF HUMAN EXCRETA
The survey data revealed that overall, 99.2 percent of the public toilets were practicing safe disposal of human
excreta. In majority of the states, all the public toilets (100.0%) practiced safe disposal of human excreta. There
are few states which reported lower than 100 percent safe disposal in public toilets are, West Bengal (98.6%),
Maharashtra (98.5%), Uttar Pradesh (98.4%), Nagaland (97.1%), Madhya Pradesh (95.5%), Assam (94.4%) & Bihar
(94.4%) at overall level.
Under ODF village category, all public toilet across all states reported to be having 100 percent toilets practicing
safe disposal while under Non-ODF village category, majority of the states were showing 100 percent safe
disposal, however, the states wherein public toilets reported to be practicing safe disposal in lower than 100
percent are, Uttar Pradesh (98.2%), Assam & Bihar (93.8%), Nagaland (92.9%), Madhya Pradesh (90.9%), West
Bengal (88.9%) and Maharashtra (84.6%). Please refer annexure table-PT:9 for additional information.
Methods of disposal from public toilets (%)
12.9. USER CHARGES Overall, 85.3% of the total public toilets found across the ODF and non-ODF villages did not charge user fees. In
ODF, the public toilet which did not charge fee represents 80.5 percent while in Non-ODF, this represents 90.9
percent.
Percentage of public toilet do not charge user fee (%)
Safe disposal, 99.2
Unsafe disposal , 0.8
Safe disposal Unsafe disposalBase: All unlocked public toilet-981
84.1 84 84.2
India ODF Non ODF Base: All unlocked public toilets - 981

Interim Report National Annual Rural Sanitation Survey (NARSS), Round-2, 2018-2019
CHAPTER-12: AVAILABILITY AND STATUS OF PUBLIC TOILETS PAGE 119
In ODF village category, majority of the public toilets did not charge fee, however, Meghalaya is the only state
where lowest percentage of public toilets were recorded which did not charge fee. The percentage is 16.7
percent. Other states reported to be either did not charge fee at all or 50 percent or more public toilet did not
charge fee. Please refer annexure table-PT:8 for additional information.

Interim Report National Annual Rural Sanitation Survey (NARSS), Round-2, 2018-2019
CHAPTER-13: PUBLIC SPACES SANITATION FACILITY PAGE 120
CHAPTER-13: PUBLIC SPACES SANITATION FACILITY
Key Findings
• Presence of faecal matter in the public places: Public places in villages which were traditionally used for defecation, among them 92.6 percent were found to be clean and free from defecation. In ODF villages, 99 percent villages with public spaces were found to be free from defecation. In 87 percent of non-ODF villages, public spaces were found to be free from defecation.
• Safe disposal mechanism-solid: Almost three- fourth of the villages (71.3%) reported of disposing the solid waste through a safe method. 95.1 percent of ODF villages were found to be disposing the solid waste safely whereas 50.1 percent of non-ODF villages were found to be doing the same.
• Safe disposal mechanism-liquid: 80.9 percent of villages at national level reported of following safe mechanism for waste water disposal. 96.3 percent of ODF villages reported the same followed by 67.3 percent of the non-ODF villages.
• Minimal littering: 96.5 percent of the villages at national level were found to have minimal littering. In ODF villages, a high number of 99.5 percent villages were found to have minimal or no littering in the public places. In non-ODF villages, the percentage was 93.8 percent.
• Minimal water logging: At an overall level 96.7 percent of villages were found to be free from water logging. Among ODF villages, 99.7 percent of villages had no or minimal water logging while in Non-ODF category, the percentage was 94 percent.

Interim Report National Annual Rural Sanitation Survey (NARSS), Round-2, 2018-2019
CHAPTER-13: PUBLIC SPACES SANITATION FACILITY PAGE 121
13.1. INTRODUCTION
ublic places are the area or location where large number of people gather and use the facility. These places
vary in the number of people using them, the amount of time that people spent there increase the
likelihood of sanitation of the places become compromised. This chapter describes the current level of incidence
of fecal matter in the places which were historically used for open defecation, number of public places and
instances of open defecation, practices of safe disposal of solid waste, methods of disposal of waste water, public
places with minimal level of littering and minimal level of water logging. The data gathered pertaining to these
aspects was aimed to understand the current trend of sanitation practices adopted in the villages. The
information on public spaces was gathered in all the sampled villages (n=6136) across ODF and Non- ODF village
category.
13.2. INCIDENCE OF FECAL MATTER AND TYPES OF PLACES HISTORICALLY USED FOR OPEN DEFECATION
More than ninety percent (92.6%) of villages in India reported to have feces not found in the area that were used
for open defecation in the past. Only 7.4 percent village reported visible feces. In ODF villages, the percentage of
feces not found is 99 percent while in Non-ODF village category, the village reported feces not found represents
87 percent.
State wise analysis of data reveals that majority of the villages at overall level are open defecation free. The
states wherein open defecation free area, reported in less than 99 percent villages, are Jammu & Kashmir
(97.5%), West Bengal (95.8%), Telangana (91.5%), Andhra Pradesh (88.2%), Puducherry & Madhya Pradesh
(84.6%), Karnataka (82.1%), Bihar (73.7%), Goa (73.1%) and Odisha (60.1%). Odisha is the state wherein majority
of the villages reported visible feces in the area. This represents (39.9%). States wherein all villages (100%)
reported to be free of visible feces are, Arunachal Pradesh, Assam, Manipur, Meghalaya, Mizoram, Nagaland,
Uttar Pradesh, Tripura, Himachal Pradesh, Kerala, Sikkim, ANI, Dadra & Nagar Haveli, Uttarakhand and
Chhattisgarh.
Open defecation free area used for defecation in the past (%)
In ODF category, the states where visible feces not found, were reported above 98 percent but below 100 percent
are, Gujarat (99.5%), Rajasthan (99.3%), Madhya Pradesh, Haryana & Maharashtra (99% each), West Bengal
(98.9%), Karnataka (98.8%), Telangana (98.5%) and Punjab (98.3%). Representation of villages free from visible
72.8
100.0
65.7
India ODF Non ODFBase: All surveyd villages - 6136
P

Interim Report National Annual Rural Sanitation Survey (NARSS), Round-2, 2018-2019
CHAPTER-13: PUBLIC SPACES SANITATION FACILITY PAGE 122
feces below 98 percent are reported in the states, Andhra Pradesh (97.8%), Jharkhand (97.5%), Odisha (96.9%),
J&K (96.2%), Tamilnadu (95.4%) and Bihar (87.1%).
In Non-ODF category, the states where representation of the villages free from visible feces reported below 99
percent are, J&K (98.1%), West Bengal (88.7%), Telangana (86.6%), Puducherry (84.6%), Madhya Pradesh
(77.9%), Goa (73.1%), Bihar (72.9%), Andhra Pradesh (68.5%), Odisha (55.4%) and Karnataka (51.6%). Refer PSS:1
in annexure table
State wise distribution of defecation free public places (%)
13.3. VILLAGES FOLLOWING SAFE SLWM WITH ODF PUBLIC PLACES- MINIMAL LITTERING &
MINIMAL WATER LOGGING
Basis the condition defined to classify the village into safe and unsafe with respect to the instances of fecal matter
at public places, safe disposal of solid & liquid waste, minimal littering and minimal water logging in the villages,
the data collected in the survey suggested that 63 percent of the villages at overall level, are seemed to be clean.
All villages- with ODF area used for open defecation in the past, ODF open ground, ODF roads, ODF
infamous place, safe SLWM, Minimal littering & Minimal water logging.
Reported: (n=3868)
Sample: All villages surveyed (6136)
Base: All surveyed villages (6136)

Interim Report National Annual Rural Sanitation Survey (NARSS), Round-2, 2018-2019
CHAPTER-13: PUBLIC SPACES SANITATION FACILITY PAGE 123
The percentage of cleaned villages in ODF village is 88.9 percent while in Non-ODF villages, the cleaned village
represents 40 percent.
State-wise data analysis shows that all villages of the states of Dadra & Nagar Haveli and Sikkim are cleaned at
national level. The states where the percentage of cleaned villages is higher than 90 percent but lower than 100
percent are, Haryana (97.1%), ANI & Mizoram (96.2%), Uttarakhand (94.8%), Gujarat (91.8%) and Kerala (91%).
States where percentage of cleaned villages is lower than 50 percent are, Madhya Pradesh (47.2%), Arunachal
Pradesh (46.2%), J&K (41.8%), Jharkhand (40.8%), Goa (34.6%), Puducherry (26.9%), Odisha (19.4%), Tripura
(19.2%), Bihar (17%) and Assam (16.9%).
In ODF village category, in majority of the states, the percentage of cleaned villages are higher than 90 percent.
The states wherein the percentage of village is lower than 90 percent are, Chhattisgarh & Himachal Pradesh
(89.1% each), Madhya Pradesh (86.3%), Telangana (83.8%), Andhra Pradesh (83.5%), Punjab (83.3%), Odisha
(81.3%), West Bengal (81.1%), J&K (80.8%), Jharkhand (75%), Assam (61.9%) and Bihar (41.9%).
In Non-ODF category, Only Mizoram has got 96.2 percent cleaned villages. Rest of the states reported to have
the percentage of cleaned villages, below 85 percent. The states wherein the percentage of cleaned villages were
reported higher than 50 percent are, Mizoram (96.2%), Uttar Pradesh (82.3%), Tamilnadu (66.7%) and Rajasthan
(61.7%). Percentage of cleaned villages with less than 20 percent, were reported in the states of Meghalaya &
Tripura (19.2% each), Andhra Pradesh (19.1%), Karnataka (16.8%), Bihar (15.5%), Odisha (11.6%), Manipur
(11.5%), West Bengal (7.9%) and Assam (4.1%). Refer PSS:2 in annexure table
13.4. OPEN DEFECATION INSTANCES AT OPEN GROUND Open ground areas of the villages across ODF and Non-ODF category were observed to look at the instances of
open defecation practices in the survey. The data revealed that more than 90 percent of the villages (94.2%) with
open ground did not have the instances of open defecation at overall level. In ODF category, almost all villages
(98.9%) did not have open defecation instances while under Non-ODF, the representation of open defecation at
open areas in the villages, is 90 percent. Refer PSS:3 in annexure table
Village with no instances of open defecation in open grounds (%)
94.298.9
90.0
Total ODF Non-ODF
Base: All villages surveyed (6136)

Interim Report National Annual Rural Sanitation Survey (NARSS), Round-2, 2018-2019
CHAPTER-13: PUBLIC SPACES SANITATION FACILITY PAGE 124
13.5. OPEN DEFECATION INSTANCES IN ROADS ALONGSIDE VILLAGE
Roads alongside the villages across ODF and Non-ODF category were observed to look at the instances of open
defecation practices in the survey. The data revealed that 94.5 percent of the villages did not have the instances
of open defecation alongside the roads at overall level. In ODF category, almost all villages (99.4%) did not have
open defecation instances while under Non-ODF, the representation of open defecation alongside the villages,
is 90.2 percent. In India, the villages representing below 90 percent wherein the instances of open defecation
observed, were reported in the states of Andhra Pradesh (87.8%), Madhya Pradesh (86.7%), Karnataka (85.1%),
Goa & Puducherry (84.6% each), Bihar (82.5%) and Odisha (70.7%). Refer PSS:4 in annexure table
Village with no instances of open defecation in roads alongside the village (%)
13.6. OPEN DEFECATION INSTANCES AT ANY INFAMOUS PLACE
Infamous places in the villages across ODF and Non-ODF category were observed to look at the instances of open
defecation in the NARSS survey. The data revealed that 96.7 percent of the villages did not have the instances of
open defecation at overall level. In ODF category, almost all villages (99.6%) did not have open defecation
instances while under Non-ODF, the representation of open defecation, was 94.1 percent. In India, the villages
representing below 99 percent wherein the instances of open defecation observed, were reported in the states
of J&K (98.7%), West Bengal (98.6%), Goa (96.2%), Karnataka (95.5%), Telangana (94.5%), Andhra Pradesh
(92.6%), Puducherry & Madhya Pradesh (92.3% each), Bihar (86.9%) and Odisha (82.3%). Refer PSS:5 in annexure
table
Village with no instances of open defecation at any infamous place (%)
94.599.4
90.2
Total ODF Non-ODF
Base: All villages surveyed (6136)
96.7 99.694.1
Total ODF Non-ODF
Base: All villages surveyed (6136)

Interim Report National Annual Rural Sanitation Survey (NARSS), Round-2, 2018-2019
CHAPTER-13: PUBLIC SPACES SANITATION FACILITY PAGE 125
13.7. METHODS OF SOLID WASTE DISPOSAL
Solid waste has potentially harmful health effects, if it is not disposed of properly. Exposure to the decomposed
waste may lead to develop various infective diseases and that the children are potentially more susceptible to
contract the disease than any adult individual. The survey captured the different methods of solid waste disposal
which were prevalent in the village. Under the different disposal methods, the options were provided in the
questionnaire which helped interviewers to record the correct methods wherever the methods were used in the
village. The options were: 1) No treatment of solid waste 2) Open burning of the solid waste 3) Waste dumped
in river/ water bodies 4) Community level composting arrangement (NADEP/ Vermi-composting etc.) in the
village 5) Community level waste collection arrangements and 6) Segregated waste collected, and safely
managed in the village.
The survey data revealed that almost three- fourth (71.3%) of the total villages practiced safe methods of solid
waste disposal at overall level. In ODF village, the percentage of safe disposal methods were substantially high
which accounted to be 95.1 percent while in Non-ODF village, safe disposal methods represented 50.1 percent.
State-wise data analysis revealed that in India, only Sikkim and Dadra & Nagar Haveli reported all its villages
(100%) practiced safe solid waste disposal methods. The states wherein the percentage of villages practiced safe
disposal methods, lies between 95 percent to 100 percent, are Haryana (99%), Chhattisgarh & Kerala (98.9%),
Mizoram (98.1%), Gujarat (97.9%), ANI (96.2%), Uttarakhand (94.8%) and Himachal Pradesh (94.5%). States
wherein representation of village is below 50 percent for safe disposal of solid waste are, Arunachal Pradesh
(48.1%), Jharkhand (47.4%), J&K (45.6%), Bihar (29.3%), Odisha (25.1%), Assam (21.2%) and Tripura (19.2%).
In ODF category, all villages of Sikkim, Dadra & Nagar Haveli, Mizoram and Tamilnadu practiced safe disposal
methods. States where representation of safe disposal are lower than 90 percent are, Punjab (83.3%), J&K
(80.8%), Jharkhand (77.5%), Assam (73.8%) and Bihar (71%). Percent of village which lies between 97 to 100
percent were reported to be in the states of Haryana (99%), Chhattisgarh & Kerala (98.9%), Gujarat (97.9%),
Maharashtra (97.7%) and Karnataka (97.1%).
In Non-ODF category, all the states reported to have lower than 100 percent villages practiced safe solid waste
disposal methods. Only Mizoram reported its 96.2 percent villages practiced safe solid waste disposal methods.
States where the percent of village is 50 percent or above, are Mizoram (96.2%), Uttar Pradesh (86.4%),
Tamilnadu (86.1%), Goa (76.9%), Rajasthan (69.1%), Telangana (62.9%), Maharashtra (60.8%) and Puducherry
(50%). States with villages percent lower than 30 percent are, J&K (28.3%), Bihar (26.9%), Karnataka (26.3%),
Meghalaya (23.1%), Manipur & Tripura (19.2%), West Bengal (17.9%) and Odisha (16.3%).
Data analysis by individual methods of solid waste disposal revealed that majority of the village practiced
community level waste collection arrangement (31.8%) followed by segregated waste collected and safely
managed (28.3%), open burning (18.2%) and so on at overall level. In ODF category, more than half of the villages
practiced community level waste collection arrangement (51.9%) followed by segregated waste collected and
safely managed (30.4%) and Community level composting arrangement (NADEP/ Vermi-compost (12.7%).
In Non-ODF, almost one-third of the villages (30.9%) practiced open burning for disposal of solid waste, followed
by segregated waste collected and safely managed (26.5%) and no treatment of solid waste (14.7%). Please refer
annexure table-PSS:6 & 7 for additional information
Safe solid waste disposal methods Includes Community level composting arrangement (NADEP/ Vermi-composting etc., Community level waste collection arrangements & Segregated waste collected and safely managed in the village. Sample: All villages surveyed (6136)

Interim Report National Annual Rural Sanitation Survey (NARSS), Round-2, 2018-2019
CHAPTER-13: PUBLIC SPACES SANITATION FACILITY PAGE 126
Methods of solid waste disposal (%)
13.8. METHODS OF LIQUID WASTE DISPOSAL
Liquid waste also has adverse effect on health of the individuals particularly children. It provides conducive
environments for harmful organism grow which lead to develop various water borne and vector borne diseases.
Proper disposal of waste water is important to keep the surrounding health and clean. To know the actual status
of the villages with respect to the availability of waste water and its disposal, the survey collected exhaustive
data on various methods of disposal of waste water. In survey questionnaire, different options were provided
(under record all mentioned) to capture the methods which were used in the village.
The options were: 1) No drainage system/ soak pit 2) Draining in open water body/ river 3) Flows in a some
kind of safe system 4) Some kind of treatment (into drain/ kitchen garden/ soak pit.
The survey data revealed that 80.9 percent of the villages adopted safe disposal methods of water waste at
overall level. In ODF villages, the percentage of safe disposal is substantially high which accounted to be 96.3
percent while in Non-ODF category, the percentage is 67.3 percent. In Kerala, Sikkim, Dadra & Nagar Haveli and
Uttarakhand, all the villages (100%) adopted safe disposal methods of liquid waste. States wherein percentage
of villages are higher than 90 percent but lower than 100 percent are, Haryana (99%), Gujarat (98.5%), Mizoram
(98.1%), Chhattisgarh (97.8%), Himachal Pradesh (96.4%), ANI (96.2%), Uttar Pradesh (93.4%), Maharashtra
(92.4%), Meghalaya & Tripura (92.3% each) and Rajasthan (90.7%).
In ODF category, almost all the villages practiced safe disposal of liquid waste, however, the states wherein the
representation of safe disposal is below 90 percent are, Jharkhand (87.5%), Assam (83.3%) and Bihar (54.8%).
In Non-ODF category, only Mizoram reported safe disposal universally where all its villages (100%) reported to
have followed safe disposal practice for liquid waste. States wherein representation of safe liquid waste disposal
No treatment 8%
Open burning18%
Dumped in water bodies3%
Community level composting arrangement
11%
Community level waste collection arrangement
32%
Segregated waste collected, and safely
managed28%
No treatment Open burningDumped in water bodies Community level composting arrangementCommunity level waste collection arrangement Segregated waste collected, and safely managed
Base : All villages surveyed (6136)
Safe liquid waste disposal methods
Includes flows in some kind of safe system & some kind of treatment (into drain/ kitchen garden/ soak pit
Sample: All villages surveyed (6136)

Interim Report National Annual Rural Sanitation Survey (NARSS), Round-2, 2018-2019
CHAPTER-13: PUBLIC SPACES SANITATION FACILITY PAGE 127
is above 90 percent are, Mizoram (100%), Uttar Pradesh (92.8%) and Tripura (92.3%). The states where percent
of village is below 50 percent are, Puducherry (46.2%), Assam (44.2%), J&K (43.4%), Karnataka (43.2%), West
Bengal (36.4%) and Manipur (34.6%). States with percentage of village between 70 to 90 percent are, Meghalaya
(84.6%), Tamilnadu (82.8%), Telangana (80.4%), Nagaland (76.9%), Maharashtra (75.8%) and Rajasthan (73.4%).
Please refer annexure table-PSS:8 for additional information.
Different methods through which waste water is disposed (%)
12.6
19.1
44.7
28.5
.8
1.3
69.0
32.7
7.0
10.7
56.1
30.4
No drainage system
Draining in open water body
Flows in a some kind of safe system
Some kind of treatment
Total ODF Non-ODF Base : All Villages - 6136
Sa
fe
Me
tho
d

Interim Report National Annual Rural Sanitation Survey (NARSS), Round-2, 2018-2019
CHAPTER-13: PUBLIC SPACES SANITATION FACILITY PAGE 128
Safe disposal method of liquid waste by state/ UT (%)
Percentage of villages practicing safe disposal methods of liquid waste
13.9. VILLAGES SHOWING MINIMAL LITTER Besides asking various disposal methods of solid and liquid waste from the eligible respondent of the village,
cleanliness of the villages was also observed by looking at the instances of littering. The interviewers primarily
observed the minimal level of littering in and around the villages. The data analysis shows that almost all the
villages (96.5%) were reported to have minimal level of littering in the village at overall level. Observation across
the ODF village shows that minimal level of littering represents 99.5 percent while in Non-ODF villages, the
percentage is 93.8 percent.
The states wherein the percentage of villages with minimal littering lies between 90 to 99 percent are, Kerala
(98.9%), J&K (98.7%), West Bengal (98.4%), Jharkhand (96.7%), Tripura (96.2%), Karnataka (95.9%) and Telangana
(93.3%). States with village percent below 90 percent are, Assam & Bihar (89.9% each), Andhra Pradesh (89.7%),
Arunachal Pradesh & Puducherry (88.5%) and Odisha (77.7%).
In ODF category, majority of the states were reported its 100 percent villages with minimal level of littering,
however, few of the states were reported to have less than 100 percent villages with minimal littering. These
states are Karnataka (99.4%), Kerala (98.9%), West Bengal (98.6%), Andhra Pradesh (97.3%), Odisha (96.9%) and
Bihar (96.8%).
100.0100.0100.0100.099.098.598.197.8
96.496.2
93.492.492.392.3
90.788.5
85.685.585.5
80.980.7
78.878.077.9
71.965.4
61.860.8
58.057.7
52.951.9
46.2
Dadra And Nagar HaveliKeralaSikkim
UttarakhandHaryanaGujarat
MizoramChhattisgarh
Himachal PradeshA & N Islands
Uttar PradeshMaharastraMeghalaya
TripuraRajasthanNagaland
Andhra PradeshTamil NaduTelangana
TotalPunjab
Arunachal PradeshKarnataka
West BengalMadhya Pradesh
ManipurJharkhand
Jammu & KashmirOdisha
GoaAssam
BiharPuducherry
Base : All Villages - 6136

Interim Report National Annual Rural Sanitation Survey (NARSS), Round-2, 2018-2019
CHAPTER-13: PUBLIC SPACES SANITATION FACILITY PAGE 129
In Non-ODF category, the states wherein the percentage of village with minimal littering represents lower than
90 percent are, Bihar & Karnataka (89.5% each), Telangana (88.7%), Puducherry (88.5%), Assam (87.1%),
Arunachal Pradesh (76.9%), Odisha (75.3%) and Andhra Pradesh (74.2%). The percentage of villages lies between
95 to 99 percent are, J&K (98.1%), West Bengal (98%), Tripura (96.2%) and Jharkhand (95.5%). Please refer
annexure table-PSS:9 for additional information.
Distribution of minimal level of littering (%).
13.10. VILLAGES SHOWING MINIMAL WATER LOGGING
In addition to collecting information on littering in the villages, the instances of water logging at the public places
were also observed. Majority of villages at an overall level were found to be free of any kind of water logging
(96.7%). Almost all the ODF villages (99.7 %) were found to be free of water logging and among non-ODF villages,
94 percent of the villages were found to be free of water logging.
The states wherein the percentage of villages with minimal water logging represents lower than 100 percent are,
Assam (99.5%), West Bengal (99%), Kerala (98.9%), J&K (98.7%), Tripura (96.2%), Jharkhand (96.1%), Arunachal
Pradesh (94.2%), Karnataka (93.7%), Andhra Pradesh (93%), Bihar & Telangana (91.5% each), Puducherry (84.6%)
and Odisha (70.3%).
In ODF category, almost all the villages have minimal water logging. Few states reported to have less than 100
percent villages with minimal water logging. These states are Assam (99.3%), J&K (98.1%), West Bengal (97.4%),
Tripura (96.2%), Jharkhand (94.6%), Bihar (91.2%), Arunachal Pradesh (88.5%), Telangana (85.6%), Puducherry
(84.6%), Karnataka (83.2%), Andhra Pradesh (83.1%) and Odisha (66.9%). Please refer annexure table-PSS:10 for
additional information.
96.5 99.593.8
Total ODF Non-ODF
Total ODF Non-ODFBase : All Villages - 6136

Interim Report National Annual Rural Sanitation Survey (NARSS), Round-2, 2018-2019
CHAPTER-13: PUBLIC SPACES SANITATION FACILITY PAGE 130
Distribution of minimal level of water logging (%)
******************
96.7 99.794.0
Total ODF Non-ODF
Total ODF Non-ODF Base : All Villages - 6136

Interim Report National Annual Rural Sanitation Survey (NARSS), Round-2, 2018-2019
ANNEXURES PAGE 131
ANNEXURES
HIGHLIGHTS I. Factsheets
II. Survey Tools III. Additional Tables

Interim Report National Annual Rural Sanitation Survey (NARSS), Round-2, 2018-2019
ANNEXURE - I: FACTSHEETS PAGE 132
ANNEXURE - I: FACTSHEETS
INDIA Factsheet- NARSS ROUND 2 (2018-19) Sample Size covered OVERALL ODF Non ODF
Number of Villages surveyed 6136 2891 3245 Number of households surveyed 92411 43735 48676 Number of Anganwadis surveyed 6082 2867 3215
Number of Schools surveyed 6002 2828 3174 A. Access to Toilet OVERALL (%) ODF (%) Non ODF (%) A1. Percentage of households having access to toilet facility 93.3 98.0 89.1 A2. Percentage of Anganwadis having access to toilet facility 91.3 98.9 84.4 A3. Percentage of Schools having access to toilet facility 98.9 99.8 98.1 B. Functionality of Toilet OVERALL (%) ODF (%) Non ODF (%) B1. Percentage of households having functional toilet 98.6 99.7 97.5 B2. Percentage of Anganwadis having functional toilets 97.7 99.8 95.3 B3. Percentage of Schools having functional toilets 98.5 99.8 97.3 C. Sanitary condition of Toilet OVERALL (%) ODF (%) Non ODF (%) C1. Percentage of households where toilets found in hygienic condition
95.0 99.5 90.5
C2. Percentage of Anganwadis where toilets found in hygienic condition
95.9 99.1 92.1
C3. Percentage of Schools where toilets found in hygienic condition
98.0 99.1 97.1
D. Disposal mechanism of human excreta from toilet OVERALL (%) ODF (%) Non ODF (%) D1. Percentage of household toilets with safe disposal mechanism
99.6 100.0 99.1
D2. Percentage of Anganwadis toilets with safe disposal mechanism
98.6 99.9 97.1
D3. Percentage of Schools toilets with safe disposal mechanism 99.2 99.9 98.6 E. Disposal mechanism of child excreta OVERALL (%) ODF (%) Non ODF (%) E1. Percentage of households practicing safe disposal of child faeces (less than 3 years)
75.4 95.4 59.9
F. Usage of Toilet OVERALL (%) ODF (%) Non ODF (%) F1. Percentage of individuals using toilet those having access to it 96.7 99.8 93.8 F2. Percentage of Anganwadis where toilets is being used 92.8 98.9 85.6 F3. Percentage of Schools where toilets are being used 97.6 99.6 95.8 G. Solid & liquid waste management (SLWM) OVERALL (%) ODF (%) Non ODF (%) G1. Percentage of household where solid waste is not visible 97.5 98.6 96.5 G2. Percentage of household where liquid waste / stagnant water is not visible
96.3 96.0 96.5
G3. Percentage of village with minimal level of littering 96.5 99.5 93.8 G4. Percentage of village with minimal level of water logging 96.7 99.7 94.0 H. Visible faecal matter in Public spaces OVERALL (%) ODF (%) Non ODF (%) H1. Percentage of the village where visible faeces not found in the area that were used for open defecation in the past
92.6 99.0 87.0

Interim Report National Annual Rural Sanitation Survey (NARSS), Round-2, 2018-2019
ANNEXURE - I: FACTSHEETS PAGE 133
ANDAMAN & NICOBAR ISLAND Fact Sheet- NARSS ROUND 2 (2018-19) Sample Size covered OVERALL ODF Non ODF
Number of Villages surveyed 26 26 0
Number of households surveyed 390 390 0
Number of Anganwadis surveyed 26 26 0
Number of Schools surveyed 26 26 0
A. Access to Toilet OVERALL (%) ODF (%) Non ODF (%)
A1. Percentage of households having access to toilet facility 99.2 99.2 0.0
A2. Percentage of Anganwadis having access to toilet facility 100.0 100.0 0.0
A3. Percentage of Schools having access to toilet facility 100.0 100.0 0.0
B. Functionality of Toilet OVERALL (%) ODF (%) Non ODF (%)
B1. Percentage of households having functional toilet 100.0 100.0 0.0
B2. Percentage of Anganwadis having functional toilets 100.0 100.0 0.0
B3. Percentage of Schools having functional toilets 100.0 100.0 0.0
C. Sanitary condition of Toilet OVERALL (%) ODF (%) Non ODF (%)
C1. Percentage of households where toilets found in hygienic condition
98.2 98.2 0.0
C2. Percentage of Anganwadis where toilets found in hygienic condition
100.0 100.0 0.0
C3. Percentage of Schools where toilets found in hygienic condition 100.0 100.0 0.0
D. Disposal mechanism of human excreta from toilet OVERALL (%) ODF (%) Non ODF (%)
D1. Percentage of household toilets with safe disposal mechanism 100.0 100.0 0.0
D2. Percentage of Anganwadis toilets with safe disposal mechanism 100.0 100.0 0.0
D3. Percentage of Schools toilets with safe disposal mechanism 100.0 100.0 0.0
E. Disposal mechanism of child excreta OVERALL (%) ODF (%) Non ODF (%)
E1. Percentage of households practicing safe disposal of child faeces (less than 3 years)
97.7 97.7 0.0
F. Usage of Toilet OVERALL (%) ODF (%) Non ODF (%)
F1. Percentage of individuals using toilet those having access to it 100.0 100.0 0.0
F2. Percentage of Anganwadis where toilets is being used 100.0 100.0 0.0
F3. Percentage of Schools where toilets are being used 96.2 96.2 0.0
G. Solid & liquid waste management (SLWM) OVERALL (%) ODF (%) Non ODF (%)
G1. Percentage of household where solid waste is not visible 99.0 99.0 0.0
G2. Percentage of household where liquid waste / stagnant water is not visible
99.5 99.5 0.0
G3. Percentage of village with minimal level of littering 100.0 100.0 0.0
G4. Percentage of village with minimal level of water logging 100.0 100.0 0.0
H. Visible faecal matter in Public spaces OVERALL (%) ODF (%) Non ODF (%)
H1. Percentage of the village where visible faeces not found in the area that were used for open defecation in the past
100.0 100.0 0.0

Interim Report National Annual Rural Sanitation Survey (NARSS), Round-2, 2018-2019
ANNEXURE - I: FACTSHEETS PAGE 134
ANDHRA PRADESH Fact Sheet- NARSS ROUND 2 (2018-19) Sample Size covered OVERALL ODF Non ODF
Number of Villages surveyed 271 182 89
Number of households surveyed 4065 2730 1335
Number of Anganwadis surveyed 271 182 89
Number of Schools surveyed 270 182 88
A. Access to Toilet OVERALL (%) ODF (%) Non ODF (%)
A1. Percentage of households having access to toilet facility 95.7 98.6 90.0
A2. Percentage of Anganwadis having access to toilet facility 87.8 98.9 65.2
A3. Percentage of Schools having access to toilet facility 96.3 100.0 88.6
B. Functionality of Toilet OVERALL (%) ODF (%) Non ODF (%)
B1. Percentage of households having functional toilet 99.3 99.8 98.3
B2. Percentage of Anganwadis having functional toilets 97.8 99.3 92.9
B3. Percentage of Schools having functional toilets 96.3 99.4 87.5
C. Sanitary condition of Toilet OVERALL (%) ODF (%) Non ODF (%)
C1. Percentage of households where toilets found in hygienic condition
99.0 99.8 97.1
C2. Percentage of Anganwadis where toilets found in hygienic condition
87.0 98.6 47.6
C3. Percentage of Schools where toilets found in hygienic condition 95.9 100.0 84.4
D. Disposal mechanism of human excreta from toilet OVERALL (%) ODF (%) Non ODF (%)
D1. Percentage of household toilets with safe disposal mechanism 99.6 99.9 98.8
D2. Percentage of Anganwadis toilets with safe disposal mechanism 98.4 99.3 95.2
D3. Percentage of Schools toilets with safe disposal mechanism 98.8 100.0 95.3
E. Disposal mechanism of child excreta OVERALL (%) ODF (%) Non ODF (%)
E1. Percentage of households practicing safe disposal of child faeces (less than 3 years)
92.2 98.7 61.0
F. Usage of Toilet OVERALL (%) ODF (%) Non ODF (%)
F1. Percentage of individuals using toilet those having access to it 96.8 99.1 91.8
F2. Percentage of Anganwadis where toilets is being used 94.1 98.6 78.6
F3. Percentage of Schools where toilets are being used 96.3 100.0 85.9
G. Solid & liquid waste management (SLWM) OVERALL (%) ODF (%) Non ODF (%)
G1. Percentage of household where solid waste is not visible 95.2 95.7 94.2
G2. Percentage of household where liquid waste / stagnant water is not visible
83.4 78.0 94.5
G3. Percentage of village with minimal level of littering 89.7 97.3 74.2
G4. Percentage of village with minimal level of water logging 93.0 97.8 83.1
H. Visible faecal matter in Public spaces OVERALL (%) ODF (%) Non ODF (%)
H1. Percentage of the village where visible faeces not found in the area that were used for open defecation in the past
88.2 97.8 68.5

Interim Report National Annual Rural Sanitation Survey (NARSS), Round-2, 2018-2019
ANNEXURE - I: FACTSHEETS PAGE 135
ARUNACHAL PRADESH Fact Sheet- NARSS ROUND 2 (2018-19) Sample Size covered OVERALL ODF Non ODF
Number of Villages surveyed 52 26 26
Number of households surveyed 780 390 390
Number of Anganwadis surveyed 50 24 26
Number of Schools surveyed 40 20 20
A. Access to Toilet OVERALL (%) ODF (%) Non ODF (%)
A1. Percentage of households having access to toilet facility 99.6 100.0 99.2
A2. Percentage of Anganwadis having access to toilet facility 100.0 100.0 100.0
A3. Percentage of Schools having access to toilet facility 100.0 100.0 100.0
B. Functionality of Toilet OVERALL (%) ODF (%) Non ODF (%)
B1. Percentage of households having functional toilet 99.7 100.0 99.5
B2. Percentage of Anganwadis having functional toilets 100.0 100.0 100.0
B3. Percentage of Schools having functional toilets 100.0 100.0 100.0
C. Sanitary condition of Toilet OVERALL (%) ODF (%) Non ODF (%)
C1. Percentage of households where toilets found in hygienic condition
98.5 99.7 97.1
C2. Percentage of Anganwadis where toilets found in hygienic condition
100.0 100.0 100.0
C3. Percentage of Schools where toilets found in hygienic condition 100.0 100.0 100.0
D. Disposal mechanism of human excreta from toilet OVERALL (%) ODF (%) Non ODF (%)
D1. Percentage of household toilets with safe disposal mechanism 99.7 100.0 99.5
D2. Percentage of Anganwadis toilets with safe disposal mechanism 100.0 100.0 100.0
D3. Percentage of Schools toilets with safe disposal mechanism 100.0 100.0 100.0
E. Disposal mechanism of child excreta OVERALL (%) ODF (%) Non ODF (%)
E1. Percentage of households practicing safe disposal of child faeces (less than 3 years)
83.8 94.5 71.3
F. Usage of Toilet OVERALL (%) ODF (%) Non ODF (%)
F1. Percentage of individuals using toilet those having access to it 99.9 99.9 100.0
F2. Percentage of Anganwadis where toilets is being used 100.0 100.0 100.0
F3. Percentage of Schools where toilets are being used 100.0 100.0 100.0
G. Solid & liquid waste management (SLWM) OVERALL (%) ODF (%) Non ODF (%)
G1. Percentage of household where solid waste is not visible 98.7 100.0 97.5
G2. Percentage of household where liquid waste / stagnant water is not visible
99.4 99.2 99.5
G3. Percentage of village with minimal level of littering 88.5 100.0 76.9
G4. Percentage of village with minimal level of water logging 94.2 100.0 88.5
H. Visible faecal matter in Public spaces OVERALL (%) ODF (%) Non ODF (%)
H1. Percentage of the village where visible faeces not found in the area that were used for open defecation in the past
100.0 100.0 100.0
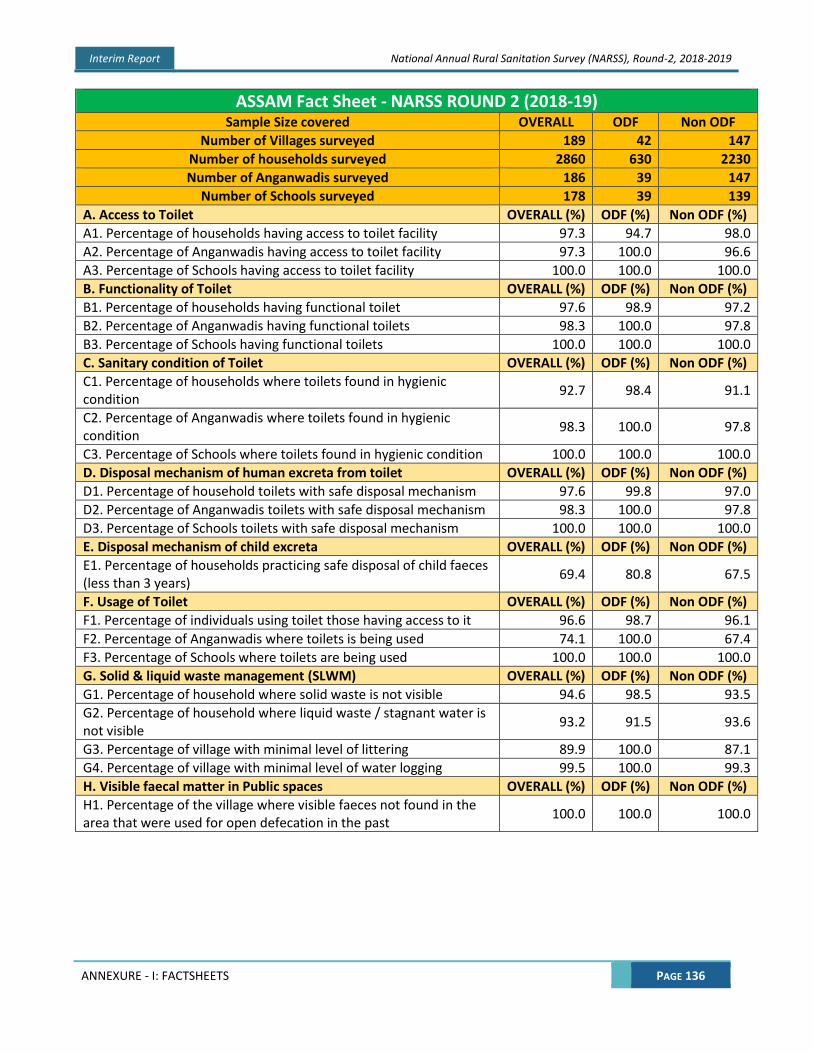
Interim Report National Annual Rural Sanitation Survey (NARSS), Round-2, 2018-2019
ANNEXURE - I: FACTSHEETS PAGE 136
ASSAM Fact Sheet - NARSS ROUND 2 (2018-19) Sample Size covered OVERALL ODF Non ODF
Number of Villages surveyed 189 42 147
Number of households surveyed 2860 630 2230
Number of Anganwadis surveyed 186 39 147
Number of Schools surveyed 178 39 139
A. Access to Toilet OVERALL (%) ODF (%) Non ODF (%)
A1. Percentage of households having access to toilet facility 97.3 94.7 98.0
A2. Percentage of Anganwadis having access to toilet facility 97.3 100.0 96.6
A3. Percentage of Schools having access to toilet facility 100.0 100.0 100.0
B. Functionality of Toilet OVERALL (%) ODF (%) Non ODF (%)
B1. Percentage of households having functional toilet 97.6 98.9 97.2
B2. Percentage of Anganwadis having functional toilets 98.3 100.0 97.8
B3. Percentage of Schools having functional toilets 100.0 100.0 100.0
C. Sanitary condition of Toilet OVERALL (%) ODF (%) Non ODF (%)
C1. Percentage of households where toilets found in hygienic condition
92.7 98.4 91.1
C2. Percentage of Anganwadis where toilets found in hygienic condition
98.3 100.0 97.8
C3. Percentage of Schools where toilets found in hygienic condition 100.0 100.0 100.0
D. Disposal mechanism of human excreta from toilet OVERALL (%) ODF (%) Non ODF (%)
D1. Percentage of household toilets with safe disposal mechanism 97.6 99.8 97.0
D2. Percentage of Anganwadis toilets with safe disposal mechanism 98.3 100.0 97.8
D3. Percentage of Schools toilets with safe disposal mechanism 100.0 100.0 100.0
E. Disposal mechanism of child excreta OVERALL (%) ODF (%) Non ODF (%)
E1. Percentage of households practicing safe disposal of child faeces (less than 3 years)
69.4 80.8 67.5
F. Usage of Toilet OVERALL (%) ODF (%) Non ODF (%)
F1. Percentage of individuals using toilet those having access to it 96.6 98.7 96.1
F2. Percentage of Anganwadis where toilets is being used 74.1 100.0 67.4
F3. Percentage of Schools where toilets are being used 100.0 100.0 100.0
G. Solid & liquid waste management (SLWM) OVERALL (%) ODF (%) Non ODF (%)
G1. Percentage of household where solid waste is not visible 94.6 98.5 93.5
G2. Percentage of household where liquid waste / stagnant water is not visible
93.2 91.5 93.6
G3. Percentage of village with minimal level of littering 89.9 100.0 87.1
G4. Percentage of village with minimal level of water logging 99.5 100.0 99.3
H. Visible faecal matter in Public spaces OVERALL (%) ODF (%) Non ODF (%)
H1. Percentage of the village where visible faeces not found in the area that were used for open defecation in the past
100.0 100.0 100.0

Interim Report National Annual Rural Sanitation Survey (NARSS), Round-2, 2018-2019
ANNEXURE - I: FACTSHEETS PAGE 137
BIHAR Fact Sheet- NARSS ROUND 2 (2018-19) Sample Size covered OVERALL ODF Non ODF
Number of Villages surveyed 566 31 535
Number of households surveyed 8476 465 8011
Number of Anganwadis surveyed 553 31 522
Number of Schools surveyed 555 31 524
A. Access to Toilet OVERALL (%) ODF (%) Non ODF (%)
A1. Percentage of households having access to toilet facility 73.6 85.9 72.9
A2. Percentage of Anganwadis having access to toilet facility 64.4 74.2 63.8
A3. Percentage of Schools having access to toilet facility 96.0 96.8 96.0
B. Functionality of Toilet OVERALL (%) ODF (%) Non ODF (%)
B1. Percentage of households having functional toilet 99.0 99.7 99.0
B2. Percentage of Anganwadis having functional toilets 96.9 100.0 96.7
B3. Percentage of Schools having functional toilets 97.4 96.7 97.4
C. Sanitary condition of Toilet OVERALL (%) ODF (%) Non ODF (%)
C1. Percentage of households where toilets found in hygienic condition
95.2 99.3 95.0
C2. Percentage of Anganwadis where toilets found in hygienic condition
96.9 100.0 96.7
C3. Percentage of Schools where toilets found in hygienic condition 97.4 96.7 97.4
D. Disposal mechanism of human excreta from toilet OVERALL (%) ODF (%) Non ODF (%)
D1. Percentage of household toilets with safe disposal mechanism 99.2 100.0 99.1
D2. Percentage of Anganwadis toilets with safe disposal mechanism 96.9 100.0 96.7
D3. Percentage of Schools toilets with safe disposal mechanism 97.4 96.7 97.4
E. Disposal mechanism of child excreta OVERALL (%) ODF (%) Non ODF (%)
E1. Percentage of households practicing safe disposal of child faeces (less than 3 years)
42.1 58.0 41.4
F. Usage of Toilet OVERALL (%) ODF (%) Non ODF (%)
F1. Percentage of individuals using toilet those having access to it 92.3 99.7 91.8
F2. Percentage of Anganwadis where toilets is being used 90.6 100.0 90.1
F3. Percentage of Schools where toilets are being used 98.3 96.7 98.4
G. Solid & liquid waste management (SLWM) OVERALL (%) ODF (%) Non ODF (%)
G1. Percentage of household where solid waste is not visible 94.7 99.5 94.5
G2. Percentage of household where liquid waste / stagnant water is not visible
93.3 93.9 93.3
G3. Percentage of village with minimal level of littering 89.9 96.8 89.5
G4. Percentage of village with minimal level of water logging 91.5 96.8 91.2
H. Visible faecal matter in Public spaces OVERALL (%) ODF (%) Non ODF (%)
H1. Percentage of the village where visible faeces not found in the area that were used for open defecation in the past
73.7 87.1 72.9

Interim Report National Annual Rural Sanitation Survey (NARSS), Round-2, 2018-2019
ANNEXURE - I: FACTSHEETS PAGE 138
CHATTISHGARH Fact Sheet- NARSS ROUND 2 (2018-19) Sample Size covered OVERALL ODF Non ODF
Number of Villages surveyed 184 184 0
Number of households surveyed 2760 2760 0
Number of Anganwadis surveyed 183 183 0
Number of Schools surveyed 184 184 0
A. Access to Toilet OVERALL (%) ODF (%) Non ODF (%)
A1. Percentage of households having access to toilet facility 98.9 98.9 0.0
A2. Percentage of Anganwadis having access to toilet facility 100.0 100.0 0.0
A3. Percentage of Schools having access to toilet facility 99.5 99.5 0.0
B. Functionality of Toilet OVERALL (%) ODF (%) Non ODF (%)
B1. Percentage of households having functional toilet 99.9 99.9 0.0
B2. Percentage of Anganwadis having functional toilets 100.0 100.0 0.0
B3. Percentage of Schools having functional toilets 100.0 100.0 0.0
C. Sanitary condition of Toilet OVERALL (%) ODF (%) Non ODF (%)
C1. Percentage of households where toilets found in hygienic condition
99.9 99.9 0.0
C2. Percentage of Anganwadis where toilets found in hygienic condition
100.0 100.0 0.0
C3. Percentage of Schools where toilets found in hygienic condition 100.0 100.0 0.0
D. Disposal mechanism of human excreta from toilet OVERALL (%) ODF (%) Non ODF (%)
D1. Percentage of household toilets with safe disposal mechanism 100.0 100.0 0.0
D2. Percentage of Anganwadis toilets with safe disposal mechanism 100.0 100.0 0.0
D3. Percentage of Schools toilets with safe disposal mechanism 100.0 100.0 0.0
E. Disposal mechanism of child excreta OVERALL (%) ODF (%) Non ODF (%)
E1. Percentage of households practicing safe disposal of child faeces (less than 3 years)
97.5 97.5 0.0
F. Usage of Toilet OVERALL (%) ODF (%) Non ODF (%)
F1. Percentage of individuals using toilet those having access to it 99.8 99.8 0.0
F2. Percentage of Anganwadis where toilets is being used 98.8 98.8 0.0
F3. Percentage of Schools where toilets are being used 99.5 99.5 0.0
G. Solid & liquid waste management (SLWM) OVERALL (%) ODF (%) Non ODF (%)
G1. Percentage of household where solid waste is not visible 99.8 99.8 0.0
G2. Percentage of household where liquid waste / stagnant water is not visible
99.4 99.4 0.0
G3. Percentage of village with minimal level of littering 100.0 100.0 0.0
G4. Percentage of village with minimal level of water logging 100.0 100.0 0.0
H. Visible faecal matter in Public spaces OVERALL (%) ODF (%) Non ODF (%)
H1. Percentage of the village where visible faeces not found in the area that were used for open defecation in the past
100.0 100.0 0.0

Interim Report National Annual Rural Sanitation Survey (NARSS), Round-2, 2018-2019
ANNEXURE - I: FACTSHEETS PAGE 139
DADRA & NAGAR HAVELI Fact Sheet- NARSS ROUND 2 (2018-19) Sample Size covered OVERALL ODF Non ODF
Number of Villages surveyed 26 26 0
Number of households surveyed 390 390 0
Number of Anganwadis surveyed 26 26 0
Number of Schools surveyed 26 26 0
A. Access to Toilet OVERALL (%) ODF (%) Non ODF (%)
A1. Percentage of households having access to toilet facility 100.0 100.0 0.0
A2. Percentage of Anganwadis having access to toilet facility 100.0 100.0 0.0
A3. Percentage of Schools having access to toilet facility 100.0 100.0 0.0
B. Functionality of Toilet OVERALL (%) ODF (%) Non ODF (%)
B1. Percentage of households having functional toilet 100.0 100.0 0.0
B2. Percentage of Anganwadis having functional toilets 100.0 100.0 0.0
B3. Percentage of Schools having functional toilets 100.0 100.0 0.0
C. Sanitary condition of Toilet OVERALL (%) ODF (%) Non ODF (%)
C1. Percentage of households where toilets found in hygienic condition
100.0 100.0 0.0
C2. Percentage of Anganwadis where toilets found in hygienic condition
100.0 100.0 0.0
C3. Percentage of Schools where toilets found in hygienic condition 100.0 100.0 0.0
D. Disposal mechanism of human excreta from toilet OVERALL (%) ODF (%) Non ODF (%)
D1. Percentage of household toilets with safe disposal mechanism 100.0 100.0 0.0
D2. Percentage of Anganwadis toilets with safe disposal mechanism 100.0 100.0 0.0
D3. Percentage of Schools toilets with safe disposal mechanism 100.0 100.0 0.0
E. Disposal mechanism of child excreta OVERALL (%) ODF (%) Non ODF (%)
E1. Percentage of households practicing safe disposal of child faeces (less than 3 years)
100.0 100.0 0.0
F. Usage of Toilet OVERALL (%) ODF (%) Non ODF (%)
F1. Percentage of individuals using toilet those having access to it 100.0 100.0 0.0
F2. Percentage of Anganwadis where toilets is being used 100.0 100.0 0.0
F3. Percentage of Schools where toilets are being used 100.0 100.0 0.0
G. Solid & liquid waste management (SLWM) OVERALL (%) ODF (%) Non ODF (%)
G1. Percentage of household where solid waste is not visible 100.0 100.0 0.0
G2. Percentage of household where liquid waste / stagnant water is not visible
98.9 98.9 0.0
G3. Percentage of village with minimal level of littering 100.0 100.0 0.0
G4. Percentage of village with minimal level of water logging 100.0 100.0 0.0
H. Visible faecal matter in Public spaces OVERALL (%) ODF (%) Non ODF (%)
H1. Percentage of the village where visible faeces not found in the area that were used for open defecation in the past
100.0 100.0 0.0

Interim Report National Annual Rural Sanitation Survey (NARSS), Round-2, 2018-2019
ANNEXURE - I: FACTSHEETS PAGE 140
GOA Fact Sheet- NARSS ROUND 2 (2018-19) Sample Size covered OVERALL ODF Non ODF
Number of Villages surveyed 26 0 26
Number of households surveyed 390 0 390
Number of Anganwadis surveyed 26 0 26
Number of Schools surveyed 26 0 26
A. Access to Toilet OVERALL (%) ODF (%) Non ODF (%)
A1. Percentage of households having access to toilet facility 98.1 0.0 98.1
A2. Percentage of Anganwadis having access to toilet facility 100.0 0.0 100.0
A3. Percentage of Schools having access to toilet facility 100.0 0.0 100.0
B. Functionality of Toilet OVERALL (%) ODF (%) Non ODF (%)
B1. Percentage of households having functional toilet 97.3 0.0 97.3
B2. Percentage of Anganwadis having functional toilets 95.8 0.0 95.8
B3. Percentage of Schools having functional toilets 95.0 0.0 95.0
C. Sanitary condition of Toilet OVERALL (%) ODF (%) Non ODF (%)
C1. Percentage of households where toilets found in hygienic condition
85.9 0.0 85.9
C2. Percentage of Anganwadis where toilets found in hygienic condition
95.8 0.0 95.8
C3. Percentage of Schools where toilets found in hygienic condition 95.0 0.0 95.0
D. Disposal mechanism of human excreta from toilet OVERALL (%) ODF (%) Non ODF (%)
D1. Percentage of household toilets with safe disposal mechanism 99.7 0.0 99.7
D2. Percentage of Anganwadis toilets with safe disposal mechanism 95.8 0.0 95.8
D3. Percentage of Schools toilets with safe disposal mechanism 95.0 0.0 95.0
E. Disposal mechanism of child excreta OVERALL (%) ODF (%) Non ODF (%)
E1. Percentage of households practicing safe disposal of child faeces (less than 3 years)
74.0 0.0 74.0
F. Usage of Toilet OVERALL (%) ODF (%) Non ODF (%)
F1. Percentage of individuals using toilet those having access to it 100.0 0.0 100.0
F2. Percentage of Anganwadis where toilets is being used 91.7 0.0 91.7
F3. Percentage of Schools where toilets are being used 95.0 0.0 95.0
G. Solid & liquid waste management (SLWM) OVERALL (%) ODF (%) Non ODF (%)
G1. Percentage of household where solid waste is not visible 75.8 0.0 75.8
G2. Percentage of household where liquid waste / stagnant water is not visible
82.0 0.0 82.0
G3. Percentage of village with minimal level of littering 100.0 0.0 100.0
G4. Percentage of village with minimal level of water logging 100.0 0.0 100.0
H. Visible faecal matter in Public spaces OVERALL (%) ODF (%) Non ODF (%)
H1. Percentage of the village where visible faeces not found in the area that were used for open defecation in the past
73.1 0.0 73.1

Interim Report National Annual Rural Sanitation Survey (NARSS), Round-2, 2018-2019
ANNEXURE - I: FACTSHEETS PAGE 141
GUJARAT Fact Sheet- NARSS ROUND 2 (2018-19) Sample Size covered OVERALL ODF Non ODF
Number of Villages surveyed 194 194 0
Number of households surveyed 2910 2910 0
Number of Anganwadis surveyed 194 194 0
Number of Schools surveyed 194 194 0
A. Access to Toilet OVERALL (%) ODF (%) Non ODF (%)
A1. Percentage of households having access to toilet facility 98.8 98.8 0.0
A2. Percentage of Anganwadis having access to toilet facility 100.0 100.0 0.0
A3. Percentage of Schools having access to toilet facility 100.0 100.0 0.0
B. Functionality of Toilet OVERALL (%) ODF (%) Non ODF (%)
B1. Percentage of households having functional toilet 100.0 100.0 0.0
B2. Percentage of Anganwadis having functional toilets 100.0 100.0 0.0
B3. Percentage of Schools having functional toilets 100.0 100.0 0.0
C. Sanitary condition of Toilet OVERALL (%) ODF (%) Non ODF (%)
C1. Percentage of households where toilets found in hygienic condition
100.0 100.0 0.0
C2. Percentage of Anganwadis where toilets found in hygienic condition
100.0 100.0 0.0
C3. Percentage of Schools where toilets found in hygienic condition 100.0 100.0 0.0
D. Disposal mechanism of human excreta from toilet OVERALL (%) ODF (%) Non ODF (%)
D1. Percentage of household toilets with safe disposal mechanism 100.0 100.0 0.0
D2. Percentage of Anganwadis toilets with safe disposal mechanism 100.0 100.0 0.0
D3. Percentage of Schools toilets with safe disposal mechanism 100.0 100.0 0.0
E. Disposal mechanism of child excreta OVERALL (%) ODF (%) Non ODF (%)
E1. Percentage of households practicing safe disposal of child faeces (less than 3 years)
99.0 99.0 0.0
F. Usage of Toilet OVERALL (%) ODF (%) Non ODF (%)
F1. Percentage of individuals using toilet those having access to it 99.9 99.9 0.0
F2. Percentage of Anganwadis where toilets is being used 100.0 100.0 0.0
F3. Percentage of Schools where toilets are being used 100.0 100.0 0.0
G. Solid & liquid waste management (SLWM) OVERALL (%) ODF (%) Non ODF (%)
G1. Percentage of household where solid waste is not visible 99.9 99.9 0.0
G2. Percentage of household where liquid waste / stagnant water is not visible
99.6 99.6 0.0
G3. Percentage of village with minimal level of littering 100.0 100.0 0.0
G4. Percentage of village with minimal level of water logging 100.0 100.0 0.0
H. Visible faecal matter in Public spaces OVERALL (%) ODF (%) Non ODF (%)
H1. Percentage of the village where visible faeces not found in the area that were used for open defecation in the past
99.5 99.5 0.0

Interim Report National Annual Rural Sanitation Survey (NARSS), Round-2, 2018-2019
ANNEXURE - I: FACTSHEETS PAGE 142
HARYANA Fact Sheet- NARSS ROUND 2 (2018-19) Sample Size covered OVERALL ODF Non ODF
Number of Villages surveyed 102 102 0
Number of households surveyed 1530 1530 0
Number of Anganwadis surveyed 102 102 0
Number of Schools surveyed 102 102 0
A. Access to Toilet OVERALL (%) ODF (%) Non ODF (%)
A1. Percentage of households having access to toilet facility 99.6 99.6 0.0
A2. Percentage of Anganwadis having access to toilet facility 100.0 100.0 0.0
A3. Percentage of Schools having access to toilet facility 100.0 100.0 0.0
B. Functionality of Toilet OVERALL (%) ODF (%) Non ODF (%)
B1. Percentage of households having functional toilet 100.0 100.0 0.0
B2. Percentage of Anganwadis having functional toilets 100.0 100.0 0.0
B3. Percentage of Schools having functional toilets 100.0 100.0 0.0
C. Sanitary condition of Toilet OVERALL (%) ODF (%) Non ODF (%)
C1. Percentage of households where toilets found in hygienic condition
100.0 100.0 0.0
C2. Percentage of Anganwadis where toilets found in hygienic condition
100.0 100.0 0.0
C3. Percentage of Schools where toilets found in hygienic condition 100.0 100.0 0.0
D. Disposal mechanism of human excreta from toilet OVERALL (%) ODF (%) Non ODF (%)
D1. Percentage of household toilets with safe disposal mechanism 100.0 100.0 0.0
D2. Percentage of Anganwadis toilets with safe disposal mechanism 100.0 100.0 0.0
D3. Percentage of Schools toilets with safe disposal mechanism 100.0 100.0 0.0
E. Disposal mechanism of child excreta OVERALL (%) ODF (%) Non ODF (%)
E1. Percentage of households practicing safe disposal of child faeces (less than 3 years)
98.9 98.9 0.0
F. Usage of Toilet OVERALL (%) ODF (%) Non ODF (%)
F1. Percentage of individuals using toilet those having access to it 100.0 100.0 0.0
F2. Percentage of Anganwadis where toilets is being used 100.0 100.0 0.0
F3. Percentage of Schools where toilets are being used 100.0 100.0 0.0
G. Solid & liquid waste management (SLWM) OVERALL (%) ODF (%) Non ODF (%)
G1. Percentage of household where solid waste is not visible 100.0 100.0 0.0
G2. Percentage of household where liquid waste / stagnant water is not visible
99.6 99.6 0.0
G3. Percentage of village with minimal level of littering 100.0 100.0 0.0
G4. Percentage of village with minimal level of water logging 100.0 100.0 0.0
H. Visible faecal matter in Public spaces OVERALL (%) ODF (%) Non ODF (%)
H1. Percentage of the village where visible faeces not found in the area that were used for open defecation in the past
99.0 99.0 0.0

Interim Report National Annual Rural Sanitation Survey (NARSS), Round-2, 2018-2019
ANNEXURE - I: FACTSHEETS PAGE 143
HIMACHAL PRADESH Fact Sheet- NARSS ROUND 2 (2018-19) Sample Size covered OVERALL ODF Non ODF
Number of Villages surveyed 55 55 0
Number of households surveyed 825 825 0
Number of Anganwadis surveyed 54 54 0
Number of Schools surveyed 42 42 0
A. Access to Toilet OVERALL (%) ODF (%) Non ODF (%)
A1. Percentage of households having access to toilet facility 98.9 98.9 0.0
A2. Percentage of Anganwadis having access to toilet facility 100.0 100.0 0.0
A3. Percentage of Schools having access to toilet facility 100.0 100.0 0.0
B. Functionality of Toilet OVERALL (%) ODF (%) Non ODF (%)
B1. Percentage of households having functional toilet 99.7 99.7 0.0
B2. Percentage of Anganwadis having functional toilets 100.0 100.0 0.0
B3. Percentage of Schools having functional toilets 100.0 100.0 0.0
C. Sanitary condition of Toilet OVERALL (%) ODF (%) Non ODF (%)
C1. Percentage of households where toilets found in hygienic condition
99.9 99.9 0.0
C2. Percentage of Anganwadis where toilets found in hygienic condition
100.0 100.0 0.0
C3. Percentage of Schools where toilets found in hygienic condition 100.0 100.0 0.0
D. Disposal mechanism of human excreta from toilet OVERALL (%) ODF (%) Non ODF (%)
D1. Percentage of household toilets with safe disposal mechanism 100.0 100.0 0.0
D2. Percentage of Anganwadis toilets with safe disposal mechanism 100.0 100.0 0.0
D3. Percentage of Schools toilets with safe disposal mechanism 100.0 100.0 0.0
E. Disposal mechanism of child excreta OVERALL (%) ODF (%) Non ODF (%)
E1. Percentage of households practicing safe disposal of child faeces (less than 3 years)
100.0 100.0 0.0
F. Usage of Toilet OVERALL (%) ODF (%) Non ODF (%)
F1. Percentage of individuals using toilet those having access to it 99.8 99.8 0.0
F2. Percentage of Anganwadis where toilets is being used 96.0 96.0 0.0
F3. Percentage of Schools where toilets are being used 100.0 100.0 0.0
G. Solid & liquid waste management (SLWM) OVERALL (%) ODF (%) Non ODF (%)
G1. Percentage of household where solid waste is not visible 100.0 100.0 0.0
G2. Percentage of household where liquid waste / stagnant water is not visible
99.5 99.5 0.0
G3. Percentage of village with minimal level of littering 100.0 100.0 0.0
G4. Percentage of village with minimal level of water logging 100.0 100.0 0.0
H. Visible faecal matter in Public spaces OVERALL (%) ODF (%) Non ODF (%)
H1. Percentage of the village where visible faeces not found in the area that were used for open defecation in the past
100.0 100.0 0.0

Interim Report National Annual Rural Sanitation Survey (NARSS), Round-2, 2018-2019
ANNEXURE - I: FACTSHEETS PAGE 144
JAMMU & KASHMIR Fact Sheet- NARSS R2 (2018-19) Sample Size covered OVERALL ODF Non ODF
Number of Villages surveyed 80 26 54
Number of households surveyed 1197 390 807
Number of Anganwadis surveyed 78 25 53
Number of Schools surveyed 72 20 52
A. Access to Toilet OVERALL (%) ODF (%) Non ODF (%)
A1. Percentage of households having access to toilet facility 85.3 93.6 81.3
A2. Percentage of Anganwadis having access to toilet facility 91.0 100.0 86.8
A3. Percentage of Schools having access to toilet facility 100.0 100.0 100.0
B. Functionality of Toilet OVERALL (%) ODF (%) Non ODF (%)
B1. Percentage of households having functional toilet 99.3 100.0 98.9
B2. Percentage of Anganwadis having functional toilets 100.0 100.0 100.0
B3. Percentage of Schools having functional toilets 100.0 100.0 100.0
C. Sanitary condition of Toilet OVERALL (%) ODF (%) Non ODF (%)
C1. Percentage of households where toilets found in hygienic condition
98.5 100.0 97.6
C2. Percentage of Anganwadis where toilets found in hygienic condition
100.0 100.0 100.0
C3. Percentage of Schools where toilets found in hygienic condition 100.0 100.0 100.0
D. Disposal mechanism of human excreta from toilet OVERALL (%) ODF (%) Non ODF (%)
D1. Percentage of household toilets with safe disposal mechanism 99.5 100.0 99.2
D2. Percentage of Anganwadis toilets with safe disposal mechanism 100.0 100.0 100.0
D3. Percentage of Schools toilets with safe disposal mechanism 100.0 100.0 100.0
E. Disposal mechanism of child excreta OVERALL (%) ODF (%) Non ODF (%)
E1. Percentage of households practicing safe disposal of child faeces (less than 3 years)
78.7 95.8 71.8
F. Usage of Toilet OVERALL (%) ODF (%) Non ODF (%)
F1. Percentage of individuals using toilet those having access to it 98.6 100.0 97.7
F2. Percentage of Anganwadis where toilets is being used 92.6 95.2 90.9
F3. Percentage of Schools where toilets are being used 100.0 100.0 100.0
G. Solid & liquid waste management (SLWM) OVERALL (%) ODF (%) Non ODF (%)
G1. Percentage of household where solid waste is not visible 99.5 100.0 99.3
G2. Percentage of household where liquid waste / stagnant water is not visible
99.2 99.2 99.2
G3. Percentage of village with minimal level of littering 98.7 100.0 98.1
G4. Percentage of village with minimal level of water logging 98.7 100.0 98.1
H. Visible faecal matter in Public spaces OVERALL (%) ODF (%) Non ODF (%)
H1. Percentage of the village where visible faeces not found in the area that were used for open defecation in the past
97.5 96.2 98.1

Interim Report National Annual Rural Sanitation Survey (NARSS), Round-2, 2018-2019
ANNEXURE - I: FACTSHEETS PAGE 145
JHARKHAND Fact Sheet- NARSS ROUND 2 (2018-19) Sample Size covered OVERALL ODF Non ODF
Number of Villages surveyed 152 40 112
Number of households surveyed 2278 600 1678
Number of Anganwadis surveyed 148 40 108
Number of Schools surveyed 142 36 106
A. Access to Toilet TOTAL (%) ODF (%) Non ODF (%)
A1. Percentage of households having access to toilet facility 84.7 89.9 82.8
A2. Percentage of Anganwadis having access to toilet facility 79.1 92.5 74.1
A3. Percentage of Schools having access to toilet facility 99.3 97.2 100.0
B. Functionality of Toilet TOTAL (%) ODF (%) Non ODF (%)
B1. Percentage of households having functional toilet 96.4 93.9 97.4
B2. Percentage of Anganwadis having functional toilets 96.6 100.0 94.7
B3. Percentage of Schools having functional toilets 100.0 100.0 100.0
C. Sanitary condition of Toilet TOTAL (%) ODF (%) Non ODF (%)
C1. Percentage of households where toilets found in hygienic condition
84.4 94.1 80.5
C2. Percentage of Anganwadis where toilets found in hygienic condition
96.6 100.0 94.7
C3. Percentage of Schools where toilets found in hygienic condition 100.0 100.0 100.0
D. Disposal mechanism of human excreta from toilet TOTAL (%) ODF (%) Non ODF (%)
D1. Percentage of household toilets with safe disposal mechanism 98.5 100.0 98.0
D2. Percentage of Anganwadis toilets with safe disposal mechanism 96.6 100.0 94.7
D3. Percentage of Schools toilets with safe disposal mechanism 100.0 100.0 100.0
E. Disposal mechanism of child excreta TOTAL (%) ODF (%) Non ODF (%)
E1. Percentage of households practicing safe disposal of child faeces (less than 3 years)
54.5 79.2 44.2
F. Usage of Toilet OVERALL (%) ODF (%) Non ODF (%)
F1. Percentage of individuals using toilet those having access to it 90.4 99.6 86.9
F2. Percentage of Anganwadis where toilets is being used 82.8 96.7 75.4
F3. Percentage of Schools where toilets are being used 100.0 100.0 100.0
G. Solid & liquid waste management (SLWM) OVERALL (%) ODF (%) Non ODF (%)
G1. Percentage of household where solid waste is not visible 96.5 99.4 95.5
G2. Percentage of household where liquid waste / stagnant water is not visible
97.2 97.3 97.1
G3. Percentage of village with minimal level of littering 96.7 100.0 95.5
G4. Percentage of village with minimal level of water logging 96.1 100.0 94.6
H. Visible faecal matter in Public spaces OVERALL (%) ODF (%) Non ODF (%)
H1. Percentage of the village where visible faeces not found in the area that were used for open defecation in the past
99.3 97.5 100.0

Interim Report National Annual Rural Sanitation Survey (NARSS), Round-2, 2018-2019
ANNEXURE - I: FACTSHEETS PAGE 146
KARNATAKA Fact Sheet- NARSS R2 (2018-19) Sample Size covered OVERALL ODF Non ODF
Number of Villages surveyed 268 173 95
Number of households surveyed 4047 2625 1422
Number of Anganwadis surveyed 265 171 94
Number of Schools surveyed 266 172 94
A. Access to Toilet OVERALL (%) ODF (%) Non ODF (%)
A1. Percentage of households having access to toilet facility 95.4 97.7 91.2
A2. Percentage of Anganwadis having access to toilet facility 88.3 98.8 69.1
A3. Percentage of Schools having access to toilet facility 98.9 100.0 96.8
B. Functionality of Toilet OVERALL (%) ODF (%) Non ODF (%)
B1. Percentage of households having functional toilet 99.5 100.0 98.6
B2. Percentage of Anganwadis having functional toilets 90.6 99.2 70.4
B3. Percentage of Schools having functional toilets 94.6 99.4 82.9
C. Sanitary condition of Toilet OVERALL (%) ODF (%) Non ODF (%)
C1. Percentage of households where toilets found in hygienic condition
92.7 98.0 82.1
C2. Percentage of Anganwadis where toilets found in hygienic condition
86.2 97.6 59.3
C3. Percentage of Schools where toilets found in hygienic condition 90.8 96.4 77.1
D. Disposal mechanism of human excreta from toilet OVERALL (%) ODF (%) Non ODF (%)
D1. Percentage of household toilets with safe disposal mechanism 100.0 100.0 100.0
D2. Percentage of Anganwadis toilets with safe disposal mechanism 92.8 99.2 77.8
D3. Percentage of Schools toilets with safe disposal mechanism 96.2 100.0 87.1
E. Disposal mechanism of child excreta OVERALL (%) ODF (%) Non ODF (%)
E1. Percentage of households practicing safe disposal of child faeces (less than 3 years)
76.5 97.1 45.6
F. Usage of Toilet OVERALL (%) ODF (%) Non ODF (%)
F1. Percentage of individuals using toilet those having access to it 95.8 99.8 88.0
F2. Percentage of Anganwadis where toilets is being used 80.7 97.6 40.7
F3. Percentage of Schools where toilets are being used 83.7 97.6 50.0
G. Solid & liquid waste management (SLWM) OVERALL (%) ODF (%) Non ODF (%)
G1. Percentage of household where solid waste is not visible 87.5 85.0 92.1
G2. Percentage of household where liquid waste / stagnant water is not visible
86.2 83.1 91.8
G3. Percentage of village with minimal level of littering 95.9 99.4 89.5
G4. Percentage of village with minimal level of water logging 93.7 99.4 83.2
H. Visible faecal matter in Public spaces OVERALL (%) ODF (%) Non ODF (%)
H1. Percentage of the village where visible faeces not found in the area that were used for open defecation in the past
82.1 98.8 51.6

Interim Report National Annual Rural Sanitation Survey (NARSS), Round-2, 2018-2019
ANNEXURE - I: FACTSHEETS PAGE 147
KERALA Fact Sheet- NARSS R2 (2018-19) Sample Size covered OVERALL ODF Non ODF
Number of Villages surveyed 178 178 0
Number of households surveyed 2960 2960 0
Number of Anganwadis surveyed 178 178 0
Number of Schools surveyed 178 178 0
A. Access to Toilet OVERALL (%) ODF (%) Non ODF (%)
A1. Percentage of households having access to toilet facility 99.9 99.9 0.0
A2. Percentage of Anganwadis having access to toilet facility 100.0 100.0 0.0
A3. Percentage of Schools having access to toilet facility 100.0 100.0 0.0
B. Functionality of Toilet OVERALL (%) ODF (%) Non ODF (%)
B1. Percentage of households having functional toilet 100.0 100.0 0.0
B2. Percentage of Anganwadis having functional toilets 100.0 100.0 0.0
B3. Percentage of Schools having functional toilets 100.0 100.0 0.0
C. Sanitary condition of Toilet OVERALL (%) ODF (%) Non ODF (%)
C1. Percentage of households where toilets found in hygienic condition
100.0 100.0 0.0
C2. Percentage of Anganwadis where toilets found in hygienic condition
100.0 100.0 0.0
C3. Percentage of Schools where toilets found in hygienic condition 100.0 100.0 0.0
D. Disposal mechanism of human excreta from toilet OVERALL (%) ODF (%) Non ODF (%)
D1. Percentage of household toilets with safe disposal mechanism 100.0 100.0 0.0
D2. Percentage of Anganwadis toilets with safe disposal mechanism 100.0 100.0 0.0
D3. Percentage of Schools toilets with safe disposal mechanism 100.0 100.0 0.0
E. Disposal mechanism of child excreta OVERALL (%) ODF (%) Non ODF (%)
E1. Percentage of households practicing safe disposal of child faeces (less than 3 years)
100.0 100.0 0.0
F. Usage of Toilet OVERALL (%) ODF (%) Non ODF (%)
F1. Percentage of individuals using toilet those having access to it 100.0 100.0 0.0
F2. Percentage of Anganwadis where toilets is being used 100.0 100.0 0.0
F3. Percentage of Schools where toilets are being used 100.0 100.0 0.0
G. Solid & liquid waste management (SLWM) OVERALL (%) ODF (%) Non ODF (%)
G1. Percentage of household where solid waste is not visible 100.0 100.0 0.0
G2. Percentage of household where liquid waste / stagnant water is not visible
99.8 99.8 0.0
G3. Percentage of village with minimal level of littering 98.9 98.9 0.0
G4. Percentage of village with minimal level of water logging 98.9 98.9 0.0
H. Visible faecal matter in Public spaces OVERALL (%) ODF (%) Non ODF (%)
H1. Percentage of the village where visible faeces not found in the area that were used for open defecation in the past
100.0 100.0 0.0

Interim Report National Annual Rural Sanitation Survey (NARSS), Round-2, 2018-2019
ANNEXURE - I: FACTSHEETS PAGE 148
MADHYA PRADESH Fact Sheet- NARSS R2 (2018-19) Sample Size covered OVERALL ODF Non ODF
Number of Villages surveyed 324 102 222
Number of households surveyed 4854 1530 3324
Number of Anganwadis surveyed 324 102 222
Number of Schools surveyed 322 102 220
A. Access to Toilet OVERALL (%) ODF (%) Non ODF (%)
A1. Percentage of households having access to toilet facility 94.1 98.0 92.2
A2. Percentage of Anganwadis having access to toilet facility 86.4 98.0 81.1
A3. Percentage of Schools having access to toilet facility 96.6 99.0 95.5
B. Functionality of Toilet OVERALL (%) ODF (%) Non ODF (%)
B1. Percentage of households having functional toilet 97.8 99.9 96.8
B2. Percentage of Anganwadis having functional toilets 95.1 100.0 92.3
B3. Percentage of Schools having functional toilets 98.0 100.0 97.1
C. Sanitary condition of Toilet OVERALL (%) ODF (%) Non ODF (%)
C1. Percentage of households where toilets found in hygienic condition
94.4 99.9 91.8
C2. Percentage of Anganwadis where toilets found in hygienic condition
95.1 100.0 92.3
C3. Percentage of Schools where toilets found in hygienic condition 98.0 100.0 97.1
D. Disposal mechanism of human excreta from toilet OVERALL (%) ODF (%) Non ODF (%)
D1. Percentage of household toilets with safe disposal mechanism 98.9 99.9 98.4
D2. Percentage of Anganwadis toilets with safe disposal mechanism 95.1 100.0 92.3
D3. Percentage of Schools toilets with safe disposal mechanism 98.0 100.0 97.1
E. Disposal mechanism of child excreta OVERALL (%) ODF (%) Non ODF (%)
E1. Percentage of households practicing safe disposal of child faeces (less than 3 years)
72.1 95.8 62.1
F. Usage of Toilet OVERALL (%) ODF (%) Non ODF (%)
F1. Percentage of individuals using toilet those having access to it 94.9 99.7 92.5
F2. Percentage of Anganwadis where toilets is being used 82.5 97.5 74.1
F3. Percentage of Schools where toilets are being used 98.4 100.0 97.6
G. Solid & liquid waste management (SLWM) OVERALL (%) ODF (%) Non ODF (%)
G1. Percentage of household where solid waste is not visible 95.8 99.5 94.0
G2. Percentage of household where liquid waste / stagnant water is not visible
95.5 98.6 94.0
G3. Percentage of village with minimal level of littering 100.0 100.0 100.0
G4. Percentage of village with minimal level of water logging 100.0 100.0 100.0
H. Visible faecal matter in Public spaces OVERALL (%) ODF (%) Non ODF (%)
H1. Percentage of the village where visible faeces not found in the area that were used for open defecation in the past
84.6 99.0 77.9

Interim Report National Annual Rural Sanitation Survey (NARSS), Round-2, 2018-2019
ANNEXURE - I: FACTSHEETS PAGE 149
MAHARASTRA Fact Sheet- NARSS ROUND 2 (2018-19) Sample Size covered OVERALL ODF Non ODF
Number of Villages surveyed 421 301 120
Number of households surveyed 6360 4560 1800
Number of Anganwadis surveyed 420 300 120
Number of Schools surveyed 421 301 120
A. Access to Toilet OVERALL (%) ODF (%) Non ODF (%)
A1. Percentage of households having access to toilet facility 94.5 96.4 89.9
A2. Percentage of Anganwadis having access to toilet facility 96.2 99.3 88.3
A3. Percentage of Schools having access to toilet facility 99.8 99.7 100.0
B. Functionality of Toilet OVERALL (%) ODF (%) Non ODF (%)
B1. Percentage of households having functional toilet 99.5 100.0 98.3
B2. Percentage of Anganwadis having functional toilets 98.6 100.0 94.1
B3. Percentage of Schools having functional toilets 100.0 100.0 100.0
C. Sanitary condition of Toilet OVERALL (%) ODF (%) Non ODF (%)
C1. Percentage of households where toilets found in hygienic condition
95.1 99.8 82.4
C2. Percentage of Anganwadis where toilets found in hygienic condition
98.6 100.0 94.1
C3. Percentage of Schools where toilets found in hygienic condition 100.0 100.0 100.0
D. Disposal mechanism of human excreta from toilet OVERALL (%) ODF (%) Non ODF (%)
D1. Percentage of household toilets with safe disposal mechanism 99.5 100.0 98.3
D2. Percentage of Anganwadis toilets with safe disposal mechanism 98.6 100.0 94.1
D3. Percentage of Schools toilets with safe disposal mechanism 100.0 100.0 100.0
E. Disposal mechanism of child excreta OVERALL (%) ODF (%) Non ODF (%)
E1. Percentage of households practicing safe disposal of child faeces (less than 3 years)
85.3 97.8 55.0
F. Usage of Toilet OVERALL (%) ODF (%) Non ODF (%)
F1. Percentage of individuals using toilet those having access to it 97.3 100.0 90.2
F2. Percentage of Anganwadis where toilets is being used 95.1 99.2 82.4
F3. Percentage of Schools where toilets are being used 100.0 100.0 100.0
G. Solid & liquid waste management (SLWM) OVERALL (%) ODF (%) Non ODF (%)
G1. Percentage of household where solid waste is not visible 99.0 99.8 97.0
G2. Percentage of household where liquid waste / stagnant water is not visible
96.5 96.3 96.9
G3. Percentage of village with minimal level of littering 100.0 100.0 100.0
G4. Percentage of village with minimal level of water logging 100.0 100.0 100.0
H. Visible faecal matter in Public spaces OVERALL (%) ODF (%) Non ODF (%)
H1. Percentage of the village where visible faeces not found in the area that were used for open defecation in the past
99.3 99.0 100.0

Interim Report National Annual Rural Sanitation Survey (NARSS), Round-2, 2018-2019
ANNEXURE - I: FACTSHEETS PAGE 150
MANIPUR Fact Sheet- NARSS ROUND 2 (2018-19) Sample Size covered OVERALL ODF Non ODF
Number of Villages surveyed 52 26 26
Number of households surveyed 780 390 390
Number of Anganwadis surveyed 51 25 26
Number of Schools surveyed 51 25 26
A. Access to Toilet OVERALL (%) ODF (%) Non ODF (%)
A1. Percentage of households having access to toilet facility 100.0 100.0 100.0
A2. Percentage of Anganwadis having access to toilet facility 100.0 100.0 100.0
A3. Percentage of Schools having access to toilet facility 100.0 100.0 100.0
B. Functionality of Toilet OVERALL (%) ODF (%) Non ODF (%)
B1. Percentage of households having functional toilet 99.2 100.0 98.3
B2. Percentage of Anganwadis having functional toilets 97.7 100.0 95.2
B3. Percentage of Schools having functional toilets 100.0 100.0 100.0
C. Sanitary condition of Toilet OVERALL (%) ODF (%) Non ODF (%)
C1. Percentage of households where toilets found in hygienic condition
96.7 99.8 93.6
C2. Percentage of Anganwadis where toilets found in hygienic condition
97.7 100.0 95.2
C3. Percentage of Schools where toilets found in hygienic condition 100.0 100.0 100.0
D. Disposal mechanism of human excreta from toilet OVERALL (%) ODF (%) Non ODF (%)
D1. Percentage of household toilets with safe disposal mechanism 99.2 100.0 98.3
D2. Percentage of Anganwadis toilets with safe disposal mechanism 97.7 100.0 95.2
D3. Percentage of Schools toilets with safe disposal mechanism 100.0 100.0 100.0
E. Disposal mechanism of child excreta OVERALL (%) ODF (%) Non ODF (%)
E1. Percentage of households practicing safe disposal of child faeces (less than 3 years)
94.2 95.7 93.0
F. Usage of Toilet OVERALL (%) ODF (%) Non ODF (%)
F1. Percentage of individuals using toilet those having access to it 100.0 100.0 100.0
F2. Percentage of Anganwadis where toilets is being used 97.7 100.0 95.2
F3. Percentage of Schools where toilets are being used 100.0 100.0 100.0
G. Solid & liquid waste management (SLWM) OVERALL (%) ODF (%) Non ODF (%)
G1. Percentage of household where solid waste is not visible 97.7 100.0 95.4
G2. Percentage of household where liquid waste / stagnant water is not visible
97.1 98.5 95.8
G3. Percentage of village with minimal level of littering 100.0 100.0 100.0
G4. Percentage of village with minimal level of water logging 100.0 100.0 100.0
H. Visible faecal matter in Public spaces OVERALL (%) ODF (%) Non ODF (%)
H1. Percentage of the village where visible faeces not found in the area that were used for open defecation in the past
100.0 100.0 100.0

Interim Report National Annual Rural Sanitation Survey (NARSS), Round-2, 2018-2019
ANNEXURE - I: FACTSHEETS PAGE 151
MEGHALAYA Fact Sheet- NARSS ROUND 2 (2018-19) Sample Size covered OVERALL ODF Non ODF
Number of Villages surveyed 52 26 26
Number of households surveyed 780 390 390
Number of Anganwadis surveyed 50 25 25
Number of Schools surveyed 46 24 22
A. Access to Toilet OVERALL (%) ODF (%) Non ODF (%)
A1. Percentage of households having access to toilet facility 99.6 100.0 99.2
A2. Percentage of Anganwadis having access to toilet facility 100.0 100.0 100.0
A3. Percentage of Schools having access to toilet facility 100.0 100.0 100.0
B. Functionality of Toilet OVERALL (%) ODF (%) Non ODF (%)
B1. Percentage of households having functional toilet 98.0 100.0 96.1
B2. Percentage of Anganwadis having functional toilets 100.0 100.0 100.0
B3. Percentage of Schools having functional toilets 100.0 100.0 100.0
C. Sanitary condition of Toilet OVERALL (%) ODF (%) Non ODF (%)
C1. Percentage of households where toilets found in hygienic condition
95.9 100.0 91.8
C2. Percentage of Anganwadis where toilets found in hygienic condition
100.0 100.0 100.0
C3. Percentage of Schools where toilets found in hygienic condition 100.0 100.0 100.0
D. Disposal mechanism of human excreta from toilet OVERALL (%) ODF (%) Non ODF (%)
D1. Percentage of household toilets with safe disposal mechanism 98.0 100.0 96.1
D2. Percentage of Anganwadis toilets with safe disposal mechanism 100.0 100.0 100.0
D3. Percentage of Schools toilets with safe disposal mechanism 100.0 100.0 100.0
E. Disposal mechanism of child excreta OVERALL (%) ODF (%) Non ODF (%)
E1. Percentage of households practicing safe disposal of child faeces (less than 3 years)
95.4 98.3 91.6
F. Usage of Toilet OVERALL (%) ODF (%) Non ODF (%)
F1. Percentage of individuals using toilet those having access to it 98.3 100.0 96.5
F2. Percentage of Anganwadis where toilets is being used 97.6 95.7 100.0
F3. Percentage of Schools where toilets are being used 100.0 100.0 100.0
G. Solid & liquid waste management (SLWM) OVERALL (%) ODF (%) Non ODF (%)
G1. Percentage of household where solid waste is not visible 98.3 100.0 96.6
G2. Percentage of household where liquid waste / stagnant water is not visible
99.9 99.7 100.0
G3. Percentage of village with minimal level of littering 100.0 100.0 100.0
G4. Percentage of village with minimal level of water logging 100.0 100.0 100.0
H. Visible faecal matter in Public spaces OVERALL (%) ODF (%) Non ODF (%)
H1. Percentage of the village where visible faeces not found in the area that were used for open defecation in the past
100.0 100.0 100.0

Interim Report National Annual Rural Sanitation Survey (NARSS), Round-2, 2018-2019
ANNEXURE - I: FACTSHEETS PAGE 152
MIZORAM Fact Sheet- NARSS ROUND 2 (2018-19) Sample Size covered OVERALL ODF Non ODF
Number of Villages surveyed 52 26 26
Number of households surveyed 790 395 395
Number of Anganwadis surveyed 52 26 26
Number of Schools surveyed 52 26 26
A. Access to Toilet OVERALL (%) ODF (%) Non ODF (%)
A1. Percentage of households having access to toilet facility 100.0 100.0 100.0
A2. Percentage of Anganwadis having access to toilet facility 100.0 100.0 100.0
A3. Percentage of Schools having access to toilet facility 100.0 100.0 100.0
B. Functionality of Toilet OVERALL (%) ODF (%) Non ODF (%)
B1. Percentage of households having functional toilet 99.9 99.7 100.0
B2. Percentage of Anganwadis having functional toilets 100.0 100.0 100.0
B3. Percentage of Schools having functional toilets 100.0 100.0 100.0
C. Sanitary condition of Toilet OVERALL (%) ODF (%) Non ODF (%)
C1. Percentage of households where toilets found in hygienic condition
96.1 99.7 92.5
C2. Percentage of Anganwadis where toilets found in hygienic condition
100.0 100.0 100.0
C3. Percentage of Schools where toilets found in hygienic condition 100.0 100.0 100.0
D. Disposal mechanism of human excreta from toilet OVERALL (%) ODF (%) Non ODF (%)
D1. Percentage of household toilets with safe disposal mechanism 100.0 100.0 100.0
D2. Percentage of Anganwadis toilets with safe disposal mechanism 100.0 100.0 100.0
D3. Percentage of Schools toilets with safe disposal mechanism 100.0 100.0 100.0
E. Disposal mechanism of child excreta OVERALL (%) ODF (%) Non ODF (%)
E1. Percentage of households practicing safe disposal of child faeces (less than 3 years)
82.0 96.7 62.1
F. Usage of Toilet OVERALL (%) ODF (%) Non ODF (%)
F1. Percentage of individuals using toilet those having access to it 99.9 100.0 99.9
F2. Percentage of Anganwadis where toilets is being used 98.0 96.2 100.0
F3. Percentage of Schools where toilets are being used 100.0 100.0 100.0
G. Solid & liquid waste management (SLWM) OVERALL (%) ODF (%) Non ODF (%)
G1. Percentage of household where solid waste is not visible 99.5 99.0 100.0
G2. Percentage of household where liquid waste / stagnant water is not visible
99.2 98.4 100.0
G3. Percentage of village with minimal level of littering 100.0 100.0 100.0
G4. Percentage of village with minimal level of water logging 100.0 100.0 100.0
H. Visible faecal matter in Public spaces OVERALL (%) ODF (%) Non ODF (%)
H1. Percentage of the village where visible faeces not found in the area that were used for open defecation in the past
100.0 100.0 100.0

Interim Report National Annual Rural Sanitation Survey (NARSS), Round-2, 2018-2019
ANNEXURE - I: FACTSHEETS PAGE 153
NAGALAND Fact Sheet- NARSS ROUND 2 (2018-19) Sample Size covered OVERALL ODF Non ODF
Number of Villages surveyed 52 26 26
Number of households surveyed 780 390 390
Number of Anganwadis surveyed 52 26 26
Number of Schools surveyed 52 26 26
A. Access to Toilet OVERALL (%) ODF (%) Non ODF (%)
A1. Percentage of households having access to toilet facility 100.0 100.0 100.0
A2. Percentage of Anganwadis having access to toilet facility 100.0 100.0 100.0
A3. Percentage of Schools having access to toilet facility 100.0 100.0 100.0
B. Functionality of Toilet OVERALL (%) ODF (%) Non ODF (%)
B1. Percentage of households having functional toilet 99.2 99.2 99.2
B2. Percentage of Anganwadis having functional toilets 97.8 100.0 95.0
B3. Percentage of Schools having functional toilets 100.0 100.0 100.0
C. Sanitary condition of Toilet OVERALL (%) ODF (%) Non ODF (%)
C1. Percentage of households where toilets found in hygienic condition
97.4 99.2 95.6
C2. Percentage of Anganwadis where toilets found in hygienic condition
97.8 100.0 95.0
C3. Percentage of Schools where toilets found in hygienic condition 100.0 100.0 100.0
D. Disposal mechanism of human excreta from toilet OVERALL (%) ODF (%) Non ODF (%)
D1. Percentage of household toilets with safe disposal mechanism 99.6 100.0 99.2
D2. Percentage of Anganwadis toilets with safe disposal mechanism 97.8 100.0 95.0
D3. Percentage of Schools toilets with safe disposal mechanism 100.0 100.0 100.0
E. Disposal mechanism of child excreta OVERALL (%) ODF (%) Non ODF (%)
E1. Percentage of households practicing safe disposal of child faeces (less than 3 years)
92.0 97.0 85.7
F. Usage of Toilet OVERALL (%) ODF (%) Non ODF (%)
F1. Percentage of individuals using toilet those having access to it 99.8 100.0 99.5
F2. Percentage of Anganwadis where toilets is being used 84.4 100.0 65.0
F3. Percentage of Schools where toilets are being used 100.0 100.0 100.0
G. Solid & liquid waste management (SLWM) OVERALL (%) ODF (%) Non ODF (%)
G1. Percentage of household where solid waste is not visible 99.2 100.0 98.5
G2. Percentage of household where liquid waste / stagnant water is not visible
98.5 99.0 98.0
G3. Percentage of village with minimal level of littering 100.0 100.0 100.0
G4. Percentage of village with minimal level of water logging 100.0 100.0 100.0
H. Visible faecal matter in Public spaces OVERALL (%) ODF (%) Non ODF (%)
H1. Percentage of the village where visible faeces not found in the area that were used for open defecation in the past
100.0 100.0 100.0

Interim Report National Annual Rural Sanitation Survey (NARSS), Round-2, 2018-2019
ANNEXURE - I: FACTSHEETS PAGE 154
ODISHA Fact Sheet- NARSS ROUND 2 (2018-19) Sample Size covered OVERALL ODF Non ODF
Number of Villages surveyed 283 32 251
Number of households surveyed 4244 480 3764
Number of Anganwadis surveyed 281 32 249
Number of Schools surveyed 277 31 246
A. Access to Toilet OVERALL (%) ODF (%) Non ODF (%)
A1. Percentage of households having access to toilet facility 72.2 98.3 68.9
A2. Percentage of Anganwadis having access to toilet facility 82.2 100.0 79.9
A3. Percentage of Schools having access to toilet facility 97.8 100.0 97.6
B. Functionality of Toilet OVERALL (%) ODF (%) Non ODF (%)
B1. Percentage of households having functional toilet 96.0 99.0 95.5
B2. Percentage of Anganwadis having functional toilets 78.5 96.2 74.6
B3. Percentage of Schools having functional toilets 89.1 96.8 88.1
C. Sanitary condition of Toilet OVERALL (%) ODF (%) Non ODF (%)
C1. Percentage of households where toilets found in hygienic condition
85.5 98.8 83.1
C2. Percentage of Anganwadis where toilets found in hygienic condition
79.2 96.2 75.4
C3. Percentage of Schools where toilets found in hygienic condition 91.0 96.8 90.2
D. Disposal mechanism of human excreta from toilet OVERALL (%) ODF (%) Non ODF (%)
D1. Percentage of household toilets with safe disposal mechanism 99.3 100.0 99.1
D2. Percentage of Anganwadis toilets with safe disposal mechanism 95.8 100.0 94.9
D3. Percentage of Schools toilets with safe disposal mechanism 95.9 100.0 95.3
E. Disposal mechanism of child excreta OVERALL (%) ODF (%) Non ODF (%)
E1. Percentage of households practicing safe disposal of child faeces (less than 3 years)
35.7 94.9 27.1
F. Usage of Toilet OVERALL (%) ODF (%) Non ODF (%)
F1. Percentage of individuals using toilet those having access to it 89.6 99.9 87.7
F2. Percentage of Anganwadis where toilets is being used 79.9 96.2 76.3
F3. Percentage of Schools where toilets are being used 80.1 93.5 78.3
G. Solid & liquid waste management (SLWM) OVERALL (%) ODF (%) Non ODF (%)
G1. Percentage of household where solid waste is not visible 96.3 99.5 95.9
G2. Percentage of household where liquid waste / stagnant water is not visible
96.8 99.3 96.4
G3. Percentage of village with minimal level of littering 77.7 96.9 75.3
G4. Percentage of village with minimal level of water logging 70.3 96.9 66.9
H. Visible faecal matter in Public spaces OVERALL (%) ODF (%) Non ODF (%)
H1. Percentage of the village where visible faeces not found in the area that were used for open defecation in the past
60.1 96.9 55.4

Interim Report National Annual Rural Sanitation Survey (NARSS), Round-2, 2018-2019
ANNEXURE - I: FACTSHEETS PAGE 155
PUDUCHERY Fact Sheet- NARSS R2 (2018-19) Sample Size covered OVERALL ODF Non ODF
Number of Villages surveyed 26 0 26
Number of households surveyed 390 0 390
Number of Anganwadis surveyed 26 0 26
Number of Schools surveyed 26 0 26
A. Access to Toilet OVERALL (%) ODF (%) Non ODF (%)
A1. Percentage of households having access to toilet facility 95.2 0.0 95.2
A2. Percentage of Anganwadis having access to toilet facility 92.3 0.0 92.3
A3. Percentage of Schools having access to toilet facility 100.0 0.0 100.0
B. Functionality of Toilet OVERALL (%) ODF (%) Non ODF (%)
B1. Percentage of households having functional toilet 99.7 0.0 99.7
B2. Percentage of Anganwadis having functional toilets 100.0 0.0 100.0
B3. Percentage of Schools having functional toilets 100.0 0.0 100.0
C. Sanitary condition of Toilet OVERALL (%) ODF (%) Non ODF (%)
C1. Percentage of households where toilets found in hygienic condition
96.8 0.0 96.8
C2. Percentage of Anganwadis where toilets found in hygienic condition
100.0 0.0 100.0
C3. Percentage of Schools where toilets found in hygienic condition 100.0 0.0 100.0
D. Disposal mechanism of human excreta from toilet OVERALL (%) ODF (%) Non ODF (%)
D1. Percentage of household toilets with safe disposal mechanism 99.7 0.0 99.7
D2. Percentage of Anganwadis toilets with safe disposal mechanism 100.0 0.0 100.0
D3. Percentage of Schools toilets with safe disposal mechanism 100.0 0.0 100.0
E. Disposal mechanism of child excreta OVERALL (%) ODF (%) Non ODF (%)
E1. Percentage of households practicing safe disposal of child faeces (less than 3 years)
53.6 0.0 53.6
F. Usage of Toilet OVERALL (%) ODF (%) Non ODF (%)
F1. Percentage of individuals using toilet those having access to it 91.4 0.0 91.4
F2. Percentage of Anganwadis where toilets is being used 86.4 0.0 86.4
F3. Percentage of Schools where toilets are being used 100.0 0.0 100.0
G. Solid & liquid waste management (SLWM) OVERALL (%) ODF (%) Non ODF (%)
G1. Percentage of household where solid waste is not visible 98.9 0.0 98.9
G2. Percentage of household where liquid waste / stagnant water is not visible
97.8 0.0 97.8
G3. Percentage of village with minimal level of littering 88.5 0.0 88.5
G4. Percentage of village with minimal level of water logging 84.6 0.0 84.6
H. Visible faecal matter in Public spaces OVERALL (%) ODF (%) Non ODF (%)
H1. Percentage of the village where visible faeces not found in the area that were used for open defecation in the past
84.6 0.0 84.6

Interim Report National Annual Rural Sanitation Survey (NARSS), Round-2, 2018-2019
ANNEXURE - I: FACTSHEETS PAGE 156
PUNJAB Fact Sheet- NARSS ROUND 2 (2018-19) Sample Size covered OVERALL ODF Non ODF
Number of Villages surveyed 108 60 48
Number of households surveyed 1620 900 720
Number of Anganwadis surveyed 108 60 48
Number of Schools surveyed 107 58 49
A. Access to Toilet OVERALL (%) ODF (%) Non ODF (%)
A1. Percentage of households having access to toilet facility 97.3 97.3 97.2
A2. Percentage of Anganwadis having access to toilet facility 94.4 96.7 91.7
A3. Percentage of Schools having access to toilet facility 99.1 98.3 100.0
B. Functionality of Toilet OVERALL (%) ODF (%) Non ODF (%)
B1. Percentage of households having functional toilet 97.3 99.9 94.1
B2. Percentage of Anganwadis having functional toilets 98.6 97.7 100.0
B3. Percentage of Schools having functional toilets 99.1 98.2 100.0
C. Sanitary condition of Toilet OVERALL (%) ODF (%) Non ODF (%)
C1. Percentage of households where toilets found in hygienic condition
96.7 99.9 92.6
C2. Percentage of Anganwadis where toilets found in hygienic condition
97.2 95.3 100.0
C3. Percentage of Schools where toilets found in hygienic condition 99.1 98.2 100.0
D. Disposal mechanism of human excreta from toilet OVERALL (%) ODF (%) Non ODF (%)
D1. Percentage of household toilets with safe disposal mechanism 99.9 100.0 99.9
D2. Percentage of Anganwadis toilets with safe disposal mechanism 98.6 97.7 100.0
D3. Percentage of Schools toilets with safe disposal mechanism 99.1 98.2 100.0
E. Disposal mechanism of child excreta OVERALL (%) ODF (%) Non ODF (%)
E1. Percentage of households practicing safe disposal of child faeces (less than 3 years)
90.1 95.4 83.6
F. Usage of Toilet OVERALL (%) ODF (%) Non ODF (%)
F1. Percentage of individuals using toilet those having access to it 99.0 100.0 97.8
F2. Percentage of Anganwadis where toilets is being used 94.4 100.0 86.2
F3. Percentage of Schools where toilets are being used 100.0 100.0 100.0
G. Solid & liquid waste management (SLWM) OVERALL (%) ODF (%) Non ODF (%)
G1. Percentage of household where solid waste is not visible 99.3 99.6 98.9
G2. Percentage of household where liquid waste / stagnant water is not visible
99.4 99.7 98.9
G3. Percentage of village with minimal level of littering 100.0 100.0 100.0
G4. Percentage of village with minimal level of water logging 100.0 100.0 100.0
H. Visible faecal matter in Public spaces OVERALL (%) ODF (%) Non ODF (%)
H1. Percentage of the village where visible faeces not found in the area that were used for open defecation in the past
99.1 98.3 100.0

Interim Report National Annual Rural Sanitation Survey (NARSS), Round-2, 2018-2019
ANNEXURE - I: FACTSHEETS PAGE 157
RAJASTHAN Fact Sheet- NARSS ROUND 2 (2018-19) Sample Size covered OVERALL ODF Non ODF
Number of Villages surveyed 396 302 94
Number of households surveyed 5940 4530 1410
Number of Anganwadis surveyed 390 297 93
Number of Schools surveyed 393 299 94
A. Access to Toilet OVERALL (%) ODF (%) Non ODF (%)
A1. Percentage of households having access to toilet facility 95.6 96.5 92.9
A2. Percentage of Anganwadis having access to toilet facility 95.6 98 88.2
A3. Percentage of Schools having access to toilet facility 100.0 100.0 100.0
B. Functionality of Toilet OVERALL (%) ODF (%) Non ODF (%)
B1. Percentage of households having functional toilet 99.9 99.9 99.9
B2. Percentage of Anganwadis having functional toilets 99.6 100.0 98.0
B3. Percentage of Schools having functional toilets 100.0 100.0 100.0
C. Sanitary condition of Toilet OVERALL (%) ODF (%) Non ODF (%)
C1. Percentage of households where toilets found in hygienic condition
99.1 99.7 97.0
C2. Percentage of Anganwadis where toilets found in hygienic condition
99.6 100.0 98.0
C3. Percentage of Schools where toilets found in hygienic condition 100.0 100.0 100.0
D. Disposal mechanism of human excreta from toilet OVERALL (%) ODF (%) Non ODF (%)
D1. Percentage of household toilets with safe disposal mechanism 100.0 100.0 99.9
D2. Percentage of Anganwadis toilets with safe disposal mechanism 99.6 100.0 98.0
D3. Percentage of Schools toilets with safe disposal mechanism 100.0 100.0 100.0
E. Disposal mechanism of child excreta OVERALL (%) ODF (%) Non ODF (%)
E1. Percentage of households practicing safe disposal of child faeces (less than 3 years)
87.5 95.5 68.1
F. Usage of Toilet OVERALL (%) ODF (%) Non ODF (%)
F1. Percentage of individuals using toilet those having access to it 98.8 99.9 95.3
F2. Percentage of Anganwadis where toilets is being used 97.1 100.0 84.3
F3. Percentage of Schools where toilets are being used 100.0 100.0 100.0
G. Solid & liquid waste management (SLWM) OVERALL (%) ODF (%) Non ODF (%)
G1. Percentage of household where solid waste is not visible 99.8 100.0 99.2
G2. Percentage of household where liquid waste / stagnant water is not visible
99.1 99.3 98.4
G3. Percentage of village with minimal level of littering 100.0 100.0 100.0
G4. Percentage of village with minimal level of water logging 100.0 100.0 100.0
H. Visible faecal matter in Public spaces OVERALL (%) ODF (%) Non ODF (%)
H1. Percentage of the village where visible faeces not found in the area that were used for open defecation in the past
99.5 99.3 100.0

Interim Report National Annual Rural Sanitation Survey (NARSS), Round-2, 2018-2019
ANNEXURE - I: FACTSHEETS PAGE 158
SIKKIM Fact Sheet- NARSS ROUND 2 (2018-19) Sample Size covered OVERALL ODF Non ODF
Number of Villages surveyed 26 26 0
Number of households surveyed 390 390 0
Number of Anganwadis surveyed 26 26 0
Number of Schools surveyed 26 26 0
A. Access to Toilet OVERALL (%) ODF (%) Non ODF (%)
A1. Percentage of households having access to toilet facility 100.0 100.0 0.0
A2. Percentage of Anganwadis having access to toilet facility 100.0 100.0 0.0
A3. Percentage of Schools having access to toilet facility 100.0 100.0 0.0
B. Functionality of Toilet OVERALL (%) ODF (%) Non ODF (%)
B1. Percentage of households having functional toilet 100.0 100.0 0.0
B2. Percentage of Anganwadis having functional toilets 100.0 100.0 0.0
B3. Percentage of Schools having functional toilets 100.0 100.0 0.0
C. Sanitary condition of Toilet OVERALL (%) ODF (%) Non ODF (%)
C1. Percentage of households where toilets found in hygienic condition
99.7 99.7 0.0
C2. Percentage of Anganwadis where toilets found in hygienic condition
100.0 100.0 0.0
C3. Percentage of Schools where toilets found in hygienic condition 100.0 100.0 0.0
D. Disposal mechanism of human excreta from toilet OVERALL (%) ODF (%) Non ODF (%)
D1. Percentage of household toilets with safe disposal mechanism 100.0 100.0 0.0
D2. Percentage of Anganwadis toilets with safe disposal mechanism 100.0 100.0 0.0
D3. Percentage of Schools toilets with safe disposal mechanism 100.0 100.0 0.0
E. Disposal mechanism of child excreta OVERALL (%) ODF (%) Non ODF (%)
E1. Percentage of households practicing safe disposal of child faeces (less than 3 years)
97.3 97.3 0.0
F. Usage of Toilet OVERALL (%) ODF (%) Non ODF (%)
F1. Percentage of individuals using toilet those having access to it 100.0 100.0 0.0
F2. Percentage of Anganwadis where toilets is being used 100.0 100.0 0.0
F3. Percentage of Schools where toilets are being used 100.0 100.0 0.0
G. Solid & liquid waste management (SLWM) OVERALL (%) ODF (%) Non ODF (%)
G1. Percentage of household where solid waste is not visible 100.0 100.0 0.0
G2. Percentage of household where liquid waste / stagnant water is not visible
100.0 100.0 0.0
G3. Percentage of village with minimal level of littering 100.0 100.0 0.0
G4. Percentage of village with minimal level of water logging 100.0 100.0 0.0
H. Visible faecal matter in Public spaces OVERALL (%) ODF (%) Non ODF (%)
H1. Percentage of the village where visible faeces not found in the area that were used for open defecation in the past
100.0 100.0 0.0

Interim Report National Annual Rural Sanitation Survey (NARSS), Round-2, 2018-2019
ANNEXURE - I: FACTSHEETS PAGE 159
TAMILNADU Fact Sheet -NARSS R2 (2018-19) Sample Size covered OVERALL ODF Non ODF
Number of Villages surveyed 332 65 267
Number of households surveyed 4980 975 4005
Number of Anganwadis surveyed 331 65 266
Number of Schools surveyed 299 50 249
A. Access to Toilet OVERALL (%) ODF (%) Non ODF (%)
A1. Percentage of households having access to toilet facility 99.7 99.6 99.7
A2. Percentage of Anganwadis having access to toilet facility 99.1 100.0 98.9
A3. Percentage of Schools having access to toilet facility 100.0 100.0 100.0
B. Functionality of Toilet OVERALL (%) ODF (%) Non ODF (%)
B1. Percentage of households having functional toilet 96.9 100.0 96.0
B2. Percentage of Anganwadis having functional toilets 99.0 100.0 98.8
B3. Percentage of Schools having functional toilets 100.0 100.0 100.0
C. Sanitary condition of Toilet OVERALL (%) ODF (%) Non ODF (%)
C1. Percentage of households where toilets found in hygienic condition
92.1 98.9 90.2
C2. Percentage of Anganwadis where toilets found in hygienic condition
99.0 100.0 98.8
C3. Percentage of Schools where toilets found in hygienic condition 100.0 100.0 100.0
D. Disposal mechanism of human excreta from toilet OVERALL (%) ODF (%) Non ODF (%)
D1. Percentage of household toilets with safe disposal mechanism 99.8 100.0 99.7
D2. Percentage of Anganwadis toilets with safe disposal mechanism 99.0 100.0 98.8
D3. Percentage of Schools toilets with safe disposal mechanism 100.0 100.0 100.0
E. Disposal mechanism of child excreta OVERALL (%) ODF (%) Non ODF (%)
E1. Percentage of households practicing safe disposal of child faeces (less than 3 years)
69.4 86.8 66.0
F. Usage of Toilet OVERALL (%) ODF (%) Non ODF (%)
F1. Percentage of individuals using toilet those having access to it 96.5 98.5 96.0
F2. Percentage of Anganwadis where toilets is being used 91.4 98.5 89.6
F3. Percentage of Schools where toilets are being used 100.0 100.0 100.0
G. Solid & liquid waste management (SLWM) OVERALL (%) ODF (%) Non ODF (%)
G1. Percentage of household where solid waste is not visible 99.3 99.9 99.2
G2. Percentage of household where liquid waste / stagnant water is not visible
99.1 99.3 99.1
G3. Percentage of village with minimal level of littering 100.0 100.0 100.0
G4. Percentage of village with minimal level of water logging 100.0 100.0 100.0
H. Visible faecal matter in Public spaces OVERALL (%) ODF (%) Non ODF (%)
H1. Percentage of the village where visible faeces not found in the area that were used for open defecation in the past
99.1 95.4 100.0

Interim Report National Annual Rural Sanitation Survey (NARSS), Round-2, 2018-2019
ANNEXURE - I: FACTSHEETS PAGE 160
TELENGANA Fact Sheet- NARSS ROUND 2 (2018-19) Sample Size covered OVERALL ODF Non ODF
Number of Villages surveyed 165 68 97
Number of households surveyed 2469 1020 1449
Number of Anganwadis surveyed 165 68 97
Number of Schools surveyed 164 68 96
A. Access to Toilet OVERALL (%) ODF (%) Non ODF (%)
A1. Percentage of households having access to toilet facility 96.4 96.4 96.4
A2. Percentage of Anganwadis having access to toilet facility 70.9 95.6 53.6
A3. Percentage of Schools having access to toilet facility 95.7 100.0 92.7
B. Functionality of Toilet OVERALL (%) ODF (%) Non ODF (%)
B1. Percentage of households having functional toilet 99.8 100.0 99.7
B2. Percentage of Anganwadis having functional toilets 100.0 100.0 100.0
B3. Percentage of Schools having functional toilets 99.4 100.0 98.9
C. Sanitary condition of Toilet OVERALL (%) ODF (%) Non ODF (%)
C1. Percentage of households where toilets found in hygienic condition
99.1 100.0 98.5
C2. Percentage of Anganwadis where toilets found in hygienic condition
100.0 100.0 100.0
C3. Percentage of Schools where toilets found in hygienic condition 99.4 100.0 98.9
D. Disposal mechanism of human excreta from toilet OVERALL (%) ODF (%) Non ODF (%)
D1. Percentage of household toilets with safe disposal mechanism 99.9 100.0 99.8
D2. Percentage of Anganwadis toilets with safe disposal mechanism 100.0 100.0 100.0
D3. Percentage of Schools toilets with safe disposal mechanism 99.4 100.0 98.9
E. Disposal mechanism of child excreta OVERALL (%) ODF (%) Non ODF (%)
E1. Percentage of households practicing safe disposal of child faeces (less than 3 years)
75.8 91.6 65.9
F. Usage of Toilet OVERALL (%) ODF (%) Non ODF (%)
F1. Percentage of individuals using toilet those having access to it 97.7 99.8 96.2
F2. Percentage of Anganwadis where toilets is being used 85.5 93.3 74.2
F3. Percentage of Schools where toilets are being used 100.0 100.0 100.0
G. Solid & liquid waste management (SLWM) OVERALL (%) ODF (%) Non ODF (%)
G1. Percentage of household where solid waste is not visible 97.1 99.6 95.3
G2. Percentage of household where liquid waste / stagnant water is not visible
95.9 97.3 94.9
G3. Percentage of village with minimal level of littering 93.3 100.0 88.7
G4. Percentage of village with minimal level of water logging 91.5 100.0 85.6
H. Visible faecal matter in Public spaces OVERALL (%) ODF (%) Non ODF (%)
H1. Percentage of the village where visible faeces not found in the area that were used for open defecation in the past
91.5 98.5 86.6

Interim Report National Annual Rural Sanitation Survey (NARSS), Round-2, 2018-2019
ANNEXURE - I: FACTSHEETS PAGE 161
TRIPURA Fact Sheet- NARSS ROUND 2 (2018-19) Sample Size covered OVERALL ODF Non ODF
Number of Villages surveyed 26 0 26
Number of households surveyed 390 0 390
Number of Anganwadis surveyed 26 0 26
Number of Schools surveyed 26 0 26
A. Access to Toilet OVERALL (%) ODF (%) Non ODF (%)
A1. Percentage of households having access to toilet facility 98.6 0.0 98.6
A2. Percentage of Anganwadis having access to toilet facility 100.0 0.0 100.0
A3. Percentage of Schools having access to toilet facility 100.0 0.0 100.0
B. Functionality of Toilet OVERALL (%) ODF (%) Non ODF (%)
B1. Percentage of households having functional toilet 99.0 0.0 99.0
B2. Percentage of Anganwadis having functional toilets 100.0 0.0 100.0
B3. Percentage of Schools having functional toilets 100.0 0.0 100.0
C. Sanitary condition of Toilet OVERALL (%) ODF (%) Non ODF (%)
C1. Percentage of households where toilets found in hygienic condition
94.6 0.0 94.6
C2. Percentage of Anganwadis where toilets found in hygienic condition
100.0 0.0 100.0
C3. Percentage of Schools where toilets found in hygienic condition 100.0 0.0 100.0
D. Disposal mechanism of human excreta from toilet OVERALL (%) ODF (%) Non ODF (%)
D1. Percentage of household toilets with safe disposal mechanism 99.0 0.0 99.0
D2. Percentage of Anganwadis toilets with safe disposal mechanism 100.0 0.0 100.0
D3. Percentage of Schools toilets with safe disposal mechanism 100.0 0.0 100.0
E. Disposal mechanism of child excreta OVERALL (%) ODF (%) Non ODF (%)
E1. Percentage of households practicing safe disposal of child faeces (less than 3 years)
67.7 0.0 67.7
F. Usage of Toilet OVERALL (%) ODF (%) Non ODF (%)
F1. Percentage of individuals using toilet those having access to it 99.2 0.0 99.2
F2. Percentage of Anganwadis where toilets is being used 87.5 0.0 87.5
F3. Percentage of Schools where toilets are being used 100.0 0.0 100.0
G. Solid & liquid waste management (SLWM) OVERALL (%) ODF (%) Non ODF (%)
G1. Percentage of household where solid waste is not visible 98.2 0.0 98.2
G2. Percentage of household where liquid waste / stagnant water is not visible
99.7 0.0 99.7
G3. Percentage of village with minimal level of littering 96.2 0.0 96.2
G4. Percentage of village with minimal level of water logging 96.2 0.0 96.2
H. Visible faecal matter in Public spaces OVERALL (%) ODF (%) Non ODF (%)
H1. Percentage of the village where visible faeces not found in the area that were used for open defecation in the past
100.0 0.0 100.0

Interim Report National Annual Rural Sanitation Survey (NARSS), Round-2, 2018-2019
ANNEXURE - I: FACTSHEETS PAGE 162
UTTAR PRADESH Fact Sheet- NARSS R2 (2018-19) Sample Size covered OVERALL ODF Non ODF
Number of Villages surveyed 888 133 755
Number of households surveyed 13330 1995 11335
Number of Anganwadis surveyed 883 133 750
Number of Schools surveyed 885 132 753
A. Access to Toilet OVERALL (%) ODF (%) Non ODF (%)
A1. Percentage of households having access to toilet facility 97.8 99.6 97.5
A2. Percentage of Anganwadis having access to toilet facility 98.9 100.0 98.7
A3. Percentage of Schools having access to toilet facility 100.0 100.0 100.0
B. Functionality of Toilet OVERALL (%) ODF (%) Non ODF (%)
B1. Percentage of households having functional toilet 97.7 99.2 97.5
B2. Percentage of Anganwadis having functional toilets 99.6 100.0 99.6
B3. Percentage of Schools having functional toilets 100.0 100.0 100.0
C. Sanitary condition of Toilet OVERALL (%) ODF (%) Non ODF (%)
C1. Percentage of households where toilets found in hygienic condition
91.3 99.1 89.9
C2. Percentage of Anganwadis where toilets found in hygienic condition
97.3 100.0 96.8
C3. Percentage of Schools where toilets found in hygienic condition 100.0 100.0 100.0
D. Disposal mechanism of human excreta from toilet OVERALL (%) ODF (%) Non ODF (%)
D1. Percentage of household toilets with safe disposal mechanism 99.9 100.0 99.9
D2. Percentage of Anganwadis toilets with safe disposal mechanism 99.6 100.0 99.6
D3. Percentage of Schools toilets with safe disposal mechanism 100.0 100.0 100.0
E. Disposal mechanism of child excreta OVERALL (%) ODF (%) Non ODF (%)
E1. Percentage of households practicing safe disposal of child faeces (less than 3 years)
81.7 91.6 79.6
F. Usage of Toilet OVERALL (%) ODF (%) Non ODF (%)
F1. Percentage of individuals using toilet those having access to it 96.8 99.9 96.3
F2. Percentage of Anganwadis where toilets is being used 94.9 99.2 94.1
F3. Percentage of Schools where toilets are being used 100.0 100.0 100.0
G. Solid & liquid waste management (SLWM) OVERALL (%) ODF (%) Non ODF (%)
G1. Percentage of household where solid waste is not visible 99.6 99.9 99.5
G2. Percentage of household where liquid waste / stagnant water is not visible
99.5 99.6 99.5
G3. Percentage of village with minimal level of littering 100.0 100.0 100.0
G4. Percentage of village with minimal level of water logging 100.0 100.0 100.0
H. Visible faecal matter in Public spaces OVERALL (%) ODF (%) Non ODF (%)
H1. Percentage of the village where visible faeces not found in the area that were used for open defecation in the past
100.0 100.0 100.0

Interim Report National Annual Rural Sanitation Survey (NARSS), Round-2, 2018-2019
ANNEXURE - I: FACTSHEETS PAGE 163
UTTARAKHAND Fact Sheet- NARSS ROUND 2 (2018-19) Sample Size covered OVERALL ODF Non ODF
Number of Villages surveyed 58 58 0
Number of households surveyed 870 870 0
Number of Anganwadis surveyed 58 58 0
Number of Schools surveyed 57 57 0
A. Access to Toilet OVERALL (%) ODF (%) Non ODF (%)
A1. Percentage of households having access to toilet facility 99.5 99.5 0.0
A2. Percentage of Anganwadis having access to toilet facility 98.3 98.3 0.0
A3. Percentage of Schools having access to toilet facility 100.0 100.0 0.0
B. Functionality of Toilet OVERALL (%) ODF (%) Non ODF (%)
B1. Percentage of households having functional toilet 100.0 100.0 0.0
B2. Percentage of Anganwadis having functional toilets 100.0 100.0 0.0
B3. Percentage of Schools having functional toilets 100.0 100.0 0.0
C. Sanitary condition of Toilet OVERALL (%) ODF (%) Non ODF (%)
C1. Percentage of households where toilets found in hygienic condition
99.6 99.6 0.0
C2. Percentage of Anganwadis where toilets found in hygienic condition
100.0 100.0 0.0
C3. Percentage of Schools where toilets found in hygienic condition 100.0 100.0 0.0
D. Disposal mechanism of human excreta from toilet OVERALL (%) ODF (%) Non ODF (%)
D1. Percentage of household toilets with safe disposal mechanism 100.0 100.0 0.0
D2. Percentage of Anganwadis toilets with safe disposal mechanism 100.0 100.0 0.0
D3. Percentage of Schools toilets with safe disposal mechanism 100.0 100.0 0.0
E. Disposal mechanism of child excreta OVERALL (%) ODF (%) Non ODF (%)
E1. Percentage of households practicing safe disposal of child faeces (less than 3 years)
95.3 95.3 0.0
F. Usage of Toilet OVERALL (%) ODF (%) Non ODF (%)
F1. Percentage of individuals using toilet those having access to it 99.9 99.9 0.0
F2. Percentage of Anganwadis where toilets is being used 100.0 100.0 0.0
F3. Percentage of Schools where toilets are being used 100.0 100.0 0.0
G. Solid & liquid waste management (SLWM) OVERALL (%) ODF (%) Non ODF (%)
G1. Percentage of household where solid waste is not visible 100.0 100.0 0.0
G2. Percentage of household where liquid waste / stagnant water is not visible
99.3 99.3 0.0
G3. Percentage of village with minimal level of littering 100.0 100.0 0.0
G4. Percentage of village with minimal level of water logging 100.0 100.0 0.0
H. Visible faecal matter in Public spaces OVERALL (%) ODF (%) Non ODF (%)
H1. Percentage of the village where visible faeces not found in the area that were used for open defecation in the past
100.0 100.0 0.0

Interim Report National Annual Rural Sanitation Survey (NARSS), Round-2, 2018-2019
ANNEXURE - I: FACTSHEETS PAGE 164
WEST BENGAL Fact Sheet- NARSS ROUND 2 (2018-19) Sample size covered OVERALL ODF Non ODF
Number of villages surveyed 506 355 151
Number of households surveyed 7586 5325 2261
Number of Anganwadis surveyed 499 349 150
Number of schools surveyed 497 351 146
A. Access to Toilet OVERALL (%) ODF (%) Non ODF (%)
A1. Percentage of households having access to toilet facility 95.1 98.3 87.4
A2. Percentage of Anganwadis having access to toilet facility 93.8 99.7 80
A3. Percentage of Schools having access to toilet facility 99.4 100.0 97.9
B. Functionality of Toilet OVERALL (%) ODF (%) Non ODF (%)
B1. Percentage of households having functional toilet 98.2 99.6 94.6
B2. Percentage of Anganwadis having functional toilets 96.5 99.3 87.2
B3. Percentage of Schools having functional toilets 97.3 99.7 91.1
C. Sanitary condition of Toilet OVERALL (%) ODF (%) Non ODF (%)
C1. Percentage of households where toilets found in hygienic condition
95.6 99.6 85.2
C2. Percentage of Anganwadis where toilets found in hygienic condition
88.1 95.7 63.8
C3. Percentage of Schools where toilets found in hygienic condition 92.6 95.1 85.9
D. Disposal mechanism of human excreta from toilet OVERALL (%) ODF (%) Non ODF (%)
D1. Percentage of household toilets with safe disposal mechanism 99.3 100.0 97.6
D2. Percentage of Anganwadis toilets with safe disposal mechanism 99.0 100.0 95.7
D3. Percentage of Schools toilets with safe disposal mechanism 100.0 100.0 100.0
E. Disposal mechanism of child excreta OVERALL (%) ODF (%) Non ODF (%)
E1. Percentage of households practicing safe disposal of child faeces (less than 3 years)
75.4 94.0 37.6
F. Usage of Toilet OVERALL (%) ODF (%) Non ODF (%)
F1. Percentage of individuals using toilet those having access to it 96.3 99.9 86.9
F2. Percentage of Anganwadis where toilets is being used 93.7 99.0 76.6
F3. Percentage of Schools where toilets are being used 95.7 99.1 86.7
G. Solid & liquid waste management (SLWM) OVERALL (%) ODF (%) Non ODF (%)
G1. Percentage of household where solid waste is not visible 98.1 99.7 94.3
G2. Percentage of household where liquid waste / stagnant water is not visible
95.3 95.1 95.9
G3. Percentage of village with minimal level of littering 98.4 98.6 98.0
G4. Percentage of village with minimal level of water logging 99.0 99.7 97.4
H. Visible faecal matter in Public spaces OVERALL (%) ODF (%) Non ODF (%)
H1. Percentage of the village where visible faeces not found in the area that were used for open defecation in the past
95.8 98.9 88.7
***End of Factsheet***

Interim Report National Annual Rural Sanitation Survey (NARSS), Round-2, 2018-2019
ANNEXURE - II: SURVEY TOOLS PAGE 165
ANNEXURE - II: SURVEY TOOLS NATIONAL ANNUAL RURAL SANITATION SURVEY– ROUND 2 QUESTIONNAIRE - HOUSEHOLD Conventions used in this document: Interviewer instructions are in red, bold, font. Programmed items are in green font. Additionally, all skip would be automated Observation related questions are in bold Blue font

Interim Report National Annual Rural Sanitation Survey (NARSS), Round-2, 2018-2019
ANNEXURE - II: SURVEY TOOLS PAGE 166
IDENTIFICATION
I.1 Please select the name and code of the State/Union Territory (UT) Dropdown menu containing the names and codes of the sampled states/UTs
I.2 Please select the name and code of the district Dropdown menu containing the names and codes of the sampled district within the selected state/UT
I.2A Please select the name and code of the Block Dropdown menu containing the names and codes of the sampled sub district within the selected district
I.3 Please select the name and code of the village Dropdown menu containing the names and codes of the sampled villages within the selected district suffix with code & original/additional
I.4 Type of Village – (Auto code) ODF 1 Non ODF 2
I.5 Structure Number (Alpha numeric)
I.6 New HH Number (Numeric)
I.6.1 Type of HH Original -1 Substitute-2
I.7 Please write the interviewer name and code
I.8 Please write the supervisor name and code
I.9 Please write the name of Head of Household
I.10 Please write the name of the respondent
I.11 Please write the mobile number of the respondent Write ‘999999999’ if respondent doesn’t provide the phone number
I.12 Date of the interview To be auto computed (not to be displayed)
I.13 Interview start time To be auto computed (not to be displayed)

Interim Report National Annual Rural Sanitation Survey (NARSS), Round-2, 2018-2019
ANNEXURE - II: SURVEY TOOLS PAGE 167
Consent
Introduction: Greetings! My name is _____________, and I am working as an interviewer with Kantar Public, a leading research organization. At present, we are conducting a survey to assess the sanitation behaviour of the population. We wish to know about you, your family, and your village, and would like to spend about 15 minutes with you. We are talking to several people in this and other villages. Talking to us or not is your decision. Confidentiality: The information that is collected during the interview will be kept private. If you talk to us, then you will help us complete our study Contact Information: The project team is willing to answer any questions you may have concerning the procedures described or the research. If you need more information on the survey, please contact the following person:
1. Dr Anoop Tripathi, PMC, Ministry of Drinking Water and Sanitation, Contact Number-9934302546 2. Saptarshi Guha, KANTAR PUBLIC, Contact Number-011- 42697800
_________________________________________________________________ Respondent has given consent for both interview and clicking the picture of toilet - Yes- 1 No- 2
SECTION A: ACCESSIBILITY & FUNCTIONAL STATUS OF TOILET
Q No.
Question Response Options Codes Skip
Q1 Whether you and your family members have access to a toilet, if yes what kind of Toilet facility? (DO NOT READ OUT THE OPTIONS) (SINGLE CODING)
Yes- We have access to toilet Exclusively used by our family
1
Yes- We have access to toilet used by multiple families (Shared toilet facility)
2
Yes- We have access to a Public/ Community toilet facility (toilet is open to the public)
3 Go to Q 7
No- Our family doesn’t have access to any toilet (family members usually defecate in the bush, fields, or other locations)
4 Go to Q 7
If coded 4 in Q 1 & then following question need to be asked
Q1. A a. Do women and elderly in your family have access to the toilet? Yes-1, No-2 b. Does any member of your family like your son, daughter, brother whose toilet you have access
to? Yes-1, No-2
c. Do you or any other member of your family staying with you have a toilet built with your money or from any other scheme? Yes-1, No-2
d. During rainy season do you have access of toilet that you can use? Yes-1, No-2

Interim Report National Annual Rural Sanitation Survey (NARSS), Round-2, 2018-2019
ANNEXURE - II: SURVEY TOOLS PAGE 168
If response of any above four questions is ‘yes’ then CAPI will throw back to Q1 by saying as “Please check the response in Q 1 and move forward”
Q 2 Observe the functionality of toilet (The toilet which is being used by the household currently should be observed)
Yes No
Pan/ seat is completely broken 1 2
Pan is completely choked 1 2
Pits/tanks are completely covered
1 2
Pipes are completely broken or open
1 2
• If coded 1 & 2 in Q 1, then Application should open camera for clicking the picture of toilet, “Click the picture of front side of the toilet” / 2nd Photo Question- “Click the picture of inside of the toilet” / 3rd Photo Question- “Click the picture of back side of the toilet”
Q 3 Do you bring water for Toilet usage from outside OR you have water source inside your house/premises? SINGLE CODING (Observe evidence of water availability in the household –piped water supply in the toilet, or small water turf/tank next to the toilet, or bucket of water kept next to the toilet, or well in the house premises or hand-pump, or any other water source.
Yes –within the house/ premises 1
Yes – from outside premises 2
No- Water is not available for toilet usage
3
Q 4
Can you please tell me where the human waste/excreta get drained from the toilet? SINGLE CODING
Toilet drains waste directly into
Open Drain/ Nallah 1
Open pit 2
Pond or river or stream or any water body etc.
3
Septic tank without soak pit 4
Septic tank with a soak pit 5
Single leach pit toilet 6
Double leach pit toilet 7
A closed drain with Sewer system 8
Closed Pit 9
Don’t Know 10
Application should open camera for clicking the discharge area of toilet, take one photograph
Q 6 In this question, various aspects are being checked to access the hygienic situation of the toilet. Read each of the option one by one and select ‘Yes’ or ‘No’ as applicable. Please note that this is an ‘observation only’ question and it should not be asked to the respondent. OBSERVATION ONLY: Observe the hygienic situation in the toilet.
Yes No
A Toilet is connected to a tank/pit or to a sewer system
1 2
B Fly proof seal available (Water trap/lid/other)
1 2
C Whether human excreta visible in the squatting area
1 2
SECTION B: USAGE OF TOILET

Interim Report National Annual Rural Sanitation Survey (NARSS), Round-2, 2018-2019
ANNEXURE - II: SURVEY TOOLS PAGE 169
Q. No.
Question Response Options
Codes Skip
Q 7 Can you please tell me total members of your household aged 3 years or more living for last 6 months in this household, also tell me the name, age/gender and defecation practice of all your household members
Name (Prepare complete Family Roaster for members aged 3 years or more and ask about their Defecation practice) Start with elder member
A. Sex of the (name)
B. Age of the (name) in completed years
C. Does (name) use latrine always?
D. If coded as 0 in Q.no. C Did (name) use latrine often, rarely and never in last 15 days?
M F Yes No Often Rarely Never
1 1 2 -------years 1 0 1 2 0
2 1 2 -------years 1 0 1 2 0
3 1 2 -------years 1 0 1 2 0
4 1 2 -------years 1 0 1 2 0
5 1 2 -------years 1 0 1 2 0
Q 8 Are there any children aged less than 3 years in your family?
Total children
If coded ‘0’ go to Q 9
Male
Female
Q 9 How is child feces disposed mostly? (SINGLE CODING) This question would be asked for less than 3 years of child has reported in Q 7
Put into Toilet 1
Buried in the ground 2
Thrown in open area indiscriminately 3
Thrown into garbage 4
Don’t Know/Can’t Say 9
SECTION C: SOLID & LIQUID WASTE DISPOSAL PRACTICE
Q 10
OBSERVATION ONLY: Is there any garbage or litter piled up or dumped within the premise of the house? (any kind of garbage has kept as temporally should not be considered as plied /dumped up) (Please take GPS enabled photograph) SINGLE CODING (Litter would mean – solid waste (in rural areas, examples of solid waste include wastes from kitchens, gardens, cattle sheds, agriculture, and materials such as metal, paper, plastic, cloth, and so on. They are organic and inorganic materials with no remaining economic value to the owner produced by homes). It will not include properly stored garbage in covered bins for disposal, properly collected cattle dung within the premises of the house for agricultural and other uses.)
Yes 1
No 2

Interim Report National Annual Rural Sanitation Survey (NARSS), Round-2, 2018-2019
ANNEXURE - II: SURVEY TOOLS PAGE 170
If Yes coded in Q 10 then Application should open camera for “please click the photo of dumped up area”
Q 11
How is the solid waste of HH disposed mostly? Indiscriminate (there is no formal arrangement)
1
Safely disposed within the household
2
Disposed Outside to common system
3
Q 12
OBSERVATION ONLY: Is there stagnant waste water within the premise of the house? (Please take GPS enabled photograph) SINGLE CODING (Waste water means –grey water generated by households stagnant at the time of survey. It would not include accumulated rain water or permanent homestead ponds within the house premises.)
Yes 1
No 2
• If Yes coded in Q 12 then Application should open camera for “please click the photo of stagnant waste water”
Q 13
Where is the HH waste water disposed Indiscriminate 1
Flows into a common system
2
Kitchen Garden 3
Soak Pit 4
Any others (specify) 9
SECTION D: DEMOGRAPHY CHARACTERISTIC
D.1 What is the religion of Head of the Household?
Hinduism 1
Islam 2
Christianism 3
Sikhism 4
Other (specify……………….) 7
D.2 Which economic category does the head of household belong to?
APL 1
BPL 2
Don’t Know 9
D.3 Which caste category does the Head of household belong to? SINGLE RESPONSE ONLY (Interviewer may obtain a quick list of caste category for the households living in this village from the opinion leader if necessary)
Other Backward Caste 1
Scheduled Caste 2
Scheduled Tribe 3
General Caste 4
Don’t Know/Can’t Say 9
D.4 Which category head of the Household belong to? SC 1

Interim Report National Annual Rural Sanitation Survey (NARSS), Round-2, 2018-2019
ANNEXURE - II: SURVEY TOOLS PAGE 171
ST 2
Landless (No homestead land or agriculture land) having less than or equal to 0.005 acres of land.
3
Small & Marginal Farmers (who owns more than 0.005 acre but less than or equal to 4 acres of land.
4
Labourers with only Homestead land (No agriculture land)
5
Physically handicapped 6
Women Headed HH 7
None of these/ Don’t Know 8 Thank the respondent *******************
Interim Report National Annual Rural Sanitation Survey (NARSS), Round-2, 2018-2019
ANNEXURE - II: SURVEY TOOLS PAGE 172
NATIONAL ANNUAL RURAL SANITATION SURVEY (NARSS) – ROUND 2 QUESTIONNAIRE - SCHOOL Conventions used in this document: Interviewer instructions are in red, bold, font. Programmed items are in green font. Additionally, all skip would be automated Observation related questions are in bold Blue font

Interim Report National Annual Rural Sanitation Survey (NARSS), Round-2, 2018-2019
ANNEXURE - II: SURVEY TOOLS PAGE 173
IDENTIFICATION
I.1 Please select the name and code of the state/Union Territory (UT) Dropdown menu containing the names and codes of the sampled states/UTs
I.2 Please select the name and code of the district Dropdown menu containing the names and codes of the sampled district within the selected state/UT
I.2A Please select the name and code of the sub-district Dropdown menu containing the names and codes of the samples sub district within the selected district
I.3 Please select the name and code of the village Dropdown menu containing the names and codes of the sampled villages within the selected district
I.4 Type of Village – (Auto code) ODF 1 Non ODF 2
I.4.1 How many Govt schools are there in this village? Grade Number -if zero in all then end the interview
Primary (Grade 1-5)
Lower Secondary/Elementary (Grades 6-8)
Secondary (Grades 9-10)
Higher Secondary (Grades 10-12)
I.5 Please write the School name
I.6 Please write the Interviewer/supervisor name and code
I.7 Please write the name of the respondent________________
Head Master/Mistress/Principal- 1 Teacher other than HM/Principal - 2 Administrator/Non-Teaching Staff- 3
I.8 Please write the mobile number of the respondent Write ‘999999999’ if respondent doesn’t provide the phone number
I.9 Date of the interview To be auto computed (not to be displayed)
I.10 Interview start time To be auto computed (not to be displayed)

Interim Report National Annual Rural Sanitation Survey (NARSS), Round-2, 2018-2019
ANNEXURE - II: SURVEY TOOLS PAGE 174
Consent
Introduction: Greetings! My name is _____________, and I am working as an interviewer with Kantar Public, a leading research organization. At present, we are conducting a survey under Swachh Bharat Mission (SBM) for MDWS (Ministry of Drinking Water and Sanitation), Government of India to assess the sanitation behaviour of the population. We wish to know about sanitation facility in your school and would like to spend about 15 minutes with you. We are talking to several people in this and other villages. Talking to us or not is your decision. Confidentiality: The information that is collected during the interview will be kept private. If you talk to us, then you will help us complete our study Contact Information: The project team is willing to answer any questions you may have concerning the procedures described or the research. If you need more information on the survey, please contact the following person:
1. Dr Anoop Tripathi, PMC, Ministry of Drinking Water and Sanitation, Contact Number-9934302546 2. Saptarshi Guha, KANTAR PUBLIC, Contact Number-011- 42697800
_________________________________________________________________
Q. No.
Question Response Options Codes Skip
Q1 Please select the type of the school Boys school 1
Girls school 2
Co-educational school 3
Q 2 Number of Students Boys NA-9
Girl NA-9
Q 3 Education level of School (Single Coding)
Primary (Grade 1-5) 1
Lower Secondary/Elementary (Grades 6-8)
2
Secondary (Grades 9-10) 3
Higher Secondary (Grades 10-12)
4
Q 4 Does the school have access to any toilet facility? SINGLE CODING
Yes, school has access to a toilet facility
1
School do not have access to a toilet facility
2 END
Q 5 Are there separate toilets for boys and girls in the school? SINGLE CODING
Yes, there are separate toilets
1

Interim Report National Annual Rural Sanitation Survey (NARSS), Round-2, 2018-2019
ANNEXURE - II: SURVEY TOOLS PAGE 175
Q. No.
Question Response Options Codes Skip
No, there are no separate toilets
2
Not applicable 3
Interviewer should request the respondent to show the toilet facility if option 1 is selected in Q4. If respondent has given consent for clicking the picture. Q 6 Will you allow us to click the photographs of
the toilet facility which is accessible to this school?
Yes 1
No 2
• If coded 1 in Q 6 application should open camera for clicking the picture of toilet “Click the picture of inside of the toilet facility” / Click the picture of outside of the toilet facility
Q 7 Please specify the total number of toilet seats available in the school If coded 2 in Q 5 application should not accept any response in Boys or in Girls only accept in common
Boys
Girls
Common
Q 8 Please specify the total number of toilet seats functional in the school If coded 2 in Q 5 application should not accept any response in Boys or in Girls only accept in common
Boys
Girls
Common
Q8A Is the toilet locked during the survey? Yes-1 No-2
Q 9 Observe the functionality of toilet Functionality Yes No
Pan/Seat is completely broken 1 2
Pan is completely choked 1 2
Pits/tanks are completely covered 1 2
Pipes are completely broken or open 1 2
Q 10
OBSERVATION ONLY: Observe the usage of the toilet. What is the usage status of the toilet?
Yes No
Toilet appears to be well kept, in regular use with water inside or nearby
1 2
Q 11
In this question, various aspects are being checked to access the hygienic situation of the toilet. Read each of the option one by one and select ‘Yes’ or ‘No’ as applicable. Please note that this is an ‘observation only’ question and it should not be asked to the respondent. OBSERVATION ONLY: Observe the hygienic situation in the toilet.
Yes
A Toilet is connected to a tank/pit or to a sewer system
1
B Fly proof seal available (Water trap/lid/other)
1

Interim Report National Annual Rural Sanitation Survey (NARSS), Round-2, 2018-2019
ANNEXURE - II: SURVEY TOOLS PAGE 176
C Whether human excreta visible in the squatting area
1
Q 12
Observe evidence of handwashing practice after use of toilet
Only Water available near the toilet or water point
1
Soap available near the toilet or water point
2
Both water & soap available near the toilet or water point
3
Neither soap nor water available near the toilet
4
Q 13
Can you please tell me where the human waste/excreta get discharged from the toilet? SINGLE CODING
Toilet discharges waste directly into
Open Drain/Nallah 1
Open pit 2
Pond or river or stream or any water body etc.
3
Septic tank without soak pit 4
Septic tank with a soak Pit 5
Single leach pit toilet 6
Double leach pit toilet 7
A closed drain with Sewer system 8
Closed Pit 9
Don’t Know 10
*********Thank you**********

Interim Report National Annual Rural Sanitation Survey (NARSS), Round-2, 2018-2019
ANNEXURE - II: SURVEY TOOLS PAGE 177
NATIONAL ANNUAL RURAL SANITATION SURVEY (NARSS) – ROUND 2 QUESTIONNAIRE - ANGANWADI CENTRE Conventions used in this document: Interviewer instructions are in red, bold, font. Programmed items are in green font. Additionally, all skip would be automated Observation related questions are in bold Blue font

Interim Report National Annual Rural Sanitation Survey (NARSS), Round-2, 2018-2019
ANNEXURE - II: SURVEY TOOLS PAGE 178
IDENTIFICATION I.1 Please select the name and code of the state/Union Territory (UT)
Dropdown menu containing the names and codes of the sampled states/UTs
I.2 Please select the name and code of the district Dropdown menu containing the names and codes of the sampled district within the selected state/UT
I.2A Please select the name and code of the sub-district Dropdown menu containing the names and codes of the sampled sub district within the selected district
I.3 Please select the name and code of the village Dropdown menu containing the names and codes of the sampled villages within the selected district suffix with code & original/additional
I.4 Type of Village – (Auto code) ODF 1 Non ODF 2
I.4.1 How many Anganwadi centres are there in this village?
If zero then end the interview
I.5 Please write the name of the Anganwadi Worker/Helper
I.6 Please write the interviewer/Supervisor name and code
I.7 Please write the mobile number of the respondent
Write ‘999999999’ if respondent doesn’t provide the phone number
I.8 Date of the interview To be auto computed (not to be displayed)
I.9 Interview start time To be auto computed (not to be displayed)

Interim Report National Annual Rural Sanitation Survey (NARSS), Round-2, 2018-2019
ANNEXURE - II: SURVEY TOOLS PAGE 179
Consent
Introduction: Greetings! My name is _____________, and I am working as an interviewer with Kantar Public, a leading research organization. At present, we are conducting a survey under Swachh Bharat Mission (SBM) for MDWS (Ministry of Drinking Water and Sanitation), Government of India to assess the sanitation behaviour of the population. We wish to know about the sanitation facilities in your anganwadi centre and would like to spend about 15 minutes with you. We are talking to several people in this and other villages. Talking to us or not is your decision. Confidentiality: The information that is collected during the interview will be kept private. If you talk to us, then you will help us complete our study Contact Information: The project team is willing to answer any questions you may have concerning the procedures described or the research. If you need more information on the survey, please contact the following person:
1. Dr Anoop Tripathi, PMC, Ministry of Drinking Water and Sanitation, Contact Number-9934302546 2. Saptarshi Guha, KANTAR PUBLIC, Contact Number-011- 42697800
_________________________________________________________________
Q. No. Question Response Options Codes Skip
Q 1 Does the AWC have its own building? Yes, has its own building 1
No, running in Private building/house
2
Q 2 Does the AWC have access to any toilet facility? SINGLE CODING
Yes, AWC has a toilet in own premises
1 Q 3
AWC uses the toilet of the household in case of center happens in a private building
2 Q 3
AWC do not have access to a toilet facility
3 Q 10
Interviewer should request the respondent to show the toilet facility if option 1 is selected in Q2. If respondent has given consent for clicking the picture.
Q 3 Will you allow us to click the photographs of the toilet facility which is accessible to this AWC?
Yes 1
No 2
• If coded 1 in Q 3 application should open camera for clicking the picture of toilet, “Click the picture of inside of the toilet facility” / Click the picture of outside of the toilet facility
Yes 1

Interim Report National Annual Rural Sanitation Survey (NARSS), Round-2, 2018-2019
ANNEXURE - II: SURVEY TOOLS PAGE 180
Q 3A Is the toilet locked during the survey date? No 2
Q 4 Observe the functionality of toilet Yes No
Pan/seat is completely broken
1 2
Pan is completely choked
1 2
Pits/Tanks are completely covered
1 2
Pipes are completely broken or open
1 2
Q 5 OBSERVATION ONLY: Observe the presence of water near the toilet. Is there a provision of water for use of the toilet? SINGLE CODING (Observe evidence of water availability in the AWC –piped water supply in the toilet, or small water turf/tank next to the toilet, or bucket of water kept next to the toilet, or well in the house premises or hand-pump, or any other water source, plus cleanliness of the toilet.)
Yes 1
No 2
Q 6 In this question, various aspects are being checked to access the hygienic situation of the toilet. Read each of the option one by one and select ‘Yes’ or ‘No’ as applicable. Please note that this is an ‘observation only’ question and it should not be asked to the respondent. OBSERVATION ONLY: Observe the hygienic situation in the toilet.
Yes No
a Toilet is connected to a tank/pit or to a sewer system
1 2
b Fly proof seal available (Water trap/lid/other)
1 2
c Whether human excreta visible in the squatting area
1 2
Q 7 Can you please tell me where do excreta get discharge from the toilet? SINGLE CODING
Toilet discharges waste directly into
Open Drain/Nallah 1
Open pit 2
Pond or river or stream or any water body etc.
3
Septic tank without soak pit
4
Septic tank with a soak Pit 5
Single leach pit toilet 6
Double leach pit toilet 7
A closed drain with Sewer system
8
Closed Pit 9
Don’t Know 10
Q 8 OBSERVATION ONLY: Observe usage of the toilet.
Yes No

Interim Report National Annual Rural Sanitation Survey (NARSS), Round-2, 2018-2019
ANNEXURE - II: SURVEY TOOLS PAGE 181
What is the usage status of the toilet?
Toilet appears to be well kept, in regular use with water inside or nearby
1 2
Q 9 OBSERVATION ONLY Whether water is available for handwashing after the usage of toilet
Only Water available near the toilet or water point
1
Soap available near the toilet or the water point
2
Both water & soap available near the toilet or water point
3
Neither soap nor water available near the toilet
4
Q 10 If no toilet in Anganwadi Center then where do the children go to defecate?
Nearby Public Toilet 1
School Toilet 2
Own House 3
Open 4
**********Thank you********* NATIONAL ANNUAL RURAL SANITATION SURVEY (NARSS) – ROUND 2 QUESTIONNAIRE – PUBLIC/COMMUNITY TOILET

Interim Report National Annual Rural Sanitation Survey (NARSS), Round-2, 2018-2019
ANNEXURE - II: SURVEY TOOLS PAGE 182
Conventions used in this document: Interviewer instructions are in red, bold, font. Programmed items are in green font. Additionally, all skip would be automated Observation related questions are in bold Blue font

Interim Report National Annual Rural Sanitation Survey (NARSS), Round-2, 2018-2019
ANNEXURE - II: SURVEY TOOLS PAGE 183
IDENTIFICATION
I.1 Please select the name and code of the state/Union Territory (UT) Dropdown menu containing the names and codes of the sampled states/UTs
I.2 Please select the name and code of the district Dropdown menu containing the names and codes of the sampled district within the selected state/UT
I.2A Please select the name and code of the sub-district Dropdown menu containing the names and codes of the sampled sub district within the selected district
I.3 Please select the name and code of the village Dropdown menu containing the names and codes of the sampled villages within the selected district
I.4 Type of Village – (Auto code) ODF 1 Non ODF 2
I.5 Please write the interviewer/supervisor name and code
I.6 Please write the name of the respondent
I.7 Please write the mobile number of the respondent Write ‘999999999’ if respondent doesn’t provide the phone number
I.8 Date of the interview To be auto computed (not to be displayed)
I.9 Interview start time To be auto computed (not to be displayed)

Interim Report National Annual Rural Sanitation Survey (NARSS), Round-2, 2018-2019
ANNEXURE - II: SURVEY TOOLS PAGE 184
Consent
Introduction: Greetings! My name is _____________, and I am working as an interviewer with Kantar Public, a leading research organization. At present, we are conducting a survey to assess the sanitation behaviour of the population. We wish to know about the sanitation facility in this public toilet located in your village and would like to spend about 15 minutes with you. We are talking to several people in this and other villages. Talking to us or not is your decision. Confidentiality: The information that is collected during the interview will be kept private. If you talk to us, then you will help us complete our study Contact Information: The project team is willing to answer any questions you may have concerning the procedures described or the research. If you need more information on the survey, please contact the following person:
1. Dr Anoop Tripathi, PMC, Ministry of Drinking Water and Sanitation, Contact Number-9934302546 2. Saptarshi Guha, KANTAR PUBLIC, Contact Number-011- 42697800
_________________________________________________________________
Q. No.
Question Response Options Codes Skip
Q 1 Are there any public toilets located in the village? SINGLE CODING
Yes 1
No 2 END
Q1A Mention the land mark of the Community Toilet
Q 2 How many public toilet facilities are there in the village? SINGLE CODING
Interviewer should request the respondent to show the toilet facility. If respondent has given consent for clicking the picture.
Q 3 Will you allow us to click the photographs of this public toilet facility?
Yes 1
No 2
If coded 1 in Q 3 application should open camera for clicking the picture of toilet, GPS enabled two photographs must be taken of the toilet-one inside & one outside
Q 4 Are there separate sections for men and women in the toilet? SINGLE CODING
Yes, there are separate sections 1
No, there are no separate sections 2
Q 5 Observe the functionality of toilet Yes No
Pan/Seat is completely broken 1 2
Pan is completely choked 1 2

Interim Report National Annual Rural Sanitation Survey (NARSS), Round-2, 2018-2019
ANNEXURE - II: SURVEY TOOLS PAGE 185
Q. No.
Question Response Options Codes Skip
Pits/Tanks are completely covered 1 2
Pipes are completely broken or open
1 2
The toilet is locked/not in use 1 2 Skip to Q 10
Q 6 Is water available for use in the toilets Yes 1
No 2
Q 7 Observe evidence of handwashing practice after use of toilet
Only Water available near the toilet or water point
1
Soap available near the toilet or water point
2
Both water & soap available near the toilet or water point
3
Neither soap nor water available near the toilet
4
Q 8 OBSERVATION ONLY: Observe the usage of the toilet. What is the usage status of the toilet?
Yes No
Toilet appears to be well kept, in regular use with water inside or nearby
1 2
Q 9 Can you please tell me where the human waste/excreta get discharged from the toilet? SINGLE CODING
Toilet discharges waste directly into
Open Drain/Nallah 1
Open pit 2
Pond or river or stream or any water body etc.
3
Septic tank without soak pit 4
Septic tank with a soak Pit 5
Single leach pit toilet 6
Double leach pit toilet 7
A closed drain with Sewer system 8
Closed Pit 9
Q 10
Is there a user charge for use of the toilet Yes 1
No 2
**********Thank you*********

Interim Report National Annual Rural Sanitation Survey (NARSS), Round-2, 2018-2019
ANNEXURE - II: SURVEY TOOLS PAGE 186
NATIONAL ANNUAL RURAL SANITATION SURVEY (NARSS) – ROUND 2 QUESTIONNAIRE – PUBLIC SPACES SANITATION Conventions used in this document: Interviewer instructions are in red, bold, font. Programmed items are in green font. Additionally, all skip would be automated Observation related questions are in bold Blue font

Interim Report National Annual Rural Sanitation Survey (NARSS), Round-2, 2018-2019
ANNEXURE - II: SURVEY TOOLS PAGE 187
IDENTIFICATION
I.1 Please select the name and code of the state/Union Territory (UT) Dropdown menu containing the names and codes of the sampled states/UTs
I.2 Please select the name and code of the district Dropdown menu containing the names and codes of the sampled district within the selected state/UT
I.2A Please select the name and code of the Block Dropdown menu containing the names and codes of the sampled sub district within the selected state/UT
I.3 Please select the name and code of the village Dropdown menu containing the names and codes of the sampled villages within the selected district
I.4 Type of Village – (Auto code) ODF 1 Non ODF 2
I.5 Please write the supervisor name and code
I.6 Date of the interview To be auto computed (not to be displayed)
I.7 Interview start time To be auto computed (not to be displayed)
Q. No.
Question Response Options Codes Skip
Q1 Area that are/were used for open defecation in the past Faeces Found 1
faeces not found 2
Q2 A. Important Public Places or locations & B. Instances of people defecating in the open or visible faeces on ground
A. Places having instances for Open Defecation
B. Level of Instances
Available in The Village
Faeces Found
faeces not found
Yes No
Hospitals/Public Health Centre 1 2 1 2
Schools 1 2 1 2
Panchayat Bhawan 1 2 1 2
Community Centres/Halls 1 2 1 2
Places of Worship-Temple/Gurdwara/Masjid/Church
1 2 1 2
Bus stand/Railway Station/Market Places 1 2 1 2
Public/Govt Offices 1 2 1 2
Public Drinking Water Sources (Well/Hand pump/Stand post/Fountains/Springs/Community Tanks
1 2 1 2
Others (Specify) 1 2 1 2
For every places If coded 1 in Q 2B then application should camera for taking photograph

Interim Report National Annual Rural Sanitation Survey (NARSS), Round-2, 2018-2019
ANNEXURE - II: SURVEY TOOLS PAGE 188
Q3 Open ground/fields Faeces Found
1
faeces not found
2
If coded 1 in Q 3 then application should camera for taking photograph
Q4 Roads alongside the village Faeces Found
1
faeces not found
2
If coded 1 in Q 4 then application should camera for taking photograph
Q5 Any infamous places Faeces Found
1
faeces not found
2
If coded 1 in Q 5 then application should camera for taking photograph
Q 6 Is the Village performing safe disposal of Solid waste
No treatment of solid waste 1
Open burning 2
Dumped in river/ water bodies 3
Community level composting arrangement (NADEP/Vermi-compost etc.)
4
Community level waste collection arrangements
5
Segregated waste collected, and safely managed
6
Q 7 How is the waste water disposed of? (Multiple response possible)
No drainage system/ soak pit 1
Draining in open water body/river
2
Flows in some kind of safe system
3
Some kind of treatment (into drain/ kitchen garden/soak pit)
4
Q 8 Public places show minimal level of littering OBSERVATION ONLY: Observe the whole village public places and record
Yes 1
No 2
Q 9 Public places show minimal level of water logging OBSERVATION ONLY: Observe the whole village public places and record
Yes 1
No 2
**********Thank you*********

Interim Report National Annual Rural Sanitation Survey (NARSS), Round-2, 2018-2019
ANNEXURE - III: TABLES PAGE 189
ANNEXURE - III: TABLES ANNEXURE TABLES I - HOUSEHOLD HH:1. Percent distribution of social category of head of the household
States
Total ODF NON ODF O
the
r B
ackw
ard
Cas
te
Sch
ed
ule
d C
aste
Sch
ed
ule
d T
rib
e
Ge
ne
ral C
aste
Do
n’t
Kn
ow
/Can
’t S
ay
Tota
l
Oth
er
Bac
kwar
d C
aste
Sch
ed
ule
d C
aste
Sch
ed
ule
d T
rib
e
Ge
ne
ral C
aste
Do
n’t
Kn
ow
/Can
’t S
ay
Tota
l
Oth
er
Bac
kwar
d C
aste
Sch
ed
ule
d C
aste
Sch
ed
ule
d T
rib
e
Ge
ne
ral C
aste
Do
n’t
Kn
ow
/ C
an’t
Say
Tota
l
% % % % % N % % % % % N % % % % % N
Total 43.1 11.2 13.2 29.6 2.9 92411 38.9 12 13.6 32.4 3.1 43735 46.9 10.5 12.8 27 2.8 48676
A & N Islands 14.3 5.1 23.3 46.7 10.6 390 14.3 5.1 23.3 46.7 10.6 390 0 0 0 0 0 0
Andhra Pradesh 42.2 14.8 11.4 29.2 2.4 4065 40.2 15.4 10.5 31 3 2730 46.3 13.7 13.2 25.5 1.3 1335
Arunachal Pradesh 14.8 11.4 42.7 23.1 7.9 780 17.7 20.8 18.9 27.4 15.3 390 12 2.1 66.6 18.8 0.5 390
Assam 42 10.8 10.6 33.2 3.4 2860 48.8 11.6 12.2 23 4.4 630 40.1 10.6 10.1 36.1 3.1 2230
Bihar 48.8 10.5 13.2 24.7 2.8 8476 33.7 15.7 9.6 38.5 2.6 465 49.7 10.2 13.4 23.9 2.8 8011
Chhattisgarh 43.6 13.2 12.8 26.2 4.1 2760 43.6 13.2 12.8 26.2 4.1 2760 0 0 0 0 0 0
Dadra &Nagar Haveli 19.9 2.5 33.6 37 7.1 390 19.9 2.5 33.6 37 7.1 390 0 0 0 0 0 0
Goa 23.4 5.3 21.4 40.7 9.1 390 0 0 0 0 0 0 23.4 5.3 21.4 40.7 9.1 390
Gujarat 43.2 10.4 10 35.1 1.2 2910 43.2 10.4 10 35.1 1.2 2910 0 0 0 0 0 0
Haryana 46.5 9 13.8 29.7 0.9 1530 46.5 9 13.8 29.7 0.9 1530 0 0 0 0 0 0
Himachal Pradesh 38.2 10.6 13.3 35.5 2.4 825 38.2 10.6 13.3 35.5 2.4 825 0 0 0 0 0 0
Jammu & Kashmir 39.2 12.4 10.1 36.2 2.1 1197 20.6 8.2 9.8 61.1 0.3 390 48.2 14.4 10.2 24.2 3 807
Jharkhand 48.8 11.1 12.1 25.6 2.4 2278 48.4 10.7 16.5 24.2 0.2 600 49 11.2 10.5 26.1 3.2 1678
Karnataka 38.8 11.9 11.8 34.8 2.6 4047 38.2 11.6 11.1 36.2 2.9 2625 39.8 12.6 13.2 32.3 2.1 1422
Kerala 23.3 10.8 16.6 42.9 6.4 2960 23.3 10.8 16.6 42.9 6.4 2960 0 0 0 0 0 0
Madhya Pradesh 46.7 10.4 12.1 28.1 2.6 4854 40.2 11.3 14.4 30.8 3.3 1530 49.7 10 11.1 26.9 2.3 3324
Maharashtra 44.3 12.1 11.9 28.8 2.9 6360 41.9 12.7 12.3 29.9 3.2 4560 50.5 10.8 10.6 26.2 1.9 1800
Manipur 29.9 12.3 19.6 33.3 4.9 780 30.1 8.1 28.7 30.9 2.1 390 29.6 16.6 10.4 35.6 7.7 390

Interim Report National Annual Rural Sanitation Survey (NARSS), Round-2, 2018-2019
ANNEXURE - III: TABLES PAGE 190
States
Total ODF NON ODF
Oth
er
Bac
kwar
d C
aste
Sch
ed
ule
d C
aste
Sch
ed
ule
d T
rib
e
Ge
ne
ral C
aste
Do
n’t
Kn
ow
/Can
’t S
ay
Tota
l
Oth
er
Bac
kwar
d C
aste
Sch
ed
ule
d C
aste
Sch
ed
ule
d T
rib
e
Ge
ne
ral C
aste
Do
n’t
Kn
ow
/Can
’t S
ay
Tota
l
Oth
er
Bac
kwar
d C
aste
Sch
ed
ule
d C
aste
Sch
ed
ule
d T
rib
e
Ge
ne
ral C
aste
Do
n’t
Kn
ow
/ C
an’t
Say
Tota
l
% % % % % N % % % % % N % % % % % N
Meghalaya 25.3 10.6 31.5 29.1 3.5 780 23.8 11.4 33.4 25.9 5.5 390 26.9 9.7 29.6 32.3 1.6 390
Mizoram 16.9 4.3 49.8 27.5 1.6 790 17.1 6.2 44.9 30.7 1.1 395 16.7 2.4 54.7 24.2 2 395
Nagaland 26.8 4.9 37.6 27.2 3.4 780 33.9 7.1 24.7 30.1 4.2 390 19.8 2.8 50.5 24.3 2.6 390
Odisha 50 10.6 11.2 24.6 3.6 4244 46.5 12.3 11.2 27.1 3 480 50.4 10.4 11.2 24.3 3.7 3764
Puducherry 28.6 5.6 33.1 31.7 1.1 390 0 0 0 0 0 0 28.6 5.6 33.1 31.7 1.1 390
Punjab 45.3 10.5 9.4 32.2 2.6 1620 38.4 8.9 9.2 39 4.5 900 53.9 12.5 9.7 23.7 0.2 720
Rajasthan 44.1 12.1 11.2 29.7 2.8 5940 43.3 13.1 11 30.4 2.2 4530 47 9 11.8 27.5 4.7 1410
Sikkim 9.9 5.9 51.3 31.4 1.5 390 9.9 5.9 51.3 31.4 1.5 390 0 0 0 0 0 0
Tamil Nadu 45.4 12.2 12.3 27.3 2.7 4980 41.4 16 11.2 29.9 1.5 975 46.4 11.3 12.6 26.7 3 4005
Telangana 48.3 11 15.7 22.9 2.1 2469 47 10.8 16.5 23.6 2 1020 49.2 11.1 15.1 22.4 2.2 1449
Tripura 43.9 12.9 10.7 32.5 0 390 0 0 0 0 0 0 43.9 12.9 10.7 32.5 0 390
Uttar Pradesh 48.3 11.1 9.8 28 2.8 13330 44.1 14.8 9.2 29.3 2.6 1995 49.1 10.5 9.9 27.7 2.8 11335
Uttarakhand 41 11.8 11.6 34.9 0.8 870 41 11.8 11.6 34.9 0.8 870 0 0 0 0 0 0
West Bengal 42.4 11.6 11 32.4 2.6 7586 38.8 12.6 12.5 33.3 2.7 5325 50.9 9.2 7.3 30.2 2.4 2261
All HH surveyed
HH:2. Economic category of head of the household
States Total ODF NON ODF
APL BPL Don’t Know
Total APL BPL Don’t Know
Total APL BPL Don’t Know
Total
% % % N % % % N % % % N
Total 34.1 59.4 6.6 92411 35.7 57.7 6.7 43735 32.6 60.9 6.5 48676
A & N Islands 40.5 52.7 6.8 390 40.5 52.7 6.8 390 0.0 0.0 0.0 0
Andhra Pradesh 30.1 62.8 7.1 4065 28.8 63.5 7.8 2730 32.9 61.4 5.6 1335
Arunachal Pradesh 28.2 68.4 3.4 780 33.2 61.5 5.3 390 23.2 75.2 1.5 390
Assam 34.4 58.4 7.2 2860 31.8 63.4 4.7 630 35.2 56.9 7.9 2230

Interim Report National Annual Rural Sanitation Survey (NARSS), Round-2, 2018-2019
ANNEXURE - III: TABLES PAGE 191
States Total ODF NON ODF
APL BPL Don’t Know
Total APL BPL Don’t Know
Total APL BPL Don’t Know
Total
% % % N % % % N % % % N
Bihar 32.2 61.4 6.4 8476 29.6 60.1 10.3 465 32.4 61.4 6.2 8011
Chhattisgarh 33.9 59.3 6.9 2760 33.9 59.3 6.9 2760 0.0 0.0 0.0 0
Dadra &Nagar Haveli 48.6 46.7 4.7 390 48.6 46.7 4.7 390 0.0 0.0 0.0 0
Goa 29.8 57.9 12.3 390 0.0 0.0 0.0 0 29.8 57.9 12.3 390
Gujarat 42.5 52.8 4.7 2910 42.5 52.8 4.7 2910 0.0 0.0 0.0 0
Haryana 36.2 54.8 9.0 1530 36.2 54.8 9.0 1530 0.0 0.0 0.0 0
Himachal Pradesh 33.3 59.7 7.0 825 33.3 59.7 7.0 825 0.0 0.0 0.0 0
Jammu & Kashmir 37.1 58.8 4.1 1197 44.5 50.4 5.2 390 33.6 62.9 3.6 807
Jharkhand 27.2 65.7 7.1 2278 32.0 59.8 8.2 600 25.5 67.8 6.7 1678
Karnataka 26.6 67.3 6.0 4047 26.9 67.9 5.2 2625 26.2 66.4 7.4 1422
Kerala 30.6 60.3 9.1 2960 30.6 60.3 9.1 2960 0.0 0.0 0.0 0
Madhya Pradesh 36.6 57.3 6.0 4854 38.9 54.5 6.5 1530 35.6 58.6 5.8 3324
Maharashtra 32.0 60.9 7.1 6360 31.6 60.8 7.6 4560 33.0 61.3 5.8 1800
Manipur 27.4 61.5 11.1 780 27.6 59.2 13.2 390 27.3 63.8 8.9 390
Meghalaya 27.8 67.4 4.8 780 23.1 70.9 5.9 390 32.4 63.9 3.7 390
Mizoram 49.0 48.2 2.8 790 54.5 42.6 2.9 395 43.4 53.8 2.8 395
Nagaland 26.9 67.4 5.7 780 27.3 65.5 7.1 390 26.5 69.2 4.3 390
Odisha 30.5 63.0 6.4 4244 33.5 59.5 6.9 480 30.1 63.5 6.4 3764
Puducherry 21.9 62.1 16.0 390 0.0 0.0 0.0 0 21.9 62.1 16.0 390
Punjab 35.6 59.5 4.9 1620 40.7 52.9 6.4 900 29.3 67.8 3.0 720
Rajasthan 37.5 55.0 7.5 5940 37.2 55.4 7.4 4530 38.4 53.8 7.9 1410
Sikkim 49.8 45.3 5.0 390 49.8 45.3 5.0 390 0.0 0.0 0.0 0
Tamil Nadu 36.8 57.0 6.2 4980 46.0 49.1 4.9 975 34.5 58.9 6.6 4005
Telangana 32.1 62.4 5.5 2469 30.5 62.6 6.9 1020 33.3 62.2 4.5 1449
Tripura 40.1 54.7 5.2 390 0.0 0.0 0.0 0 40.1 54.7 5.2 390
Uttar Pradesh 34.3 58.7 7.0 13330 41.3 52.0 6.8 1995 33.1 59.8 7.1 11335
Uttarakhand 37.0 57.9 5.1 870 37.0 57.9 5.1 870 0.0 0.0 0.0 0
West Bengal 38.2 56.2 5.6 7586 40.5 54.6 4.9 5325 32.9 60.0 7.1 2261
All HH surveyed

Interim Report National Annual Rural Sanitation Survey (NARSS), Round-2, 2018-2019
ANNEXURE - III: TABLES PAGE 192
HH:3. Accessibility to the Toilets of the households
States
Total ODF Non ODF
Ow
n
Toile
t
Shar
ed
Toile
t
Co
mm
un
i
ty T
oile
t
No
Acc
ess
to t
oile
t
Tota
l
Ow
n
Toile
t
Shar
ed
To
ilet
Co
mm
un
i
ty T
oile
t
No
Acc
ess
to
to
ilet
Tota
l
Ow
n
Toile
t
Shar
ed
Toile
t
Co
mm
un
i
ty T
oile
t
No
Acc
ess
to t
oile
t
Tota
l
% % % % N % % % % N % % % % N
Total 81.5 10.1 1.7 6.7 92411 89.9 6.9 1.1 2.0 43735 73.9 2.3 10.9 48676 0.0
A & N Islands 92.3 6.6 0.3 0.8 390 92.3 6.6 0.3 0.8 390 0.0 0.0 0.0 0 0.0
Andhra Pradesh 84.2 11.3 0.2 4.3 4065 87.8 10.4 0.3 1.4 2730 76.8 0.0 10.0 1335 0.0
Arunachal Pradesh 94.4 5.2 0.0 0.4 780 90.6 9.4 0.0 0.0 390 98.2 0.0 0.8 390 0.0
Assam 88.8 7.8 0.6 2.7 2860 88.8 5.9 0.0 5.3 630 88.8 0.8 2.0 2230 0.0
Bihar 59.6 13.0 1.0 26.4 8476 78.8 6.3 0.8 14.1 465 58.5 1.0 27.1 8011 0.0
Chhattisgarh 89.2 9.5 0.2 1.1 2760 89.2 9.5 0.2 1.1 2760 0.0 0.0 0.0 0 0.0
Dadra And Nagar Haveli 97.3 2.7 0.0 0.0 390 97.3 2.7 0.0 0.0 390 0.0 0.0 0.0 0 0.0
Goa 94.7 3.4 0.1 1.9 390 0.0 0.0 0.0 0.0 0 94.7 0.1 1.9 390 0.0
Gujarat 93.9 4.6 0.3 1.2 2910 93.9 4.6 0.3 1.2 2910 0.0 0.0 0.0 0 0.0
Haryana 94.4 4.8 0.4 0.4 1530 94.4 4.8 0.4 0.4 1530 0.0 0.0 0.0 0 0.0
Himachal Pradesh 93.4 5.2 0.3 1.1 825 93.4 5.2 0.3 1.1 825 0.0 0.0 0.0 0 0.0
Jammu & Kashmir 79.0 6.3 0.0 14.7 1197 84.8 8.8 0.0 6.4 390 76.2 0.0 18.7 807 0.0
Jharkhand 67.6 15.4 1.7 15.3 2278 79.5 9.5 0.9 10.1 600 63.4 1.9 17.2 1678 0.0
Karnataka 81.0 13.3 1.1 4.6 4047 85.0 11.9 0.9 2.3 2625 73.6 1.7 8.8 1422 0.0
Kerala 99.8 0.2 0.0 0.1 2960 99.8 0.2 0.0 0.1 2960 0.0 0.0 0.0 0 0.0
Madhya Pradesh 76.7 17.1 0.3 5.9 4854 86.3 11.2 0.5 2.0 1530 72.3 0.2 7.8 3324 0.0
Maharashtra 78.5 9.5 6.6 5.5 6360 81.1 8.6 6.7 3.6 4560 71.9 6.2 10.1 1800 0.0
Manipur 88.1 11.9 0.0 0.0 780 88.0 12.0 0.0 0.0 390 88.1 0.0 0.0 390 0.0
Meghalaya 90.7 8.9 0.0 0.4 780 87.1 12.9 0.0 0.0 390 94.3 0.0 0.8 390 0.0
Mizoram 99.8 0.2 0.0 0.0 790 99.8 0.2 0.0 0.0 395 99.7 0.0 0.0 395 0.0
Nagaland 89.5 7.2 3.3 0.0 780 91.6 5.9 2.5 0.0 390 87.5 4.2 0.0 390 0.0
Odisha 63.2 8.2 0.8 27.8 4244 96.7 1.6 0.0 1.7 480 59.0 0.9 31.1 3764 0.0
Puducherry 72.1 9.2 13.9 4.8 390 0.0 0.0 0.0 0.0 0 72.1 13.9 4.8 390 0.0
Punjab 84.4 12.9 0.0 2.7 1620 87.0 10.3 0.0 2.7 900 81.2 0.0 2.8 720 0.0
Rajasthan 89.6 5.3 0.7 4.4 5940 91.1 4.8 0.5 3.5 4530 84.9 1.2 7.1 1410 0.0
Sikkim 97.9 2.1 0.0 0.0 390 97.9 2.1 0.0 0.0 390 0.0 0.0 0.0 0 0.0
Tamil Nadu 74.8 9.8 15.1 0.3 4980 87.5 5.5 6.6 0.4 975 71.7 17.2 0.3 4005 0.0
Telangana 85.3 11.1 0.0 3.6 2469 90.6 5.8 0.0 3.6 1020 81.5 0.0 3.6 1449 0.0
Tripura 97.2 0.2 1.1 1.4 390 0.0 0.0 0.0 0.0 0 97.2 1.1 1.4 390 0.0

Interim Report National Annual Rural Sanitation Survey (NARSS), Round-2, 2018-2019
ANNEXURE - III: TABLES PAGE 193
States
Total ODF Non ODF
Ow
n
Toile
t
Shar
ed
Toile
t
Co
mm
un
i
ty T
oile
t
No
Acc
ess
to t
oile
t
Tota
l
Ow
n
Toile
t
Shar
ed
To
ilet
Co
mm
un
i
ty T
oile
t
No
Acc
ess
to
to
ilet
Tota
l
Ow
n
Toile
t
Shar
ed
Toile
t
Co
mm
un
i
ty T
oile
t
No
Acc
ess
to t
oile
t
Tota
l
% % % % N % % % % N % % % % N
Uttar Pradesh 82.3 15.3 0.2 2.2 13330 91.1 8.3 0.2 0.4 1995 80.8 0.1 2.5 11335 0.0
Uttarakhand 90.7 8.8 0.0 0.5 870 90.7 8.8 0.0 0.5 870 0.0 0.0 0.0 0 0.0
West Bengal 88.1 6.7 0.3 4.9 7586 92.0 6.1 0.2 1.7 5325 78.9 0.5 12.6 2261 0.0
All HH surveyed

Interim Report National Annual Rural Sanitation Survey (NARSS), Round-2, 2018-2019
ANNEXURE - III: TABLES PAGE 194
HH:4. Household with accessibility to the toilet States Total ODF NON ODF
Access Non- Access Total Access Non- Access Total Access Non- Access Total
% % N % % N % % N
Total 93.3 6.7 92411 98.0 2.0 43735 89.1 10.9 48676
A & N Islands 99.2 .8 390 99.2 .8 390 0.0 0.0 0
Andhra Pradesh 95.7 4.3 4065 98.6 1.4 2730 90.0 10.0 1335
Arunachal Pradesh 99.6 .4 780 100.0 0.0 390 99.2 .8 390
Assam 97.3 2.7 2860 94.7 5.3 630 98.0 2.0 2230
Bihar 73.6 26.4 8476 85.9 14.1 465 72.9 27.1 8011
Chhattisgarh 98.9 1.1 2760 98.9 1.1 2760 0.0 0.0 0
Dadra And Nagar Haveli 100.0 0.0 390 100.0 0.0 390 0.0 0.0 0
Goa 98.1 1.9 390 0.0 0.0 0 98.1 1.9 390
Gujarat 98.8 1.2 2910 98.8 1.2 2910 0.0 0.0 0
Haryana 99.6 .4 1530 99.6 .4 1530 0.0 0.0 0
Himachal Pradesh 98.9 1.1 825 98.9 1.1 825 0.0 0.0 0
Jammu & Kashmir 85.3 14.7 1197 93.6 6.4 390 81.3 18.7 807
Jharkhand 84.7 15.3 2278 89.9 10.1 600 82.8 17.2 1678
Karnataka 95.4 4.6 4047 97.7 2.3 2625 91.2 8.8 1422
Kerala 99.9 .1 2960 99.9 .1 2960 0.0 0.0 0
Madhya Pradesh 94.1 5.9 4854 98.0 2.0 1530 92.2 7.8 3324
Maharashtra 94.5 5.5 6360 96.4 3.6 4560 89.9 10.1 1800
Manipur 100.0 0.0 780 100.0 0.0 390 100.0 0.0 390
Meghalaya 99.6 .4 780 100.0 0.0 390 99.2 .8 390
Mizoram 100.0 0.0 790 100.0 0.0 395 100.0 0.0 395
Nagaland 100.0 0.0 780 100.0 0.0 390 100.0 0.0 390
Odisha 72.2 27.8 4244 98.3 1.7 480 68.9 31.1 3764
Puducherry 95.2 4.8 390 0.0 0.0 0 95.2 4.8 390
Punjab 97.3 2.7 1620 97.3 2.7 900 97.2 2.8 720
Rajasthan 95.6 4.4 5940 96.5 3.5 4530 92.9 7.1 1410
Sikkim 100.0 0.0 390 100.0 0.0 390 0.0 0.0 0
Tamil Nadu 99.7 .3 4980 99.6 .4 975 99.7 .3 4005
Telangana 96.4 3.6 2469 96.4 3.6 1020 96.4 3.6 1449
Tripura 98.6 1.4 390 0.0 0.0 0 98.6 1.4 390
Uttar Pradesh 97.8 2.2 13330 99.6 .4 1995 97.5 2.5 11335
Uttarakhand 99.5 .5 870 99.5 .5 870 0.0 0.0 0
West Bengal 95.1 4.9 7586 98.3 1.7 5325 87.4 12.6 2261

Interim Report National Annual Rural Sanitation Survey (NARSS), Round-2, 2018-2019
ANNEXURE - III: TABLES PAGE 195
States Total ODF NON ODF
Access Non- Access Total Access Non- Access Total Access Non- Access Total
% % N % % N % % N
All HH surveyed

Interim Report National Annual Rural Sanitation Survey (NARSS), Round-2, 2018-2019
ANNEXURE - III: TABLES PAGE 196
HH:5. Percentage of Functional Toilets in the household States Total ODF Non-ODF
Functional Non-functional
Total Functional Non-functional
Total Functional Non-functional
Total
% % N % % N % % N
Total 98.6 1.4 84590 99.7 0.3 42347 97.5 2.5 42243
A & N Islands 100.0 0.0 386 100.0 0.0 386 0.0 0.0 0
Andhra Pradesh 99.3 0.7 3882 99.8 0.2 2681 98.3 1.7 1201
Arunachal Pradesh 99.7 0.3 777 100.0 0.0 390 99.5 0.5 387
Assam 97.6 2.4 2765 98.9 1.1 597 97.2 2.8 2169
Bihar 99.0 1.0 6152 99.7 0.3 396 99.0 1.0 5756
Chhattisgarh 99.9 0.1 2724 99.9 0.1 2724 0.0 0.0 0
Dadra And Nagar Haveli 100.0 0.0 390 100.0 0.0 390 0.0 0.0 0
Goa 97.3 2.7 383 0.0 0.0 0 97.3 2.7 383
Gujarat 100.0 0.0 2868 100.0 0.0 2868 0.0 0.0 0
Haryana 100.0 0.0 1518 100.0 0.0 1518 0.0 0.0 0
Himachal Pradesh 99.7 0.3 813 99.7 0.3 813 0.0 0.0 0
Jammu & Kashmir 99.3 0.7 1021 100.0 0.0 365 98.9 1.1 656
Jharkhand 96.4 3.6 1892 93.9 6.1 534 97.4 2.6 1358
Karnataka 99.5 0.5 3815 100.0 0.0 2543 98.6 1.4 1272
Kerala 100.0 0.0 2958 100.0 0.0 2958 0.0 0.0 0
Madhya Pradesh 97.8 2.2 4552 99.9 0.1 1492 96.8 3.2 3060
Maharashtra 99.5 0.5 5593 100.0 0.0 4087 98.3 1.7 1506
Manipur 99.2 0.8 780 100.0 0.0 390 98.3 1.7 390
Meghalaya 98.0 2.0 777 100.0 0.0 390 96.1 3.9 387
Mizoram 99.9 0.1 790 99.7 0.3 395 100.0 0.0 395
Nagaland 99.2 0.8 754 99.2 0.8 380 99.2 0.8 374
Odisha 96.0 4.0 3031 99.0 1.0 472 95.5 4.5 2559
Puducherry 99.7 0.3 317 0.0 0.0 0 99.7 0.3 317
Punjab 97.3 2.7 1576 99.9 0.1 876 94.1 5.9 700
Rajasthan 99.9 0.1 5639 99.9 0.1 4346 99.9 0.1 1293
Sikkim 100.0 0.0 390 100.0 0.0 390 0.0 0.0 0
Tamil Nadu 96.9 3.1 4213 100.0 0.0 906 96.0 4.0 3307
Telangana 99.8 0.2 2380 100.0 0.0 983 99.7 0.3 1397
Tripura 99.0 1.0 380 0.0 0.0 0 99.0 1.0 380
Uttar Pradesh 97.7 2.3 13017 99.2 0.8 1983 97.5 2.5 11033
Uttarakhand 100.0 0.0 866 100.0 0.0 866 0.0 0.0 0

Interim Report National Annual Rural Sanitation Survey (NARSS), Round-2, 2018-2019
ANNEXURE - III: TABLES PAGE 197
States Total ODF Non-ODF
Functional Non-functional
Total Functional Non-functional
Total Functional Non-functional
Total
% % N % % N % % N
West Bengal 98.2 1.8 7190 99.6 0.4 5226 94.6 5.4 1964
If coded 1 or 2 in Q.1
HH:6. Availability of water by location
States
Total ODF NON ODF
Ye
s –w
ith
in t
he
ho
use
/ p
rem
ise
s
Ye
s –
fro
m o
uts
ide
pre
mis
es
No
- W
ate
r is
no
t av
aila
ble
fo
r to
ilet
usa
ge
Tota
l
Ye
s –w
ith
in t
he
h
ou
se/
pre
mis
es
Ye
s –
fro
m o
uts
ide
p
rem
ise
s
No
- W
ate
r is
no
t
avai
lab
le f
or
toile
t
usa
ge
Tota
l
Ye
s –w
ith
in t
he
h
ou
se/
pre
mis
es
Ye
s –
fro
m o
uts
ide
p
rem
ise
s
No
- W
ate
r is
no
t
avai
lab
le f
or
toile
t
usa
ge
Tota
l
% % % N % % % N % % % N
Total 69.1 30.6 .3 84590 72.2 27.5 .3 42347 66.0 33.7 .3 42243
A & N Islands 89.7 10.1 .2 386 89.7 10.1 .2 386 0.0 0.0 0.0 0
Andhra Pradesh 67.3 30.9 1.8 3882 73.2 25.3 1.5 2681 54.2 43.5 2.4 1201
Arunachal Pradesh 70.7 29.3 0.0 777 80.9 19.1 0.0 390 60.4 39.6 0.0 387
Assam 74.6 25.3 .1 2765 82.0 17.6 .3 597 72.5 27.5 0.0 2169
Bihar 69.1 30.9 .0 6152 78.4 21.6 0.0 396 68.4 31.6 .0 5756
Chhattisgarh 48.4 50.1 1.5 2724 48.4 50.1 1.5 2724 0.0 0.0 0.0 0
Dadra &Nagar Haveli 68.6 31.4 0.0 390 68.6 31.4 0.0 390 0.0 0.0 0.0 0
Goa 88.0 12.0 0.0 383 0.0 0.0 0.0 0 88.0 12.0 0.0 383
Gujarat 71.8 28.1 .1 2868 71.8 28.1 .1 2868 0.0 0.0 0.0 0
Haryana 94.0 6.0 0.0 1518 94.0 6.0 0.0 1518 0.0 0.0 0.0 0
Himachal Pradesh 78.3 21.7 0.0 813 78.3 21.7 0.0 813 0.0 0.0 0.0 0
Jammu & Kashmir 83.1 16.9 0.0 1021 91.9 8.1 0.0 365 78.2 21.8 0.0 656
Jharkhand 46.4 51.9 1.7 1892 35.4 61.1 3.5 534 50.7 48.3 1.0 1358
Karnataka 57.3 42.6 .1 3815 61.4 38.6 0.0 2543 49.0 50.8 .2 1272
Kerala 88.3 11.7 0.0 2958 88.3 11.7 0.0 2958 0.0 0.0 0.0 0
Madhya Pradesh 56.7 43.2 .1 4552 56.0 44.0 0.0 1492 57.0 42.8 .2 3060
Maharashtra 80.2 19.8 .0 5593 81.2 18.8 .0 4087 77.5 22.5 0.0 1506
Manipur 76.0 24.0 0.0 780 77.6 22.4 0.0 390 74.5 25.5 0.0 390

Interim Report National Annual Rural Sanitation Survey (NARSS), Round-2, 2018-2019
ANNEXURE - III: TABLES PAGE 198
States
Total ODF NON ODF
Ye
s –w
ith
in t
he
ho
use
/ p
rem
ise
s
Ye
s –
fro
m o
uts
ide
pre
mis
es
No
- W
ate
r is
no
t av
aila
ble
fo
r to
ilet
usa
ge
Tota
l
Ye
s –w
ith
in t
he
h
ou
se/
pre
mis
es
Ye
s –
fro
m o
uts
ide
p
rem
ise
s
No
- W
ate
r is
no
t
avai
lab
le f
or
toile
t
usa
ge
Tota
l
Ye
s –w
ith
in t
he
h
ou
se/
pre
mis
es
Ye
s –
fro
m o
uts
ide
p
rem
ise
s
No
- W
ate
r is
no
t
avai
lab
le f
or
toile
t
usa
ge
Tota
l
% % % N % % % N % % % N
Meghalaya 77.9 21.9 .1 777 77.2 22.8 0.0 390 78.7 21.0 .3 387
Mizoram 88.3 11.7 0.0 790 85.0 15.0 0.0 395 91.6 8.4 0.0 395
Nagaland 67.0 32.9 .1 754 64.5 35.5 0.0 380 69.5 30.3 .3 374
Odisha 44.6 52.8 2.6 3031 46.8 51.9 1.3 472 44.2 52.9 2.8 2559
Puducherry 83.3 16.4 .3 317 0.0 0.0 0.0 0 83.3 16.4 .3 317
Punjab 96.3 3.6 .1 1576 96.6 3.3 .1 876 96.0 4.0 0.0 700
Rajasthan 68.4 31.6 0.0 5639 69.0 31.0 0.0 4346 66.6 33.4 0.0 1293
Sikkim 89.7 10.3 0.0 390 89.7 10.3 0.0 390 0.0 0.0 0.0 0
Tamil Nadu 77.2 22.4 .3 4213 72.2 27.6 .2 906 78.6 21.0 .3 3307
Telangana 74.8 25.2 0.0 2380 66.5 33.5 0.0 983 80.6 19.4 0.0 1397
Tripura 43.4 56.6 0.0 380 0.0 0.0 0.0 0 43.4 56.6 0.0 380
Uttar Pradesh 64.2 35.8 .0 13017 73.0 26.9 .0 1983 62.6 37.4 0.0 11033
Uttarakhand 68.4 31.6 0.0 866 68.4 31.6 0.0 866 0.0 0.0 0.0 0
West Bengal 71.0 28.8 .3 7190 69.6 30.1 .3 5226 74.6 25.2 .2 1964
If coded 1 or 2 in Q.1
HH:7. Percent distribution of availability of water for toilet use by village category
States Total ODF Non-ODF
Yes No Total Yes No Total Yes No Total
% % N % % N % % N
Total 99.7 0.3 84590 99.7 0.3 42347 99.7 0.3 42243
A & N Islands 99.8 0.2 386 99.8 0.2 386 0.0 0.0 0
Andhra Pradesh 98.2 1.8 3882 98.5 1.5 2681 97.6 2.4 1201
Arunachal Pradesh 100.0 0.0 777 100.0 0.0 390 100.0 0.0 387
Assam 99.9 0.1 2765 99.7 0.3 597 100.0 0.0 2169
Bihar 100.0 0.0 6152 100.0 0.0 396 100.0 0.0 5756
Chhattisgarh 98.5 1.5 2724 98.5 1.5 2724 0.0 0.0 0

Interim Report National Annual Rural Sanitation Survey (NARSS), Round-2, 2018-2019
ANNEXURE - III: TABLES PAGE 199
States Total ODF Non-ODF
Yes No Total Yes No Total Yes No Total
% % N % % N % % N
Dadra &Nagar Haveli 100.0 0.0 390 100.0 0.0 390 0.0 0.0 0
Goa 100.0 0.0 383 0.0 0.0 0 100.0 0.0 383
Gujarat 99.9 0.1 2868 99.9 0.1 2868 0.0 0.0 0
Haryana 100.0 0.0 1518 100.0 0.0 1518 0.0 0.0 0
Himachal Pradesh 100.0 0.0 813 100.0 0.0 813 0.0 0.0 0
Jammu & Kashmir 100.0 0.0 1021 100.0 0.0 365 100.0 0.0 656
Jharkhand 98.3 1.7 1892 96.5 3.5 534 99.0 1.0 1358
Karnataka 99.9 0.1 3815 100.0 0.0 2543 99.8 0.2 1272
Kerala 100.0 0.0 2958 100.0 0.0 2958 0.0 0.0 0
Madhya Pradesh 99.9 0.1 4552 100.0 0.0 1492 99.8 0.2 3060
Maharashtra 100.0 0.0 5593 100.0 0.0 4087 100.0 0.0 1506
Manipur 100.0 0.0 780 100.0 0.0 390 100.0 0.0 390
Meghalaya 99.9 0.1 777 100.0 0.0 390 99.7 0.3 387
Mizoram 100.0 0.0 790 100.0 0.0 395 100.0 0.0 395
Nagaland 99.9 0.1 754 100.0 0.0 380 99.7 0.3 374
Odisha 97.4 2.6 3031 98.7 1.3 472 97.2 2.8 2559
Puducherry 99.7 0.3 317 0.0 0.0 0 99.7 0.3 317
Punjab 99.9 0.1 1576 99.9 0.1 876 100.0 0.0 700
Rajasthan 100.0 0.0 5639 100.0 0.0 4346 100.0 0.0 1293
Sikkim 100.0 0.0 390 100.0 0.0 390 0.0 0.0 0
Tamil Nadu 99.7 0.3 4213 99.8 0.2 906 99.7 0.3 3307
Telangana 100.0 0.0 2380 100.0 0.0 983 100.0 0.0 1397
Tripura 100.0 0.0 380 0.0 0.0 0 100.0 0.0 380
Uttar Pradesh 100.0 0.0 13017 100.0 0.0 1983 100.0 0.0 11033
Uttarakhand 100.0 0.0 866 100.0 0.0 866 0.0 0.0 0
West Bengal 99.7 0.3 7190 99.7 0.3 5226 99.8 0.2 1964
If coded 1 or 2 in Q.1
HH:8. Percentage of hygienic toilet in the household
States Total ODF Non-ODF
Hygienic Un-hygienic Total Hygienic Un-hygienic Total Hygienic Un-hygienic Total
% % N % % N % % N
Total 95.0 5.0 84590 99.5 0.5 42347 90.5 9.5 42243

Interim Report National Annual Rural Sanitation Survey (NARSS), Round-2, 2018-2019
ANNEXURE - III: TABLES PAGE 200
States Total ODF Non-ODF
Hygienic Un-hygienic Total Hygienic Un-hygienic Total Hygienic Un-hygienic Total
% % N % % N % % N
A & N Islands 98.2 1.8 386 98.2 1.8 386 0.0 0.0 0
Andhra Pradesh 99.0 1.0 3882 99.8 0.2 2681 97.1 2.9 1201
Arunachal Pradesh 98.5 1.5 777 99.7 0.3 390 97.1 2.9 387
Assam 92.7 7.3 2765 98.4 1.6 597 91.1 8.9 2169
Bihar 95.2 4.8 6152 99.3 0.7 396 95.0 5.0 5756
Chhattisgarh 99.9 0.1 2724 99.9 0.1 2724 0.0 0.0 0
Dadra And Nagar Haveli 100.0 0.0 390 100.0 0.0 390 0.0 0.0 0
Goa 85.9 14.1 383 0.0 0.0 0 85.9 14.1 383
Gujarat 100.0 0.0 2868 100.0 0.0 2868 0.0 0.0 0
Haryana 100.0 0.0 1518 100.0 0.0 1518 0.0 0.0 0
Himachal Pradesh 99.9 0.1 813 99.9 0.1 813 0.0 0.0 0
Jammu & Kashmir 98.5 1.5 1021 100.0 0.0 365 97.6 2.4 656
Jharkhand 84.4 15.6 1892 94.1 5.9 534 80.5 19.5 1358
Karnataka 92.7 7.3 3815 98.0 2.0 2543 82.1 17.9 1272
Kerala 100.0 0.0 2958 100.0 0.0 2958 0.0 0.0 0
Madhya Pradesh 94.4 5.6 4552 99.9 0.1 1492 91.8 8.2 3060
Maharashtra 95.1 4.9 5593 99.8 0.2 4087 82.4 17.6 1506
Manipur 96.7 3.3 780 99.8 0.2 390 93.6 6.4 390
Meghalaya 95.9 4.1 777 100.0 0.0 390 91.8 8.2 387
Mizoram 96.1 3.9 790 99.7 0.3 395 92.5 7.5 395
Nagaland 97.4 2.6 754 99.2 0.8 380 95.6 4.4 374
Odisha 85.5 14.5 3031 98.8 1.2 472 83.1 16.9 2559
Puducherry 96.8 3.2 317 0.0 0.0 0 96.8 3.2 317
Punjab 96.7 3.3 1576 99.9 0.1 876 92.6 7.4 700
Rajasthan 99.1 0.9 5639 99.7 0.3 4346 97.0 3.0 1293
Sikkim 99.7 0.3 390 99.7 0.3 390 0.0 0.0 0
Tamil Nadu 92.1 7.9 4213 98.9 1.1 906 90.2 9.8 3307
Telangana 99.1 0.9 2380 100.0 0.0 983 98.5 1.5 1397
Tripura 94.6 5.4 380 0.0 0.0 0 94.6 5.4 380
Uttar Pradesh 91.3 8.7 13017 99.1 0.9 1983 89.9 10.1 11033
Uttarakhand 99.6 0.4 866 99.6 0.4 866 0.0 0.0 0
West Bengal 95.6 4.4 7190 99.6 0.4 5226 85.2 14.8 1964
If coded 1 or 2 in Q.1

Interim Report National Annual Rural Sanitation Survey (NARSS), Round-2, 2018-2019
ANNEXURE - III: TABLES PAGE 201
HH:9. Percentage of toilet with safe disposal in the households States Total ODF Non- ODF
Safe Unsafe Total Safe Unsafe Total Safe Unsafe Total
% % N % % N % % N
Total 99.6 0.4 84590 100.0 0.0 42347 99.1 0.9 42243
A & N Islands 100.0 0.0 386 100.0 0.0 386 0.0 0.0 0
Andhra Pradesh 99.6 0.4 3882 99.9 0.1 2681 98.8 1.2 1201
Arunachal Pradesh 99.7 0.3 777 100.0 0.0 390 99.5 0.5 387
Assam 97.6 2.4 2765 99.8 0.2 597 97.0 3.0 2169
Bihar 99.2 0.8 6152 100.0 0.0 396 99.1 0.9 5756
Chhattisgarh 100.0 0.0 2724 100.0 0.0 2724 0.0 0.0 0
Dadra And Nagar Haveli 100.0 0.0 390 100.0 0.0 390 0.0 0.0 0
Goa 99.7 0.3 383 0.0 0.0 0 99.7 0.3 383
Gujarat 100.0 0.0 2868 100.0 0.0 2868 0.0 0.0 0
Haryana 100.0 0.0 1518 100.0 0.0 1518 0.0 0.0 0
Himachal Pradesh 100.0 0.0 813 100.0 0.0 813 0.0 0.0 0
Jammu & Kashmir 99.5 0.5 1021 100.0 0.0 365 99.2 0.8 656
Jharkhand 98.5 1.5 1892 100.0 0.0 534 98.0 2.0 1358
Karnataka 100.0 0.0 3815 100.0 0.0 2543 100.0 0.0 1272
Kerala 100.0 0.0 2958 100.0 0.0 2958 0.0 0.0 0
Madhya Pradesh 98.9 1.1 4552 99.9 0.1 1492 98.4 1.6 3060
Maharashtra 99.5 0.5 5593 100.0 0.0 4087 98.3 1.7 1506
Manipur 99.2 0.8 780 100.0 0.0 390 98.3 1.7 390
Meghalaya 98.0 2.0 777 100.0 0.0 390 96.1 3.9 387
Mizoram 100.0 0.0 790 100.0 0.0 395 100.0 0.0 395
Nagaland 99.6 0.4 754 100.0 0.0 380 99.2 0.8 374
Odisha 99.3 0.7 3031 100.0 0.0 472 99.1 0.9 2559
Puducherry 99.7 0.3 317 0.0 0.0 0 99.7 0.3 317
Punjab 99.9 0.1 1576 100.0 0.0 876 99.9 0.1 700
Rajasthan 100.0 0.0 5639 100.0 0.0 4346 99.9 0.1 1293
Sikkim 100.0 0.0 390 100.0 0.0 390 0.0 0.0 0
Tamil Nadu 99.8 0.2 4213 100.0 0.0 906 99.7 0.3 3307
Telangana 99.9 0.1 2380 100.0 0.0 983 99.8 0.2 1397
Tripura 99.0 1.0 380 0.0 0.0 0 99.0 1.0 380
Uttar Pradesh 99.9 0.1 13017 100.0 0.0 1983 99.9 0.1 11033
Uttarakhand 100.0 0.0 866 100.0 0.0 866 0.0 0.0 0
West Bengal 99.3 0.7 7190 100.0 0.0 5226 97.6 2.4 1964

Interim Report National Annual Rural Sanitation Survey (NARSS), Round-2, 2018-2019
ANNEXURE - III: TABLES PAGE 202
States Total ODF Non- ODF
Safe Unsafe Total Safe Unsafe Total Safe Unsafe Total
% % N % % N % % N
If coded 1 or 2 in Q.1
HH:10. Percent distribution of disposal method of Child excreta
States Total ODF Non-ODF
Safe Unsafe DK Total Safe Unsafe DK Total Safe Unsafe DK Total
% % % N % % % N % % % N
Total 75.4 23.8 0.8 13988 95.4 4.4 0.2 6099 59.9 38.8 1.3 7888
A & N Islands 97.7 2.3 0.0 44 97.7 2.3 0.0 44 0.0 0.0 0.0 0
Andhra Pradesh 92.2 7.6 0.1 696 98.7 1.3 0.0 576 61.0 38.2 0.8 120
Arunachal Pradesh 83.8 16.2 0.0 134 94.5 5.5 0.0 72 71.3 28.7 0.0 62
Assam 69.4 29.9 0.8 344 80.8 19.2 0.0 47 67.5 31.6 0.9 297
Bihar 42.1 56.3 1.6 1711 58.0 40.4 1.6 73 41.4 57.0 1.6 1638
Chhattisgarh 97.5 2.5 0.0 343 97.5 2.5 0.0 343 0.0 0.0 0.0 0
Dadra And Nagar Haveli 100.0 0.0 0.0 69 100.0 0.0 0.0 69 0.0 0.0 0.0 0
Goa 74.0 7.4 18.6 18 0.0 0.0 0.0 0 74.0 7.4 18.6 18
Gujarat 99.0 1.0 0.0 304 99.0 1.0 0.0 304 0.0 0.0 0.0 0
Haryana 98.9 1.1 0.0 296 98.9 1.1 0.0 296 0.0 0.0 0.0 0
Himachal Pradesh 100.0 0.0 0.0 79 100.0 0.0 0.0 79 0.0 0.0 0.0 0
Jammu & Kashmir 78.7 20.1 1.2 160 95.8 4.2 0.0 46 71.8 26.4 1.7 115
Jharkhand 54.5 45.0 0.5 495 79.2 20.3 0.5 145 44.2 55.3 0.5 350
Karnataka 76.5 16.9 6.6 545 97.1 2.8 0.1 327 45.6 38.0 16.4 218
Kerala 100.0 0.0 0.0 401 100.0 0.0 0.0 401 0.0 0.0 0.0 0
Madhya Pradesh 72.1 27.6 0.3 755 95.8 4.2 0.0 224 62.1 37.5 0.4 531
Maharashtra 85.3 13.4 1.3 727 97.8 1.8 0.4 515 55.0 41.7 3.4 212
Manipur 94.2 5.8 0.0 103 95.7 4.3 0.0 45 93.0 7.0 0.0 59
Meghalaya 95.4 4.6 0.0 203 98.3 1.7 0.0 116 91.6 8.4 0.0 88
Mizoram 82.0 18.0 0.0 104 96.7 3.3 0.0 60 62.1 37.9 0.0 44
Nagaland 92.0 8.0 0.0 61 97.0 3.0 0.0 33 85.7 14.3 0.0 27
Odisha 35.7 64.0 0.4 575 94.9 5.1 0.0 73 27.1 72.5 0.4 502
Puducherry 53.6 43.6 2.8 35 0.0 0.0 0.0 0 53.6 43.6 2.8 35
Punjab 90.1 9.9 0.0 208 95.4 4.6 0.0 114 83.6 16.4 0.0 93
Rajasthan 87.5 12.4 0.1 798 95.5 4.3 0.2 564 68.1 31.9 0.0 234
Sikkim 97.3 2.7 0.0 37 97.3 2.7 0.0 37 0.0 0.0 0.0 0
Tamil Nadu 69.4 30.2 0.4 491 86.8 11.9 1.3 79 66.0 33.7 0.3 412

Interim Report National Annual Rural Sanitation Survey (NARSS), Round-2, 2018-2019
ANNEXURE - III: TABLES PAGE 203
States Total ODF Non-ODF
Safe Unsafe DK Total Safe Unsafe DK Total Safe Unsafe DK Total
% % % N % % % N % % % N
Telangana 75.8 24.2 0.0 189 91.6 8.4 0.0 73 65.9 34.1 0.0 116
Tripura 67.7 32.3 0.0 28 0.0 0.0 0.0 0 67.7 32.3 0.0 28
Uttar Pradesh 81.7 17.6 0.7 2802 91.6 7.6 0.8 478 79.6 19.7 0.7 2324
Uttarakhand 95.3 4.7 0.0 126 95.3 4.7 0.0 126 0.0 0.0 0.0 0
West Bengal 75.4 24.4 0.2 1106 94.0 6.0 0.0 740 37.6 61.8 0.6 366
If coded 1 or 2 in Q.1 and Q8>0
HH:11. Evidence of Solid waste within premises of household
States Total ODF NON ODF
Yes No Total Yes No Total Yes No Total
% % N % % N % % N
Total 2.5 97.5 92411 1.4 98.6 43735 3.5 96.5 48676
A & N Islands 1.0 99.0 390 1.0 99.0 390 0.0 0.0 0
Andhra Pradesh 4.8 95.2 4065 4.3 95.7 2730 5.8 94.2 1335
Arunachal Pradesh 1.3 98.7 780 0.0 100.0 390 2.5 97.5 390
Assam 5.4 94.6 2860 1.5 98.5 630 6.5 93.5 2230
Bihar 5.3 94.7 8476 .5 99.5 465 5.5 94.5 8011
Chhattisgarh .2 99.8 2760 .2 99.8 2760 0.0 0.0 0
Dadra And Nagar Haveli 0.0 100.0 390 0.0 100.0 390 0.0 0.0 0
Goa 24.2 75.8 390 0.0 0.0 0 24.2 75.8 390
Gujarat .1 99.9 2910 .1 99.9 2910 0.0 0.0 0
Haryana 0.0 100.0 1530 0.0 100.0 1530 0.0 0.0 0
Himachal Pradesh 0.0 100.0 825 0.0 100.0 825 0.0 0.0 0
Jammu & Kashmir .5 99.5 1197 0.0 100.0 390 .7 99.3 807
Jharkhand 3.5 96.5 2278 .6 99.4 600 4.5 95.5 1678
Karnataka 12.5 87.5 4047 15.0 85.0 2625 7.9 92.1 1422
Kerala 0.0 100.0 2960 0.0 100.0 2960 0.0 0.0 0
Madhya Pradesh 4.2 95.8 4854 .5 99.5 1530 6.0 94.0 3324
Maharashtra 1.0 99.0 6360 .2 99.8 4560 3.0 97.0 1800
Manipur 2.3 97.7 780 0.0 100.0 390 4.6 95.4 390
Meghalaya 1.7 98.3 780 0.0 100.0 390 3.4 96.6 390
Mizoram .5 99.5 790 1.0 99.0 395 0.0 100.0 395
Nagaland .8 99.2 780 0.0 100.0 390 1.5 98.5 390
Odisha 3.7 96.3 4244 .5 99.5 480 4.1 95.9 3764

Interim Report National Annual Rural Sanitation Survey (NARSS), Round-2, 2018-2019
ANNEXURE - III: TABLES PAGE 204
States Total ODF NON ODF
Yes No Total Yes No Total Yes No Total
% % N % % N % % N
Puducherry 1.1 98.9 390 0.0 0.0 0 1.1 98.9 390
Punjab .7 99.3 1620 .4 99.6 900 1.1 98.9 720
Rajasthan .2 99.8 5940 .0 100.0 4530 .8 99.2 1410
Sikkim 0.0 100.0 390 0.0 100.0 390 0.0 0.0 0
Tamil Nadu .7 99.3 4980 .1 99.9 975 .8 99.2 4005
Telangana 2.9 97.1 2469 .4 99.6 1020 4.7 95.3 1449
Tripura 1.8 98.2 390 0.0 0.0 0 1.8 98.2 390
Uttar Pradesh .4 99.6 13330 .1 99.9 1995 .5 99.5 11335
Uttarakhand 0.0 100.0 870 0.0 100.0 870 0.0 0.0 0
West Bengal 1.9 98.1 7586 .3 99.7 5325 5.7 94.3 2261
All HH surveyed
HH:12. Percent distribution of disposal methods of solid waste by the household
States
Total ODF Non-ODF
Ind
iscr
imin
ate
(th
ere
is n
o f
orm
al
arra
nge
me
nt)
Safe
ly d
isp
ose
d
wit
hin
th
e h
ou
seh
old
Dis
po
sed
Ou
tsid
e t
o
com
mo
n s
yste
m
Tota
l
Ind
iscr
imin
ate
(th
ere
is
no
fo
rmal
arra
nge
me
nt)
Safe
ly d
isp
ose
d
wit
hin
th
e h
ou
seh
old
Dis
po
sed
Ou
tsid
e t
o
com
mo
n s
yste
m
Tota
l
Ind
iscr
imin
ate
(th
ere
is n
o f
orm
al
arra
nge
me
nt)
Safe
ly d
isp
ose
d
wit
hin
th
e h
ou
seh
old
Dis
po
sed
Ou
tsid
e t
o
com
mo
n s
yste
m
Tota
l
% % % N % % % N % % % N
Total 4.2 42.5 53.3 92411 4.9 45.4 49.7 43735 3.6 39.9 56.5 48676
A & N Islands 11.2 61.8 27.1 390 11.2 61.8 27.1 390 0.0 0.0 0.0 0
Andhra Pradesh 9.4 55.3 35.3 4065 7.8 62.9 29.3 2730 12.7 39.8 47.5 1335
Arunachal Pradesh 1.0 98.3 0.6 780 0.3 99.5 0.3 390 1.8 97.2 1.0 390
Assam 4.7 87.8 7.5 2860 3.3 91.2 5.5 630 5.1 86.8 8.1 2230
Bihar 5.1 52.5 42.4 8476 3.9 61.2 34.9 465 5.1 52.0 42.9 8011
Chhattisgarh 17.5 25.6 56.9 2760 17.5 25.6 56.9 2760 0.0 0.0 0.0 0
Dadra And Nagar Haveli 1.6 82.7 15.6 390 1.6 82.7 15.6 390 0.0 0.0 0.0 0
Goa 0.0 24.3 75.7 390 0.0 0.0 0.0 0 0.0 24.3 75.7 390
Gujarat 0.4 61.3 38.3 2910 0.4 61.3 38.3 2910 0.0 0.0 0.0 0
Haryana 0.0 25.7 74.3 1530 0.0 25.7 74.3 1530 0.0 0.0 0.0 0
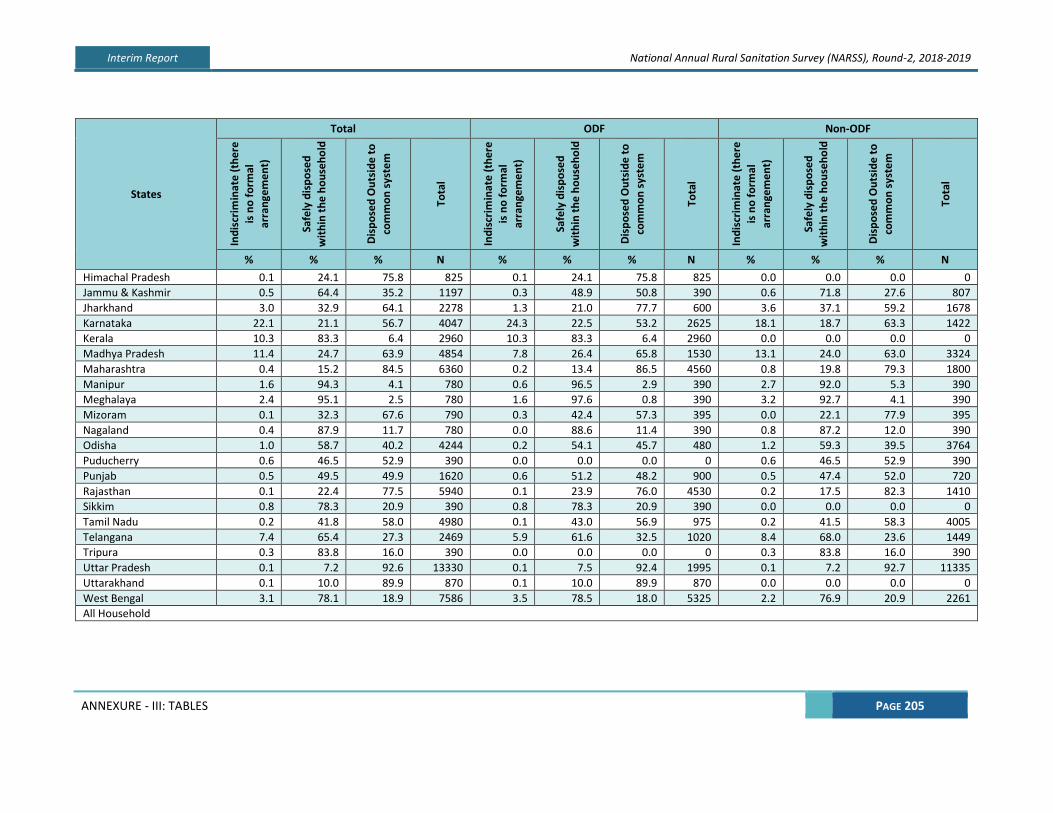
Interim Report National Annual Rural Sanitation Survey (NARSS), Round-2, 2018-2019
ANNEXURE - III: TABLES PAGE 205
States
Total ODF Non-ODF
Ind
iscr
imin
ate
(th
ere
is n
o f
orm
al
arra
nge
me
nt)
Safe
ly d
isp
ose
d
wit
hin
th
e h
ou
seh
old
Dis
po
sed
Ou
tsid
e t
o
com
mo
n s
yste
m
Tota
l
Ind
iscr
imin
ate
(th
ere
is
no
fo
rmal
arra
nge
me
nt)
Safe
ly d
isp
ose
d
wit
hin
th
e h
ou
seh
old
Dis
po
sed
Ou
tsid
e t
o
com
mo
n s
yste
m
Tota
l
Ind
iscr
imin
ate
(th
ere
is n
o f
orm
al
arra
nge
me
nt)
Safe
ly d
isp
ose
d
wit
hin
th
e h
ou
seh
old
Dis
po
sed
Ou
tsid
e t
o
com
mo
n s
yste
m
Tota
l
% % % N % % % N % % % N
Himachal Pradesh 0.1 24.1 75.8 825 0.1 24.1 75.8 825 0.0 0.0 0.0 0
Jammu & Kashmir 0.5 64.4 35.2 1197 0.3 48.9 50.8 390 0.6 71.8 27.6 807
Jharkhand 3.0 32.9 64.1 2278 1.3 21.0 77.7 600 3.6 37.1 59.2 1678
Karnataka 22.1 21.1 56.7 4047 24.3 22.5 53.2 2625 18.1 18.7 63.3 1422
Kerala 10.3 83.3 6.4 2960 10.3 83.3 6.4 2960 0.0 0.0 0.0 0
Madhya Pradesh 11.4 24.7 63.9 4854 7.8 26.4 65.8 1530 13.1 24.0 63.0 3324
Maharashtra 0.4 15.2 84.5 6360 0.2 13.4 86.5 4560 0.8 19.8 79.3 1800
Manipur 1.6 94.3 4.1 780 0.6 96.5 2.9 390 2.7 92.0 5.3 390
Meghalaya 2.4 95.1 2.5 780 1.6 97.6 0.8 390 3.2 92.7 4.1 390
Mizoram 0.1 32.3 67.6 790 0.3 42.4 57.3 395 0.0 22.1 77.9 395
Nagaland 0.4 87.9 11.7 780 0.0 88.6 11.4 390 0.8 87.2 12.0 390
Odisha 1.0 58.7 40.2 4244 0.2 54.1 45.7 480 1.2 59.3 39.5 3764
Puducherry 0.6 46.5 52.9 390 0.0 0.0 0.0 0 0.6 46.5 52.9 390
Punjab 0.5 49.5 49.9 1620 0.6 51.2 48.2 900 0.5 47.4 52.0 720
Rajasthan 0.1 22.4 77.5 5940 0.1 23.9 76.0 4530 0.2 17.5 82.3 1410
Sikkim 0.8 78.3 20.9 390 0.8 78.3 20.9 390 0.0 0.0 0.0 0
Tamil Nadu 0.2 41.8 58.0 4980 0.1 43.0 56.9 975 0.2 41.5 58.3 4005
Telangana 7.4 65.4 27.3 2469 5.9 61.6 32.5 1020 8.4 68.0 23.6 1449
Tripura 0.3 83.8 16.0 390 0.0 0.0 0.0 0 0.3 83.8 16.0 390
Uttar Pradesh 0.1 7.2 92.6 13330 0.1 7.5 92.4 1995 0.1 7.2 92.7 11335
Uttarakhand 0.1 10.0 89.9 870 0.1 10.0 89.9 870 0.0 0.0 0.0 0
West Bengal 3.1 78.1 18.9 7586 3.5 78.5 18.0 5325 2.2 76.9 20.9 2261
All Household

Interim Report National Annual Rural Sanitation Survey (NARSS), Round-2, 2018-2019
ANNEXURE - III: TABLES PAGE 206
HH:13. Safe disposal of solid waste (%)
States
Total ODF NON ODF
Safe Disposal Unsafe
Disposal Total Safe Disposal
Unsafe Disposal
Total Safe Disposal Unsafe
Disposal Total
% % N % % N % % N
Total 95.8 4.2 92411 95.1 4.9 43735 96.4 3.6 48676
A & N Islands 88.8 11.2 390 88.8 11.2 390 0.0 0.0 0
Andhra Pradesh 90.6 9.4 4065 92.2 7.8 2730 87.3 12.7 1335
Arunachal Pradesh 99.0 1.0 780 99.7 .3 390 98.2 1.8 390
Assam 95.3 4.7 2860 96.7 3.3 630 94.9 5.1 2230
Bihar 94.9 5.1 8476 96.1 3.9 465 94.9 5.1 8011
Chhattisgarh 82.5 17.5 2760 82.5 17.5 2760 0.0 0.0 0
Dadra And Nagar Haveli 98.4 1.6 390 98.4 1.6 390 0.0 0.0 0
Goa 100.0 0.0 390 0.0 0.0 0 100.0 0.0 390
Gujarat 99.6 .4 2910 99.6 .4 2910 0.0 0.0 0
Haryana 100.0 0.0 1530 100.0 0.0 1530 0.0 0.0 0
Himachal Pradesh 99.9 .1 825 99.9 .1 825 0.0 0.0 0
Jammu & Kashmir 99.5 .5 1197 99.7 .3 390 99.4 .6 807
Jharkhand 97.0 3.0 2278 98.7 1.3 600 96.4 3.6 1678
Karnataka 77.9 22.1 4047 75.7 24.3 2625 81.9 18.1 1422
Kerala 89.7 10.3 2960 89.7 10.3 2960 0.0 0.0 0
Madhya Pradesh 88.6 11.4 4854 92.2 7.8 1530 86.9 13.1 3324
Maharashtra 99.6 .4 6360 99.8 .2 4560 99.2 .8 1800
Manipur 98.4 1.6 780 99.4 .6 390 97.3 2.7 390
Meghalaya 97.6 2.4 780 98.4 1.6 390 96.8 3.2 390
Mizoram 99.9 .1 790 99.7 .3 395 100.0 0.0 395
Nagaland 99.6 .4 780 100.0 0.0 390 99.2 .8 390
Odisha 99.0 1.0 4244 99.8 .2 480 98.8 1.2 3764
Puducherry 99.4 .6 390 0.0 0.0 0 99.4 .6 390
Punjab 99.5 .5 1620 99.4 .6 900 99.5 .5 720
Rajasthan 99.9 .1 5940 99.9 .1 4530 99.8 .2 1410
Sikkim 99.2 .8 390 99.2 .8 390 0.0 0.0 0
Tamil Nadu 99.8 .2 4980 99.9 .1 975 99.8 .2 4005
Telangana 92.6 7.4 2469 94.1 5.9 1020 91.6 8.4 1449
Tripura 99.7 .3 390 0.0 0.0 0 99.7 .3 390
Uttar Pradesh 99.9 .1 13330 99.9 .1 1995 99.9 .1 11335
Uttarakhand 99.9 .1 870 99.9 .1 870 0.0 0.0 0

Interim Report National Annual Rural Sanitation Survey (NARSS), Round-2, 2018-2019
ANNEXURE - III: TABLES PAGE 207
States
Total ODF NON ODF
Safe Disposal Unsafe
Disposal Total Safe Disposal
Unsafe Disposal
Total Safe Disposal Unsafe
Disposal Total
% % N % % N % % N
West Bengal 96.9 3.1 7586 96.5 3.5 5325 97.8 2.2 2261
All HH surveyed
HH:14. Evidence of liquid waste within premises of household
States
Total ODF NON ODF
Yes No Total Yes No Total Yes No Total
% % N % % N % % N
Total 3.7 96.3 92411 4.0 96.0 43735 3.5 96.5 48676
A & N Islands .5 99.5 390 .5 99.5 390 0.0 0.0 0
Andhra Pradesh 16.6 83.4 4065 22.0 78.0 2730 5.5 94.5 1335
Arunachal Pradesh .6 99.4 780 .8 99.2 390 .5 99.5 390
Assam 6.8 93.2 2860 8.5 91.5 630 6.4 93.6 2230
Bihar 6.7 93.3 8476 6.1 93.9 465 6.7 93.3 8011
Chhattisgarh .6 99.4 2760 .6 99.4 2760 0.0 0.0 0
Dadra And Nagar Haveli 1.1 98.9 390 1.1 98.9 390 0.0 0.0 0
Goa 18.0 82.0 390 0.0 0.0 0 18.0 82.0 390
Gujarat .4 99.6 2910 .4 99.6 2910 0.0 0.0 0
Haryana .4 99.6 1530 .4 99.6 1530 0.0 0.0 0
Himachal Pradesh .5 99.5 825 .5 99.5 825 0.0 0.0 0
Jammu & Kashmir .8 99.2 1197 .8 99.2 390 .8 99.2 807
Jharkhand 2.8 97.2 2278 2.7 97.3 600 2.9 97.1 1678
Karnataka 13.8 86.2 4047 16.9 83.1 2625 8.2 91.8 1422
Kerala .2 99.8 2960 .2 99.8 2960 0.0 0.0 0
Madhya Pradesh 4.5 95.5 4854 1.4 98.6 1530 6.0 94.0 3324
Maharashtra 3.5 96.5 6360 3.7 96.3 4560 3.1 96.9 1800
Manipur 2.9 97.1 780 1.5 98.5 390 4.2 95.8 390
Meghalaya .1 99.9 780 .3 99.7 390 0.0 100.0 390
Mizoram .8 99.2 790 1.6 98.4 395 0.0 100.0 395
Nagaland 1.5 98.5 780 1.0 99.0 390 2.0 98.0 390
Odisha 3.2 96.8 4244 .7 99.3 480 3.6 96.4 3764
Puducherry 2.2 97.8 390 0.0 0.0 0 2.2 97.8 390
Punjab .6 99.4 1620 .3 99.7 900 1.1 98.9 720
Rajasthan .9 99.1 5940 .7 99.3 4530 1.6 98.4 1410

Interim Report National Annual Rural Sanitation Survey (NARSS), Round-2, 2018-2019
ANNEXURE - III: TABLES PAGE 208
States
Total ODF NON ODF
Yes No Total Yes No Total Yes No Total
% % N % % N % % N
Sikkim 0.0 100.0 390 0.0 100.0 390 0.0 0.0 0
Tamil Nadu .9 99.1 4980 .7 99.3 975 .9 99.1 4005
Telangana 4.1 95.9 2469 2.7 97.3 1020 5.1 94.9 1449
Tripura .3 99.7 390 0.0 0.0 0 .3 99.7 390
Uttar Pradesh .5 99.5 13330 .4 99.6 1995 .5 99.5 11335
Uttarakhand .7 99.3 870 .7 99.3 870 0.0 0.0 0
West Bengal 4.7 95.3 7586 4.9 95.1 5325 4.1 95.9 2261
All HH surveyed

Interim Report National Annual Rural Sanitation Survey (NARSS), Round-2, 2018-2019
ANNEXURE - III: TABLES PAGE 209
HH:15. Percent distribution of disposal methods of liquid waste in the household
States
Total ODF Non-ODF
Ind
iscr
imin
ate
Flo
ws
into
a
com
mo
n s
yste
m
Kit
che
n G
ard
en
Soak
Pit
An
y o
the
rs
Tota
l
Ind
iscr
imin
ate
Flo
ws
into
a
com
mo
n s
yste
m
Kit
che
n G
ard
en
Soak
Pit
An
y o
the
rs
Tota
l
Ind
iscr
imin
ate
Flo
ws
into
a
com
mo
n s
yste
m
Kit
che
n G
ard
en
Soak
Pit
An
y o
the
rs
Tota
l
% % % % % N % % % % % N % % % % % N
Total 4.0 60.1 20.6 13.6 1.6 92411 4.4 56.6 20.1 17.3 1.6 43735 3.7 63.2 21.1 10.3 1.6 48676
A & N Islands 25.2 46.3 7.6 20.1 0.8 390 25.2 46.3 7.6 20.1 0.8 390 0.0 0.0 0.0 0.0 0.0 0
Andhra Pradesh 6.2 69.0 18.6 6.0 0.3 4065 4.0 72.9 16.9 5.9 0.3 2730 10.8 61.0 21.9 6.1 0.2 1335
Arunachal Pradesh 0.3 45.1 52.4 2.2 0.0 780 0.0 25.5 70.6 4.0 0.0 390 0.5 64.8 34.2 0.5 0.0 390
Assam 4.7 25.8 47.6 22.0 0.0 2860 3.1 16.6 53.3 27.1 0.0 630 5.1 28.4 45.9 20.6 0.0 2230
Bihar 5.0 74.1 11.9 7.2 1.8 8476 3.1 88.8 4.2 4.0 0.0 465 5.1 73.3 12.4 7.3 1.9 8011
Chhattisgarh 14.1 41.3 33.9 10.2 0.4 2760 14.1 41.3 33.9 10.2 0.4 2760 0.0 0.0 0.0 0.0 0.0 0
Dadra And Nagar Haveli 0.0 39.1 46.7 14.2 0.0 390 0.0 39.1 46.7 14.2 0.0 390 0.0 0.0 0.0 0.0 0.0 0
Goa 0.0 30.1 1.9 67.9 0.0 390 0.0 0.0 0.0 0.0 0.0 0 0.0 30.1 1.9 67.9 0.0 390
Gujarat 0.0 35.9 2.9 59.6 1.5 2910 0.0 35.9 2.9 59.6 1.5 2910 0.0 0.0 0.0 0.0 0.0 0
Haryana 0.1 99.3 0.3 0.4 0.0 1530 0.1 99.3 0.3 0.4 0.0 1530 0.0 0.0 0.0 0.0 0.0 0
Himachal Pradesh 0.1 24.8 44.8 29.5 0.8 825 0.1 24.8 44.8 29.5 0.8 825 0.0 0.0 0.0 0.0 0.0 0
Jammu & Kashmir 0.7 67.0 5.9 23.4 3.0 1197 0.5 63.9 9.8 25.5 0.3 390 0.8 68.5 4.0 22.4 4.3 807
Jharkhand 1.9 63.4 28.5 6.2 0.0 2278 1.7 55.0 35.4 7.9 0.0 600 1.9 66.4 26.0 5.6 0.1 1678
Karnataka 22.1 56.8 2.2 17.7 1.2 4047 24.3 51.9 2.6 19.4 1.8 2625 18.0 65.8 1.4 14.6 0.2 1422
Kerala 6.2 21.0 55.8 16.9 0.1 2960 6.2 21.0 55.8 16.9 0.1 2960 0.0 0.0 0.0 0.0 0.0 0
Madhya Pradesh 16.8 60.7 15.9 6.1 0.4 4854 14.7 67.9 13.8 3.2 0.3 1530 17.8 57.4 16.9 7.4 0.4 3324
Maharashtra 1.1 53.2 10.8 34.1 0.8 6360 1.1 50.6 12.4 35.0 0.9 4560 1.4 59.9 6.5 31.7 0.5 1800
Manipur 0.8 67.2 29.8 1.3 0.9 780 0.0 71.1 27.4 1.3 0.3 390 1.6 63.3 32.2 1.3 1.6 390
Meghalaya 0.1 9.6 86.2 4.0 0.1 780 0.3 10.9 80.6 7.9 0.3 390 0.0 8.2 91.8 0.0 0.0 390
Mizoram 0.0 51.1 42.8 3.0 3.0 790 0.0 60.7 33.6 1.1 4.6 395 0.0 41.6 52.1 5.0 1.3 395
Nagaland 0.8 24.0 71.2 4.1 0.0 780 0.5 28.3 68.4 2.8 0.0 390 1.0 19.7 73.9 5.3 0.0 390
Odisha 0.9 46.5 46.9 5.2 0.6 4244 0.0 44.2 51.8 2.8 1.2 480 1.0 46.8 46.3 5.5 0.5 3764
Puducherry 0.6 50.2 35.5 13.7 0.0 390 0.0 0.0 0.0 0.0 0.0 0 0.6 50.2 35.5 13.7 0.0 390
Punjab 0.1 96.6 0.9 1.9 0.5 1620 0.1 95.8 0.8 3.0 0.4 900 0.1 97.8 1.2 0.5 0.5 720
Rajasthan 0.7 73.5 9.9 14.6 1.3 5940 0.5 73.5 9.4 15.4 1.2 4530 1.3 73.4 11.4 12.2 1.7 1410
Sikkim 0.0 31.2 55.0 13.8 0.0 390 0.0 31.2 55.0 13.8 0.0 390 0.0 0.0 0.0 0.0 0.0 0

Interim Report National Annual Rural Sanitation Survey (NARSS), Round-2, 2018-2019
ANNEXURE - III: TABLES PAGE 210
States
Total ODF Non-ODF
Ind
iscr
imin
ate
Flo
ws
into
a
com
mo
n s
yste
m
Kit
che
n G
ard
en
Soak
Pit
An
y o
the
rs
Tota
l
Ind
iscr
imin
ate
Flo
ws
into
a
com
mo
n s
yste
m
Kit
che
n G
ard
en
Soak
Pit
An
y o
the
rs
Tota
l
Ind
iscr
imin
ate
Flo
ws
into
a
com
mo
n s
yste
m
Kit
che
n G
ard
en
Soak
Pit
An
y o
the
rs
Tota
l
% % % % % N % % % % % N % % % % % N
Tamil Nadu 0.4 35.9 46.5 16.1 1.1 4980 0.4 40.1 36.3 22.6 0.5 975 0.4 34.9 49.0 14.5 1.2 4005
Telangana 2.5 47.1 40.1 9.6 0.8 2469 1.2 52.8 36.2 9.4 0.4 1020 3.3 43.1 42.9 9.7 1.0 1449
Tripura 0.3 51.4 17.3 0.3 30.8 390 0.0 0.0 0.0 0.0 0.0 0 0.3 51.4 17.3 0.3 30.8 390
Uttar Pradesh 0.4 83.7 6.5 7.6 1.9 13330 0.3 89.5 4.5 4.7 0.9 1995 0.4 82.7 6.8 8.1 2.0 11335
Uttarakhand 0.3 65.1 22.2 11.1 1.3 870 0.3 65.1 22.2 11.1 1.3 870 0.0 0.0 0.0 0.0 0.0 0
West Bengal 2.4 68.6 10.9 11.4 6.7 7586 2.7 66.1 11.5 12.1 7.6 5325 1.6 74.4 9.3 9.9 4.8 2261
All Household
HH:16. Safe disposal of liquid waste
States
Total ODF NON ODF
Safe Disposal Unsafe Disposal Total Safe Disposal Unsafe Disposal Total Safe Disposal Unsafe Disposal Total
% % N % % N % % N
Total 96.0 4.0 92411 95.6 4.4 43735 96.3 3.7 48676
A & N Islands 74.8 25.2 390 74.8 25.2 390 0.0 0.0 0
Andhra Pradesh 93.8 6.2 4065 96.0 4.0 2730 89.2 10.8 1335
Arunachal Pradesh 99.7 .3 780 100.0 0.0 390 99.5 .5 390
Assam 95.3 4.7 2860 96.9 3.1 630 94.9 5.1 2230
Bihar 95.0 5.0 8476 96.9 3.1 465 94.9 5.1 8011
Chhattisgarh 85.9 14.1 2760 85.9 14.1 2760 0.0 0.0 0
Dadra And Nagar Haveli 100.0 0.0 390 100.0 0.0 390 0.0 0.0 0
Goa 100.0 0.0 390 0.0 0.0 0 100.0 0.0 390
Gujarat 100.0 .0 2910 100.0 .0 2910 0.0 0.0 0
Haryana 99.9 .1 1530 99.9 .1 1530 0.0 0.0 0
Himachal Pradesh 99.9 .1 825 99.9 .1 825 0.0 0.0 0
Jammu & Kashmir 99.3 .7 1197 99.5 .5 390 99.2 .8 807
Jharkhand 98.1 1.9 2278 98.3 1.7 600 98.1 1.9 1678
Karnataka 77.9 22.1 4047 75.7 24.3 2625 82.0 18.0 1422
Kerala 93.8 6.2 2960 93.8 6.2 2960 0.0 0.0 0

Interim Report National Annual Rural Sanitation Survey (NARSS), Round-2, 2018-2019
ANNEXURE - III: TABLES PAGE 211
States
Total ODF NON ODF
Safe Disposal Unsafe Disposal Total Safe Disposal Unsafe Disposal Total Safe Disposal Unsafe Disposal Total
% % N % % N % % N
Madhya Pradesh 83.2 16.8 4854 85.3 14.7 1530 82.2 17.8 3324
Maharashtra 98.9 1.1 6360 98.9 1.1 4560 98.6 1.4 1800
Manipur 99.2 .8 780 100.0 0.0 390 98.4 1.6 390
Meghalaya 99.9 .1 780 99.7 .3 390 100.0 0.0 390
Mizoram 100.0 0.0 790 100.0 0.0 395 100.0 0.0 395
Nagaland 99.2 .8 780 99.5 .5 390 99.0 1.0 390
Odisha 99.1 .9 4244 100.0 0.0 480 99.0 1.0 3764
Puducherry 99.4 .6 390 0.0 0.0 0 99.4 .6 390
Punjab 99.9 .1 1620 99.9 .1 900 99.9 .1 720
Rajasthan 99.3 .7 5940 99.5 .5 4530 98.7 1.3 1410
Sikkim 100.0 0.0 390 100.0 0.0 390 0.0 0.0 0
Tamil Nadu 99.6 .4 4980 99.6 .4 975 99.6 .4 4005
Telangana 97.5 2.5 2469 98.8 1.2 1020 96.7 3.3 1449
Tripura 99.7 .3 390 0.0 0.0 0 99.7 .3 390
Uttar Pradesh 99.6 .4 13330 99.7 .3 1995 99.6 .4 11335
Uttarakhand 99.7 .3 870 99.7 .3 870 0.0 0.0 0
West Bengal 97.6 2.4 7586 97.3 2.7 5325 98.4 1.6 2261
All HH surveyed
ANNEXURE TABLES II – SCHOOL SCH:1. Percentage Distribution of types of school
Particulars Total ODF Non-ODF
Base: All villages 6002 2828 3174
Boys school 1.8 2.1 1.6
Girls school 1.6 1.9 1.4
Co-educational school 96.6 96.0 97.0
Education level of School
Base: All schools 6002 2828 3174
Primary (Grade 1-5) 45.2 46.1 44.4
Lower Secondary/Elementary (Grades 6-8) 31.8 26.2 36.9
Secondary (Grades 9-10) 11.1 10.6 11.6
Higher Secondary (Grades 10-12) 11.8 17.1 7.1

Interim Report National Annual Rural Sanitation Survey (NARSS), Round-2, 2018-2019
ANNEXURE - III: TABLES PAGE 212
SCH:2. Accessibility of toilets in the School
States
Total ODF NON ODF
Yes, school has access to
a toilet facility
School do not have access to a toilet
facility
Base
Yes, school has access to
a toilet facility
School do not have access to a toilet
facility
Base
Yes, school has access to
a toilet facility
School do not have access to a toilet
facility
Base
% % N % % N % % N
All India 98.9 1.1 6002 99.8 0.2 2828 98.1 1.9 3174
A & N Islands 100.0 0.0 26 100.0 0.0 26 0.0 0.0 0
Andhra Pradesh 96.3 3.7 270 100.0 0.0 182 88.6 11.4 88
Arunachal Pradesh 100.0 0.0 40 100.0 0.0 20 100.0 0.0 20
Assam 100.0 0.0 178 100.0 0.0 39 100.0 0.0 139
Bihar 96.0 4.0 555 96.8 3.2 31 96.0 4.0 524
Chhattisgarh 99.5 0.5 184 99.5 0.5 184 0.0 0.0 0
Dadra &Nagar Haveli 100.0 0.0 26 100.0 0.0 26 0.0 0.0 0
Goa 100.0 0.0 26 0.0 0.0 0 100.0 0.0 26
Gujarat 100.0 0.0 194 100.0 0.0 194 0.0 0.0 0
Haryana 100.0 0.0 102 100.0 0.0 102 0.0 0.0 0
Himachal Pradesh 100.0 0.0 42 100.0 0.0 42 0.0 0.0 0
Jammu & Kashmir 100.0 0.0 72 100.0 0.0 20 100.0 0.0 52
Jharkhand 99.3 0.7 142 97.2 2.8 36 100.0 0.0 106
Karnataka 98.9 1.1 266 100.0 0.0 172 96.8 3.2 94
Kerala 100.0 0.0 178 100.0 0.0 178 0.0 0.0 0
Madhya Pradesh 96.6 3.4 322 99.0 1.0 102 95.5 4.5 220
Maharashtra 99.8 0.2 421 99.7 0.3 301 100.0 0.0 120
Manipur 100.0 0.0 51 100.0 0.0 25 100.0 0.0 26
Meghalaya 100.0 0.0 46 100.0 0.0 24 100.0 0.0 22
Mizoram 100.0 0.0 52 100.0 0.0 26 100.0 0.0 26
Nagaland 100.0 0.0 52 100.0 0.0 26 100.0 0.0 26
Odisha 97.8 2.2 277 100.0 0.0 31 97.6 2.4 246
Puducherry 100.0 0.0 26 0.0 0.0 0 100.0 0.0 26
Punjab 99.1 0.9 107 98.3 1.7 58 100.0 0.0 49
Rajasthan 100.0 0.0 393 100.0 0.0 299 100.0 0.0 94
Sikkim 100.0 0.0 26 100.0 0.0 26 0.0 0.0 0
Tamil Nadu 100.0 0.0 299 100.0 0.0 50 100.0 0.0 249
Telangana 95.7 4.3 164 100.0 0.0 68 92.7 7.3 96

Interim Report National Annual Rural Sanitation Survey (NARSS), Round-2, 2018-2019
ANNEXURE - III: TABLES PAGE 213
States
Total ODF NON ODF
Yes, school has access to
a toilet facility
School do not have access to a toilet
facility
Base
Yes, school has access to
a toilet facility
School do not have access to a toilet
facility
Base
Yes, school has access to
a toilet facility
School do not have access to a toilet
facility
Base
% % N % % N % % N
Tripura 100.0 0.0 26 0.0 0.0 0 100.0 0.0 26
Uttar Pradesh 100.0 0.0 885 100.0 0.0 132 100.0 0.0 753
Uttarakhand 100.0 0.0 57 100.0 0.0 57 0.0 0.0 0
West Bengal 99.4 0.6 497 100.0 0.0 351 97.9 2.1 146

Interim Report National Annual Rural Sanitation Survey (NARSS), Round-2, 2018-2019
ANNEXURE - III: TABLES PAGE 214
SCH:3. Percentage of functional school toilets States Total ODF NON ODF
Functional Non-Functional
Base Functional Non-Functional
Base Functional Non-Functional
Base
N % % N % % N % %
Total 98.5 1.5 5870 99.8 0.2 2816 97.3 2.7 3054
A & N Islands 100.0 0.0 26 100.0 0.0 26 0.0 0.0 0
Andhra Pradesh 96.3 3.7 244 99.4 0.6 180 87.5 12.5 64
Arunachal Pradesh 100.0 0.0 40 100.0 0.0 20 100.0 0.0 20
Assam 100.0 0.0 178 100.0 0.0 39 100.0 0.0 139
Bihar 97.4 2.6 532 96.7 3.3 30 97.4 2.6 502
Chhattisgarh 100.0 0.0 183 100.0 0.0 183 0.0 0.0 0
Dadra & Nagar Haveli 100.0 0.0 26 100.0 0.0 26 0.0 0.0 0
Goa 95.0 5.0 20 0.0 0.0 0 95.0 5.0 20
Gujarat 100.0 0.0 194 100.0 0.0 194 0.0 0.0 0
Haryana 100.0 0.0 102 100.0 0.0 102 0.0 0.0 0
Himachal Pradesh 100.0 0.0 42 100.0 0.0 42 0.0 0.0 0
Jammu & Kashmir 100.0 0.0 72 100.0 0.0 20 100.0 0.0 52
Jharkhand 100.0 0.0 141 100.0 0.0 35 100.0 0.0 106
Karnataka 94.6 5.4 239 99.4 0.6 169 82.9 17.1 70
Kerala 100.0 0.0 178 100.0 0.0 178 0.0 0.0 0
Madhya Pradesh 98.0 2.0 306 100.0 0.0 101 97.1 2.9 205
Maharashtra 100.0 0.0 420 100.0 0.0 300 100.0 0.0 120
Manipur 100.0 0.0 51 100.0 0.0 25 100.0 0.0 26
Meghalaya 100.0 0.0 46 100.0 0.0 24 100.0 0.0 22
Mizoram 100.0 0.0 52 100.0 0.0 26 100.0 0.0 26
Nagaland 100.0 0.0 52 100.0 0.0 26 100.0 0.0 26
Odisha 89.1 10.9 266 96.8 3.2 31 88.1 11.9 235
Puducherry 100.0 0.0 26 0.0 0.0 0 100.0 0.0 26
Punjab 99.1 0.9 106 98.2 1.8 57 100.0 0.0 49
Rajasthan 100.0 0.0 393 100.0 0.0 299 100.0 0.0 94
Sikkim 100.0 0.0 26 100.0 0.0 26 0.0 0.0 0
Tamil Nadu 100.0 0.0 299 100.0 0.0 50 100.0 0.0 249
Telangana 99.4 0.6 157 100.0 0.0 68 98.9 1.1 89
Tripura 100.0 0.0 26 0.0 0.0 0 100.0 0.0 26
Uttar Pradesh 100.0 0.0 885 100.0 0.0 132 100.0 0.0 753
Uttarakhand 100.0 0.0 57 100.0 0.0 57 0.0 0.0 0

Interim Report National Annual Rural Sanitation Survey (NARSS), Round-2, 2018-2019
ANNEXURE - III: TABLES PAGE 215
States Total ODF NON ODF
Functional Non-Functional
Base Functional Non-Functional
Base Functional Non-Functional
Base
N % % N % % N % %
West Bengal 97.3 2.7 485 99.7 0.3 350 91.1 8.9 135

Interim Report National Annual Rural Sanitation Survey (NARSS), Round-2, 2018-2019
ANNEXURE - III: TABLES PAGE 216
SCH:4. Separate toilets for boys and girls in the school States Total ODF NON ODF
Yes, there are separate
toilets
No, there are no separate
toilets
Total Yes, there are separate
toilets
No, there are no separate
toilets
Total Yes, there are separate
toilets
No, there are no separate
toilets
Total
% % N % % N % % N
Total 88.4 11.6 5734 91.1 8.9 2711 86.0 14.0 3023
A & N Islands 100.0 0.0 26 100.0 0.0 26 0.0 0.0 0
Andhra Pradesh 88.6 11.4 255 94.4 5.6 179 75.0 25.0 76
Arunachal Pradesh 79.5 20.5 39 73.7 26.3 19 85.0 15.0 20
Assam 72.1 27.9 172 60.5 39.5 38 75.4 24.6 134
Bihar 80.0 20.0 526 76.7 23.3 30 80.2 19.8 496
Chhattisgarh 86.0 14.0 178 86.0 14.0 178 0.0 0.0 0
Dadra &Nagar Haveli 100.0 0.0 26 100.0 0.0 26 0.0 0.0 0
Goa 96.0 4.0 25 0.0 0.0 0 96.0 4.0 25
Gujarat 97.3 2.7 186 97.3 2.7 186 0.0 0.0 0
Haryana 100.0 0.0 91 100.0 0.0 91 0.0 0.0 0
Himachal Pradesh 100.0 0.0 42 100.0 0.0 42 0.0 0.0 0
Jammu & Kashmir 69.2 30.8 65 60.0 40.0 15 72.0 28.0 50
Jharkhand 90.6 9.4 138 94.3 5.7 35 89.3 10.7 103
Karnataka 92.8 7.2 250 92.0 8.0 163 94.3 5.7 87
Kerala 98.8 1.2 173 98.8 1.2 173 0.0 0.0 0
Madhya Pradesh 79.6 20.4 285 79.6 20.4 93 79.7 20.3 192
Maharashtra 94.2 5.8 380 95.7 4.3 278 90.2 9.8 102
Manipur 70.6 29.4 51 76.0 24.0 25 65.4 34.6 26
Meghalaya 64.4 35.6 45 78.3 21.7 23 50.0 50.0 22
Mizoram 90.4 9.6 52 88.5 11.5 26 92.3 7.7 26
Nagaland 71.2 28.8 52 73.1 26.9 26 69.2 30.8 26
Odisha 78.7 21.3 268 83.9 16.1 31 78.1 21.9 237
Puducherry 95.7 4.3 23 0.0 0.0 0 95.7 4.3 23
Punjab 87.1 12.9 101 87.0 13.0 54 87.2 12.8 47
Rajasthan 95.2 4.8 377 94.4 5.6 287 97.8 2.2 90
Sikkim 88.5 11.5 26 88.5 11.5 26 0.0 0.0 0
Tamil Nadu 95.3 4.7 297 92.0 8.0 50 96.0 4.0 247
Telangana 86.9 13.1 153 98.5 1.5 67 77.9 22.1 86
Tripura 69.2 30.8 26 0.0 0.0 0 69.2 30.8 26
Uttar Pradesh 94.6 5.4 871 96.9 3.1 130 94.2 5.8 741

Interim Report National Annual Rural Sanitation Survey (NARSS), Round-2, 2018-2019
ANNEXURE - III: TABLES PAGE 217
States Total ODF NON ODF
Yes, there are separate
toilets
No, there are no separate
toilets
Total Yes, there are separate
toilets
No, there are no separate
toilets
Total Yes, there are separate
toilets
No, there are no separate
toilets
Total
% % N % % N % % N
Uttarakhand 89.3 10.7 56 89.3 10.7 56 0.0 0.0 0
West Bengal 85.0 15.0 479 84.6 15.4 338 85.8 14.2 141
All Co-educational Schools
SCH:5. Condition of school toilets at an overall level
Particulars Boy’s Toilet Girl’s Toilet Common Toilet
BASE: All the toilet available (unlocked) 107 93 5670
% % %
Usable 97.2 97.8 97.6
Functional 99.1 98.9 98.5
Safe disposal 99.1 100 99.2
Hygienic 97.2 100 98
Water Available for handwashing 83.2 81.7 80.8
SCH:6. Availability of School toilets for students in ODF and Non-ODF region
Particulars Number of Students Number of Toilets Seats Number of Students for
each toilet seat Number of Functional
Toilet Seat Number of Student for
each Functional Toilet Seat
Village type ODF Non-ODF ODF Non-ODF ODF Non-ODF ODF Non-ODF ODF Non-ODF
Boys 295854 315244 4427 3837 66.8 82.2 4132 3546 71.6 88.9
Girls 284469 316201 4669 3991 60.9 79.2 4440 3744 64.1 84.5
SCH:7. Hygienic practices observed in school
States Total ODF NON ODF
Hygienic Un-Hygienic Total Hygienic Un-Hygienic Total Hygienic Un-Hygienic Total
N % % N % % N % %
Total 98.0 2.0 5870 99.1 0.9 2816 97.1 2.9 3054
A & N Islands 100.0 0.0 26 100.0 0.0 26 0.0 0.0 0
Andhra Pradesh 95.9 4.1 244 100.0 0.0 180 84.4 15.6 64
Arunachal Pradesh 100.0 0.0 40 100.0 0.0 20 100.0 0.0 20
Assam 100.0 0.0 178 100.0 0.0 39 100.0 0.0 139
Bihar 97.4 2.6 532 96.7 3.3 30 97.4 2.6 502

Interim Report National Annual Rural Sanitation Survey (NARSS), Round-2, 2018-2019
ANNEXURE - III: TABLES PAGE 218
States Total ODF NON ODF
Hygienic Un-Hygienic Total Hygienic Un-Hygienic Total Hygienic Un-Hygienic Total
N % % N % % N % %
Chhattisgarh 100.0 0.0 183 100.0 0.0 183 0.0 0.0 0
Dadra & Nagar Haveli 100.0 0.0 26 100.0 0.0 26 0.0 0.0 0
Goa 95.0 5.0 20 0.0 0.0 0 95.0 5.0 20
Gujarat 100.0 0.0 194 100.0 0.0 194 0.0 0.0 0
Haryana 100.0 0.0 102 100.0 0.0 102 0.0 0.0 0
Himachal Pradesh 100.0 0.0 42 100.0 0.0 42 0.0 0.0 0
Jammu & Kashmir 100.0 0.0 72 100.0 0.0 20 100.0 0.0 52
Jharkhand 100.0 0.0 141 100.0 0.0 35 100.0 0.0 106
Karnataka 90.8 9.2 239 96.4 3.6 169 77.1 22.9 70
Kerala 100.0 0.0 178 100.0 0.0 178 0.0 0.0 0
Madhya Pradesh 98.0 2.0 306 100.0 0.0 101 97.1 2.9 205
Maharashtra 100.0 0.0 420 100.0 0.0 300 100.0 0.0 120
Manipur 100.0 0.0 51 100.0 0.0 25 100.0 0.0 26
Meghalaya 100.0 0.0 46 100.0 0.0 24 100.0 0.0 22
Mizoram 100.0 0.0 52 100.0 0.0 26 100.0 0.0 26
Nagaland 100.0 0.0 52 100.0 0.0 26 100.0 0.0 26
Odisha 91.0 9.0 266 96.8 3.2 31 90.2 9.8 235
Puducherry 100.0 0.0 26 0.0 0.0 0 100.0 0.0 26
Punjab 99.1 0.9 106 98.2 1.8 57 100.0 0.0 49
Rajasthan 100.0 0.0 393 100.0 0.0 299 100.0 0.0 94
Sikkim 100.0 0.0 26 100.0 0.0 26 0.0 0.0 0
Tamil Nadu 100.0 0.0 299 100.0 0.0 50 100.0 0.0 249
Telangana 99.4 0.6 157 100.0 0.0 68 98.9 1.1 89
Tripura 100.0 0.0 26 0.0 0.0 0 100.0 0.0 26
Uttar Pradesh 100.0 0.0 885 100.0 0.0 132 100.0 0.0 753
Uttarakhand 100.0 0.0 57 100.0 0.0 57 0.0 0.0 0
West Bengal 92.6 7.4 485 95.1 4.9 350 85.9 14.1 135
If coded 1 or 2 in Q.2
SCH:8. Hygienic situation of the toilet? - Toilet is connected to a tank/ pit or to a sewer system
States Total ODF NON ODF
Yes No Total Yes No Total Yes No Total
% % N % % N % % N
Total 99.1 0.9 5870 99.8 0.2 2816 98.6 1.4 3054

Interim Report National Annual Rural Sanitation Survey (NARSS), Round-2, 2018-2019
ANNEXURE - III: TABLES PAGE 219
States Total ODF NON ODF
Yes No Total Yes No Total Yes No Total
% % N % % N % % N
A & N Islands 100.0 0.0 26 100.0 0.0 26 0.0 0.0 0
Andhra Pradesh 98.8 1.2 244 100.0 0.0 180 95.3 4.7 64
Arunachal Pradesh 100.0 0.0 40 100.0 0.0 20 100.0 0.0 20
Assam 100.0 0.0 178 100.0 0.0 39 100.0 0.0 139
Bihar 97.4 2.6 532 96.7 3.3 30 97.4 2.6 502
Chhattisgarh 100.0 0.0 183 100.0 0.0 183 0.0 0.0 0
Dadra &Nagar Haveli 100.0 0.0 26 100.0 0.0 26 0.0 0.0 0
Goa 95.0 5.0 20 0.0 0.0 0 95.0 5.0 20
Gujarat 100.0 0.0 194 100.0 0.0 194 0.0 0.0 0
Haryana 100.0 0.0 102 100.0 0.0 102 0.0 0.0 0
Himachal Pradesh 100.0 0.0 42 100.0 0.0 42 0.0 0.0 0
Jammu & Kashmir 100.0 0.0 72 100.0 0.0 20 100.0 0.0 52
Jharkhand 100.0 0.0 141 100.0 0.0 35 100.0 0.0 106
Karnataka 96.2 3.8 239 100.0 0.0 169 87.1 12.9 70
Kerala 100.0 0.0 178 100.0 0.0 178 0.0 0.0 0
Madhya Pradesh 98.0 2.0 306 100.0 0.0 101 97.1 2.9 205
Maharashtra 100.0 0.0 420 100.0 0.0 300 100.0 0.0 120
Manipur 100.0 0.0 51 100.0 0.0 25 100.0 0.0 26
Meghalaya 100.0 0.0 46 100.0 0.0 24 100.0 0.0 22
Mizoram 100.0 0.0 52 100.0 0.0 26 100.0 0.0 26
Nagaland 100.0 0.0 52 100.0 0.0 26 100.0 0.0 26
Odisha 95.5 4.5 266 96.8 3.2 31 95.3 4.7 235
Puducherry 100.0 0.0 26 0.0 0.0 0 100.0 0.0 26
Punjab 99.1 0.9 106 98.2 1.8 57 100.0 0.0 49
Rajasthan 100.0 0.0 393 100.0 0.0 299 100.0 0.0 94
Sikkim 100.0 0.0 26 100.0 0.0 26 0.0 0.0 0
Tamil Nadu 100.0 0.0 299 100.0 0.0 50 100.0 0.0 249
Telangana 99.4 0.6 157 100.0 0.0 68 98.9 1.1 89
Tripura 100.0 0.0 26 0.0 0.0 0 100.0 0.0 26
Uttar Pradesh 100.0 0.0 885 100.0 0.0 132 100.0 0.0 753
Uttarakhand 100.0 0.0 57 100.0 0.0 57 0.0 0.0 0
West Bengal 99.4 0.6 485 99.1 0.9 350 100.0 0.0 135
If coded 2 in Q.8a

Interim Report National Annual Rural Sanitation Survey (NARSS), Round-2, 2018-2019
ANNEXURE - III: TABLES PAGE 220
SCH:9. Hand washing practices
States
Total ODF NON ODF
On
ly W
ate
r av
aila
ble
ne
ar t
he
toile
t o
r w
ate
r p
oin
t
Soap
ava
ilab
le n
ear
th
e t
oile
t
or
wat
er
po
int
Bo
th w
ate
r &
so
ap a
vaila
ble
ne
ar t
he
to
ilet
or
wat
er
po
int
Ne
ith
er
soap
no
r w
ate
r
avai
lab
le n
ear
th
e t
oile
t
Tota
l
On
ly W
ate
r av
aila
ble
ne
ar t
he
toile
t o
r w
ate
r p
oin
t
Soap
ava
ilab
le n
ear
th
e t
oile
t
or
wat
er
po
int
Bo
th w
ate
r &
so
ap a
vaila
ble
ne
ar t
he
to
ilet
or
wat
er
po
int
Ne
ith
er
soap
no
r w
ate
r
avai
lab
le n
ear
th
e t
oile
t
Tota
l
On
ly W
ate
r av
aila
ble
ne
ar t
he
toile
t o
r w
ate
r p
oin
t
Soap
ava
ilab
le n
ear
th
e t
oile
t
or
wat
er
po
int
Bo
th w
ate
r &
so
ap a
vaila
ble
ne
ar t
he
to
ilet
or
wat
er
po
int
Ne
ith
er
soap
no
r w
ate
r av
aila
ble
ne
ar t
he
to
ilet
Tota
l
% % % % N % % % % N % % % % N
Total 41.0 13.7 39.8 5.5 5870 46.7 12.4 40.4 0.5 2816 35.8 14.8 39.2 10.2 3054
A & N Islands 50.0 23.1 26.9 0.0 26 50.0 23.1 26.9 0.0 26 0.0 0.0 0.0 0.0 0
Andhra Pradesh 63.5 8.2 25.4 2.9 244 65.0 7.8 27.2 0.0 180 59.4 9.4 20.3 10.9 64
Arunachal Pradesh 42.5 15.0 37.5 5.0 40 35.0 20.0 45.0 0.0 20 50.0 10.0 30.0 10.0 20
Assam 44.4 29.2 19.1 7.3 178 53.8 28.2 17.9 0.0 39 41.7 29.5 19.4 9.4 139
Bihar 41.2 11.3 36.8 10.7 532 43.3 16.7 40.0 0.0 30 41.0 11.0 36.7 11.4 502
Chhattisgarh 47.5 10.4 42.1 0.0 183 47.5 10.4 42.1 0.0 183 0.0 0.0 0.0 0.0 0
Dadra &Nagar Haveli 11.5 38.5 50.0 0.0 26 11.5 38.5 50.0 0.0 26 0.0 0.0 0.0 0.0 0
Goa 45.0 20.0 35.0 0.0 20 0.0 0.0 0.0 0.0 0 45.0 20.0 35.0 0.0 20
Gujarat 35.1 21.6 43.3 0.0 194 35.1 21.6 43.3 0.0 194 0.0 0.0 0.0 0.0 0
Haryana 34.3 9.8 55.9 0.0 102 34.3 9.8 55.9 0.0 102 0.0 0.0 0.0 0.0 0
Himachal Pradesh 23.8 7.1 69.0 0.0 42 23.8 7.1 69.0 0.0 42 0.0 0.0 0.0 0.0 0
Jammu & Kashmir 59.7 5.6 29.2 5.6 72 65.0 5.0 30.0 0.0 20 57.7 5.8 28.8 7.7 52
Jharkhand 27.7 5.7 61.0 5.7 141 20.0 5.7 74.3 0.0 35 30.2 5.7 56.6 7.5 106
Karnataka 61.5 11.3 21.3 5.9 239 72.8 8.3 17.2 1.8 169 34.3 18.6 31.4 15.7 70
Kerala 55.1 11.8 33.1 0.0 178 55.1 11.8 33.1 0.0 178 0.0 0.0 0.0 0.0 0
Madhya Pradesh 32.7 10.1 39.9 17.3 306 41.6 9.9 47.5 1.0 101 28.3 10.2 36.1 25.4 205
Maharashtra 36.4 11.7 43.3 8.6 420 42.0 12.3 44.0 1.7 300 22.5 10.0 41.7 25.8 120
Manipur 47.1 3.9 47.1 2.0 51 56.0 0.0 44.0 0.0 25 38.5 7.7 50.0 3.8 26
Meghalaya 73.9 4.3 19.6 2.2 46 79.2 4.2 16.7 0.0 24 68.2 4.5 22.7 4.5 22
Mizoram 57.7 19.2 23.1 0.0 52 61.5 15.4 23.1 0.0 26 53.8 23.1 23.1 0.0 26
Nagaland 75.0 0.0 15.4 9.6 52 88.5 0.0 11.5 0.0 26 61.5 0.0 19.2 19.2 26
Odisha 24.4 28.9 22.2 24.4 266 32.3 32.3 32.3 3.2 31 23.4 28.5 20.9 27.2 235
Puducherry 42.3 11.5 42.3 3.8 26 0.0 0.0 0.0 0.0 0 42.3 11.5 42.3 3.8 26

Interim Report National Annual Rural Sanitation Survey (NARSS), Round-2, 2018-2019
ANNEXURE - III: TABLES PAGE 221
States
Total ODF NON ODF
On
ly W
ate
r av
aila
ble
ne
ar t
he
toile
t o
r w
ate
r p
oin
t
Soap
ava
ilab
le n
ear
th
e t
oile
t
or
wat
er
po
int
Bo
th w
ate
r &
so
ap a
vaila
ble
ne
ar t
he
to
ilet
or
wat
er
po
int
Ne
ith
er
soap
no
r w
ate
r
avai
lab
le n
ear
th
e t
oile
t
Tota
l
On
ly W
ate
r av
aila
ble
ne
ar t
he
toile
t o
r w
ate
r p
oin
t
Soap
ava
ilab
le n
ear
th
e t
oile
t
or
wat
er
po
int
Bo
th w
ate
r &
so
ap a
vaila
ble
ne
ar t
he
to
ilet
or
wat
er
po
int
Ne
ith
er
soap
no
r w
ate
r
avai
lab
le n
ear
th
e t
oile
t
Tota
l
On
ly W
ate
r av
aila
ble
ne
ar t
he
toile
t o
r w
ate
r p
oin
t
Soap
ava
ilab
le n
ear
th
e t
oile
t
or
wat
er
po
int
Bo
th w
ate
r &
so
ap a
vaila
ble
ne
ar t
he
to
ilet
or
wat
er
po
int
Ne
ith
er
soap
no
r w
ate
r av
aila
ble
ne
ar t
he
to
ilet
Tota
l
% % % % N % % % % N % % % % N
Punjab 49.1 16.0 34.9 0.0 106 50.9 22.8 26.3 0.0 57 46.9 8.2 44.9 0.0 49
Rajasthan 38.2 17.6 42.0 2.3 393 36.8 18.1 45.2 0.0 299 42.6 16.0 31.9 9.6 94
Sikkim 23.1 0.0 76.9 0.0 26 23.1 0.0 76.9 0.0 26 0.0 0.0 0.0 0.0 0
Tamil Nadu 35.1 7.0 57.2 0.7 299 30.0 6.0 64.0 0.0 50 36.1 7.2 55.8 0.8 249
Telangana 56.7 5.7 29.3 8.3 157 54.4 5.9 38.2 1.5 68 58.4 5.6 22.5 13.5 89
Tripura 46.2 15.4 11.5 26.9 26 0.0 0.0 0.0 0.0 0 46.2 15.4 11.5 26.9 26
Uttar Pradesh 21.5 18.6 57.7 2.1 885 11.4 12.1 76.5 0.0 132 23.2 19.8 54.4 2.5 753
Uttarakhand 64.9 10.5 24.6 0.0 57 64.9 10.5 24.6 0.0 57 0.0 0.0 0.0 0.0 0
West Bengal 59.8 9.3 29.5 1.4 485 57.4 8.6 33.4 0.6 350 65.9 11.1 19.3 3.7 135
All surveyed School
SCH:10. Water available or not for toilet use
States
Total ODF NON ODF
Water available
water not available
Total Water
available water not available
Total Water
available water not available
Total
% % N % % N % % N
Total 80.8 19.2 5870 87.1 12.9 2816 75.0 25.0 3054
A & N Islands 76.9 23.1 26 76.9 23.1 26 0.0 0.0 0
Andhra Pradesh 88.9 11.1 244 92.2 7.8 180 79.7 20.3 64
Arunachal Pradesh 80.0 20.0 40 80.0 20.0 20 80.0 20.0 20
Assam 63.5 36.5 178 71.8 28.2 39 61.2 38.8 139
Bihar 78.0 22.0 532 83.3 16.7 30 77.7 22.3 502
Chhattisgarh 89.6 10.4 183 89.6 10.4 183 0.0 0.0 0
Dadra &Nagar Haveli 61.5 38.5 26 61.5 38.5 26 0.0 0.0 0
Goa 80.0 20.0 20 0.0 0.0 0 80.0 20.0 20
Gujarat 78.4 21.6 194 78.4 21.6 194 0.0 0.0 0
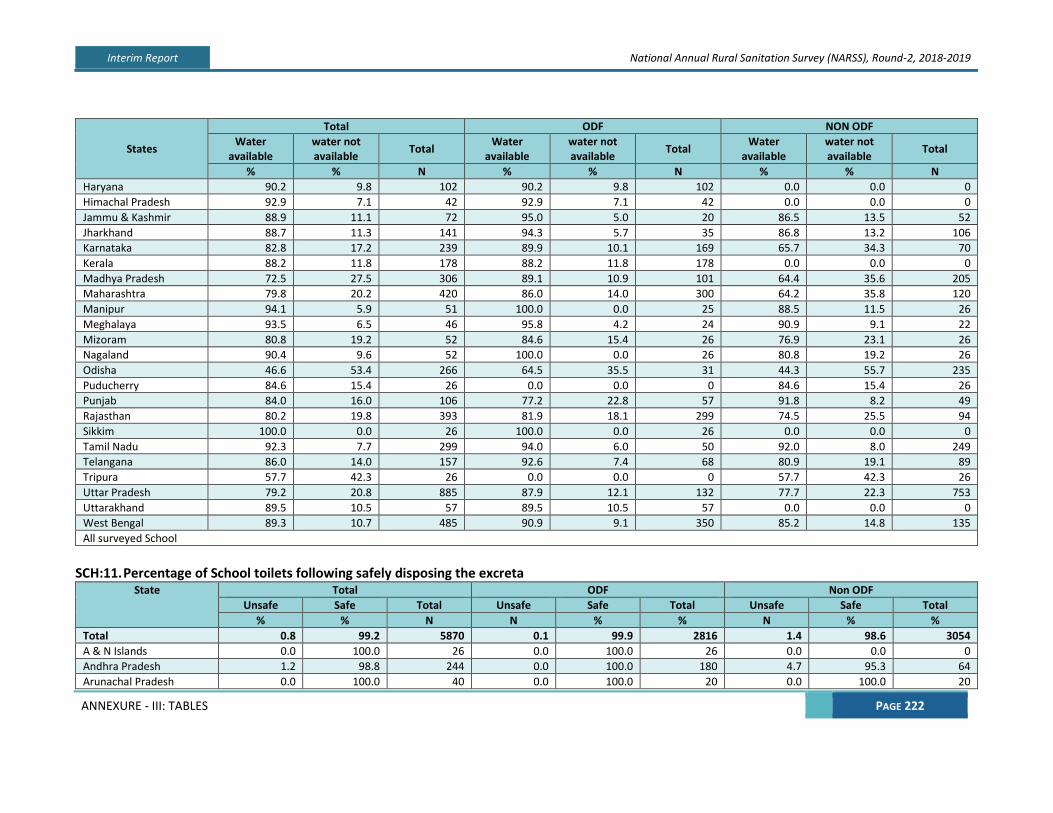
Interim Report National Annual Rural Sanitation Survey (NARSS), Round-2, 2018-2019
ANNEXURE - III: TABLES PAGE 222
States
Total ODF NON ODF
Water available
water not available
Total Water
available water not available
Total Water
available water not available
Total
% % N % % N % % N
Haryana 90.2 9.8 102 90.2 9.8 102 0.0 0.0 0
Himachal Pradesh 92.9 7.1 42 92.9 7.1 42 0.0 0.0 0
Jammu & Kashmir 88.9 11.1 72 95.0 5.0 20 86.5 13.5 52
Jharkhand 88.7 11.3 141 94.3 5.7 35 86.8 13.2 106
Karnataka 82.8 17.2 239 89.9 10.1 169 65.7 34.3 70
Kerala 88.2 11.8 178 88.2 11.8 178 0.0 0.0 0
Madhya Pradesh 72.5 27.5 306 89.1 10.9 101 64.4 35.6 205
Maharashtra 79.8 20.2 420 86.0 14.0 300 64.2 35.8 120
Manipur 94.1 5.9 51 100.0 0.0 25 88.5 11.5 26
Meghalaya 93.5 6.5 46 95.8 4.2 24 90.9 9.1 22
Mizoram 80.8 19.2 52 84.6 15.4 26 76.9 23.1 26
Nagaland 90.4 9.6 52 100.0 0.0 26 80.8 19.2 26
Odisha 46.6 53.4 266 64.5 35.5 31 44.3 55.7 235
Puducherry 84.6 15.4 26 0.0 0.0 0 84.6 15.4 26
Punjab 84.0 16.0 106 77.2 22.8 57 91.8 8.2 49
Rajasthan 80.2 19.8 393 81.9 18.1 299 74.5 25.5 94
Sikkim 100.0 0.0 26 100.0 0.0 26 0.0 0.0 0
Tamil Nadu 92.3 7.7 299 94.0 6.0 50 92.0 8.0 249
Telangana 86.0 14.0 157 92.6 7.4 68 80.9 19.1 89
Tripura 57.7 42.3 26 0.0 0.0 0 57.7 42.3 26
Uttar Pradesh 79.2 20.8 885 87.9 12.1 132 77.7 22.3 753
Uttarakhand 89.5 10.5 57 89.5 10.5 57 0.0 0.0 0
West Bengal 89.3 10.7 485 90.9 9.1 350 85.2 14.8 135
All surveyed School
SCH:11. Percentage of School toilets following safely disposing the excreta
State Total ODF Non ODF
Unsafe Safe Total Unsafe Safe Total Unsafe Safe Total
% % N N % % N % %
Total 0.8 99.2 5870 0.1 99.9 2816 1.4 98.6 3054
A & N Islands 0.0 100.0 26 0.0 100.0 26 0.0 0.0 0
Andhra Pradesh 1.2 98.8 244 0.0 100.0 180 4.7 95.3 64
Arunachal Pradesh 0.0 100.0 40 0.0 100.0 20 0.0 100.0 20

Interim Report National Annual Rural Sanitation Survey (NARSS), Round-2, 2018-2019
ANNEXURE - III: TABLES PAGE 223
State Total ODF Non ODF
Unsafe Safe Total Unsafe Safe Total Unsafe Safe Total
% % N N % % N % %
Assam 0.0 100.0 178 0.0 100.0 39 0.0 100.0 139
Bihar 2.6 97.4 532 3.3 96.7 30 2.6 97.4 502
Chhattisgarh 0.0 100.0 183 0.0 100.0 183 0.0 0.0 0
Dadra And Nagar Haveli 0.0 100.0 26 0.0 100.0 26 0.0 0.0 0
Goa 5.0 95.0 20 0.0 0.0 0 5.0 95.0 20
Gujarat 0.0 100.0 194 0.0 100.0 194 0.0 0.0 0
Haryana 0.0 100.0 102 0.0 100.0 102 0.0 0.0 0
Himachal Pradesh 0.0 100.0 42 0.0 100.0 42 0.0 0.0 0
Jammu & Kashmir 0.0 100.0 72 0.0 100.0 20 0.0 100.0 52
Jharkhand 0.0 100.0 141 0.0 100.0 35 0.0 100.0 106
Karnataka 3.8 96.2 239 0.0 100.0 169 12.9 87.1 70
Kerala 0.0 100.0 178 0.0 100.0 178 0.0 0.0 0
Madhya Pradesh 2.0 98.0 306 0.0 100.0 101 2.9 97.1 205
Maharashtra 0.0 100.0 420 0.0 100.0 300 0.0 100.0 120
Manipur 0.0 100.0 51 0.0 100.0 25 0.0 100.0 26
Meghalaya 0.0 100.0 46 0.0 100.0 24 0.0 100.0 22
Mizoram 0.0 100.0 52 0.0 100.0 26 0.0 100.0 26
Nagaland 0.0 100.0 52 0.0 100.0 26 0.0 100.0 26
Odisha 4.1 95.9 266 0.0 100.0 31 4.7 95.3 235
Puducherry 0.0 100.0 26 0.0 0.0 0 0.0 100.0 26
Punjab 0.9 99.1 106 1.8 98.2 57 0.0 100.0 49
Rajasthan 0.0 100.0 393 0.0 100.0 299 0.0 100.0 94
Sikkim 0.0 100.0 26 0.0 100.0 26 0.0 0.0 0
Tamil Nadu 0.0 100.0 299 0.0 100.0 50 0.0 100.0 249
Telangana 0.6 99.4 157 0.0 100.0 68 1.1 98.9 89
Tripura 0.0 100.0 26 0.0 0.0 0 0.0 100.0 26
Uttar Pradesh 0.0 100.0 885 0.0 100.0 132 0.0 100.0 753
Uttarakhand 0.0 100.0 57 0.0 100.0 57 0.0 0.0 0
West Bengal 0.0 100.0 485 0.0 100.0 350 0.0 100.0 135

Interim Report National Annual Rural Sanitation Survey (NARSS), Round-2, 2018-2019
ANNEXURE - III: TABLES PAGE 224
SCH:12. Usage status of the school toilets States Total ODF NON ODF
Yes No Base Yes No Base Yes No Base
% % N % % N % % N
Total 97.6 2.4 5870 99.6 0.4 2816 95.8 4.2 3054
A & N Islands 96.2 3.8 26 96.2 3.8 26 0.0 0.0 0
Andhra Pradesh 96.3 3.7 244 100.0 0.0 180 85.9 14.1 64
Arunachal Pradesh 100.0 0.0 40 100.0 0.0 20 100.0 0.0 20
Assam 100.0 0.0 178 100.0 0.0 39 100.0 0.0 139
Bihar 98.3 1.7 532 96.7 3.3 30 98.4 1.6 502
Chhattisgarh 99.5 0.5 183 99.5 0.5 183 0.0 0.0 0
Dadra And Nagar Haveli 100.0 0.0 26 100.0 0.0 26 0.0 0.0 0
Goa 95.0 5.0 20 0.0 0.0 0 95.0 5.0 20
Gujarat 100.0 0.0 194 100.0 0.0 194 0.0 0.0 0
Haryana 100.0 0.0 102 100.0 0.0 102 0.0 0.0 0
Himachal Pradesh 100.0 0.0 42 100.0 0.0 42 0.0 0.0 0
Jammu & Kashmir 100.0 0.0 72 100.0 0.0 20 100.0 0.0 52
Jharkhand 100.0 0.0 141 100.0 0.0 35 100.0 0.0 106
Karnataka 83.7 16.3 239 97.6 2.4 169 50.0 50.0 70
Kerala 100.0 0.0 178 100.0 0.0 178 0.0 0.0 0
Madhya Pradesh 98.4 1.6 306 100.0 0.0 101 97.6 2.4 205
Maharashtra 100.0 0.0 420 100.0 0.0 300 100.0 0.0 120
Manipur 100.0 0.0 51 100.0 0.0 25 100.0 0.0 26
Meghalaya 100.0 0.0 46 100.0 0.0 24 100.0 0.0 22
Mizoram 100.0 0.0 52 100.0 0.0 26 100.0 0.0 26
Nagaland 100.0 0.0 52 100.0 0.0 26 100.0 0.0 26
Odisha 80.1 19.9 266 93.5 6.5 31 78.3 21.7 235
Puducherry 100.0 0.0 26 0.0 0.0 0 100.0 0.0 26
Punjab 100.0 0.0 106 100.0 0.0 57 100.0 0.0 49
Rajasthan 100.0 0.0 393 100.0 0.0 299 100.0 0.0 94
Sikkim 100.0 0.0 26 100.0 0.0 26 0.0 0.0 0
Tamil Nadu 100.0 0.0 299 100.0 0.0 50 100.0 0.0 249
Telangana 100.0 0.0 157 100.0 0.0 68 100.0 0.0 89
Tripura 100.0 0.0 26 0.0 0.0 0 100.0 0.0 26
Uttar Pradesh 100.0 0.0 885 100.0 0.0 132 100.0 0.0 753
Uttarakhand 100.0 0.0 57 100.0 0.0 57 0.0 0.0 0
West Bengal 95.7 4.3 485 99.1 0.9 350 86.7 13.3 135

Interim Report National Annual Rural Sanitation Survey (NARSS), Round-2, 2018-2019
ANNEXURE - III: TABLES PAGE 225
States Total ODF NON ODF
Yes No Base Yes No Base Yes No Base
% % N % % N % % N
All surveyed School
ANNEXURE TABLES III – ANGANWADI CENTERS AWC:1. Percent distribution of ownership types of Anganwadi centers
Particulars Total ODF NON ODF
Base 6082 2867 3215
Yes, has its own building 70.5 76.1 65.4
No, running in Private building/house 29.5 23.9 34.6
AWC:2. State-wise percent distribution of accessibility to toilet
States
Total ODF NON ODF
Access Non-Access Total Access Non-Access Total Access Non-Access Total
% % N % % N % % N
Total 91.3 8.7 6082 98.9 1.1 2867 84.4 15.6 3215
A & N Islands 100.0 0.0 26 100.0 0.0 26 0.0 0.0 0
Andhra Pradesh 87.8 12.2 271 98.9 1.1 182 65.2 34.8 89
Arunachal Pradesh 100.0 0.0 50 100.0 0.0 24 100.0 0.0 26
Assam 97.3 2.7 186 100.0 0.0 39 96.6 3.4 147
Bihar 64.4 35.6 553 74.2 25.8 31 63.8 36.2 522
Chhattisgarh 100.0 0.0 183 100.0 0.0 183 0.0 0.0 0
Dadra &Nagar Haveli 100.0 0.0 26 100.0 0.0 26 0.0 0.0 0
Goa 100.0 0.0 26 0.0 0.0 0 100.0 0.0 26
Gujarat 100.0 0.0 194 100.0 0.0 194 0.0 0.0 0
Haryana 100.0 0.0 102 100.0 0.0 102 0.0 0.0 0
Himachal Pradesh 100.0 0.0 54 100.0 0.0 54 0.0 0.0 0
Jammu & Kashmir 91.0 9.0 78 100.0 0.0 25 86.8 13.2 53
Jharkhand 79.1 20.9 148 92.5 7.5 40 74.1 25.9 108
Karnataka 88.3 11.7 265 98.8 1.2 171 69.1 30.9 94
Kerala 100.0 0.0 178 100.0 0.0 178 0.0 0.0 0
Madhya Pradesh 86.4 13.6 324 98.0 2.0 102 81.1 18.9 222
Maharashtra 96.2 3.8 420 99.3 0.7 300 88.3 11.7 120

Interim Report National Annual Rural Sanitation Survey (NARSS), Round-2, 2018-2019
ANNEXURE - III: TABLES PAGE 226
States
Total ODF NON ODF
Access Non-Access Total Access Non-Access Total Access Non-Access Total
% % N % % N % % N
Manipur 100.0 0.0 51 100.0 0.0 25 100.0 0.0 26
Meghalaya 100.0 0.0 50 100.0 0.0 25 100.0 0.0 25
Mizoram 100.0 0.0 52 100.0 0.0 26 100.0 0.0 26
Nagaland 100.0 0.0 52 100.0 0.0 26 100.0 0.0 26
Odisha 82.2 17.8 281 100.0 0.0 32 79.9 20.1 249
Puducherry 92.3 7.7 26 0.0 0.0 0 92.3 7.7 26
Punjab 94.4 5.6 108 96.7 3.3 60 91.7 8.3 48
Rajasthan 95.6 4.4 390 98.0 2.0 297 88.2 11.8 93
Sikkim 100.0 0.0 26 100.0 0.0 26 0.0 0.0 0
Tamil Nadu 99.1 0.9 331 100.0 0.0 65 98.9 1.1 266
Telangana 70.9 29.1 165 95.6 4.4 68 53.6 46.4 97
Tripura 100.0 0.0 26 0.0 0.0 0 100.0 0.0 26
Uttar Pradesh 98.9 1.1 883 100.0 0.0 133 98.7 1.3 750
Uttarakhand 98.3 1.7 58 98.3 1.7 58 0.0 0.0 0
West Bengal 93.8 6.2 499 99.7 0.3 349 80.0 20.0 150
All surveyed AWC
AWC:3. Percent distribution of accessibity to the toilet by ownership status
Accessibility
Total ODF NON ODF
Count Column Total N
% Count
Column Total N
% Count
Column Total N
% Count
Column Total N
% Count
Column Total N
% Count
Column Total N
%
Yes, AWC has a toilet in own premises 3353 78.2 541 30.1 1858 85.2 250 36.5 1495 71.1 291 26.2
AWC uses the toilet of the Household in case of center 94 2.2 560 31.2 51 2.3 274 40.0 43 2.0 286 25.7
AWC do not have access a toilet facility 838 19.6 696 38.7 273 12.5 161 23.5 565 26.9 535 48.1
Total 4285 100.0 1797 100.0 2182 100.0 685 100.0 2103 100.0 1112 100.0
AWC:4. Percent distribution of functionality by village category
States
Total ODF NON ODF
Functional toilet
Non-functional
toilet Total
Functional toilet
Non-functional
toilet Total
Functional toilet
Non-functional
toilet Total
Total 97.7 2.3 4482 99.8 0.2 2429 95.3 4.7 2053

Interim Report National Annual Rural Sanitation Survey (NARSS), Round-2, 2018-2019
ANNEXURE - III: TABLES PAGE 227
States
Total ODF NON ODF
Functional toilet
Non-functional
toilet Total
Functional toilet
Non-functional
toilet Total
Functional toilet
Non-functional
toilet Total
A & N Islands 100.0 0.0 19 100.0 0.0 19 0.0 0.0 0
Andhra Pradesh 97.8 2.2 185 99.3 0.7 143 92.9 7.1 42
Arunachal Pradesh 100.0 0.0 11 100.0 0.0 5 100.0 0.0 6
Assam 98.3 1.7 58 100.0 0.0 12 97.8 2.2 46
Bihar 96.9 3.1 192 100.0 0.0 10 96.7 3.3 182
Chhattisgarh 100.0 0.0 172 100.0 0.0 172 0.0 0.0 0
Dadra &Nagar Haveli 100.0 0.0 26 100.0 0.0 26 0.0 0.0 0
Goa 95.8 4.2 24 0.0 0.0 0 95.8 4.2 24
Gujarat 100.0 0.0 190 100.0 0.0 190 0.0 0.0 0
Haryana 100.0 0.0 100 100.0 0.0 100 0.0 0.0 0
Himachal Pradesh 100.0 0.0 50 100.0 0.0 50 0.0 0.0 0
Jammu & Kashmir 100.0 0.0 54 100.0 0.0 21 100.0 0.0 33
Jharkhand 96.6 3.4 87 100.0 0.0 30 94.7 5.3 57
Karnataka 90.6 9.4 181 99.2 0.8 127 70.4 29.6 54
Kerala 100.0 0.0 172 100.0 0.0 172 0.0 0.0 0
Madhya Pradesh 95.1 4.9 223 100.0 0.0 80 92.3 7.7 143
Maharashtra 98.6 1.4 347 100.0 0.0 262 94.1 5.9 85
Manipur 97.7 2.3 43 100.0 0.0 22 95.2 4.8 21
Meghalaya 100.0 0.0 42 100.0 0.0 23 100.0 0.0 19
Mizoram 100.0 0.0 49 100.0 0.0 26 100.0 0.0 23
Nagaland 97.8 2.2 45 100.0 0.0 25 95.0 5.0 20
Odisha 78.5 21.5 144 96.2 3.8 26 74.6 25.4 118
Puducherry 100.0 0.0 22 0.0 0.0 0 100.0 0.0 22
Punjab 98.6 1.4 72 97.7 2.3 43 100.0 0.0 29
Rajasthan 99.6 0.4 279 100.0 0.0 228 98.0 2.0 51
Sikkim 100.0 0.0 26 100.0 0.0 26 0.0 0.0 0
Tamil Nadu 99.0 1.0 315 100.0 0.0 65 98.8 1.2 250
Telangana 100.0 0.0 76 100.0 0.0 45 100.0 0.0 31
Tripura 100.0 0.0 24 0.0 0.0 0 100.0 0.0 24
Uttar Pradesh 99.6 0.4 807 100.0 0.0 128 99.6 0.4 679
Uttarakhand 100.0 0.0 52 100.0 0.0 52 0.0 0.0 0
West Bengal 96.5 3.5 395 99.3 0.7 301 87.2 12.8 94

Interim Report National Annual Rural Sanitation Survey (NARSS), Round-2, 2018-2019
ANNEXURE - III: TABLES PAGE 228
AWC:5. Percent distribution of usage status of the toilet by village category
States Total ODF NON ODF
Yes No Total Yes No Total Yes No Total
Total 92.8 7.2 4482 98.9 1.1 2429 85.6 14.4 2053
A & N Islands 100.0 0.0 19 100.0 0.0 19 0.0 0.0 0
Andhra Pradesh 94.1 5.9 185 98.6 1.4 143 78.6 21.4 42
Arunachal Pradesh 100.0 0.0 11 100.0 0.0 5 100.0 0.0 6
Assam 74.1 25.9 58 100.0 0.0 12 67.4 32.6 46
Bihar 90.6 9.4 192 100.0 0.0 10 90.1 9.9 182
Chhattisgarh 98.8 1.2 172 98.8 1.2 172 0.0 0.0 0
Dadra &Nagar Haveli 100.0 0.0 26 100.0 0.0 26 0.0 0.0 0
Goa 91.7 8.3 24 0.0 0.0 0 91.7 8.3 24
Gujarat 100.0 0.0 190 100.0 0.0 190 0.0 0.0 0
Haryana 100.0 0.0 100 100.0 0.0 100 0.0 0.0 0
Himachal Pradesh 96.0 4.0 50 96.0 4.0 50 0.0 0.0 0
Jammu & Kashmir 92.6 7.4 54 95.2 4.8 21 90.9 9.1 33
Jharkhand 82.8 17.2 87 96.7 3.3 30 75.4 24.6 57
Karnataka 80.7 19.3 181 97.6 2.4 127 40.7 59.3 54
Kerala 100.0 0.0 172 100.0 0.0 172 0.0 0.0 0
Madhya Pradesh 82.5 17.5 223 97.5 2.5 80 74.1 25.9 143
Maharashtra 95.1 4.9 347 99.2 0.8 262 82.4 17.6 85
Manipur 97.7 2.3 43 100.0 0.0 22 95.2 4.8 21
Meghalaya 97.6 2.4 42 95.7 4.3 23 100.0 0.0 19
Mizoram 98.0 2.0 49 96.2 3.8 26 100.0 0.0 23
Nagaland 84.4 15.6 45 100.0 0.0 25 65.0 35.0 20
Odisha 79.9 20.1 144 96.2 3.8 26 76.3 23.7 118
Puducherry 86.4 13.6 22 0.0 0.0 0 86.4 13.6 22
Punjab 94.4 5.6 72 100.0 0.0 43 86.2 13.8 29
Rajasthan 97.1 2.9 279 100.0 0.0 228 84.3 15.7 51
Sikkim 100.0 0.0 26 100.0 0.0 26 0.0 0.0 0
Tamil Nadu 91.4 8.6 315 98.5 1.5 65 89.6 10.4 250
Telangana 85.5 14.5 76 93.3 6.7 45 74.2 25.8 31
Tripura 87.5 12.5 24 0.0 0.0 0 87.5 12.5 24
Uttar Pradesh 94.9 5.1 807 99.2 0.8 128 94.1 5.9 679
Uttarakhand 100.0 0.0 52 100.0 0.0 52 0.0 0.0 0
West Bengal 93.7 6.3 395 99.0 1.0 301 76.6 23.4 94

Interim Report National Annual Rural Sanitation Survey (NARSS), Round-2, 2018-2019
ANNEXURE - III: TABLES PAGE 229
AWC:6. Status of different toilet facilities used outside in case if toilets are not available in AWC Characteristics Total ODF NON ODF
Base 1534 434 1100
Nearby Public Toilet 2.2 4.6 1.2
School Toilet 21.3 30.9 17.5
Own House 41.9 57.1 35.9
Open 34.7 7.4 45.5

Interim Report National Annual Rural Sanitation Survey (NARSS), Round-2, 2018-2019
ANNEXURE - III: TABLES PAGE 230
AWC:7. Percent distribution of hygienic situation States Total ODF NON ODF
Hygienic Un-Hygienic Total Hygienic Un-Hygienic Total Hygienic Un-Hygienic Total
Total 95.9 4.1 4482 99.1 0.9 2429 92.1 7.9 2053
A & N Islands 100.0 0.0 19 100.0 0.0 19 0.0 0.0 0
Andhra Pradesh 87.0 13.0 185 98.6 1.4 143 47.6 52.4 42
Arunachal Pradesh 100.0 0.0 11 100.0 0.0 5 100.0 0.0 6
Assam 98.3 1.7 58 100.0 0.0 12 97.8 2.2 46
Bihar 96.9 3.1 192 100.0 0.0 10 96.7 3.3 182
Chhattisgarh 100.0 0.0 172 100.0 0.0 172 0.0 0.0 0
Dadra &Nagar Haveli 100.0 0.0 26 100.0 0.0 26 0.0 0.0 0
Goa 95.8 4.2 24 0.0 0.0 0 95.8 4.2 24
Gujarat 100.0 0.0 190 100.0 0.0 190 0.0 0.0 0
Haryana 100.0 0.0 100 100.0 0.0 100 0.0 0.0 0
Himachal Pradesh 100.0 0.0 50 100.0 0.0 50 0.0 0.0 0
Jammu & Kashmir 100.0 0.0 54 100.0 0.0 21 100.0 0.0 33
Jharkhand 96.6 3.4 87 100.0 0.0 30 94.7 5.3 57
Karnataka 86.2 13.8 181 97.6 2.4 127 59.3 40.7 54
Kerala 100.0 0.0 172 100.0 0.0 172 0.0 0.0 0
Madhya Pradesh 95.1 4.9 223 100.0 0.0 80 92.3 7.7 143
Maharashtra 98.6 1.4 347 100.0 0.0 262 94.1 5.9 85
Manipur 97.7 2.3 43 100.0 0.0 22 95.2 4.8 21
Meghalaya 100.0 0.0 42 100.0 0.0 23 100.0 0.0 19
Mizoram 100.0 0.0 49 100.0 0.0 26 100.0 0.0 23
Nagaland 97.8 2.2 45 100.0 0.0 25 95.0 5.0 20
Odisha 79.2 20.8 144 96.2 3.8 26 75.4 24.6 118
Puducherry 100.0 0.0 22 0.0 0.0 0 100.0 0.0 22
Punjab 97.2 2.8 72 95.3 4.7 43 100.0 0.0 29
Rajasthan 99.6 0.4 279 100.0 0.0 228 98.0 2.0 51
Sikkim 100.0 0.0 26 100.0 0.0 26 0.0 0.0 0
Tamil Nadu 99.0 1.0 315 100.0 0.0 65 98.8 1.2 250
Telangana 100.0 0.0 76 100.0 0.0 45 100.0 0.0 31
Tripura 100.0 0.0 24 0.0 0.0 0 100.0 0.0 24
Uttar Pradesh 97.3 2.7 807 100.0 0.0 128 96.8 3.2 679
Uttarakhand 100.0 0.0 52 100.0 0.0 52 0.0 0.0 0
West Bengal 88.1 11.9 395 95.7 4.3 301 63.8 36.2 94

Interim Report National Annual Rural Sanitation Survey (NARSS), Round-2, 2018-2019
ANNEXURE - III: TABLES PAGE 231

Interim Report National Annual Rural Sanitation Survey (NARSS), Round-2, 2018-2019
ANNEXURE - III: TABLES PAGE 232
AWC:8. Percent distribution of safe disposal of human excreta States Total ODF NON ODF
Safe Unsafe Total Safe Unsafe Total Safe Unsafe Total
Total 98.6 1.4 4482 99.9 0.1 2429 97.1 2.9 2053
A & N Islands 100.0 0.0 19 100.0 0.0 19 0.0 0.0 0
Andhra Pradesh 98.4 1.6 185 99.3 0.7 143 95.2 4.8 42
Arunachal Pradesh 100.0 0.0 11 100.0 0.0 5 100.0 0.0 6
Assam 98.3 1.7 58 100.0 0.0 12 97.8 2.2 46
Bihar 96.9 3.1 192 100.0 0.0 10 96.7 3.3 182
Chhattisgarh 100.0 0.0 172 100.0 0.0 172 0.0 0.0 0
Dadra &Nagar Haveli 100.0 0.0 26 100.0 0.0 26 0.0 0.0 0
Goa 95.8 4.2 24 0.0 0.0 0 95.8 4.2 24
Gujarat 100.0 0.0 190 100.0 0.0 190 0.0 0.0 0
Haryana 100.0 0.0 100 100.0 0.0 100 0.0 0.0 0
Himachal Pradesh 100.0 0.0 50 100.0 0.0 50 0.0 0.0 0
Jammu & Kashmir 100.0 0.0 54 100.0 0.0 21 100.0 0.0 33
Jharkhand 96.6 3.4 87 100.0 0.0 30 94.7 5.3 57
Karnataka 92.8 7.2 181 99.2 0.8 127 77.8 22.2 54
Kerala 100.0 0.0 172 100.0 0.0 172 0.0 0.0 0
Madhya Pradesh 95.1 4.9 223 100.0 0.0 80 92.3 7.7 143
Maharashtra 98.6 1.4 347 100.0 0.0 262 94.1 5.9 85
Manipur 97.7 2.3 43 100.0 0.0 22 95.2 4.8 21
Meghalaya 100.0 0.0 42 100.0 0.0 23 100.0 0.0 19
Mizoram 100.0 0.0 49 100.0 0.0 26 100.0 0.0 23
Nagaland 97.8 2.2 45 100.0 0.0 25 95.0 5.0 20
Odisha 95.8 4.2 144 100.0 0.0 26 94.9 5.1 118
Puducherry 100.0 0.0 22 0.0 0.0 0 100.0 0.0 22
Punjab 98.6 1.4 72 97.7 2.3 43 100.0 0.0 29
Rajasthan 99.6 0.4 279 100.0 0.0 228 98.0 2.0 51
Sikkim 100.0 0.0 26 100.0 0.0 26 0.0 0.0 0
Tamil Nadu 99.0 1.0 315 100.0 0.0 65 98.8 1.2 250
Telangana 100.0 0.0 76 100.0 0.0 45 100.0 0.0 31
Tripura 100.0 0.0 24 0.0 0.0 0 100.0 0.0 24
Uttar Pradesh 99.6 0.4 807 100.0 0.0 128 99.6 0.4 679
Uttarakhand 100.0 0.0 52 100.0 0.0 52 0.0 0.0 0
West Bengal 99.0 1.0 395 100.0 0.0 301 95.7 4.3 94

Interim Report National Annual Rural Sanitation Survey (NARSS), Round-2, 2018-2019
ANNEXURE - III: TABLES PAGE 233

Interim Report National Annual Rural Sanitation Survey (NARSS), Round-2, 2018-2019
ANNEXURE - III: TABLES PAGE 234
AWC:9. Whether water is available for handwashing after the usage of toilet?
States
Total ODF NON ODF
On
ly W
ate
r av
aila
ble
ne
ar
the
to
ilet
or
wat
er
po
int
Soap
ava
ilab
le n
ear
th
e
toile
t o
r th
e w
ate
r p
oin
t
Bo
th w
ate
r &
so
ap
avai
lab
le n
ear
th
e t
oile
t o
r
wat
er
po
int
Ne
ith
er
soap
no
r w
ate
r
avai
lab
le n
ear
th
e t
oile
t
Tota
l
On
ly W
ate
r av
aila
ble
ne
ar
the
to
ilet
or
wat
er
po
int
Soap
ava
ilab
le n
ear
th
e
toile
t o
r th
e w
ate
r p
oin
t
Bo
th w
ate
r &
so
ap
avai
lab
le n
ear
th
e t
oile
t o
r
wat
er
po
int
Ne
ith
er
soap
no
r w
ate
r
avai
lab
le n
ear
th
e t
oile
t
Tota
l
On
ly W
ate
r av
aila
ble
ne
ar
the
to
ilet
or
wat
er
po
int
Soap
ava
ilab
le n
ear
th
e
toile
t o
r th
e w
ate
r p
oin
t
Bo
th w
ate
r &
so
ap
avai
lab
le n
ear
th
e t
oile
t o
r
wat
er
po
int
Ne
ith
er
soap
no
r w
ate
r
avai
lab
le n
ear
th
e t
oile
t
Tota
l
% % % % N % % % % N % % % % N
Total 39.6 11.0 42.1 7.4 4482 41.7 10.0 43.4 5.0 2429 37.2 12.1 40.5 10.2 2053
A & N Islands 68.4 5.3 26.3 0.0 19 68.4 5.3 26.3 0.0 19 0.0 0.0 0.0 0.0 0
Andhra Pradesh 51.4 4.3 40.0 4.3 185 55.2 4.2 39.2 1.4 143 38.1 4.8 42.9 14.3 42
Arunachal Pradesh 72.7 9.1 9.1 9.1 11 40.0 20.0 20.0 20.0 5 100.0 0.0 0.0 0.0 6
Assam 46.6 22.4 17.2 13.8 58 75.0 8.3 8.3 8.3 12 39.1 26.1 19.6 15.2 46
Bihar 45.8 6.3 43.8 4.2 192 30.0 0.0 60.0 10.0 10 46.7 6.6 42.9 3.8 182
Chhattisgarh 43.6 7.6 44.2 4.7 172 43.6 7.6 44.2 4.7 172 0.0 0.0 0.0 0.0 0
Dadra &Nagar Haveli 34.6 11.5 53.8 0.0 26 34.6 11.5 53.8 0.0 26 0.0 0.0 0.0 0.0 0
Goa 41.7 20.8 37.5 0.0 24 0.0 0.0 0.0 0.0 0 41.7 20.8 37.5 0.0 24
Gujarat 31.6 15.3 48.9 4.2 190 31.6 15.3 48.9 4.2 190 0.0 0.0 0.0 0.0 0
Haryana 33.0 10.0 50.0 7.0 100 33.0 10.0 50.0 7.0 100 0.0 0.0 0.0 0.0 0
Himachal Pradesh 24.0 12.0 60.0 4.0 50 24.0 12.0 60.0 4.0 50 0.0 0.0 0.0 0.0 0
Jammu & Kashmir 61.1 13.0 24.1 1.9 54 66.7 4.8 28.6 0.0 21 57.6 18.2 21.2 3.0 33
Jharkhand 24.1 2.3 57.5 16.1 87 23.3 6.7 60.0 10.0 30 24.6 0.0 56.1 19.3 57
Karnataka 39.8 12.7 38.1 9.4 181 32.3 11.8 49.6 6.3 127 57.4 14.8 11.1 16.7 54
Kerala 25.0 9.3 65.7 0.0 172 25.0 9.3 65.7 0.0 172 0.0 0.0 0.0 0.0 0
Madhya Pradesh 43.5 6.3 37.7 12.6 223 48.8 5.0 42.5 3.8 80 40.6 7.0 35.0 17.5 143
Maharashtra 33.1 11.8 44.1 11.0 347 37.0 11.1 42.4 9.5 262 21.2 14.1 49.4 15.3 85
Manipur 39.5 0.0 60.5 0.0 43 50.0 0.0 50.0 0.0 22 28.6 0.0 71.4 0.0 21
Meghalaya 85.7 2.4 7.1 4.8 42 82.6 4.3 4.3 8.7 23 89.5 0.0 10.5 0.0 19
Mizoram 61.2 14.3 24.5 0.0 49 65.4 19.2 15.4 0.0 26 56.5 8.7 34.8 0.0 23
Nagaland 60.0 0.0 13.3 26.7 45 60.0 0.0 12.0 28.0 25 60.0 0.0 15.0 25.0 20
Odisha 20.1 37.5 11.8 30.6 144 19.2 46.2 23.1 11.5 26 20.3 35.6 9.3 34.7 118
Puducherry 68.2 0.0 18.2 13.6 22 0.0 0.0 0.0 0.0 0 68.2 0.0 18.2 13.6 22

Interim Report National Annual Rural Sanitation Survey (NARSS), Round-2, 2018-2019
ANNEXURE - III: TABLES PAGE 235
States
Total ODF NON ODF
On
ly W
ate
r av
aila
ble
ne
ar
the
to
ilet
or
wat
er
po
int
Soap
ava
ilab
le n
ear
th
e
toile
t o
r th
e w
ate
r p
oin
t
Bo
th w
ate
r &
so
ap
avai
lab
le n
ear
th
e t
oile
t o
r
wat
er
po
int
Ne
ith
er
soap
no
r w
ate
r
avai
lab
le n
ear
th
e t
oile
t
Tota
l
On
ly W
ate
r av
aila
ble
ne
ar
the
to
ilet
or
wat
er
po
int
Soap
ava
ilab
le n
ear
th
e
toile
t o
r th
e w
ate
r p
oin
t
Bo
th w
ate
r &
so
ap
avai
lab
le n
ear
th
e t
oile
t o
r
wat
er
po
int
Ne
ith
er
soap
no
r w
ate
r
avai
lab
le n
ear
th
e t
oile
t
Tota
l
On
ly W
ate
r av
aila
ble
ne
ar
the
to
ilet
or
wat
er
po
int
Soap
ava
ilab
le n
ear
th
e
toile
t o
r th
e w
ate
r p
oin
t
Bo
th w
ate
r &
so
ap
avai
lab
le n
ear
th
e t
oile
t o
r
wat
er
po
int
Ne
ith
er
soap
no
r w
ate
r
avai
lab
le n
ear
th
e t
oile
t
Tota
l
% % % % N % % % % N % % % % N
Punjab 62.5 16.7 15.3 5.6 72 62.8 23.3 9.3 4.7 43 62.1 6.9 24.1 6.9 29
Rajasthan 44.8 9.7 38.0 7.5 279 46.9 7.9 38.2 7.0 228 35.3 17.6 37.3 9.8 51
Sikkim 30.8 0.0 69.2 0.0 26 30.8 0.0 69.2 0.0 26 0.0 0.0 0.0 0.0 0
Tamil Nadu 32.7 7.0 56.2 4.1 315 24.6 10.8 63.1 1.5 65 34.8 6.0 54.4 4.8 250
Telangana 55.3 9.2 28.9 6.6 76 55.6 11.1 31.1 2.2 45 54.8 6.5 25.8 12.9 31
Tripura 83.3 0.0 4.2 12.5 24 0.0 0.0 0.0 0.0 0 83.3 0.0 4.2 12.5 24
Uttar Pradesh 26.3 13.8 55.1 4.8 807 15.6 10.9 72.7 .8 128 28.3 14.3 51.8 5.6 679
Uttarakhand 57.7 7.7 26.9 7.7 52 57.7 7.7 26.9 7.7 52 0.0 0.0 0.0 0.0 0
West Bengal 57.2 10.6 24.1 8.1 395 58.5 9.6 26.9 5.0 301 53.2 13.8 14.9 18.1 94
If coded 1 or 2 in Q.2

Interim Report National Annual Rural Sanitation Survey (NARSS), Round-2, 2018-2019
ANNEXURE - III: TABLES PAGE 236
ANNEXURE TABLES IV – PUBLIC TOILET PT:1. Distribution of public toilet by village category
AVAILABILITY OF PUBLIC TOILET Total ODF NON ODF
Base 6136 2891 3245
Yes 17.8 20.2 15.6
No 82.2 79.8 84.4
PT:2. Distribution of public toilets by separate sections available
CHARACTERISTICS Total ODF NON ODF
Base 1091 585 506
Yes, there are separate sections 59.1 66.5 50.6
No, there are no separate sections 40.9 33.5 49.4
PT:3. Distribution of village by the public toilet having separate sections for men & women
States
Total ODF NON ODF
Yes, there are separate sections
No, there are no separate
sections Total
Yes, there are separate sections
No, there are no separate
sections Total
Yes, there are separate sections
No, there are no separate
sections Total
% % N % % N % % N
Total 59.1 40.9 1091 66.5 33.5 585 50.6 49.4 506
A & N Islands 80.0 20.0 15 80.0 20.0 15 0.0 0.0 0
Andhra Pradesh 92.6 7.4 27 92.0 8.0 25 100.0 0.0 2
Arunachal Pradesh 85.7 14.3 7 50.0 50.0 2 100.0 0.0 5
Assam 23.8 76.2 21 50.0 50.0 2 21.1 78.9 19
Bihar 47.4 52.6 19 50.0 50.0 2 47.1 52.9 17
Chhattisgarh 69.2 30.8 13 69.2 30.8 13 0.0 0.0 0
Dadra &Nagar Haveli 0.0 0.0 0 0.0 0.0 0 0.0 0.0 0
Goa 100.0 0.0 9 0.0 0.0 0 100.0 0.0 9
Gujarat 92.0 8.0 25 92.0 8.0 25 0.0 0.0 0
Haryana 57.9 42.1 19 57.9 42.1 19 0.0 0.0 0
Himachal Pradesh 50.0 50.0 4 50.0 50.0 4 0.0 0.0 0
Jammu & Kashmir 0.0 100.0 2 0.0 100.0 2 0.0 0.0 0
Jharkhand 57.1 42.9 7 66.7 33.3 3 50.0 50.0 4
Karnataka 72.7 27.3 44 79.2 20.8 24 65.0 35.0 20
Kerala 89.3 10.7 75 89.3 10.7 75 0.0 0.0 0

Interim Report National Annual Rural Sanitation Survey (NARSS), Round-2, 2018-2019
ANNEXURE - III: TABLES PAGE 237
States
Total ODF NON ODF
Yes, there are separate sections
No, there are no separate
sections Total
Yes, there are separate sections
No, there are no separate
sections Total
Yes, there are separate sections
No, there are no separate
sections Total
% % N % % N % % N
Madhya Pradesh 54.5 45.5 22 54.5 45.5 11 54.5 45.5 11
Maharashtra 69.1 30.9 149 68.5 31.5 124 72.0 28.0 25
Manipur 57.1 42.9 21 70.0 30.0 10 45.5 54.5 11
Meghalaya 62.5 37.5 8 66.7 33.3 6 50.0 50.0 2
Mizoram 43.2 56.8 37 38.1 61.9 21 50.0 50.0 16
Nagaland 25.6 74.4 39 23.8 76.2 21 27.8 72.2 18
Odisha 66.7 33.3 9 100.0 0.0 1 62.5 37.5 8
Puducherry 69.2 30.8 13 0.0 0.0 0 69.2 30.8 13
Punjab 0.0 0.0 0 0.0 0.0 0 0.0 0.0 0
Rajasthan 64.4 35.6 45 70.3 29.7 37 37.5 62.5 8
Sikkim 55.6 44.4 9 55.6 44.4 9 0.0 0.0 0
Tamil Nadu 39.8 60.2 284 39.3 60.7 56 39.9 60.1 228
Telangana 85.7 14.3 7 66.7 33.3 3 100.0 0.0 4
Tripura 0.0 100.0 9 0.0 0.0 0 0.0 100.0 9
Uttar Pradesh 74.3 25.7 70 71.4 28.6 7 74.6 25.4 63
Uttarakhand 20.0 80.0 5 20.0 80.0 5 0.0 0.0 0
West Bengal 67.5 32.5 77 65.1 34.9 63 78.6 21.4 14
All surveyed Public Toilet
PT:4. Water available for toilet use
States Total ODF NON ODF
Yes No Total Yes No Total Yes No Total
% % N % % N % % N
Total 94.4 5.6 981 99.8 .2 583 86.4 13.6 398
A & N Islands 100.0 0.0 15 100.0 0.0 15 0.0 0.0 0
Andhra Pradesh 100.0 0.0 26 100.0 0.0 25 100.0 0.0 1
Arunachal Pradesh 83.3 16.7 6 100.0 0.0 2 75.0 25.0 4
Assam 77.8 22.2 18 100.0 0.0 2 75.0 25.0 16
Bihar 55.6 44.4 18 100.0 0.0 2 50.0 50.0 16
Chhattisgarh 100.0 0.0 13 100.0 0.0 13 0.0 0.0 0
Dadra &Nagar Haveli 0.0 0.0 0 0.0 0.0 0 0.0 0.0 0
Goa 100.0 0.0 7 0.0 0.0 0 100.0 0.0 7

Interim Report National Annual Rural Sanitation Survey (NARSS), Round-2, 2018-2019
ANNEXURE - III: TABLES PAGE 238
States Total ODF NON ODF
Yes No Total Yes No Total Yes No Total
% % N % % N % % N
Gujarat 100.0 0.0 25 100.0 0.0 25 0.0 0.0 0
Haryana 100.0 0.0 19 100.0 0.0 19 0.0 0.0 0
Himachal Pradesh 100.0 0.0 4 100.0 0.0 4 0.0 0.0 0
Jammu & Kashmir 100.0 0.0 2 100.0 0.0 2 0.0 0.0 0
Jharkhand 100.0 0.0 5 100.0 0.0 3 100.0 0.0 2
Karnataka 90.0 10.0 30 100.0 0.0 22 62.5 37.5 8
Kerala 100.0 0.0 75 100.0 0.0 75 0.0 0.0 0
Madhya Pradesh 77.3 22.7 22 100.0 0.0 11 54.5 45.5 11
Maharashtra 99.3 .7 137 100.0 0.0 124 92.3 7.7 13
Manipur 100.0 0.0 21 100.0 0.0 10 100.0 0.0 11
Meghalaya 100.0 0.0 8 100.0 0.0 6 100.0 0.0 2
Mizoram 97.0 3.0 33 100.0 0.0 21 91.7 8.3 12
Nagaland 91.4 8.6 35 100.0 0.0 21 78.6 21.4 14
Odisha 87.5 12.5 8 100.0 0.0 1 85.7 14.3 7
Puducherry 80.0 20.0 5 0.0 0.0 0 80.0 20.0 5
Punjab 0.0 0.0 0 0.0 0.0 0 0.0 0.0 0
Rajasthan 100.0 0.0 45 100.0 0.0 37 100.0 0.0 8
Sikkim 100.0 0.0 9 100.0 0.0 9 0.0 0.0 0
Tamil Nadu 92.2 7.8 243 98.2 1.8 56 90.4 9.6 187
Telangana 85.7 14.3 7 100.0 0.0 3 75.0 25.0 4
Tripura 75.0 25.0 4 0.0 0.0 0 75.0 25.0 4
Uttar Pradesh 90.6 9.4 64 100.0 0.0 7 89.5 10.5 57
Uttarakhand 100.0 0.0 5 100.0 0.0 5 0.0 0.0 0
West Bengal 100.0 0.0 72 100.0 0.0 63 100.0 0.0 9
All surveyed Public Toilet
PT:5. Distribution of public toilets by evidence of handwashing practices
Evidence of hand washing India ODF NON ODF
Base 981 583 398
Soap or water available near the toilet 95.7 99.8 89.7
Nether soap nor water available near the toilet 4.3 0.2 10.3
PT:6. Distribution of toilet by functionality status

Interim Report National Annual Rural Sanitation Survey (NARSS), Round-2, 2018-2019
ANNEXURE - III: TABLES PAGE 239
States Total ODF NON ODF
Functional toilet
Nonfunctional toilet
Total Functional toilet
Nonfunctional toilet
Total Functional toilet
Nonfunctional toilet
Total
% % N % % N % % N
Total 99.0 1.0 981 100.0 0.0 583 97.5 2.5 398
A & N Islands 100.0 0.0 15 100.0 0.0 15 0.0 0.0 0
Andhra Pradesh 100.0 0.0 26 100.0 0.0 25 100.0 0.0 1
Arunachal Pradesh 100.0 0.0 6 100.0 0.0 2 100.0 0.0 4
Assam 94.4 5.6 18 100.0 0.0 2 93.8 6.3 16
Bihar 94.4 5.6 18 100.0 0.0 2 93.8 6.3 16
Chhattisgarh 100.0 0.0 13 100.0 0.0 13 0.0 0.0 0
Dadra &Nagar Haveli 0.0 0.0 0 0.0 0.0 0 0.0 0.0 0
Goa 100.0 0.0 7 0.0 0.0 0 100.0 0.0 7
Gujarat 100.0 0.0 25 100.0 0.0 25 0.0 0.0 0
Haryana 100.0 0.0 19 100.0 0.0 19 0.0 0.0 0
Himachal Pradesh 100.0 0.0 4 100.0 0.0 4 0.0 0.0 0
Jammu & Kashmir 100.0 0.0 2 100.0 0.0 2 0.0 0.0 0
Jharkhand 100.0 0.0 5 100.0 0.0 3 100.0 0.0 2
Karnataka 93.3 6.7 30 100.0 0.0 22 75.0 25.0 8
Kerala 100.0 0.0 75 100.0 0.0 75 0.0 0.0 0
Madhya Pradesh 95.5 4.5 22 100.0 0.0 11 90.9 9.1 11
Maharashtra 98.5 1.5 137 100.0 0.0 124 84.6 15.4 13
Manipur 100.0 0.0 21 100.0 0.0 10 100.0 0.0 11
Meghalaya 100.0 0.0 8 100.0 0.0 6 100.0 0.0 2
Mizoram 100.0 0.0 33 100.0 0.0 21 100.0 0.0 12
Nagaland 97.1 2.9 35 100.0 0.0 21 92.9 7.1 14
Odisha 100.0 0.0 8 100.0 0.0 1 100.0 0.0 7
Puducherry 100.0 0.0 5 0.0 0.0 0 100.0 0.0 5
Punjab 0.0 0.0 0 0.0 0.0 0 0.0 0.0 0
Rajasthan 100.0 0.0 45 100.0 0.0 37 100.0 0.0 8
Sikkim 100.0 0.0 9 100.0 0.0 9 0.0 0.0 0
Tamil Nadu 100.0 0.0 243 100.0 0.0 56 100.0 0.0 187
Telangana 100.0 0.0 7 100.0 0.0 3 100.0 0.0 4
Tripura 100.0 0.0 4 0.0 0.0 0 100.0 0.0 4
Uttar Pradesh 98.4 1.6 64 100.0 0.0 7 98.2 1.8 57
Uttarakhand 100.0 0.0 5 100.0 0.0 5 0.0 0.0 0
West Bengal 98.6 1.4 72 100.0 0.0 63 88.9 11.1 9

Interim Report National Annual Rural Sanitation Survey (NARSS), Round-2, 2018-2019
ANNEXURE - III: TABLES PAGE 240
PT:7. Percentage distribution of toilet by usage status
States Total ODF NON ODF
Yes No Total Yes No Total Yes No Total
% % N % % N % % N
Total 94.0 6.0 981 99.7 .3 583 85.7 14.3 398
A & N Islands 100.0 0.0 15 100.0 0.0 15 0.0 0.0 0
Andhra Pradesh 100.0 0.0 26 100.0 0.0 25 100.0 0.0 1
Arunachal Pradesh 66.7 33.3 6 100.0 0.0 2 50.0 50.0 4
Assam 77.8 22.2 18 100.0 0.0 2 75.0 25.0 16
Bihar 55.6 44.4 18 100.0 0.0 2 50.0 50.0 16
Chhattisgarh 100.0 0.0 13 100.0 0.0 13 0.0 0.0 0
Dadra &Nagar Haveli 0.0 0.0 0 0.0 0.0 0 0.0 0.0 0
Goa 100.0 0.0 7 0.0 0.0 0 100.0 0.0 7
Gujarat 100.0 0.0 25 100.0 0.0 25 0.0 0.0 0
Haryana 100.0 0.0 19 100.0 0.0 19 0.0 0.0 0
Himachal Pradesh 100.0 0.0 4 100.0 0.0 4 0.0 0.0 0
Jammu & Kashmir 100.0 0.0 2 100.0 0.0 2 0.0 0.0 0
Jharkhand 80.0 20.0 5 100.0 0.0 3 50.0 50.0 2
Karnataka 83.3 16.7 30 100.0 0.0 22 37.5 62.5 8
Kerala 100.0 0.0 75 100.0 0.0 75 0.0 0.0 0
Madhya Pradesh 77.3 22.7 22 100.0 0.0 11 54.5 45.5 11
Maharashtra 99.3 .7 137 100.0 0.0 124 92.3 7.7 13
Manipur 95.2 4.8 21 100.0 0.0 10 90.9 9.1 11
Meghalaya 100.0 0.0 8 100.0 0.0 6 100.0 0.0 2
Mizoram 100.0 0.0 33 100.0 0.0 21 100.0 0.0 12
Nagaland 91.4 8.6 35 95.2 4.8 21 85.7 14.3 14
Odisha 75.0 25.0 8 100.0 0.0 1 71.4 28.6 7
Puducherry 80.0 20.0 5 0.0 0.0 0 80.0 20.0 5
Punjab 0.0 0.0 0 0.0 0.0 0 0.0 0.0 0
Rajasthan 97.8 2.2 45 100.0 0.0 37 87.5 12.5 8
Sikkim 100.0 0.0 9 100.0 0.0 9 0.0 0.0 0
Tamil Nadu 91.8 8.2 243 98.2 1.8 56 89.8 10.2 187
Telangana 85.7 14.3 7 100.0 0.0 3 75.0 25.0 4
Tripura 75.0 25.0 4 0.0 0.0 0 75.0 25.0 4
Uttar Pradesh 95.3 4.7 64 100.0 0.0 7 94.7 5.3 57
Uttarakhand 100.0 0.0 5 100.0 0.0 5 0.0 0.0 0

Interim Report National Annual Rural Sanitation Survey (NARSS), Round-2, 2018-2019
ANNEXURE - III: TABLES PAGE 241
States Total ODF NON ODF
Yes No Total Yes No Total Yes No Total
% % N % % N % % N
West Bengal 100.0 0.0 72 100.0 0.0 63 100.0 0.0 9
All surveyed Public Toilet

Interim Report National Annual Rural Sanitation Survey (NARSS), Round-2, 2018-2019
ANNEXURE - III: TABLES PAGE 242
PT:8. Distribution of public toilets by user fee charges User Fee Total ODF NON ODF
Base 1091 585 506
Yes 14.7 19.5 9.1
No 85.3 80.5 90.9
PT:9. Percentage distribution of toilets by method of disposal of excreta
States Total ODF NON ODF
Unsafe Safe Total Unsafe Safe Total Unsafe Safe Total
% % N % % N % % N
Total .8 99.2 981 0.0 100.0 583 2.0 98.0 398
A & N Islands 0.0 100.0 15 0.0 100.0 15 0.0 0.0 0
Andhra Pradesh 0.0 100.0 26 0.0 100.0 25 0.0 100.0 1
Arunachal Pradesh 0.0 100.0 6 0.0 100.0 2 0.0 100.0 4
Assam 5.6 94.4 18 0.0 100.0 2 6.3 93.8 16
Bihar 5.6 94.4 18 0.0 100.0 2 6.3 93.8 16
Chhattisgarh 0.0 100.0 13 0.0 100.0 13 0.0 0.0 0
Dadra &Nagar Haveli 0.0 0.0 0 0.0 0.0 0 0.0 0.0 0
Goa 0.0 100.0 7 0.0 0.0 0 0.0 100.0 7
Gujarat 0.0 100.0 25 0.0 100.0 25 0.0 0.0 0
Haryana 0.0 100.0 19 0.0 100.0 19 0.0 0.0 0
Himachal Pradesh 0.0 100.0 4 0.0 100.0 4 0.0 0.0 0
Jammu & Kashmir 0.0 100.0 2 0.0 100.0 2 0.0 0.0 0
Jharkhand 0.0 100.0 5 0.0 100.0 3 0.0 100.0 2
Karnataka 0.0 100.0 30 0.0 100.0 22 0.0 100.0 8
Kerala 0.0 100.0 75 0.0 100.0 75 0.0 0.0 0
Madhya Pradesh 4.5 95.5 22 0.0 100.0 11 9.1 90.9 11
Maharashtra 1.5 98.5 137 0.0 100.0 124 15.4 84.6 13
Manipur 0.0 100.0 21 0.0 100.0 10 0.0 100.0 11
Meghalaya 0.0 100.0 8 0.0 100.0 6 0.0 100.0 2
Mizoram 0.0 100.0 33 0.0 100.0 21 0.0 100.0 12
Nagaland 2.9 97.1 35 0.0 100.0 21 7.1 92.9 14
Odisha 0.0 100.0 8 0.0 100.0 1 0.0 100.0 7
Puducherry 0.0 100.0 5 0.0 0.0 0 0.0 100.0 5
Punjab 0.0 0.0 0 0.0 0.0 0 0.0 0.0 0
Rajasthan 0.0 100.0 45 0.0 100.0 37 0.0 100.0 8

Interim Report National Annual Rural Sanitation Survey (NARSS), Round-2, 2018-2019
ANNEXURE - III: TABLES PAGE 243
States Total ODF NON ODF
Unsafe Safe Total Unsafe Safe Total Unsafe Safe Total
% % N % % N % % N
Sikkim 0.0 100.0 9 0.0 100.0 9 0.0 0.0 0
Tamil Nadu 0.0 100.0 243 0.0 100.0 56 0.0 100.0 187
Telangana 0.0 100.0 7 0.0 100.0 3 0.0 100.0 4
Tripura 0.0 100.0 4 0.0 0.0 0 0.0 100.0 4
Uttar Pradesh 1.6 98.4 64 0.0 100.0 7 1.8 98.2 57
Uttarakhand 0.0 100.0 5 0.0 100.0 5 0.0 0.0 0
West Bengal 1.4 98.6 72 0.0 100.0 63 11.1 88.9 9
All
ANNEXURE TABLES V - PUBLIC SPACES (PSS) PSS:1. Area that are/were used for open defecation in the past
States Total ODF Non ODF
Visible faeces Found
Faeces not found
Base Visible faeces Found
Faeces not found
Base Visible faeces Found
Faeces not found
Base
% % N % % N % % N
Total 7.4 92.6 6136 1.0 99.0 2891 13.0 87.0 3245
A & N Islands 0.0 100.0 26 0.0 100.0 26 0.0 0.0 0
Andhra Pradesh 11.8 88.2 271 2.2 97.8 182 31.5 68.5 89
Arunachal Pradesh 0.0 100.0 52 0.0 100.0 26 0.0 100.0 26
Assam 0.0 100.0 189 0.0 100.0 42 0.0 100.0 147
Bihar 26.3 73.7 566 12.9 87.1 31 27.1 72.9 535
Chhattisgarh 0.0 100.0 184 0.0 100.0 184 0.0 0.0 0
Dadra &Nagar Haveli 0.0 100.0 26 0.0 100.0 26 0.0 0.0 0
Goa 26.9 73.1 26 0.0 0.0 0 26.9 73.1 26
Gujarat 0.5 99.5 194 0.5 99.5 194 0.0 0.0 0
Haryana 1.0 99.0 102 1.0 99.0 102 0.0 0.0 0
Himachal Pradesh 0.0 100.0 55 0.0 100.0 55 0.0 0.0 0
Jammu & Kashmir 2.5 97.5 79 3.8 96.2 26 1.9 98.1 53
Jharkhand 0.7 99.3 152 2.5 97.5 40 0.0 100.0 112
Karnataka 17.9 82.1 268 1.2 98.8 173 48.4 51.6 95
Kerala 0.0 100.0 178 0.0 100.0 178 0.0 0.0 0
Madhya Pradesh 15.4 84.6 324 1.0 99.0 102 22.1 77.9 222

Interim Report National Annual Rural Sanitation Survey (NARSS), Round-2, 2018-2019
ANNEXURE - III: TABLES PAGE 244
States Total ODF Non ODF
Visible faeces Found
Faeces not found
Base Visible faeces Found
Faeces not found
Base Visible faeces Found
Faeces not found
Base
% % N % % N % % N
Maharashtra 0.7 99.3 421 1.0 99.0 301 0.0 100.0 120
Manipur 0.0 100.0 52 0.0 100.0 26 0.0 100.0 26
Meghalaya 0.0 100.0 52 0.0 100.0 26 0.0 100.0 26
Mizoram 0.0 100.0 52 0.0 100.0 26 0.0 100.0 26
Nagaland 0.0 100.0 52 0.0 100.0 26 0.0 100.0 26
Odisha 39.9 60.1 283 3.1 96.9 32 44.6 55.4 251
Puducherry 15.4 84.6 26 0.0 0.0 0 15.4 84.6 26
Punjab 0.9 99.1 109 1.7 98.3 60 0.0 100.0 49
Rajasthan 0.5 99.5 396 0.7 99.3 302 0.0 100.0 94
Sikkim 0.0 100.0 26 0.0 100.0 26 0.0 0.0 0
Tamil Nadu 0.9 99.1 332 4.6 95.4 65 0.0 100.0 267
Telangana 8.5 91.5 165 1.5 98.5 68 13.4 86.6 97
Tripura 0.0 100.0 26 0.0 0.0 0 0.0 100.0 26
Uttar Pradesh 0.0 100.0 888 0.0 100.0 133 0.0 100.0 755
Uttarakhand 0.0 100.0 58 0.0 100.0 58 0.0 0.0 0
West Bengal 4.2 95.8 506 1.1 98.9 355 11.3 88.7 151
All surveyed Public Space Sanitation
PSS:2. Villages following safe SLWM with ODF public places- minimal littering & water logging
States Total ODF NON ODF
Yes No Total Yes No Total Yes No Total
% % N % % N % % N
Total 63 37 6136 88.9 11.1 2891 40 60 3245
A & N Islands 96.2 3.8 26 96.2 3.8 26 0 0 0
Andhra Pradesh 62.4 37.6 271 83.5 16.5 182 19.1 80.9 89
Arunachal Pradesh 46.2 53.8 52 92.3 7.7 26 0 100 26
Assam 16.9 83.1 189 61.9 38.1 42 4.1 95.9 147
Bihar 17 83 566 41.9 58.1 31 15.5 84.5 535
Chhattisgarh 89.1 10.9 184 89.1 10.9 184 0 0 0
Dadra And Nagar Haveli 100 0 26 100 0 26 0 0 0
Goa 34.6 65.4 26 0 0 0 34.6 65.4 26
Gujarat 91.8 8.2 194 91.8 8.2 194 0 0 0
Haryana 97.1 2.9 102 97.1 2.9 102 0 0 0

Interim Report National Annual Rural Sanitation Survey (NARSS), Round-2, 2018-2019
ANNEXURE - III: TABLES PAGE 245
States Total ODF NON ODF
Yes No Total Yes No Total Yes No Total
% % N % % N % % N
Himachal Pradesh 89.1 10.9 55 89.1 10.9 55 0 0 0
Jammu & Kashmir 41.8 58.2 79 80.8 19.2 26 22.6 77.4 53
Jharkhand 40.8 59.2 152 75 25 40 28.6 71.4 112
Karnataka 67.5 32.5 268 95.4 4.6 173 16.8 83.2 95
Kerala 91 9 178 91 9 178 0 0 0
Madhya Pradesh 47.2 52.8 324 86.3 13.7 102 29.3 70.7 222
Maharashtra 80.3 19.7 421 93.4 6.6 301 47.5 52.5 120
Manipur 53.8 46.2 52 96.2 3.8 26 11.5 88.5 26
Meghalaya 55.8 44.2 52 92.3 7.7 26 19.2 80.8 26
Mizoram 96.2 3.8 52 96.2 3.8 26 96.2 3.8 26
Nagaland 65.4 34.6 52 96.2 3.8 26 34.6 65.4 26
Odisha 19.4 80.6 283 81.3 18.8 32 11.6 88.4 251
Puducherry 26.9 73.1 26 0 0 0 26.9 73.1 26
Punjab 58.7 41.3 109 83.3 16.7 60 28.6 71.4 49
Rajasthan 85.9 14.1 396 93.4 6.6 302 61.7 38.3 94
Sikkim 100 0 26 100 0 26 0 0 0
Tamil Nadu 71.4 28.6 332 90.8 9.2 65 66.7 33.3 267
Telangana 55.2 44.8 165 83.8 16.2 68 35.1 64.9 97
Tripura 19.2 80.8 26 0 0 0 19.2 80.8 26
Uttar Pradesh 84.1 15.9 888 94.7 5.3 133 82.3 17.7 755
Uttarakhand 94.8 5.2 58 94.8 5.2 58 0 0 0
West Bengal 59.3 40.7 506 81.1 18.9 355 7.9 92.1 151
All surveyed Public Space Sanitation
PSS:3. Open defecation instances at open ground
States
Total ODF NON ODF
Visible faeces Found
Faeces not found Total Visible faeces Found
Faeces not found Total Visible faeces Found
Faeces not found Total
% % N % % N % % N
Total 5.8 94.2 6136 1.1 98.9 2891 10.0 90.0 3245
A & N Islands 0.0 100.0 26 0.0 100.0 26 0.0 0.0 0
Andhra Pradesh 13.7 86.3 271 2.7 97.3 182 36.0 64.0 89
Arunachal Pradesh 0.0 100.0 52 0.0 100.0 26 0.0 100.0 26

Interim Report National Annual Rural Sanitation Survey (NARSS), Round-2, 2018-2019
ANNEXURE - III: TABLES PAGE 246
States
Total ODF NON ODF
Visible faeces Found
Faeces not found Total Visible faeces Found
Faeces not found Total Visible faeces Found
Faeces not found Total
% % N % % N % % N
Assam 0.0 100.0 189 0.0 100.0 42 0.0 100.0 147
Bihar 18.4 81.6 566 6.5 93.5 31 19.1 80.9 535
Chhattisgarh 0.0 100.0 184 0.0 100.0 184 0.0 0.0 0
Dadra &Nagar Haveli 0.0 100.0 26 0.0 100.0 26 0.0 0.0 0
Goa 26.9 73.1 26 0.0 0.0 0 26.9 73.1 26
Gujarat .5 99.5 194 .5 99.5 194 0.0 0.0 0
Haryana 1.0 99.0 102 1.0 99.0 102 0.0 0.0 0
Himachal Pradesh 0.0 100.0 55 0.0 100.0 55 0.0 0.0 0
Jammu & Kashmir 2.5 97.5 79 3.8 96.2 26 1.9 98.1 53
Jharkhand 1.3 98.7 152 5.0 95.0 40 0.0 100.0 112
Karnataka 10.8 89.2 268 .6 99.4 173 29.5 70.5 95
Kerala 0.0 100.0 178 0.0 100.0 178 0.0 0.0 0
Madhya Pradesh 10.8 89.2 324 1.0 99.0 102 15.3 84.7 222
Maharashtra .7 99.3 421 1.0 99.0 301 0.0 100.0 120
Manipur 0.0 100.0 52 0.0 100.0 26 0.0 100.0 26
Meghalaya 0.0 100.0 52 0.0 100.0 26 0.0 100.0 26
Mizoram 0.0 100.0 52 0.0 100.0 26 0.0 100.0 26
Nagaland 0.0 100.0 52 0.0 100.0 26 0.0 100.0 26
Odisha 35.3 64.7 283 0.0 100.0 32 39.8 60.2 251
Puducherry 11.5 88.5 26 0.0 0.0 0 11.5 88.5 26
Punjab 1.8 98.2 109 3.3 96.7 60 0.0 100.0 49
Rajasthan .8 99.2 396 1.0 99.0 302 0.0 100.0 94
Sikkim 0.0 100.0 26 0.0 100.0 26 0.0 0.0 0
Tamil Nadu .9 99.1 332 4.6 95.4 65 0.0 100.0 267
Telangana 7.9 92.1 165 1.5 98.5 68 12.4 87.6 97
Tripura 0.0 100.0 26 0.0 0.0 0 0.0 100.0 26
Uttar Pradesh 0.0 100.0 888 0.0 100.0 133 0.0 100.0 755
Uttarakhand 0.0 100.0 58 0.0 100.0 58 0.0 0.0 0
West Bengal 2.0 98.0 506 1.4 98.6 355 3.3 96.7 151
All surveyed Public Space Sanitation

Interim Report National Annual Rural Sanitation Survey (NARSS), Round-2, 2018-2019
ANNEXURE - III: TABLES PAGE 247
PSS:4. Open defecation instances in roads alongside the village
States
Total ODF NON ODF
Visible faeces Found
Faeces not found Total Visible faeces Found
Faeces not found Total Visible faeces Found
Faeces not found Total
% % N % % N % % N
Total 5.5 94.5 6136 .6 99.4 2891 9.8 90.2 3245
A & N Islands 0.0 100.0 26 0.0 100.0 26 0.0 0.0 0
Andhra Pradesh 12.2 87.8 271 2.2 97.8 182 32.6 67.4 89
Arunachal Pradesh 0.0 100.0 52 0.0 100.0 26 0.0 100.0 26
Assam 0.0 100.0 189 0.0 100.0 42 0.0 100.0 147
Bihar 17.5 82.5 566 6.5 93.5 31 18.1 81.9 535
Chhattisgarh 0.0 100.0 184 0.0 100.0 184 0.0 0.0 0
Dadra &Nagar Haveli 0.0 100.0 26 0.0 100.0 26 0.0 0.0 0
Goa 15.4 84.6 26 0.0 0.0 0 15.4 84.6 26
Gujarat 0.0 100.0 194 0.0 100.0 194 0.0 0.0 0
Haryana 0.0 100.0 102 0.0 100.0 102 0.0 0.0 0
Himachal Pradesh 0.0 100.0 55 0.0 100.0 55 0.0 0.0 0
Jammu & Kashmir 1.3 98.7 79 3.8 96.2 26 0.0 100.0 53
Jharkhand .7 99.3 152 2.5 97.5 40 0.0 100.0 112
Karnataka 14.9 85.1 268 .6 99.4 173 41.1 58.9 95
Kerala 0.0 100.0 178 0.0 100.0 178 0.0 0.0 0
Madhya Pradesh 13.3 86.7 324 0.0 100.0 102 19.4 80.6 222
Maharashtra .7 99.3 421 1.0 99.0 301 0.0 100.0 120
Manipur 0.0 100.0 52 0.0 100.0 26 0.0 100.0 26
Meghalaya 0.0 100.0 52 0.0 100.0 26 0.0 100.0 26
Mizoram 0.0 100.0 52 0.0 100.0 26 0.0 100.0 26
Nagaland 0.0 100.0 52 0.0 100.0 26 0.0 100.0 26
Odisha 29.3 70.7 283 0.0 100.0 32 33.1 66.9 251
Puducherry 15.4 84.6 26 0.0 0.0 0 15.4 84.6 26
Punjab .9 99.1 109 1.7 98.3 60 0.0 100.0 49
Rajasthan .5 99.5 396 .7 99.3 302 0.0 100.0 94
Sikkim 0.0 100.0 26 0.0 100.0 26 0.0 0.0 0
Tamil Nadu .3 99.7 332 1.5 98.5 65 0.0 100.0 267
Telangana 9.1 90.9 165 1.5 98.5 68 14.4 85.6 97
Tripura 0.0 100.0 26 0.0 0.0 0 0.0 100.0 26

Interim Report National Annual Rural Sanitation Survey (NARSS), Round-2, 2018-2019
ANNEXURE - III: TABLES PAGE 248
States
Total ODF NON ODF
Visible faeces Found
Faeces not found Total Visible faeces Found
Faeces not found Total Visible faeces Found
Faeces not found Total
% % N % % N % % N
Uttar Pradesh 0.0 100.0 888 0.0 100.0 133 0.0 100.0 755
Uttarakhand 0.0 100.0 58 0.0 100.0 58 0.0 0.0 0
West Bengal 1.4 98.6 506 .3 99.7 355 4.0 96.0 151
All surveyed Public Space Sanitation
PSS:5. Open defecation instances at any infamous places
States
Total ODF NON ODF
Visible faeces Found
Faeces not found Total Visible faeces Found
Faeces not found Total Visible faeces Found
Faeces not found Total
% % N % % N % % N
Total 3.3 96.7 6136 .4 99.6 2891 5.9 94.1 3245
A & N Islands 0.0 100.0 26 0.0 100.0 26 0.0 0.0 0
Andhra Pradesh 7.4 92.6 271 2.7 97.3 182 16.9 83.1 89
Arunachal Pradesh 0.0 100.0 52 0.0 100.0 26 0.0 100.0 26
Assam 0.0 100.0 189 0.0 100.0 42 0.0 100.0 147
Bihar 13.1 86.9 566 3.2 96.8 31 13.6 86.4 535
Chhattisgarh 0.0 100.0 184 0.0 100.0 184 0.0 0.0 0
Dadra &Nagar Haveli 0.0 100.0 26 0.0 100.0 26 0.0 0.0 0
Goa 3.8 96.2 26 0.0 0.0 0 3.8 96.2 26
Gujarat 0.0 100.0 194 0.0 100.0 194 0.0 0.0 0
Haryana 0.0 100.0 102 0.0 100.0 102 0.0 0.0 0
Himachal Pradesh 0.0 100.0 55 0.0 100.0 55 0.0 0.0 0
Jammu & Kashmir 1.3 98.7 79 3.8 96.2 26 0.0 100.0 53
Jharkhand 0.0 100.0 152 0.0 100.0 40 0.0 100.0 112
Karnataka 4.5 95.5 268 .6 99.4 173 11.6 88.4 95
Kerala 0.0 100.0 178 0.0 100.0 178 0.0 0.0 0
Madhya Pradesh 7.7 92.3 324 0.0 100.0 102 11.3 88.7 222
Maharashtra .5 99.5 421 .7 99.3 301 0.0 100.0 120
Manipur 0.0 100.0 52 0.0 100.0 26 0.0 100.0 26
Meghalaya 0.0 100.0 52 0.0 100.0 26 0.0 100.0 26
Mizoram 0.0 100.0 52 0.0 100.0 26 0.0 100.0 26

Interim Report National Annual Rural Sanitation Survey (NARSS), Round-2, 2018-2019
ANNEXURE - III: TABLES PAGE 249
States
Total ODF NON ODF
Visible faeces Found
Faeces not found Total Visible faeces Found
Faeces not found Total Visible faeces Found
Faeces not found Total
% % N % % N % % N
Nagaland 0.0 100.0 52 0.0 100.0 26 0.0 100.0 26
Odisha 17.7 82.3 283 0.0 100.0 32 19.9 80.1 251
Puducherry 7.7 92.3 26 0.0 0.0 0 7.7 92.3 26
Punjab 0.0 100.0 109 0.0 100.0 60 0.0 100.0 49
Rajasthan .3 99.7 396 .3 99.7 302 0.0 100.0 94
Sikkim 0.0 100.0 26 0.0 100.0 26 0.0 0.0 0
Tamil Nadu 0.0 100.0 332 0.0 100.0 65 0.0 100.0 267
Telangana 5.5 94.5 165 0.0 100.0 68 9.3 90.7 97
Tripura 0.0 100.0 26 0.0 0.0 0 0.0 100.0 26
Uttar Pradesh 0.0 100.0 888 0.0 100.0 133 0.0 100.0 755
Uttarakhand 0.0 100.0 58 0.0 100.0 58 0.0 0.0 0
West Bengal 1.4 98.6 506 .6 99.4 355 3.3 96.7 151
All surveyed Public Space Sanitation
PSS:6. Village performing safe disposal of Solid waste (Descriptive)

Interim Report National Annual Rural Sanitation Survey (NARSS), Round-2, 2018-2019
ANNEXURE - III: TABLES PAGE 250
States
Total ODF NON ODF
No
tre
atm
en
t o
f so
lid w
aste
Op
en
bu
rnin
g
Du
mp
ed
in r
ive
r/ w
ate
r b
od
ies
Co
mm
un
ity
leve
l co
mp
ost
ing
arra
nge
me
nt
(NA
DEP
/Ve
rmic
om
po
st
Co
mm
un
ity
leve
l was
te c
olle
ctio
n
arra
nge
me
nts
Segr
ega
ted
was
te c
olle
cte
d, a
nd
safe
ly m
anag
ed
Tota
l
No
tre
atm
en
t o
f so
lid w
aste
Op
en
bu
rnin
g
Du
mp
ed
in r
ive
r/ w
ate
r b
od
ies
Co
mm
un
ity
leve
l co
mp
ost
ing
arra
nge
me
nt
(NA
DEP
/Ve
rmic
om
po
st
Co
mm
un
ity
leve
l was
te c
olle
ctio
n
arra
nge
me
nts
Segr
ega
ted
was
te c
olle
cte
d, a
nd
safe
ly m
anag
ed
Tota
l
No
tre
atm
en
t o
f so
lid w
aste
Op
en
bu
rnin
g
Du
mp
ed
in r
ive
r/ w
ate
r b
od
ies
Co
mm
un
ity
leve
l co
mp
ost
ing
arra
nge
me
nt
(NA
DEP
/Ve
rmic
om
po
st
Co
mm
un
ity
leve
l was
te c
olle
ctio
n
arra
nge
me
nts
Segr
ega
ted
was
te c
olle
cte
d, a
nd
safe
ly m
anag
ed
Tota
l
% % % % % % N % % % % % % N % % % % % % N
Total 8.1 18.2 2.5 11.1 31.8 28.3 6136 0.6 3.9 0.4 12.7 51.9 30.4 2891 14.7 30.9 4.4 9.7 13.8 26.5 3245
A & N Islands 0 3.8 0 34.6 57.7 3.8 26 0 3.8 0 34.6 57.7 3.8 26 0 0 0 0 0 0 0
Andhra Pradesh 0 15.9 6.6 28.4 14 35.1 271 0 2.7 0.5 40.1 14.3 42.3 182 0 42.7 19.1 4.5 13.5 20.2 89
Arunachal Pradesh 0 50 1.9 38.5 9.6 0 52 0 3.8 0 76.9 19.2 0 26 0 96.2 3.8 0 0 0 26
Assam 0 71.4 7.4 0.5 15.9 4.8 189 0 26.2 0 0 69 4.8 42 0 84.4 9.5 0.7 0.7 4.8 147
Bihar 42.4 23.3 4.9 6.5 3.4 19.4 566 6.5 12.9 9.7 9.7 25.8 35.5 31 44.5 23.9 4.7 6.4 2.1 18.5 535
Chhattisgarh 1.1 0 0 10.3 50 38.6 184 1.1 0 0 10.3 50 38.6 184 0 0 0 0 0 0 0
Dadra &Nagar Haveli 0 0 0 7.7 88.5 3.8 26 0 0 0 7.7 88.5 3.8 26 0 0 0 0 0 0 0
Goa 0 23.1 0 3.8 61.5 11.5 26 0 0 0 0 0 0 0 0 23.1 0 3.8 61.5 11.5 26
Gujarat 0 1 1 11.9 47.9 38.1 194 0 1 1 11.9 47.9 38.1 194 0 0 0 0 0 0 0
Haryana 0 1 0 3.9 71.6 23.5 102 0 1 0 3.9 71.6 23.5 102 0 0 0 0 0 0 0
Himachal Pradesh 0 5.5 0 3.6 54.5 36.4 55 0 5.5 0 3.6 54.5 36.4 55 0 0 0 0 0 0 0
Jammu & Kashmir 1.3 48.1 5.1 1.3 34.2 10.1 79 0 19.2 0 0 69.2 11.5 26 1.9 62.3 7.5 1.9 17 9.4 53
Jharkhand 0 50.7 2 3.3 15.8 28.3 152 0 22.5 0 5 40 32.5 40 0 60.7 2.7 2.7 7.1 26.8 112
Karnataka 8.6 15.7 3.7 11.9 35.8 24.3 268 1.2 1.7 0 16.8 52 28.3 173 22.1 41.1 10.5 3.2 6.3 16.8 95
Kerala 0 1.1 0 13.5 63.5 21.9 178 0 1.1 0 13.5 63.5 21.9 178 0 0 0 0 0 0 0
Madhya Pradesh 18.5 18.2 1.5 4.6 27.5 29.6 324 2.9 2.9 0 6.9 55.9 31.4 102 25.7 25.2 2.3 3.6 14.4 28.8 222
Maharashtra 0 12.4 0.5 9 42.8 35.4 421 0 2 0.3 9 52.5 36.2 301 0 38.3 0.8 9.2 18.3 33.3 120
Manipur 0 42.3 0 7.7 50 0 52 0 3.8 0 7.7 88.5 0 26 0 80.8 0 7.7 11.5 0 26
Meghalaya 0 42.3 0 1.9 36.5 19.2 52 0 7.7 0 3.8 65.4 23.1 26 0 76.9 0 0 7.7 15.4 26
Mizoram 0 0 1.9 11.5 65.4 21.2 52 0 0 0 11.5 69.2 19.2 26 0 0 3.8 11.5 61.5 23.1 26
Nagaland 0 30.8 0 1.9 48.1 19.2 52 0 3.8 0 0 80.8 15.4 26 0 57.7 0 3.8 15.4 23.1 26

Interim Report National Annual Rural Sanitation Survey (NARSS), Round-2, 2018-2019
ANNEXURE - III: TABLES PAGE 251
States
Total ODF NON ODF
No
tre
atm
en
t o
f so
lid w
aste
Op
en
bu
rnin
g
Du
mp
ed
in r
ive
r/ w
ate
r b
od
ies
Co
mm
un
ity
leve
l co
mp
ost
ing
arra
nge
me
nt
(NA
DEP
/Ve
rmic
om
po
st
Co
mm
un
ity
leve
l was
te c
olle
ctio
n
arra
nge
me
nts
Segr
ega
ted
was
te c
olle
cte
d, a
nd
safe
ly m
anag
ed
Tota
l
No
tre
atm
en
t o
f so
lid w
aste
Op
en
bu
rnin
g
Du
mp
ed
in r
ive
r/ w
ate
r b
od
ies
Co
mm
un
ity
leve
l co
mp
ost
ing
arra
nge
me
nt
(NA
DEP
/Ve
rmic
om
po
st
Co
mm
un
ity
leve
l was
te c
olle
ctio
n
arra
nge
me
nts
Segr
ega
ted
was
te c
olle
cte
d, a
nd
safe
ly m
anag
ed
Tota
l
No
tre
atm
en
t o
f so
lid w
aste
Op
en
bu
rnin
g
Du
mp
ed
in r
ive
r/ w
ate
r b
od
ies
Co
mm
un
ity
leve
l co
mp
ost
ing
arra
nge
me
nt
(NA
DEP
/Ve
rmic
om
po
st
Co
mm
un
ity
leve
l was
te c
olle
ctio
n
arra
nge
me
nts
Segr
ega
ted
was
te c
olle
cte
d, a
nd
safe
ly m
anag
ed
Tota
l
% % % % % % N % % % % % % N % % % % % % N
Odisha 35.7 31.1 8.1 2.8 10.2 12 283 3.1 3.1 0 6.3 71.9 15.6 32 39.8 34.7 9.2 2.4 2.4 11.6 251
Puducherry 19.2 15.4 15.
4 7.7 7.7 34.6 26 0 0 0 0 0 0 0 19.2 15.4 15.4 7.7 7.7 34.6 26
Punjab 0 35.8 0.9 11 37.6 14.7 109 0 15 1.7 10 60 13.3 60 0 61.2 0 12.2 10.2 16.3 49
Rajasthan 0 10.6 0.3 4 35.9 49.2 396 0 4.6 0 4.6 41.4 49.3 302 0 29.8 1.1 2.1 18.1 48.9 94
Sikkim 0 0 0 11.5 34.6 53.8 26 0 0 0 11.5 34.6 53.8 26 0 0 0 0 0 0 0
Tamil Nadu 0 8.1 3 27.1 13.9 47.9 332 0 0 0 26.2 23.1 50.8 65 0 10.1 3.7 27.3 11.6 47.2 267
Telangana 0 21.2 3.6 14.5 46.1 14.5 165 0 5.9 1.5 13.2 67.6 11.8 68 0 32 5.2 15.5 30.9 16.5 97
Tripura 3.8 73.1 3.8 3.8 3.8 11.5 26 0 0 0 0 0 0 0 3.8 73.1 3.8 3.8 3.8 11.5 26
Uttar Pradesh 0 11.6 0.6 19.1 28.5 40.2 888 0 3.8 0 24.8 36.8 34.6 133 0 13 0.7 18.1 27 41.2 755
Uttarakhand 0 5.2 0 17.2 41.4 36.2 58 0 5.2 0 17.2 41.4 36.2 58 0 0 0 0 0 0 0
West Bengal 12.1 15 3 5.1 51.4 13.4 506 2.3 4.8 0.8 6.8 70.1 15.2 355 35.1 39.1 7.9 1.3 7.3 9.3 151
All surveyed Public Space Sanitation

Interim Report National Annual Rural Sanitation Survey (NARSS), Round-2, 2018-2019
ANNEXURE - III: TABLES PAGE 252
PSS:7. Village performing safe disposal of solid waste States Total ODF NON ODF
Safe Unsafe Total Safe Unsafe Total Safe Unsafe Total
% % N % % N % % N
Total 71.3 28.7 6136 95.1 4.9 2891 50.1 49.9 3245
A & N Islands 96.2 3.8 26 96.2 3.8 26 0.0 0.0 0
Andhra Pradesh 77.5 22.5 271 96.7 3.3 182 38.2 61.8 89
Arunachal Pradesh 48.1 51.9 52 96.2 3.8 26 0.0 100.0 26
Assam 21.2 78.8 189 73.8 26.2 42 6.1 93.9 147
Bihar 29.3 70.7 566 71.0 29.0 31 26.9 73.1 535
Chhattisgarh 98.9 1.1 184 98.9 1.1 184 0.0 0.0 0
Dadra &Nagar Haveli 100.0 0.0 26 100.0 0.0 26 0.0 0.0 0
Goa 76.9 23.1 26 0.0 0.0 0 76.9 23.1 26
Gujarat 97.9 2.1 194 97.9 2.1 194 0.0 0.0 0
Haryana 99.0 1.0 102 99.0 1.0 102 0.0 0.0 0
Himachal Pradesh 94.5 5.5 55 94.5 5.5 55 0.0 0.0 0
Jammu & Kashmir 45.6 54.4 79 80.8 19.2 26 28.3 71.7 53
Jharkhand 47.4 52.6 152 77.5 22.5 40 36.6 63.4 112
Karnataka 72.0 28.0 268 97.1 2.9 173 26.3 73.7 95
Kerala 98.9 1.1 178 98.9 1.1 178 0.0 0.0 0
Madhya Pradesh 61.7 38.3 324 94.1 5.9 102 46.8 53.2 222
Maharashtra 87.2 12.8 421 97.7 2.3 301 60.8 39.2 120
Manipur 57.7 42.3 52 96.2 3.8 26 19.2 80.8 26
Meghalaya 57.7 42.3 52 92.3 7.7 26 23.1 76.9 26
Mizoram 98.1 1.9 52 100.0 0.0 26 96.2 3.8 26
Nagaland 69.2 30.8 52 96.2 3.8 26 42.3 57.7 26
Odisha 25.1 74.9 283 93.8 6.3 32 16.3 83.7 251
Puducherry 50.0 50.0 26 0.0 0.0 0 50.0 50.0 26
Punjab 63.3 36.7 109 83.3 16.7 60 38.8 61.2 49
Rajasthan 89.1 10.9 396 95.4 4.6 302 69.1 30.9 94
Sikkim 100.0 0.0 26 100.0 0.0 26 0.0 0.0 0
Tamil Nadu 88.9 11.1 332 100.0 0.0 65 86.1 13.9 267
Telangana 75.2 24.8 165 92.6 7.4 68 62.9 37.1 97
Tripura 19.2 80.8 26 0.0 0.0 0 19.2 80.8 26
Uttar Pradesh 87.8 12.2 888 96.2 3.8 133 86.4 13.6 755
Uttarakhand 94.8 5.2 58 94.8 5.2 58 0.0 0.0 0
West Bengal 70.0 30.0 506 92.1 7.9 355 17.9 82.1 151

Interim Report National Annual Rural Sanitation Survey (NARSS), Round-2, 2018-2019
ANNEXURE - III: TABLES PAGE 253
States Total ODF NON ODF
Safe Unsafe Total Safe Unsafe Total Safe Unsafe Total
% % N % % N % % N
All surveyed Public Space Sanitation

Interim Report National Annual Rural Sanitation Survey (NARSS), Round-2, 2018-2019
ANNEXURE - III: TABLES PAGE 254
PSS:8. Village performing safe disposal of waste water States Total ODF NON ODF
Safe Unsafe Total Safe Unsafe Total Safe Unsafe Total
% % N % % N % % N
Total 80.9 19.1 6136 96.3 3.7 2891 67.3 32.7 3245
A & N Islands 96.2 3.8 26 96.2 3.8 26 0.0 0.0 0
Andhra Pradesh 85.6 14.4 271 95.6 4.4 182 65.2 34.8 89
Arunachal Pradesh 78.8 21.2 52 100.0 0.0 26 57.7 42.3 26
Assam 52.9 47.1 189 83.3 16.7 42 44.2 55.8 147
Bihar 51.9 48.1 566 54.8 45.2 31 51.8 48.2 535
Chhattisgarh 97.8 2.2 184 97.8 2.2 184 0.0 0.0 0
Dadra &Nagar Haveli 100.0 0.0 26 100.0 0.0 26 0.0 0.0 0
Goa 57.7 42.3 26 0.0 0.0 0 57.7 42.3 26
Gujarat 98.5 1.5 194 98.5 1.5 194 0.0 0.0 0
Haryana 99.0 1.0 102 99.0 1.0 102 0.0 0.0 0
Himachal Pradesh 96.4 3.6 55 96.4 3.6 55 0.0 0.0 0
Jammu & Kashmir 60.8 39.2 79 96.2 3.8 26 43.4 56.6 53
Jharkhand 61.8 38.2 152 87.5 12.5 40 52.7 47.3 112
Karnataka 78.0 22.0 268 97.1 2.9 173 43.2 56.8 95
Kerala 100.0 0.0 178 100.0 0.0 178 0.0 0.0 0
Madhya Pradesh 71.9 28.1 324 94.1 5.9 102 61.7 38.3 222
Maharashtra 92.4 7.6 421 99.0 1.0 301 75.8 24.2 120
Manipur 65.4 34.6 52 96.2 3.8 26 34.6 65.4 26
Meghalaya 92.3 7.7 52 100.0 0.0 26 84.6 15.4 26
Mizoram 98.1 1.9 52 96.2 3.8 26 100.0 0.0 26
Nagaland 88.5 11.5 52 100.0 0.0 26 76.9 23.1 26
Odisha 58.0 42.0 283 90.6 9.4 32 53.8 46.2 251
Puducherry 46.2 53.8 26 0.0 0.0 0 46.2 53.8 26
Punjab 80.7 19.3 109 95.0 5.0 60 63.3 36.7 49
Rajasthan 90.7 9.3 396 96.0 4.0 302 73.4 26.6 94
Sikkim 100.0 0.0 26 100.0 0.0 26 0.0 0.0 0
Tamil Nadu 85.5 14.5 332 96.9 3.1 65 82.8 17.2 267
Telangana 85.5 14.5 165 92.6 7.4 68 80.4 19.6 97
Tripura 92.3 7.7 26 0.0 0.0 0 92.3 7.7 26
Uttar Pradesh 93.4 6.6 888 96.2 3.8 133 92.8 7.2 755
Uttarakhand 100.0 0.0 58 100.0 0.0 58 0.0 0.0 0
West Bengal 77.9 22.1 506 95.5 4.5 355 36.4 63.6 151

Interim Report National Annual Rural Sanitation Survey (NARSS), Round-2, 2018-2019
ANNEXURE - III: TABLES PAGE 255
All surveyed Public Space Sanitation

Interim Report National Annual Rural Sanitation Survey (NARSS), Round-2, 2018-2019
ANNEXURE - III: TABLES PAGE 256
PSS:9. Public places show minimal level of littering
States
Total ODF NON ODF
Yes No Total Yes No Total Yes No Total
% % N % % N % % N
Total 96.5 3.5 6136 99.5 0.5 2891 93.8 6.2 3245
A & N Islands 100.0 0.0 26 100.0 0.0 26 0.0 0.0 0
Andhra Pradesh 89.7 10.3 271 97.3 2.7 182 74.2 25.8 89
Arunachal Pradesh 88.5 11.5 52 100.0 0.0 26 76.9 23.1 26
Assam 89.9 10.1 189 100.0 0.0 42 87.1 12.9 147
Bihar 89.9 10.1 566 96.8 3.2 31 89.5 10.5 535
Chhattisgarh 100.0 0.0 184 100.0 0.0 184 0.0 0.0 0
Dadra &Nagar Haveli 100.0 0.0 26 100.0 0.0 26 0.0 0.0 0
Goa 100.0 0.0 26 0.0 0.0 0 100.0 0.0 26
Gujarat 100.0 0.0 194 100.0 0.0 194 0.0 0.0 0
Haryana 100.0 0.0 102 100.0 0.0 102 0.0 0.0 0
Himachal Pradesh 100.0 0.0 55 100.0 0.0 55 0.0 0.0 0
Jammu & Kashmir 98.7 1.3 79 100.0 0.0 26 98.1 1.9 53
Jharkhand 96.7 3.3 152 100.0 0.0 40 95.5 4.5 112
Karnataka 95.9 4.1 268 99.4 0.6 173 89.5 10.5 95
Kerala 98.9 1.1 178 98.9 1.1 178 0.0 0.0 0
Madhya Pradesh 100.0 0.0 324 100.0 0.0 102 100.0 0.0 222
Maharashtra 100.0 0.0 421 100.0 0.0 301 100.0 0.0 120
Manipur 100.0 0.0 52 100.0 0.0 26 100.0 0.0 26
Meghalaya 100.0 0.0 52 100.0 0.0 26 100.0 0.0 26
Mizoram 100.0 0.0 52 100.0 0.0 26 100.0 0.0 26
Nagaland 100.0 0.0 52 100.0 0.0 26 100.0 0.0 26
Odisha 77.7 22.3 283 96.9 3.1 32 75.3 24.7 251
Puducherry 88.5 11.5 26 0.0 0.0 0 88.5 11.5 26
Punjab 100.0 0.0 109 100.0 0.0 60 100.0 0.0 49
Rajasthan 100.0 0.0 396 100.0 0.0 302 100.0 0.0 94
Sikkim 100.0 0.0 26 100.0 0.0 26 0.0 0.0 0
Tamil Nadu 100.0 0.0 332 100.0 0.0 65 100.0 0.0 267
Telangana 93.3 6.7 165 100.0 0.0 68 88.7 11.3 97
Tripura 96.2 3.8 26 0.0 0.0 0 96.2 3.8 26
Uttar Pradesh 100.0 0.0 888 100.0 0.0 133 100.0 0.0 755
Uttarakhand 100.0 0.0 58 100.0 0.0 58 0.0 0.0 0
West Bengal 98.4 1.6 506 98.6 1.4 355 98.0 2.0 151

Interim Report National Annual Rural Sanitation Survey (NARSS), Round-2, 2018-2019
ANNEXURE - III: TABLES PAGE 257
States
Total ODF NON ODF
Yes No Total Yes No Total Yes No Total
% % N % % N % % N
All surveyed Public Space Sanitation

Interim Report National Annual Rural Sanitation Survey (NARSS), Round-2, 2018-2019
ANNEXURE - III: TABLES PAGE 258
PSS:10. Public places show minimal level of water logging States Total ODF NON ODF
Yes No Total Yes No Total Yes No Total
% % N % % N % % N
Total 96.7 3.3 6136 99.7 0.3 2891 94.0 6.0 3245
A & N Islands 100.0 0.0 26 100.0 0.0 26 0.0 0.0 0
Andhra Pradesh 93.0 7.0 271 97.8 2.2 182 83.1 16.9 89
Arunachal Pradesh 94.2 5.8 52 100.0 0.0 26 88.5 11.5 26
Assam 99.5 0.5 189 100.0 0.0 42 99.3 0.7 147
Bihar 91.5 8.5 566 96.8 3.2 31 91.2 8.8 535
Chhattisgarh 100.0 0.0 184 100.0 0.0 184 0.0 0.0 0
Dadra &Nagar Haveli 100.0 0.0 26 100.0 0.0 26 0.0 0.0 0
Goa 100.0 0.0 26 0.0 0.0 0 100.0 0.0 26
Gujarat 100.0 0.0 194 100.0 0.0 194 0.0 0.0 0
Haryana 100.0 0.0 102 100.0 0.0 102 0.0 0.0 0
Himachal Pradesh 100.0 0.0 55 100.0 0.0 55 0.0 0.0 0
Jammu & Kashmir 98.7 1.3 79 100.0 0.0 26 98.1 1.9 53
Jharkhand 96.1 3.9 152 100.0 0.0 40 94.6 5.4 112
Karnataka 93.7 6.3 268 99.4 0.6 173 83.2 16.8 95
Kerala 98.9 1.1 178 98.9 1.1 178 0.0 0.0 0
Madhya Pradesh 100.0 0.0 324 100.0 0.0 102 100.0 0.0 222
Maharashtra 100.0 0.0 421 100.0 0.0 301 100.0 0.0 120
Manipur 100.0 0.0 52 100.0 0.0 26 100.0 0.0 26
Meghalaya 100.0 0.0 52 100.0 0.0 26 100.0 0.0 26
Mizoram 100.0 0.0 52 100.0 0.0 26 100.0 0.0 26
Nagaland 100.0 0.0 52 100.0 0.0 26 100.0 0.0 26
Odisha 70.3 29.7 283 96.9 3.1 32 66.9 33.1 251
Puducherry 84.6 15.4 26 0.0 0.0 0 84.6 15.4 26
Punjab 100.0 0.0 109 100.0 0.0 60 100.0 0.0 49
Rajasthan 100.0 0.0 396 100.0 0.0 302 100.0 0.0 94
Sikkim 100.0 0.0 26 100.0 0.0 26 0.0 0.0 0
Tamil Nadu 100.0 0.0 332 100.0 0.0 65 100.0 0.0 267
Telangana 91.5 8.5 165 100.0 0.0 68 85.6 14.4 97
Tripura 96.2 3.8 26 0.0 0.0 0 96.2 3.8 26
Uttar Pradesh 100.0 0.0 888 100.0 0.0 133 100.0 0.0 755
Uttarakhand 100.0 0.0 58 100.0 0.0 58 0.0 0.0 0
West Bengal 99.0 1.0 506 99.7 0.3 355 97.4 2.6 151

Interim Report National Annual Rural Sanitation Survey (NARSS), Round-2, 2018-2019
ANNEXURE - III: TABLES PAGE 259
States Total ODF NON ODF
Yes No Total Yes No Total Yes No Total
% % N % % N % % N
All surveyed Public Space Sanitation
*****************