n c e o national center on educational outcomes cultivating success in fertile soil raising...
Post on 19-Dec-2015
218 views
TRANSCRIPT
National Center on Educational Outcomes
N C
E O
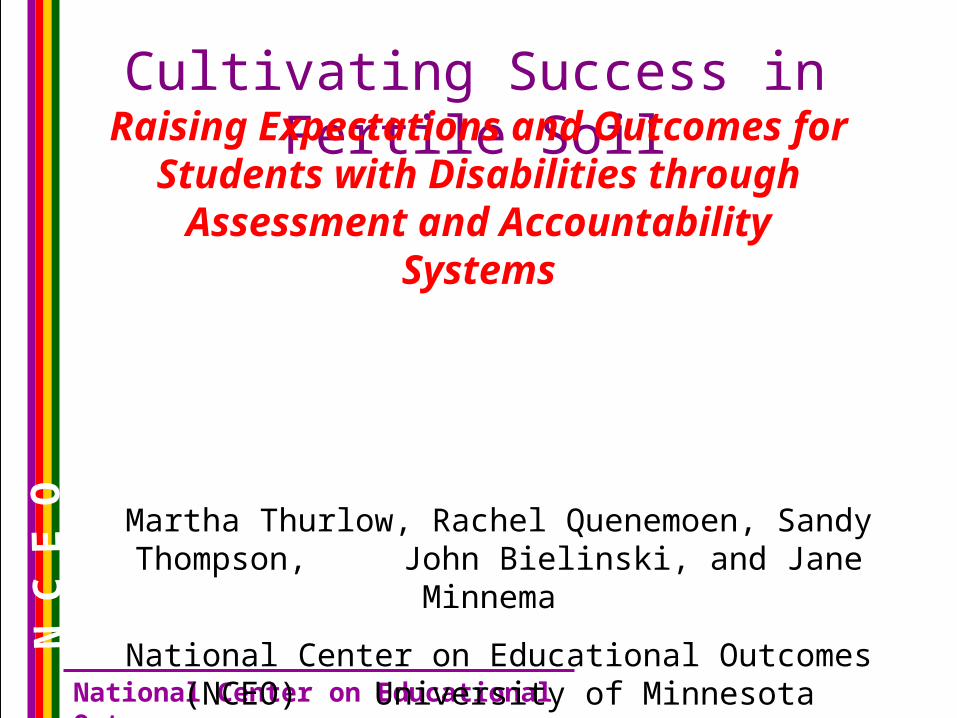
Cultivating Success in Fertile SoilRaising Expectations and Outcomes for
Students with Disabilities through Assessment and Accountability Systems
Martha Thurlow, Rachel Quenemoen, Sandy Thompson, John Bielinski, and Jane Minnema
National Center on Educational Outcomes (NCEO) University of Minnesota

National Center on Educational Outcomes
N C
E O
Clinic Agenda
Part I: Separate the Wheat from the Chaff
Part II: Plow New Ground
Part III: Apply the Best Fertilizers
Part IV: Harvest a Rich Return

N C
E O
National Center on Educational Outcomes
Visit: education.umn.edu/nceo
or Search for NCEO
National Center on Educational Outcomes
N C
E O
Part I. Separate the Wheat from the Chaff

National Center on Educational Outcomes
N C
E O
In 1989, the Education Summit set an agenda for education reform that called for –
Higher Expectations
Rigorous Educational Standards
Assessments of Progress toward Standards
NCEO was funded in 1990 to look at the educational outcomes of students with disabilities
National Center on Educational Outcomes
N C
E O
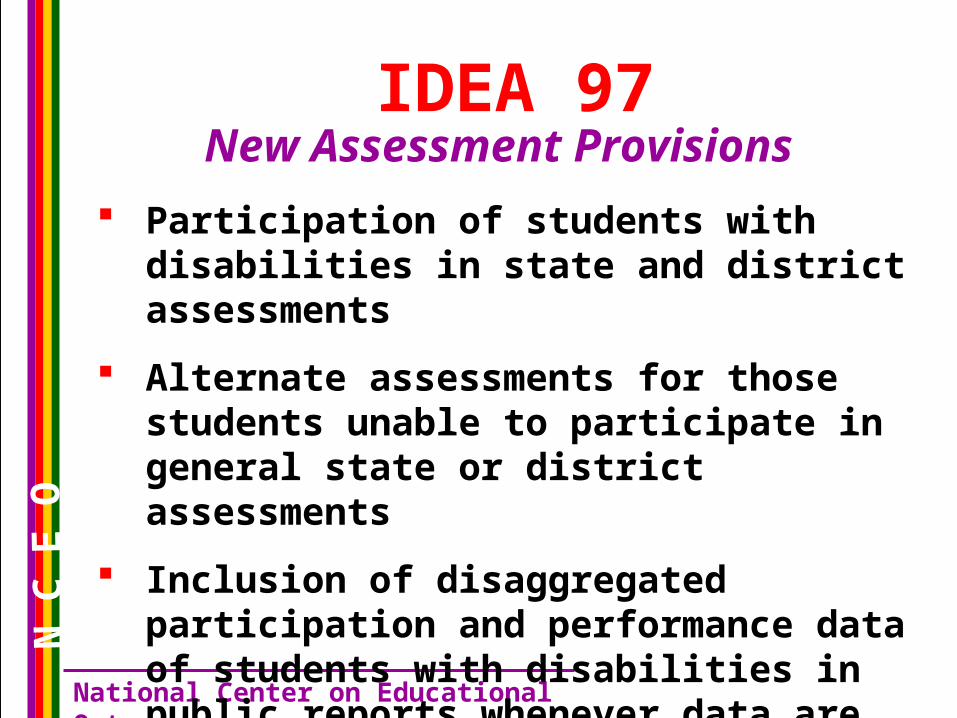
IDEA 97
Participation of students with disabilities in state and district assessments
Alternate assessments for those students unable to participate in general state or district assessments
Inclusion of disaggregated participation and performance data of students with disabilities in public reports whenever data are provided for all students
New Assessment Provisions

National Center on Educational Outcomes
N C
E O
Title I
All “eligible” students can receive Title I services, regardless of other services provided
Title I evaluation is based on statewide assessment, which is to include all students
States must report statewide data, with disaggregations for students with disabilities, LEP students, and other groups
States must define adequate yearly progress (AYP) and evaluate schools against AYP
Includes ALL Students

National Center on Educational Outcomes
N C
E O
Common Themes Include:
• Participation of ALL students in state and district assessments
• Reported information about the performance of special populations, relative to other students
• Measurement against consistent goals and standards for ALL students (to the maximum extent appropriate)

Standards-Based Reform Context
--- Everything else is negotiable ---
schedules, place, time, structure, curriculum, methods of assessment, instructional methods . . .

Accountability System Components
Goals (Content Standards)
Indicators of Success (Performance Standards)
Measures of Performance (Assessment System)
Reporting
Consequences

National Center on Educational Outcomes
N C
E O
Clarification of Assessments
Classroom TestsEligibility
Assessments
Large-Scale Assessments
Districtwide Statewide National

National Center on Educational Outcomes
N C
E O
VARYING Context of State Assessments
Some measure basics, others high standards
Some are high stakes for students, some high stakes for systems, some are both
Grades administered vary, as do content areas (all have Reading and Math)
Some are norm-referenced, some are criterion referenced, and some are both
Varying approaches to accommodations and alternate assessments

National Center on Educational Outcomes
N C
E O
Principles of Inclusive Assessment and Accountability Systems
• Principle 1. All students with disabilities are included in the assessment system.
• Principle 2. Decisions about how students with disabilities participate in the assessment system are the result of clearly articulated decision-making processes.
National Center on Educational Outcomes
N C
E O
Principles of Inclusive Assessment and Accountability Systems
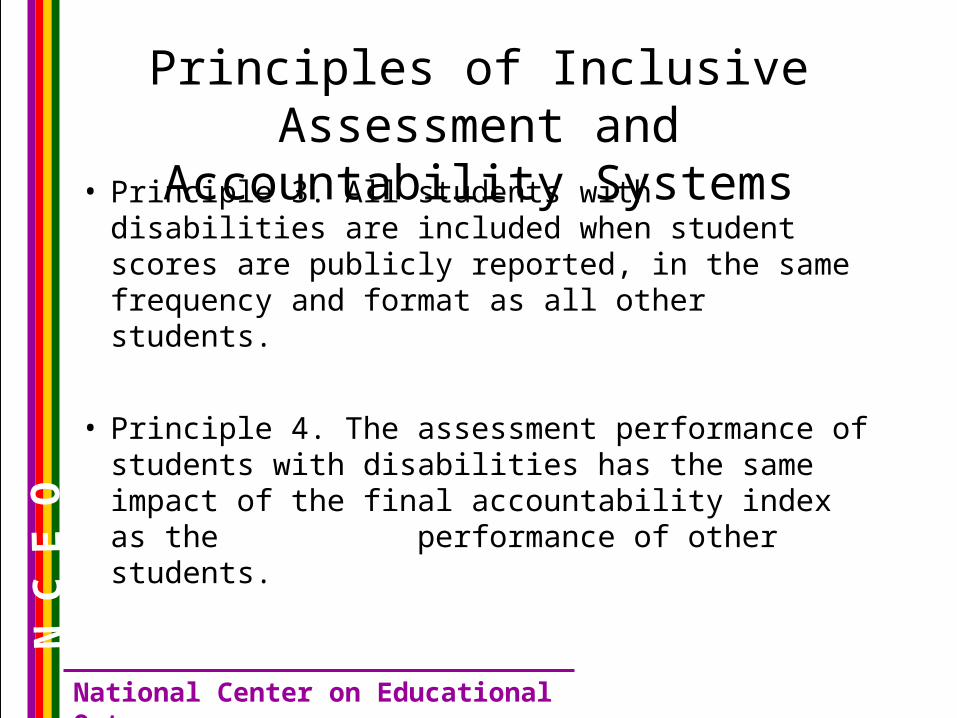
• Principle 3. All students with disabilities are included when student scores are publicly reported, in the same frequency and format as all other students.
• Principle 4. The assessment performance of students with disabilities has the same impact of the final accountability index as the performance of other students.

National Center on Educational Outcomes
N C
E O
Principles of Inclusive Assessment and Accountability Systems
• Principle 5. There is improvement of both the assessment system and the accountability system over time…
• Principle 6. Every policy and practice reflects the belief that all students must be included in state and district assessment and accountability systems.

National Center on Educational Outcomes
N C
E O
Part II. Plow New Ground

National Center on Educational Outcomes
N C
E O
High Stakes Testing
• Student Accountability – students are held responsible and consequences are assigned to them (e.g., must pass test to graduate or move to next grade) 20 States
• System Accountability – educators, schools, or districts are held responsible and consequences are assigned to them (e.g., schools rated according to test scores, teachers receive rewards for student performance) 38 States

National Center on Educational Outcomes
N C
E O
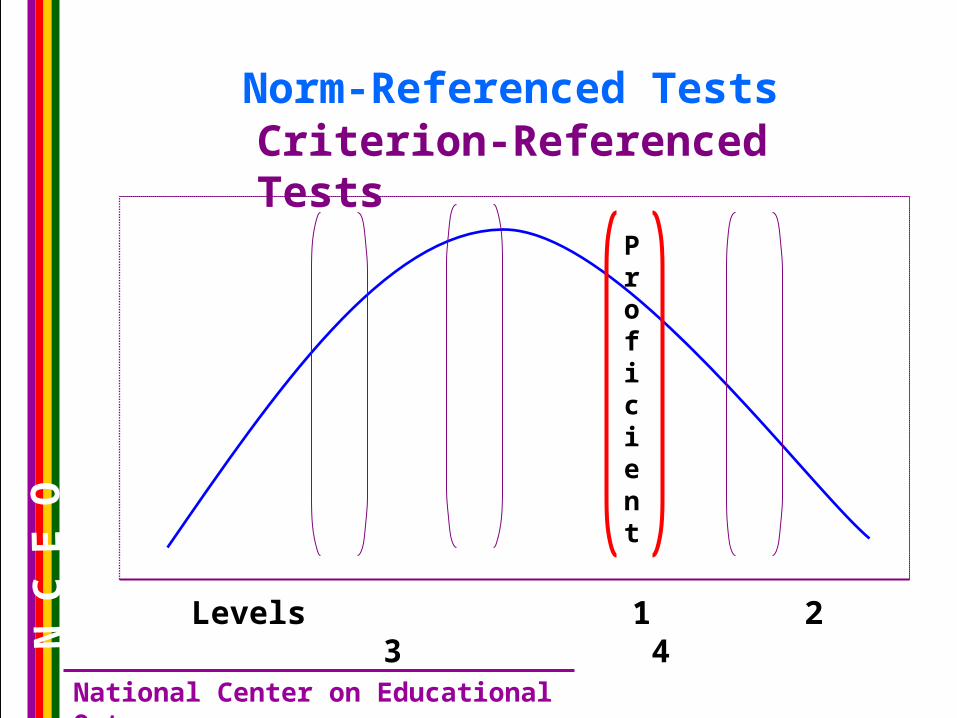
Definitions*
• Norm-Referenced Test (NRT):A test that allows its users to make score interpretations of a test taker’s performance in relationship to the performance of other people in a specified reference population.
• Criterion-Referenced Test (CRT): A test that allows its users to make score interpretations in relation to a functional performance level, typically through “cut score” definitions.
*From OCR Resource Guide, December 2000
National Center on Educational Outcomes
N C
E O
Norm-Referenced TestsCriterion-Referenced Tests
Levels 1 2 3 4
Proficient

National Center on Educational Outcomes
N C
E O
ReliabilityReliability is an index of the precision with which an examinee’s score is estimated with a particular set of items.
Not reliable
Or valid
Reliable,
But not valid
Reliable &
Valid
True Score
True Score
True Score

National Center on Educational Outcomes
N C
E O
Validity
The degree to which test scores accurately reflect the types of inferences made.
True ScoreMath Ability
Poor Performance
High Performance
Accommodated
True Score
Math Ability
Non- Accommodated

National Center on Educational Outcomes
N C
E O
Test score utility for school improvement resulting in
improved outcomes for students with disabilities, depends on
alignment with standards
Standardized Test
Standardized Test Cur
ricu
lum
and
Cur
ricu
lum
and
Inst
ruct
ion
Inst
ruct
ion
Impr
ovem
ent
Impr
ovem
entCONTENT
STANDARDS

National Center on Educational Outcomes
N C
E O
When the Numbers Are Not Enough• IDEA and IASA require states to report the number of students
with disabilities participating in the regular assessment, and the number participating in the alternate assessment
• Two important numbers

National Center on Educational Outcomes
N C
E O
How does the performance of students receiving special ed. services compare to the performance of all students?
• Now, look how easy it is to compare groups when percentages are reported in each category
Math ProficiencyNumber
of studentsNumber
receiving SpEd
Partially Proficient 300 70
Proficient 250 20
Advanced 50 10
Math ProficiencyPercent
of studentsPercent SpEd
Partially Proficient 50.0% 70.0%
Proficient 42.0% 20.0%
Advanced 8.0% 10.0%

National Center on Educational Outcomes
N C
E O
Who is counted affects interpretation of results
Which School did better, A or B?
Math Proficiency School A School B
Partially Proficient 50.0% 70.0%
Proficient 30.0% 15.0%
Advanced 20.0% 15.0%
Now decide
School A School B
Percent of All Students Tested 50.0% 95.0%

National Center on Educational Outcomes
N C
E O
Louisiana Data (NRT)
IEP IEP 504 504
Grade In Out In Out
3 5.7 94.3 12.8 87.2
5 5.8 94.2 15.4 84.6
6 6.1 93.9 19.2 81.8
9 11.2 88.8 22.6 77.4

National Center on Educational Outcomes
N C
E O
Assessment Participation Rates of Students with Disabilities
Rates Vary Tremendously Across States
The lowest rate is 15%
The highest rate is 100%

National Center on Educational Outcomes
N C
E O
AK
HI
CA
NV
AZ
OR
WAMT
WY
UT CO
TX
OK
LA
AR
KS
NE
SD
ND
MN
WI
MIIA
MO
IL
MS AL
FL
GA
TN
IN
KY
OH
WV
SC
NC
VA
PA
NY
ME
MD
DE
NJ
CT RI
NH
VT
MA
ID
NM
States Reporting Disaggregated Data for Students with Disabilities
No disaggregated data
Performance data only for some tests
Performance and Participation data for some tests
2000 Study
Performance data only for all tests
Performance and Participation data for all tests
14 states disaggregated data on the participation of students with disabilities
17 states disaggregated data on the performance of students with disabilities

National Center on Educational Outcomes
N C
E O
Current Research and Technical Challenges
• Accommodations and Modifications
• Alternate Assessment
• Out-of-Level Testing
• Other “GAP” Assessments
National Center on Educational Outcomes
N C
E O
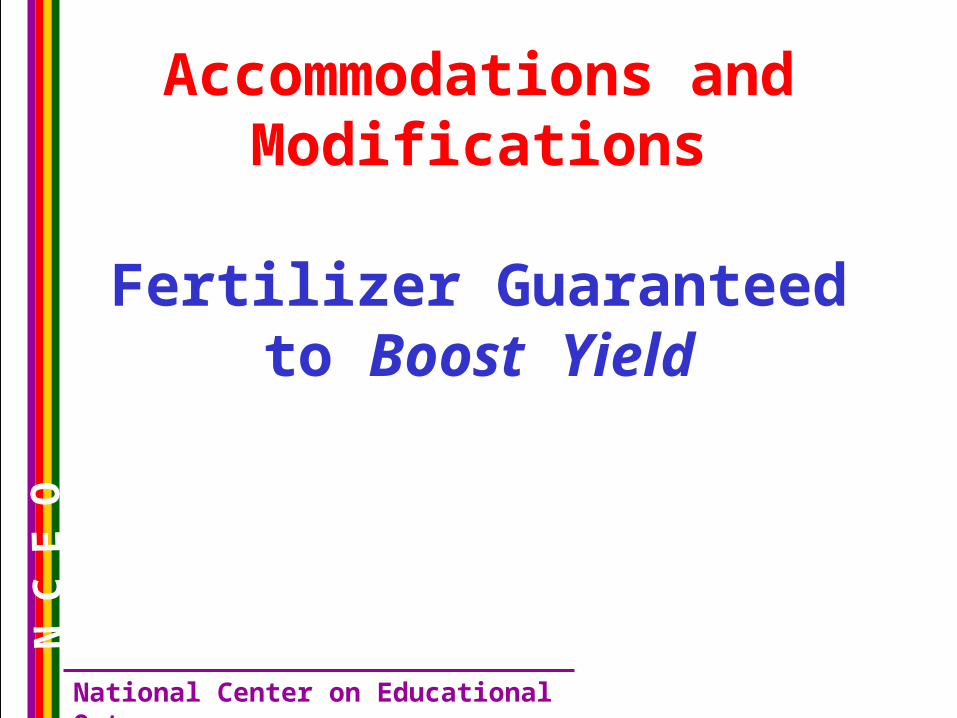
Accommodations and Modifications
Fertilizer Guaranteedto Boost Yield
National Center on Educational Outcomes
N C
E O
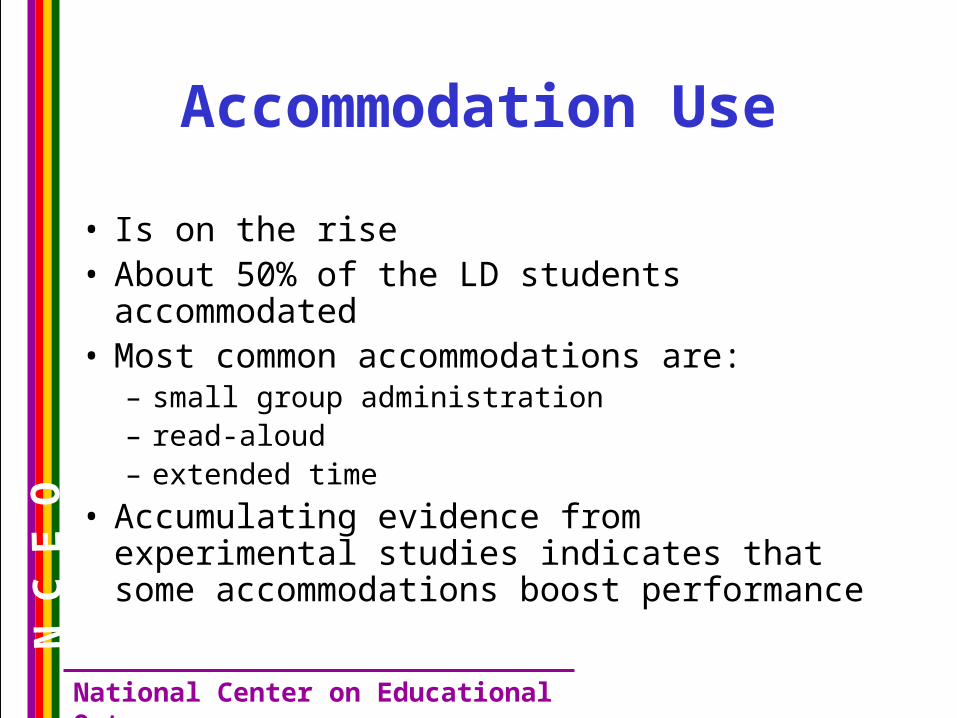
Accommodation Use
• Is on the rise• About 50% of the LD students accommodated• Most common accommodations are:
– small group administration– read-aloud– extended time
• Accumulating evidence from experimental studies indicates that some accommodations boost performance

National Center on Educational Outcomes
N C
E O
The Metaphor
• An accommodation is a change in testing materials or procedures that:
- increases access to the test for students with disabilities.
- results in measurement of student abilities not disabilities
- levels-the-playing field

National Center on Educational Outcomes
N C
E O
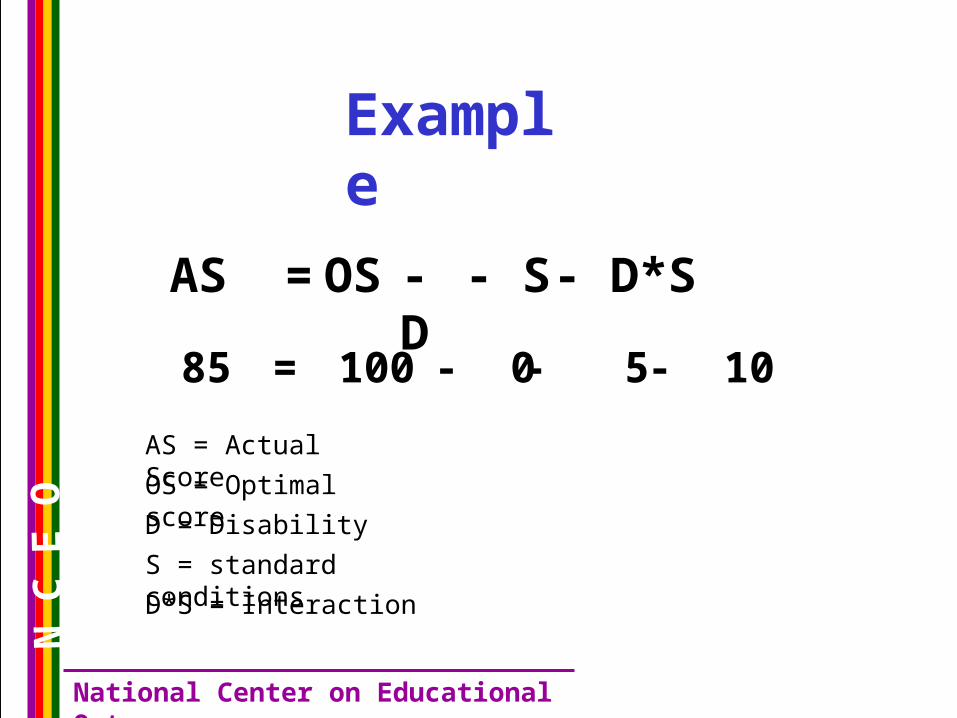
Psychometric Definition
• An accommodation represents an alteration to standard test conditions that neutralizes extraneous sources of difficulty that result from an interaction between standard administration and the student’s disability while preserving the measurement goals of the test.
National Center on Educational Outcomes
N C
E O
85 = 100 - 0 - 5 - 10
AS =
AS = Actual Score
OS
OS = Optimal score
- D
D = Disability
- S
S = standard conditions
- D*S
D*S = Interaction
Example
National Center on Educational Outcomes
N C
E O
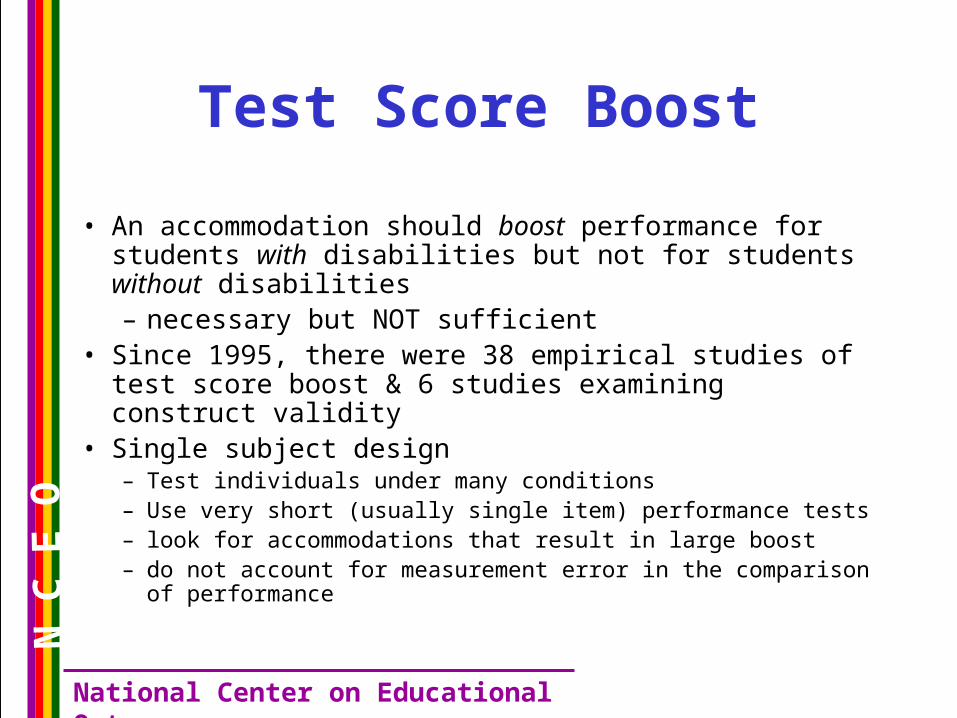
Test Score Boost
• An accommodation should boost performance for students with disabilities but not for students without disabilities– necessary but NOT sufficient
• Since 1995, there were 38 empirical studies of test score boost & 6 studies examining construct validity
• Single subject design– Test individuals under many conditions– Use very short (usually single item) performance tests– look for accommodations that result in large boost– do not account for measurement error in the comparison of
performance
National Center on Educational Outcomes
N C
E O
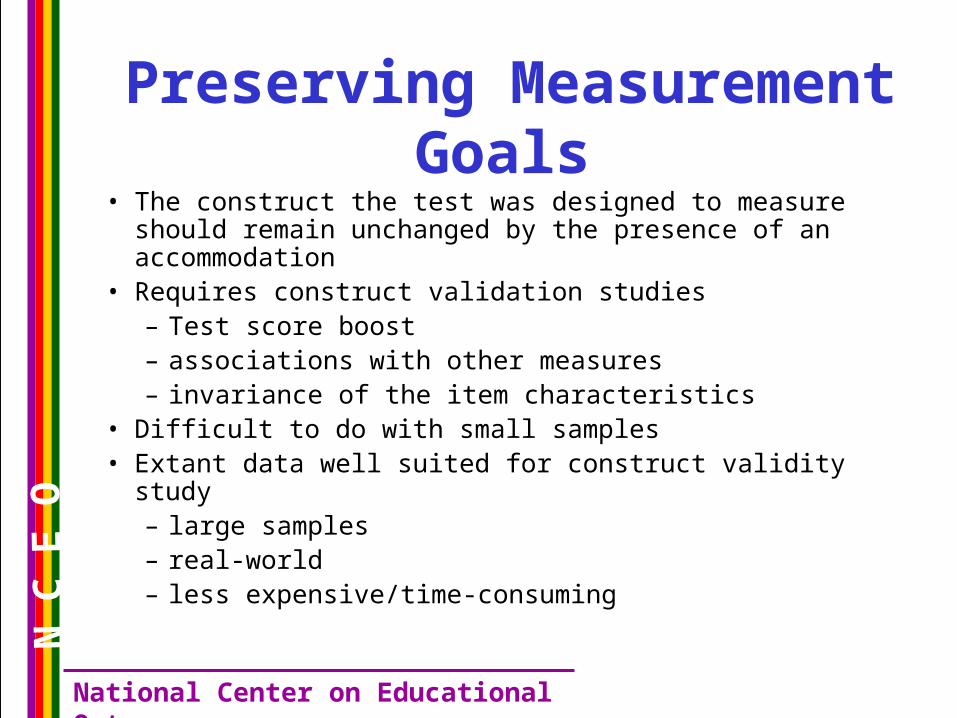
Preserving Measurement Goals
• The construct the test was designed to measure should remain unchanged by the presence of an accommodation
• Requires construct validation studies– Test score boost– associations with other measures– invariance of the item characteristics
• Difficult to do with small samples• Extant data well suited for construct validity study
– large samples– real-world– less expensive/time-consuming

National Center on Educational Outcomes
N C
E O
Construct-validation
• Compare item characteristics across groups– Differential Item Functioning Analysis
– Structural Equation Modeling
• Four possibilities if an effect is found– Accommodation not appropriately administered
– Accommodation not administered to appropriate population
– Accommodation doesn’t work
– Some combination of these

National Center on Educational Outcomes
N C
E O
Research Findings• DIF analysis across four groups
– Non-disabled, non-accommodated– Low performing, non-disabled, non-accommodated– Reading disabled, no read-aloud accommodation– Reading disabled, with read-aloud accommodation
• Results
MATH READING
Performance-matched:
No read-aloud:
Read-aloud:
0 1
1
6
10
19
# DIF Items
National Center on Educational Outcomes
N C
E O
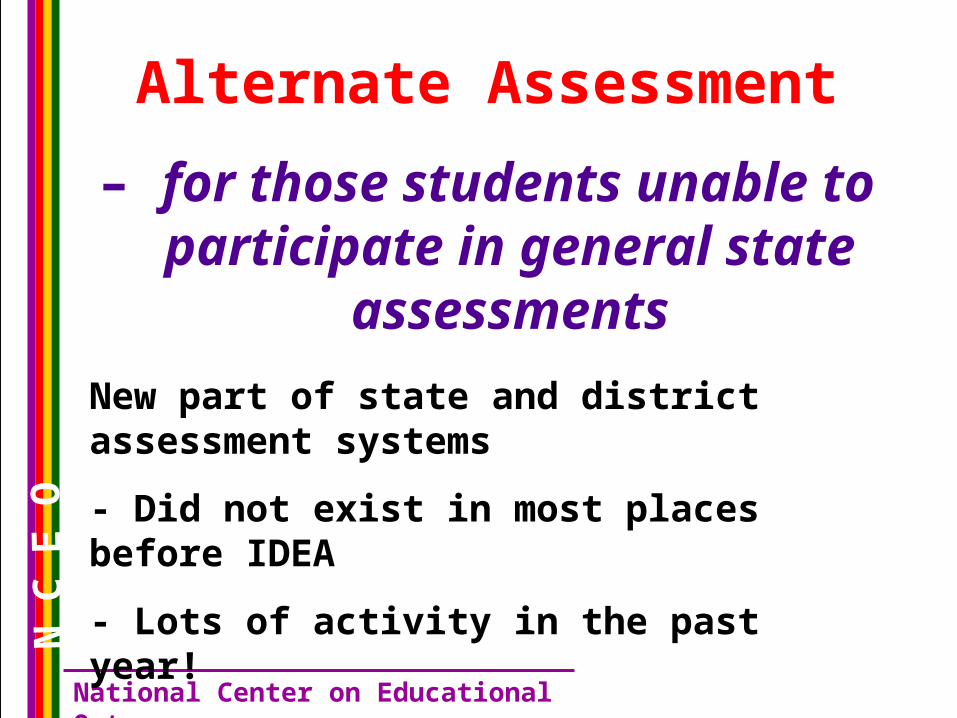
Alternate Assessment
– for those students unable to participate in general state
assessments
New part of state and district assessment systems
- Did not exist in most places before IDEA
- Lots of activity in the past year!

National Center on Educational Outcomes
N C
E O
Alternate Assessments are intended to provide the missing piece that makes it possible to include ALL students with disabilities
Many states have found the need for more than one missing piece
National Center on Educational Outcomes
N C
E O
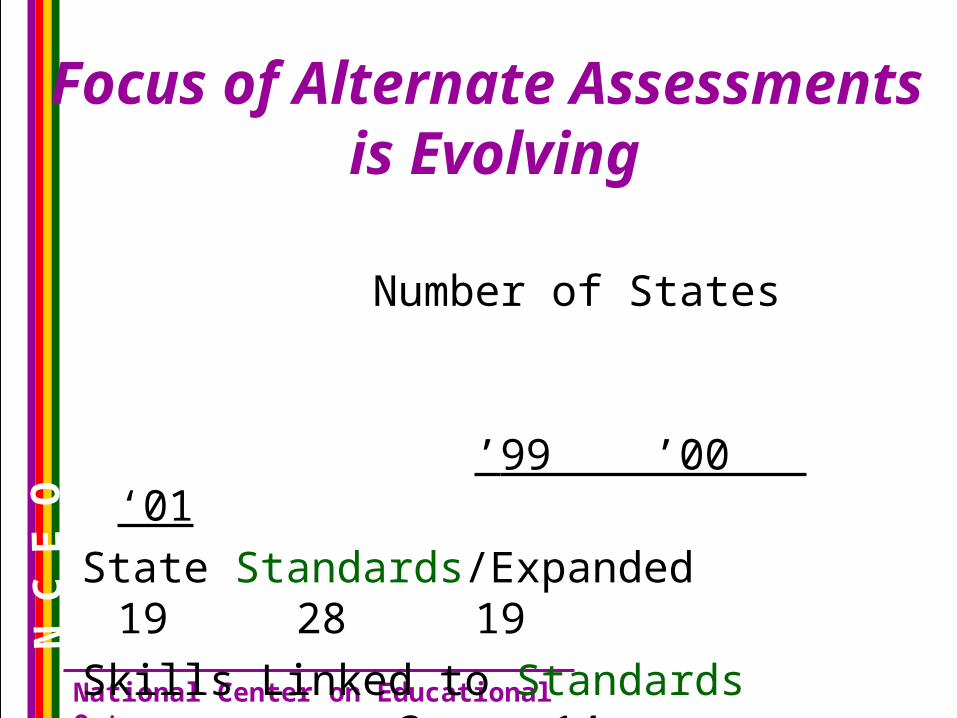
Focus of Alternate Assessments is Evolving
Number of States
’99 ’00 ‘01
State Standards/Expanded 19 28 19
Skills Linked to Standards -- 3 14
Standards + Additional Skills 1 7 9
Skills Only 16 9 4
Other or Uncertain 24 3 3

National Center on Educational Outcomes
N C
E O
As Focus Evolves, So Does Assessment Decision-Making Process
If no, ad just the student’sinstruction so tha t he/she
is work ing toward standards.
If no, consider a lternateassessm ent participation
for the student.
If yes, the student shouldparticipate in the genera l
assessm ent with a careful planfor the use of accommodations.
Can the student show what he/sheknows on a general assessment,
using accommodations?
W hen yes, go onto the nex t question .
Is the s tudent working toward high standards?

National Center on Educational Outcomes
N C
E O
Example from MA training -Who should take MCAS-Alt?
• A student with a disability…
– Who requires substantial modifications to instructional level and learning standards in a content area, and
– Who requires intensive, individualized instruction in order to acquire and generalize knowledge, and
– Who is unable to demonstrate achievement of learning standards on a paper and pencil test, even with accommodations
National Center on Educational Outcomes
N C
E O
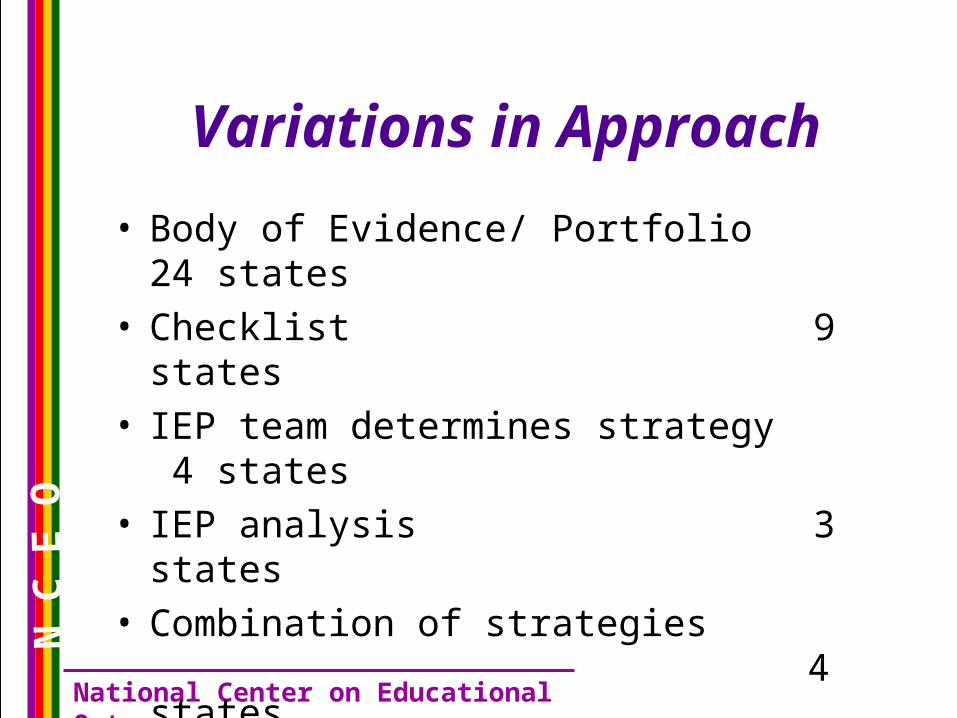
Variations in Approach
• Body of Evidence/ Portfolio 24 states• Checklist 9 states• IEP team determines strategy 4 states• IEP analysis 3 states• Combination of strategies 4 states • Specific performance assessment 4 states• No decision 2 states

National Center on Educational Outcomes
N C
E O
Stakeholders Bring Different Values and Beliefs to the Table
• Alternate assessment developers in nearly all states included: – State special education and assessment personnel
– Local administrators, special and general educators, assessment coordinators, and related service providers
– Parents and advocates
– A few states included students and adults with disabilities

National Center on Educational Outcomes
N C
E O
Variations in Student Performance Measures
• Skill/competence 40 states
• Independence 32 states
• Progress 24 states
• Ability to generalize 18 states
• Other 7 states

National Center on Educational Outcomes
N C
E O
Variations in System Performance Measures
• Variety of Settings 21 states
• Staff Support 20 states
• Appropriateness (e.g, age, challenge) 20 states
• Gen. Ed. Participation 12 states
• Parent Satisfaction 9 states
• No system measures 8 states

National Center on Educational Outcomes
N C
E O
Example: Arkansas Scoring Domain Definitions
• Performance - demonstration of skill while attempting a given task. Each entry is scored
• Support - assistance provided to a student during performance of tasks. Each entry is scored
• Appropriateness - The degree to which the tasks 1) reflect the chronological age of a student, 2) provide a challenge for the student, and 3) are representative of real-world activities that promote increased independence. Each entry is scored
• Settings - settings or environments in which tasks are administered/performed for math entries; and for ELA entries. Scored once for each content area across entries

National Center on Educational Outcomes
N C
E O
Alternate Assessment Performance Descriptors
About one-third of states are using the same performance descriptors for their alternate and general assessments
Slightly more states are using different performance descriptors
different from general
assessment
same as general
assessment
both
no performance
levels
State has not decided

National Center on Educational Outcomes
N C
E O
Absolute vs. Relative Performance Standards
• Some states emphasize measurement against absolute standards over the relative emphasis on individualized needs and abilities. In these states, most students participating in the alternate assessment are performing at the “0” or “1” levels.
• Other states have a separate definition of performance levels for the alternate assessment that emphasizes student-by-student growth of skill toward the relative standard based on the high expectation bridge, not in comparison to absolute standards. With this approach, student results can be at any of the proficiency levels.

National Center on Educational Outcomes
N C
E O
Number of States Reporting Alternate Assessment Results
• Blended with General Assessment Results
1
• Results Reported Separately
0

National Center on Educational Outcomes
N C
E OOut-of-Level Testing: What Does it Offer?
SemanticsOut-of-level/functional level
Alternative/alternate
Standards-Based Measurementassess proficiency against curriculum standards
use proficiency levels
dissatisfaction about the inability to detect progress for students in lowest proficiency level

National Center on Educational Outcomes
N C
E OProficiency Standards: the
technical view
L1 L2 L3 L4
All Kids
Special Ed

National Center on Educational Outcomes
N C
E O
Measuring Progress
• Further split bottom level• Compounds already unreliable measurement• Unreliable measurement of achievement leads to
unreliable of progress• If measuring progress is important & measuring
progress within groups is required (e.g. SpEd), then we need reliable measurement for all kids

National Center on Educational Outcomes
N C
E O
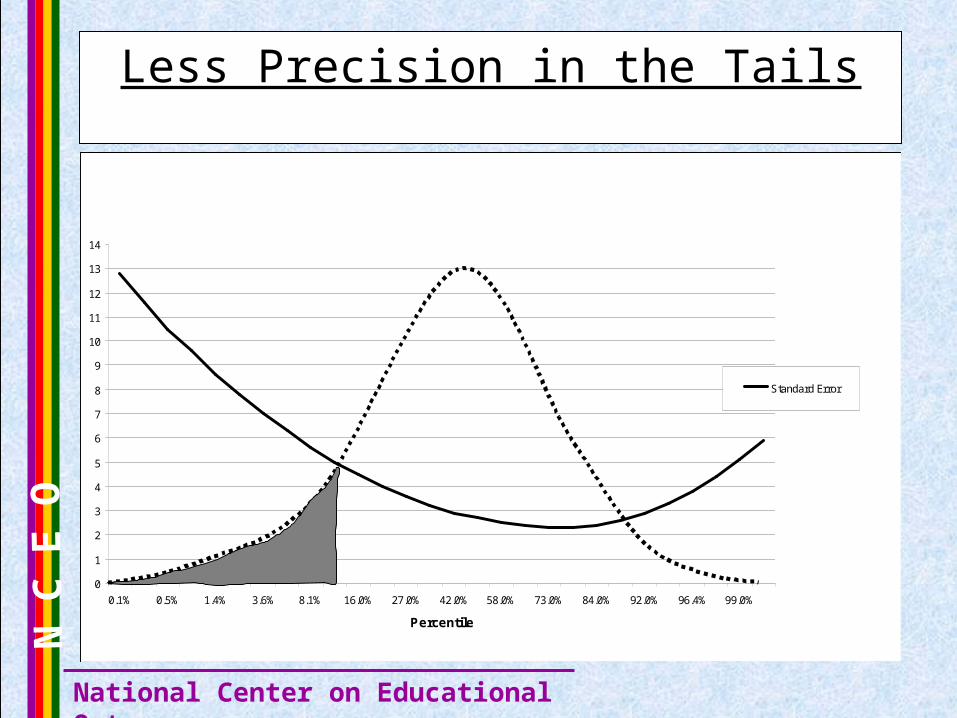
• Precision (reliability) is the cap of validity– poor precision = poor validity
• Precision decreases exponentially as test scores move toward the tails– too few items to indicate what the examinee can
and cannot do
National Center on Educational Outcomes
N C
E OLess Precision in the Tails
0
1
2
3
4
5
6
7
8
9
10
11
12
13
14
0.1% 0.5% 1.4% 3.6% 8.1% 16.0% 27.0% 42.0% 58.0% 73.0% 84.0% 92.0% 96.4% 99.0%
Percentile
Standard Error

National Center on Educational Outcomes
N C
E OPrecision Increased with
3 Linked Tests
0
1
2
3
4
5
6
7
8
9
10
Percentile
Standard Error

National Center on Educational Outcomes
N C
E O
Multilevel System
• Require larger item banks
• Require linking (e.g. concurrent calibration)– Concepts & Content should overlap across
levels
• Require mechanism for assignment to levels– safe guards to ensure appropriate assignment
National Center on Educational Outcomes
N C
E O
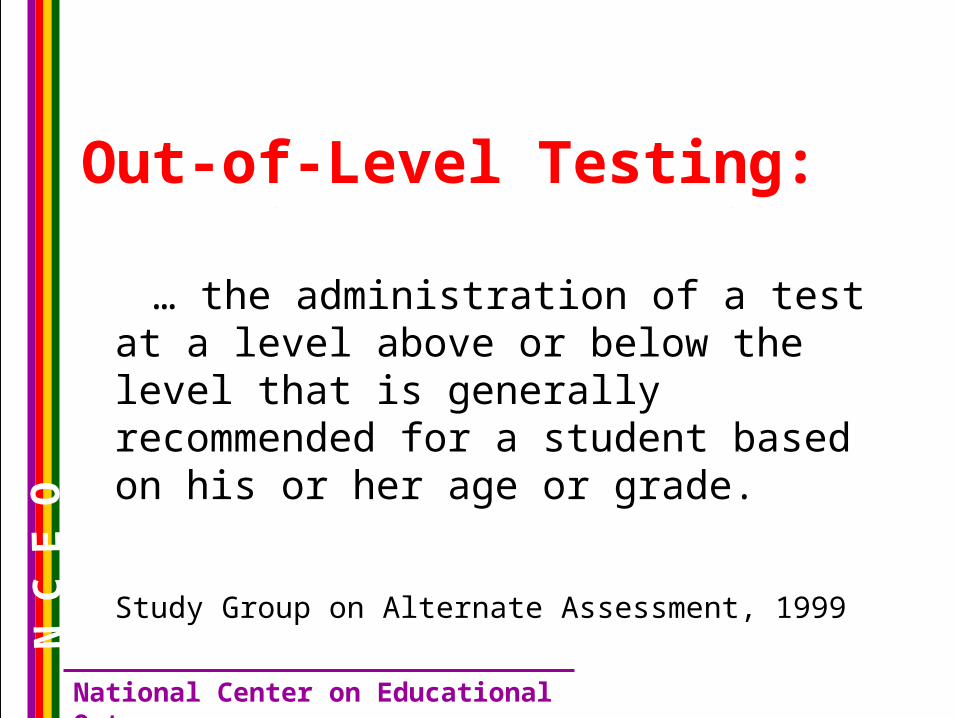
Out-of-Level Testing: A policy and practice view … the administration of a test at a level
above or below the level that is generally recommended for a student based on his or her age or grade.
Study Group on Alternate Assessment, 1999
National Center on Educational Outcomes
N C
E O
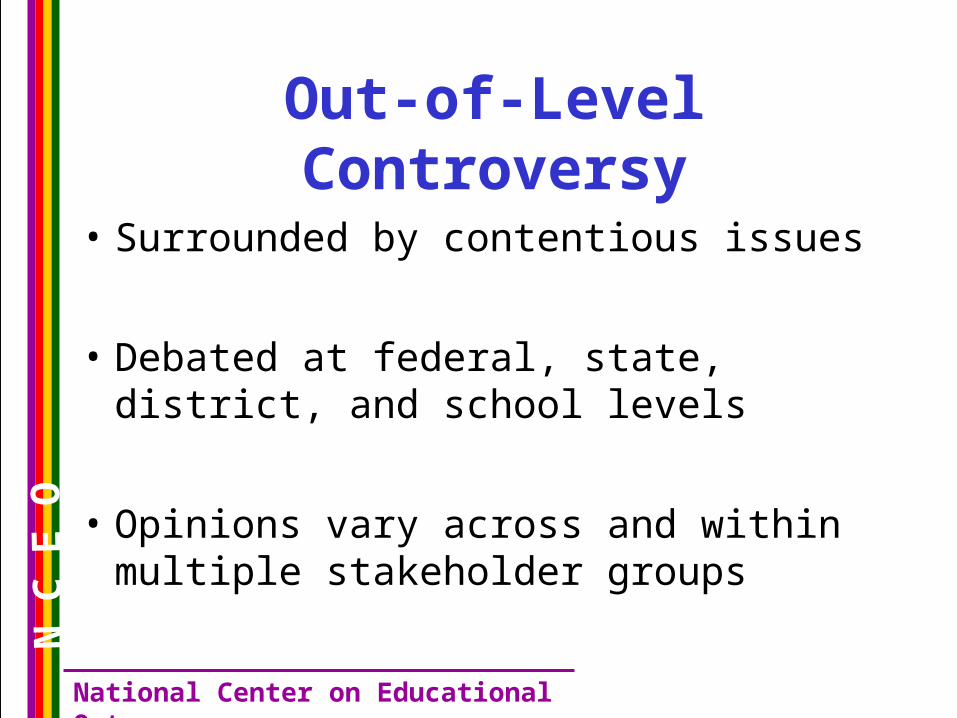
Out-of-Level Controversy
• Surrounded by contentious issues
• Debated at federal, state, district, and school levels
• Opinions vary across and within multiple stakeholder groups
National Center on Educational Outcomes
N C
E O
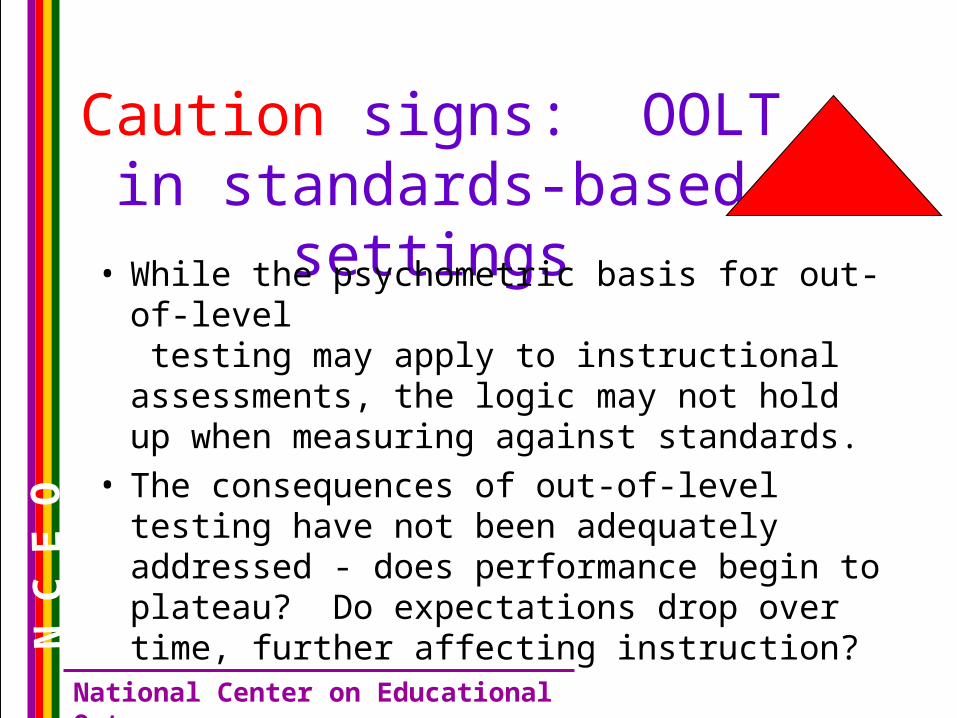
Caution signs: OOLT in standards-based settings
• While the psychometric basis for out-of-level testing may apply to instructional assessments, the logic may not hold up when measuring against standards.
• The consequences of out-of-level testing have not been adequately addressed - does performance begin to plateau? Do expectations drop over time, further affecting instruction?

National Center on Educational Outcomes
N C
E O
Expansion and Variability
• Rapid expansion of out-of-level testing programs
• Wide variability in policy content and implementation practices

National Center on Educational Outcomes
N C
E O
Increase from 1993 to 2001
Numbers of states allowing is increasing
Wide variability in policy and implementation
1993 – 1 State (Georgia)
1995 – 5 States (Connecticut, Georgia, Kansas, North Carolina, Oregon)
1997 – 10 States (Alaska, Connecticut, Georgia, Maine, Missouri, New Hampshire, New York, North Dakota, Vermont, West Virginia)
2001 – 17 States (Alabama, Arizona, California, Connecticut, Delaware, Georgia, Hawaii, Iowa, Louisiana, Mississippi, North Dakota, Oregon, South Carolina, Texas, Utah, Vermont, West Virginia)
National Center on Educational Outcomes
N C
E O
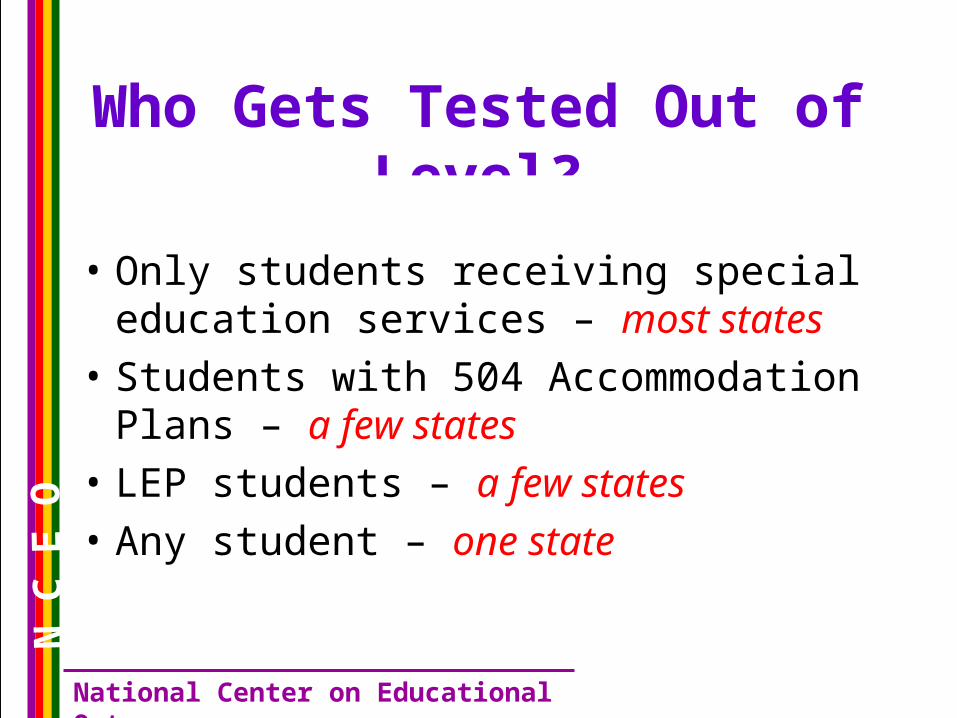
Who Gets Tested Out of Level?
• Only students receiving special education services – most states
• Students with 504 Accommodation Plans – a few states
• LEP students – a few states
• Any student – one state

National Center on Educational Outcomes
N C
E O
Where Out-of-Level TestingFits in Assessment Systems
• Accommodation
• Non-standard Accommodation
• Modification
• Adapted Assessment
• Alternate Assessment
National Center on Educational Outcomes
N C
E O
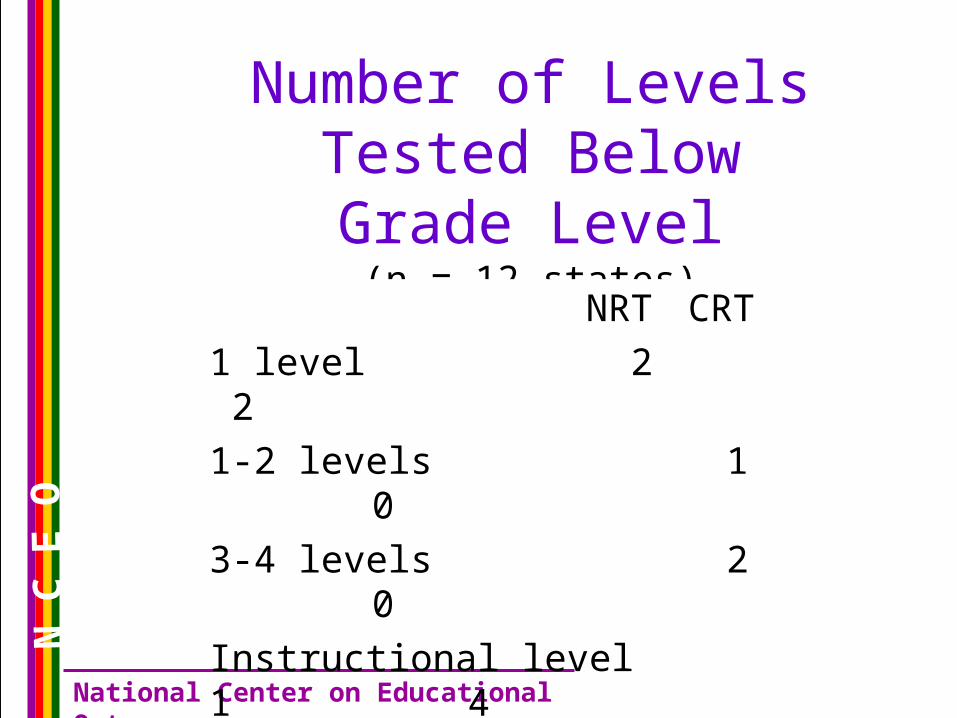
Number of Levels Tested Below Grade Level
(n = 12 states)
NRT CRT
1 level 2 2
1-2 levels 1 0
3-4 levels 2 0
Instructional level 1 4
Test levels only 0 2

National Center on Educational Outcomes
N C
E O
Pros and Cons for Students
• More accurate instructional decisions … BUT … Lower expectations
• Grade retention may decrease … BUT … May not receive regular diploma
• Students may have less test anxiety … BUT … Less motivation to complete a developmentally inappropriate test

National Center on Educational Outcomes
N C
E O
Pros and Cons for Systems
• More students included in state tests … BUT … Students with disabilities treated differently... May result in exclusion from reporting or accountability.
• Test scores may be more valid … BUT … Test scores may not be usable
• Way to improve assessment and accountability systems … BUT … State systems may not actually be inclusive

National Center on Educational Outcomes
N C
E O
Current Research
• Describing the prevalence of out-of-level testing
• Determining how students are selected for out-of-level testing
• Investigating the impact of out-of-level testing on academic performance

National Center on Educational Outcomes
N C
E O
Other “Gap” Assessments

National Center on Educational Outcomes
N C
E O
Ways to Participate Same way as other students
With accommodations
Alternate assessment
Not as simple as it looks
Some states are identifying other ways

National Center on Educational Outcomes
N C
E O
Hybrid Plants

National Center on Educational Outcomes
N C
E O
Some hybrids are better than others . . .
PRETTY GOOD, GOOD, NOT SO GOOD, or REALLY NOT GOOD
How do you tell?
Back to the Principles!

National Center on Educational Outcomes
N C
E O
Levels Testing
Different from out-of-level testing?
Really assessing the same standards for all students?
Implications for performance over time?

National Center on Educational Outcomes
N C
E O
Developmental Scales and Other Assessments
Really assess the same standards as for other students?
How can scores be aggregated with other scores?
Implications for standards-based instruction?

National Center on Educational Outcomes
N C
E O
Alternative Assessments (e.g., juried assessments)
Enough basis for good “alternatives” in performance assessment literature?Should these be available only to students with disabilities?How can this information be aggregated with test scores?

National Center on Educational Outcomes
N C
E O
SUMMARY: A work in progress!
• Accommodations and Modifications
• Alternate Assessment
• Out-of-Level Testing
• Other “GAP” Assessments
National Center on Educational Outcomes6-15-01
N C
E O
Interpreting Performance Trends for Students in Special Education

National Center on Educational Outcomes
N C
E O
What goes in, must come out!Methods for Reporting Trends
• Cross-sectional– across grades within year
• Cohort-dynamic– within grade across years
• Cohort-static– across grades across years– a group is defined in base year and tracked over
time

National Center on Educational Outcomes
N C
E O
Considerations for SWD
• Disability label is NOT static
• Participation rates tend to increase with grade level
• Accommodation use tends to decrease with grade level
• Drop-out occurs mostly among students with a mild disability

National Center on Educational Outcomes
N C
E O
Transitions
0
2
4
6
8
10
12
14
16
18
Per
cent
of
the
SpE
d P
opul
atio
n
Grade 4 Grade 5 Grade 6 Grade 7
Left
Enter

National Center on Educational Outcomes
N C
E O
Transitions Tied to Performance
53
59
65
71
77
Ave
rage
Tes
t Sc
ore
4th 5th 6th 7th
Left
Enter

National Center on Educational Outcomes
N C
E O
Impact on Achievement Trends
63
69
75
81
87
4th 5th 6th 7th 8th
Ave
rage
Tes
t Sc
ore
SpEd
GEd

National Center on Educational Outcomes
N C
E O
Part III. Apply the Best Fertilizers

National Center on Educational Outcomes
N C
E O
How High is High Enough?
IEP Goals and
Objectives
Content and Performance
Standards

National Center on Educational Outcomes
N C
E O
What Other Information Exists. . .
• Beginning results of a study on out-of-level testing
• Analyses of the effects of accommodations on test score comparability and validity
• Exploration of issues in assessment for students with disabilities who are also English Language Learners
• Studies of related policies – graduation requirements, social promotion, appeals/waiver procedures
• Continued analyses of state data to better understand accommodation, reporting, and performance issues
• Identification of procedures for reviewing items for bias for disabilities or accommodations

National Center on Educational Outcomes
N C
E O
Part IV. Harvest a Rich Return

National Center on Educational Outcomes
N C
E O
Positive Consequences0 5 10 15
Increased access to the general curriculum
Increased inclusion in accountability system
More rigorous education
Increased participation in state assessments
Increased academic expectations
Improved performance on some stateassessments
Increased general and special educationnetworking
Number of States

National Center on Educational Outcomes
N C
E O
2001 State Directors Told Us:All Students with Disabilities are Included in All Components of the Accountability System in 25 States
AK
HI
CA
NV
AZ
OR
WAMT
WY
UT CO
TX
OK
LA
AR
KS
NE
SD
ND
MN
WI
MIIA
MO
IL
MS AL
FL
GA
TN
IN
KY
OH
WV
SC
NC
VA
PA
NY
ME
MD
DE
NJ
CTRI
NH
VT
MA
ID
NM
All Students in Accountability System

National Center on Educational Outcomes
N C
E O
What State Directors Say About Changes in Performance
About 28% of states reported increases in state test performance of students with disabilities
Nearly one-third of the states were not able to make comparisons because of previous unavailability of data
higher than previous years
about the same
comparison data not available
lower than previous years
NCEO’s 2001 Survey of States:

National Center on Educational Outcomes
N C
E OSurvey of 100 Students with
Learning Disabilities in Minnesota
• The majority of students surveyed:– Know about graduation tests– Know how they are doing on tests– Use accommodations on tests– Understand accommodations and other
things that help them learn• Schools attended by most students surveyed
are teaching them about accommodations

National Center on Educational Outcomes
N C
E O
Actual Consequences 2001
New York: More students with disabilities PASSED the Regent’s Exam than took it before
Kentucky: Higher performance levels on alternate assessment were correlated with integration of instruction and assessment; and the level of involvement of the student in constructing his or her own portfolio
Wyoming: Lara’s Story
(a few examples)

National Center on Educational Outcomes
N C
E O
Future
It is not going away – the push will continue to include students with disabilities and LEP students in assessments and accountability systems. That is a GOOD thing! It is important to get on with it . . . .

National Center on Educational Outcomes
N C
E O
Remember: What goes in affects what comes out! It is important to focus not just on measuring the cow’s milk/cream output (although that IS Important) . . . . But, we need to get on with making sure that the cow increases production!

National Center on Educational Outcomes
N C
E OIT ALL COMES DOWN TO
TEACHING AND LEARNING