n ew york state e ducation d epartment … n ew york state e ducation d epartment policy brief...
TRANSCRIPT

1
N E W Y O R K S T A T E E D U C A T I O N D E P A R T M E N T
POLICY BRIEF
Formula Al locat ion For Schools: Histor ical Perspect ive and
Lessons from New York State
PR E P A R E D F O R T H E N A T I O N A L AC A D E M Y F O R S C I E N C E S
PA N E L O N FO R M U L A A L L O C A T I O N B Y
J A M E S A. K A D A M U S D E P U T Y C O M M I S S I O N E R F O R E L E M E N T A R Y , M I D D L E,
S E C O N D A R Y A N D C O N T I N U I N G ED U C A T I O N
M A R C H 2 0 0 2
2
A C K N O W L E D G E M E N T S
The author gratefully acknowledges the editorial, research, technical and policy analysis assistance provided by the New York State Education Department’s State Aid Work Group and other colleagues of the New York State Education Department in preparing this paper. Contributors include: Clesson Bush Deborah H. Cunningham Andrew Gayle Richard Glasheen Janet Mayo Ruthlyn Noel Burt Porter Matthew Reilly Charles Shippee Charles Szuberla Darlene Tegza Susan VanDeventer Willard C. Vanhorne

3
Formula Allocation for Schools Historical Perspective and Lessons from New York State
This paper offers a practitioner's perspective on education funding through school aid
formulas. State school aid formulas in New York State have tended to evolve through a process
of incremental change characterized by slow growth, punctuated by occasional reforms. Many
of the current formulas are designed to drive aid to districts according to their levels of student
need and fiscal capacity. Such targeting efforts depend, however, on the State’s ability to
gather and analyze complex data. Abstract concepts such as student need and district wealth
need to become measurable variables in order to drive funding. Debates about acceptable
proxy measures for these important concepts mean that, even when we agree on policy goals,
the means of achieving those goals remains a subject of ongoing debate.
Other debates result from conflicting policy goals. Targeting aid to student need
conflicts at times with the goal of providing stability and predictability in year-to-year funding
levels. With competing goals and inherent uncertainties in the operationalization of variables
that drive billions of dollars in school aid,1 it is hardly surprising that education finance is
complex and often contentious. Finally, school aid has raised questions about
intergovernmental relations and the appropriate roles of federal, state, and local governments in
providing resources for K-12 education. This paper will examine the evolution of education
funding in New York State by offering a brief history of New York State’s school aid formulas.
The paper concludes by drawing implications for federal funding formulas from this state
perspective.
Before beginning, a brief description of the governance of education in New York State
will help to distinguish this from other states. Budget authority for educational aid in New York
rests with the legislature and the executive branch, as it does in other states. The New York
State Board of Regents is the policy making body for all educational institutions in the State and
the State Education Department. Members of the Board are appointed by a joint session of the

4
Legislature. The Regents can take positions on the impact of aid distributions and make aid
proposals independent of the executive or legislative branches. Although the Regents have
been influential in aid deliberations their relationship is advisory in nature.
New York’s Early Education History: A Quest for Educational Opportunity
New York State’s initial efforts to achieve equality of educational opportunity began with
the Common School Law of 1812. Under this law some 12,000 school districts were created,
which allowed for most children to be within walking distance of a public school.2 The Common
School Law allowed school districts to have limited taxing authority in order to maintain local
school buildings. The State contributed aid toward education through the interest created from
a State Common School Fund; towns were given the responsibility of collecting a tax that would
match the funds generated by the State. As a result, the number of students grew and the cost
of educating them grew at a faster pace than the Common School Fund could provide. Many
schools imposed tuition to help meet the demand. This kept children of poor families from
attending school.
The Free School Law of 1849 served as New York State’s second major stride toward
equalized educational opportunity. Under this law, all schools were required to remain free of
charge for at least four months. The law further provided that both county and town taxes be
levied to raise revenues equal to the amount of aid received from the State. School districts
were also given unlimited authorization to levy taxes to provide additional support for public
education.3
Allowing districts to raise unlimited local revenues to fund public education resulted in
wide variations in per-pupil spending across the State as wealthy districts increased local
spending on education. In order to stem spending inequalities, which developed as a result of
the unlimited taxing authority given to school districts, the New York State Legislature instituted
1 New York State aid to elementary and secondary education totaled almost $14 billion for school year 2001-02. 2 New York State Education Department, Report of the Expanded Tax Base Study, January 1981. 3 New York State School Finance Law Study Project, Occasional Paper number 14: Development of Public School Finance in New York State, April 1978.

5
a statewide school property tax in 1851.4 With the creation of a statewide tax, county and town
school taxes were eliminated. The 1851 property tax increased the State share of educational
expenditures during its initial year to 52 percent. By 1901, however, the statewide property tax
was repealed.
In a further attempt to equalize school aid among school districts, the Cole Rice Law of
1925 provided for a foundation program which allotted $1,200 per elementary school teacher
and $1,600 per secondary school teacher to all districts that possessed a high school or at least
five teachers. The Law of 1925 also attempted to redistribute school funds from wealthy
districts to those areas of the State that were experiencing financial difficulties by:
1. Using average daily attendance in conjunction with a uniform cost factor to determine
the amount of support guaranteed from State and local revenues; and,
2. Using full valuation of property per pupil as the determining factor of a district’s ability
to tax itself in support of its schools as a means to give those districts with less
property wealth a greater aid contribution from the State.5
Revisions in the school aid formula during 1945 and 1948 sought to treat low wealth
central school districts and other districts alike by providing all with the same foundation level of
support as opposed to the varying levels of support brought about through the Law of 1925.
These changes to funding allocation attempted to correct the vast inequalities that were present
among central school districts.
Although it retained many of the provisions of the Laws of 1925, the revisions to the
school aid formula in 1962 were primarily aimed towards cities.6 The 1962 law attempted to
reallocate funds from suburban areas to cities, which were suffering from decreasing
populations and shrinking tax bases. Cities were the beneficiaries of further attempts at fiscal
equalization in 1974 when additional weightings were placed on special programs in cities.
4 New York State School Finance Law Study Project, Occasional Paper number 14: Development of Public School Finance in New York State, April 1978. 5 New York State Education Department, Report of the Expanded Tax Base Study, January 1981. 6 New York State School Finance Law Study Product, Occasional Paper number 14: Development of Public School Finance in New York State, April 1978.

6
A parallel effort to accelerate the State's push toward greater equalization of educational
opportunity occurred in its encouragement of school district consolidation, particularly during the
World War II and the post World War II era. Combining small districts would improve
educational opportunity by resulting in larger student enrollments needed to support greater
breadth in the curriculum. In 1942, for example, the Joint Legislative Committee of the State
Education System initiated work on the Master Plan for School District Reorganization. That
plan, which reached completion in 1947, recommended that the 5,050 existing districts at that
time be reduced to 500. Only seven years later, a Temporary Commission on Education
Finances was formed (also known as the “Heald Commission” in honor of its chairman Henry T.
Heald). That Commission concluded, among other things, that:
…”It has been recognized that the attainment of existing educational standards and a
reasonable degree of equality of educational opportunity throughout the state will depend as
much upon improving the school district organization as upon the improvement of the school
finance laws of the state7.”
The recommendations of that Commission were numerous, but Commission members
specifically emphasized the use of positive incentives for school district reorganization, and
recommended as well the updating of the 1947 Master Plan for School District Reorganization.
There can be no doubt that the work of this Commission provided an important impetus to the
further equalization of educational opportunity throughout the State. The subsequent passage of
Reorganization Incentive Aid (Chapter 745 of the Education Law in 1965) helped to further
accelerate consolidation trends, by providing reorganized districts an additional 10 percent of
their formula aid for a five-year period, and by extending an additional 25 percent of its Building
Aid for construction related to reorganization. Today, less than 700 major school districts exist in
New York, a massive reduction from the 5,050 districts in existence at the end of World War II.
The 1970s: A Competing Goal of Financial Stability
7
Fiscal equalization was not the only goal affecting school aid allocations. Lawmakers
have also been very eager to protect districts from sudden drops in formula-driven funding by
enacting provisions that hold districts harmless (i.e., save-harmless provisions). Such sudden
drops in funding could occur for example if rapid increases in property values increased a
district's tax base and thus reduced the amount of State Aid it was eligible to receive. Similarly,
since a district’s aid is determined by assessing its wealth in relation to a State average, a
district’s aid can drop if its wealth changes in relation to the State average, even if the district’s
tax base remains unchanged. This will occur, for example, if property values drop consistently
in one part of the State. A sudden drop in enrollment can also cause funding to drop, even
though districts might not be able to reduce their educational expenditures as quickly. In New
York State, save-harmless provisions have been varied and generous. By 1976-77, all but
seven school districts in the State received State Aid through “save-harmless” provisions, thus
reducing the equalizing effects of aid formulas.
The 1980’s: Aid with Strings Attached—Growth in Categorical Aids
From 1978-1989, New York experienced a general economic expansion. State Aid for
education grew rapidly during this period. In 1978-79, the State discontinued use of the
foundation formula and enacted the percent equalizing formula for operating aid, equalized on
the basis of full property value per pupil. In the decade between 1979-80 and 1989-90, State
Aid for schools increased by 124 percent. Along with this growth came a significant increase in
both the number of categorical aid formulas and in the overall amount of funding distributed
through categorical aid formulas. During this period the number of categorical aids funded
through General Support for Public Schools more than doubled, from 26 categorical aids and
grants in 1979-80 to 54 in 1989-90. In addition, dozens of other State Aid programs provided
funds to school districts through other budget allocations.8 Categorical aid helped the State
7 Temporary Commission on Educational Finance, Final Report – Financing Public Education in New York State, Albany, N.Y., 1956, p. 245 8 New York State Division of the Budget, Education Unit, Description of 1979-80 New York State School Aid Programs, and New York State Division of the Budget, Education Unit, Fall, 1979, and Description of 1989-90 New York State School Aid Programs, September 28, 1989.

8
influence how districts allocated educational resources and ensured that districts spent funds on
materials and programs deemed to have high educational value.9
By the end of this period, the State began to use categorical aid to direct more funding to
improve low student achievement. In 1987-88, the State introduced an aid program for "Pupils
with Compensatory Educational Needs (PCEN)." This provided funding for large city districts to
benefit students with basic skills deficiencies. State regulation required school districts to
provide remediation until the children performed at grade level.
The period from 1978 to 1989 also witnessed the development of a mechanism for
addressing the policy goal of wealth equalization. The idea was that Operating Aid should
inversely correspond to a district's ability to pay for education. Wealthy districts should receive
less aid per pupil than poor districts. State Operating Aid was distributed using both aid ratios
based on the district's property wealth and need-weighted pupil counts. Low-wealth school
districts received a higher aid ratio (and thus more aid) than wealthy districts. Since 1984-85,
the Operating Aid formula has used a wealth measure called the "Combined Wealth Ratio"
(CWR). The CWR is based in equal proportions on both per-pupil income wealth and per-pupil
property wealth (equalized to represent full value).
The CWR exemplifies many of the challenges education finance policymakers face in
developing and using measures to drive school aid. First, although the CWR is intended to
serve as a measure of fiscal capacity, it does not reflect actual practices used by localities to
raise funds for education.10 It is a proxy for fiscal capacity. As a result, districts sometimes
complain that the CWR overstates their actual revenue-generating ability and push for additional
State funding. Secondly, the CWR is a relative measure. Essentially it compares each district's
9 To the extent that districts already allocate resources to the "categories," categorical aid is in effect fungible and can be used for other purposes, including tax relief. A recent article by Fisher and Papke discusses research on school district responses to categorical aid. The evidence suggests that categorical aid does increase school spending, but by an amount less than the amount of the grant. Fisher and Papke also cite evidence that categorical aid contributes to local tax relief and that "much of categorical funding is not equalizing in its distribution." (See Ronald C. Fisher and Leslie E. Papke, Local government responses to education grants, National Tax Journal 53 (1): 163.)

9
wealth to the State average. This means that a district's CWR fluctuates according to both
changes in its own per-pupil property and income wealth and changes in the State averages of
these wealth measures. Thus, a recession concentrated in one part of the State may lower
income levels and property values for many districts. As a result, the statewide average wealth
measures used to calculate the CWR will decrease. Other districts, however, may not suffer the
consequences of the economic downturn. Their property values and per-pupil income may be
stable. Nevertheless, since they have become wealthier relative to the State average, their
CWR increases. Their greater CWR means that their State Sharing Ratio (used to calculate
Operating Aid) will decrease and they will receive a smaller share of State Aid. Legislators
representing districts in this situation argue that districts whose need and ability to pay for
education have not increased should not suffer a decrease in their sharing ratio just because
the State average has changed. As a result, the Legislature often enacts save-harmless
provisions to cushion the financial blows to such districts. In New York State, using a State
average to determine aid shares poses additional problems because New York City is such a
large district. With 1.1 million public school students, it accounts for over one-third of the State's
public K-12 enrollment. Consequently, New York City tends to dominate the average of any
pupil-weighted measure in which it is used. Despite these drawbacks, New York school aid
formulas tend to rely on relative measures. Establishing normative levels of need and fiscal
capacity to drive school aid is certain to lead to extensive and ongoing adjustments—both
methodological and political.
Shifts in a district's relative status sometimes are used to justify save-harmless
provisions or legislation capping the percentage increase on measures that drive school aid
formulas. Other provisions place caps on year-to-year increases in full property value. This
reduces the increase to a district's Combined Wealth Ratio, which in turn limits the decrease in
its Aid Ratio. The end result is that, with the cap, a district ends up receiving more aid than it
10 The great variety of local funding sources makes the use of a single statewide standard measure for fiscal capacity impossible.

10
would receive if the increase in its full value were not capped. For Building Aid, for example,
school districts are allowed to select their most favorable Aid Ratio for any year going back to
1981-82. Since 2001 several approaches have been enacted to limit the benefit of this aid ratio
choice. Thus, in many cases Building Aid is provided on the basis of 20-year-old information
about district wealth. Legislative action for school year 2001-02 reduced the impact of these
provisions on the State’s education budget by requiring districts to accept an assumed
amortization schedule for debt service for past and future school building projects. The result is
that State Aid is calculated as if the district’s debt for school construction were spread over more
years and the annual cost is reduced.
In practice, then, instead of relying on the most current data available and allowing the
formulas to run as intended, lawmakers tend to cushion the blow for districts that would "lose
out" by allowing them to use something other than their actual data. Clearly, such caps and
save-harmless provisions undermine the intended wealth-equalizing structure of the aid
formulas. Categorical formulas and grants also tend to mitigate the wealth-equalizing effects of
the aid formulas both because many are driven by enrollments or other considerations than
district wealth or pupil need and because they reduce the amount of funds available for
distribution through the wealth-equalizing Operating Aid formula. Thus the formulas serve
competing policy goals. The wealth-equalizing formulas coexist with other aid formulas that
drive aid to all districts regardless of wealth.
The 1990s: Targeting Aid to Pupil Needs
In terms of raw numbers, New York State aid for education during the 1990s did not vary
greatly from the prior 15 years. For example, New York started out the decade of the 1990s
with some 50 separate categorical and computerized aids and by the end of the decade the
number had changed little (although there were some consolidations, additions, and
eliminations).11 State Aid as a percentage of total K-12 expenditures (after the inclusion of the
11 New York State Division of the Budget, Education Unit, Description of 1990-91 New York State School Aid Programs, Fall, 1990; and New York State Division of the Budget, Education Unit, Description of
11
State-funded School Tax Reduction program known as STAR)12 summed to 44 percent in the
1999-2000 State fiscal year, while it accounted for only a marginally smaller share (42.9
percent) in the 1989-90 State fiscal year. Federal aid as a percentage of total spending
changed little, as well: it was 3.6 percent in 1989-90 and 4.5 percent a decade later.
However, if we look behind these numbers there are some changes in policy, direction,
and themes that are worth highlighting. First and perhaps foremost is that the trend toward
ever-higher State appropriations for education was stalled in the early part of the decade, due to
a national and State economic downturn. The result was the incorporation of a deficit reduction
assessment imposed three-quarters of the way through the 1990-91 fiscal year. This formula
resulted in a 0.7 percent overall reduction in statewide aid to school districts in the 1989-90
State fiscal year. Since the length of New York’s recession was longer than the nation’s as a
whole, the deficit reduction assessment was imposed for three years. Despite the negative
effect of reducing aid to school districts mid-year, the deficit reduction formulas reduced aid in a
wealth-equalizing manner. The result was that the distribution of aid after deficit reduction was
more equalized than before.
Concomitant with the reduction in State Aid, the State Board of Regents and local
governments—including school districts—were pushing for a reduction in mandates. The
Regents identified 19 separate mandate relief actions that they believed would help school
districts reduce local costs while maintaining or improving programs and services to students.
Of these 11 were implemented through legislative enactment or promulgation of rules and
regulations by the Board of Regents. Relief occurred in requirements for receipt of State
Hardware Aid, special education class size, special education individualized education plan
development, special education resource room case loads and aid, special education evaluation
and early retirement.
1999-2000 New York State School Aid Programs, Fall, 2000. See Table II-A in each report for a list of aids financed through General Support for Public Schools. 12 STAR is a property tax relief program that supplants a portion of local residential property tax support for schools with State funding. The State in essence pays part of homeowners' property taxes. STAR

12
The economic crisis of this period had some salutary effects at the time: it created a
window of opportunity for change, and for reconsideration of the State Aid formula assumptions.
One manifestation was formula changes that reflected some of the recommendations of the
Blue Ribbon Salerno Commission convened as a result of State legislative action in the late
1980s. The Commission had called for a number of corrective actions: consolidation and
simplification of aids; formulas that reflect the higher costs of educating at-risk and poor
children; and formulas that reflect the variation in districts' regional costs of living and abilities to
pay. The Salerno Commission—and the Regents—criticized aid for Pupils with Compensatory
Educational Needs as rewarding failure. (Aid increased as student achievement decreased.)
These recommendations resulted in the following formula changes in the 1993-94 fiscal year:
§ Consolidation of seven aids into a single Comprehensive Operating Aid;
§ The creation of tax equalization and tax effort aids to provide relief to high taxing districts;
§ The creation of Extraordinary Needs Aid to supplement operating funds for districts with high
poverty; and
§ Enactment of an aid for educationally related support services to reduce unnecessary
special education placement.
Extraordinary Needs Aid essentially recognizes that pupils living in poverty and pupils
with limited English proficiency need more educational resources than others. As such, it
incorporates a measure of equity that recognizes different learning needs of different groups of
students (i.e., vertical equity) into the school aid formulas.
The Laws of 1993 represented a significant change in New York State education aid
formulas with respect to need. They made it clear that pupil need was to be addressed by
measuring factors (such as poverty and limited English) outside the control of school districts.
They emphasized the importance of measuring school districts’ educational burden as well as
each district’s ability to pay in allocating State Aid.
drives aid to districts in proportion to their residential tax bases and self-selected tax rates. Distributionally, it favors taxpayers with expensive homes and those with high property tax rates.
13
Over the past decade, the State has increased its funding to school districts with both
high pupil need and limited fiscal capacity. Figure 1 shows that, by school year 2000-01, State
Aid to school districts was highly correlated (r=.79) with a combined measure of pupil need and
fiscal capacity: school district need/fiscal capacity deciles13. The chart offers evidence that
wealth-equalizing formulas such as Extraordinary Needs Aid and Educationally Related Support
Services Aid effectively target aid to school districts with high student poverty and/or low fiscal
capacity. They do so by increasing the number of pupils aided in these high need school
districts through an additional weighting for pupils from poverty backgrounds, with limited
English proficiency or coming from geographically sparse areas of the State. In most cases,
high poverty districts also have a low fiscal capacity. This pattern is broken in the case of New
York City, which has very high student poverty and average fiscal capacity. The case of New
York City points out that district wealth, not pupil need, is the dominant equalizer in present day
State Aid. As a result, the State is considering additional ways to increase student poverty as a
State Aid factor.
[insert Figure 1 about here]
New York State Education Department analysis of the concept of school district pupil
need has resulted in several conclusions that have guided Regents policy and legislative
recommendations. First, limited English proficiency is a significant, albeit small, factor in the
assessment of school district pupil need. It affects a small number of pupils, but these are
concentrated in a small number of school districts. The ability of such school districts to support
English as a second language programs is key to their meeting student achievement goals.
Second, a measure of student eligibility for K-6 free and reduced-price school lunch programs is
positively correlated with a number of measures of social and economic stress: five- to 17- year-
olds living in poverty, dropouts and a separate measure of non-graduates, the failure to attain
student achievement standards, adults living in poverty, female-headed households living in
13 Note that the authors use the need/fiscal capacity deciles to assess the distribution of State Aid in New York, but this measure is not used in the formulas.

14
poverty and public assistance.14 Third, achievement worsens and the cost of providing extra
help increases as the concentration of poverty grows.15 These findings have validated the use
of measures of K-6 free and reduced-price lunch eligibility and limited English proficiency in aid
distribution and the practice of providing increased aid for school districts with higher
concentrations of poverty. These findings have also prompted an extensive policy focus by the
State Board of Regents to target resources, State technical assistance, and the efforts of other
agencies to close the achievement gap, that is, the gap between student achievement and that
required to meet State learning standards.
However, these reforms were not fully affordable, so these and other aid formulas
created in 1993-94 were phased in through a transition adjustment that limited year-to-year
maximum increases to three percent in the first year.16 Moreover, this transition adjustment also
had a save-harmless provision that guaranteed that a district would not receive less aid in the
current year than it received in the base year. Therefore, although there are elements of reform
within these changes, they also illustrate tensions that remain in State education funding: long-
term transition rules and save-harmless provisions whose relation to present-day school district
need is dubious, but whose life has been extended in order to achieve distributive effects. The
1993-94 enactment of the transition adjustments is a case study of how politics have impacted
school finance. Because of the ability of the transition adjustments to adjust final aid
appropriations, Operating Aid became less important as a driver of aid. Then separate formulas
were needed to drive aid to specific purposes.
Another of the consequences inherent in New York’s political culture and, by extension,
State Aid—that of a strong tendency to spread the wealth—is illustrated by the following
example. The Regents proposed Extraordinary Needs Aid as a $200 million proposal to benefit
only six percent of the State’s districts. The Legislature, however, enacted a $335 million
14 Pearson correlations ranged from .42 to .70 in unpublished analyses made by the New York State Education Department’s Fiscal Analysis and Research Unit (1988). 15 See Myers 1986. 16 The cap was continued until 2001. It was modified in years following 1993 in relation to the level of the State’s allocation for education.

15
formula directing aid to virtually all districts and a lesser amount to those districts of concern to
the Regents.
During the mid and late 1990s, State Aid for schools grew at a faster rate than
previously, driven by increases in enrollment and operating expenditures as well as overall
State revenue and economic growth. The last three years of the decade yielded record
increases in State Aid each year. In 1997, the State enacted a Governor-proposed School Tax
Relief property tax reduction program, whereby the State exempts some of the property tax
costs of localities, with greater subsidy to seniors on fixed incomes. The State then reimburses
school districts for the forgone property tax revenues. This exemption has been phased in
gradually and currently provides approximately $2.8 billion in tax relief, or 15 percent of State
Aid to education.17
Another significant change in State Aid formulas at this time was that general Operating
Aid decreased as a share of total aid: it was 55.6 percent of the total at the beginning and
declined to 49.5 percent by the end of the decade. There was a strong thrust with regard to
investments in the educational infrastructure during the late 1990s. Significant targeting of
funds to textbooks, computer hardware and software, teacher support aids, and investment in
new building and renovation of existing facilities occurred.
Building Aid, along with Transportation Aid and Excess Cost Aid (for special education)
are examples of "spend-to-get" formulas, which grew as a share of State Aid during the 1990s.
These three aid categories constituted 22.5 percent of State Aid at the beginning of the decade
and grew to 29.5 percent of State Aid by the end of the decade. The Legislature may have
favored "spend-to-get" formulas because they provide incentives to districts to invest in their
infrastructure and in their students. Districts receive more aid as they increase their own
contribution in these areas. State budgeters, however, may resist open-ended percent
17 Chapter 53 of the New York State Laws of 2000 (also known as The Education, Labor, and Family Assistance Budget Bill).

16
reimbursement grants because of the difficulties involved in estimating, and hence budgeting
for, these expenditures.
Yet, even when open-ended matching aid is in place, districts do not always respond as
vigorously as expected. New York State's Building Aid formula offers a case in point. During
1998-99 and 1999-2000, added incentives were built into the Building Aid formula to encourage
capital construction. A regional cost factor was applied to Building Aid to reflect the higher cost
of doing business in certain parts of the State, particularly New York City and Long Island. Also,
during this period, the State enhanced Aid Ratios for building by an additional 10 percentage
points. This means that a district with a State Building Aid share of 80 percent of approved
costs before the incentive had a share of 90 percent with the incentive. In other words, such a
district's local share of approved construction costs would drop by half from 20 percent to 10
percent.18 Although many perceived capital construction needs to be great in the cities,
particularly New York City, the cities did not take advantage of the Building Aid incentive to the
same extent as did other school districts.
[insert Figure 2 about here]
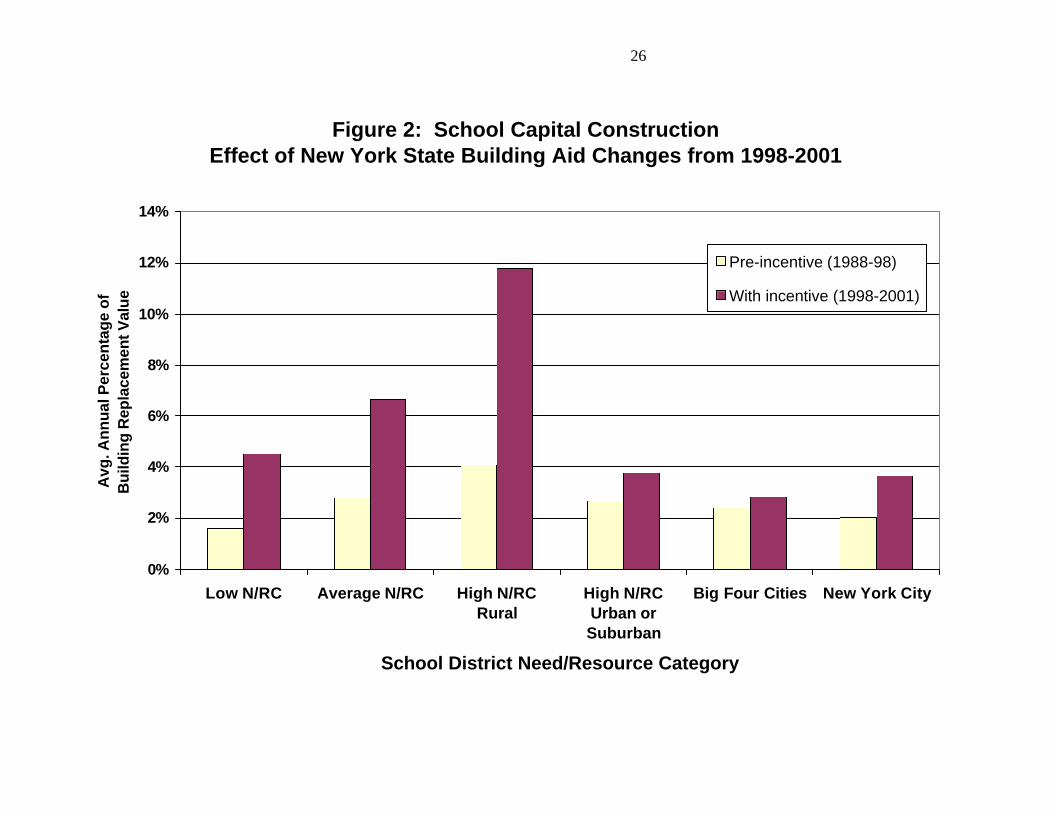
Figure 2 shows the construction rate19 of school facilities during the 10 years prior to the
incentive and during the first three years the incentives were in effect.20 The legislated Building
Aid ratios—and thus the price incentives—tended to be highest in the high need rural districts,
which responded vigorously to the incentive. Other types of districts, however, namely the high
need urban/suburban districts, the "Big Four Large City Districts" (Buffalo, Syracuse, Rochester,
and Yonkers), and New York City, did not respond nearly as much—although they did show
some increase in construction rates.
18 Building Aid Ratios vary by district. The State average is roughly 55 percent. 19 Construction rate is expressed as the average annual spending as a percent of cost of building replacement. The data have not been adjusted for inflation. 20 School districts are categorized into pupil need/resource capacity categories. Appendix A offers an explanation of these categories.
17
In general, their Building Aid Ratios also offered those districts considerable leveraging
power for their local construction dollars. Analysis of the Building Aid data is teaching us that
we need to learn more about what influences districts' responses to aid formulas containing
price incentives. Factors such as statutory debt service limits imposed on cities, district size,
local government decision-making processes, municipal budgeting practices, and the fiscal
dependency of large city school districts on municipal governments may contribute to
dampened responses to capital construction price incentives among some high need districts.
During the latter part of the 1990s, needs-based funding also took a very prominent role.
In addition to Extraordinary Needs Aid and Educationally Related Support Services Aid
described above, these formula interventions included Universal Pre-Kindergarten, Full-day
Kindergarten, and Early Grade Class Size Reduction. The final formula-based intervention
during the 1990s that is worth noting is that of Charter Schools. Charter Schools, which are
publicly funded, but released from many of the regulatory requirements of other schools, were
approved to operate in New York State in 1998. School districts in which the child resides are
required to pay the charter school an average spending level per child (approved operating
expense per total aidable pupil units for expense). The sending school district then continues to
receive State Aid for all pupils including charter school pupils.
The New Millennium
The tension between the political desire to spread aid out as widely as possible and to
better target aid to need was apparent in State budget negotiations for the 2001-02 school year.
The Governor and both houses of the Legislature included a recommendation in their separate
budget proposals to adjust Operating Aid to school districts by a regional cost factor. This was
considered in order to adjust State Aid for the actual cost of educating children, and not to
penalize school districts with higher costs of doing business. Subsequent to this, the Governor
raised concerns about the availability of resources, anticipating the possibility of an economic
recession. Terrorist attacks in New York City on September 11, 2001 further stressed the
State’s revenues while increasing costs. Final legislative action for 2001-02 did not include a

18
cost adjustment for schools. It created a budget for school districts that provided that the total
generated for each school district in the Governor’s budget recommendations be appropriated
to each school district without regard for individual formulas. So, despite initial discussions
aimed at improving the State’s ability to equalize aid, the final action, in the face of decreasing
tax revenues, provided much of State Aid without regard to formulas and need factors.
At the same time the State struggles in the face of an economic recession and increased
expenditures and reduced revenues resulting from the September 11 terrorist attacks, a case
challenging the constitutionality of the State’s school funding system is working its way through
the courts. Parents of New York City school children have alleged that the State’s funding
system has caused thousands of children to be denied access to the teachers, materials,
equipment, school facilities and extra help they need to be educated.21 The resolution of this
case may provide impetus for changing the aid system to achieve educational goals.
Ongoing Challenges: Data Quality
New York State’s program of education reform has depended on three major initiatives:
raising educational standards and creating new assessments, building school capacity to meet
the standards, and developing institutional accountability through the public reporting of results.
Public reporting of student results has been accomplished with annual school report cards that
have compared individual school districts results with other similar districts on the basis of
poverty, size and geographical criteria. As the State Education Department has continued to
make student results public, the data have improved as districts continue to work to make them
as accurate as possible. This process has contributed to an interest in ways in which to
maximize the quality of data used both for assessment and school finance purposes.
Accountability and equity demand that the State use current, valid and accurate data on
local finances, district demographics, and student performance indicators that can be compared
across all school districts in the State. Yet sometimes it is impossible to have it both ways: in
21 Campaign for Fiscal Equity versus New York State, Supreme Court decision in favor of the plaintiffs, January 10, 2001.

19
order to ensure accuracy, we generally have "traded off" some currency. For example, current-
year (State Fiscal Year 2001-02) formulas use two-year-old pupil counts and three-year-old data
on property values.
New York State provides almost $14 billion in State Aid to the State's public schools; that
sum is allocated primarily on the basis of information provided by school districts themselves.
Federal aid is also contingent upon compliance with specific assessment, reporting, and
accountability requirements. If aid is to be distributed appropriately, all of that information must
be accurate and verifiable. In order to ensure this, the State Education Department staff must
implement a rigorous data quality assurance program. Auditing must be an integral part of the
data collection process.
Over the past 20 years, advances in data management and computing technology have
increased our capacity to gather and analyze data. Recently, the State decided to create an
individual student record system. This will help us study the "value-added" through education in
very specific ways. We will be able to reduce our reliance on measures correlated with low
performance (and thus high need) and learn more about what works (and what does not).
Looking at schools and districts that succeed despite their need and/or their fiscal capacity
could help us find ways to improve student achievement across the State. At the same time,
gathering such detailed data has raised issues of confidentiality and access. Balancing our
need to understand what works with the right to privacy poses yet another challenge for
education policymakers.
Implications for Federal Funding Formulas
The fact that no mention of a Federal role in education was included in the United States
Constitution makes it clear that the primary responsibility for education resides with the states in
partnership with localities. A limited Federal role has been reaffirmed over the years by a
number of Supreme Court and lower court decisions and congressional actions.
Given the Federal government's limited responsibility for public education, it is not
surprising that Federal funding is a small, though significant, part of the education finance
20
picture in New York State. Figure 3 shows the portions of total education revenue per pupil by
source. The figures are district averages (or means rather than pupil-weighted means). While
federal funds make up a small portion of education spending, they comprise a greater share of
aid for high-need districts. State funding is also need equalizing. Districts tend to receive more
State Aid as their need (as measured by the Need/Fiscal Capacity Index (NFCI)) increases.22
New York City is something of an exception; it provides more local support for schools than
most districts in its need decile. Figure 3 also distinguishes STAR tax relief payments from
school aid. The STAR program provides tax relief in relation to the value of residential property.
Properties with higher value receive more tax relief.
[insert Figure 3 about here]
The Federal role has evolved with time. From colonial days to the 1960s, the primary
Federal concern was to ensure an educated population, as a way of promoting civic, national
defense, and economic interests. The 1960s civil rights movement led to the development of
Great Society programs to help disadvantaged students, including enactment of the Elementary
and Secondary Education (ESEA) and Higher Education Acts, and, in the 1970s, the Education
of the Handicapped Act. A broader social consciousness led Washington to supplement state
and local efforts in trying to target aid more to pockets of need while seeking to provide more
and better educational opportunities.
For New York and other states, programs under ESEA’s Title I provide the largest pot of
Federal money for elementary and secondary education, funneling financial assistance through
state education agencies to school districts and schools with the most poor children to help
ensure that all of them meet challenging state academic standards. Title I provides perhaps the
clearest Federal example of how the political conflict plays out in a mostly unresolved manner
between targeting money to need and ensuring that almost every school gets funded.
22 The NFCI is a ratio of a district's student need to its fiscal capacity. It is calculated by adding the percentage of a district's limited English proficient students and the percentage of students on free or reduced-price lunch and dividing that total by the sum of the state average percentages for those measures. This figure is then divided by the district's Combined Wealth Ratio (used as a measure of

21
New York State received over $803 million under Title I in Federal fiscal year 2001 for
two types of grants: the basic grant ($670 million) and the concentration grant ($133 million).
Title I provides the basic grant to school districts with poverty greater than two percent; it
provides concentration grants to school districts with poverty greater than 15 percent. Ninety-
seven percent of the State’s school districts qualify for the basic grant (and receive 83 percent
of Title I funds), and 53 percent of districts qualify for the concentration grant (and receive 17
percent of Title I funds).
There has been a concerted effort over the years to target Title I funding more to low-
income students but progress generally has depended on an overall larger amount of money
being made available, i.e., no existing money is diverted. Poverty concentration factors were
built into the allocation process. More targeting proposals are being introduced. Despite these
efforts, in federal fiscal year 2003 roughly 40 percent of potentially eligible students remain
unserved23, although recent formula changes will phase-in coverage of a larger percent of
eligible students. Hence, the debate and proposals for change will and should continue in trying
to achieve an equitable balance between students' needs and political efficacy.
As an associated concern, the Federal government should be proactive in providing
accurate data for making such policy and funding decisions by gathering, analyzing and
synthesizing national information on K-12 performance and funding practices. It should invest
more in efforts to improve the quality and currency of education data collected by the states.
However, federal authorities also must be mindful of the burdens it imposes on states for
data collection and reporting. Despite the virtues of policy objectives, many observers contend
that Federal programs contain mandates that legally exceed the proper Federal role and intrude
upon state and local authority. Certainly, accountability and the value of good data justify
appropriate data collection and reporting, but Federal requirements should be accompanied by
fiscal capacity). See Appendix A for a description of the Combined Wealth Ratio. The NFCI is similar to the Need/Resource Index, which is used in some school aid formulas.
22
commensurate aid to help states comply. Good data is an asset; both the Federal government
and the states need to make the investments necessary to gather, store, and use it effectively.
23 CRS Report for Congress (Order Code RL30491) Education for the Disadvantaged: ESEA Title I Allocation Formula Provisions, dated January 8, 2001, page CRS-4. Received through the CRS Web (http://www.house.gov/htbin/crsprodget?/rl/RL30491)

23
REFERENCES
Fisher, Ronald C. and Leslie E. Papke, Local government responses to education grants, National Tax Journal 53 (1): 163.
Myers, David E. The relationship between school poverty concentration and students’ reading and math achievement and learning. National Institute of Education contract with Decision Resources Corporation, 1985. Cited in: Poverty, achievement and the distribution of compensatory education services. Office of Educational Research and Improvement, U.S. Department of Education, Office of Research, 1986. New York State Division of the Budget, Education Unit, Description of 1979-80 New York State School Aid Programs, Fall, 1979.
New York State Division of the Budget, Education Unit, Description of 1989-90 New York State School Aid Programs, September 28, 1989.
New York State Division of the Budget, Education Unit, Description of 1990-91 New York State School Aid Programs, Fall 1990.
New York State Division of the Budget, Education Unit, Description of 1999-2000 New York State School Aid Programs, Fall 2000.
New York State Education Department, Report of the Expanded Tax Base Study, January 1981.
New York State School Finance Law Study Project, Occasional Paper number 14: Development of Public School Finance in New York State, April 1978.
New York State School Finance Law Study Product, Occasional Paper number 14: Development of Public School Finance in New York State, April 1978.

24
Appendix A
The Need/Resource Capacity Category Definitions
The Need/Resource Capacity Index, a measure of a district's ability to meet the needs of its students with local resources, is the ratio of the estimated poverty percentage (expressed in standard score form) to the Combined Wealth Ratio (expressed in standard score form). The estimated poverty percentage is a weighted average of the 1998-99 and 1999-2000 kindergarten through grade 6 percentage of students eligible for free or reduced-price lunch. The result is a measure that approximates the percentage of children eligible for free- or reduced-price lunches. The Combined Wealth Ratio is the ratio of district wealth per pupil to the State average wealth per pupil used to distribute 1998-99 aid. The measure of district wealth is an equally weighted combination of district property wealth (100 percent of full valuation per pupil) and income per weighted pupil. (Pupils are weighted by need. The need measure includes limited English proficiency, eligibility for free or reduced-price lunch, and geographic sparsity.)
A district with both an estimated poverty level and a Combined Wealth Ratio equal to the State average would have a need/resource capacity index of 1.0. Need/Resource Capacity (N/RC) categories are created from this index using the definitions in Table 1 below. Table 1: Need/Resource Categories Need/Resource Capacity Category
Number of Districts
Definition
High N/RC Districts
New York City 1 New York City
Large City Districts 4 Buffalo, Rochester, Syracuse, Yonkers
Urban-Suburban 38 All districts at or above the 70th percentile (1.1855) which meet on of the following conditions: 1) more than 100 students per square mile; or 2) have an enrollment greater than 2,500 and more than 50 students per square mile.
Rural 163 All districts at or above the 70th percentile (1.1855) which meet one of two conditions: 1) fewer than 50 students per square mile, or 2) fewer than 100 students per square mile and an enrollment of 2500 or less.
Average N/RC Districts 340 All districts between the 20th (0.7693) and 70th (1.1855) percentiles on the index.
Low N/RC Districts 134 All districts below the 20th percentile (0.7693) on the index.

25
Figure 1. Average State Aid Per Enrolled Pupil (2000-2001) by Need/Fiscal Capacity Deciles
$1,442
$2,184
$4,259
$5,224$5,576
$3,969
$6,316
$3,287
$3,805
$2,759
$4,714
$0
$1,000
$2,000
$3,000
$4,000
$5,000
$6,000
$7,000
1 2 3 4 5 6 7 8 9 NYC 10
NFC deciles
Sta
te a
id p
er p
up
il
Lower need/Higher wealth Lower wealth/Higher need
26
Figure 2: School Capital Construction Effect of New York State Building Aid Changes from 1998-2001
0%
2%
4%
6%
8%
10%
12%
14%
Low N/RC Average N/RC High N/RCRural
High N/RCUrban orSuburban
Big Four Cities New York City
School District Need/Resource Category
Avg
. An
nu
al P
erce
nta
ge
of
Bui
ldin
g R
epla
cem
ent V
alue
Pre-incentive (1988-98)
With incentive (1998-2001)

27
$0
$2,000
$4,000
$6,000
$8,000
$10,000
$12,000
$14,000
$16,000
Do
llars
Per
Pu
pil
1 2 3 4 5 6 7 8 9 10 NYC
Need/Fiscal Capacity Decile
Figure 3. Average Total Education Revenue Per Pupil From State, Local and Federal Sources by Need/Fiscal Capacity Index Decile (1999-2000)
Local Revenue Per Pupil
Revenue From STAR Per Pupil
State Revenue Per Pupil
Federal Revenue Per Pupil
High Need Low Need (9th Decile)