n12/4/envso/sp1/eng/tz0/xx - projects'...
TRANSCRIPT

19 pages
N12/4/ENVSO/SP1/ENG/TZ0/XX
Tuesday 13 November 2012 (afternoon)
ENVIRONMENTAL SYSTEMS AND SOCIETIESSTANDARD LEVELPAPER 1
INSTRUCTIONS TO CANDIDATES
• Write your session number in the boxes above.• Do not open this examination paper until instructed to do so.• Answer all questions.• Write your answers in the boxes provided.• A calculator is required for this paper.• The maximum mark for this examination paper is [45 marks].
1 hour
© International Baccalaureate Organization 2012
Candidate session number
0 0
Examination code
8 8 1 2 – 6 3 0 1
0120
88126301

– 2 – N12/4/ENVSO/SP1/ENG/TZ0/XX
Please do not write on this page.
Answers written on this page will not be marked.
0220

– 3 –
Turn over
N12/4/ENVSO/SP1/ENG/TZ0/XX
1. Figure 1 shows how vegetation changes with altitude in the Andean mountain chain in South America.
Figure 1A
ltitu
de /
m
5000
4000
3000
2000
1000
0
permanent snow almost no vegetation alpine meadows Andean dwarf forest (shorter trees)
cloud forest with numerous ferns dense forest with 25 m trees tropical rainforest
[Source: Zonation of the vegetation belts in the South American Andes presently and during the climatic minimum of the last continental glaciation of the northern hemisphere – when each of the zones was about 1,200 m lower. (After Perlmutter, M. A. and Matthews, M. D., 1990, Global cyclostratigraphy – a model, in Cross, T. A., ed., Quantitative dynamic stratigraphy: Prentice Hall,
Englewood Cliffs, New Jersey, pp. 233–260.]
(a) State the term for the pattern of vegetation shown in Figure 1. [1]
. . . . . . . . . . . . . . . . . . . . . . . . . . . . . . . . . . . . . . . . . . . . . . . . . . . . . . . . . . . . . . . . . . . . . . .
(b) Identify two limiting factors affecting the vegetation in the alpine meadows. [2]
. . . . . . . . . . . . . . . . . . . . . . . . . . . . . . . . . . . . . . . . . . . . . . . . . . . . . . . . . . . . . . . . . . . . . . . . . . . . . . . . . . . . . . . . . . . . . . . . . . . . . . . . . . . . . . . . . . . . . . . . . . . . . . . . . . . . . . . . . . . . . . . . . . . . . . . . . . . . . . . . . . . . . . . . . . . . . . . . . . . . . . . . . . . . . . . . . . . . . . . . . . . . . . . . . . . . . . . . . . . . . . . . . . . . . . . . . . . . . . . . . . . . . . . . . . . . . . . . . . . . . . . . . . . . . . . . . . . . . . . . . . . .
(c) Suggest one way in which the pattern of vegetation shown in Figure 1 might change as a result of global warming. [1]
. . . . . . . . . . . . . . . . . . . . . . . . . . . . . . . . . . . . . . . . . . . . . . . . . . . . . . . . . . . . . . . . . . . . . . . . . . . . . . . . . . . . . . . . . . . . . . . . . . . . . . . . . . . . . . . . . . . . . . . . . . . . . . . . . . . . . . . . . . . . . .
0320

– 4 – N12/4/ENVSO/SP1/ENG/TZ0/XX
2. Figure 2 shows Japanese Knotweed (Fallopia japonica), a large plant native to eastern Asia. It is an invasive species that has been successful in colonizing North America and Europe. The most effective method of control of Japanese Knotweed is by herbicide application.
[Source: adapted from Wikipedia.]
Figure 2
[Source: © MdE at Wikimedia Commons, CC-BY-SA 3.0 Germanhttp://de.wikipedia.org/wiki/Benutzer:MdE
http://en.wikipedia.org/wiki/File:Fallopia_japonica_MdE_2.jpg]]
(a) JapaneseKnotweedcanbedescribedasapioneerspecies.Definethetermpioneer species. [1]
. . . . . . . . . . . . . . . . . . . . . . . . . . . . . . . . . . . . . . . . . . . . . . . . . . . . . . . . . . . . . . . . . . . . . . . . . . . . . . . . . . . . . . . . . . . . . . . . . . . . . . . . . . . . . . . . . . . . . . . . . . . . . . . . . . . . . . . . . . . . . .
(b) State one impact of an invasive species on the functioning of an aquatic ecosystem. [1]
. . . . . . . . . . . . . . . . . . . . . . . . . . . . . . . . . . . . . . . . . . . . . . . . . . . . . . . . . . . . . . . . . . . . . . . . . . . . . . . . . . . . . . . . . . . . . . . . . . . . . . . . . . . . . . . . . . . . . . . . . . . . . . . . . . . . . . . . . . . . . .
(This question continues on the following page)
0420

– 5 –
Turn over
N12/4/ENVSO/SP1/ENG/TZ0/XX
(Question 2 continued)
(c) Outline two problems caused by the use of herbicides to control invasive species such as Japanese Knotweed. [2]
. . . . . . . . . . . . . . . . . . . . . . . . . . . . . . . . . . . . . . . . . . . . . . . . . . . . . . . . . . . . . . . . . . . . . . . . . . . . . . . . . . . . . . . . . . . . . . . . . . . . . . . . . . . . . . . . . . . . . . . . . . . . . . . . . . . . . . . . . . . . . . . . . . . . . . . . . . . . . . . . . . . . . . . . . . . . . . . . . . . . . . . . . . . . . . . . . . . . . . . . . . . . . . . . . . . . . . . . . . . . . . . . . . . . . . . . . . . . . . . . . . . . . . . . . . . . . . . . . . . . . . . . . . . . . . . . . . . . . . . . . . . .
0520

– 6 – N12/4/ENVSO/SP1/ENG/TZ0/XX
3. Figure 3 shows rates of net primary productivity (NPP) for different biomes around the world.
Figure 3
Net primary productivity (kg–C /m2/year)
0.3 0.6 0.9 1.20[Source: Used with permission from the Center for Sustainability and the Global Environment (SAGE),
Nelson Institute for Environmental Studies, University of Wisconsin-Madison, USA.]
(a) Definethetermnet primary productivity. [1]
. . . . . . . . . . . . . . . . . . . . . . . . . . . . . . . . . . . . . . . . . . . . . . . . . . . . . . . . . . . . . . . . . . . . . . . . . . . . . . . . . . . . . . . . . . . . . . . . . . . . . . . . . . . . . . . . . . . . . . . . . . . . . . . . . . . . . . . . . . . . . .
(b) Explain why rates of net primary productivity are higher in some parts of the planet than others. [2]
. . . . . . . . . . . . . . . . . . . . . . . . . . . . . . . . . . . . . . . . . . . . . . . . . . . . . . . . . . . . . . . . . . . . . . . . . . . . . . . . . . . . . . . . . . . . . . . . . . . . . . . . . . . . . . . . . . . . . . . . . . . . . . . . . . . . . . . . . . . . . . . . . . . . . . . . . . . . . . . . . . . . . . . . . . . . . . . . . . . . . . . . . . . . . . . . . . . . . . . . . . . . . . . . . . . . . . . . . . . . . . . . . . . . . . . . . . . . . . . . . . . . . . . . . . . . . . . . . . . . . . . . . . . . . . . . . . . . . . . . . . . . . . . . . . . . . . . . . . . . . . . . . . . . . . . . . . . . . . . . . . . . . . . . . . . . . . . . . . . . . . . . . . . . . . . . . . . . . . . . . . . . . . . . . . . . . . . . . . . . . . . . . . . . . . . . . . . . . . . . . . . . . . . . . . . . . . . . . . . . . . . . . .
(This question continues on the following page)
0620

– 7 –
Turn over
N12/4/ENVSO/SP1/ENG/TZ0/XX
(Question 3 continued)
(c) Suggest two ecological reasons why certain ecosystems are considered more biologicallysignificantthanothers. [2]
. . . . . . . . . . . . . . . . . . . . . . . . . . . . . . . . . . . . . . . . . . . . . . . . . . . . . . . . . . . . . . . . . . . . . . . . . . . . . . . . . . . . . . . . . . . . . . . . . . . . . . . . . . . . . . . . . . . . . . . . . . . . . . . . . . . . . . . . . . . . . . . . . . . . . . . . . . . . . . . . . . . . . . . . . . . . . . . . . . . . . . . . . . . . . . . . . . . . . . . . . . . . . . . . . . . . . . . . . . . . . . . . . . . . . . . . . . . . . . . . . . . . . . . . . . . . . . . . . . . . . . . . . . . . . . . . . . . . . . . . . . . .
(d) Outline one human activity threatening a namedareaofbiologicalsignificance. [1]
. . . . . . . . . . . . . . . . . . . . . . . . . . . . . . . . . . . . . . . . . . . . . . . . . . . . . . . . . . . . . . . . . . . . . . . . . . . . . . . . . . . . . . . . . . . . . . . . . . . . . . . . . . . . . . . . . . . . . . . . . . . . . . . . . . . . . . . . . . . . . . . . . . . . . . . . . . . . . . . . . . . . . . . . . . . . . . . . . . . . . . . . . . . . . . . . . . . . . . . . . . . . . . . . . . . . . . . . . . . . . . . . . . . . . . . . . . . . . . . . . . . . . . . . . . . . . . . . . . . . . . . . . . . . . . . . . . . . . . . . . . . .
0720

– 8 – N12/4/ENVSO/SP1/ENG/TZ0/XX
4. Figure 4 shows changes in world grain production and consumption between 1960 and 2006.
Figure 4
grai
n / m
illio
n to
nnes
2500
2000
1500
1000
500
0
Key:
Production
Consumption
1960 1970 1980 1990 2000 2010
Year[Source: http://www.jennifermarohasy.com/blog/archives/2006_ProductionConsumption.gif
U.S. Department of Agriculture.]
(a) Calculate the percentage increase in grain production between 1967 and 2005. [1]
. . . . . . . . . . . . . . . . . . . . . . . . . . . . . . . . . . . . . . . . . . . . . . . . . . . . . . . . . . . . . . . . . . . . . . . . . . . . . . . . . . . . . . . . . . . . . . . . . . . . . . . . . . . . . . . . . . . . . . . . . . . . . . . . . . . . . . . . . . . . . .
(This question continues on the following page)
0820
– 9 –
Turn over
N12/4/ENVSO/SP1/ENG/TZ0/XX
(Question 4 continued)
(b) Construct a simple diagram to show three inputs that can lead to increases in two outputs in a food production system. [3]
(c) Outline two negative environmental impacts of increasing food production. [2]
. . . . . . . . . . . . . . . . . . . . . . . . . . . . . . . . . . . . . . . . . . . . . . . . . . . . . . . . . . . . . . . . . . . . . . . . . . . . . . . . . . . . . . . . . . . . . . . . . . . . . . . . . . . . . . . . . . . . . . . . . . . . . . . . . . . . . . . . . . . . . . . . . . . . . . . . . . . . . . . . . . . . . . . . . . . . . . . . . . . . . . . . . . . . . . . . . . . . . . . . . . . . . . . . . . . . . . . . . . . . . . . . . . . . . . . . . . . . . . . . . . . . . . . . . . . . . . . . . . . . . . . . . . . . . . . . . . . . . . . . . . . .
(d) Explain how the size of the ecological footprint of individuals may be affected by their diet. [2]
. . . . . . . . . . . . . . . . . . . . . . . . . . . . . . . . . . . . . . . . . . . . . . . . . . . . . . . . . . . . . . . . . . . . . . . . . . . . . . . . . . . . . . . . . . . . . . . . . . . . . . . . . . . . . . . . . . . . . . . . . . . . . . . . . . . . . . . . . . . . . . . . . . . . . . . . . . . . . . . . . . . . . . . . . . . . . . . . . . . . . . . . . . . . . . . . . . . . . . . . . . . . . . . . . . . . . . . . . . . . . . . . . . . . . . . . . . . . . . . . . . . . . . . . . . . . . . . . . . . . . . . . . . . . . . . . . . . . . . . . . . . .
0920
– 10 – N12/4/ENVSO/SP1/ENG/TZ0/XX
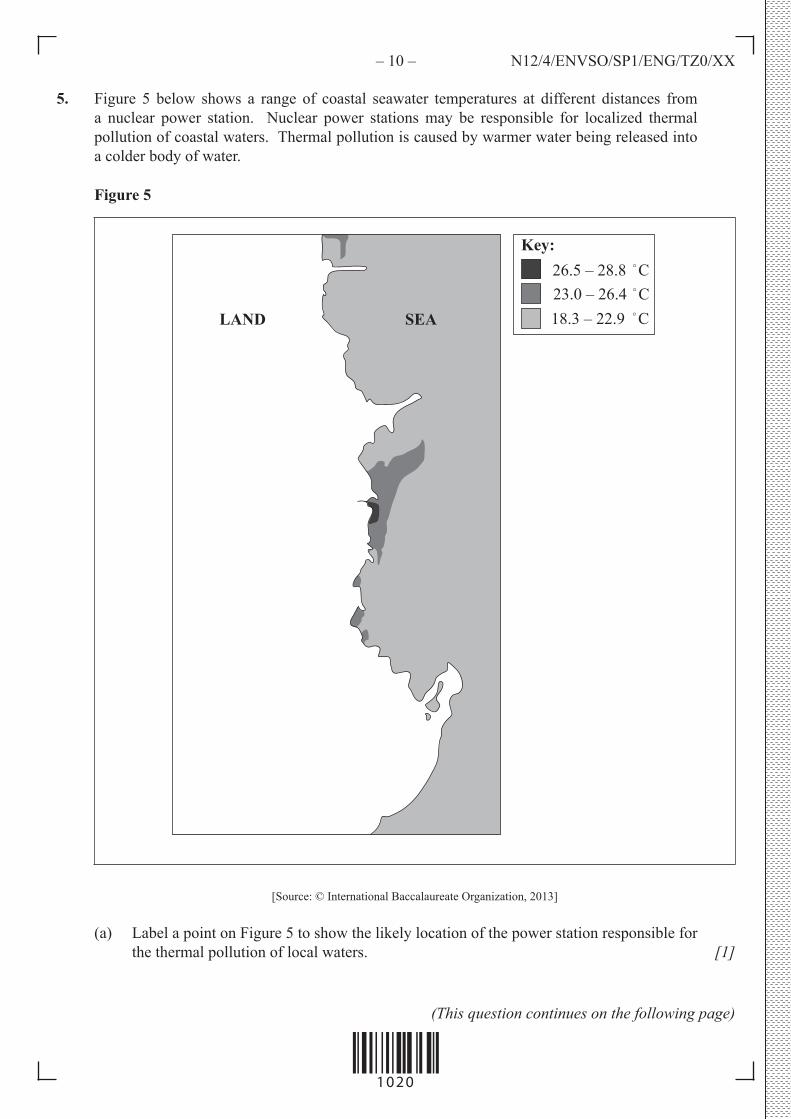
5. Figure 5 below shows a range of coastal seawater temperatures at different distances from a nuclear power station. Nuclear power stations may be responsible for localized thermal pollution of coastal waters. Thermal pollution is caused by warmer water being released into a colder body of water.
Figure 5
26.5 – 28.8 23.0 – 26.4 18.3 – 22.9
Key:�C�C�CLAND SEA
[Source: © International Baccalaureate Organization, 2013]
(a) Label a point on Figure 5 to show the likely location of the power station responsible for the thermal pollution of local waters. [1]
(This question continues on the following page)
1020

– 11 –
Turn over
N12/4/ENVSO/SP1/ENG/TZ0/XX
(Question 5 continued)
(b) Thermal pollution lowers the dissolved oxygen content of water. Suggest the effect of this on a named transformation process. [2]
. . . . . . . . . . . . . . . . . . . . . . . . . . . . . . . . . . . . . . . . . . . . . . . . . . . . . . . . . . . . . . . . . . . . . . . . . . . . . . . . . . . . . . . . . . . . . . . . . . . . . . . . . . . . . . . . . . . . . . . . . . . . . . . . . . . . . . . . . . . . . . . . . . . . . . . . . . . . . . . . . . . . . . . . . . . . . . . . . . . . . . . . . . . . . . . . . . . . . . . . . . . . . . . . . . . . . . . . . . . . . . . . . . . . . . . . . . . . . . . . . . . . . . . . . . . . . . . . . . . . . . . . . . . . . . . . . . . . . . . . . . . .
(c) Identify one local factor which can affect the choice of pollution management strategy, and one national factor. An international factor has been shown as an example. [2]
Factor affecting choice of pollution management strategy
International International agreements to set targets to reduce amounts of atmospheric pollutants that can be released.
Local
. . . . . . . . . . . . . . . . . . . . . . . . . . . . . . . . . . . . . . . . . . . . . . . . . . . .
. . . . . . . . . . . . . . . . . . . . . . . . . . . . . . . . . . . . . . . . . . . . . . . . . . . .
National
. . . . . . . . . . . . . . . . . . . . . . . . . . . . . . . . . . . . . . . . . . . . . . . . . . . .
. . . . . . . . . . . . . . . . . . . . . . . . . . . . . . . . . . . . . . . . . . . . . . . . . . . .
(This question continues on the following page)
1120

– 12 – N12/4/ENVSO/SP1/ENG/TZ0/XX
(Question 5 continued)
(d) International agreements are one way in which governments can respond to environmental problems. In the table below, state the issue to which each agreement relates. [2]
Agreement Issue
Montreal protocol . . . . . . . . . . . . . . . . . . . . . . . . . . . . . . . . . . . . . . . . . . . . . . . .
Kyoto protocol . . . . . . . . . . . . . . . . . . . . . . . . . . . . . . . . . . . . . . . . . . . . . . . .
CITES . . . . . . . . . . . . . . . . . . . . . . . . . . . . . . . . . . . . . . . . . . . . . . . .
1220

– 13 –
Turn over
N12/4/ENVSO/SP1/ENG/TZ0/XX
Please do not write on this page.
Answers written on this page will not be marked.
1320

– 14 – N12/4/ENVSO/SP1/ENG/TZ0/XX
6. Figure6belowshowsdataontheriskstolifeandpropertybycoastalfloodinginseveralmajorcities as a result of global warming.
Figure 6
Country City at riskEstimated number of citizens at risk /
thousands
Estimated value of property at risk /
billion dollarsIndia Mumbai (Bombay) 2787 46.20
China Guangzhou 2718 84.17
China Shanghai 2353 72.86
USA Miami 2003 416.29
Vietnam Ho Chi Minh City 1931 26.86
India Kolkata (Calcutta) 1929 31.99
USA New York-Newark 1540 320.20
Egypt Alexandria 1330 28.46
Japan Tokyo 1110 174.29
China Tianjin 956 29.62
Thailand Bangkok 907 38.72
[Source:‘Rankingoftheworld’scitiesmostexposedtocoastalfloodingtodayandinthefuture.Executivesummary’ Table 1 © OECD, 2007.]
(a) Identify two patterns in the data. [2]
. . . . . . . . . . . . . . . . . . . . . . . . . . . . . . . . . . . . . . . . . . . . . . . . . . . . . . . . . . . . . . . . . . . . . . . . . . . . . . . . . . . . . . . . . . . . . . . . . . . . . . . . . . . . . . . . . . . . . . . . . . . . . . . . . . . . . . . . . . . . . . . . . . . . . . . . . . . . . . . . . . . . . . . . . . . . . . . . . . . . . . . . . . . . . . . . . . . . . . . . . . . . . . . . . . . . . . . . . . . . . . . . . . . . . . . . . . . . . . . . . . . . . . . . . . . . . . . . . . . . . . . . . . . . . . . . . . . . . . . . . . . .
(This question continues on the following page)
1420

– 15 –
Turn over
N12/4/ENVSO/SP1/ENG/TZ0/XX
(Question 6 continued)
(b) Suggest two reasons why less economically developed countries (LEDCs) are more vulnerable to the effects of coastal inundation than more economically developed countries (MEDCs). [2]
. . . . . . . . . . . . . . . . . . . . . . . . . . . . . . . . . . . . . . . . . . . . . . . . . . . . . . . . . . . . . . . . . . . . . . . . . . . . . . . . . . . . . . . . . . . . . . . . . . . . . . . . . . . . . . . . . . . . . . . . . . . . . . . . . . . . . . . . . . . . . . . . . . . . . . . . . . . . . . . . . . . . . . . . . . . . . . . . . . . . . . . . . . . . . . . . . . . . . . . . . . . . . . . . . . . . . . . . . . . . . . . . . . . . . . . . . . . . . . . . . . . . . . . . . . . . . . . . . . . . . . . . . . . . . . . . . . . . . . . . . . . .
(c) State two reasons why global warming may lead to rises in sea levels. [1]
. . . . . . . . . . . . . . . . . . . . . . . . . . . . . . . . . . . . . . . . . . . . . . . . . . . . . . . . . . . . . . . . . . . . . . . . . . . . . . . . . . . . . . . . . . . . . . . . . . . . . . . . . . . . . . . . . . . . . . . . . . . . . . . . . . . . . . . . . . . . . . . . . . . . . . . . . . . . . . . . . . . . . . . . . . . . . . . . . . . . . . . . . . . . . . . . . . . . . . . . . . . . . . . . . . . . . . . . . . . . . . . . . . . . . . . . . . . . . . . . . . . . . . . . . . . . . . . . . . . . . . . . . . . . . . . . . . . . . . . . . . . .
(d) State onereasonwhyitisdifficulttomeasurechangesinsealevelaccurately. [1]
. . . . . . . . . . . . . . . . . . . . . . . . . . . . . . . . . . . . . . . . . . . . . . . . . . . . . . . . . . . . . . . . . . . . . . . . . . . . . . . . . . . . . . . . . . . . . . . . . . . . . . . . . . . . . . . . . . . . . . . . . . . . . . . . . . . . . . . . . . . . . .
(This question continues on the following page)
1520

– 16 – N12/4/ENVSO/SP1/ENG/TZ0/XX
(Question 6 continued)
(e) Explain one effect of coastal inundation on each of the following: [4]
(i) coastal ecosystems
. . . . . . . . . . . . . . . . . . . . . . . . . . . . . . . . . . . . . . . . . . . . . . . . . . . . . . . . . . . . . . . . . . . . . . . . . . . . . . . . . . . . . . . . . . . . . . . . . . . . . . . . . . . . . . . . . . . . . . . . . . . . . . . . . . . .
(ii) human health
. . . . . . . . . . . . . . . . . . . . . . . . . . . . . . . . . . . . . . . . . . . . . . . . . . . . . . . . . . . . . . . . . . . . . . . . . . . . . . . . . . . . . . . . . . . . . . . . . . . . . . . . . . . . . . . . . . . . . . . . . . . . . . . . . . . .
1620

– 17 –
Turn over
N12/4/ENVSO/SP1/ENG/TZ0/XX
Please do not write on this page.
Answers written on this page will not be marked.
1720
– 18 – N12/4/ENVSO/SP1/ENG/TZ0/XX
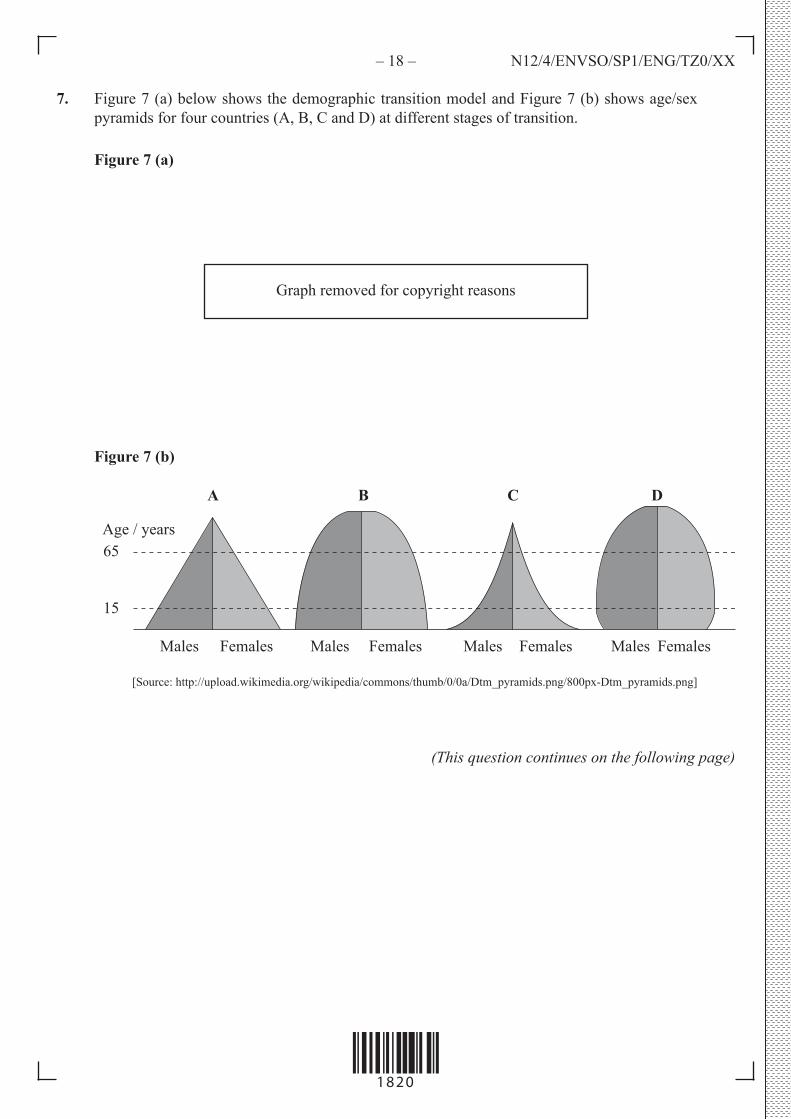
7. Figure 7 (a) below shows the demographic transition model and Figure 7 (b) shows age/sex pyramids for four countries (A, B, C and D) at different stages of transition.
Figure 7 (a)
Figure 7 (b)
A B C D
65
15
Males Females Males Females Males Females Males Females
Age / years
[Source: http://upload.wikimedia.org/wikipedia/commons/thumb/0/0a/Dtm_pyramids.png/800px-Dtm_pyramids.png]
(This question continues on the following page)
1820
Graph removed for copyright reasons

– 19 –
Turn over
N12/4/ENVSO/SP1/ENG/TZ0/XX
(Question 7 continued)
(a) Determine the stage of demographic transition represented by each age/sex pyramid. [2]
Pyramid Stage of demographic transition
A . . . . . . . . . . . . . . . . . . . . . . . . . . . . .
B . . . . . . . . . . . . . . . . . . . . . . . . . . . . .
C . . . . . . . . . . . . . . . . . . . . . . . . . . . . .
D . . . . . . . . . . . . . . . . . . . . . . . . . . . . .
(b) State the term used to describe the number of people that can be supported by a given environment. [1]
. . . . . . . . . . . . . . . . . . . . . . . . . . . . . . . . . . . . . . . . . . . . . . . . . . . . . . . . . . . . . . . . . . . . . . .
(c) Explain three ways in which the number of people supported within an area may be increased. [3]
. . . . . . . . . . . . . . . . . . . . . . . . . . . . . . . . . . . . . . . . . . . . . . . . . . . . . . . . . . . . . . . . . . . . . . . . . . . . . . . . . . . . . . . . . . . . . . . . . . . . . . . . . . . . . . . . . . . . . . . . . . . . . . . . . . . . . . . . . . . . . . . . . . . . . . . . . . . . . . . . . . . . . . . . . . . . . . . . . . . . . . . . . . . . . . . . . . . . . . . . . . . . . . . . . . . . . . . . . . . . . . . . . . . . . . . . . . . . . . . . . . . . . . . . . . . . . . . . . . . . . . . . . . . . . . . . . . . . . . . . . . . . . . . . . . . . . . . . . . . . . . . . . . . . . . . . . . . . . . . . . . . . . . . . . . . . . . . . . . . . . . . . . . . . . . . . . . . . . . . . . . . . . . . . . . . . . . . . . . . . . . . . . . . . . . . . . . . . . . . . . . . . . . . . . . . . . . . . . . . . . . . . . .
1920

Please do not write on this page.
Answers written on this page will not be marked.
2020