n6z m803 - defense technical information center · n6z m803 report 315 trt i- o q. i ... et les...
TRANSCRIPT

N6Z M803 REPORT 315
trt
I- o Q.
I
ADVISORY GROUP FOR AERONAUTICAL RESEARCH AND DEVELOPMENT
64 RUE DE VARENNE. PARIS VII
7 REPORT 315
CO CO
FLIGHT TESTING OF THE FIAT G9I
G. CIAMPOUNI
APRIL 1961 n D ' •
0EC6 19».
^
LJQL A
•
NORTH ATLANTIC TREATY ORGANISATION
Reproduced by the CLEARINGHOUSE
for Federal Scientific & Technical Information Springfield Va. 22151 3\

REPORT 315
NORTH ATLANTIC TREATY ORGANIZATION
ADVISORY GROUP FOR AERONAUTICAL RESEARCH AND DEVELOPMENT
PLIGHT TESTING OP THE FIAT G 91
by
G. Ciampollnl
This Report was presented at the Nineteenth Meeting of the AGARD Flight Mechanics Panel, held from 17-19 April 1961 in Paris, France

SUMMARY
-The report is a summarized description of the G 91 flight testing, with special reference to the test methods, flying technique, recording devices and flight data processing. General Information on the test planning, on the number of aircraft actually used during the tests and on the airborne test equipment and ground testing facilities are given. The correlation aspects between flight, wind tunnel and design results are emphasized as a basic guidance in the approach to some flight mechanics problems; typical examples of such a correlation are illustrated. The beneficial cooperation by several research organizations on the highest level, from different countries belonging to the NATO area, has been given special emphasis.
SOMMAIRE
Le rapport decrit en resume les essais en vol effectu^s sur le G 91, et porte plus particulierement sur les methodes d'essai, les techniques de vol, les appareils d'enregistrement, et le traitement des informa- tions obtenues en vol. Le programme d*essais etabli, le nombre d'avions effectivement utilises au cours des essais, le materiel de bord d'essai et les installations d'essai au sol sont indiquesd'une maniere g^nerale. La correlation entre les r^sultats d'essais en vol, en soufflerie et ae calcul est soulignee en tant que guide pour aborder certains problemes de la mecanique de vol, avec, k titre illustratif, quelques exemplüs types d'une teile correlation. Une mention speciale est faite do la collaboration fructueuse qu'ont assuree plusieurs organismes de recherchesimportants relevant de diff^rents pays membres de l'OTAN.
629.135:533.6.05
3c6d
ii

dm i .
CONTENTS
Page
SUMMARY ii
LIST OF FIGURES iv
1. INTRODUCTION 1 1.1 General 1 1.2 Flight-Test Data-Reduction Facilities 2 1.3 Airborne Instrumentation. Ground Check and
Calibration Devices 3
2. PERFORMANCE AND CALIBRATION METHODS 3 2.1 Performance 3 2.2 In-Fllght Calibrations 4
3. FLYING QUALITIES 5
4. STRUCTURAL STABILITY 7
5. VIBRATIONS 8
6. BASIC AIRBORNE EQUIPMENT FUNCTIONAL TRIALS 9
7. ARMAMENT 10
8. COMMUNICATION AND NAVIGATION 10
9. CONCLUDING REMARKS 10
FIGURES 11
DISTRIBUTION
ill

LIST OF FIGURES
. Fig.9
Fig.10
■■ Fig.11
Fig.12
Fig.13
Fig.14
Fig.15
Fig.16
Fig.17
Fig.l Distribution of flight-test program and aircraft
Fig. 2 Parameters measured in the G 91 flight tests
Fig.3 Flight test data reduction facilities
Fig.4 Typical flight test instrumentation
Fig. 5 Fiat G 91 1/5 - scale model for air intake wind-tunnel tests
Fig. 6 Take-off and landing performance measurements
Fig.7 Calibration of pitot-static pressure installation by the use of accelerometer and attitude-angle measurements (NA^A Report 1145)
Fig.8 Lateral aerodynamic force derivative against sideslip angle. Wind-tunnel and flight test results
Elevator effectiveness
Longitudinal static stability
Short-period longitudinal stability
Load factor spectrum
Tip wing-rib elastic rotation measured in flight tests
Nosewheel restraining moment spectrum during take-off and landing
Flutter investigation
Wing and empennage vibration level indicators
Wing model in inertial and aeroelastic similarity installed in the low-speed tunnel
Fig.18 Vibrations. Plight test excitation of horizontal stabilizer first mode. Theoretical and experimental data correlation
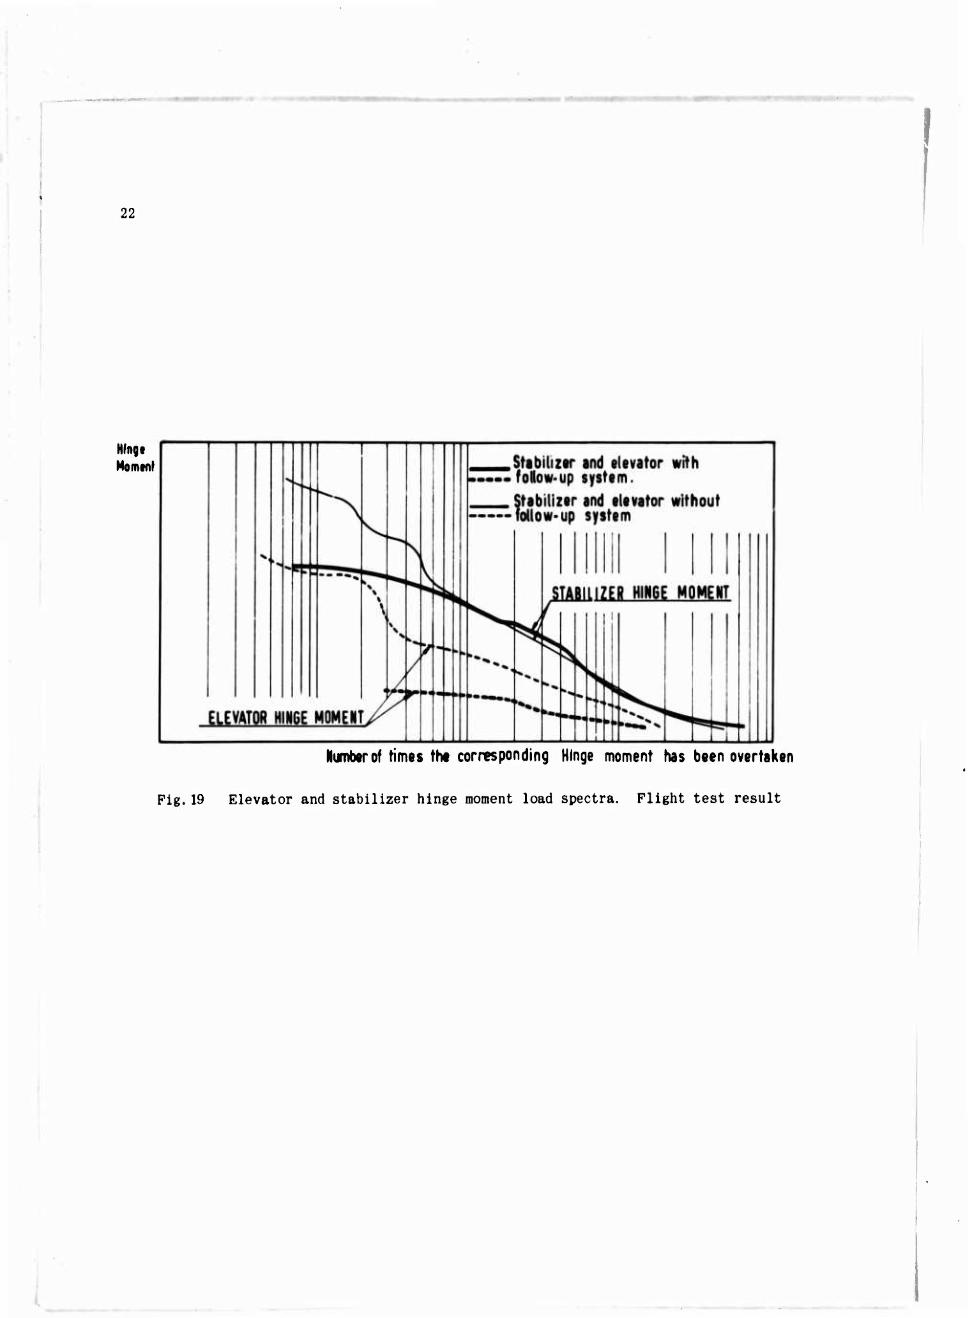
Fig.19 Elevator and stabilizer hinge moment load spectra. Flight test result
iv
Page
U
11
12
13
14
15
16
16
17
17
18
18
19
19
20
20
21
21
22

—I
FLIGHT TESTING OF THE FIAT G 91
G. Ciampolini*
1. INTRODUCTION
1.1 General
The G 91 flight test program has been planned well in advance, following a con- ventional procedure.
A general program for the tests has been prepared since the early phase of the pro- ject, and the methods and techniques for each test have been thoroughly specified.
The program was planned on the lines of the standard testing layout of a prototype. Actual investigations were carried out on the following main subjects:-
(i) Plight Characteristics
(ii) Airframe
(a) Performance
(b) Handling
(a) Plight Load Spectra
(b) Vibrations
(ill) Basic Airborne Equipment and Systems (hydraulic, electric, cabin conditioning, etc.)
(a) Communication and Navigation (iv) Operational Equipment i
I (b) Armament
For each test of the program the following points were previously defined.-
(a) Test methods, flying techniques, and data reduction methods.
(b) Parameters to bö recorded during each test, and specifications for the measuring and recording devices characteristics (sensitivity, accuracy, frequency response, etc.) for each parameter.
The next step was devoted to
(c) The preparation of the data sheets for the manual data processing and of the programs for the digital computers.
(d) The design, construction and actual installation on the aircraft of the pick- up and recording system, and the set-up of the facilities for instrument calibration and system ground check.
*fiat Co., Dipartinento Prove Volo, Caselle Tonnese, Torino, Italy

The actual work on these items was started during the early phase of the G 91 design and developed concurrently in order to get into the flying phase with a fully efficient flight testing organization. The totality of the G 91 weapon system testing was carried out using twenty-two aircraft, including the prototypes engaged in the basic investigations regarding flight mechanics, functional and structural problems.
The flight test equipment was distributed on the various aircraft according to the list in Figure 1.
On the 22 aircraft listed in Figure 1, more than 500 pick-ups have been installed with the related measuring and recording equipment; the diagram shown in Figure 2 illustrates the distribution of the recorded parameters according to the category of the test.
Design, wind-tunnel and test-rig results have been utilized as a guide for each flight test, whenever possible. Such a procedure is generally required in vibration tests for safety reasons, for a better understanding of the phenomena and for a sound interpretation of the flight test results; but it can guarantee, through a progressive correlation of the calculated and flight data, an appreciable reduction of the flying time and of the pilot's risk in the field of performance and handling tests.
Directing the flight tests by theoretical calculations and by ground test results was extremely helpful,especially so thanks to the cooperation and the advice by several Research Organizations on the highest level, for example:-
ONERA for flutter calculation and ground resonance tests.
NACA and WADC (through MWDT) for transonic wind tunnel flutter tests, with a model in inertial and aeroelastic similarity, and for flight flutter tests.
Cornell Laboratory and the 'Fabrique Föderale d* Avion' of Emmen for basic aerodynamic wind tunnel model tests.
Lilla vertical wind tunnel of the 'Institute de Me'canique des Fluides' for model spinning tests.
Polytechnic School in Torino for low-speed model flutter tests.
The armament and navigational trials have been carried out under the guide and the authority of the Italian Air Force and of the German Air Force, partly at the Caselle Airport (Torino) and partly at Flight Testing Centers like the CEV of Cazaux and the RSV of 'Pratica di Mare'.
1.2 Flight-Test Data-Reduction Facilities
The flight-test data-reduction planning has been based, as well as the design calculations, on the use of digital and analog computers.
The digital computers available for this purpose have been in succession one CPC-IBM, with three memory units, and one USS 90 Remington Rand.
The analog computer^ employed have been one Short with 18 operational amplifiers and one computer developed by Fiat, with 30 operational amplifiers.
In addition, special devices have been employed to read the data recorded during the flight tests, to transfer these data to the digital computer according to a program established in advance, and to convert recordings into plottings.
The complete apparatus comprises reading devices (by transparency and by reflection) with optical amplification for up to 180 mm wide recording bands (Pig. 3).
1.3 Airborne Instrumentation. Calibration Devices
Ground Check and
The airborne recording system was based, as already mentioned, on photographic paper recorders installed on the aircraft. Its use relies upon the availability of a special laboratory, set up to check the functioning of and to calibrate the measuring networks installed on the aircraft.
The recorders used are of French design, as the SFIM and Beaudouin recorders, or the LCR K 14 Spec. Fiat Av., developed according to the same principle and utilizing the same galvanometers, in order to obtain improved performance as regards the number of the recorded variables and the recording endurance. Every detail of the laboratory has been planned to allow the direct matching of the ground check and calibration devices with the airborne test equipment actually installed on the aircraft.
A thermubaric unit, of German make, can provide actual flight environmental conditions as far as pressure, temperature, humidity and centrifugal acceleration are concerned; it is used for the testing of components of prototype measuring equipment and for periodical check and calibration of the main instruments.
The pick-ups were selected so as to comply with a particular technical specification, and are of French, American, German, English, Dutch, Danish and Italian make.
In addition to the photographic recording equipment, telemetering was also used on the G 91, but in a limited and experimental form. An airborne FM/FM set, of Italian make, was installed on the aircraft. More recently magnetic tape has been used for in- flight recording. The basic equipment is of French make.
All the airborne measuring and recording systems have been installed and integrated in the aircraft, mainly during the construction of the airframe.
On the first prototype aircraft such systems reached a weight of up to approximately 13% of the empty weight of the aircraft. Figure 4 shows a typical example of the installation.
2. PERFORMANCE AND CALIBRATION METHODS
2.1 Performance
The performance testing methods, reported by the AGARD Flight Test Manual, have been basically used; the Edwards AFB Manual has been followed for the actual data pro- cessing.

.1
Some performance tests, i.e. the level flight speed and the range and endurance tests, have been carried out on the basis of strictly experimental test procedures; some others, i.e. take-off and climb tests, have been developed by analytical methods (according to AGARD Flight Test Manual terminology).
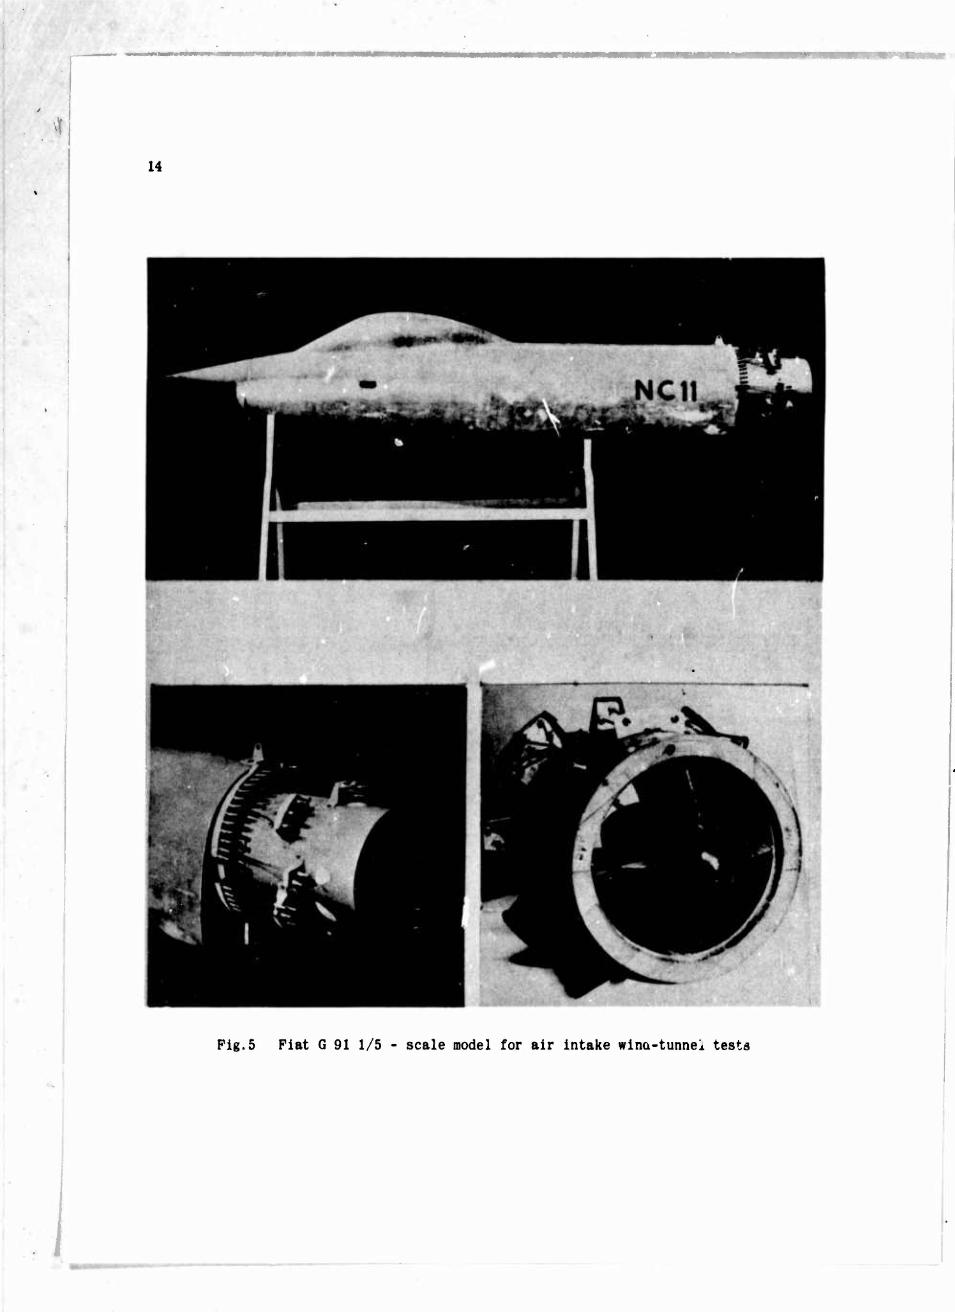
For such analytical reduction methods the engine non-dimensional performance given by the manufacturer has been used, and the air intake efficiency values, obtained by wind tunnel model tests, carried out to investigate air intake stability characteristics, were assumed (Fig. 5).
A very simple method has been used to obtain the take-off and landing characteristics; the method consists in recording the take-off and landing paths by conventional ground photographic equipment (see Figure 6).
The background in the picture of the airfield, as seen by the camera, has been calibrated in order to enable us to draw on it lines of constant given altitude above the runway axis.
The pictures of aircraft landing or taking off can be easily overlaid on the librated background, by the use of surrounding reference points, in order to recon-
struct the actual trajectory of the aircraft. ca
With this method it is possible to obtain information about the distance to clear the 50 ft obstacle, the flight path angle, the aircraft angle of attack and the static pressure error.
Such measurements have been carried out during normal test flights, without scheduling special missions.
A deeper and more extensive investigation on the G 91 performance was carried out by the HSV of the Italian Air Force, at Pratica di Mare, and was based on the AGARD methods.
2.2 In-Flight Calibrations
The pitot-static error measurement and the true sideslip angle measurement are reported here as examples of calibration methods.
The pitot-static pressure calibration has been performed by the two following methods:-
(a) Calibration at low altitude by the conventional 'tower' method.
(b) Calibration at high altitude by the method described in NACA Report 1145 and based on data from accelerometers and attitude gyros.
Several high altitude runs were made, starting from low Mach number conditions (for which the low altitude calibration was available) and diving to the maximum permissible Mach number.

.
The following parameters were measured on continuous photographic paper recorders:-
X-, Y-, Z-axis components of e.g. acceleration,
pitch and bank angles (by free gyro recording system),
altitude, air speed and air temperature.
By integrating the acceleration components in the vertical piano it is possible to obtain continuously the true altitude variation during dives from the initial test altitude.
The measurement of the pressure and temperature values during the test allows us tu obtain complete information of the static pressure error against Mach number.
Figure 7 shows a calibration curve obtained by such a method.
The data reduction was made by digital computer.
The position error of the sideslip angle pick-ups was determined, on the G 91, b.v a method based on the recorded data integration.Thefollowing parameters were recorded:-
altitude and air speed,
angle of sideslip (obtained by swivelling vanes placed beneath the fuselage rather than on a nose boom, which, in case of damage, could be highly dangerous to the engine),
X-, Y-, Z-axis components of the e.g. acceleration,
pitch and bank angles,
rate of yaw,
Sideslip tests, beginning from zero-bank and no sideslip conditions, were made.
Knowing the values of the parameters it is possible to get the projection in the wing plane of the direction of the e.g. motion and therefore the true sideslip angle, which is the angle between the x-axis and such a projection.
Figure 8 is the curve of the aerodynamic derivative C against the true sideslip angle ßc calculated from flight test data by the method just given and compared with the corre^nonding curve that was previously obtained uy wind tunnel tests.
A very similar method was used to calibrate the longitudinal angle of attack pick-up.
3. FLYING QUALITIES
The G 91 flying qualities testing has been carried out on the basis of a conventional stability and control flight program to find out the aircraft and manoeuvre characteristics within the design flight envelope and to compare them with official 'requirements'.
i 6
In such a progiam many tests and measurements were included to get lift boundaries, thrust boundaries, short-period characteristics and to obtain direct information about operational manoeuvre capabilities of the aircraft within the design flight limits.
In the basic section of this program the flight investigations were carried out checking continuously the correlation between flight data and theoretical and wind tunnel results.
The most significant stability and control derivatives, on which such a correlation has to be based, were found out during the flight testing; several free and forced oscillation tests and control pulse manoeuvres were included in the flight program to allow the pilot an immediate and direct understanding of the aircraft controllability, as well as to permit the aerodynamic ist to determine, by the analysis of the air- craft motion, the aerodynamic derivatives. The analysis of the tests was made mainly by the 'time vector' method and by algebraic resolution of the equations of motion, substituting the flight test data into the equations.
A first investivation of the flight test results was made by calculating the basic stability derivatives by the usual simple formulae, giving the natural free oscillation period.
In some cases the actual calculations were done by analog computing machines.
In every case the damping derivatives were determined by using theoretical informa- ation to separate the contribution of the rates of incidence (C^) damping terms from that of the attitude rates (C^) ones.
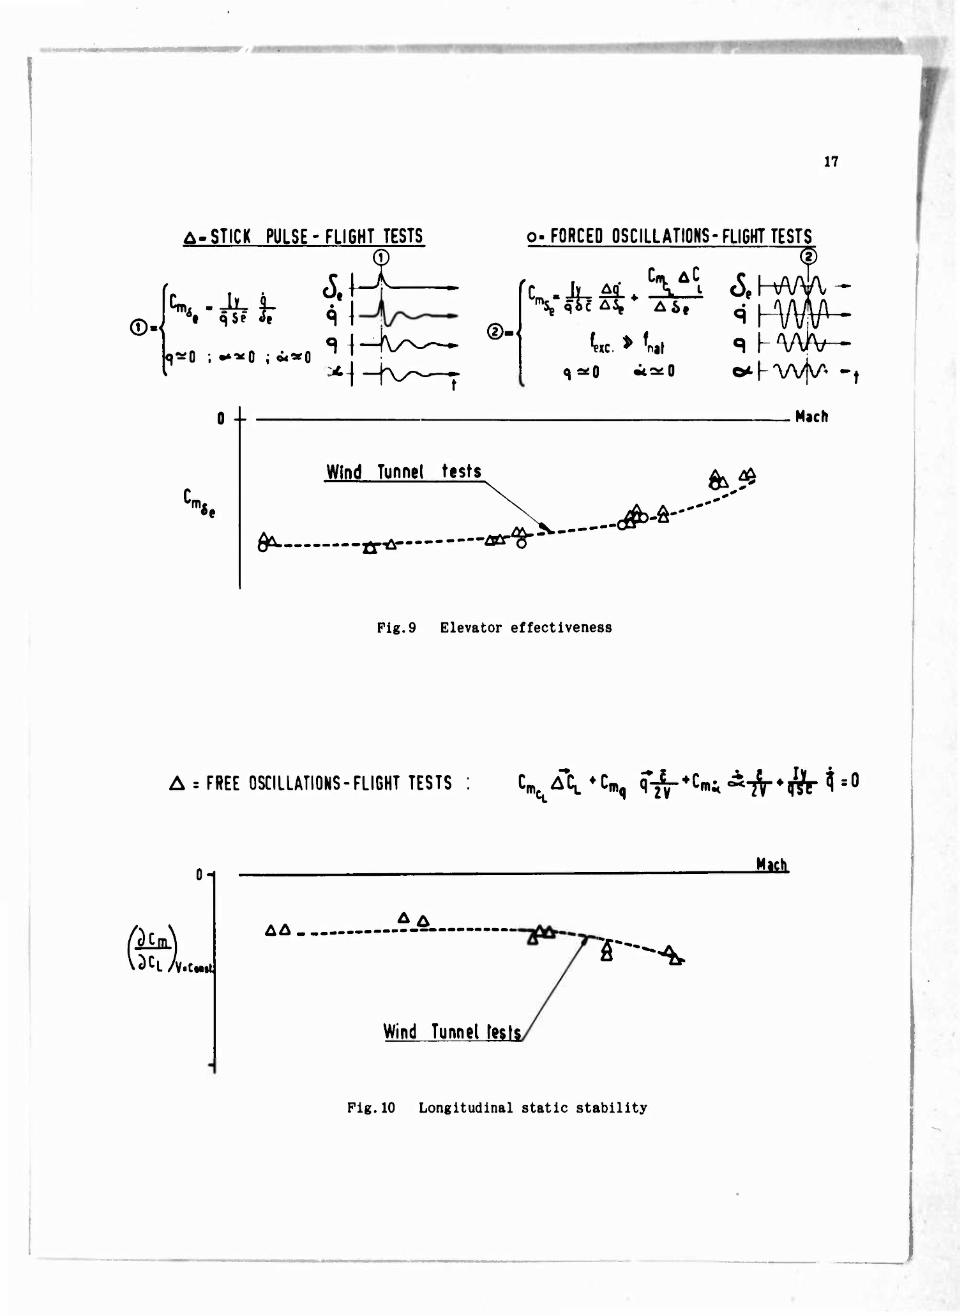
Figures 9 and 10 show some results of typical investigations in the area of stability and manoeuvre derivatives obtained from flight tests, compared with wind tunnel results. Figure 9 shows the elevator effectiveness derivative against Mach number, obtdined by two different flight techniques and by different data reduction methods; the comparison between them and the wind tunnel results is quite satisfactory. The effect of elastic rotations of the elevator and stabilizer surfaces was measured and has been 'ound negligible. The results were obtained by pulse and by forced-oscillation manoeuvres and the data reduction was made by the analysis shown in the figure.
Figure 10 shows the comparison between the values of longitudinal static stability derivative C,^ from flight tests and the corresponding wind tunnel results.
Li
Determining the stability derivatives by flight tests and cross-checking them with design and wind tunnel data was the basic procedure followed to investigate the air- craft controllability and the most reliable way to proceed to the solution of some particular problems (i.e. stability augmentation by dampers and roll divergence boundary determination) by the use of analog computers.
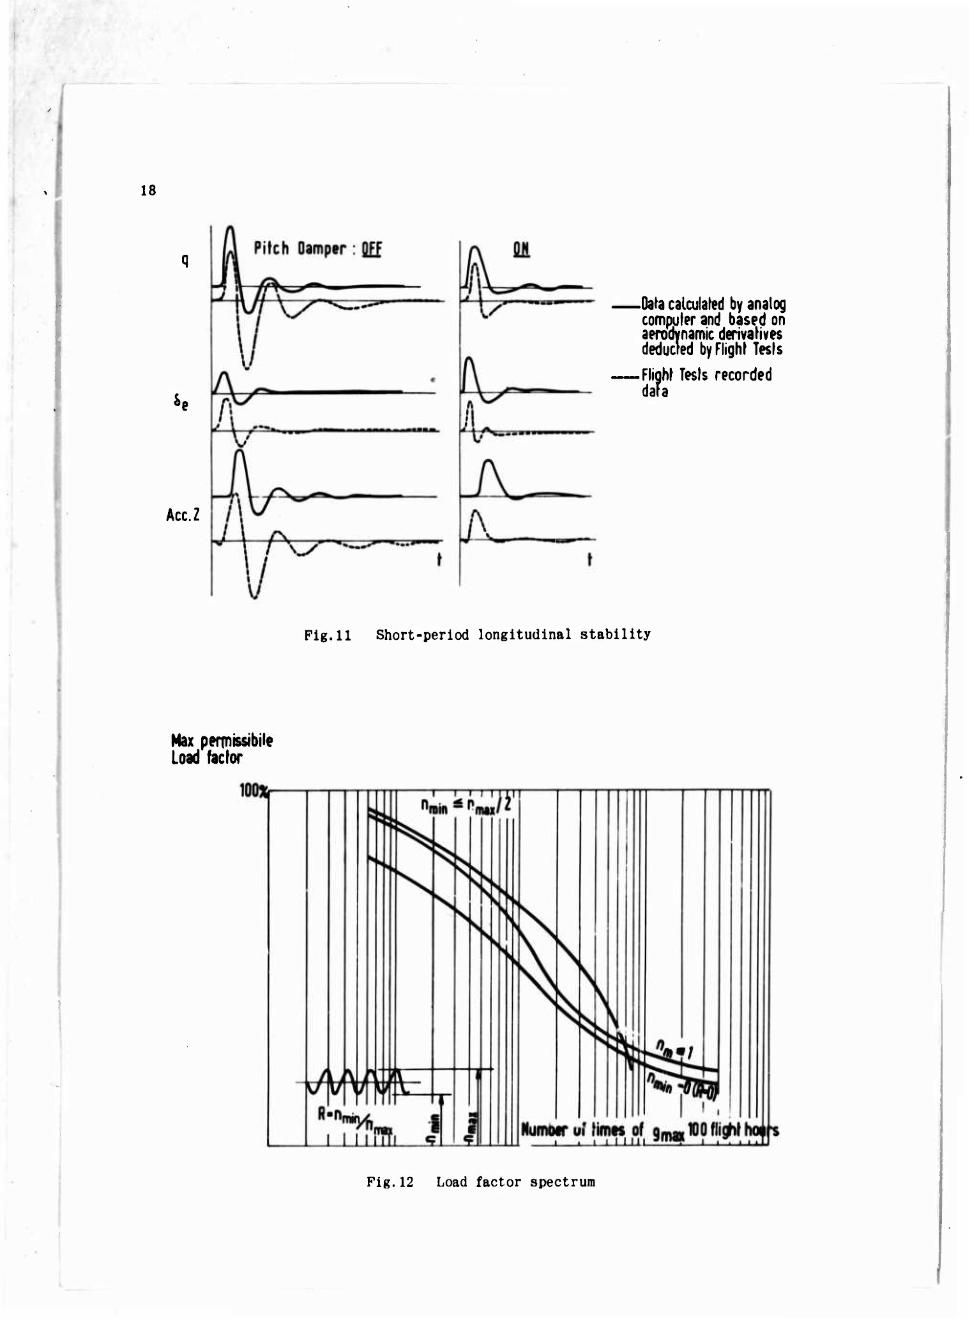
Figure 11 shows some examples of pitch oscillations,generated on the G 91 by pulse manoeuvres, with pitch damper 'On' and 'Off . The recordings were obtained respectively by analog computers, using aerodynamic derivatives based on design and flight data, and by actual flight tests, under the same test conditions.

■
This particular investigation is the subject of a paper presented by Mr Mautino of Piat D.A. during the AGARD Symposium on 'Stability and Control', recently held at Brussels.
4. STRUCTURAL STABILITY
The capability of obtaining a quick and direct correlation between flight and ground test results was the main requirement specified for the structural stability test instrumentation, for static loads, repeated loads and for vibrations.
The test methods used are of a mixed type; that is, the information relative to static loads or vibration characteristics, for every test condition, is arrived at by integration of design, ground and flight test results. Let us consider, for example, the typical fields of static loads and load spectra investigations. The basic air- borne instrumentation was installed to measure the following:-
(a) Load factors;
(b) Loads on the control rods at the output of the actuators;
(c) Angular displacements of moving surfaces at different points, spanwise, to obtain also information about the twist of the surfaces due to manoeuvre loads;
(d) The angle between root and tip ribs of wings, stabilizer and vertical fin. Rods, fixed only to the root rib and free to bend without interfering with the internal structure, were used for this purpose. A pick-up (potentiometer or differential transformer) was installed at the opposite, free end of the rod. Fixed rods with strain gauges were also used for vibration tests;
(e) Strain measurement on hydraulic jacks or particular structural elements.
The recorded data do not give a complete picture of the actual flight loads distribution, but their correlation with those obtained by the static ground tests allowed a continuous check of the close agreement between design assumptions and flight conditions.
Figure 12 shows load factor spectra given by the Italian Air Force RSV, and based on recordings taken during the intensive trials at Pratica di Mare; these spectra were included in a study, attached to a Report on fatigue, distributed to Flight Mechanics Panel members at the Istanbul meeting in October 1960.
Fig. 13 isaplot of wing twist against load factor, obtained during pull-out manoeuvres. The curve obtained during ground static tests, and corresponding to the design assump- tions for the same manoeuvres, is also given. The measurements listed were also very useful in obtaining special load spectra necessary to define the fatigue life of some structural parts of the aircraft. For example, load spectra of the nosewheel strut rescraining moment, measured on runways and grass strips respectively, are shown in Figure 14.
1

S. VIBRATIONS
Plight tests to investigate aeroelastir stability are, as is well known, those
requiring more computing aids and wind tunnel work than any other type of test. Such basic work was carried out for the G 91 with the cooperation and the advice of the
previously mentioned research agencies and test centers in the NATO area (Figure 15).
The investigations were carried out as follows:
(a) Calculation and measurement of the stiffness and inertia characteristics of
the main structural parts of the airframe.
(b) Calculation of the principal modes and ground determination of the aircraft actual modes (advice and cooperation by O.N.E.R.A.).
(c) Critical speed calculations through transonic coefficients.
(d) Transonic wind tunnel critical speed experimental determination, with an air- craft model in the main configuration (advice and cooperation by N.A.C.A.).
(e) Calculation of the aircraft critical speeds in the main and alternative con- figtmtiODd (external loads) by transonic and low speed coefficients, and cross check of these calculations by low speed wind tunnel tests (Polytechnic School of Torino wind tunnel).
(f) Aircraft flight testing, for every configuration, inducing vibrations with flight control pulses by the pilot; the characteristics of the modes, indicated
by the calculations as the most critical, were observed and compared with theoretical data (W.A.D.C. cooperation).
Sixty-nine viijration variables were measured during the flight tests, fifty-four of them by acceleration induction pick-ups, five by structural strain induction pick-ups and ten by strain gauges.
The frequency response of the measuring networks installed on the aircraft had to be determined. Such a calibration was carried out with the pick-ups fed by the air- craft electrical system and with electro-magnetic vibrators of the same type as those used for the ground vibration tests.
In the airborne test equipment were included special devices to inform the pilot of the vibration level of the most significant elements of the airframe (wing, stabilizer, fin and control surfaces) and of the damping characteristics of the
vibrations excited by pulse manoeuvres. Such devices give the average square values of the acceleration, velocity or displacement of the vibrations, according to the
function selected on the ground before the flight test.
Pigure 16 shows the auxiliary panel supporting such a warning system.
The vibration variables recording was carried out by airborne photographic paper
recorders; simply from an experimental viewpoint, some vibration measurements were made using an PM/PM telemetering system and magnetic tape recorders.

9
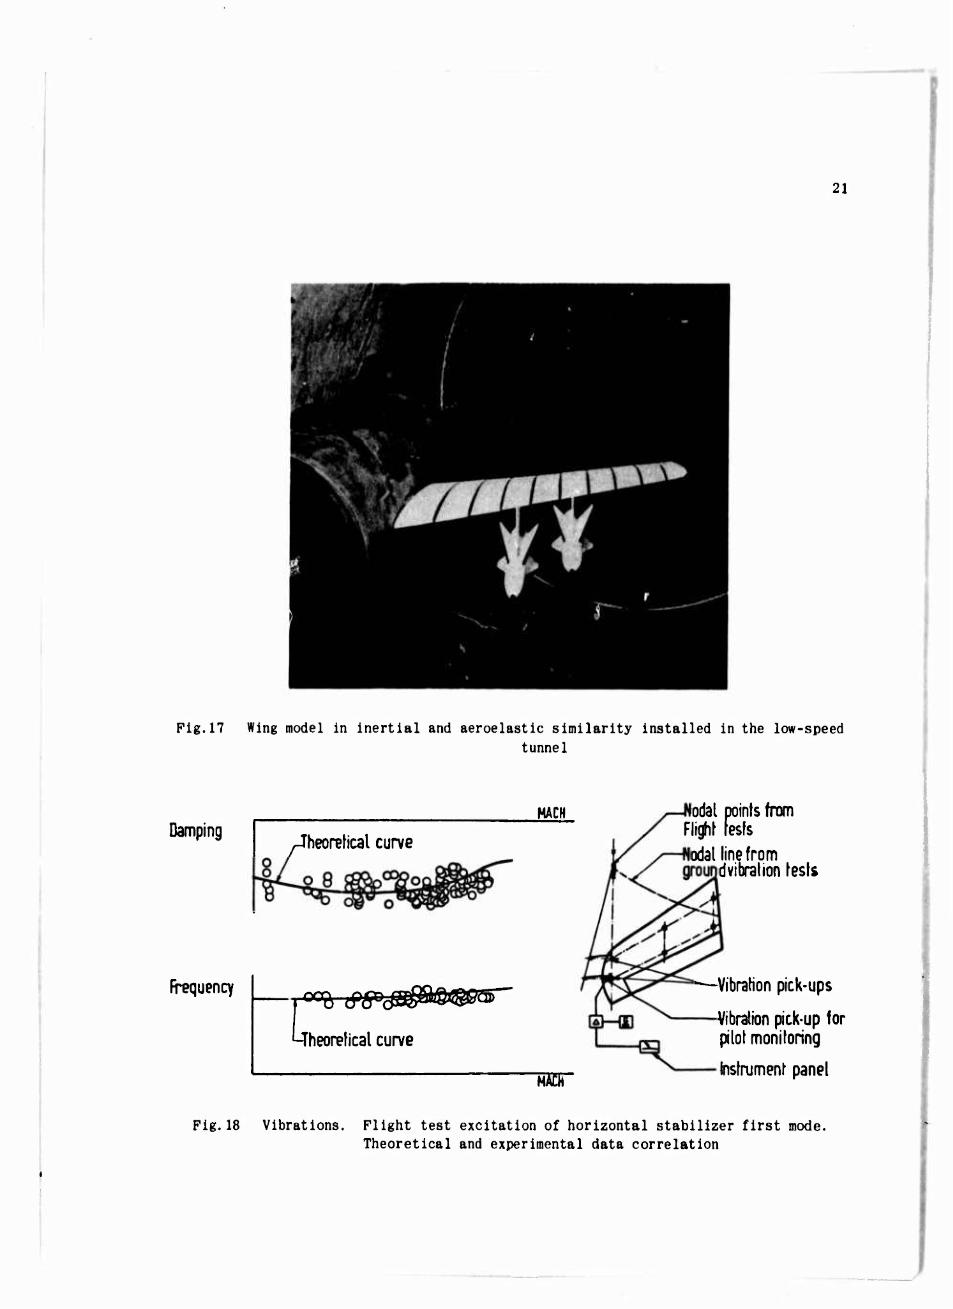
Some examples of the aeroelastic investigation results are reported here.
Figure 17 shows the aircraft model, in aeroelastic similarity, for a typical external loads configuration. The model is shown lu the low speed wind tunnel, being supported by a system, which cannot be seen in the picture, simulating the freedom of the aircraft
about the Y-and Z-axis, its aerodynamic stiffness, and built-in pitch and roll inertial similarity.
The low speed wind tunnel tests gave critical speed results very close (about 5% difference) to the corresponding calculation results (low speed aerodynamic coefficients
assumption).
Figure 18 shows comparison between theoretical and flight test damping coefficients for a frequency corresponding to a typical mode. The vibrations were excited by pulse manoeuvres.
6. BASIC AIRBORNE EQUIPMENT FUNCTIONAL TRIALS
The basic airborne equipment testing required a great amount of experimental work, which can be illustrated by listing some of the most important items tested:-
(i) Temperature measurements on the body of the hydraulic pumps and in the main points of the hydraulic system.
(ii) Measurements, by strain gauges, of the pressure variations in the hydraulic lines to obtain statistical data, necessary to simulate, on the test bench, long functioning periods, in order to determine the operational life of the lines elements.
(iii) Measurements of the electric loads and temperatures of the main electric
actuators.
(iv) Measurements of the load spectra, especially during manoeuvres, of the main
flight control actuators to compare flight data with test bench data in order to assess their operational life.
(v) Measurements at the servo out-put of the oscillating loads from the damping of the rods, due to step inputs, in order to assess the stability of the servo-systems,
(vi) Measurements of engine main parameters.
(vii) Measurements of temperatures and pressures of the cabin pressurization and air-conditioning systems at some typical points.
(viii) Measurements of the landing gear wheel vibrations during braking action by the pilot and of temperatures at some typical points of the wheels, especially
in the hub area, by thermocouples installed in such a way as to allow direct measurement by ground personnel immediately after a full stop landing (by RSV - Pratica di Mare).
As an illustration of such measurements, the load spectra of the stabilizer and elevator actuators, obtained by flight tests, are shown in Figure 19. The comparison between

10
loads of the conventional and the electrical follow-up tail (the last one is now in- stalled on the trainer version of the G 91), in the same flight conditions, is given
special emphasis.
7. ARMAMENT
The G 91 armament trials, for the different basic configurations, were carried out under the guidance and the authority of the Italian and of the German Air Forces. The corresponding test methods have been developed by these Air Forces and therefore their description is not included in this report.
From a general point of view it is worth mentioning that, for these tests, the in- stallation of some special recording and photographic equipment (for vibration, gun-bay ventilation, explosion warning etc., and to collect information on the trajectories of bombs, rockets and guided missiles) was required by the customer and carried out by Fiat.
8. COMMUNICATION AND NAVIGATION
Besides the usual flight program to test the characteristics and the reliability
of the basic communication and navigation equipment, a special flight program was carried out to test the Doppler-Phi self-contained navigation system, both from the technical and operational point of view.
The test methods used for such investigations were studied and issued by German
Air Force specialists. The methods were based on the principle of flying a given course, and taking synchronized pictures of the ground and of the Doppler-Phi display at some reference points, in order to compare the actual path with the programmed one.
The Doppler-Phi flight program covered the main operational and environmental con-
ditions, including flat and hilly areas, sea and coastal areas and low and high missions,
9. CONCLUDING REMARKS
Every branch of the G 91 flight testing has the distinctive mark of the closest co- operation of the most important research agencies and testing centers in the NATO area.
The same kind of international cooperation was obtained in the field of the flying qualities evaluation and of the weapon system trials, carried out by several highly
qualified national teams to asses the operational capabilities of the aircraft.
Such cooperation was the most extended and deep, and meant a great deal in bringing the G 91 to a Squadron standard, as the weapon system complying with the SHAPE general requirements for the first generation LWSR aircraft.

11
TYPE OF TEST NUMBER OF AIRCRAFT PLACE ORGANIZATION
RESPONSIBLE
Basic flight mvesligahons 5 Caselle (Torino) Pratica di Mare (Homa)
FIAT - DA 1 RSV - AMI
Intensive trials 10 Pratica di Mare (Roma) «^V - AMI
Armament trials
3 Guided missiles CAZAUX CEV
1 Guns Caselle (Torino) FIAT
. Bombs and 1 Rockets
Pratica di Mare (Roms) RSV - AMI
Navigational trials
1 Ooppler -PHI Caselle (Torino) FIAT
1 Oecca Weatherfield AFB
(England) USAF
Fig.l Distribution of flight-test program and aircraft
' TEST TEST
SHIPS N*
PERFORMANCE AND FLYING QUALITIES
LOADS AND STRAINS
VIBRATIONS STRUCTURE
rcMPERATUK
ENGINE AND
ACCESSORIES
fWTOGRAPHC (IRSERVERS
1 Basic flight investigations Ion prototypes 5 112
(21.8%) 79
(15.47.) 69
(1357.) 43
(857.) 46
. 1«*] 4
(0.8 7.)_
Intensive trials 10 20 (3,97.) (1.97.)
Armament 5 (B3i) 15
(2.97.) 50
(9.7 7.) 15
(2.97.)
Radio Navigation 2 *5 v (17.)
14 (2.7 7.)
NOTE Figures shown above give the number ol the recorded parameters
Values in brackets are the percentage of the total
Fig.2 Parameters measured in the G 91 flight tests
12
Pig.3 Plight test data reduction facilities
13
z Z o in o
UJ —
t- a v> 3 or
1/1 in o o in t- a. u
a o. a •- o t~ in z H u a UJ < * a u Z > Z u t- o UJ < N UJ z -1 z — S UJ >- -I o UJ o • a o ►- o s
ui in 3 t- z )- ui <n
or uj o < a uj uj i - a D in _j o »- ui m in uj oc •• a. in ui u o in z u K U — O UJ Ä K < > a K a tn
Z Z B < uj o UJ > Z - Q a. >- a z - o o u o z u »- O 3 Ul -
-xr o.
§
1
Z i t- ►- a: o in a Z z w • w — UJ u N in cc > Z Z - K 3 J— UJ O -J o in a y ■
o: z - >- in o UJ in a UJ ■ Ul t- 5 u in IM uj < a- ec < P- in < — o t- - a. u 5 in u -1 z in >- in UJ z
in u o |
in u ■ 5 Z « OE a - z or a 5 1-«
C in »- hj UJ z - UJ 3 <n >■- K 01 N >- < u K 1- UJ (r z tn o o - UJ z in UJ < K « UJ
1- K J Z >• • UJ Z K D UJ Z
5 < < — o o t- z O UJ in z m a. > > a a o o a a. in _ o - Uj Uj < m K .1 o m z UJ O < 3 -I J t- s w — — u K ZOO
(T u u «n >< a. UJ > t- a. UJ _i u
1- a] in in O
O z •FH V « o a UJ
m *- o — s
10 < in
i o o -10.
• M
•H E
z > o z O K Z O • in — in
_ in UJ • z o mm a in — z m o m • OM*a:»-ujuJO a. in z u tr CD
t- a. »- 3 ■ zzzu^m^-o o o o z t- -i K B a: o UJ t- u. uj UJ uj a 13 -i o ^-j-jszzt-a:
<<<>5u.ä!<
i 14
Fig.5 Fiat G 91 1/5 - scale model for air intake wino-tunnel tests
i

15
^S-p _ if rrr -■>»-.,1.11 I „I
.-.•/-r-«» «00. I viy
Fig. 6 Take-off and landing performance measurements

16
q
.Constant speed > Dive
o i
^P'P'PMEAS-Static error
i Vdt,
a, ax COS e'-a1s«n ^ G9L
a . x-axis acceleration
az . z-axis acceleration
av - vertical acceleration along vertical of earth
e - attitude angle
(/ - vertical velocity
R - gas constant
h - altitude
Pitot installations are
geometrically similar
Pig.7 Calibration of pitot-static pressure installation by the use of accelerometer
and attitude-angle measurements (NACA Report 1145)
jic=/e cos^d^yrdl- -^-/(ay + g sen^)
cy ( const, altitude )
dt
s<%
X fo
pc = true sideslip angle x'' 9 = pitch attitude
w r = rate of yaw Vt :true airspeed ay = acceleration along
y-axis
r' X
A"
Jb*' r'*
Wind Tunnel results .r' ° Flight test result
fk Fig.8 Lateral aerodynamic force derivative against sideslip angle. Wind-tunnel and
flight test results
17
A-STICK PULSE-FLIGHT TESTS
cS M^
•«0 ; ^«O ; o«*0 ©-
o- FORCED OSCILLATIONS-FLIGHT TESTS
1 Cm AC
0 --
C mi,
Mach
Wind Tunnel tests ^5 &
&• •tr1*" •ä^51 K#>-ft
Pig.9 Elevator effectiveness
A = FREE OSCILLATIONS-FLIGHT TESTS : cmA\ ^C^ q^^mi ^TV*^ ^ =0
Oi
(0 VdCL/V.ttMl
A4. AA
Mach
Wind Tunnel tests
r--^
Fig.10 Longitudinal static stability
18
Acc.Z
.Data calculated by analog computer and based on aerodynamic derivatives deducted by Flight Tests
.Flight Tests recorded dara
Fig.11 Short-period longitudinal stability
Max permissibile Load factor
Fig.12 Load factor spectrum

19
Load
factor
Rotation measured i Flight Test during actual pud out manoeuvres
n-1 ±Jk.
tations measured in ground static tests in load conditir * corresponding to pull out manoeuvre up to CL max
Rotations
Fig.13 Tip wing-rib elastic rotation measured in flight tests
Restrain moment amplitude
times the corresponding restrain moment has been overtaken
Fig.14 Nosewheel restraining moment spectrum during take-off and landing

20
CALCULATIONS
(By analog and digital computers) Preliminary general invesligation and calculation for every A;C actual version and load condition,up to six degrees of freedom
1 INERTIA AND STIFFNESS
MEASUREMENT
INERTIA OF STRUCTURAL ELEMEHTS (I.E. a sectioned wing)
STIFFNESS OF THE PRINCIPAL STRUCTURAL ELEMENTS. INCLUDIN6 CONTROLS
1 GROUND RESONANCE TESTS
TESTS ON THE kit 3 Basic A/C versions (complete external load range) Tests on structural components
TESTS ON MODELS Models for transonic wind tunnel Models for low speed wind tunnel
WIND TUNNEL
TRANS. WIND TUNNEL (HACA) Several tail models
Lb.. SPEED WIND TUNNEL ( Politechnic School Torino) Tail models lor several structural chb. actenslics Wing models: for each type S different configurations I
3 different types of external load |
FLIGHT TESTS 3BASIC A/C VERSIONS
(Pulse manouvres induced vibrations analysis )
Fig.15 Flutter investigation
Fig.16 Wing and empennage vibration level indicators
21
Pig.17 Wing model in inertial and aeroelastic similarity installed in the low-speed tunnel
Damping Jheorehcal curve
MACH
frequency
I OCl^ ^^DJjIJjffllQl^/i lli"^
heoretical curve
lodal points from Flight fesfs odal line from
dvibration tests
MÄDT
Vibration pick-ups
Vibration pick-up for pilot monitoring
Instrument panel
Fig.18 Vibrations. Flight test excitation of horizontal stabilizer first mode. Theoretical and experimental data correlation
I 22
Hingt Mommt
Number of times the corresponding Hinge moment has been overtaken
Fig.19 Elevator and stabilizer hinge moment load spectra. Plight test result