na165098 white slough tertiary ponds final geotechnical report
TRANSCRIPT

APPENDIX D

Final Geotechnical EngineeringServices Report
White Slough Wastewater Treatment Facility Tertiary PondsLodi, California
December 16, 2016Terracon Project No. NA165098
Prepared for:Petrologix
26675 Bruella RoadGalt, California
Prepared by:Terracon Consultants, Inc.
Lodi, California

Terracon Consul tants, Inc. 902 Industr ia l Way Lodi, Cal iforn iaP [209] 367 3701 F [209] 333 8303 terracon.com
December 16, 2016
Petrologix26675 Bruella RoadGalt, CA 95632
Attn: Daniel Kramer, P.G., C.E.G.
Re: Final Geotechnical Engineering Services ReportWhite Slough Wastewater Treatment Facility Teriary Ponds12751 N. Thornton RoadLodi, CaliforniaTerracon Project Number: NA150395
Dear Daniel:
Terracon Consultants, Inc. (Terracon) has completed the final geotechnical engineering servicesfor the above referenced project. This study was performed in general accordance with ourproposal number PNA150395 dated October 20, 2015 and revised on November 25, 2015 andMarch 2, 2016. This report presents the findings of the subsurface exploration and providesgeotechnical recommendations concerning earthwork and the design and construction of tertiarypond embankments for the proposed project.
We appreciate the opportunity to be of service to you on this project. If you have any questionsconcerning this report, or if we may be of further service, please contact us.
Sincerely,Terracon Consultants, Inc.
Patrick C. Dell, Senior Associate Garret Hubbart, PrincipalGeotechnical Engineer 2186 Geotechnical Engineer 2588Geotechnical Department Manager Office Manager
Enclosurescc: 1 – Client (PDF)
1 – File
TABLE OF CONTENTS
Responsive ■ Resourceful ■ Reliable
PageEXECUTIVE SUMMARY ............................................................................................................. i1.0 INTRODUCTION ............................................................................................................. 12.0 PROJECT INFORMATION ............................................................................................. 2
2.1 Project Description ............................................................................................... 22.2 Site Location and Description............................................................................... 2
3.0 SUBSURFACE CONDITIONS ........................................................................................ 23.1 Local Geology ...................................................................................................... 23.2 Faulting and Seismic Considerations ................................................................... 3
3.2.1 Seismic Site Class and Parameters .......................................................... 33.2.2 Faulting and Estimated Ground Motions ................................................... 3
3.3 Soil Conditions ..................................................................................................... 43.4 Groundwater ........................................................................................................ 53.5 Liquefaction Potential ........................................................................................... 5
4.0 FINAL GEOTECHNICAL ENGINEERING ANALYSES................................................... 64.1 Seepage Analysis ................................................................................................ 74.2 Slope Stability Analysis ........................................................................................ 7
5.0 RECOMMENDATIONS ................................................................................................... 85.1 Earthwork............................................................................................................. 8
5.1.1 Site Preparation........................................................................................ 85.2 Material Requirements ......................................................................................... 8
5.2.1 Compaction Requirements ....................................................................... 95.3 Grading and Drainage .......................................................................................... 95.4 Earthwork Construction Considerations ............................................................... 95.5 Pump Station and Pipeline Design and Construction ......................................... 11
5.5.1 Pump Station Design and Construction .................................................. 115.5.2 18-inch Tertiary Pipeline Design and Construction ................................. 12
5.6 Pavements ......................................................................................................... 135.6.1 Design Considerations ........................................................................... 135.6.2 Pavement Drainage ................................................................................ 145.6.3 Pavement Maintenance .......................................................................... 145.6.4 Construction Considerations................................................................... 15
6.0 GENERAL COMMENTS ............................................................................................... 15

TABLE OF CONTENTS (continued)
Responsive ■ Resourceful ■ Reliable
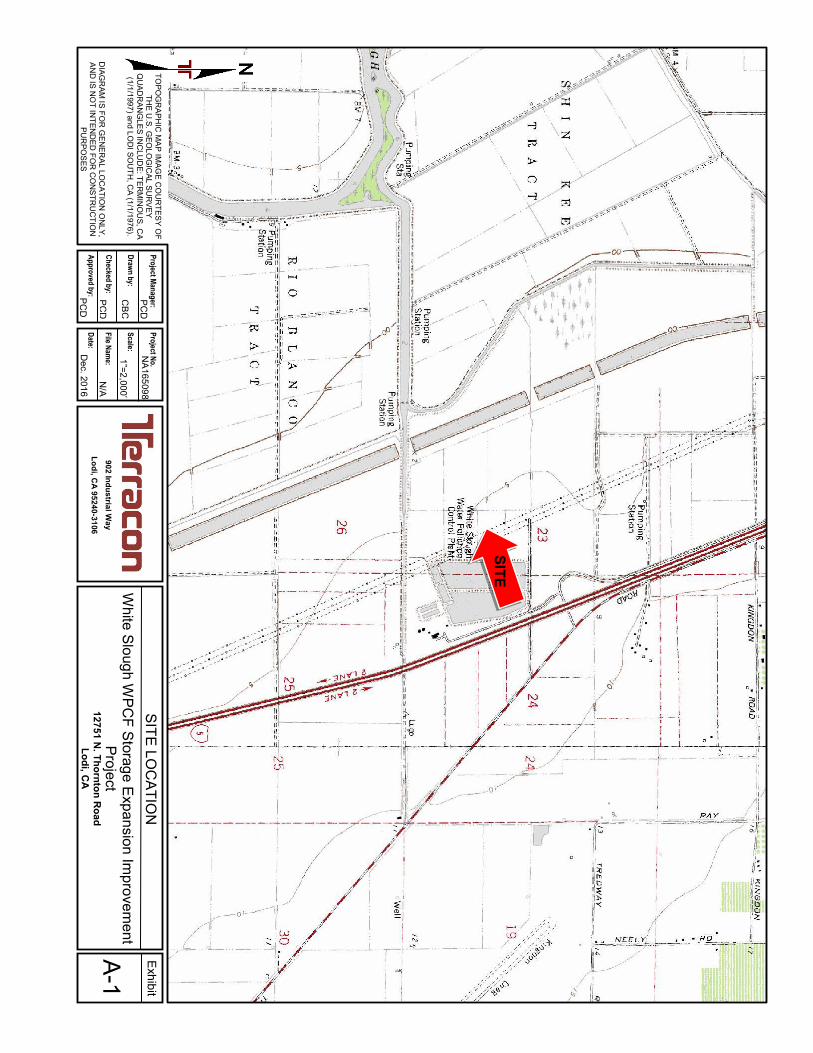
APPENDIX A – FIELD EXPLORATIONExhibit A-1 Site Location MapExhibit A-2 Exploration PlanExhibit A-3 Field Exploration DescriptionExhibit A-4 to A-9 Boring Logs
APPENDIX B – LABORATORY TESTINGExhibit B-1 Laboratory TestingExhibit B-2 Atterberg LimitsExhibit B-3 Summary of Laboratory TestsExhibit B-4, B-5 R-value Test Results
APPENDIX C – SUPPORTING DOCUMENTSExhibit C-1 General NotesExhibit C-2 Unified Soil Classification SystemExhibit C-3 Seepage Analysis ModelExhibit C-4 Slope Stability Analysis ModelExhibit C-5 Seismic Design ParametersExhibit C-6 2008 Deaggregation Summary

Final Geotechnical Engineering Services ReportWhite Slough Wastewater Treatment Facility Tertiary Ponds ■ Lodi, CaliforniaDecember 16, 2016 ■ Terracon Project No. NA165098
Responsive ■ Resourceful ■ Reliable i
EXECUTIVE SUMMARY
A final geotechnical engineering services report has been prepared for new tertiary ponds to beconstructed west of the existing White Slough Wastewater Treatment Facility on Thornton Roadin Lodi, San Joaquin County, California. Terracon previously prepared a preliminary geotechnicalengineering report for this project dated September 16, 2016. Terracon’s preliminarygeotechnical engineering scope of work for this project included drilling six (6) borings forsubsurface exploration, laboratory testing, preliminary geotechnical engineering analysis, andpreparation of a preliminary geotechnical engineering report. Four (4) of the borings wereadvanced to 21½ feet below the existing ground surface (bgs) and two (2) borings were advancedto 51½ feet bgs. Borings were located at the planned embankments for the ponds. Terracon’sfinal geotechnical engineering scope of work for this project included additional laboratory testing,final geotechnical engineering analysis, and preparation of this report. No additional borings wereperformed as part of this final report. Additional borings are planned to be performed as part ofan addendum to this report for the proposed pump station and pipeline associated with the newtertiary ponds. The recommendations for the pump station and pipeline contained in this reportare preliminary only and need to be confirmed with data obtained from the planned additionalborings.
Based on the information obtained from our preliminary geotechnical engineering report and finalgeotechnical engineering analyses and additional laboratory data, the proposed project canproceed as planned provided the final recommendations contained in this report are properlyimplemented in the planning, initial design work, and pre-construction planning of the project. Thefollowing geotechnical considerations were identified:
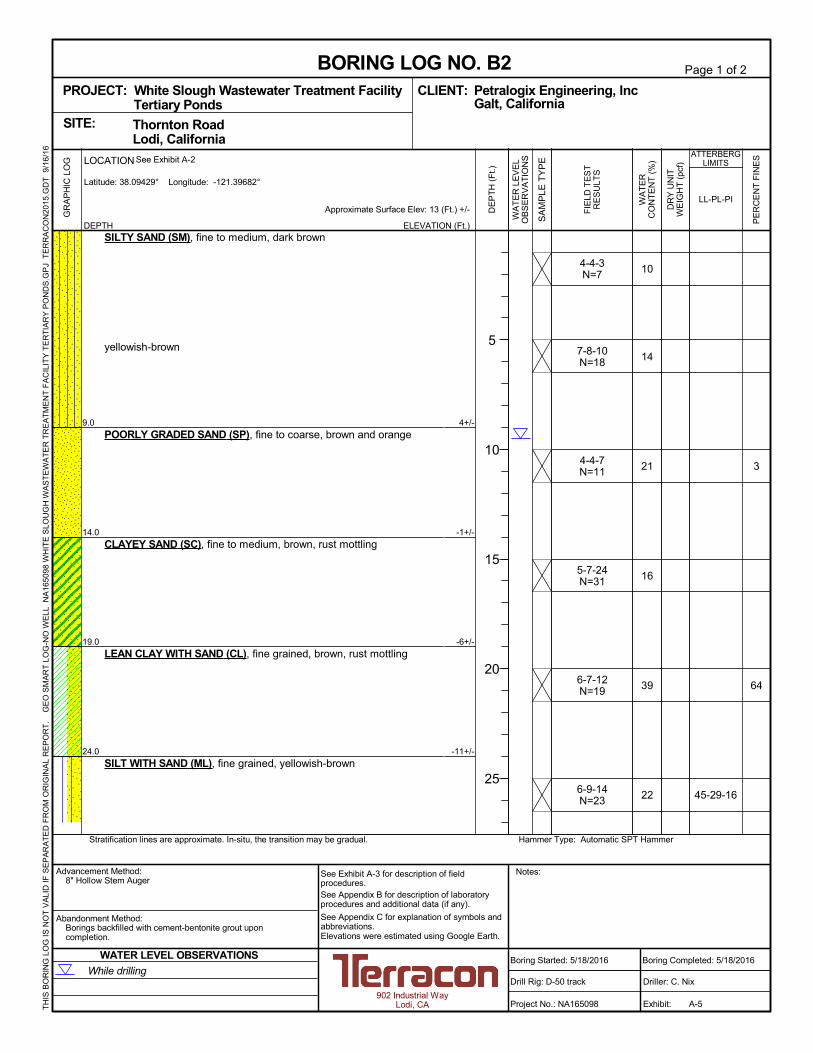
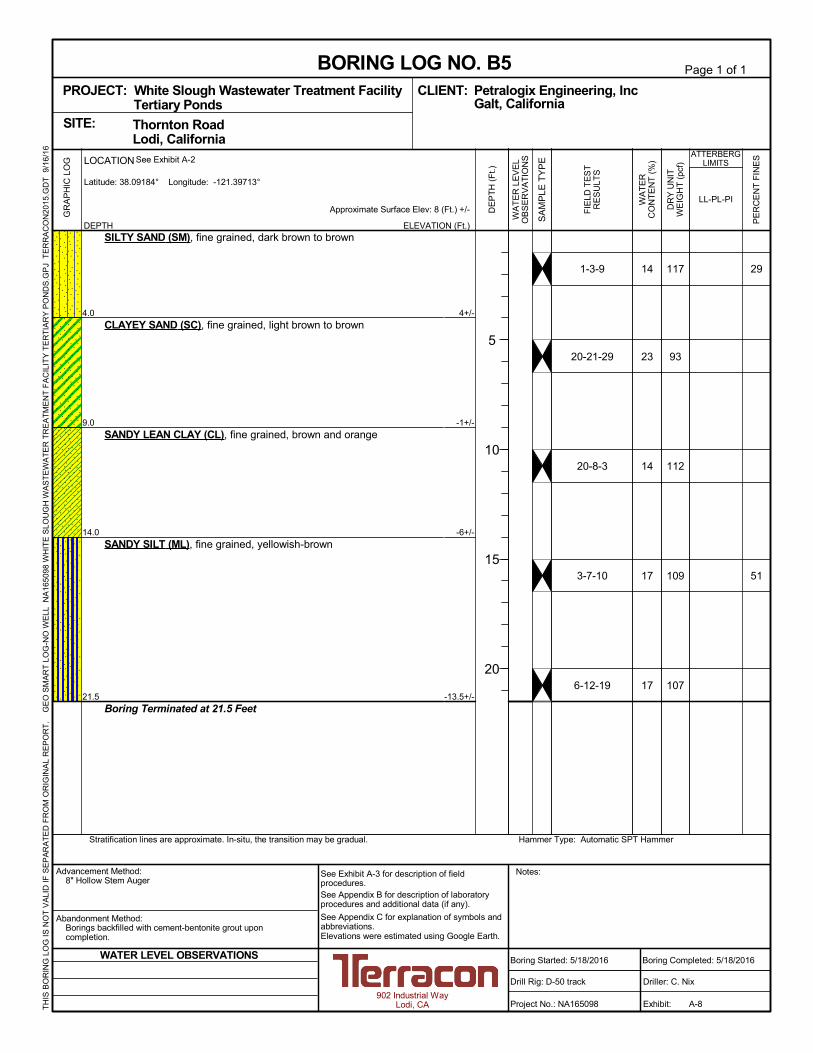
In general, the upper on-site materials encountered in our borings generally consisted of stiffto very stiff sandy silt and very loose to medium dense silty sand. These upper soils extendedto depths of between 4 and 9 feet bgs. An exception to these conditions was encountered inboring B4 where the upper 4 feet consisted of sandy lean clay. The upper soils were underlainby interbedded layers of very soft to hard sandy silt, very loose to dense sand with varyingamounts of silt, and very stiff to hard lean clay with sand that extended to the maximum depthsexplored. For a more detailed description of the soil lithology, see the attached Boring Logsin Appendix A.
Groundwater was encountered in two of the exploratory borings at depths of approximately 5and 8 feet bgs at the time of the investigation. The borings were not allowed to stay open foran extended period of time for safety purposes, so the groundwater depth should beconsidered approximate and may fluctuate in the future.
The project site is not mapped for potential liquefaction hazard by the California GeologicSurvey (CGS), however saturated cohesionless soils were encountered within the upper 50

Final Geotechnical Engineering Services ReportWhite Slough Wastewater Treatment Facility Tertiary Ponds ■ Lodi, CaliforniaDecember 16, 2016 ■ Terracon Project No. NA165098
Responsive ■ Resourceful ■ Reliable ii
feet. A detailed evaluation of liquefaction potential was performed for this project and issummarized in the following report.
A seepage and slope stability analysis of the proposed embankments was performed. Theresults of these analyses are presented in this report.
Based on the soil conditions encountered in our borings, the tertiary pond embankments maybe constructed with material from within the upper 2 feet of the proposed pond locations.Some of the material may need to be blended to meet the project specifications.
This summary should be used in conjunction with the entire report for design purposes. It shouldbe recognized that details were not included or fully developed in this section, and the report mustbe read in its entirety for a comprehensive understanding of the items contained herein. Thesection titled GENERAL COMMENTS should be read for an understanding of the reportlimitations.

Responsive ■ Resourceful ■ Reliable 1
FINAL GEOTECHNICAL ENGINEERING SERVICES REPORTWHITE SLOUGH WASTEWATER TREATMENT FACILITY
TERTIARY PONDSLODI, CALIFORNIA
Terracon Project No. NA165098December 16, 2016
1.0 INTRODUCTION
This report present the results of our final geotechnical engineering services performed for theproposed tertiary ponds at the White Slough Wastewater Facility on Thornton Road in Lodi,California. Logs of the borings along with a site location map and exploration plan are includedin Appendix A of this report.
Our geotechnical engineering scope of work for this project included drilling six (6) borings forsubsurface exploration, laboratory testing, geotechnical engineering analysis, and preparation ofthis report. Four (4) of the borings were advanced to 21½ feet below the existing ground surface(bgs) and two (2) borings were advanced to 51½ feet bgs. All of the borings were drilled at thelocations of the planned embankments for the ponds. Additional borings are planned to beperformed at the location of the proposed pump station and pipeline that will be included in thisproject. An addendum will be prepared when those borings are completed. Therecommendations for the pump station and pipeline contained in this report are preliminary onlyand need to be confirmed with data obtained from the planned additional borings.
The purpose of these services is to provide information and geotechnical engineeringrecommendations relative to:
subsurface soil conditions seepage analysis groundwater conditions foundations and below grade walls
slope stability analysis earthwork recommendations preliminary recommendations for the
design and construction of the pumpstation and pipeline
Final Geotechnical Engineering Services ReportWhite Slough Wastewater Treatment Facility Tertiary Ponds ■ Lodi, CaliforniaDecember 16, 2016 ■ Terracon Project No. NA165098
Responsive ■ Resourceful ■ Reliable 2
2.0 PROJECT INFORMATION
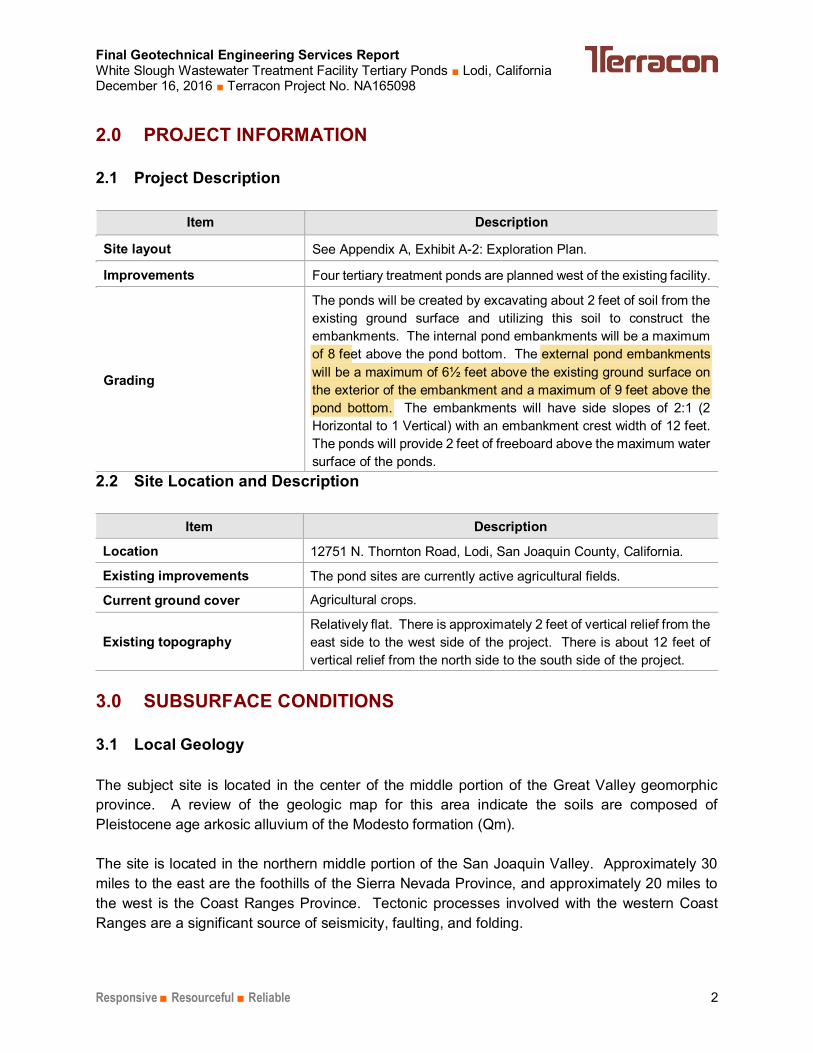
2.1 Project Description
Item Description
Site layout See Appendix A, Exhibit A-2: Exploration Plan.
Improvements Four tertiary treatment ponds are planned west of the existing facility.
Grading
The ponds will be created by excavating about 2 feet of soil from theexisting ground surface and utilizing this soil to construct theembankments. The internal pond embankments will be a maximumof 8 feet above the pond bottom. The external pond embankmentswill be a maximum of 6½ feet above the existing ground surface onthe exterior of the embankment and a maximum of 9 feet above thepond bottom. The embankments will have side slopes of 2:1 (2Horizontal to 1 Vertical) with an embankment crest width of 12 feet.The ponds will provide 2 feet of freeboard above the maximum watersurface of the ponds.
2.2 Site Location and Description
Item Description
Location 12751 N. Thornton Road, Lodi, San Joaquin County, California.
Existing improvements The pond sites are currently active agricultural fields.
Current ground cover Agricultural crops.
Existing topographyRelatively flat. There is approximately 2 feet of vertical relief from theeast side to the west side of the project. There is about 12 feet ofvertical relief from the north side to the south side of the project.
3.0 SUBSURFACE CONDITIONS
3.1 Local Geology
The subject site is located in the center of the middle portion of the Great Valley geomorphicprovince. A review of the geologic map for this area indicate the soils are composed ofPleistocene age arkosic alluvium of the Modesto formation (Qm).
The site is located in the northern middle portion of the San Joaquin Valley. Approximately 30miles to the east are the foothills of the Sierra Nevada Province, and approximately 20 miles tothe west is the Coast Ranges Province. Tectonic processes involved with the western CoastRanges are a significant source of seismicity, faulting, and folding.

Final Geotechnical Engineering Services ReportWhite Slough Wastewater Treatment Facility Tertiary Ponds ■ Lodi, CaliforniaDecember 16, 2016 ■ Terracon Project No. NA165098
Responsive ■ Resourceful ■ Reliable 3
3.2 Faulting and Seismic Considerations
3.2.1 Seismic Site Class and Parameters
The following table presents the seismic design values and site class as calculated from theUSGS U.S. Seismic Design Maps website utilizing ASCE 7-10.
DESCRIPTION VALUE2013 California Building Code Site Classification (CBC) 1 D
Site Latitude 38.09106°
Site Longitude -121.39622°
Ss Spectral Acceleration for a Short Period 0.881g
S1 Spectral Acceleration for a 1-Second Period 0.333g
Fa Site Coefficient for a Short Period 1.148
Fv Site Coefficient for a 1-Second Period 1.733
SMs Maximum Considered Spectral Response Acceleration for a Short Period 1.011g
SM1 Maximum Considered Spectral Response Acceleration for a 1-Second Period 0.578g
SDs Design Spectral Response Acceleration for a Short Period 0.674g
SD1 Design Spectral Response Acceleration for a 1-Second Period 0.385g1 Note: The 2013 California Building Code (CBC) requires a site soil profile determination extending to a depth of100 feet for seismic site classification. The current scope does not include the required 100 foot soil profiledetermination. Borings extended to a maximum depth of 51½ feet, and this seismic site class definition considersthat similar soils continue below the maximum depth of the subsurface exploration. Additional exploration to greaterdepths could be considered to confirm the conditions below the current depth of exploration. Alternatively, ageophysical exploration by us could be utilized in order to attempt to confirm the seismic site class.
3.2.2 Faulting and Estimated Ground Motions
The subject site is located in the California Central Valley Area which is a relatively low tomoderately seismically active area. The type and magnitude of seismic hazards affecting the siteare dependent on the distance to causative faults, the intensity, and the magnitude of the seismicevent. The following table indicates the distance of the fault zones and the associated maximumcredible earthquake that can be produced by nearby seismic events, as calculated using theUnited States Geologic Survey 2008 Interactive Deaggregations program. The Green ValleyConnected Characteristic Fault, which is located about 56 kilometers from the site, is consideredto have the most significant effect at the site from a design standpoint.
Fault Name% Contribution Approximate
Distance to Site(kilometers)
Maximum CredibleEarthquake (MCE)
MagnitudeGreen Valley Connected Char 4.11 56.2 6.89
Mount Diablo Thrust D2.1 & D2.4, C 3.28 47.2 6.61

Final Geotechnical Engineering Services ReportWhite Slough Wastewater Treatment Facility Tertiary Ponds ■ Lodi, CaliforniaDecember 16, 2016 ■ Terracon Project No. NA165098
Responsive ■ Resourceful ■ Reliable 4
The USGS Design Maps Detailed Report evaluates the Peak Ground Acceleration (PGAM) to be0.368g. Based on the 2008 interactive deaggregations, the PGA at the subject site for a 2%probability of exceedance in 50 years (return period of 2475 years) is expected to be about0.439g. The site is not located within an Alquist-Priolo Earthquake Fault Zone based on ourreview of State Fault Hazard Maps.1
3.3 Soil Conditions
Based on the results of the borings, subsurface conditions on the project site can be generalizedas follows:
StratumApproximate Depth to
Bottom of Stratum(feet)
Material Description Consistency/ Density
1 4 to 7½1 Sandy Silt Very Loose to Medium Dense
2 4 to 92 Silty Sand; Sandy Lean ClayVery Loose to Medium Dense;
Stiff
3 19
Interbedded layers of SandySilt, Silty Sand, Poorly GradedSand with Silt, Clayey Sand,
Sandy Lean Clay
Very loose to Dense, Stiff
4 24 Lean Clay with Sand Very Stiff to Hard
5 51½Silty Sand, Clayey Sand,Sandy Silt, Silt with Sand
Medium Dense to Dense
1. Encountered in borings B1 and B6.2. Encountered in borings B2, B3, and B5. Sandy Lean Clay was only encountered in boring B4.
Conditions encountered at each boring location are indicated on the individual boring logs.Stratification boundaries on the boring logs represent the approximate location of changes in soiltypes; in situ, the transition between materials may be gradual. Details for each of the boringscan be found on the boring logs in Appendix A of this report.
Laboratory tests consisting of Atterberg limits and No. 200 washes were performed on a numberof samples from the borings. In addition, bulk samples collected by Petrologix from within theproposed pond construction area were delivered to our office. The approximate locations of thePetrologix samples are indicated on Plate A-2 of Appendix A. Selected samples from Petrologixwere tested for Atterberg limits and No. 200 washes to assist in evaluating the upper 2 feet of
1 California Department of Conservation Division of Mines and Geology (CDMG), “Digital Images of Official Maps of Alquist-PrioloEarthquake Fault Zones of California.
Greenville Connected Char 3.22 44.6 6.89

Final Geotechnical Engineering Services ReportWhite Slough Wastewater Treatment Facility Tertiary Ponds ■ Lodi, CaliforniaDecember 16, 2016 ■ Terracon Project No. NA165098
Responsive ■ Resourceful ■ Reliable 5
material for use within the pond embankments. The test results from the samples collected fromthe borings are included on the boring logs. The results of the testing performed on samples fromour borings and Petrologix are summarized in Appendix B.
In addition to the bulk samples from Petrologix, we obtained two samples of the near surface soilsfor Resistance Value (R-value) testing for use in designing pavement sections. The results of theR-value tests are included in Appendix B.
3.4 Groundwater
Groundwater was encountered at depths of 5 and 8 feet bgs in two of our borings at the time theborings were drilled. It is unknown why we did not encounter groundwater in our other borings.A groundwater study by others including additional test borings by us may be warranted in anattempt to determine the depth of groundwater throughout the site. These test holes were notallowed to remain open for an extended period of time; therefore, the measured depth ofgroundwater should be considered approximate.
We understand Petrologix performed some percolation tests within the proposed tertiary pondareas. For those tests, groundwater was encountered at depths between 3 and 6½ feet bgs.
Groundwater conditions in the future could change due to rainfall, construction activities, irrigation,or other factors. The evaluation of these factors is beyond the scope of this study. Due to potentialfluctuation of groundwater depths and the historical groundwater data, a groundwater depth of noless than 3 feet bgs should be utilized for design purposes unless a more detailed groundwaterstudy is performed.
3.5 Liquefaction Potential
Liquefaction is a mode of ground failure that results from the generation of excess pore-waterpressures during earthquake ground shaking, causing loss of shear strength. This phenomenongenerally occurs in areas of high seismicity, where groundwater is shallow, and loose granularsoils. Strong seismic shaking can also cause cyclic softening of saturated relatively non-plasticfine-grained soils. The California Geologic Survey (CGS) has designated certain areas withinCalifornia as potential liquefaction hazard zones. These are areas considered at a risk ofliquefaction-related ground failure during a seismic event, based upon mapped surficial depositsand the likely presence of a relatively shallow water table. This site is not mapped within adesignated area of potential liquefaction.
However due to the depth to groundwater and the relatively cohesionless soils encountered inour exploratory borings, two liquefaction analyses were conducted with data from borings B1 andB2 utilizing the SPT correlation procedures set forth by Idriss and Boulanger (2014). We assumeda groundwater depth of 5 feet bgs in our analyses based on recent and historic groundwater

Final Geotechnical Engineering Services ReportWhite Slough Wastewater Treatment Facility Tertiary Ponds ■ Lodi, CaliforniaDecember 16, 2016 ■ Terracon Project No. NA165098
Responsive ■ Resourceful ■ Reliable 6
elevations. The analysis method uses correlations based on SPT blow counts recorded atuniform intervals throughout the boring. Based on the analyses, the liquefaction potential is judgedto be relatively low. Potential liquefaction-induced settlement was calculated based on the soilconditions encountered in borings B1 and B2. In our opinion, potential settlement fromliquefaction is relatively minor and expected to be about 1½ inches total settlement with differentialsettlement expected to be about ½ this value across the site based on the soil conditions at boringB1. Liquefaction induced settlement based on the soil conditions at boring B2 are expected to beless than ½ inch. Estimates of settlement due to liquefaction are generally expected to vary onthe order of a factor of 2. In considering potential liquefaction-induced settlement at this site, wehave also considered that the soils are Pleistocene age deposits. Research has indicated thatPleistocene age soils do not typically undergo liquefaction due to aging effects of the deposit.
4.0 FINAL GEOTECHNICAL ENGINEERING ANALYSES
Seepage and slope stability analyses of the proposed pond embankments were performed usingcomputer models. The models were performed utilizing the general criteria from the Urban LeveeDesign Criteria (ULDC), even though the pond embankments (levees) do not protect an urbanarea. The ULDC was developed by the California Department of Water Resources (DWR) forapplication to the design and construction of levees protecting urban environments. However,the ULDC contains some of the most up to date methods and recommendations for the designand construction of levees.
Since the ponds will likely have water in them a majority of the time, we considered theembankments to be “frequently loaded” which the ULDC defines as embankments that“experiences a water surface elevation of 1 foot or higher above the elevation of the landsidelevee toe at least once a day for more than 36 days per year on average.”
The waterside of the embankment refers to the inside slope of the ponds; the landside refers tothe outside slope of the ponds. The proposed pond embankments will have waterside andlandside slopes of 2 horizontal to 1 vertical, the crown width will be 12 feet, and the maximumheight of the embankment will be about 6½ feet above the existing ground surface and 9 feetabove the pond bottoms. It is proposed that the pond embankments be constructed of compactedengineered fill obtained from the upper 2 feet or so of soil from the bottoms of the ponds. Theponds will designed to provide at least 2 feet of freeboard above the design water surfaceelevation. The maximum amount of head that the ponds will experience will therefore be 4½ feetabove the landside toe of the embankment.
For both the seepage and slope stability analyses, we analyzed the embankment for a steady-state seepage condition with water at the design water surface elevation. We used a soilstratigraphy model based on the most conservative soil profile from our field explorations, whichwas from boring B2. We used presumptive values for the hydraulic conductivity and strengthparameters of the compacted embankment and underlying natural soil deposits. These values

Final Geotechnical Engineering Services ReportWhite Slough Wastewater Treatment Facility Tertiary Ponds ■ Lodi, CaliforniaDecember 16, 2016 ■ Terracon Project No. NA165098
Responsive ■ Resourceful ■ Reliable 7
were selected based on our experience with similar type soils in the Central Valley and our recentexperience with the DWR Urban Levee Evaluation project. We considered a range of values inour analyses.
We have also considered potential settlement of the new pond embankments. Based on the soilconditions encountered in our borings and our experience with similar soils, in our opinionsettlement from the new embankments is anticipated to be relatively minor and should occur asthe embankments are constructed.
In addition to the pond embankments, a pump station and associated 18-inch diameter inlet/outletpipeline are also planned to be constructed as part of this project. The pump station will beconstructed at the southwest corner of the new ponds. The pipeline will extend from the newpump station east/northeast to the existing treatment facility, as well as under the western pondembankment. The pump station will extend approximately 15 feet below the existing groundsurface. The pipeline will be approximately 6 to 8 feet below the existing ground surface.
4.1 Seepage Analysis
We performed a seepage analysis of the proposed tertiary pond embankments using thecomputer program SEEP/W by Geo-Slope International.
Based on our analysis, seepage through the pond embankments is not likely to result in boils orcause significant stability problems. The exit gradient at the toe of the embankment wascalculated to be approximately 0.3. This value is lower than the ULDC criteria at the embankmenttoe of 0.5. Exit gradients greater than 0.5 indicate a high potential for boils to occur. Therefore,from a steady state seepage perspective, the pond embankments can be constructed as planned,in accordance with the recommendations presented in this report. The results of our seepageanalysis are presented in Appendix C.
Some minor seepage through the embankments may occur shortly after construction. However,we anticipate the amount of seepage to be relatively minor and to slow down or stop after a shortperiod of time as silt and other material from the effluent water will tend to seal the inside of thepond embankment. Some seepage may occur through the bottom of the pond but this is notexpected to surface in areas adjacent to the ponds. We anticipate seepage through the bottomsof the ponds will migrate vertically downward into the ground.
4.2 Slope Stability Analysis
We performed a slope stability analysis of the proposed tertiary pond embankments using thecomputer program SLOPE/W by Geo-Slope International.

Final Geotechnical Engineering Services ReportWhite Slough Wastewater Treatment Facility Tertiary Ponds ■ Lodi, CaliforniaDecember 16, 2016 ■ Terracon Project No. NA165098
Responsive ■ Resourceful ■ Reliable 8
Based on our analysis, the calculated factor of safety against a slope failure for steady stateseepage static conditions is 1.8. This factor of safety is greater than the ULDC recommendedfactor of safety for levees of 1.5 for static conditions. Therefore, from a slope stability standpoint,the pond embankments can be constructed as planned, in accordance with the recommendationspresented in this report. The results of our slope stability analysis are presented in Appendix C.
5.0 RECOMMENDATIONS
5.1 Earthwork
The following presents recommendations for site preparation, excavation, subgrade preparationand placement of engineered fills on the project. The recommendations presented are for thedesign and construction of the pond embankments and are contingent upon following therecommendations outlined in this section. All grading for the embankments should incorporatethe limits of the proposed embankments plus a lateral distance of at least five feet beyond theoutside edges of the slopes.
5.1.1 Site Preparation
Strip and remove existing debris, vegetation, and other deleterious materials from the outline ofthe proposed embankments plus 5 feet beyond the proposed toe of the embankments. Exposedsurfaces should be free of mounds and depressions, which could prevent uniform compaction.
The area beneath the proposed embankments should be overexcavated to a depth of 3 feet belowthe existing ground surface. This may require local dewatering in order to reach therecommended depth and compaction. The exposed subgrade should then be scarified to a depthof 12 inches and compacted to the relative density specified in Section 5.2.1. The overexcavatedmaterial should be placed and compacted as engineered fill to the density specified in Section5.2.1.
5.2 Material Requirements
All engineered fill materials for the proposed embankments from any source should be inorganicsoils free of vegetation, debris, and fragments larger than three inches in size.
Imported earth materials for use as engineered fill should be pre-approved by Terracon prior toconstruction. On-site soils may be used for pond embankment construction, although they maynot meet the requirements for the minimum Plasticity Index listed below unless they are mixedwith the more clayey soils encountered within the proposed pond locations. Imported soils mayalso be used as fill material provided they meet the requirements in this section.
The State Reclamation Board has requirements for engineered fill for new levees. Theserequirements are presented below. These requirements are for levees providing flood protection

Final Geotechnical Engineering Services ReportWhite Slough Wastewater Treatment Facility Tertiary Ponds ■ Lodi, CaliforniaDecember 16, 2016 ■ Terracon Project No. NA165098
Responsive ■ Resourceful ■ Reliable 9
and so may be altered somewhat for a project such as this. Imported soils for use as compactedengineered fill material within the proposed embankment areas should conform to materials asindicated as follows:
Percent Finer by WeightGradation (ASTM C 136)3” ......................................................................................................... 100No. 4 Sieve ..................................................................................... 80-100No. 200 Sieve ............................................................................... 20 (min) Liquid Limit ....................................................................... 45 (max) Plasticity Index .................................................................... 8 (min)
5.2.1 Compaction Requirements
Engineered fill should be placed and compacted in horizontal lifts, using equipment andprocedures that will produce recommended moisture contents and densities throughout the lift.Fill lifts should not exceed twelve inches loose thickness.
All fill placed below and within the pond embankments should be compacted to a minimum of 90percent relative compaction based on the maximum dry density obtained in the ASTM D1557 testmethod at a moisture content at least 1 percent above the optimum moisture content.
Since most fill slopes are constructed with a loosely or poorly compacted surface, the fill slopesshould be slightly overbuilt and trimmed back to firm, compacted soil.
5.3 Grading and Drainage
All final grades must provide effective drainage away from the pond embankments during andafter construction. Water permitted to pond next to the embankments can result in slope stabilityissues at the toes of the embankments. Stormwater runoff should be directed away from theembankments and be collected and discharged away from the embankments. Also, if water isallowed to pond at the toe of the embankments, it will not be possible to detect water that may beseeping from the embankment. A rigorous maintenance program should be planned to keepvegetation from growing on the sides of the embankment as well as controlling rodents burrowinginto the embankments. Care should also be taken to not undercut the toes of the embankmentsduring maintenance operations.
5.4 Earthwork Construction Considerations
It is anticipated that excavations for the proposed construction can be accomplished withconventional earthmoving equipment. Based upon the subsurface conditions determined fromthe geotechnical exploration, subgrade soils exposed during construction are anticipated to berelatively workable. On-site fine grained soils may pump or become unworkable at high water

Final Geotechnical Engineering Services ReportWhite Slough Wastewater Treatment Facility Tertiary Ponds ■ Lodi, CaliforniaDecember 16, 2016 ■ Terracon Project No. NA165098
Responsive ■ Resourceful ■ Reliable 10
contents. As previously mentioned, groundwater is relatively close to the existing ground surfaceand excavations of the existing ground may encounter difficulty from the high groundwater. Theworkability of the subgrade may be affected by precipitation, repetitive construction traffic or otherfactors. If unworkable conditions develop, workability may be improved by scarifying and drying.If the construction schedule does not allow for scarifying and drying by aeration in place, soilstabilization by the addition of chemical agents, such as cement or lime may be required. If soilstabilization is needed, Terracon should be consulted to evaluate the situation as needed.
The pond embankment slopes should be covered with some type of erosion control measureimmediately after construction. Erosion control measures can consist of erosion resistantvegetation, jute netting, or rip rap. These should be installed per the manufacturer’sspecifications. Some minor, relatively shallow erosion should be anticipated and planned for.Routine maintenance will be required on all embankment slopes. Any detected problems shouldbe repaired immediately. It is important that the bottom of all embankments be protected fromerosion or undercutting that could jeopardize the integrity of the slope. Substantial slope failurecould occur if the bottoms of the slopes are not protected. A rigorous program of reducing theamount of animal burrows should be in place to reduce the potential for seepage-relatedproblems.
The surface soils at the site primarily consist of silty sands and sandy silts which are typicallysubject to significant wind/water erosion. The project civil engineer, while developing the plans,should plan to limit wind/water erosion during and after construction to a level acceptable to theowner. Rip rap or other erosion control measures should be implemented to reduce the potentialfor wave damage to the waterside slope of the embankments.
As a minimum, all temporary excavations should be sloped or braced as required by OccupationalSafety and Health Administration (OSHA) regulations to provide stability and safe workingconditions. The contractor, by his contract, is responsible for designing and constructing stable,temporary excavations (including utility trenches) as required to maintain stability of both theexcavation sides and bottom. Excavations should be sloped or shored in the interest of safetyfollowing local and federal regulations, including current OSHA excavation and trench safetystandards.
Terracon should be retained during the construction phase of the project to observeearthwork and to perform necessary materials tests and observations during subgradepreparation, proof-rolling, placement and compaction of controlled compacted fills, andconstruction of the embankments to the completed grades.
We recommend that the earthwork portion of this project be completed during extended periodsof dry weather if possible. If earthwork is completed during the wet season (typically Octoberthrough April) it may be necessary to take extra precautionary measures to protect subgrade soils.Wet season earthwork may require additional mitigation measures beyond that which would be

Final Geotechnical Engineering Services ReportWhite Slough Wastewater Treatment Facility Tertiary Ponds ■ Lodi, CaliforniaDecember 16, 2016 ■ Terracon Project No. NA165098
Responsive ■ Resourceful ■ Reliable 11
expected during the drier summer and fall months. This could include diversion of surface runoffaround exposed soils and draining of ponded water on the site. Once subgrades are established,it may be necessary to protect the exposed subgrade soils from construction traffic.
5.5 Pump Station and Pipeline Design and Construction
The recommendations for the pump station and pipeline contained in this report are preliminaryonly and need to be confirmed with data obtained from the planned additional borings.
5.5.1 Pump Station Design and Construction
The excavation for the pump station will extend to about 15 to 17 feet below the existing groundsurface. Groundwater was encountered at a depth 5 feet bgs in boring B1, the closest boring tothe proposed pump station location. Groundwater should be lowered to a depth of at least 3 feetbelow the bottom of the proposed pump station foundation. If the bottom of the excavation is stillunstable after dewatering, then the excavation should be overexcavated another 12 inches, thena geotextile, such as Mirafi RS289i, should be placed in the bottom of the excavation and 12inches of ¾-inch crushed gravel be placed to stabilize the bottom of the excavation.
The soils encountered in boring B1 consisted of sandy silt soils to a depth of 19 feet bgs. Thesesoils varied in consistency from very soft to stiff. These soils will likely not be stable due to arelatively high moisture content. Since these soils will need to be sloped back to side slopes ofbetween 1½ to 1 (horizontal to vertical) and 2 to 1, this will require a fairly large excavation. Inlieu of excavating a “glory hole” to construct the pump station, we anticipate that the excavationwill be made with sheet piling to provide stable slopes. The sheet pile should be designed by acontractor familiar with these types of soil and groundwater conditions. The individualcontractor(s) is responsible for designing and constructing stable, temporary excavations asrequired to maintain stability of both the pump station excavation sides and bottom. Excavationsshould be sloped or shored in the interest of safety following local, and federal regulations,including current OSHA excavation and trench safety standards.
Sheet pile walls should be designed to resist lateral soil pressures of 55 pcf for soils above thewater table and 92 pcf for soils below groundwater. This value includes the hydrostatic pressureof groundwater.
In order to resist uplift/buoyant forces from groundwater, we recommend the base of thefoundation be extended horizontally to provide uplift resistance. A buoyant unit weight of soil of60 pounds per cubic foot may be used to calculate the uplift resistance of the soil column abovethe foundation. The pump station should be designed to withstand buoyant forces assuming agroundwater depth of 3 feet below the existing ground surface.
Backfill around the pump station should be compacted to a minimum of 95 percent relativecompaction based on the maximum dry density obtained in the ASTM D1557 test method up to

Final Geotechnical Engineering Services ReportWhite Slough Wastewater Treatment Facility Tertiary Ponds ■ Lodi, CaliforniaDecember 16, 2016 ■ Terracon Project No. NA165098
Responsive ■ Resourceful ■ Reliable 12
within 5 feet of the ground surface. The upper 5 feet of backfill should be compacted to a minimumof 90 percent relative compaction based on the maximum dry density obtained in the ASTMD1557 test method. We caution that inadequate compaction of the backfill can result inunacceptable settlement of the backfill which could damage pipes coming into or connected tothe pump station.
The pump station foundation may be designed for an allowable bearing pressure of 2,500 poundsper square foot for dead plus live load. This value may be increased by 1/3 to account for windor seismic forces. Buoyant forces may also be resisted by the friction created from the overburdensoil weight against the concrete sides of the pump station or the steel sheet piling. An adhesionfriction resistance of 0.40 and 0.35 may be used between the soil and concrete or steel sheetpiling, respectively.
Due to the stress relief from excavating 15 feet of soil, the anticipated total settlement of the pumpstation will be less than ½ inch. This should occur during construction.
Lateral loads on the pump station walls should be designed for the at-rest condition since thewalls will not deflect. The at-rest pressure for the soil conditions encountered in boring B-1 is 55pcf for soils above the water table and 92 pcf for soils below groundwater. This value includesthe hydrostatic pressure of groundwater.
5.5.2 18-inch Tertiary Pipeline Design and Construction
An 18-inch diameter pipeline will extend from the new pump station east/northeast to the existingtreatment facility as well as extending northwest beneath the west pond embankment. Thepipeline will be 6 to 8 feet below the existing ground surface. Since we anticipate groundwaterwill be encountered at a depth of about 3 to 5 feet bgs, it will be necessary to dewater theexcavation to allow construction of the pipeline. Depending on the depth of groundwaterencountered in the excavation, it may be possible to control the seepage with only a sump pump.However, if the excavation extends 1 to 2 feet below groundwater, the groundwater will need tobe lowered to allow construction of the pipeline. A single stage well point system may be needed.A single stage well point system is where small diameter wells are installed by jetting, driving orboring methods. Once the wells are installed they are connected to a manifold which feeds to alarge pump. An experienced dewatering contractor shall review our boring logs and project plansto determine the most suitable method of dewatering. We recommend that the groundwater belowered to at least 2 feet below the bottom of the excavation. If the bottom of the excavation isunstable, we recommend overexcavating the trench 6 to 12 inches, and placing ¾-inch crushedgravel in the bottom to stabilize the trench bottom. If necessary to further stabilize the bottom ofthe trench, then a geotextile, such as Mirafi RS289i, should be placed in the bottom of the trenchprior to placement of the gravel. The pipe should then be placed and backfilled in accordancewith City of Lodi standards. According to the City of Lodi standards, the on-site soils classify asClass 3 Pipe Bedding material.

Final Geotechnical Engineering Services ReportWhite Slough Wastewater Treatment Facility Tertiary Ponds ■ Lodi, CaliforniaDecember 16, 2016 ■ Terracon Project No. NA165098
Responsive ■ Resourceful ■ Reliable 13
Since sandy silt and silty sand soils were encountered within the upper 8 feet throughout theproject site, it may be necessary to shore the pipeline trench excavation. The individualcontractor(s) is responsible for designing and constructing stable, temporary excavations asrequired to maintain stability of both the trench excavation sides and bottom. Excavations shouldbe sloped or shored in the interest of safety following local, and federal regulations, includingcurrent OSHA excavation and trench safety standards.
5.6 Pavements
5.6.1 Design Considerations
Detailed traffic patterns and anticipated loading conditions were not available at the time that thisreport was prepared. We have provided pavement sections for traffic indices (TI) of 4.0 and 5.0.Two samples of the near surface soils were tested in our laboratory to determine their ResistanceValue (R-value). The tests produced results of 10 and 59. The approximate locations of the R-value samples is shown on Plate A-2.
Based on the potential of varying silt content which may alter the R-value, design R-Values of 10and 50 was used to calculate the Asphalt Concrete (AC) pavement thickness sections. The ACpavement sections were calculated using the Caltrans Highway Design Manual, latest edition,and a 20-year design life. We recommend additional R-value testing of the pavement subgradesoils during the mass grading operations to determine the appropriate pavement sectiondepending on the R-value of the subgrade soil at the finish pavement elevation.
Pavement design methods are intended to provide structural sections with adequate thicknessover a particular subgrade such that wheel loads are reduced to a level the subgrade can support.
Pavement performance is affected by its surroundings. In addition to providing preventivemaintenance, the civil engineer should consider the following recommendations in the design andlayout of pavements:
Final grade adjacent to paved areas should slope down from the edges at a minimum 2%; The subgrade and pavement surface should have a minimum 2% slope to promote proper
surface drainage; Install below pavement drainage systems surrounding areas anticipated for frequent
wetting; Install joint sealant and seal cracks immediately; Seal all landscaped areas in or adjacent to pavements to reduce moisture migration to
subgrade soils by embedding curbs a minimum of 6 inches into the native soils; Place compacted, low permeability non-expansive backfill against the exterior side of
curbs and gutters.

Final Geotechnical Engineering Services ReportWhite Slough Wastewater Treatment Facility Tertiary Ponds ■ Lodi, CaliforniaDecember 16, 2016 ■ Terracon Project No. NA165098
Responsive ■ Resourceful ■ Reliable 14
Assuming the pavement subgrades will be prepared as recommended within this report, thefollowing pavement sections should be considered minimums for this project for the traffic indicesassumed in the table below. If more specific traffic information becomes available, we should becontacted to reevaluate the pavement calculations.
Minimum AC Pavement Section (inches)Traffic Area R-value Traffic Index Asphalt
ConcreteAggregate
BaseTotal
ThicknessAutomobile 10 4.0 2.5 7.0 11.0Automobile 50 4.0 2.5 4.0 6.5
MaintenanceVehicles
10 5.0 3.0 9.0 12.0
MaintenanceVehicles
50 5.0 3.0 4.0 7.0
All pavement materials should meet the Caltrans Standard Specifications for HighwayConstruction, latest edition.
Rigid PCC pavements will perform better than AC in areas where short-radii turning and brakingare expected (i.e. entrance/exit aprons) due to better resistance to rutting and shoving. Inaddition, PCC pavement will perform better in areas subject to large or sustained loads. Werecommend rigid pavement for the dumpster area to include the area where the trucks will pickup the dumpster. An adequate number of longitudinal and transverse control joints should beplaced in the rigid pavement in accordance with ACI and/or AASHTO requirements. Expansion(isolation) joints must be full depth and should only be used to isolate fixed objects abutting orwithin the paved area.
Graveled access roads for lightweight maintenance vehicles should consist of 12 inches ofcompacted aggregate base over compacted native subgrade.
5.6.2 Pavement Drainage
Pavements should be sloped to provide rapid drainage of surface water. Water allowed to pondon or adjacent to the pavements could saturate the subgrade and contribute to prematurepavement deterioration. In addition, the pavement subgrade should be graded to provide positivedrainage within the granular base section.
5.6.3 Pavement Maintenance
The pavement sections provided in this report represent minimum recommended thicknessesand, as such, periodic maintenance should be anticipated. Therefore preventive maintenanceshould be planned and provided for through an on-going pavement management program.Maintenance activities are intended to slow the rate of pavement deterioration and to preserve

Final Geotechnical Engineering Services ReportWhite Slough Wastewater Treatment Facility Tertiary Ponds ■ Lodi, CaliforniaDecember 16, 2016 ■ Terracon Project No. NA165098
Responsive ■ Resourceful ■ Reliable 15
the pavement investment. Maintenance consists of both localized maintenance (e.g. crack andjoint sealing and patching) and global maintenance (e.g. surface sealing). Preventivemaintenance is usually the first priority when implementing a pavement maintenance program.
5.6.4 Construction Considerations
Additional engineering observation is recommended to determine the type and extent of a costeffective program. Even with periodic maintenance, some movements and related cracking maystill occur and repairs may be required.Materials and construction of pavements for the project should be in accordance with therequirements and specifications of Caltrans Standard Specifications for Highway Construction,latest edition.
Base course or pavement materials should not be placed when the surface is wet. Surfacedrainage should be provided away from the edge of paved areas to minimize lateral moisturetransmission into the subgrade.
6.0 GENERAL COMMENTS
Terracon should be retained to review the final design plans and specifications so comments canbe made regarding interpretation and implementation of our geotechnical recommendations in thedesign and specifications. Terracon also should be retained to provide observation and testingservices during grading, excavation, embankment construction and other earth-relatedconstruction phases of the project.
The analysis and recommendations presented in this final report are based upon the dataobtained from the borings performed at the indicated locations and from other informationdiscussed in this report and should only be used for planning purposes and should not be usedto develop construction documents. This final report does not reflect variations that may occurbetween borings, across the site, or due to the modifying effects of construction or weather. Thenature and extent of such variations may not become evident until during or after construction. Ifvariations appear, we should be immediately notified so that further evaluation and supplementalrecommendations can be provided.
The scope of services for this project does not include either specifically or by implication anyenvironmental assessment of the site or identification or prevention of pollutants, hazardousmaterials or conditions. If the owner is concerned about the potential for such contamination orpollution, other studies should be undertaken.
This report has been prepared for the exclusive use of our client for specific application to theproject discussed and has been prepared in accordance with generally accepted geotechnicalengineering practices. No warranties, either express or implied, are intended or made. Site

Final Geotechnical Engineering Services ReportWhite Slough Wastewater Treatment Facility Tertiary Ponds ■ Lodi, CaliforniaDecember 16, 2016 ■ Terracon Project No. NA165098
Responsive ■ Resourceful ■ Reliable 16
safety, excavation support, and dewatering requirements are the responsibility of others. In theevent that changes in the nature, design, or location of the project as outlined in this report areplanned, the conclusions and recommendations contained in this report shall not be consideredvalid unless Terracon reviews the changes and either verifies or modifies the conclusions of thisreport in writing.

APPENDIX AFIELD EXPLORATION
TOPO
GR
APHIC
MA
P IMAG
E CO
UR
TESY O
F TH
E U.S. G
EOLO
GIC
AL SUR
VEY
QU
ADR
ANG
LES INC
LUD
E: TERM
INO
US, C
A (1/1/1997) and LO
DI SO
UTH
, CA (1/1/1976).
SITE LOC
ATION
W
hite Slough W
PCF Storage E
xpansion Improvem
ent Project
12751 N. Thornton R
oad Lodi, C
A
902 Industrial Way
Lodi, CA
95240-3106
NA
165098
DIAG
RAM
IS FOR
GEN
ERAL LO
CATIO
N O
NLY,
AND
IS NO
T INTEN
DED
FOR
CO
NSTR
UC
TION
PU
RPO
SES
Project Manager:
Drawn by:
Checked by: Approved by: C
BC
PC
D
PC
D
PC
D
N/A
Dec. 2016
Project No.
File Name:
Date: A
-1
Exhibit
SITE
1”=2,000’ Scale:

EX
PLOR
ATION
PLAN
902 Industrial Way
Lodi, CA
95240-3106
NA
165098 AER
IAL PHO
TOG
RAPH
Y PRO
VIDED
BY M
ICR
OSO
FT BING
MAP
S W
hite Slough W
PCF Storage E
xpansion Im
provement Project
12751 N. Thornton R
oad Lodi, C
A
DIAG
RAM
IS FOR
GEN
ERAL LO
CATIO
N O
NLY,
AND
IS NO
T INTEN
DED
FOR
CO
NSTR
UC
TION
PU
RPO
SES
Project Manager:
Drawn by:
Checked by: Approved by: C
BC
PC
D
PC
D
PC
D
N/A
Dec. 2016
Scale: Project No.
File Name:
Date: AS
SH
OW
N A
-2
Exhibit
Final Geotechnical Engineering Services ReportWhite Slough Wastewater Treatment Facility Tertiary Ponds ■ Lodi, CaliforniaDecember 16, 2016 ■ Terracon Project No. NA165098
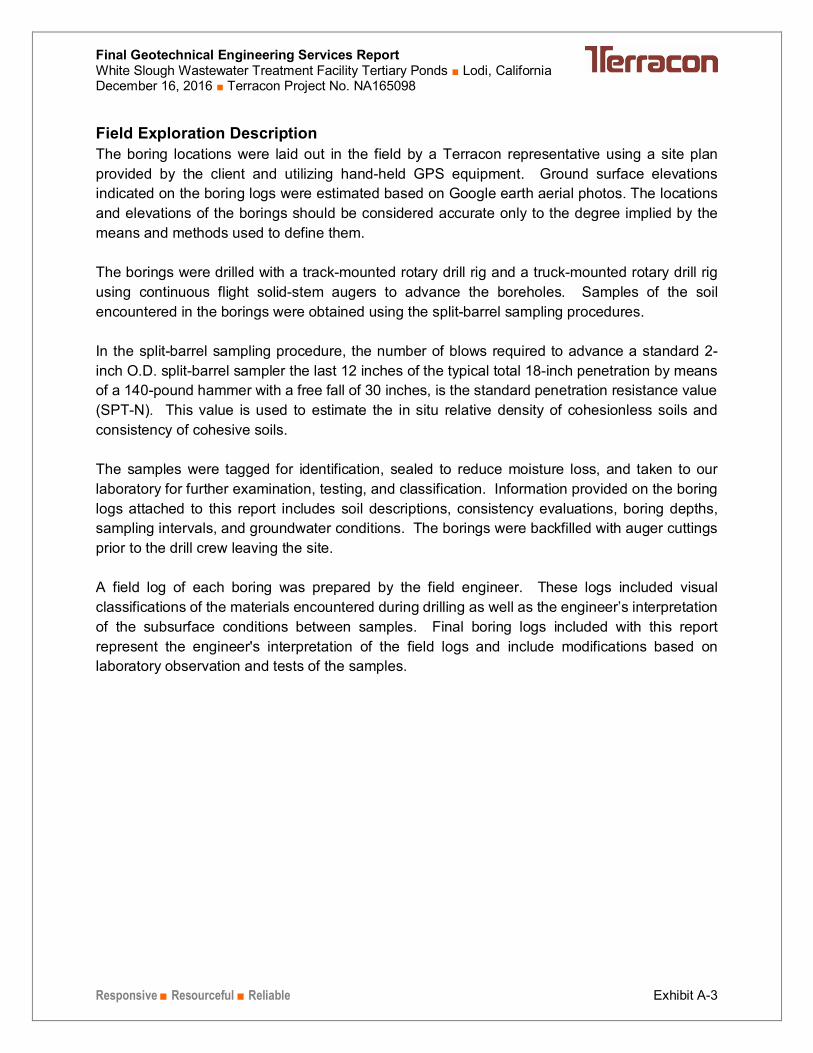
Responsive ■ Resourceful ■ Reliable Exhibit A-3
Field Exploration DescriptionThe boring locations were laid out in the field by a Terracon representative using a site planprovided by the client and utilizing hand-held GPS equipment. Ground surface elevationsindicated on the boring logs were estimated based on Google earth aerial photos. The locationsand elevations of the borings should be considered accurate only to the degree implied by themeans and methods used to define them.
The borings were drilled with a track-mounted rotary drill rig and a truck-mounted rotary drill rigusing continuous flight solid-stem augers to advance the boreholes. Samples of the soilencountered in the borings were obtained using the split-barrel sampling procedures.
In the split-barrel sampling procedure, the number of blows required to advance a standard 2-inch O.D. split-barrel sampler the last 12 inches of the typical total 18-inch penetration by meansof a 140-pound hammer with a free fall of 30 inches, is the standard penetration resistance value(SPT-N). This value is used to estimate the in situ relative density of cohesionless soils andconsistency of cohesive soils.
The samples were tagged for identification, sealed to reduce moisture loss, and taken to ourlaboratory for further examination, testing, and classification. Information provided on the boringlogs attached to this report includes soil descriptions, consistency evaluations, boring depths,sampling intervals, and groundwater conditions. The borings were backfilled with auger cuttingsprior to the drill crew leaving the site.
A field log of each boring was prepared by the field engineer. These logs included visualclassifications of the materials encountered during drilling as well as the engineer’s interpretationof the subsurface conditions between samples. Final boring logs included with this reportrepresent the engineer's interpretation of the field logs and include modifications based onlaboratory observation and tests of the samples.

5-9-14N=23
3-0-1N=1
4-5-8N=13
5-10-9N=19
12-19-19N=38
4-4-12N=16
19.0
24.0
SANDY SILT (ML), fine to medium, brown
brown and gray
LEAN CLAY WITH SAND (CL), fine to medium, brown
SILTY SAND (SM), fine to medium, brown
fine to coarse, brown
66
14
17
15
18
18
26
30-20-10
-18+/-
-23+/-
GR
APH
IC L
OG
Hammer Type: Automatic SPT HammerStratification lines are approximate. In-situ, the transition may be gradual.
THIS
BO
RIN
G L
OG
IS N
OT
VALI
D IF
SEP
ARAT
ED F
RO
M O
RIG
INAL
REP
OR
T.
GEO
SM
ART
LOG
-NO
WEL
L N
A165
098
WH
ITE
SLO
UG
H W
ASTE
WAT
ER T
REA
TMEN
T FA
CIL
ITY
TER
TIAR
Y PO
ND
S.G
PJ T
ERR
ACO
N20
15.G
DT
9/1
6/16
FIEL
D T
EST
RES
ULT
S
DEPTH
LOCATION
Latitude: 38.08744° Longitude: -121.39494°
See Exhibit A-2
PER
CEN
T FI
NES
WAT
ERC
ON
TEN
T (%
)
DR
Y U
NIT
WEI
GH
T (p
cf)
LL-PL-PI
ATTERBERGLIMITS
ELEVATION (Ft.)
Approximate Surface Elev: 1 (Ft.) +/-
SAM
PLE
TYPE
WAT
ER L
EVEL
OBS
ERVA
TIO
NS
DEP
TH (F
t.)
5
10
15
20
25
Thornton Road Lodi, CaliforniaSITE:
Page 1 of 2
Advancement Method:8" Hollow Stem Auger
Abandonment Method:Borings backfilled with cement-bentonite grout uponcompletion.
902 Industrial WayLodi, CA
Notes:
Project No.: NA165098
Drill Rig: CME-75
Boring Started: 5/16/2016
BORING LOG NO. B1Petralogix Engineering, IncCLIENT:Galt, California
Driller: C. Nix
Boring Completed: 5/17/2016
Exhibit: A-4
See Exhibit A-3 for description of fieldprocedures.See Appendix B for description of laboratoryprocedures and additional data (if any).See Appendix C for explanation of symbols andabbreviations.Elevations were estimated using Google Earth.
PROJECT: White Slough Wastewater Treatment FacilityTertiary Ponds
While samplingWATER LEVEL OBSERVATIONS

10-14-13N=27
3-1-2N=3
12-15-23N=38
5-6-9N=15
10-10-16N=26
34.0
39.0
49.0
51.5
SILTY SAND (SM), fine to medium, brown (continued)
SANDY SILT (ML), fine to medium, gray to yellowish-brown
SILTY SAND (SM), fine to coarse, yellowish-brown
fine grained, brown
CLAYEY SAND (SC), fine grained, brown
Boring Terminated at 51.5 Feet
18
51
43
16
37
21
20
17
-33+/-
-38+/-
-48+/-
-50.5+/-
GR
APH
IC L
OG
Hammer Type: Automatic SPT HammerStratification lines are approximate. In-situ, the transition may be gradual.
THIS
BO
RIN
G L
OG
IS N
OT
VALI
D IF
SEP
ARAT
ED F
RO
M O
RIG
INAL
REP
OR
T.
GEO
SM
ART
LOG
-NO
WEL
L N
A165
098
WH
ITE
SLO
UG
H W
ASTE
WAT
ER T
REA
TMEN
T FA
CIL
ITY
TER
TIAR
Y PO
ND
S.G
PJ T
ERR
ACO
N20
15.G
DT
9/1
6/16
FIEL
D T
EST
RES
ULT
S
DEPTH
LOCATION
Latitude: 38.08744° Longitude: -121.39494°
See Exhibit A-2
PER
CEN
T FI
NES
WAT
ERC
ON
TEN
T (%
)
DR
Y U
NIT
WEI
GH
T (p
cf)
LL-PL-PI
ATTERBERGLIMITS
ELEVATION (Ft.)
Approximate Surface Elev: 1 (Ft.) +/-
SAM
PLE
TYPE
WAT
ER L
EVEL
OBS
ERVA
TIO
NS
DEP
TH (F
t.)
30
35
40
45
50
Thornton Road Lodi, CaliforniaSITE:
Page 2 of 2
Advancement Method:8" Hollow Stem Auger
Abandonment Method:Borings backfilled with cement-bentonite grout uponcompletion.
902 Industrial WayLodi, CA
Notes:
Project No.: NA165098
Drill Rig: CME-75
Boring Started: 5/16/2016
BORING LOG NO. B1Petralogix Engineering, IncCLIENT:Galt, California
Driller: C. Nix
Boring Completed: 5/17/2016
Exhibit: A-4
See Exhibit A-3 for description of fieldprocedures.See Appendix B for description of laboratoryprocedures and additional data (if any).See Appendix C for explanation of symbols andabbreviations.Elevations were estimated using Google Earth.
PROJECT: White Slough Wastewater Treatment FacilityTertiary Ponds
While samplingWATER LEVEL OBSERVATIONS
4-4-3N=7
7-8-10N=18
4-4-7N=11
5-7-24N=31
6-7-12N=19
6-9-14N=23
9.0
14.0
19.0
24.0
SILTY SAND (SM), fine to medium, dark brown
yellowish-brown
POORLY GRADED SAND (SP), fine to coarse, brown and orange
CLAYEY SAND (SC), fine to medium, brown, rust mottling
LEAN CLAY WITH SAND (CL), fine grained, brown, rust mottling
SILT WITH SAND (ML), fine grained, yellowish-brown
3
64
10
14
21
16
39
22 45-29-16
4+/-
-1+/-
-6+/-
-11+/-
GR
APH
IC L
OG
Hammer Type: Automatic SPT HammerStratification lines are approximate. In-situ, the transition may be gradual.
THIS
BO
RIN
G L
OG
IS N
OT
VALI
D IF
SEP
ARAT
ED F
RO
M O
RIG
INAL
REP
OR
T.
GEO
SM
ART
LOG
-NO
WEL
L N
A165
098
WH
ITE
SLO
UG
H W
ASTE
WAT
ER T
REA
TMEN
T FA
CIL
ITY
TER
TIAR
Y PO
ND
S.G
PJ T
ERR
ACO
N20
15.G
DT
9/1
6/16
FIEL
D T
EST
RES
ULT
S
DEPTH
LOCATION
Latitude: 38.09429° Longitude: -121.39682°
See Exhibit A-2
PER
CEN
T FI
NES
WAT
ERC
ON
TEN
T (%
)
DR
Y U
NIT
WEI
GH
T (p
cf)
LL-PL-PI Approximate Surface Elev: 13 (Ft.) +/-
SAM
PLE
TYPE
WAT
ER L
EVEL
OBS
ERVA
TIO
NS
DEP
TH (F
t.)
5
10
15
20
25
Thornton Road Lodi, CaliforniaSITE:
Page 1 of 2
Advancement Method:8" Hollow Stem Auger
Abandonment Method:Borings backfilled with cement-bentonite grout uponcompletion.
902 Industrial WayLodi, CA
Notes:
Project No.: NA165098
Drill Rig: D-50 track
ATTERBERGLIMITS
ELEVATION (Ft.)
Boring Started: 5/18/2016
BORING LOG NO. B2Petralogix Engineering, IncCLIENT:Galt, California
Driller: C. Nix
Boring Completed: 5/18/2016
Exhibit: A-5
See Exhibit A-3 for description of fieldprocedures.See Appendix B for description of laboratoryprocedures and additional data (if any).See Appendix C for explanation of symbols andabbreviations.Elevations were estimated using Google Earth.
PROJECT: White Slough Wastewater Treatment FacilityTertiary Ponds
While drillingWATER LEVEL OBSERVATIONS

7-8-12N=20
6-6-11N=17
5-6-12N=18
8-9-12N=21
14-14-14N=28
44.0
51.5
SILT WITH SAND (ML), fine grained, yellowish-brown (continued)
fine to medium, yellowish-brown, rust mottling
fine to medium, brown to light brown, rust mottling
yellowish-brown, rust and black mottling
SILTY SAND (SM), fine to medium, yellowish-brown, rust mottling
Boring Terminated at 51.5 Feet
61
76
44
34
32
33
26
22
-31+/-
-38.5+/-
GR
APH
IC L
OG
Hammer Type: Automatic SPT HammerStratification lines are approximate. In-situ, the transition may be gradual.
THIS
BO
RIN
G L
OG
IS N
OT
VALI
D IF
SEP
ARAT
ED F
RO
M O
RIG
INAL
REP
OR
T.
GEO
SM
ART
LOG
-NO
WEL
L N
A165
098
WH
ITE
SLO
UG
H W
ASTE
WAT
ER T
REA
TMEN
T FA
CIL
ITY
TER
TIAR
Y PO
ND
S.G
PJ T
ERR
ACO
N20
15.G
DT
9/1
6/16
FIEL
D T
EST
RES
ULT
S
DEPTH
LOCATION
Latitude: 38.09429° Longitude: -121.39682°
See Exhibit A-2
PER
CEN
T FI
NES
WAT
ERC
ON
TEN
T (%
)
DR
Y U
NIT
WEI
GH
T (p
cf)
LL-PL-PI Approximate Surface Elev: 13 (Ft.) +/-
SAM
PLE
TYPE
WAT
ER L
EVEL
OBS
ERVA
TIO
NS
DEP
TH (F
t.)
30
35
40
45
50
Thornton Road Lodi, CaliforniaSITE:
Page 2 of 2
Advancement Method:8" Hollow Stem Auger
Abandonment Method:Borings backfilled with cement-bentonite grout uponcompletion.
902 Industrial WayLodi, CA
Notes:
Project No.: NA165098
Drill Rig: D-50 track
ATTERBERGLIMITS
ELEVATION (Ft.)
Boring Started: 5/18/2016
BORING LOG NO. B2Petralogix Engineering, IncCLIENT:Galt, California
Driller: C. Nix
Boring Completed: 5/18/2016
Exhibit: A-5
See Exhibit A-3 for description of fieldprocedures.See Appendix B for description of laboratoryprocedures and additional data (if any).See Appendix C for explanation of symbols andabbreviations.Elevations were estimated using Google Earth.
PROJECT: White Slough Wastewater Treatment FacilityTertiary Ponds
While drillingWATER LEVEL OBSERVATIONS

1-2-6
3-4-6
11-15-19
10-14-16
9-6-7
14.0
21.5
SILTY SAND (SM), fine grained, dark brown to brown
light brown to brown
rust mottling
SANDY SILT (ML), fine grained, brown, rust and black mottling
Boring Terminated at 21.5 Feet
48
48
14
23
27
31
23
100
92
97
85
98
36-33-3
-7+/-
-14.5+/-
GR
APH
IC L
OG
Hammer Type: Automatic SPT HammerStratification lines are approximate. In-situ, the transition may be gradual.
THIS
BO
RIN
G L
OG
IS N
OT
VALI
D IF
SEP
ARAT
ED F
RO
M O
RIG
INAL
REP
OR
T.
GEO
SM
ART
LOG
-NO
WEL
L N
A165
098
WH
ITE
SLO
UG
H W
ASTE
WAT
ER T
REA
TMEN
T FA
CIL
ITY
TER
TIAR
Y PO
ND
S.G
PJ T
ERR
ACO
N20
15.G
DT
9/1
6/16
FIEL
D T
EST
RES
ULT
S
DEPTH
LOCATION
Latitude: 38.09245° Longitude: -121.39881°
See Exhibit A-2
PER
CEN
T FI
NES
WAT
ERC
ON
TEN
T (%
)
DR
Y U
NIT
WEI
GH
T (p
cf)
LL-PL-PI
ATTERBERGLIMITS
ELEVATION (Ft.)
Approximate Surface Elev: 7 (Ft.) +/-
SAM
PLE
TYPE
WAT
ER L
EVEL
OBS
ERVA
TIO
NS
DEP
TH (F
t.)
5
10
15
20
Thornton Road Lodi, CaliforniaSITE:
Page 1 of 1
Advancement Method:8" Hollow Stem Auger
Abandonment Method:Borings backfilled with cement-bentonite grout uponcompletion.
902 Industrial WayLodi, CA
Notes:
Project No.: NA165098
Drill Rig: D-50 track
Boring Started: 5/17/2016
BORING LOG NO. B3Petralogix Engineering, IncCLIENT:Galt, California
Driller: C. Nix
Boring Completed: 5/17/2016
Exhibit: A-6
See Exhibit A-3 for description of fieldprocedures.See Appendix B for description of laboratoryprocedures and additional data (if any).See Appendix C for explanation of symbols andabbreviations.Elevations were estimated using Google Earth.
PROJECT: White Slough Wastewater Treatment FacilityTertiary Ponds
WATER LEVEL OBSERVATIONS

4-6-6
2-3-7
4-6-8
6-10-18
4-10-18
4.0
14.0
19.0
21.5
SANDY LEAN CLAY (CL), fine grained, black
SILTY SAND (SM), fine grained, light brown
fine to medium, dark brown
SANDY SILT (ML), fine to medium, brown, black mottling
POORLY GRADED SAND (SP), fine to medium, brown with gray
Boring Terminated at 21.5 Feet
48
16
28
27
30
26
98
90
91
92
96
44-32-12
0+/-
-10+/-
-15+/-
-17.5+/-
GR
APH
IC L
OG
Hammer Type: Automatic SPT HammerStratification lines are approximate. In-situ, the transition may be gradual.
THIS
BO
RIN
G L
OG
IS N
OT
VALI
D IF
SEP
ARAT
ED F
RO
M O
RIG
INAL
REP
OR
T.
GEO
SM
ART
LOG
-NO
WEL
L N
A165
098
WH
ITE
SLO
UG
H W
ASTE
WAT
ER T
REA
TMEN
T FA
CIL
ITY
TER
TIAR
Y PO
ND
S.G
PJ T
ERR
ACO
N20
15.G
DT
9/1
6/16
FIEL
D T
EST
RES
ULT
S
DEPTH
LOCATION
Latitude: 38.08965° Longitude: -121.39732°
See Exhibit A-2
PER
CEN
T FI
NES
WAT
ERC
ON
TEN
T (%
)
DR
Y U
NIT
WEI
GH
T (p
cf)
LL-PL-PI
ATTERBERGLIMITS
ELEVATION (Ft.)
Approximate Surface Elev: 4 (Ft.) +/-
SAM
PLE
TYPE
WAT
ER L
EVEL
OBS
ERVA
TIO
NS
DEP
TH (F
t.)
5
10
15
20
Thornton Road Lodi, CaliforniaSITE:
Page 1 of 1
Advancement Method:8" Hollow Stem Auger
Abandonment Method:Borings backfilled with cement-bentonite grout uponcompletion.
902 Industrial WayLodi, CA
Notes:
Project No.: NA165098
Drill Rig: D-50 track
Boring Started: 5/18/2016
BORING LOG NO. B4Petralogix Engineering, IncCLIENT:Galt, California
Driller: C. Nix
Boring Completed: 5/18/2016
Exhibit: A-7
See Exhibit A-3 for description of fieldprocedures.See Appendix B for description of laboratoryprocedures and additional data (if any).See Appendix C for explanation of symbols andabbreviations.Elevations were estimated using Google Earth.
PROJECT: White Slough Wastewater Treatment FacilityTertiary Ponds
WATER LEVEL OBSERVATIONS
1-3-9
20-21-29
20-8-3
3-7-10
6-12-19
4.0
9.0
14.0
21.5
SILTY SAND (SM), fine grained, dark brown to brown
CLAYEY SAND (SC), fine grained, light brown to brown
SANDY LEAN CLAY (CL), fine grained, brown and orange
SANDY SILT (ML), fine grained, yellowish-brown
Boring Terminated at 21.5 Feet
29
51
14
23
14
17
17
117
93
112
109
107
4+/-
-1+/-
-6+/-
-13.5+/-
GR
APH
IC L
OG
Hammer Type: Automatic SPT HammerStratification lines are approximate. In-situ, the transition may be gradual.
THIS
BO
RIN
G L
OG
IS N
OT
VALI
D IF
SEP
ARAT
ED F
RO
M O
RIG
INAL
REP
OR
T.
GEO
SM
ART
LOG
-NO
WEL
L N
A165
098
WH
ITE
SLO
UG
H W
ASTE
WAT
ER T
REA
TMEN
T FA
CIL
ITY
TER
TIAR
Y PO
ND
S.G
PJ T
ERR
ACO
N20
15.G
DT
9/1
6/16
FIEL
D T
EST
RES
ULT
S
DEPTH
LOCATION
Latitude: 38.09184° Longitude: -121.39713°
See Exhibit A-2
PER
CEN
T FI
NES
WAT
ERC
ON
TEN
T (%
)
DR
Y U
NIT
WEI
GH
T (p
cf)
LL-PL-PI
ATTERBERGLIMITS
ELEVATION (Ft.)
Approximate Surface Elev: 8 (Ft.) +/-
SAM
PLE
TYPE
WAT
ER L
EVEL
OBS
ERVA
TIO
NS
DEP
TH (F
t.)
5
10
15
20
Thornton Road Lodi, CaliforniaSITE:
Page 1 of 1
Advancement Method:8" Hollow Stem Auger
Abandonment Method:Borings backfilled with cement-bentonite grout uponcompletion.
902 Industrial WayLodi, CA
Notes:
Project No.: NA165098
Drill Rig: D-50 track
Boring Started: 5/18/2016
BORING LOG NO. B5Petralogix Engineering, IncCLIENT:Galt, California
Driller: C. Nix
Boring Completed: 5/18/2016
Exhibit: A-8
See Exhibit A-3 for description of fieldprocedures.See Appendix B for description of laboratoryprocedures and additional data (if any).See Appendix C for explanation of symbols andabbreviations.Elevations were estimated using Google Earth.
PROJECT: White Slough Wastewater Treatment FacilityTertiary Ponds
WATER LEVEL OBSERVATIONS

4-5-7
2-2-3
4-6-9
11-15-18
11-18-26
4.0
21.021.5
SANDY SILT (ML), fine grained, black to brown
SILTY SAND (SM), fine grained, brown
fine to coarse, brown, rust mottling
POORLY GRADED SAND (SP), fine to coarse, brown and orangeBoring Terminated at 21.5 Feet
56
26
14
23
14
17
17
117
93
112
109
107
3+/-
-14+/--14.5+/-
GR
APH
IC L
OG
Hammer Type: Automatic SPT HammerStratification lines are approximate. In-situ, the transition may be gradual.
THIS
BO
RIN
G L
OG
IS N
OT
VALI
D IF
SEP
ARAT
ED F
RO
M O
RIG
INAL
REP
OR
T.
GEO
SM
ART
LOG
-NO
WEL
L N
A165
098
WH
ITE
SLO
UG
H W
ASTE
WAT
ER T
REA
TMEN
T FA
CIL
ITY
TER
TIAR
Y PO
ND
S.G
PJ T
ERR
ACO
N20
15.G
DT
9/1
6/16
FIEL
D T
EST
RES
ULT
S
DEPTH
LOCATION
Latitude: 38.09189° Longitude: -121.39355°
See Exhibit A-2
PER
CEN
T FI
NES
WAT
ERC
ON
TEN
T (%
)
DR
Y U
NIT
WEI
GH
T (p
cf)
LL-PL-PI
ATTERBERGLIMITS
ELEVATION (Ft.)
Approximate Surface Elev: 7 (Ft.) +/-
SAM
PLE
TYPE
WAT
ER L
EVEL
OBS
ERVA
TIO
NS
DEP
TH (F
t.)
5
10
15
20
Thornton Road Lodi, CaliforniaSITE:
Page 1 of 1
Advancement Method:8" Hollow Stem Auger
Abandonment Method:Borings backfilled with cement-bentonite grout uponcompletion.
902 Industrial WayLodi, CA
Notes:
Project No.: NA165098
Drill Rig: D-50 track
Boring Started: 5/18/2016
BORING LOG NO. B6Petralogix Engineering, IncCLIENT:Galt, California
Driller: C. Nix
Boring Completed: 5/18/2016
Exhibit: A-9
See Exhibit A-3 for description of fieldprocedures.See Appendix B for description of laboratoryprocedures and additional data (if any).See Appendix C for explanation of symbols andabbreviations.Elevations were estimated using Google Earth.
PROJECT: White Slough Wastewater Treatment FacilityTertiary Ponds
WATER LEVEL OBSERVATIONS

APPENDIX BLABORATORY TESTING

Final Geotechnical Engineering Services ReportWhite Slough Wastewater Treatment Facility Tertiary Ponds ■ Lodi, CaliforniaDecember 16, 2016 ■ Terracon Project No. NA165098
Responsive ■ Resourceful ■ Reliable Exhibit B-1
Laboratory TestingSoil samples were tested in the laboratory to measure their natural water content and unit weights.A calibrated hand penetrometer was used to estimate the approximate unconfined compressivestrength of some samples. The calibrated hand penetrometer has been correlated withunconfined compression tests and provides a better estimate of soil consistency than visualexamination alone. The test results are provided on the boring logs included in Appendix A.
Descriptive classifications of the soils indicated on the boring logs are in accordance with theenclosed General Notes and the Unified Soil Classification System. Also shown are estimatedUnified Soil Classification Symbols. A brief description of this classification system is attached tothis report. All classification was by visual manual procedures. Selected samples were furtherclassified using the results of Atterberg limits and Wash No. 200 testing. The Atterberg limit testand Wash No. 200 test results are also provided on the boring logs.
Bulk samples obtained by Petrologix from within the proposed pond construction area weredelivered to our Lodi laboratory. Selected samples were tested for Atterberg limits and Wash No.200 testing. A summary of laboratory test results of the Petrologix and Terracon samples isincluded in this appendix.
Two Resistance Value (R-value) tests were also performed on near surface samples. The R-value test results are also included in this appendix.

0
10
20
30
40
50
60
0 20 40 60 80 100
CH or
OH
CL or
OL
ML or OL
MH or OH
PL PIBoring ID Depth DescriptionFines
PLASTICITY
INDEX
LIQUID LIMIT
"U" L
ine
"A" Line
30453644
20293332
10163
12
LL USCS
B1B2B3B4
ATTERBERG LIMITS RESULTSASTM D4318
20 - 21.525 - 26.515 - 16.515 - 16.5
902 Industrial WayLodi, CA
PROJECT NUMBER: NA165098PROJECT: White Slough Wastewater
Treatment Facility TertiaryPonds
SITE: Thornton Road Lodi, California
CLIENT: Petralogix Engineering, Inc Galt, California
EXHIBIT: B-2
LABO
RAT
OR
Y TE
STS
ARE
NO
T VA
LID
IF S
EPAR
ATED
FR
OM
OR
IGIN
AL R
EPO
RT.
A
TTER
BER
G L
IMIT
S N
A165
098
WH
ITE
SLO
UG
H W
ASTE
WAT
ER T
REA
TMEN
T FA
CIL
ITY
TER
TIAR
Y PO
ND
S.G
PJ T
ERR
ACO
N20
15.G
DT
9/1
6/16
CL-ML

Petrologix Samples Test Results
Sample ID Liquid Limit Plasticity Index Passing No. 200Bulk 1 38Bulk 2 25 12 61Bulk 3 34 16 65Bulk 4 30 13 66Bulk 5 34
Bulk 10 31 14 60Bulk 11 30 13 56Bulk 12 31 12 50Bulk 13 37
Terracon Samples Test Results
Boring No. Depth, ft. Liquid Limit Plasticity Index Passing No. 200B1 10 66B1 20 30 10B1 30 18B1 35 51B1 45 43B2 10 3B2 20 64B2 25 45 16B2 30 61B2 40 76B2 45 44B3 1 48B3 10 48B3 15 36 3B4 5 48B4 15 44 12B5 1 29B5 15 51B6 1 56B6 10 26
Exhibit B-3

JOB NAME: White Slough WPCF JOB #: NA165098SAMPLE NUMBER: RV_1
300 0300 90
59 Exhibit B-4
R-VALUE AT 300 PSIEXUDATIONPRESSURE:
0
10
20
30
40
50
60
70
80
90
0100200300400500600700800
R-VA
LUE
(AD
JUST
ED)
EXUDATION PRESSURE (PSI)
R-VALUE GRAPH
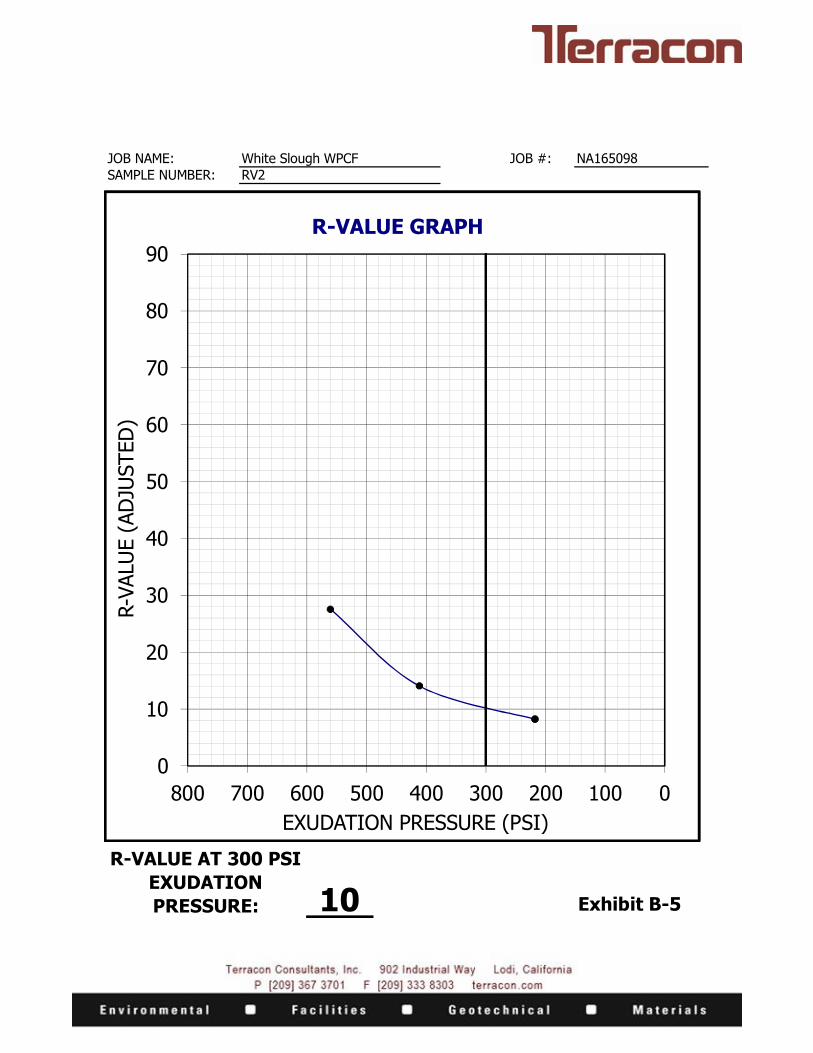
JOB NAME: White Slough WPCF JOB #: NA165098SAMPLE NUMBER: RV2
300 0300 90
10 Exhibit B-5
R-VALUE AT 300 PSIEXUDATIONPRESSURE:
0
10
20
30
40
50
60
70
80
90
0100200300400500600700800
R-VA
LUE
(AD
JUST
ED)
EXUDATION PRESSURE (PSI)
R-VALUE GRAPH

APPENDIX CSUPPORTING DOCUMENTS

GENERAL NOTES
Modified Cal
Exhibit: C-1

UNIFIED SOIL CLASSIFICATION SYSTEM
Criteria for Assigning Group Symbols and Group Names Using Laboratory Tests A Soil Classification
Group Symbol Group Name B
Coarse Grained Soils: More than 50% retained on No. 200 sieve
Gravels: More than 50% of coarse fraction retained on No. 4 sieve
Clean Gravels: Less than 5% fines C
Cu t 4 and 1 d Cc d 3 E GW Well-graded gravel F Cu � 4 and/or 1 ! Cc ! 3 E GP Poorly graded gravel F
Gravels with Fines: More than 12% fines C
Fines classify as ML or MH GM Silty gravel F,G,H Fines classify as CL or CH GC Clayey gravel F,G,H
Sands: 50% or more of coarse fraction passes No. 4 sieve
Clean Sands: Less than 5% fines D
Cu t 6 and 1 d Cc d 3 E SW Well-graded sand I Cu � 6 and/or 1 ! Cc ! 3 E SP Poorly graded sand I
Sands with Fines: More than 12% fines D
Fines classify as ML or MH SM Silty sand G,H,I Fines classify as CL or CH SC Clayey sand G,H,I
Fine-Grained Soils: 50% or more passes the No. 200 sieve
Silts and Clays: Liquid limit less than 50
Inorganic: PI ! 7 and plots on or above “A” line J CL Lean clay K,L,M PI � 4 or plots below “A” line J ML Silt K,L,M
Organic: Liquid limit - oven dried
� 0.75 OL Organic clay K,L,M,N
Liquid limit - not dried Organic silt K,L,M,O
Silts and Clays: Liquid limit 50 or more
Inorganic: PI plots on or above “A” line CH Fat clay K,L,M PI plots below “A” line MH Elastic Silt K,L,M
Organic: Liquid limit - oven dried
� 0.75 OH Organic clay K,L,M,P
Liquid limit - not dried Organic silt K,L,M,Q Highly organic soils: Primarily organic matter, dark in color, and organic odor PT Peat
A Based on the material passing the 3-inch (75-mm) sieve B If field sample contained cobbles or boulders, or both, add “with cobbles
or boulders, or both” to group name. C Gravels with 5 to 12% fines require dual symbols: GW-GM well-graded
gravel with silt, GW-GC well-graded gravel with clay, GP-GM poorly graded gravel with silt, GP-GC poorly graded gravel with clay.
D Sands with 5 to 12% fines require dual symbols: SW-SM well-graded sand with silt, SW-SC well-graded sand with clay, SP-SM poorly graded sand with silt, SP-SC poorly graded sand with clay
E Cu = D60/D10 Cc = 6010
2
30
DxD
)(D
F If soil contains t 15% sand, add “with sand” to group name. G If fines classify as CL-ML, use dual symbol GC-GM, or SC-SM.
H If fines are organic, add “with organic fines” to group name. I If soil contains t 15% gravel, add “with gravel” to group name. J If Atterberg limits plot in shaded area, soil is a CL-ML, silty clay. K If soil contains 15 to 29% plus No. 200, add “with sand” or “with gravel,”
whichever is predominant. L If soil contains t 30% plus No. 200 predominantly sand, add “sandy” to
group name. M If soil contains t 30% plus No. 200, predominantly gravel, add
“gravelly” to group name. N PI t 4 and plots on or above “A” line. O PI � 4 or plots below “A” line. P PI plots on or above “A” line. Q PI plots below “A” line.
Exhibit: C-2

Nam
e: Silty Sand M
odel: Saturated O
nly Sat K
x: 3e-006 ft/secN
ame: Poorly G
raded Sand M
odel: Saturated O
nly Sat K
x: 0.0003 ft/secN
ame: Lean C
lay Model: S
aturated Only S
at Kx: 3e-008 ft/sec
Nam
e: Silt Model: S
aturated Only S
at Kx: 3e-007 ft/sec
Nam
e: Clayey S
and Model: S
aturated Only S
at Kx: 3e-006 ft/sec
Nam
e: Com
pacted Silty S
and Model: S
aturated Only S
at Kx: 0.0003 ft/sec
Distance (ft)
-30-10
1030
5070
90110
130150
170190
210
Elevation (ft)
-30
-20
-10 0 10 MaterialsSilty SandPoorly G
raded SandLean C
layS
iltC
layey SandC
ompacted Silty Sand
123456
612534
NA
165098
White S
lough Wastew
ater Treatment Facility Tertiary P
onds
Seepage Analysis
Exhibit C-3

1.803
Nam
e: Silty Sand
Model: M
ohr-Coulom
b U
nit Weight: 120 pcf
Cohesion': 25 psf
Phi': 32 °N
ame: Poorly G
raded Sand
Model: M
ohr-Coulom
b U
nit Weight: 125 pcf
Cohesion': 20 psf
Phi': 36 °N
ame: Lean C
lay M
odel: Mohr-C
oulomb
Unit W
eight: 115 pcf C
ohesion': 500 psf Phi': 0 °
Nam
e: Silt M
odel: Mohr-C
oulomb
Unit W
eight: 115 pcf C
ohesion': 250 psf Phi': 0 °
Nam
e: Clayey S
and M
odel: Mohr-C
oulomb
Unit W
eight: 125 pcf C
ohesion': 75 psf Phi': 32 °
Nam
e: Com
pacted Silty S
and M
odel: Mohr-C
oulomb
Unit W
eight: 120 pcf C
ohesion': 25 psf Phi': 36 °
Distance (ft)
-30-10
1030
5070
90110
130150
170190
210
Elevation (ft)
-30
-20
-10 0 10 MaterialsSilty SandPoorly G
raded SandLean C
layS
iltC
layey SandC
ompacted Silty Sand
123456
612534
Slope Stability Analysis
Exhibit C
-4
White Slough W
astewater Treatm
ent Facility Tertiary PondsN
A165098

Design Maps Detailed Report
From Figure 22-1 [1]
From Figure 22-2 [2]
ASCE 7-10 Standard (38.09106°N, 121.39622°W)
Site Class D – “Stiff Soil”, Risk Category I/II/III
Section 11.4.1 — Mapped Acceleration Parameters
Note: Ground motion values provided below are for the direction of maximum horizontalspectral response acceleration. They have been converted from corresponding geometricmean ground motions computed by the USGS by applying factors of 1.1 (to obtain SS) and1.3 (to obtain S1). Maps in the 2010 ASCE-7 Standard are provided for Site Class B.Adjustments for other Site Classes are made, as needed, in Section 11.4.3.
SS = 0.881 g
S1 = 0.333 g
Section 11.4.2 — Site Class
The authority having jurisdiction (not the USGS), site-specific geotechnical data, and/orthe default has classified the site as Site Class D, based on the site soil properties inaccordance with Chapter 20.
Table 20.3–1 Site Classification
Site Class vS N or Nch su
A. Hard Rock >5,000 ft/s N/A N/A
B. Rock 2,500 to 5,000 ft/s N/A N/A
C. Very dense soil and soft rock 1,200 to 2,500 ft/s >50 >2,000 psf
D. Stiff Soil 600 to 1,200 ft/s 15 to 50 1,000 to 2,000 psf
E. Soft clay soil <600 ft/s <15 <1,000 psf
Any profile with more than 10 ft of soil having the characteristics:• Plasticity index PI > 20,• Moisture content w ≥ 40%, and• Undrained shear strength su < 500 psf
F. Soils requiring site responseanalysis in accordance with Section21.1
See Section 20.3.1
For SI: 1ft/s = 0.3048 m/s 1lb/ft = 0.0479 kN/m
Page 1 of 6Design Maps Detailed Report
5/24/2016http://ehp1-earthquake.cr.usgs.gov/designmaps/us/report.php?template=minimal&latitude=...
Exhibit C-5
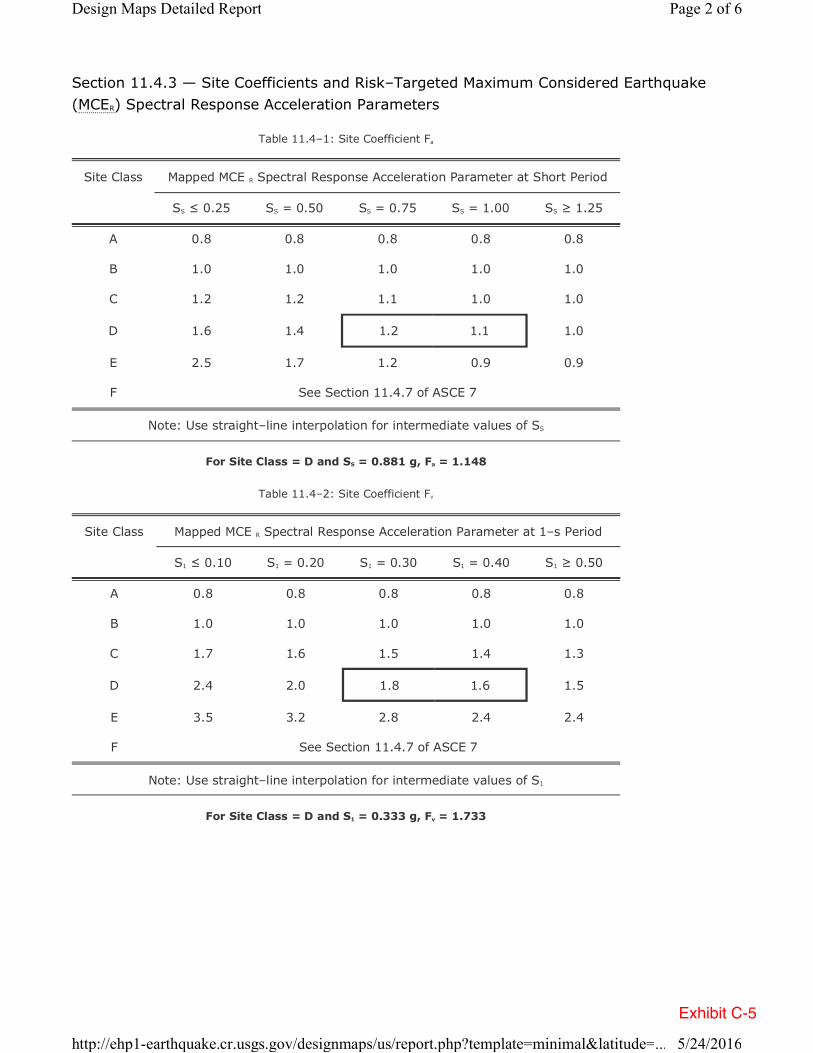
Section 11.4.3 — Site Coefficients and Risk–Targeted Maximum Considered Earthquake(MCER) Spectral Response Acceleration Parameters
Table 11.4–1: Site Coefficient Fa
Site Class Mapped MCE R Spectral Response Acceleration Parameter at Short Period
SS ≤ 0.25 SS = 0.50 SS = 0.75 SS = 1.00 SS ≥ 1.25
A 0.8 0.8 0.8 0.8 0.8
B 1.0 1.0 1.0 1.0 1.0
C 1.2 1.2 1.1 1.0 1.0
D 1.6 1.4 1.2 1.1 1.0
E 2.5 1.7 1.2 0.9 0.9
F See Section 11.4.7 of ASCE 7
Note: Use straight–line interpolation for intermediate values of SS
For Site Class = D and SS = 0.881 g, Fa = 1.148
Table 11.4–2: Site Coefficient Fv
Site Class Mapped MCE R Spectral Response Acceleration Parameter at 1–s Period
S1 ≤ 0.10 S1 = 0.20 S1 = 0.30 S1 = 0.40 S1 ≥ 0.50
A 0.8 0.8 0.8 0.8 0.8
B 1.0 1.0 1.0 1.0 1.0
C 1.7 1.6 1.5 1.4 1.3
D 2.4 2.0 1.8 1.6 1.5
E 3.5 3.2 2.8 2.4 2.4
F See Section 11.4.7 of ASCE 7
Note: Use straight–line interpolation for intermediate values of S1
For Site Class = D and S1 = 0.333 g, Fv = 1.733
Page 2 of 6Design Maps Detailed Report
5/24/2016http://ehp1-earthquake.cr.usgs.gov/designmaps/us/report.php?template=minimal&latitude=...
Exhibit C-5

Equation (11.4–1):
Equation (11.4–2):
Equation (11.4–3):
Equation (11.4–4):
From Figure 22-12 [3]
SMS = FaSS = 1.148 x 0.881 = 1.011 g
SM1 = FvS1 = 1.733 x 0.333 = 0.578 g
Section 11.4.4 — Design Spectral Acceleration Parameters
SDS = ⅔ SMS = ⅔ x 1.011 = 0.674 g
SD1 = ⅔ SM1 = ⅔ x 0.578 = 0.385 g
Section 11.4.5 — Design Response Spectrum
TL = 12 seconds
Figure 11.4–1: Design Response Spectrum
Page 3 of 6Design Maps Detailed Report
5/24/2016http://ehp1-earthquake.cr.usgs.gov/designmaps/us/report.php?template=minimal&latitude=...
Exhibit C-5

Section 11.4.6 — Risk-Targeted Maximum Considered Earthquake (MCER) ResponseSpectrum
The MCER Response Spectrum is determined by multiplying the design response spectrum above by1.5.
Page 4 of 6Design Maps Detailed Report
5/24/2016http://ehp1-earthquake.cr.usgs.gov/designmaps/us/report.php?template=minimal&latitude=...
Exhibit C-5

From Figure 22-7 [4]
Equation (11.8–1):
From Figure 22-17 [5]
From Figure 22-18 [6]
Section 11.8.3 — Additional Geotechnical Investigation Report Requirements for SeismicDesign Categories D through F
PGA = 0.309
PGAM = FPGAPGA = 1.191 x 0.309 = 0.368 g
Table 11.8–1: Site Coefficient FPGA
SiteClass
Mapped MCE Geometric Mean Peak Ground Acceleration, PGA
PGA ≤0.10
PGA =0.20
PGA =0.30
PGA =0.40
PGA ≥0.50
A 0.8 0.8 0.8 0.8 0.8
B 1.0 1.0 1.0 1.0 1.0
C 1.2 1.2 1.1 1.0 1.0
D 1.6 1.4 1.2 1.1 1.0
E 2.5 1.7 1.2 0.9 0.9
F See Section 11.4.7 of ASCE 7
Note: Use straight–line interpolation for intermediate values of PGA
For Site Class = D and PGA = 0.309 g, FPGA = 1.191
Section 21.2.1.1 — Method 1 (from Chapter 21 – Site-Specific Ground Motion Proceduresfor Seismic Design)
CRS = 1.082
CR1 = 1.130
Page 5 of 6Design Maps Detailed Report
5/24/2016http://ehp1-earthquake.cr.usgs.gov/designmaps/us/report.php?template=minimal&latitude=...
Exhibit C-5

Section 11.6 — Seismic Design Category
Table 11.6-1 Seismic Design Category Based on Short Period Response Acceleration Parameter
VALUE OF SDS
RISK CATEGORY
I or II III IV
SDS < 0.167g A A A
0.167g ≤ SDS < 0.33g B B C
0.33g ≤ SDS < 0.50g C C D
0.50g ≤ SDS D D D
For Risk Category = I and SDS = 0.674 g, Seismic Design Category = D
Table 11.6-2 Seismic Design Category Based on 1-S Period Response Acceleration Parameter
VALUE OF SD1
RISK CATEGORY
I or II III IV
SD1 < 0.067g A A A
0.067g ≤ SD1 < 0.133g B B C
0.133g ≤ SD1 < 0.20g C C D
0.20g ≤ SD1 D D DFor Risk Category = I and SD1 = 0.385 g, Seismic Design Category = D
Note: When S1 is greater than or equal to 0.75g, the Seismic Design Category is E forbuildings in Risk Categories I, II, and III, and F for those in Risk Category IV, irrespectiveof the above.
Seismic Design Category ≡ “the more severe design category in accordance withTable 11.6-1 or 11.6-2” = D
Note: See Section 11.6 for alternative approaches to calculating Seismic Design Category.
References
1. Figure 22-1:http://earthquake.usgs.gov/hazards/designmaps/downloads/pdfs/2010_ASCE-7_Figure_22-1.pdf
2. Figure 22-2:http://earthquake.usgs.gov/hazards/designmaps/downloads/pdfs/2010_ASCE-7_Figure_22-2.pdf
3. Figure 22-12: http://earthquake.usgs.gov/hazards/designmaps/downloads/pdfs/2010_ASCE-7_Figure_22-12.pdf
4. Figure 22-7:http://earthquake.usgs.gov/hazards/designmaps/downloads/pdfs/2010_ASCE-7_Figure_22-7.pdf
5. Figure 22-17: http://earthquake.usgs.gov/hazards/designmaps/downloads/pdfs/2010_ASCE-7_Figure_22-17.pdf
6. Figure 22-18: http://earthquake.usgs.gov/hazards/designmaps/downloads/pdfs/2010_ASCE-7_Figure_22-18.pdf
Page 6 of 6Design Maps Detailed Report
5/24/2016http://ehp1-earthquake.cr.usgs.gov/designmaps/us/report.php?template=minimal&latitude=...
Exhibit C-5

*** Deaggregation of Seismic Hazard at One Period of Spectral Accel. ****** Data from U.S.G.S. National Seismic Hazards Mapping Project, 2008 version ***PSHA Deaggregation. %contributions. site: NA165098 long: 121.396 W., lat: 38.091 N. Vs30(m/s)= 230.0 (some WUS atten. models use Site Class not Vs30).NSHMP 2007-08 See USGS OFR 2008-1128. dM=0.2 belowReturn period: 2475 yrs. Exceedance PGA =0.4027 g. Weight * Computed_Rate_Ex 0.406E-03#Pr[at least one eq with median motion>=PGA in 50 yrs]=0.00051#This deaggregation corresponds to Mean Hazard w/all GMPEsDIST(KM) MAG(MW) ALL_EPS EPSILON>2 1<EPS<2 0<EPS<1 -1<EPS<0 -2<EPS<-1 EPS<-2 6.8 5.05 2.733 0.666 1.641 0.425 0.000 0.000 0.000 13.7 5.05 0.812 0.749 0.063 0.000 0.000 0.000 0.000 7.0 5.20 5.206 1.032 3.014 1.160 0.000 0.000 0.000 13.9 5.20 1.973 1.614 0.359 0.000 0.000 0.000 0.000 22.6 5.21 0.187 0.187 0.000 0.000 0.000 0.000 0.000 7.2 5.40 4.726 0.736 2.515 1.453 0.023 0.000 0.000 14.1 5.40 2.373 1.603 0.770 0.000 0.000 0.000 0.000 23.2 5.41 0.423 0.423 0.000 0.000 0.000 0.000 0.000 7.3 5.60 4.057 0.527 2.014 1.419 0.097 0.000 0.000 14.3 5.60 2.532 1.339 1.193 0.000 0.000 0.000 0.000 23.8 5.60 0.721 0.717 0.004 0.000 0.000 0.000 0.000 34.9 5.62 0.063 0.063 0.000 0.000 0.000 0.000 0.000 7.5 5.80 3.310 0.372 1.594 1.228 0.115 0.000 0.000 14.4 5.80 2.445 1.035 1.397 0.012 0.000 0.000 0.000 24.2 5.80 0.971 0.906 0.065 0.000 0.000 0.000 0.000 35.1 5.81 0.177 0.177 0.000 0.000 0.000 0.000 0.000 7.5 6.01 3.583 0.337 1.758 1.401 0.088 0.000 0.000 14.6 6.01 2.755 0.906 1.756 0.093 0.000 0.000 0.000 24.3 6.00 1.073 0.905 0.167 0.000 0.000 0.000 0.000 34.0 6.02 0.435 0.435 0.000 0.000 0.000 0.000 0.000 43.7 6.01 0.132 0.132 0.000 0.000 0.000 0.000 0.000 8.1 6.20 5.100 0.454 2.552 2.027 0.067 0.000 0.000 16.1 6.20 2.517 0.773 1.650 0.094 0.000 0.000 0.000 25.2 6.20 1.174 0.877 0.297 0.000 0.000 0.000 0.000 34.2 6.20 0.616 0.596 0.019 0.000 0.000 0.000 0.000 44.2 6.22 0.316 0.316 0.000 0.000 0.000 0.000 0.000 53.5 6.21 0.091 0.091 0.000 0.000 0.000 0.000 0.000 8.0 6.40 4.453 0.324 1.882 2.143 0.104 0.000 0.000 15.7 6.40 2.632 0.586 1.832 0.213 0.000 0.000 0.000 25.2 6.40 1.355 0.814 0.541 0.000 0.000 0.000 0.000 34.8 6.40 0.750 0.671 0.079 0.000 0.000 0.000 0.000 44.8 6.47 3.235 2.977 0.258 0.000 0.000 0.000 0.000 55.1 6.45 0.482 0.482 0.000 0.000 0.000 0.000 0.000 63.1 6.43 0.098 0.098 0.000 0.000 0.000 0.000 0.000 74.9 6.46 0.129 0.129 0.000 0.000 0.000 0.000 0.000 6.0 6.60 1.340 0.082 0.484 0.692 0.083 0.000 0.000 14.5 6.60 0.757 0.140 0.523 0.094 0.000 0.000 0.000 24.9 6.60 0.506 0.277 0.229 0.000 0.000 0.000 0.000 35.9 6.60 0.181 0.155 0.026 0.000 0.000 0.000 0.000 44.3 6.60 4.735 4.009 0.726 0.000 0.000 0.000 0.000 55.6 6.59 1.701 1.649 0.051 0.000 0.000 0.000 0.000 62.5 6.60 0.463 0.463 0.000 0.000 0.000 0.000 0.000 75.5 6.63 0.334 0.334 0.000 0.000 0.000 0.000 0.000 80.8 6.58 0.062 0.061 0.000 0.000 0.000 0.000 0.000 6.2 6.80 1.057 0.060 0.358 0.569 0.070 0.000 0.000 14.5 6.80 0.855 0.133 0.568 0.154 0.000 0.000 0.000 24.7 6.80 0.408 0.175 0.233 0.000 0.000 0.000 0.000 34.8 6.80 0.188 0.145 0.043 0.000 0.000 0.000 0.000 44.4 6.76 4.698 3.190 1.508 0.000 0.000 0.000 0.000 55.4 6.76 2.198 1.907 0.291 0.000 0.000 0.000 0.000 62.0 6.77 1.197 1.141 0.055 0.000 0.000 0.000 0.000 75.8 6.79 0.964 0.964 0.000 0.000 0.000 0.000 0.000 81.9 6.79 0.085 0.085 0.000 0.000 0.000 0.000 0.000 6.3 6.95 0.417 0.023 0.136 0.230 0.030 0.000 0.000 14.6 6.95 0.439 0.060 0.279 0.100 0.000 0.000 0.000
Page 1 of 2
5/24/2016http://geohazards.usgs.gov/deaggint/2008/out/NA165098_2016.05.24_21.24.04.txt
Exhibit C-6
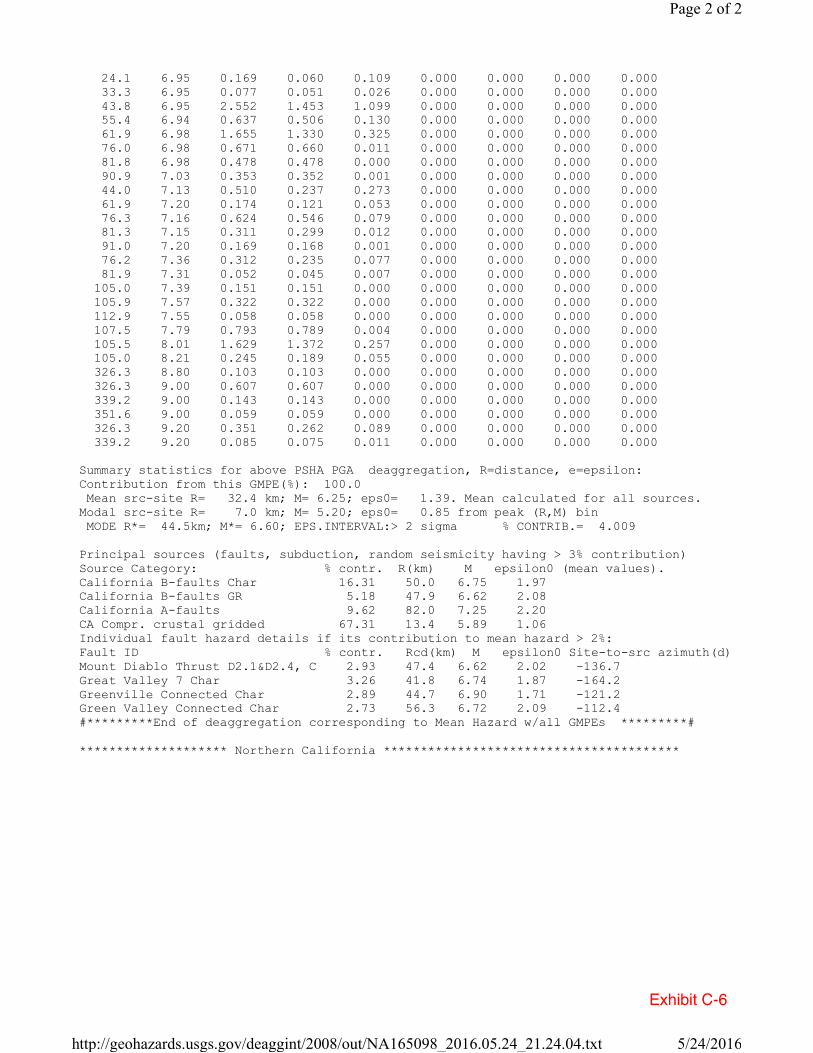
24.1 6.95 0.169 0.060 0.109 0.000 0.000 0.000 0.000 33.3 6.95 0.077 0.051 0.026 0.000 0.000 0.000 0.000 43.8 6.95 2.552 1.453 1.099 0.000 0.000 0.000 0.000 55.4 6.94 0.637 0.506 0.130 0.000 0.000 0.000 0.000 61.9 6.98 1.655 1.330 0.325 0.000 0.000 0.000 0.000 76.0 6.98 0.671 0.660 0.011 0.000 0.000 0.000 0.000 81.8 6.98 0.478 0.478 0.000 0.000 0.000 0.000 0.000 90.9 7.03 0.353 0.352 0.001 0.000 0.000 0.000 0.000 44.0 7.13 0.510 0.237 0.273 0.000 0.000 0.000 0.000 61.9 7.20 0.174 0.121 0.053 0.000 0.000 0.000 0.000 76.3 7.16 0.624 0.546 0.079 0.000 0.000 0.000 0.000 81.3 7.15 0.311 0.299 0.012 0.000 0.000 0.000 0.000 91.0 7.20 0.169 0.168 0.001 0.000 0.000 0.000 0.000 76.2 7.36 0.312 0.235 0.077 0.000 0.000 0.000 0.000 81.9 7.31 0.052 0.045 0.007 0.000 0.000 0.000 0.000 105.0 7.39 0.151 0.151 0.000 0.000 0.000 0.000 0.000 105.9 7.57 0.322 0.322 0.000 0.000 0.000 0.000 0.000 112.9 7.55 0.058 0.058 0.000 0.000 0.000 0.000 0.000 107.5 7.79 0.793 0.789 0.004 0.000 0.000 0.000 0.000 105.5 8.01 1.629 1.372 0.257 0.000 0.000 0.000 0.000 105.0 8.21 0.245 0.189 0.055 0.000 0.000 0.000 0.000 326.3 8.80 0.103 0.103 0.000 0.000 0.000 0.000 0.000 326.3 9.00 0.607 0.607 0.000 0.000 0.000 0.000 0.000 339.2 9.00 0.143 0.143 0.000 0.000 0.000 0.000 0.000 351.6 9.00 0.059 0.059 0.000 0.000 0.000 0.000 0.000 326.3 9.20 0.351 0.262 0.089 0.000 0.000 0.000 0.000 339.2 9.20 0.085 0.075 0.011 0.000 0.000 0.000 0.000
Summary statistics for above PSHA PGA deaggregation, R=distance, e=epsilon:Contribution from this GMPE(%): 100.0 Mean src-site R= 32.4 km; M= 6.25; eps0= 1.39. Mean calculated for all sources.Modal src-site R= 7.0 km; M= 5.20; eps0= 0.85 from peak (R,M) bin MODE R*= 44.5km; M*= 6.60; EPS.INTERVAL:> 2 sigma % CONTRIB.= 4.009
Principal sources (faults, subduction, random seismicity having > 3% contribution)Source Category: % contr. R(km) M epsilon0 (mean values).California B-faults Char 16.31 50.0 6.75 1.97California B-faults GR 5.18 47.9 6.62 2.08California A-faults 9.62 82.0 7.25 2.20CA Compr. crustal gridded 67.31 13.4 5.89 1.06Individual fault hazard details if its contribution to mean hazard > 2%:Fault ID % contr. Rcd(km) M epsilon0 Site-to-src azimuth(d)Mount Diablo Thrust D2.1&D2.4, C 2.93 47.4 6.62 2.02 -136.7Great Valley 7 Char 3.26 41.8 6.74 1.87 -164.2Greenville Connected Char 2.89 44.7 6.90 1.71 -121.2Green Valley Connected Char 2.73 56.3 6.72 2.09 -112.4#*********End of deaggregation corresponding to Mean Hazard w/all GMPEs *********#
******************** Northern California ****************************************
Page 2 of 2
5/24/2016http://geohazards.usgs.gov/deaggint/2008/out/NA165098_2016.05.24_21.24.04.txt
Exhibit C-6