nairobi-final manjusha x - ucl · nairobi has continued to develop as a primate city in kenya,...
TRANSCRIPT

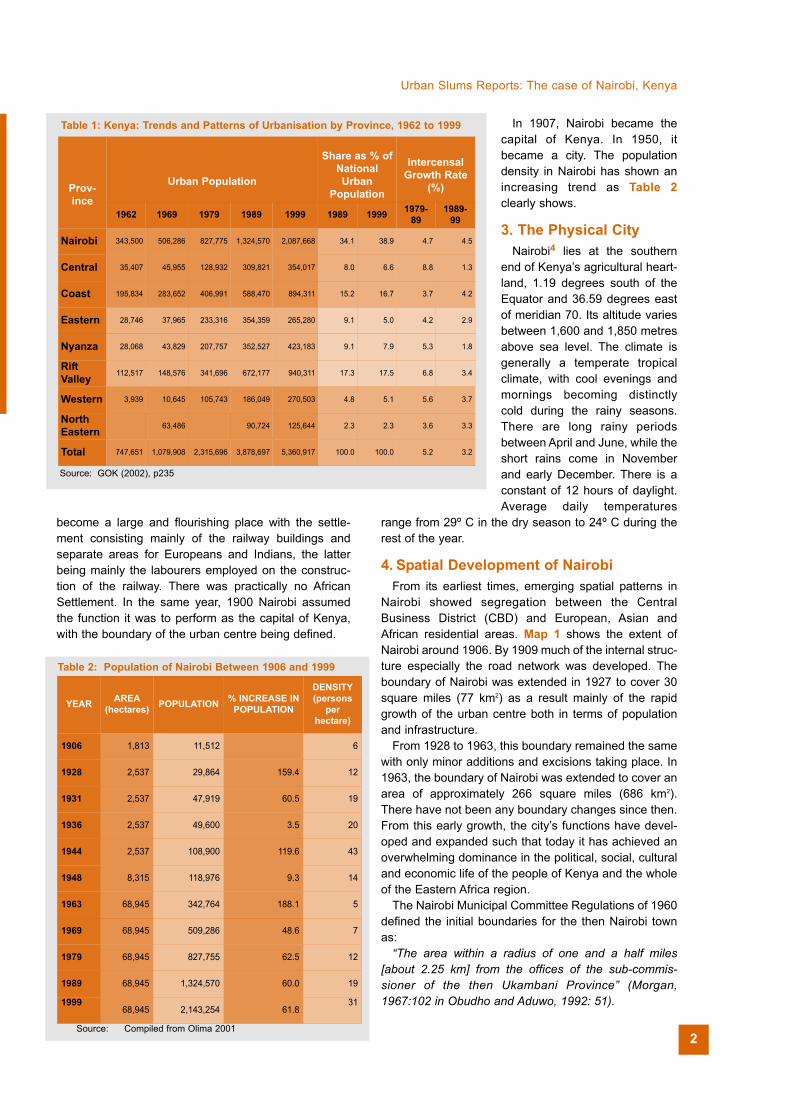
economic consolidation, aimed at bringing about abalance between rural and urban growth (GOK 1993:6).However, while demographic projections show thatrural migration will also slow down, the position inrespect of the economy has not been good. Economicgrowth has slowed from an average of 3.8 per cent perannum in 1986-90. It further continued to decline, from1.8 per cent in 1998 to 1.4 per cent in 1999, -0.2 percent in 2000 and increased marginally to 1.2 per cent in2001 (GOK 2002). As is clear from Table 1, Nairobicontinues to have the dominant share of the nationalurban population. With an urban primacy index of 2.6,Nairobi has continued to develop as a primate city inKenya, based on the “Eleven-City Index” on urbanprimacy (GOK 2002:236).
2 History of Nairobi3
The City of Nairobi owes its birth and growth to theKenya Uganda Railway (KUR). The railhead reachedNairobi in May 1899 “enroute” to the present dayKisumu part of what is now Uganda. The moving of therailway headquarters from Mombasa to Nairobi by itschief engineer, Sir George Whitehouse resulted in thesubsequent growth of Nairobi as a commercial andbusiness hub of the then British East Africa protectorate(Situma 1992:167). By 1900, Nairobi had already
I INTRODUCTION: THE CITY
A. THE URBAN CONTEXT
1. National Overview Urbanisation in Kenya has a long history with urban
agglomeration in the form of trading centres being foundalong the Kenyan coast as early as the 9th Century AD(Obudho 1988: 3) . However, the growth of many urbancentres can be traced to the pre-independence periodwhen they were used as centres of administrative andpolitical control by the colonial authorities (UNCHS1985). Table 1.0 shows that the process of urbanisationin Kenya, which had been rapid in the 1979-1989period, seems to be declining. The proportion ofKenyans living in urban centres1 increased from 5.1 percent in 1948 to 15.1 per cent in 1979, to 18.0 per centin 1989 and 34.8 per cent in 2000. There are currently194 urban centres, with 45 per cent of the urban popu-lation residing in Nairobi (GOK 1996:35; GOK 1989:74;GOK 2001).
The growth of the urban population, which hasresulted from both natural population growth and rural-urban migration, has led to an increased demand forresources required to meet the consequent demand forinfrastructure services (Olima 2001). Statistical analysisshows that the rank size distribution of the urban placesthat comprise this urban population is and will be welldistributed, corresponding to what regional geographerswould consider as balanced (GOK 1993:7)
The evident slowing2 of growth of the urban popula-tion in Kenya opens up possibilities for social and
The case of
Nairobi ,Kenyaby Winnie Mitullah
ContactWinnie MitullahUniversity of NairobiP.O. Box 30197,Nairobi, KenyaE-mail: [email protected]
Sou
rce:
CIA
fact
book
Urban Slums Reports: The case of Nairobi, Kenya
become a large and flourishing place with the settle-ment consisting mainly of the railway buildings andseparate areas for Europeans and Indians, the latterbeing mainly the labourers employed on the construc-tion of the railway. There was practically no AfricanSettlement. In the same year, 1900 Nairobi assumedthe function it was to perform as the capital of Kenya,with the boundary of the urban centre being defined.
In 1907, Nairobi became thecapital of Kenya. In 1950, itbecame a city. The populationdensity in Nairobi has shown anincreasing trend as Table 2clearly shows.
3. The Physical CityNairobi4 lies at the southern
end of Kenya’s agricultural heart-land, 1.19 degrees south of theEquator and 36.59 degrees eastof meridian 70. Its altitude variesbetween 1,600 and 1,850 metresabove sea level. The climate isgenerally a temperate tropicalclimate, with cool evenings andmornings becoming distinctlycold during the rainy seasons.There are long rainy periodsbetween April and June, while theshort rains come in Novemberand early December. There is aconstant of 12 hours of daylight.Average daily temperatures
range from 29º C in the dry season to 24º C during therest of the year.
4. Spatial Development of Nairobi From its earliest times, emerging spatial patterns in
Nairobi showed segregation between the CentralBusiness District (CBD) and European, Asian andAfrican residential areas. Map 1 shows the extent ofNairobi around 1906. By 1909 much of the internal struc-ture especially the road network was developed. Theboundary of Nairobi was extended in 1927 to cover 30square miles (77 km2) as a result mainly of the rapidgrowth of the urban centre both in terms of populationand infrastructure.
From 1928 to 1963, this boundary remained the samewith only minor additions and excisions taking place. In1963, the boundary of Nairobi was extended to cover anarea of approximately 266 square miles (686 km2).There have not been any boundary changes since then.From this early growth, the city’s functions have devel-oped and expanded such that today it has achieved anoverwhelming dominance in the political, social, culturaland economic life of the people of Kenya and the wholeof the Eastern Africa region.
The Nairobi Municipal Committee Regulations of 1960defined the initial boundaries for the then Nairobi townas:
“The area within a radius of one and a half miles[about 2.25 km] from the offices of the sub-commis-sioner of the then Ukambani Province” (Morgan,1967:102 in Obudho and Aduwo, 1992: 51).
Source: GOK (2002), p235
Table 1: Kenya: Trends and Patterns of Urbanisation by Province, 1962 to 1999
Prov-ince
Urban Population
Share as % ofNationalUrban
Population
IntercensalGrowth Rate
(%)
1962 1969 1979 1989 1999 1989 1999 1979-89
1989-99
Nairobi 343,500 506,286 827,775 1,324,570 2,087,668 34.1 38.9 4.7 4.5
Central 35,407 45,955 128,932 309,821 354,017 8.0 6.6 8.8 1.3
Coast 195,834 283,652 406,991 588,470 894,311 15.2 16.7 3.7 4.2
Eastern 28,746 37,965 233,316 354,359 265,280 9.1 5.0 4.2 2.9
Nyanza 28,068 43,829 207,757 352,527 423,183 9.1 7.9 5.3 1.8
RiftValley 112,517 148,576 341,696 672,177 940,311 17.3 17.5 6.8 3.4
Western 3,939 10,645 105,743 186,049 270,503 4.8 5.1 5.6 3.7
NorthEastern 63,486 90,724 125,644 2.3 2.3 3.6 3.3
Total 747,651 1,079,908 2,315,696 3,878,697 5,360,917 100.0 100.0 5.2 3.2
YEAR AREA(hectares) POPULATION % INCREASE IN
POPULATION
DENSITY(persons
perhectare)
1906 1,813 11,512 6
1928 2,537 29,864 159.4 12
1931 2,537 47,919 60.5 19
1936 2,537 49,600 3.5 20
1944 2,537 108,900 119.6 43
1948 8,315 118,976 9.3 14
1963 68,945 342,764 188.1 5
1969 68,945 509,286 48.6 7
1979 68,945 827,755 62.5 12
1989 68,945 1,324,570 60.0 19
199968,945 2,143,254 61.8
31
Table 2: Population of Nairobi Between 1906 and 1999
Source: Compiled from Olima 20012

of incomes as well as population densities. The peopleliving in the western suburbs are generally the moreaffluent while the lower and middle-income elements ofsociety dominate the eastern suburbs. Nairobi displaysa complex surface structure, making it difficult to deci-pher the distinct land uses of the city surface. Inevitably,there are wide variations in population density reflectingdifferent land use patterns within what Obudho andAduwo (1988) see as six distinct and different land usedivisions, namely; the Central Business District (CBD);Industrial Area; public and private open spaces; publicland; residential areas; and undeveloped land. Thespatially divided internal structure is based on land usesand income levels (Olima 2001).
5. Demographics of Nairobi Apart from both the CBD and industrial areas which
contain low population densities and a low incidence ofhousing Obudho and Aduwo (1988) indicated five resi-dential areas of varying population density and socialmix, also depicted in Table 3. These are:
Upper Nairobi lying to the west and north of the CBD.This is an area of low density, high-income population(2-25 people per hectare in 1980) and comprises manyof the former well-known expatriate residential areassuch as Woodley, Kileleshwa, Kilimani, Lavington,Bernard, Thomson and Muthaiga.
Parklands, Eastleigh and Nairobi South, an area ofmedium income, medium density population (30-40people per hectare in 1980) and consists of mainlyowner-occupier housing (many owned by Asians).
Karen and Langata, to the south and south-east, arealso high income, low-density residential areas, typifiedby large housing, gardens and paddocks. These areasare in transitional phase in that several mid-incomeestates often owner-occupied by civil servants are grow-ing to absorb the population spilling from the otherareas.
Eastlands in the marginalised urban fringe to the eastof and away from the CBD, is a low-income densely-populated area (50-300 people per hectare in 1980)with the core region of old NCC housing areas and newinstitutional housing estates (Race Course, Ngara,Shauri Moyo, Pumwani, Mathare Valley, Eastleigh,Kariobangi, Kaloleni, Bahati, Jericho, Mbotela, Dandora- bywords for urban deprivation and disadvantage)reaching densities of 200-300 people per hectare in1980).
Mathare Valley to the east of the city and Kibera tothe west form the most famous, largest uncontrolledurban settlements in the city, reaching staggering densi-ties of 1,250 people per hectare in 1980. The popula-tions of these (and other areas like Korogocho andKawangware) grew by 220% between 1969 intercensalperiod. They are characterised by the uncontrolled,spontaneous mushrooming of squatter settlements5
UNDERSTANDING SLUMS: Case Stud ies fo r the G loba l Repor t on Human Set t lements 2003
Map 2.0 illustrates the boundary changes that tookplace from 1900 until 1963 after which they have notchanged. The population of the town has also changedsignificantly. Its main sources of growth have beenimmigration especially from Central Province. The longdistance sources have been mainly the Eastern,Nyanza and Western Provinces of Kenya (Obudho andAduwo 1992:58). Other sources of population growthhave been the boundary changes and natural growthfactors.
By 1963 the Africans, who formed a major part of thepopulation, lived in the eastern parts, while theEuropeans and Asians lived in the western suburbswith access to better services. This position is reflectedtoday not so much in terms of race, but rather in terms
Map 1: The City of Nairobi Circa 1906
Source: White et. al. 1948:11
Map 2: Nairobi Boundary Changes 1906 to 1963
Source: Obudho, R.A and G.O. Aduwo (1992:53)
3
created by low-income migrants fleeing from the rapidlyrising costs of living in the city but fleeing into cardboardcities along valleys close to the CBD itself. Here thereare rapid shifts and movements of the population, short-ages of accommodation, high rents and overcrowding.Here is to be observed the starkest interrelationshipbetween income structures and housing and schoolingopportunities and the inadequate distribution of school-ing and educational opportunities despite the high profileof social demand for education in the country as a whole.It is a sharp illustration of “subsistence urbanism”.
6. The Urban Economy of NairobiIn Nairobi, 86.3 per cent of the people aged between
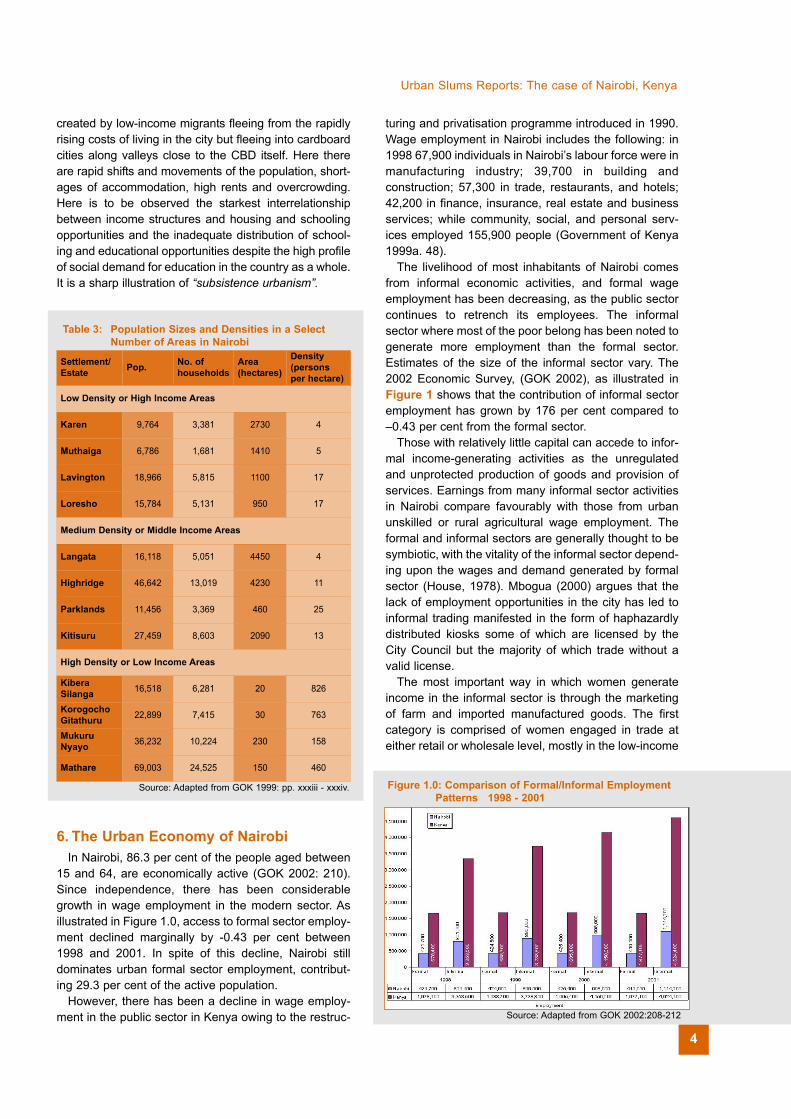
15 and 64, are economically active (GOK 2002: 210).Since independence, there has been considerablegrowth in wage employment in the modern sector. Asillustrated in Figure 1.0, access to formal sector employ-ment declined marginally by -0.43 per cent between1998 and 2001. In spite of this decline, Nairobi stilldominates urban formal sector employment, contribut-ing 29.3 per cent of the active population.
However, there has been a decline in wage employ-ment in the public sector in Kenya owing to the restruc-
turing and privatisation programme introduced in 1990.Wage employment in Nairobi includes the following: in1998 67,900 individuals in Nairobi’s labour force were inmanufacturing industry; 39,700 in building andconstruction; 57,300 in trade, restaurants, and hotels;42,200 in finance, insurance, real estate and businessservices; while community, social, and personal serv-ices employed 155,900 people (Government of Kenya1999a. 48).
The livelihood of most inhabitants of Nairobi comesfrom informal economic activities, and formal wageemployment has been decreasing, as the public sectorcontinues to retrench its employees. The informalsector where most of the poor belong has been noted togenerate more employment than the formal sector.Estimates of the size of the informal sector vary. The2002 Economic Survey, (GOK 2002), as illustrated inFigure 1 shows that the contribution of informal sectoremployment has grown by 176 per cent compared to–0.43 per cent from the formal sector.
Those with relatively little capital can accede to infor-mal income-generating activities as the unregulatedand unprotected production of goods and provision ofservices. Earnings from many informal sector activitiesin Nairobi compare favourably with those from urbanunskilled or rural agricultural wage employment. Theformal and informal sectors are generally thought to besymbiotic, with the vitality of the informal sector depend-ing upon the wages and demand generated by formalsector (House, 1978). Mbogua (2000) argues that thelack of employment opportunities in the city has led toinformal trading manifested in the form of haphazardlydistributed kiosks some of which are licensed by theCity Council but the majority of which trade without avalid license.
The most important way in which women generateincome in the informal sector is through the marketingof farm and imported manufactured goods. The firstcategory is comprised of women engaged in trade ateither retail or wholesale level, mostly in the low-income
Urban Slums Reports: The case of Nairobi, Kenya
Table 3: Population Sizes and Densities in a Select Number of Areas in Nairobi
Source: Adapted from GOK 1999: pp. xxxiii - xxxiv.
Settlement/Estate Pop. No. of
householdsArea(hectares)
Density(personsper hectare)
Low Density or High Income Areas
Karen 9,764 3,381 2730 4
Muthaiga 6,786 1,681 1410 5
Lavington 18,966 5,815 1100 17
Loresho 15,784 5,131 950 17
Medium Density or Middle Income Areas
Langata 16,118 5,051 4450 4
Highridge 46,642 13,019 4230 11
Parklands 11,456 3,369 460 25
Kitisuru 27,459 8,603 2090 13
High Density or Low Income Areas
KiberaSilanga 16,518 6,281 20 826
KorogochoGitathuru 22,899 7,415 30 763
MukuruNyayo 36,232 10,224 230 158
Mathare 69,003 24,525 150 460
Figure 1.0: Comparison of Formal/Informal Employment Patterns 1998 - 2001
Source: Adapted from GOK 2002:208-212
4

zones. Some sell in large quantities and regulate themajor supplies to urban areas. The majority engages inretail trade in small kiosks that sell consumables.Others are engaged in distributing sisal products suchas ropes for making “kiondos,” a type of local basket.The second category comprises urban women who sella variety of goods ranging from food and jewellery toimported new and old shoes and clothing. Such womenlive within low and medium-income zones in Nairobi(Mwatha 1988).
The informal sector contributes significantly toNairobi’s economy and has strong backward linkageswith commercial and public enterprises. The creation ofemployment opportunities in this sector is not neces-sarily dependent upon direct public expenditure andcommitment of public investment in advance. Theother advantages of the informal sector are that it usessimple technology appropriate to the resource base ofthe communities and that it produces jobs at lowercosts. Despite the growth of this sector, unemploymentis particularly widespread among young urban dwellersand women.
7. GovernanceIn terms of governance, the City of Nairobi falls under
the Nairobi City Council (NCC), which is composed ofelected members who form the council and the execu-tive staff who run the day-to-day activities of the coun-cil. The Nairobi City Council is governed in its opera-tions by a variety of legal statutes and administrativedecrees from the Office of the President (OP) and theMinistry of Local Authorities (MOLA). The LocalGovernment Act, Chapter 265 of the Laws of Kenya isthe main legal statute that governs the operations ofthe NCC. Currently the statute is under review.
In effecting its mandate, the NCC is divided intooperational departments, which are supervised byoverseeing committees made up of councillors, asshown in Figure 3.
The full council consists of 55 elected councillors and18 nominated councillors, giving a total number of 73councillors in the Nairobi City Council. These councillors,for purposes of policy making and overseeing are organ-ised into committees as is shown in Table 4.
The Nairobi City Council (NCC) provides a widerange of services, through the various departmentsshown in Table 4. In this role, the NCC’s efforts areaugmented by a number of government agencies andprivate sector organisations, which are active in theprocess of infrastructure delivery and management asillustrated in Figure 4. Figure 4 shows the partnershipsand interactions between these various agencies.These partnerships have been characterised by a lackof co-ordination, and at times outright hostility in theiractions. The sufferer has increasingly been the urbanresident, and more so those who live in the informalsettlements.
UNDERSTANDING SLUMS: Case Stud ies fo r the G loba l Repor t on Human Set t lements 2003
With the advent of multipartyism and an era of moreopenness and transparency in the conduct of publicaffairs, new multi-stakeholder partnerships haveevolved. Examples of these include the Nairobi InformalSettlements Co-ordinating Committee (NISCC), thePoverty Reduction Strategy Papers (PRSPs) and theLocal Authority Transfer Fund (LATF). These partner-ships have evolved out of a number of concerns,namely:
The increasing poverty in the informal settlementsThe need for increasing the resource base of local authorities
The deteriorating housing situation in the informal settlements
Recognition of the need to incorporate local communities in prioritising poverty reduction interventions
The partnerships have included the private and publicsectors, civil society and donors in their efforts aimed atfacilitating sustainable access to affordable and decentshelter for all, particularly vulnerable groups such aswomen and children. The principle of multi-stakeholderpartnerships in addressing economic developmentissues has been embedded in the national planningprocess. Consequently, the principle is also beingapplied in addressing urban problems, including slums.It is still too early to make a definitive statement regard-ing the efficacy of these partnerships.
However, it suffices to say that one of the benefits thatthey have brought to the whole process has been thatof expanding opportunities of residents of informal
Table 4: Committees and Departments of the CityCouncil of Nairobi
COMMITTEE DEPARTMENTS
Finance, Staffing & GeneralPurposes Town Clerk
Education City Treasurer's Department
Water & Sewerage/Sanitation Water and Sewage Department
Public Health Educational Department
Environmental Public Health Department
Public Works City Engineer's Department
City Planning City Inspectorate Department
Social Services & Housing City Planning Department
City Inspectorate Social Services and housingDepartment
Department of Environment
Housing and Development
Nairobi City Library Services
Source: Author's construct 2002
5

Urban Slums Reports: The case of Nairobi, Kenya
Figure 2: The Urban Governance Framework - Nairobi City
Figure 3: Council and Committee Structure of the City of Nairobi
6

settlements. In this regard, a rapid survey of participantsin these partnerships notes that “although authoritiesand communities press for quick results, developmentagencies must also emphasise the process, for itremains important” (World Bank and DFID 2002:v). Amajor problem that has been observed, was that eachof the supposed partners has evolved parallel servicedelivery approaches which has tended to weaken theprocess of infrastructure service delivery in local author-ities (ibid).
However, the performance of the NCC, which is a keypartner in all efforts aimed at resolving the problems ininformal settlements, has been poor. Commentators onthe management of NCC are invariably in agreement onthis point A noted commentator on urban issues inKenya observes that
“The provision of basic urban services has not keptpace with the rapid growth of the city. The vast themajority of the urban poor do not have access to suchservices, which are inadequate and not properly main-tained. Whereas the urban population has doubled insize during the past decade, infrastructure developmenthas proceeded far more slowly. The result has been anever-widening gap between the need for and the supplyof essential services. Revenue is collected primarilyfrom property taxes (80 per cent in 1986/87), and from
fees (4 per cent), rents (15 per cent), and other sources,but is not adequate to finance urban services”(Mazingira Institute, 1993, p. 10).
Revenue sources have been depleted because of thecentral government abolition of the Graduated PersonalTax. Although a Local Service Charge Tax was intro-duced in 1988, (and later withdrawn in 2000) because ofcorruption, mismanagement, and cross-indebtednessbetween the central government and the NCC between1973 and 1988 the NCC is still running a serious finan-cial deficit (Obudho 1997).
The revenue problem is compounded by the exten-sive and pervasive corruption that permeates NCC asdocumented by the Centre for Law and ResearchInternational (CLARION 2001:23-28)6. In support of thisview the NCC, was ranked the fifth most corrupt publicsector organisation in a recent survey by TransparencyInternational. This poor performance by the NCC hashad a negative impact on the large population of peopleliving in Nairobi’s informal settlements. Thus, any effortsat improving the lives of slum dwellers must alsoaddress the poor governance and performance of theNairobi City Council in terms of service delivery to theurban poor.
UNDERSTANDING SLUMS: Case Stud ies fo r the G loba l Repor t on Human Set t lements 2003
Figure 4.0: Agency Partnerships and Interactions in the City of Nairobi
7

II. SLUMS AND POVERTY
B. TYPES OF SLUMS
Slums in Nairobi are generally of two types, namelysquatter settlements and those that arise out of illegalsub-divisions of either government or private land. Anumber of slums are located on land unsuitable forconstruction, especially of residential housing.
1. Location of Major Informal Settlementsin Nairobi
Informal settlements are widely located across thecity. However, their location has largely been defined bytheir proximity to areas where their residents are able toget employment, as is shown in Map 3. For example,Kibera, one of the largest slums has access to theIndustrial Area. Most slum dwellers walk to work in themorning to the industrial area and nearby sources ofemployment.
2. Population Characteristics of Informal Settlements
Slums accommodate the majority of the city popula-tion. They have high densities compared to both middleand high-income residential areas, as is evident fromTable 5. Calculations for one of the slums, Huruma,shows household densities in five villages in the areacovered:
Kambi Moto 539 households on 0.4 hectareswith densities of 1,347 people/ha
Mahiira 384 households on 0.427 with densitiesof 899 people/ha
Redeemed 259 households on 0.96 hectareswith densities of 269 people/ha
Ghetto 813 households on 0.28 hectares withdensities of 2,309 people/ha
Gitathuru 311 households on 1.75 hectares withdensities of 177 people/ha
C. OFFICIAL AND UNOFFICIALDEFINITIONS OF SLUMS
The concepts slums and informal settlements areoften used interchangeably in Kenya and there is noofficial definition of slums or informal settlements.Instead, different works have provided characteristics ofslums and settlements. The MATRIX study of 1993provides a good summary of these characteristics:
Structure owners have either a quasi-legal rightof occupation or no rights at all
Structures are constructed largely of temporarymaterials and do not conform to minimum standards
The majority of structures are let on a room-to-room basis and the majority of households occupy asingle room
Densities are high, typically 250 units perhectare compared to 25 per hectare in middle incomeareas and 15 per hectare in high income areas
Physical layout is relatively haphazard making itdifficult to provide infrastructure
The majority of the inhabitants have low or verylow incomes
Urban services such as water and sanitation arenon-existent or minimal
Morbidity and mortality rates caused by diseasesstemming from environmental conditions are signifi-cantly higher than in other areas of the city
The informal settlements/slum dwellers seem to alsoshare the view of slums/informal settlements as beingdifficult areas, which lack most basic services and infra-structure. In a rapid assessment of 30 households inKorogocho, the majority of respondents indicated poorsanitation and infrastructure as a key characteristic ofslums. This was followed by characteristics such aspoor housing, crowding, violence, lack of recreationalfacilities, lack of tenure and cheap rent. The respon-dents provided some concepts used in reference toslums, with the concept slum being the most dominant.Other concepts included:
Muddy areasGhettoPoverty stricken settlementsFilthy settlementsKijiji or vijiji7
Mud city Dumping site andBeggars’ zone
Most NGOs, Central Government and LocalGovernment officials share the views epitomised inthese definitions. However, a few divergences emerge.Pamoja Trust8 includes the concept of temporary struc-tures, insecure tenure, overcrowding, and poorlyconstructed housing. They observe that the definition ofslums should be broadened to include other buildingssuch as one-roomed tenements, which have securetenure.
Another unique perspective is that of the city authori-ties. Like civil society, they view lack of basic servicesand infrastructure, as characteristics of slums, anaspect that slum dwellers do not put emphasis on. Theinclusion of the concept of livelihoods or sources oflivelihoods for the poor constitutes one of the mostsignificant changes in the definition of slums.
Urban Slums Reports: The case of Nairobi, Kenya
8

C. OFFICIAL AND UNOFFICIALDEFINITIONS OF POVERTY
The poor are defined as those who cannot affordbasic food and non-food items (World Bank 2001) In1997, the minimum cost to satisfy a daily requirement of
2,250 calories was estimated to be Ksh. 927 per personper month in rural areas and Ksh. 1,254 in urban areas.These define the food poverty line. When non-foodnecessities were added, the overall poverty line in therural areas was taken as Ksh. 1,239 per person permonth and for urban areas as Ksh. 2,648. Over the pastdecade, data on the incidence of poverty come fromthree Welfare Monitoring Surveys (1992, 1994, and1997) and two Participatory Poverty Assessments (1994and 1996). Earlier estimates were derived from a RuralHousehold Budget Survey (1981-82), an UrbanHousehold Budget Survey (1982 – 83) and theIntegrated Rural Survey (1974 – 75).
A rapid survey of NGOs showed that some of themviewed absolute poverty as lack of basic needs. Localgovernment officials on the other hand perceivedpoverty to mean the inability of persons to access basicneeds. Central government officials interviewed saidthat poverty was a state of deprivation, whereby peoplecannot afford adequate quantities of basic requirementssuch as food, shelter, healthcare and water.
Absolute Poverty Approach A household was consid-ered poor if its members could not afford the recom-mended food energy intake plus a minimum allowancefor non-food consumption.
Literature on poverty in Kenya recognises it as beinga multi-dimensional phenomenon (Ayako andKatumanga 1997:6; Karirah-Gitau 1999:17; GOK1998:16; GOK 1998b: 34). Officially, poverty is definedusing two concepts, income poverty and food poverty,as shown in Table 6. The measurement of poverty inKenya has been undertaken since the 1970s reflectingthe persistency of poverty and government concernswith it, although it is only from the late 1990s thatpoverty has become a front line development issue.Manda et. al. (2001) point out that poverty estimates inKenya have been carried out through the IntegratedRural Surveys of 1974/75, Rural and Urban HouseholdBudget Surveys of 1981/82 and Welfare MonitoringSurveys of 1992, 1994 and 1997. They suggest that onenotable feature of these surveys was that they were allhousehold based. Thus, in the light of recent develop-ments, certain social groups, such as street families,beggars, and women in destitute conditions wereexcluded. Many of these are urban based.
A summary of the resulting poverty estimates ispresented in Appendix 1. GOK (1998) in its discussionnotes the following reasons for the changes over theyears in the various poverty concepts, approaches anddefinitions adopted in respect of poverty measurements:
Restricted coverage of the measures in measuringpoverty. Subsequent measures broadened their scopebut retained the previous measures for purposes ofcomparison
Attempts to measure up to international comparisonsas well as developments in thinking on poverty meas-urements
UNDERSTANDING SLUMS: Case Stud ies fo r the G loba l Repor t on Human Set t lements 2003
Table 5.0: Informal Settlements in Nairobi - EstimatedPopulation and Population Densities
Admin.Division
AreaCovered
byInformalSettlemts(Hectares)
1993 1999
InformalSettlemt
Pop.
Density(Persons
perHectare)
InformalSettlemt
Pop.
Density(Persons
perHectare)
Makadara 85.40 102,480 1,200 155,943 1,826
Langata 229.20 251,040 1,095 382,006 1,667
Kasarani 215.00 143,155 666 217,838 1,013
Dagoretti 373.50 186,250 499 283,416 759
Embakasi 73.00 31,890 437 48,527 665
Pumwani 14.50 11,890 820 18,093 1,248
Parklands 24.40 7,326 300 11,148 457
AllDivisions 015.00 734,031 723 1,116,971 1,100
Source: Reconstructed from Matrix (1993) on the basis of a1989/99 intercensal growth rate of 6.18% for Nairobi
Map 3: Informal Settlements in Nairobi and LabourMovements
Source: Adapted from Syagga et. al. (2001:142)
9

Scarcity of figures on urban povertyFocus only on households, which neglects other
marginalised groups such as street familiesThe need to understand the spatial distribution of
poverty
The rapid assessment of Korogocho householdsshows that poverty is viewed as lack of basic necessi-ties such as food and shelter, begging, inability to investand own anything, living in a poorly constructed house,inability to survive on one’s own capabilities, disabilityand lack of income.
Most civil society organisations interviewed perceivedpoverty in a “rights” perspective. They use conceptssuch as state of deprivation, where people cannot affordbasic needs, inability to influence public decisions,inequitable distribution of resources, lack of access toresources and assets, as well as lack of an enablingenvironment.
While there seems to be no one definition of povertycommon to all slums and communities, one aspectseems to be mentioned in all definitions in Kenya: inabil-ity to meet basic needs such as food, clothing, housing,health and education for children (AMREF/GOK 1997).Changes to definitions of poverty over time have mainlyextended the definition beyond income to lack of physi-cal necessities, including basic services and assets(Ayako and Katumanga 1998) and rights to infrastruc-
ture services and assets. This change has been influ-enced by the development of the Human DevelopmentIndex that broadly considers the realisation of fullhuman capacity.
E. ORIGINS OF THE SLUMS TYPES
The growth of slums in Nairobi has resulted from avariety of factors, historical and contemporary in nature.Olima (2001) has argued that:
“the forces that have contributed to urban spatialsegregation in Nairobi are many and varied. Some arelegal and economic whereas others are cultural. Duringthe colonial period, the people of Kenya witnessed alarge-scale government sanctioned spatial segregationbased on race and reinforced by planning laws as wellas exclusionary zoning regulations.
The segregation/division along racial lines divided thecity into four distinct sectors; North and East defined asthe Asian Sector (Parklands, Pangani and Eastleigh);East and South East defined the African Sector(Pumwani, Kariokor, Donholm); South East to Southmarked another small Asian enclave before it wasbounded by the Game Park (Nairobi South, NairobiWest). Finally, the line North and West marked theEuropean area.”
Syagga et al (2001:30-31) in a further elaboration ofthis point out that the forces of rural-urban migration andincome differentials between the rural and urban areas,as well as within urban areas have contributed to thegrowth of slums in Nairobi. Other factors include unem-ployment and underemployment, and increased popula-tion densities in the rural areas that have forced espe-cially the young to move to urban areas. Majale(2000:4) points out that in the colonial era, slums essen-tially developed because of three main factors:
Displacement of Africans to make room for EuropeanSettlers
The Colonial Government’s policy of racial segrega-tion, accompanied by a de facto policy of not allocatingenough resources to cater for the housing needs of theAfricans, and
Clearance of “sub-standard” housing
Independence, with the consequent relaxation in poli-cies and laws that prohibited movement of Africans toNairobi, resulted in a major shift in population to Nairobi,without a concomitant rise in housing provision. Indeed,as Shihembetsa (1989) pointed out, the independencegovernment allowed new immigrants to put up shackswithin the city as long as they were not located near theCentral Business District (CBD). This was accompaniedby state action that protected some settlements whiledemolishing others (Syagga et. al. 2001:34). As shownin Table 7, slums in Nairobi have continued to grow in
Urban Slums Reports: The case of Nairobi, Kenya
Table 6.0: Official Definitions of Poverty9 in Kenya
APPROACH DEFINITION POVERTY LINES DERIVED
AbsolutePovertyApproach
A household wasconsidered poorif its memberscould not affordthe recom-mended foodenergy intakeplus a minimumallowance fornon-foodconsumption. Poverty linederived frommonetary valueof the consump-tion of food andnon-food itemsdistinguished thenon-poor fromthe poor
Poverty Lines per Adult EquivalentKshs. 1,490 per month in 1994
Food Poverty LineEntails diagnosis of the magnitudeof food poverty defined asconsumption levels below a pre-setnormative minimum standard,taking into account nutritionalneeds.
Total/Absolute/Overall Poverty LineCaptures the basic minimum non-food allowances in addition to theminimum food consumption
Hardcore Poverty LineAssesses those households whowould not meet their minimum foodrequirements even if they allocatedall their income on food
Poverty Index Summarisesinformation onthe incidence,intensity (depth)and severity ofpoverty, for eitherpoverty line,food, overall orhardcore poverty.
Incidence of PovertyMeasures the numbers in thepopulation living below the povertyline
Intensity of PovertyMeasures the aggregate povertygap, which reflects the averagedistances of the poor below thepoverty line
Source: GOK (1998b)
10

number as well as in population. It is important to pointout, that these figures remain estimates as long as noin-depth survey of the slums is undertaken10.
F. DATA ON SLUMS The data on slums is limited, with the exception of a
few slum areas, which have been heavily researched,for example Kibera. Pamoja Trust has a major projecton slum enumeration. The organisation has a plan toenumerate all slums in Nairobi. Theinformation available shows apathetic situation. For example,Karirah-Gitau (1999) notes that
“Between 40-60 per cent ofNairobi’s residents stay in areasdevoid of infrastructural facilities forexample: clean water, sanitarywaste disposal, access roads,drainage, health and educationalservices, decency and privacy.Moreover, the housing is of poorquality and inadequate.”
Figure 5 clearly shows that theslum residents feel the need forinfrastructure services. When theneed for housing is added, the prob-lem of access to housing and infra-structure services in the slums ofNairobi becomes starkly apparent.
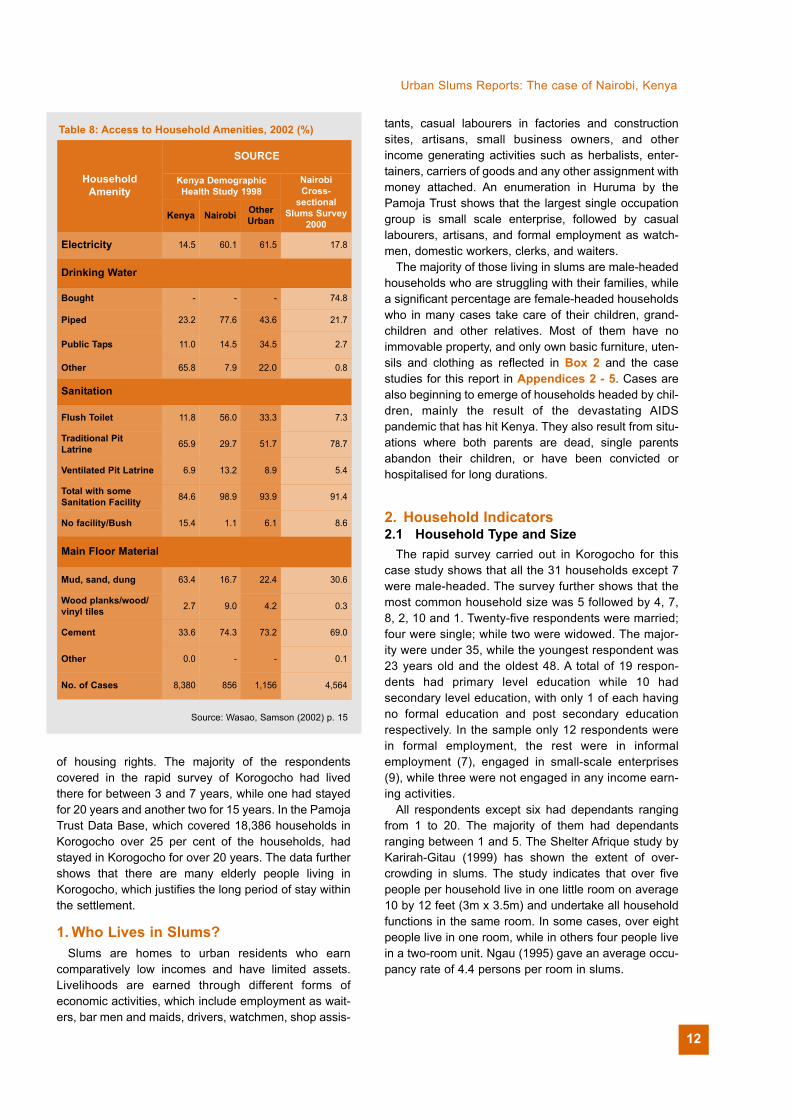
Table 8 presents the results of two studies, theNairobi Cross-sectional Slums Survey of 2000 and theKenya Demographic Health Study of 1998. Wasao(2002) noted that slum residents are worse off whencompared to residents of other urban areas in terms oftheir access to services and amenities. For instance,they observe that about 24 per cent of slum households
in Nairobi have access to piped water as compared to92 per cent for the whole of Nairobi. This position isconfirmed by other studies which have shown that slumresidents tend to pay significantly higher charges forwater services, representing major fiscal burdens for theurban poor (Aligula 1999; Wasao and Bauni 2001; andAligula 2002).
III. SLUMS: THE PEOPLE
Slums owe their origins to six factors: migration duringthe struggle for independence, rural-urban migrationand urban population growth without correspondinghousing provision, resettlement due to new develop-ments, upgrading or relocation in suitable sites, andextension of city boundaries. Inclusion of rural parts intourban boundaries often changes the characteristics ofthe settlements as more urban residents and newmigrants get attracted to such areas. Most slums haveno security of tenure, a fact that has been used toexplain the reluctance to improve housing and relatedinfrastructure. Slums have different forms of landownership: public land held by the government onbehalf of citizens, local authority, private landlords andother precarious forms of ownership which cannot belegally justified. The latter are the most problematicsince the ‘owners’ ensure that influential public figuresand urban authorities protect their investment. Theglobal campaign for secure tenure has identified theprovision of secure tenure as essential for a sustainableshelter strategy, and as a vital element in the promotion
UNDERSTANDING SLUMS: Case Stud ies fo r the G loba l Repor t on Human Set t lements 2003
Figure 5: Perception of Important Needs by Slum Residents in Nairobi, 2002
Source: Adapted from Wasao(2002),pg.19
Table 7: Growth of Informal Settlements in Nairobi11
YearNo.of
InformalSettlement
Villages
Population Units % of Pop.
1971 50 167,000 - 33
1990 78 2000000 74,165 40-50
1993 36 748,991 - 55
1995 134 1,886,166 77,600 60
Source: NACHU, 1990; Matrix, 1993; and Ngau, 1995
11
of housing rights. The majority of the respondentscovered in the rapid survey of Korogocho had livedthere for between 3 and 7 years, while one had stayedfor 20 years and another two for 15 years. In the PamojaTrust Data Base, which covered 18,386 households inKorogocho over 25 per cent of the households, hadstayed in Korogocho for over 20 years. The data furthershows that there are many elderly people living inKorogocho, which justifies the long period of stay withinthe settlement.
1. Who Lives in Slums? Slums are homes to urban residents who earn
comparatively low incomes and have limited assets.Livelihoods are earned through different forms ofeconomic activities, which include employment as wait-ers, bar men and maids, drivers, watchmen, shop assis-
tants, casual labourers in factories and constructionsites, artisans, small business owners, and otherincome generating activities such as herbalists, enter-tainers, carriers of goods and any other assignment withmoney attached. An enumeration in Huruma by thePamoja Trust shows that the largest single occupationgroup is small scale enterprise, followed by casuallabourers, artisans, and formal employment as watch-men, domestic workers, clerks, and waiters.
The majority of those living in slums are male-headedhouseholds who are struggling with their families, whilea significant percentage are female-headed householdswho in many cases take care of their children, grand-children and other relatives. Most of them have noimmovable property, and only own basic furniture, uten-sils and clothing as reflected in Box 2 and the casestudies for this report in Appendices 2 - 5. Cases arealso beginning to emerge of households headed by chil-dren, mainly the result of the devastating AIDSpandemic that has hit Kenya. They also result from situ-ations where both parents are dead, single parentsabandon their children, or have been convicted orhospitalised for long durations.
2. Household Indicators2.1 Household Type and Size
The rapid survey carried out in Korogocho for thiscase study shows that all the 31 households except 7were male-headed. The survey further shows that themost common household size was 5 followed by 4, 7,8, 2, 10 and 1. Twenty-five respondents were married;four were single; while two were widowed. The major-ity were under 35, while the youngest respondent was23 years old and the oldest 48. A total of 19 respon-dents had primary level education while 10 hadsecondary level education, with only 1 of each havingno formal education and post secondary educationrespectively. In the sample only 12 respondents werein formal employment, the rest were in informalemployment (7), engaged in small-scale enterprises(9), while three were not engaged in any income earn-ing activities.
All respondents except six had dependants rangingfrom 1 to 20. The majority of them had dependantsranging between 1 and 5. The Shelter Afrique study byKarirah-Gitau (1999) has shown the extent of over-crowding in slums. The study indicates that over fivepeople per household live in one little room on average10 by 12 feet (3m x 3.5m) and undertake all householdfunctions in the same room. In some cases, over eightpeople live in one room, while in others four people livein a two-room unit. Ngau (1995) gave an average occu-pancy rate of 4.4 persons per room in slums.
Urban Slums Reports: The case of Nairobi, Kenya
HouseholdAmenity
SOURCE
Kenya DemographicHealth Study 1998
NairobiCross-
sectionalSlums Survey
2000Kenya Nairobi Other
Urban
Electricity 14.5 60.1 61.5 17.8
Drinking Water
Bought - - - 74.8
Piped 23.2 77.6 43.6 21.7
Public Taps 11.0 14.5 34.5 2.7
Other 65.8 7.9 22.0 0.8
Sanitation
Flush Toilet 11.8 56.0 33.3 7.3
Traditional Pit Latrine 65.9 29.7 51.7 78.7
Ventilated Pit Latrine 6.9 13.2 8.9 5.4
Total with someSanitation Facility 84.6 98.9 93.9 91.4
No facility/Bush 15.4 1.1 6.1 8.6
Main Floor Material
Mud, sand, dung 63.4 16.7 22.4 30.6
Wood planks/wood/vinyl tiles 2.7 9.0 4.2 0.3
Cement 33.6 74.3 73.2 69.0
Other 0.0 - - 0.1
No. of Cases 8,380 856 1,156 4,564
Source: Wasao, Samson (2002) p. 15
Table 8: Access to Household Amenities, 2002 (%)
12

2.2 Number of ChildrenThe rapid survey of Korogocho showed that all
respondents except 4 had children with the number ofchildren ranging from 1 to 8 as reflected in Table 9.
2.3 Household IncomeIn the rapid assessment conducted for this case
study, most households were earning between Ksh.5,000 and 7,000. However, the Pamoja Trust Database,which is more comprehensive, shows that averagemonthly earnings come to about Kshs. 2,712.00
2.4 Types of Tenure and House OwnershipAll interviewees in the rapid survey except one house-
hold were renting. This trend has been reflected inalmost all studies on the slums and informal settle-ments. The Shelter Afrique study (Karirah-Gitau 1999)found that over 80 per cent in five of the six slumscovered were tenants, with owner-occupiers in four ofthe five slums being less than 10 per cent. There werealso less than two per cent in each of the six slums notowning and not paying rent. These are likely to be care-takers or relatives and friends of owners of the units.Pamoja Trust Data Base shows that of the 18,386
households living in Korogocho, the occupier status of2,904 are unknown, 10,291 are tenants, 1,088 sub-tenants, 3,848 structure owners, while a total of 255structures were vacant (Pamoja Trust Database 2001)This shows that the tenants constitute 56 per cent;although when the unknown and the vacant houses areconsidered the percentage of tenants are likely toincrease.
2.5 Literacy Rates The rapid survey shows that most household heads
had primary level (61.3 per cent) and secondary leveleducation (32.3 per cent). Only one respondent in eachcase had no formal education and post secondaryeducation. In the Shelter Afrique study most householdheads had attained at least upper primary level of
UNDERSTANDING SLUMS: Case Stud ies fo r the G loba l Repor t on Human Set t lements 2003
BOX 2: Life in Mama Jane’s Household
Mama Jane who lives in Mathare 4B talked about her prob-lems openly. She said that her daughter had three children.Although all of them are of school age, they had not attendedschool for even one day. “Jane went to school up to standardseven but I had no money to send her to secondary schoolalthough she had passed well. After staying at home for twoyears, she took off to the city and started earning her livingthere. She used to bring me money every week. I evenmanaged to send her brother to a secondary school.However, the children started coming one after the other.With my own small children to take care of, I had to stopbuying and selling vegetables. We depended entirely onJane’s income. Unfortunately, eight years ago, Jane camehome sick. She attended many hospitals but her situation gotworse. We did not know what was wrong. She died five yearsago (three years after coming home). We later learnt that shehad AIDS. The son she left behind is also sick and myfriends think he might be suffering from the same diseasethat killed his mother. However, I have no money to take himto hospital. A volunteer community nurse comes to see himhere at home. I really do not know what to do”.
Mama Jane said the son who went to secondary school withJane’s support completed school four years ago. He couldnot do any training because of lack of money. He has neverbeen employed but he does odd jobs. He married a year agoand the wife is expecting. The whole family still lives in twotiny rented rooms. The mother (Mama Jane) has been forcedto get back to her hawking business but the income is so lowthat she can hardly feed the family. The son pays the rent.When times are bad, he does not earn enough and they areperpetually under threat of eviction.Jane’s children look sickly and they are small for their ages.During the interview, session four children came in. Two wereJane’s children and the other two were Mama Jane’s. Theywere carrying something in two dirty plastic bags. MamaJane said the children had gone to Wakulima Market popu-larly called ‘Marikiti’ to collect thrown away vegetables andany other foodstuffs. They collected foodstuffs to supplementfamily meals. In the second bag, they were carrying wastepaper and tins for sale to recycling firms in the nearby slumarea. Mama Jane explained that “everyone’s contribution isvital for his family’s survival. It is only this sick one who stayshome. However, he even helps in sorting out foodstuffs andthe waste paper. This is the life many female-headed house-holds in Mathare” she concluded.
Source: Extracted from Ngau and Mitullah (1997)
Table 9: Number of Children by Age Group
Number Age 0-5 Age 6 -13 Age 14-17 Age 18 &above
0 9 13 24 27
1 13 6 3 2
2 7 8 4 1
3 2 4 - 1
Total 31 31 31 31
Source: Rapid Field Survey 2002
13

education, although in one of the six slums, which waspredominantly Muslim had 45.9 per cent of householdheads with no formal education There seems to be atrend of slums with comparatively older people havinglow levels of education. This is follows the nationaltrends which show that literacy levels increased duringthe 1970s and 80s, although the poor economicperformance during the late 1980s and 1990s hasreduced literacy levels since many families cannotafford education.
Although literacy levels are high in Kenya, a genderperspective shows that men have better education thanwomen. In an in-depth study of 10 female headedhouseholds in one of the largest slums in Nairobi,Kibera none of the 10 women interviewed had second-ary education, seven were primary school leavers, whilethree were illiterate (Mitullah 1997).
In a more recent enumeration in Huruma it wasrevealed that more boys than girls are enrolled inschools within slums. Furthermore, of those who wereenrolled between 5 and 20 per cent dropped out beforecompletion (Pamoja Trust Database 2001) as a result ofseveral problems including, financial shortages andfinding employment to supplement the family incomeand being pregnant.
3. The Cost of Living in Slums3.1 Income and Costs of Services
Most slum dwellers earn very low incomes rangingbetween Ksh. 88 and 28,000 with the majority earningbetween Ksh. 5,000 and 7,500. The majority of thoseliving in slums such as Korogocho use public means oftransport for going to work. The dominant mode is‘matatus’ (minibuses operated by individuals), followedby buses and walking. Only one respondent indicatedusing a bicycle as a mode of transport. Most of thempay an equivalent of KSh. 40 for a return trip.Depending on the location of the work place somehousehold heads pay more than Ksh. 100 for a roundtrip. The time taken to get to work is between twominutes and two hours, for a distance of between 0.2and 15 kilometres depending on the location of theworkplace and the mode of transport used.
Apart from transport, slum dwellers incur costs infood, housing, fuel, water, education, health and otheritems. Food and education take the highest percentageof their budgets. The cost for food ranges between1,500 Ksh. 12,000 with the majority spending less thanKsh. 5000 on food. Education follows food in the expen-diture of slum dwellers. However this expenditure isskewed with some households paying as little as Ksh.57, while others pay over Ksh 5,000. This depends onthe nature of the education service. The ones paying thelower amounts are often in poorly run informal schools,which do not follow any curriculum. The educationprovided does not allow children to get into the regular
national programmes. They merely provide the childrenwith a certain level of literacy, which is not recognised bypublic and market forces.
Housing falls third in the expenditure of slumdwellers. The cost of accommodation ranges betweenKsh. 600 and 3,500. In the Pamoja Trust database,which covered 18,201 households in Korogocho, theaverage rent paid was Ksh. 486 per month. While mostsecondary data shows that slum dwellers are exposedto many health problems, this is not reflected in thehealth expenditure of slum dwellers. This ranges fromKsh. 100 to 2,000 with the majority spending betweenKsh. 500 and 1,000. This does not imply that slumdwellers are healthy; instead, they are unhealthy andonly visit medical facilities when it is absolutely neces-sary. They also prescribe drugs for themselves, whichare often not correct, and in some cases they do nottake the right dose. This has resulted in many slumdwellers being resistant to a number of drugs and notbeing properly healed.
The cost of fuel is similar to that of health. Most slumdwellers spend between Ksh. 180 and 2,000 on fuel,while water is the cheapest expenditure item.Households spend between Ksh. 100 and 300 on waterper month. Other expenditure items which they incurrelate to social life: households tend to belong to severalkinship, welfare and credit associations which act asinsurance for their livelihoods. In most of these associ-ations, some fee is paid periodically as a means of rais-ing funds and showing commitment.
3.2 Common AilmentsCommon ailments include malaria and waterborne
diseases such as typhoid and cholera. Other commonailments include measles, flue, HIV/AIDS, and TB. Thepoor environmental conditions including crowding andlack of clean water contribute to most of the ailmentswithin slums. In a study on Population and HealthDynamics in Nairobi’s informal settlements, it was notedthat lack of toilets is the most commonly cited health-related problem, followed by poor drainage and watersupplies and lack of health services (APHRC 2002).
3.3 Discrimination, Victimisation and Psychological Trauma
Discrimination, especially along ethnic lines existswithin slums, with most ethnic groups conglomerating inparticular areas/sections of slums. In most cases, thenames given to such areas indicate the dominance ofthe original communities’ ethnic background. At thesame time tenants prefer to rent rooms where the struc-ture owners come from their ethnic background. In afew cases, clashes between ethnic groups have beenexperienced. The growth of settlements along ethniclines is also influenced by the place a migrant settlesfirst. This is usually in a relative’s, clan members/ruralneighbour’s urban residence. Thus, most slum areas
Urban Slums Reports: The case of Nairobi, Kenya
14

have one or a few dominant ethnic groups, often that ofthe original settlers (UNCHS 2001).
Lack of security of tenure is also a threat to slumdwellers. Slums in Kenya are highly commercialisedand evictions, often violent, occur at the whim of thestructure owners. Defaults in rent payments result inevictions and are hardly negotiated by the highlycommercialised structure owners. Consequently, theforces operating in rental markets can easily push outthe poorest individuals. In some cases, arson is used bythe unscrupulous structure owners to evict non-comply-ing households or the residents of entire slums.Discrimination is also felt slightly in the areas of educa-tion, employment, health and social setting.
Neighbourhood victimisation is more common inslums than individual and mass evictions. This type ofvictimisation is that in which outsiders are viewed as notbelonging, and are regarded with suspicion. In somecases, this is associated with violent behaviour, whichalso arises because of the difficulties slum dwellersface. Households are not able to satisfy their basicneeds while at the same time living in quite dehumanis-ing environments. The youth have neither privacy norfreedom and have to share rooms with parents andother younger siblings. Such environments push boththe youth and their parents to the streets, where theysuffer psychological trauma, which exposes them toviolent behaviour.
A recent victimisation survey in Nairobi (UNCHS2001) indicates that residents either residing or passingthrough low-income areas were more likely to be victimsof physical assault than those in other areas of Nairobi.They also identified unemployment and poverty as themost common causes of crime. General idleness andthe quick rewards that crime brings were also noted ascauses of crime. These factors partly explain the highprevalence of crime and victimisation within slums.However, studies have also shown that poverty is not adirect cause of crime. Crime is more a consequence ofexclusion from social services, education, health care,governance and politics. The study argues that theextent to which people feel valued, respected andrecognised by society determines the extent to whichthey themselves value society in return. Social exclu-sion has eroded moral values and broken down socialsupport structures such as the family and the commu-nity resulting in individuals and groups being at risk offalling into crime and violence (UNCHS 2001: 11).
4. Assets Available to Slum DwellersSlum dwellers have very few assets, which are mostly
movable. In a study covering female-headed house-holds in four slum areas, no women owned the struc-tures they lived in nor did any own land in the country-side. The few who had assets had pooled resourcesthrough associations to acquire small urban plots onwhich they planned to put up commercial buildings
when money became available. A few of them ownedkiosks in which they operated their small businesses,and it was difficult for them to acquire credit fromconventional financing institutions (Ngau and Mitullah1997).
At the household level, very few women had boughtany durable household items within the last year. Insidetheir houses, the main furniture items were the parents’beds, small coffee tables and a few wooden stools. Afew had battery operated radios and/or radio cassettes.Other items included utensils and water containers,laundry basins, buckets and clothing for the family. Mosthousehold members use mitumba (second handclothes and shoes). In the case studies for this report,the female-headed households had basic furniture andhousehold effects, as reflected in Appendices 2-5).
4.1 Financial, Human and Physical CapitalGenerally, the slum dwellers lack sources of finance
and most of them have to rely on associations, money-lenders and family members. This is because manyfinancial institutions cannot lend to the poor due to lackof collateral. The poor are active members of associa-tions which act as insurance for their livelihoods. Mostslum dwellers rely on home-based enterprises and donot have security of tenure. An assessment of humancapital shows a poor situation. Both education andhealth are poorly provided for in the slums. In the rapidsurvey, the majority ranked the two as either bad or fairwith very few noting that they were good.
G. SLUMS AND POVERTY: THE POLICIES
Several studies have noted the lack of any clearpolicy that would facilitate and guide urban developmentin Kenya. This lack has resulted in most interventionsbeing made on an ad-hoc basis, a situation reflected inthe blindness of the city authorities who for decadescontinued to dump garbage close to the residence ofthe poor slum dwellers. Furthermore, most slums arelocated on sites not planned for housing and residentsare exposed to different forms of pollution includingindustrial pollution. Industries emit hazardous wasteindiscriminately near poor settlements.
Various interventions continue to be undertaken bythe government and city authorities with the support ofdonors, civil society organisations, including CommunityBased Organisations (CBOs). In some slums such asMathare 4A, Kibera, Huruma and Korogocho housingand infrastructure programmes are being put in placethrough joint efforts of the government, donors and civilsociety organisations. These interventions aim ataddressing the problems of slums or informal settle-
UNDERSTANDING SLUMS: Case Stud ies fo r the G loba l Repor t on Human Set t lements 2003
15

ments. They have had mixed results as shown in Table8 which has classified them into themes. The main posi-tive effects have included:
Increased housing stockExpanding opportunities for communitiesAddressing the financing gap in LAsInvolving communities in setting prioritiesInvolving communities in monitoring applications
for funds
The negative effects of these policies and interven-tions include:
Proliferation of new slumsExcluded target groupsFailure to consider ability and willingness to pay of low-income householdsSubsidies not targetedNon participatory approach – top-down planningGentrificationFocus on environmental improvement rather
than the well-being of householdsInadequate partnerships characterised by poor
networking and co-ordinationNo replicability possibleTop down and apparently unsustainable approaches
ENDNOTES
1 Urban centres in Kenya are classified as towns when theyhave a population of 2,000 or more inhabitants (Olima, 2001)
2 In the recent past, population growth trends in Kenya,which exhibited some of the highest growth rates in the worldat some point in time, have considerably declined. This hasbeen because of declining birth rates. A trend in the demo-graphic data that should be a cause of concern has been theincreased mortality occasioned by AIDS (Aligula, 1999)3 The name Nairobi is derived from the Maasai communitywho referred to the current location of Nairobi as “EnkareNairobi.” This means, “ place of cold waters.”4 The cool and healthy climate in Nairobi attracted Europeanrailway engineers constructing the Kenya-Uganda railway(KUR) in the year 1899, when they chose it as a base campfor the further extension of the railway from Mombasa intoKenya’s interior. The decision to move government headquar-ters to Nairobi brought an influx of labourers who were build-ing the railway, and native Kenyans from the hinterland andsettlers.5 In the past, these were often bulldozed down by the NCC,but increasingly one is beginning to see gangs of youths whocome and clear out people from land that is occupied bysquatters, ostensibly claiming that the private developers wishto develop such property.6 This report catalogues a series of corrupt activities carriedout by officials from the NCC and the Central Government, aswell as a retinue of politicians, lawyers and private firms. It istestimony to the well-established “partnerships” between offi-cials in these sectors. The import of this is felt through theimpact it has on the revenue generation and utilisation capac-ities of the NCC and therefore of its ability to direct the neces-sary resources towards efforts at mitigating the lack of serv-ices in the informal settlements.7 Swahili word meaning communal settlement/s8 This is an NGO which works closely with slum dwellers9 Overall or absolute poverty lines are based on the cost ofpurchasing a basket of basic food items representing theamount of calories sufficient for survival (a daily allowance of2,250 calories per adult) and of essential non-food items, suchas clothing, shelter and transport (GOK, 1998)10Syagga et. al. (2001:35) note significantly that the variationsin population levels for slums reflect the different methodolo-gies adopted in arriving at the estimates, because everyperson generates baseline data of their own and this a recipefor controversy.11There are clear deviations in the population figures depictedin Table 5 and Table 7.0. These differences relay a differencein the manner in which the data was conceived and gener-ated. However, they point to the clear problem of high popula-tion densities in the informal settlements.
Urban Slums Reports: The case of Nairobi, Kenya
16

BIBLIOGRAPHY
African Population and Health Research Centre (2002)Population and Health Dynamics in Nairobi’s InformalSettlements African Population and Health Research Centre,Nairobi
Aligula, Eric M (1999) Improving the Performance of UrbanWater Infrastructure Services delivery and Management inKenya A Case Study of Nairobi City, Kisumu and Eldoret TownsShaker Verlag, Aachen
Ayako, Aloys B and Musambayi Katumanga (1997) Review ofPoverty in Kenya Institute for Policy Analysis and Research,Nairobi
Clarion (2001) “Kenya State of Corruption Report” Issue No 2Centre for Law and Research International, Nairobi
Government of Kenya (1965/66) Sessional Paper No10;Housing Policy for Kenya; 1965, Government Printers, Kenya
Government of Kenya (1980) Kenya Low-cost Housing By-lawStudy, Volumes 1 and 2, Ministry of Lands and Housing,Nairobi
Government of Kenya (1994) Social Dimensions ofDevelopment in Kenya An Approach to Human CentredDevelopment and Alleviation of Poverty Government Printers,Nairobi
Government of Kenya (1996) National Report and Plan ofAction on Shelter and Human Settlements to Habitat 11Conference, Ministry of Public Works and Housing, Nairobi
Government of Kenya (1997) Sessional Paper No 4 on AIDS inKenya Ministry of Health, Government Printer, Nairobi
Government of Kenya (1998b) Economic Survey CentralBureau of Statistics, Government Printer, Nairobi
Government of Kenya (1999) National Poverty EradicationPlan 1999-2015 Department of Development Co-ordination,Office of the President, Government Printer, Nairobi
Government of Kenya (1999a) Economic Survey GovernmentPrinters, Nairobi
Government of Kenya (2000) Interim Poverty ReductionStrategy Paper for the period 2000-2003, Government Printer,Nairobi
Government of Kenya (2001) 1999 Population and HousingCensus Volume I Central Bureau of Statistics Nairobi
Government of Kenya (2001a) 1999 Population and HousingCensus Volume II Central Bureau of Statistics Nairobi
Government of Kenya (2001b) Economic Survey GovernmentPrinters, Nairobi
Government of Kenya (2002) Economic Survey GovernmentPrinters, Nairobi
House, WJ (1978) “Nairobi’s Informal Sector A Reservoir ofDynamic Entrepreneurs of a Residual Pool of Surplus Labour?”University of Nairobi Working Paper No 347, Institute ofDevelopment Studies, Nairobi
Karirah-Gitau, Sarah (1999) Housing, Environment andPoverty Management in Eastern Africa A Case of SlumSettlements in Nairobi, Kenya – A Final Report A ShelterAfrique Research Project funded by IDRC, Nairobi
Malombe, JM (1992) “The Role of Dandora Site and ServiceProject in Providing Housing the Nairobi Residents” AfricanUrban Quarterly, Volume 7, Numbers 1&2 (pp196-202)
Malombe, JM (1995) “Approaches to Urban Poverty Reductionin Kenya; The Role of NGOs” Paper presented at the UNconference on Urban Poverty and Governance Workshop inEastern Africa 14-16 March
Manda, Damiano Kulundu; Mwangi S Kimenyi and GermanoMwabu (2001) “A Review of Poverty and Antipoverty Initiativesin Kenya” Working Paper No 3 Kenya Institute of Public PolicyResearch and Analysis, Nairobi
Matrix Development Consultants (1993) Nairobi’s InformalSettlements An Inventory Office of Housing and UrbanDevelopment Programmes, USAID
Mbogua, JP (2000) “Problems of Shelter and PlanningConstraints in the City of Nairobi” Paper presented to theAnnual National Convention of the Architectural Association ofKenya held at Safari Park Hotel, Nairobi, 27 –30th June
Mitullah, WV 1997 “In-Depth Studies of Female HeadedHouseholds in Nairobi, Kibera” A Contribution toUNDP/UNIFEM/UNCHS Programme to Improve theLivelihoods of Female Headed Households Living in InformalSettlements
Mwatha, RG (1988) “Women business entrepreneurs in urbaninformal sector” Paper presented to the First InternationalConference on Urban Growth and Spatial Planning of Nairobi,Nairobi
Nairobi Informal Settlements Co-ordinating Committee, (1996)A Development Strategy for Nairobi’s Informal Settlements(NISCC) Nairobi
National Co-operative Housing Union Ltd (NACHU) (1990) ASurvey of Informal Settlements in Nairobi February, NationalCo-operative Housing Union Ltd, Nairobi
Ngau, Margaret and Mitullah, WV 1997 Programme Documentfor Improving the Livelihood of Female-headed Households inPoverty in Nairobi’s Informal settlements
Ngau, P (1995) Informal Settlements in Nairobi A BaselineSurvey of Slums and Squatter Settlements An Inventory ofNGOs and CBOs activities, Nairobi
NISCC (1997) A Development Strategy for Nairobi’s InformalSettlements Nairobi, ITDG Resource Centre
NISSC, (2000) Presentation to the Presidential Commission ofEnquiry into Land Law Systems of Kenya, by the TAC andNISSC
Obudho, RA (1992) “The Role of Metropolitan Nairobi in SpatialPlanning in Kenya; Towards a Planning Alternative” AfricanUrban Quarterly Vol 7 No 1 & 2, February 1992
Obudho, RA (1997) Nairobi National capital and regional hubIn Carole Rakodi (ed) The Urban Challenge in Africa Growthand Management of its Large Cities United Nations University,New York(http//wwwunuedu/unupress/unupbooks/uu26ue/uu26ue00htm#Contents Accessed Monday, 17 June 2002)
Obudho, RA and Aduwo (1988) “The Role of Nairobi in SpatialPlanning in Kenya Towards a Planning Alternative” FirstInternational Conference on Urban Growth and SpatialPlanning of Nairobi, Nairobi
Obudho, RA and Aduwo (1992) “The Nature of theUrbanisation Process and Urbanism in the City of Nairobi,Kenya African Urban Quarterly Vol7 No 1 & 2, February 1992
Obudho, RA and GO Oduwo (1989) “Slum and squatter settle-ments in urban centres of Kenya. Towards a planning strategy”Netherlands Journal of Housing and Environmental Research,Volume 4, Number 1, pp 17-29
UNDERSTANDING SLUMS: Case Stud ies fo r the G loba l Repor t on Human Set t lements 2003
17

Olima, WHA (1997) “The Conflicts, Shortcomings andImplications of the Urban Land Management System in Kenya”Habitat International Vol 21, No 3, pp 319 – 331
Olima, WHO (2001) “The Dynamics and Implications ofSustaining Urban Spatial Segregation in Kenya – Experiencesfrom Nairobi Metropolis” A Paper Presented at the InternationalSeminar on Segregation in the City Held at Lincoln Institute ofLand Policy in Cambridge, MA, USA, July 25-28, 2001http//wwwlincolninstedu/courses/segreg/olimadoc onWednesday, June 12, 2002
Shihembetsa LU (1989) “Urban Developments and DwellingEnvironments. Brief Notes on Dandora, Kariobangi andEastleigh” International Workshop on Housing KU-Leuven,UNCHS-PGCHS-HRDU
Situma, FDP (1992) “The Environmental Problems in the Cityof Nairobi” African Urban Quarterly, Vol 7 Nos 1 and 2,February
Syagga, PM (1989) “Trends in Urban housing Strategy forKenya in the Next Decade”, Open-House International, JulyProceedings of the Quality in the Built EnvironmentConference
Syagga, PM and JM Malombe (1995) Development of InformalHousing in Kenya Case Studies of Kisumu and Nakuru TownsHousing and Building Research Institute, University of Nairobi
Syagga, PM, R Gatabaki-Kamau and PO Ondiege (1989)Access by Women and the Urban poor to Urban Land andCredit A Socio-Economic Evaluation of the Third Urban Projectin Kenya Housing Research and Development Unit, Universityof Nairobi (pp 75-115)
Syagga, Paul; Winnie Mitullah and Sarah K Gitau (2001)Nairobi Situation Analysis A Consultative Report Governmentof Kenya and United Nations Centre for Human Settlements(Habitat) Nairobi
Wasao, Samson (2002) Characteristics of households andrespondents In Population and health dynamics in Nairobi’sInformal Settlements African Population and Health ResearchCentre, Nairobi
White, LWT, L Silberman, and PR Anderson (1948) NairobiMaster Plan for a Colonial Capital A Report Prepared for theMunicipality of Nairobi HMSO, London
World Bank and DFID (2002) An Assessment of Local ServiceDelivery and Local Governments in Kenya Draft Final ReportMay 30
ACRONYMS
AD Anno Domini
AMREF African Medical Research Foundation
CBD Central Business District
CBOs Community Based Organisations
CLARION Centre for Law and Research International
GOK Government of Kenya
KUR Kenya Uganda Railway
LAs Local Authorities
LATF Local Authorities Transfer Fund
MOLA Ministry of Local Authorities
NCC Nairobi City Council
NGOs Non Governmental Organisations
NISCC Nairobi Informal Settlements Coordination Committee
OP Office of the President
PRSP Poverty Reduction Strategy Paper
UNCHS United Nations Centre for Human Settlements
FOREIGN EXCHANGE EQUIVALENT
As of Thursday, 04 July 2002I US $ = Kshs. 78.30
Urban Slums Reports: The case of Nairobi, Kenya
18

UNDERSTANDING SLUMS: Case Stud ies fo r the G loba l Repor t on Human Set t lements 2003
APPENDIX 1:
Summary of Previous Poverty Estimates for Kenya
Author Reference Data Source Poverty Incidence
FAO 1977Not shown
Food balance sheet, 1972-74 30% of population
Crawford and Thorbecke 19781974/75
1976 Integrated Rural Survey I (1974/75)
1976 Employment Earnings in the Modern
Sector
Integrated Rural Survey II
38.5% of households
44% of population
Collier and Lal 19801974/75
Integrated Rural Survey I Smallholder 34.2% of smallholder population
29% of all population
Vandermoortele 1976 Integrated Rural Survey I (1974/75) 33.1% of smallholder
15.3% of urban households
Crawford and Thorbecke 1980 1974/75 Integrated Rural Survey (1977) 25% households
Greer and Thorbecke 1980
Jamal 1981
1974/751976
Integrated Rural Survey (1977)
Not shown
38.6% of smallholders
32% of populations
Bigsten 1987 1976 National Accounts 40%
World Bank 19911981/82
1981/82 penal survey and complimentary
statistics
22% of rural population
World Bank 1995 and Mukui 1993
1981/821992 1981/82 Rural Survey and 1992 Welfare
Monitoring Survey (WMS) I
Rural: 48% for 1981/82 & 46% for 1992
Urban: 29.3% for 1992
Narayan and Nyamwaya 1996 1994 Participatory Poverty Assessment Widespread poverty in rural areas results
similar to 1992 WMS above
Government of Kenya 1998 1994 1992 WMS I 46.8% Rural Population
29% Urban Population
40% National Estimates
Mwabu et. al. 2000 1994 1994 WMS II 39.7% Rural Population
28.9% Urban Population
38.8% National Population
Government of Kenya 2000 1997 1997 WMS III 52.9% Rural Population
49.2% Urban Population
52.3% National Population
Source: Adapted from Manda, Damiano Kulundu; Mwangi Kimenyi and Germano Mwabu (2001) p. 16
19

Urban Slums Reports: The case of Nairobi, Kenya
APPENDIX 2: CITY REPORT CASE STUDY 1
KURIA: A MALE HOUSEHOLD HEAD
Kuria [not his real name] is 45 years old and has a second-ary education. He first came to Nairobi in 1980 when his fatherwas transferred to Nairobi from Nakuru, 150 kilometres fromNairobi. The father has since retired and is living in ruralKenya. Kuria stays with his mother who is 52 years old, andsister who is 19. The other three brothers [34, 33 and 27respectively] and two sisters [31 and 29] have moved out, butthe brothers live in Nairobi. The other two sisters are marriedand staying with their husbands [in slum or formal housing].The family does not own any land in the rural or urban areasbut they own the structure in which they live.
The structure has 4 rooms [three used to be rented].However, the tenants have moved out due to disagreementsover rent, which they wanted lowered after the rent issue waspoliticised during the Kibera rent crisis, which affected mostslums in Nairobi. The rooms are built of mud walls, cementfloor and iron sheet roof. The room has basic furniture, chairs,a table, bed and utensils. The family owns a makeshift toiletand bathroom within their compound, and do not share it withneighbours. Some of their neighbours use nearby unoccupiedhouses as both bathrooms and toilets. This has been anuisance to Kuria’s family. They are exposed to foul smells.
There are shops and bars near the structure, while water isavailable outside the plot. The family has an income of Kshs.4,000 and the other brothers who do not live in the house chipin occasionally. The family gets water from the neighbouringplot and spends Kshs. 150 per month on it. The family spendsa total of Ksh. 2,000 on food, Ksh. 1,000 on health and Ksh1,000 on education. Kuria and his brother are paying fees fora cousin who is living and studying in a rural area. The Ksh.1,000 is part of the fees, which goes towards books andpocket money.
Kuria worked with Nation Newspaper between 1995 and2000 as a casual labourer. After five years, he was not offeredany more casual work. He believes that he was pushed outsince his godfather who was a permanent employee with thefirm was sacked. In spite of this, he was grateful that thecasual work with the group inspired him to start a newspapervending business on which he survives.
APPENDIX 3: CITY REPORT CASE STUDY 2
MUGAMBI: A MALE HOUSEHOLD HEAD
Mugambi [not his real name] is 45 years old with incompleteprimary level education. He first came to Nairobi in 1965 andstayed with a brother in a planned low-income residential areaof the city, Makadara. He later moved out of his brother’s houseand stayed within the same estate. He moved into the slum in1980 after being sacked from his job. He had declined a trans-fer out of Nairobi. He first worked as a storekeeper in an Indianfirm between 1971 and 1976. He then joined Bata ShoeCompany between 1976 and 1978 as a packager before beingsacked. Mugambi does not have land or plots in rural or urbanarea.
During his formal employment, he learnt to repair machines,which still provides him with casual employment. After losinghis job, he had to rely on casual work which is unreliable anddid not enable him stay in a planned housing estate. He nowlives in a slum, earns about Ksh. 5,000 per month, and does nothave any other source of income or support.
Mugambi lives with his wife, six children and an orphanedniece who is only three and a half. He is a tenant and spendsKsh. 600, 2,000, 150, 420, 500 and 1,500 on rent, food, water,education, health and transport respectively. The family lives intwo rooms constructed of mud walls, mud floor and iron sheetroof. The family only has clothing for the family, stools, a table,bed and utensils. The sanitation around the structure is verypoor. The family has no access to a toilet and relies on a neigh-bour’s toilet. There is no bathroom and the family bathes in oneof the rooms, this somehow helps in damping the dust.Although there are shops and bars within the plot, the familyhas to fetch water outside the plot.
Mugambi knows about existing associations within the slumbut does not want to be a member because most of themrequire money, and he is struggling to feed the family andprovide other necessities. He appreciates the work of theCatholic Church. One of the priests used to pay fees for two ofhis children and since the priest left the parish, his children areoften out of school.
Mugambi aspires to start his own business because employ-ment has become difficult to get. He thinks that this will allowhim to employ his children and create employment opportunityfor others. He also wishes to buy a plot in the rural areas so thathe can engage in farming to supplement the income he getsfrom casual employment in Nairobi.
20

UNDERSTANDING SLUMS: Case Stud ies fo r the G loba l Repor t on Human Set t lements 2003
APPENDIX 4: CITY REPORT CASE STUDY 3
ANYANGO: A FEMALE HOUSEHOLD HEADAnyango [not her real name] is a 45-year-old lady living in
two rooms of about 10 by 8 feet (3mx2.5m) in Korogocho. Sheand her husband were living in their rural home, but due toacute suffering and lack of basic necessities, they decided tomove to Nairobi in search of greener pastures in 1983. Shejoined her husband who had come to Nairobi earlier andsettled in the same slum, where they currently live. Her inten-tion was to engage in small-scale economic activities in orderto supplement her husband’s income. He was a casuallabourer in a construction firm. A single lady who did not haveany dependants initially accommodated her. The lady hassince died.
A large part of Anyango’s life has been occupied by workingas a house help for different middle and upper income familiesin Nairobi. She has no formal education and could not get anyformal employment. Her husband has been co-operative asAnyango goes to work for other families. He takes care of thechildren while she is away. As the number of childrenincreased with the birth of a grandchild, she had to stop beingemployed as house help and engage in small-scale enter-prise. This also allowed her to take care of the children. Shehas several dependants: her husband, 4 children, a grand-child, and two brothers. The family lives in two roomsconstructed of mud walls, plastered floor and an old rustycorrugated iron sheet roof. What serves as a seating room has4 wooden stools, a wooden table and a bed at the far end. Theother room is used as kitchen and bedroom for the children. Ithad an old mattress on the floor where all the children sleep.One child was seated on the floor doing homework whileanother four-year-old boy was washing plates on the floor.
Anyango used to save about Ksh. 500 per month during heremployment. She used the savings for starting her business in1984, after leaving employment and she began with a grocerykiosk but has been changing the type of business according todemand. At the time of the interview she was selling boiledmaize, yoghurt, fresh milk and vegetables.
Anyango spends Ksh. 600, 2000 and 2000 on rent, foodand medical bills respectively per month. She also spends Ksh350 per month for the three children who are in primaryschool. The two in lower classes pay Ksh. 100 each while onein upper primary pays Ksh. 150. She is a member of a self-help women’s group, which is strong and presents dances atpolitical rallies. The interview took place when she had justarrived from a political rally organised by the ruling party.Occasionally she borrows money from the group. Anyangoenjoys a good relationship with her neighbours. In particular,there are three other households within her area with whichshe has close associations and they always assist each otherwhen there is need.
There were no windows in any of the rooms, and the roomswere extremely dark. A little tin lamp had to be lit to facilitatethe in-depth discussion. Sanitation around the house waspoor, no drainage but a stagnant and stinking trench, withrubbish strewn around the house. Anyango prefers to live in aslum because the rents are low and the cost of food is alsoreasonable. Although she lives in a congested environment, inher rural home she has a 1 acre piece of land, which is notused. What she referred to as a bathroom was a makeshiftcorner, covered with plastic paper with a sewage with awooden structure put on top. The family shared a toilet withseveral other households. Discussions indicated that the toiletoften gets full and those who use it join hands to drain it phys-ically, by using a plastic container on a drum which is disposedof by handcart. There is a water point near the house providedthrough a joint effort of the Kenya Government and someAustralian donors. Water costs Ksh. 2 per 20-litre container.There are six general grocery shops within the vicinity sellingmost of the family’s requirements. Anyango observed thatthere used to be many bars around the house but these hadbeen closed down due to insecurity. There are many healthand educational facilities within the vicinity, which are profit-making and are accessible so long as one can pay. The onlynearby public school is expensive and admission is not easyto get.
Anyango lamented three problems in the slums: the level ofinsecurity within the slums, poor sanitation and congestion.She noted “there is constant theft regardless of time – the onlyadvantage of living in slums is just cheap housing and cheapfood prices”. Her final comment was that these advantages“can cost one their life as insecurity is too great”. She aspiresto save money and be able to invest and educate her children.She does not want her children to have a bad future similar tothe one she experiences due to lack of education. She notedthat adequate savings will not only enable her to educate herchildren but she will also be able to build a house in her ruralhome, purchase livestock and install a posho mill. Anyangohas the political ambition of being a chairlady of a nationalbody of women’s self help groups.
21

Urban Slums Reports: The case of Nairobi, Kenya
APPENDIX 5: CITY REPORT CASE STUDY 4
NYAWIRA: A FEMALE HOUSEHOLD HEAD
Nyawira is a 38-year-old widow living in a single room ofabout 12 by 10 feet (3mx3.5m). The room has mud floors andwalls, with a rusty galvanised iron sheet [mabati] roof. It is in apathetic state. The wall is falling down and one can seethrough the structure but the is no window and the door has toremain open to light the room. The room has three easychairs, a wooden table, a bed and a few utensils.
Nyawira came to the city in 1973 to join her husband whowas then employed at Karen Country Club and living withinthe affluent suburb of Karen where the club is located. Herhusband died in 1993 and left her with 9 children. She thenhad to relocate to her rural area. Life turned out to be unbear-able since the brothers-in-law did not accept her. Her husbandwas an only child born to parents who had worked and livedoutside Kenya [Uganda]. The husband’s immediate familysub-divided land in their absence. Since no allocation wasgiven to him, she had no land left in her name. Her housewhich had been put up for her before her husband died, dueto the brother in laws’ hatred, was demolished. She was leftwith nowhere to live with her 9 children. She left for her maidenhome but during the same year, she decided to come back toNairobi with all her 9 children to look for a source of livelihood.
Nyawira came to live in the slum because she had heardthat rents were cheap and food was affordable. She startedworking in 1993 washing clothes for Somali families within theslum at a cost of Kshs. 50 per day. She continued saving someof the money with a plan of starting a small-scale business.Meanwhile all her children were out of school due to lack ofschool fees. With Kshs. 300, she started selling githeri [cookedmaize and beans]. She continued to supplement the incomefrom this business by washing clothes. During hard times, sheuses her working capital for basic needs and has to go back towashing clothes until she makes adequate savings to enableher start all over again.
Nyawira has no other source of income and she does notmake adequate savings. The profit margin from the economicactivities she does are so small and she has several depen-dants. After her husband’s death she bore another childmaking a total of 10. She also takes care of three of her deadsister-in-law’s children. Only six of her children go to school.Three others have attained school-going age but cannot beadmitted to a nearby public school since she has fee arrearsfor the other six. She is required to clear these arrears beforethe others can be admitted. The three other children belongingto her sister-in-law are all at home even though they haveattained school age.
Nyawira spends Kshs. 500, 500, 100, and 150 on rent, food,health and education respectively. She noted that occasionallythe family goes hungry and often cannot afford health serv-ices.
She faces a number of difficulties of which feeding thefamily is a major one. Others include lack of school fees andmedical expenses. Insecurity is another major problem.Several times, she has had her house broken into and almosteverything stolen. In one incident she had to borrow blankets.
Her aspirations are to educate her children to be able toassist her in future. She also aspires to expand her businessor establish a bigger business to bring in income to improvethe family’s livelihood and purchase a piece of land to estab-lish a home for her 10 children. Sanitation is poor withdrainage passing right in front of the door. The family hasaccess to a makeshift bathroom and toilet and the childrenrelieve themselves on the pathways. There is a common watersource where water is bought at Kshs. 1 per 20-litre container.Several small general shops surround the house and illicitbrews [changaa and busaa] are sold in most households.Some of the illicit brews are brewed in the surrounding house-holds while others are purchased from elsewhere. Drugs arealso sold around the household with security forces being partof the syndicate.
22