nais/sss financial aid workshop series fall 2002 mark j. mitchell, vp financial aid services...
TRANSCRIPT
NAIS/SSS Financial Aid Workshop Series
Fall 2002
Mark J. Mitchell, VP Financial Aid Services
Financial Aid Trends and Research in Independent Schools
Copyright National Association of Independent Schools 2001
Evaluating Trends and Research: Key Questions
Are demand and enrollment tied to tuition trends? To financial aid trends?
Are the numbers of students receiving financial aid changing? Are schools extending more aid to more students?
Is financial aid keeping pace with tuition increases?
How can we quantify whether financial aid impacts retention?
Do you know where your school fits?
Copyright 2002 National Association of Independent Schools
19.7 23
.3 26.4
21.4
5.9
1317
.9
-3.2
3.7
14.3
17.9
-5
0
5
10
15
20
25
30
Per
cen
t C
han
ges
Boarding Boarding-Day
Day Day-Boarding
All Schools
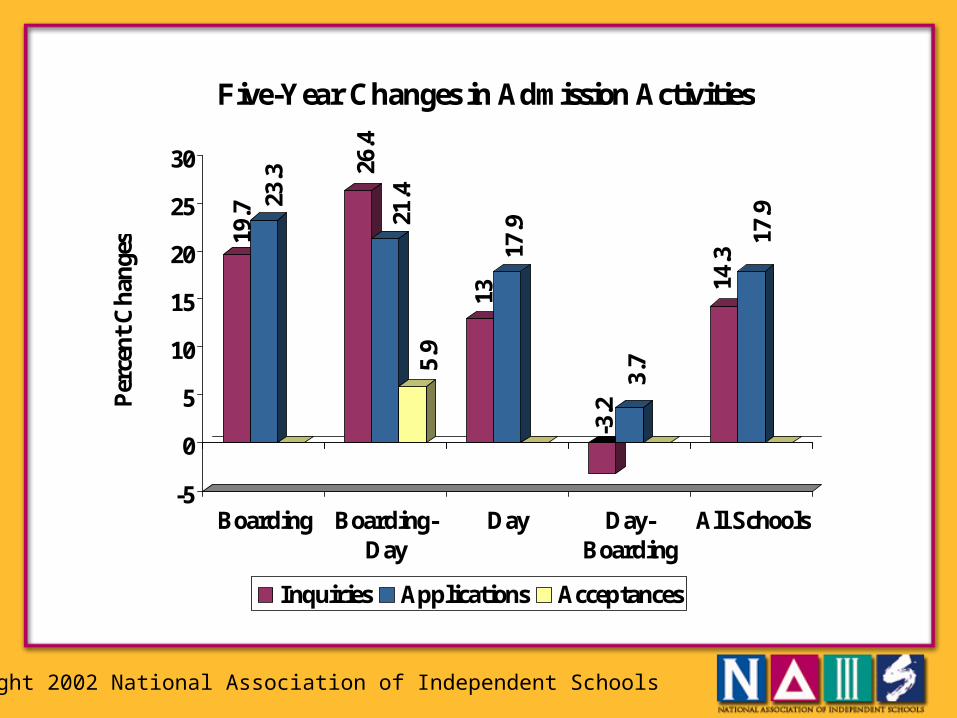
Five-Year Changes in Admission Activities
Inquiries Applications Acceptances
Copyright 2002 National Association of Independent Schools
About Demand: 10-year Trends
Independent schools have become increasingly competitive.
Since 1991 boarding-day schools’ inquiries per enrollee have increased by 58%, the highest inquiry jump of any school type.
Over the last ten years, day schools have seen the largest increase in applications per enrollee (32%) and the second largest increase in inquiries (52.6%).
While boarding schools have increased their acceptances per enrollee by 7.1% since 1991, all other types of schools have not changed the number of acceptances per enrollee.
Copyright 2002 National Association of Independent Schools
-1.2 0
13.9
11.5
9.7
23.6
-3.8
3.7
8.4
19.9
-5
0
5
10
15
20
25
Per
cen
t C
han
ges
Boarding Boarding-Day
Day Day-Boarding
All Schools
Change in Enrollment
1997-2002 1992-2002
Copyright 2002 National Association of Independent Schools
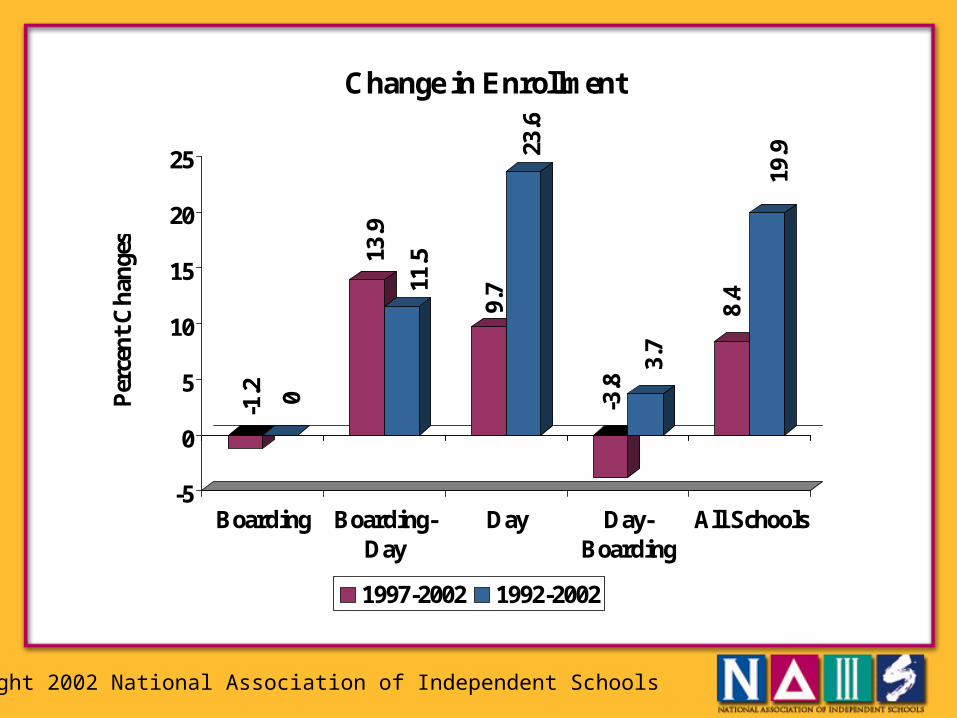
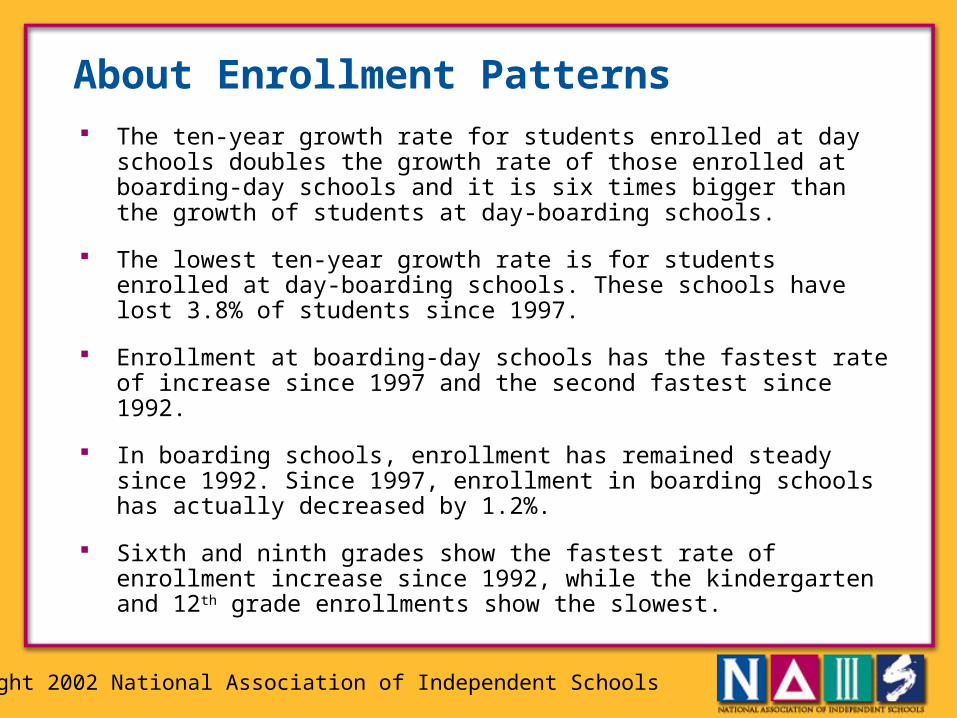
About Enrollment Patterns The ten-year growth rate for students enrolled at day schools doubles the
growth rate of those enrolled at boarding-day schools and it is six times bigger than the growth of students at day-boarding schools.
The lowest ten-year growth rate is for students enrolled at day-boarding schools. These schools have lost 3.8% of students since 1997.
Enrollment at boarding-day schools has the fastest rate of increase since 1997 and the second fastest since 1992.
In boarding schools, enrollment has remained steady since 1992. Since 1997, enrollment in boarding schools has actually decreased by 1.2%.
Sixth and ninth grades show the fastest rate of enrollment increase since 1992, while the kindergarten and 12th grade enrollments show the slowest.
Copyright 2002 National Association of Independent Schools
-8.6
16.3
-6.7
12
14.8
23
-4.3
0
10.7
19.4
-10
-5
0
5
10
15
20
25
Per
cen
t C
han
ges
Boarding Boarding-Day
Day Day-Boarding
All Schools
Change in Student of Color Enrollment
1997-2002 1992-2002
Copyright 2002 National Association of Independent Schools
About Students of Color
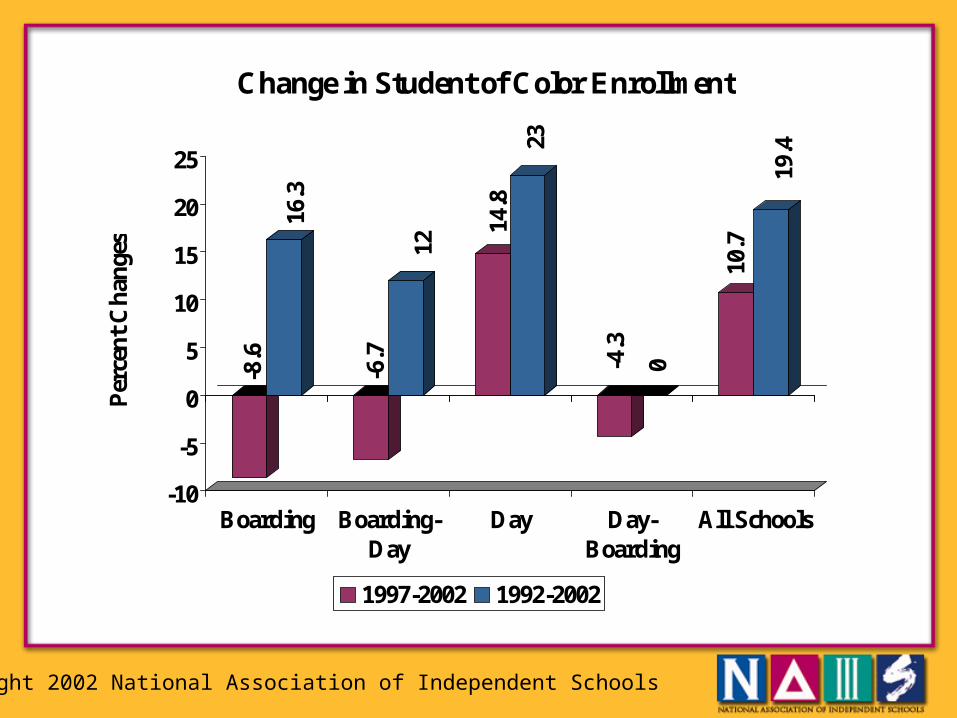
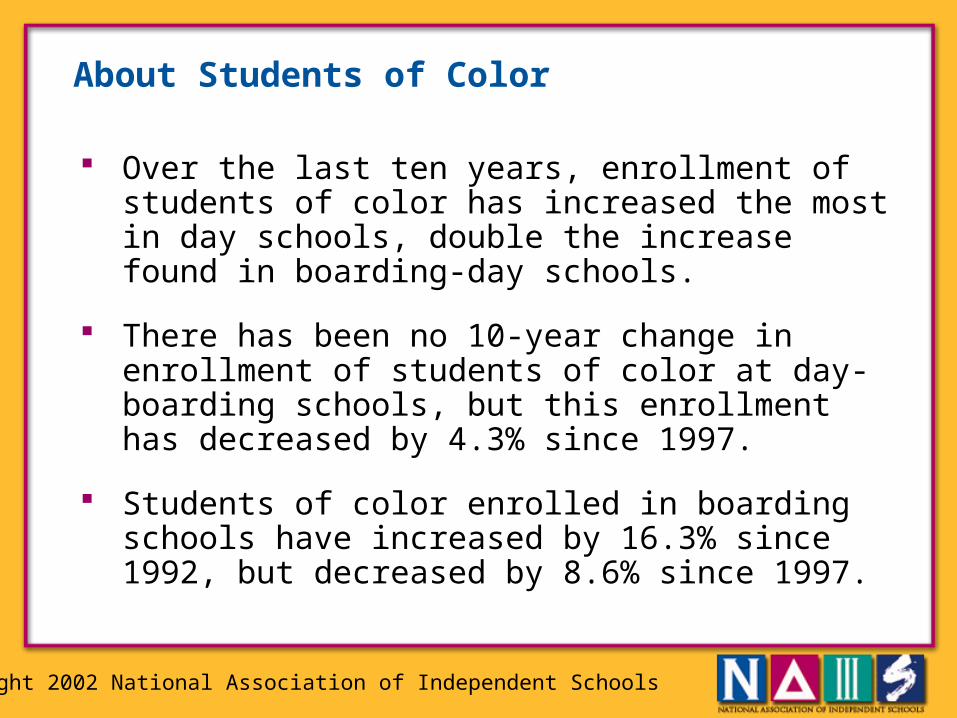
Over the last ten years, enrollment of students of color has increased the most in day schools, double the increase found in boarding-day schools.
There has been no 10-year change in enrollment of students of color at day-boarding schools, but this enrollment has decreased by 4.3% since 1997.
Students of color enrolled in boarding schools have increased by 16.3% since 1992, but decreased by 8.6% since 1997.
Copyright 2002 National Association of Independent Schools
38.6
29.5
16.9
16.3
32.9
29.7
23.1
15.2
0
5
10
15
20
25
30
35
40
Per
cen
t C
han
ges
Day 92-02 Day 97-02 Boarding 92-02 Boarding 97-02
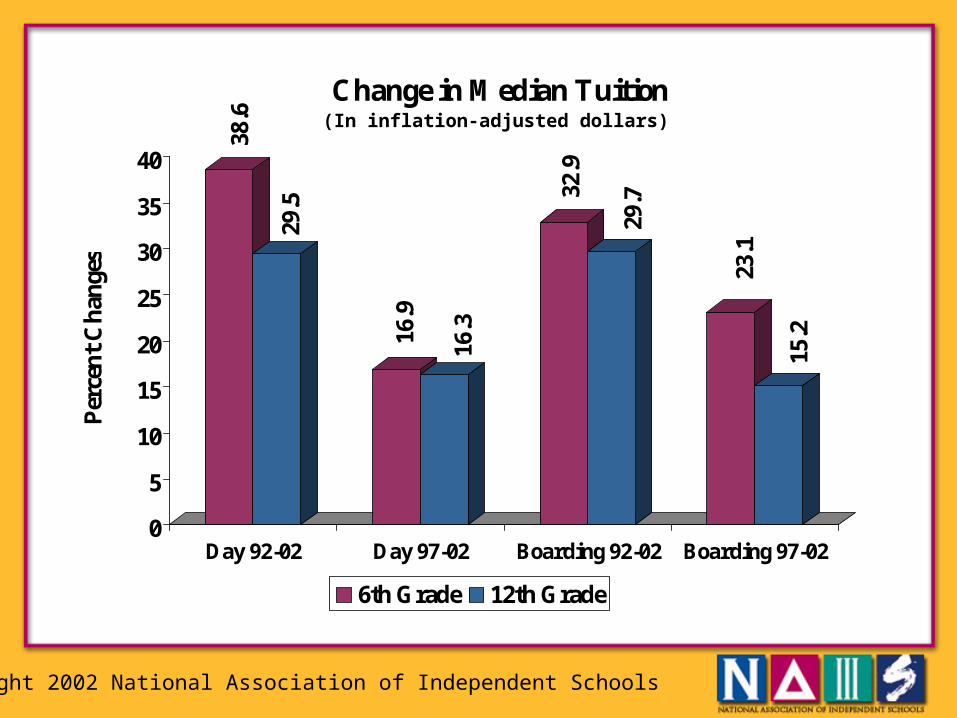
Change in Median Tuition
6th Grade 12th Grade
(In inflation-adjusted dollars)
Copyright 2002 National Association of Independent Schools
About Tuition Patterns
Median day school tuitions for sixth grade have increased the fastest since 1992.
Day school tuitions for sixth and twelfth grades have both increased by over 16% in the last 5 years.
Twelfth grade tuitions have almost the same rate of increase for day and 7-day boarding schools.
Copyright 2002 National Association of Independent Schools
25.6
-7.6
35.8
10.9
45
-2.1
11.6
21.2
38.1
1.8
-10
0
10
20
30
40
50
Per
cen
t C
han
ges
Boarding Boarding-Day
Day Day-Boarding
All Schools
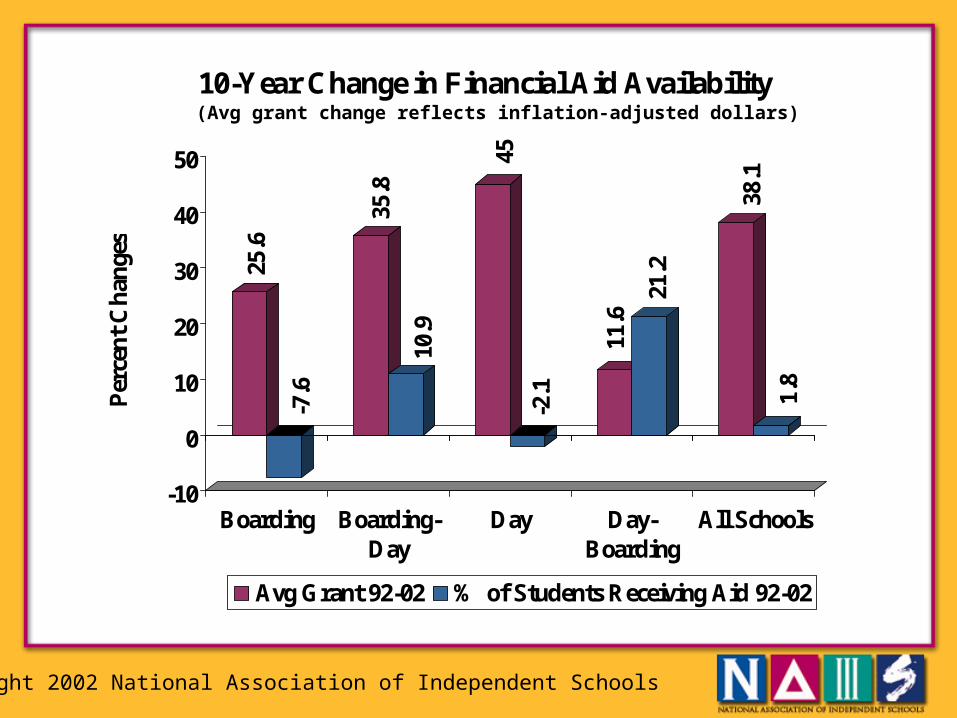
10-Year Change in Financial Aid Availability
Avg Grant 92-02 % of Students Receiving Aid 92-02
(Avg grant change reflects inflation-adjusted dollars)
Copyright 2002 National Association of Independent Schools
About Financial Aid: 10-year Trends
Since 1992, the average financial aid grant at day schools has increased by 45% but the number of students receiving the grants have decreased by 2.1%.
Financial aid grants in boarding schools have increased by 25.6% but the number of students benefiting from financial aid has decreased by 7.6% since 1992.
Among day-boarding schools, financial aid grants have increased by 11.6% while the number of students receiving financial aid has increased by 21.2%.
Copyright 2002 National Association of Independent Schools
9.7 12
.6
22.6
-5.6
22.1
-1.4
5.7
5.8
19.9
-1.2
-10
-5
0
5
10
15
20
25
Per
cen
t C
han
ges
Boarding Boarding-Day
Day Day-Boarding
All Schools
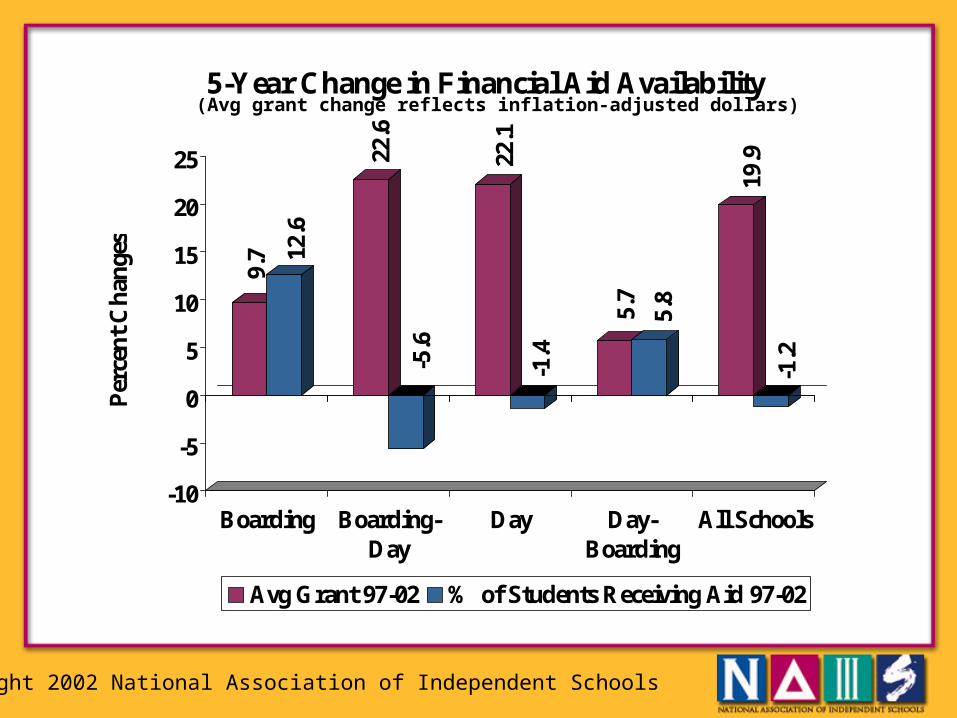
5-Year Change in Financial Aid Availability
Avg Grant 97-02 % of Students Receiving Aid 97-02
(Avg grant change reflects inflation-adjusted dollars)
Copyright 2002 National Association of Independent Schools
About Financial Aid: 5-year Trends
Boarding-day and day schools have similar rates of increase in their financial aid grants since 1997.
The number of boarding-day students receiving financial aid has decreased by 5.6%, while the number of day students on financial aid has decreased by 1.4% since 1997.
Both 5- and 10-year trends indicate that higher average awards are being provided to fewer students.
Copyright 2002 National Association of Independent Schools
12.9
23.8
5.3
0.7
8.4
8
5.4 7.
3 8.4
10.8
0
5
10
15
20
25
Per
cen
t C
han
ges
Boarding Boarding-Day
Day Day-Boarding
All Schools
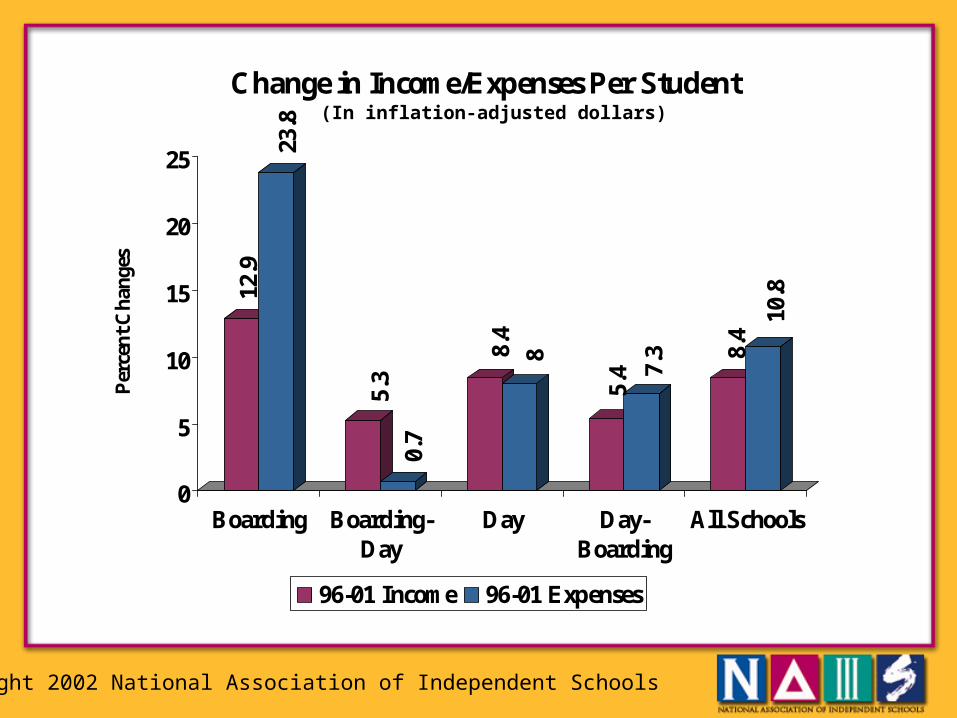
Change in Income/Expenses Per Student
96-01 Income 96-01 Expenses
(In inflation-adjusted dollars)
Copyright 2002 National Association of Independent Schools
14
13.5
20.5
12.5
23.7
20.5
19.3
19.6
18.2
15.1
0
5
10
15
20
25
Per
cen
t C
han
ges
Boarding Boarding-Day
Day Day-Boarding
All Schools
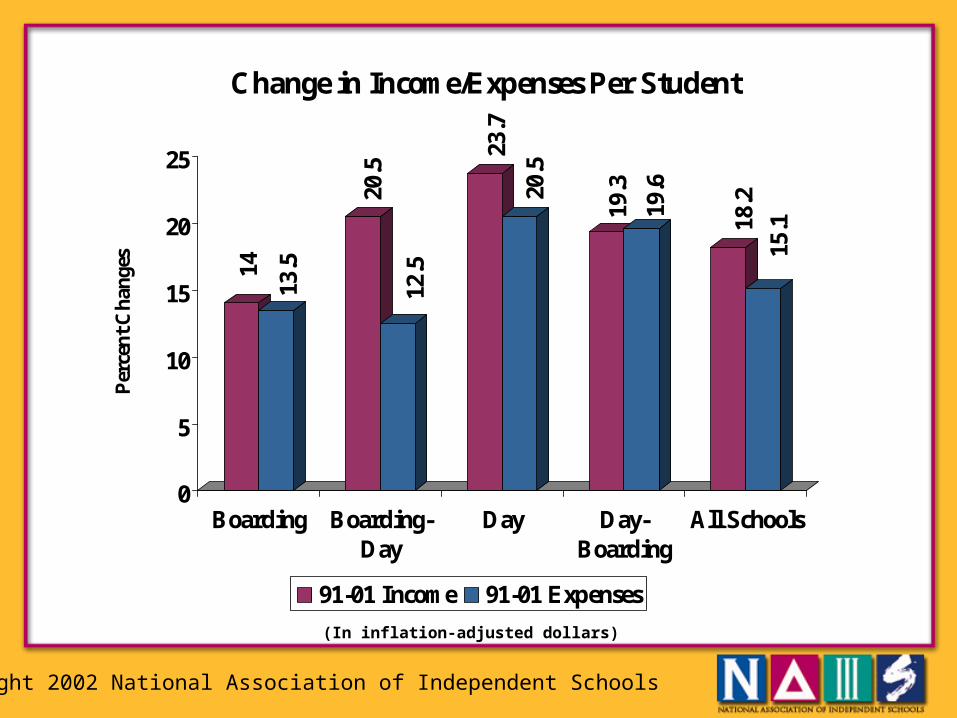
Change in Income/Expenses Per Student
91-01 Income 91-01 Expenses
(In inflation-adjusted dollars)
Copyright 2002 National Association of Independent Schools
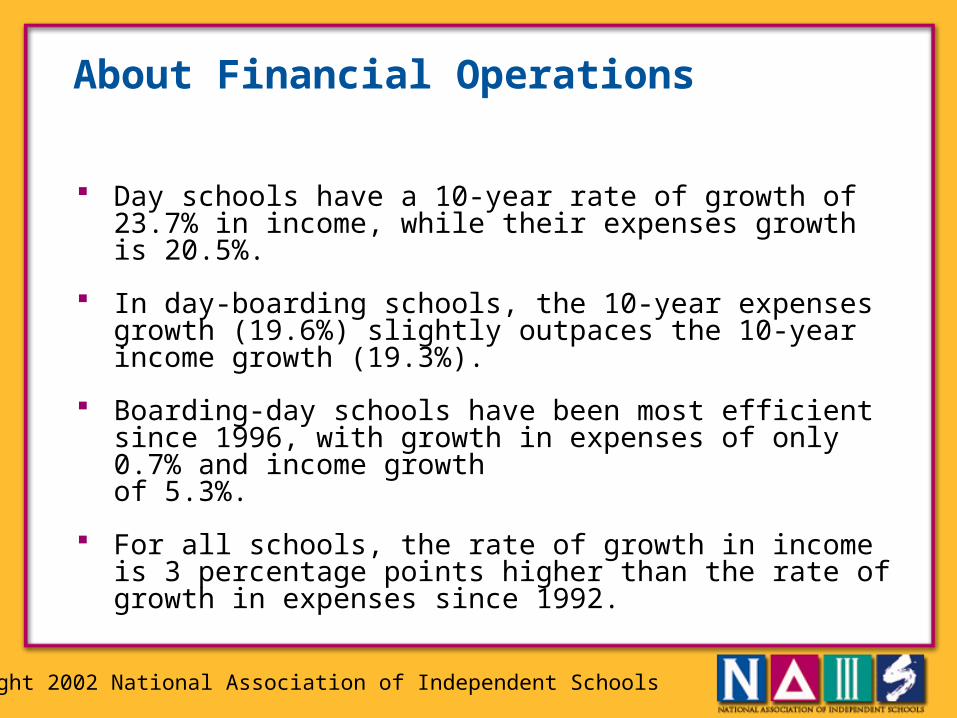
About Financial Operations
Day schools have a 10-year rate of growth of 23.7% in income, while their expenses growth is 20.5%.
In day-boarding schools, the 10-year expenses growth (19.6%) slightly outpaces the 10-year income growth (19.3%).
Boarding-day schools have been most efficient since 1996, with growth in expenses of only 0.7% and income growth of 5.3%.
For all schools, the rate of growth in income is 3 percentage points higher than the rate of growth in expenses since 1992.
Copyright 2002 National Association of Independent Schools
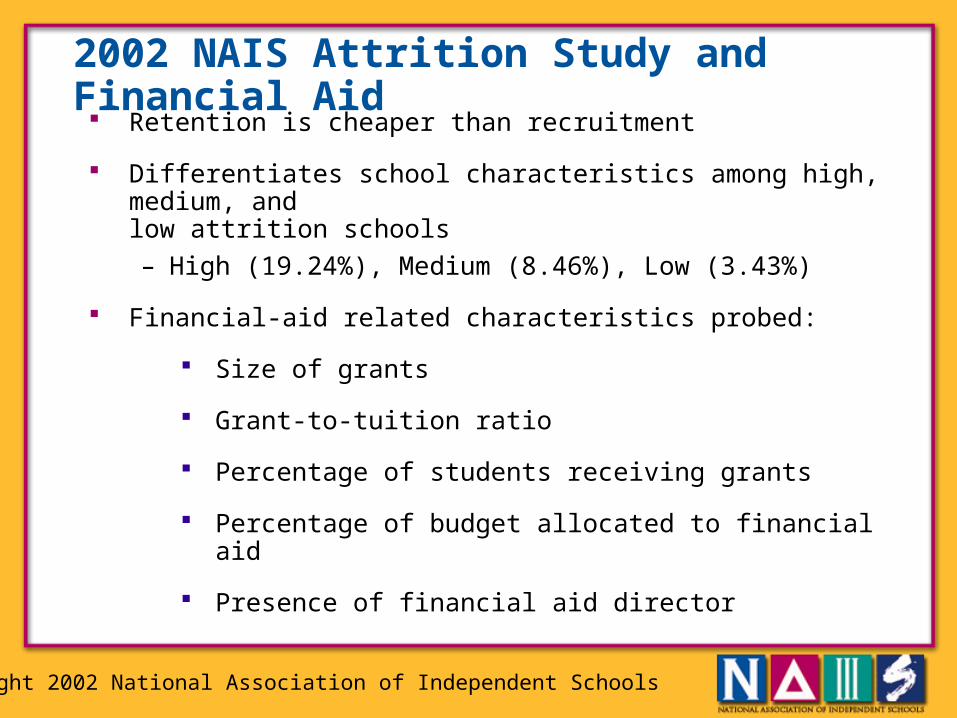
2002 NAIS Attrition Study and Financial Aid
Retention is cheaper than recruitment
Differentiates school characteristics among high, medium, and low attrition schools
– High (19.24%), Medium (8.46%), Low (3.43%)
Financial-aid related characteristics probed:
Size of grants
Grant-to-tuition ratio
Percentage of students receiving grants
Percentage of budget allocated to financial aid
Presence of financial aid director
Copyright 2002 National Association of Independent Schools
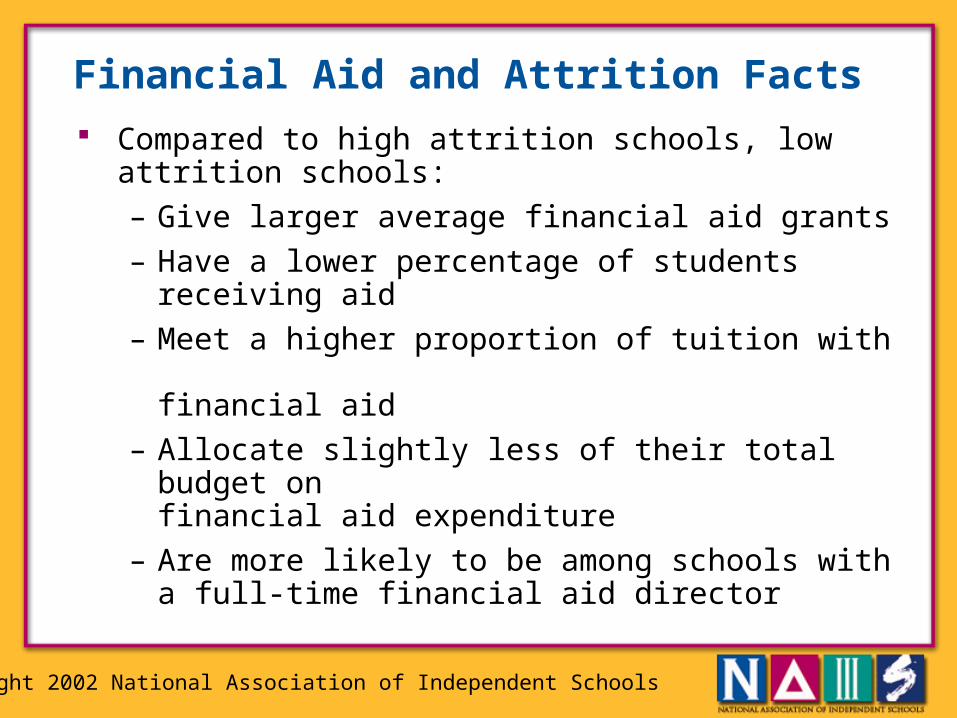
Financial Aid and Attrition Facts
Compared to high attrition schools, low attrition schools:
– Give larger average financial aid grants
– Have a lower percentage of students receiving aid
– Meet a higher proportion of tuition with financial aid
– Allocate slightly less of their total budget on financial aid expenditure
– Are more likely to be among schools with a full-time financial aid director
Copyright 2002 National Association of Independent Schools
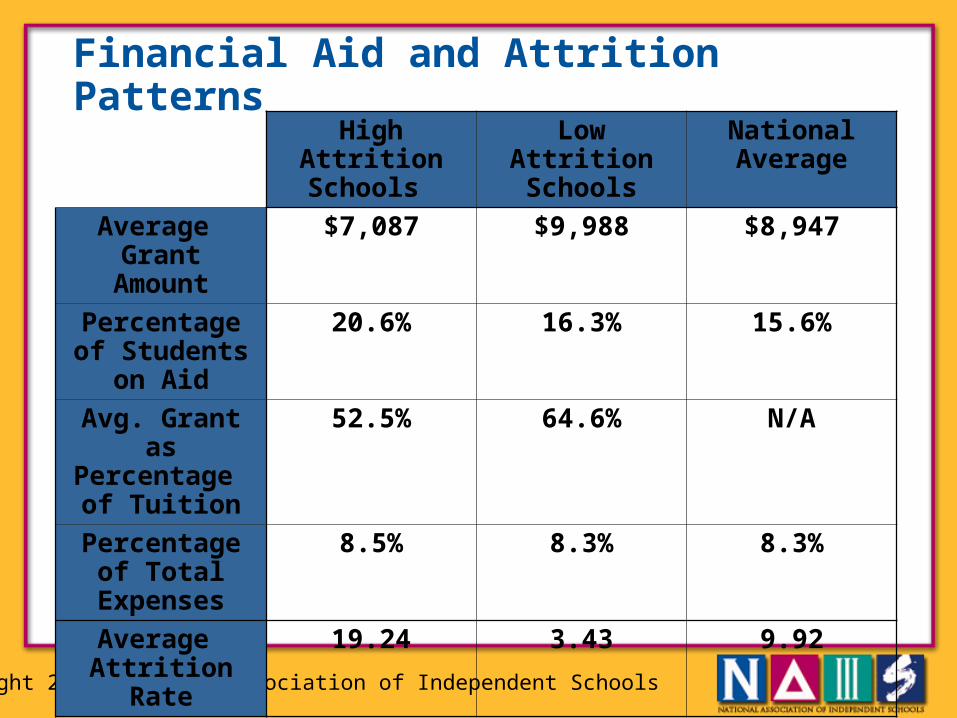
Financial Aid and Attrition PatternsHigh Attrition
Schools Low Attrition
SchoolsNational Average
Average Grant Amount
$7,087 $9,988 $8,947
Percentage of Students on Aid
20.6% 16.3% 15.6%
Avg. Grant as Percentage of Tuition
52.5% 64.6% N/A
Percentage of Total Expenses
8.5% 8.3% 8.3%
Average Attrition Rate
19.24 3.43 9.92
Copyright 2002 National Association of Independent Schools
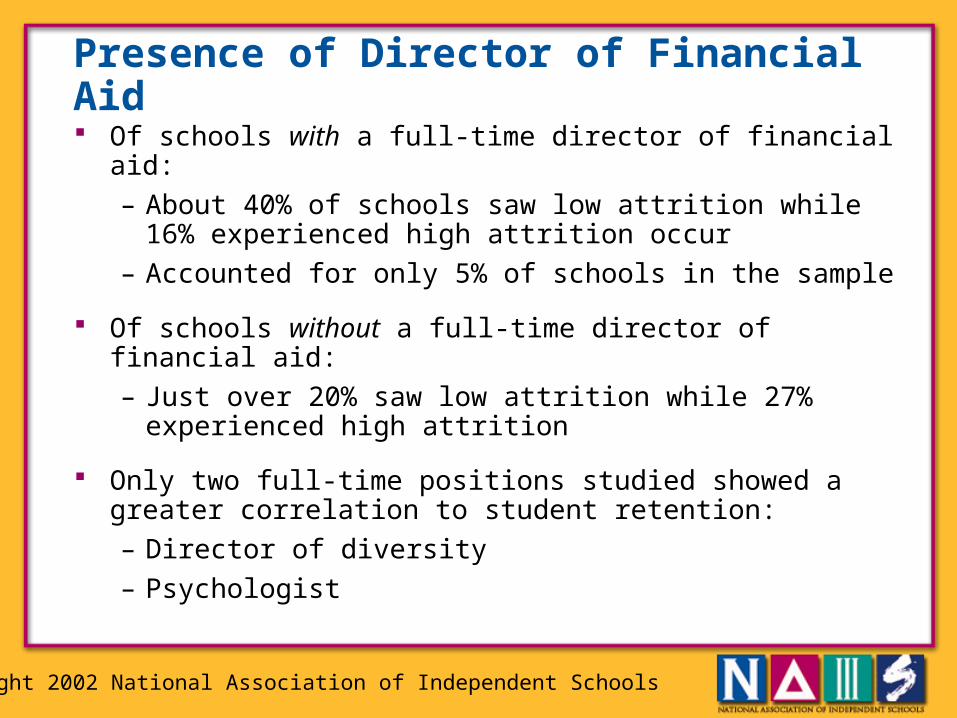
Presence of Director of Financial Aid Of schools with a full-time director of financial aid:
– About 40% of schools saw low attrition while 16% experienced high attrition occur
– Accounted for only 5% of schools in the sample
Of schools without a full-time director of financial aid:
– Just over 20% saw low attrition while 27% experienced high attrition
Only two full-time positions studied showed a greater correlation to student retention:
– Director of diversity
– Psychologist
Copyright 2002 National Association of Independent Schools
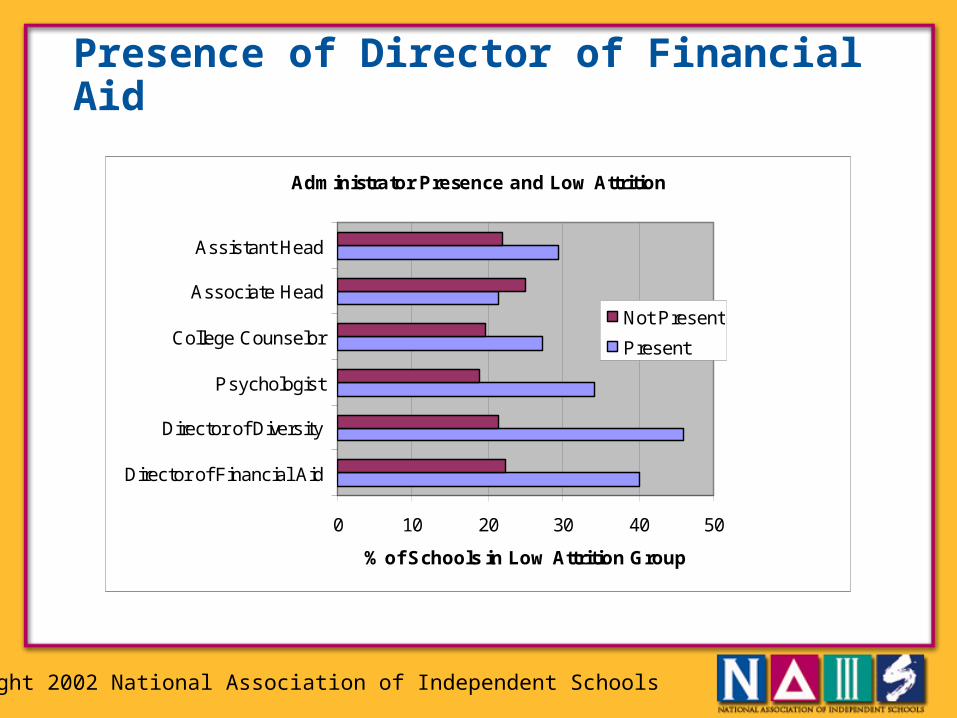
Presence of Director of Financial Aid
Administrator Presence and Low Attrition
0 10 20 30 40 50
Director of Financial Aid
Director of Diversity
Psychologist
College Counselor
Associate Head
Assistant Head
% of Schools in Low Attrition Group
Not Present
Present
Copyright 2002 National Association of Independent Schools
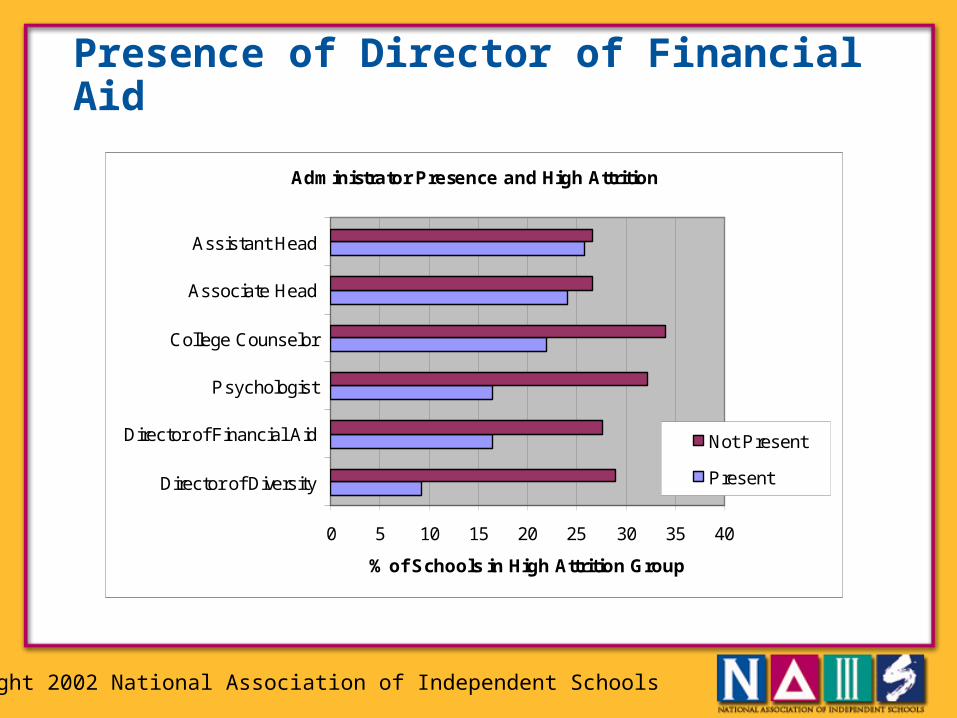
Presence of Director of Financial Aid
Administrator Presence and High Attrition
0 5 10 15 20 25 30 35 40
Director of Diversity
Director of Financial Aid
Psychologist
College Counselor
Associate Head
Assistant Head
% of Schools in High Attrition Group
Not Present
Present
Copyright 2002 National Association of Independent Schools
Key Lessons Even with rising tuition, demand is increasing
Even though enrollments are increasing for most types of schools, there is a slowdown in the past 5 years and stagnation in growth of student of color population
Even though financial aid awards are keeping pace with tuition growth, there is stagnation in the proportion of students receiving financial aid
Increasing financial aid awards do not appear to have an adverse effect on schools’ financial operations—all schools have income growth outpacing expense growth
Appear to be links between strategic staffing and resource decisions in financial aid management and student retention