nalysing of aritime ccidents - iamuiamu-edu.org/wp-content/uploads/2014/07/36_analysingof...masaki...
TRANSCRIPT

ANALYSING OF MARITIME ACCIDENTS
BY APPROACHING METHOD
FOR MINIMIZING HUMAN ERROR
Serdar Kum
International Doctoral Course Student Kobe University, Graduate School of Science and Technology, Maritime Sciences 5-1-1, Fukae Minami, Higashinada, Kobe, Hyogo-JAPAN 658-0022 [email protected] +81-80-5368 4918 +81-78-431 6246
Masaki Fuchi
Research Assistant, Captain Kobe University, Faculty of Maritime Sciences 5-1-1, Fukae Minami, Higashinada, Kobe, Hyogo-JAPAN 658-0022 [email protected] +81-78-431 6248 +81-78-431 6248
Masao Furusho
Professor Kobe University, Faculty of Maritime Sciences 5-1-1, Fukae Minami, Higashinada, Kobe, Hyogo-JAPAN 658-0022 [email protected] +81-78-431 6246 +81-78-431 6246
Abstract This study clarifies the current traffic situation in the Istanbul Strait, TURKEY based on statistical information; 928 data from across 75 years. The main objective is to investigate the risk profile of maritime accidents in the Istanbul Strait, and then to build up a methodology for minimizing human error. Maritime accidents have occurred in spite of existing safeguards. The main reason is that these safeguards do not concern enough the minimizing of human error. Evaluation methods of human behaviour are restricted, and it is very difficult to model it among all parameters of the components in a safety system.
The geographical and physical specifications of the Istanbul Strait are investigated and the potential threats defined as the risk profile. Then, proper analysis will be implemented on the resulting statistical information and the factors discussed are called 4M (Man, Machine, Media and Management) both individually and from an aspect of their mutual related effects. The existing safeguards are so evaluated, and their effectiveness is judged through carrying out experimental studies. For this purpose, the Ship Handling Simulator and actual onboard experiences have been utilized. These studies can provide the necessary data for understanding the human factors involved during navigation.
Keywords Maritime Safety; Istanbul Strait; risk assessment; human error; 4M
0 Introduction
The Istanbul Strait (Turkey) is a very strategic point that has been explained in many publications in details. It is better here to explain its importance in brief, this way;
Geopolitical; this is the only existing area from the Black Sea to the world. It is of number one importance, for passing through the Istanbul Strait the majority of oil reserves from Russia and the Caspian Sea Region. The Istanbul Strait also has one of the rarest marine biological corridors for important ecological functions.
Historical; several important conventions have been signed during historical times reflecting the political powers of the day. And, Istanbul has vast value historical places not only for Turks but also for the other cultures.
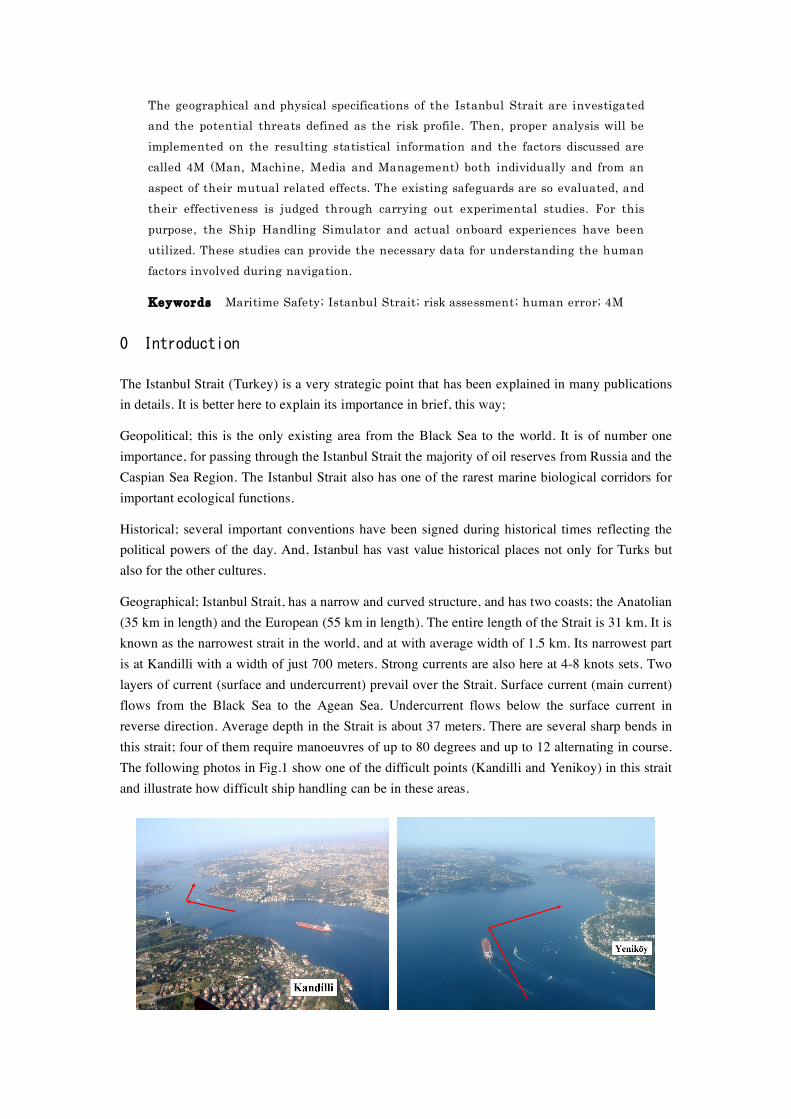
Geographical; Istanbul Strait, has a narrow and curved structure, and has two coasts; the Anatolian (35 km in length) and the European (55 km in length). The entire length of the Strait is 31 km. It is known as the narrowest strait in the world, and at with average width of 1.5 km. Its narrowest part is at Kandilli with a width of just 700 meters. Strong currents are also here at 4-8 knots sets. Two layers of current (surface and undercurrent) prevail over the Strait. Surface current (main current) flows from the Black Sea to the Agean Sea. Undercurrent flows below the surface current in reverse direction. Average depth in the Strait is about 37 meters. There are several sharp bends in this strait; four of them require manoeuvres of up to 80 degrees and up to 12 alternating in course. The following photos in Fig.1 show one of the difficult points (Kandilli and Yenikoy) in this strait and illustrate how difficult ship handling can be in these areas.

Fig. 1 Passing at Kandilli and Yenikoy in the Istanbul Strait (Photos : C. Istikbal)
The average numbers of ships’ passing through the Istanbul Strait are 48,456 yearly, 4,038 for monthly and 133 for daily. The Istanbul Strait is the second strait in having the densest traffic (after the Malacca Strait) and according to passing ratios, the volume of traffic in the Strait is 3 times greater than in Suez Canal, 4 times greater than in the Panama Canal and 2 times greater than in the Kiel Canal[1].
Istanbul Strait mainly has three periods for safe navigation, that in term of routing systems:
The first period (1965 to 1982), when the routing system of passing on the starboard side of the other ships was adopted, known as “Left-Side Navigation”.
The second period (1982 to 1994), when the routing system was changed to passing on the port side of other ships, known as “Right-Side Navigation”.
The third period (since 1994) was when the routing system with Traffic Separation Schemes (TSS) was established, this on Right-Side Navigation. And, at the end of 2003 the Vessel Traffic Services (VTS) was established in covering area of the Istanbul Strait, the Marmara Sea and the Canakkale Strait called the Turkish Strait.
1 objectives
In this study, we mainly aim to illustrate the current traffic situation in the Istanbul Strait for a fundamental study, to understand the role of the human factors in accidents then we carry out some research for minimizing the effect of navigator’s insufficient behaviour. For this purpose, some past studies are explained as literature review in following parts. It helps to compare with current situations and give a guideline for research. The risk of maritime accidents in the Istanbul Strait is investigated by using updated data for understanding the characteristics of accidents in the Strait. Then present and future research is determined to improve a methodology for preventing human error.
Evaluation methods of human behaviour are restricted, that’s why Ship Handling Simulator and some convenient tools such as; the Heart Rate Monitor and the Eye Mark Recorder for observing human characteristics in physical and psychological conditions, these are determined as suitable tools not only in authors’ research field but also in supported researches.
2 Literature Review
Tan and Otay (1998, 1999) defined a stochastic model to estimate the maritime accidents concerning of tanker traffic for narrow waterways. The drift probabilities and random arrival of ships in the model achieved by the Markov chain model, and from which they developed a state-space representation, location of ships at a given time. The model clarified that the expected number of accidents is proportional to the square of the tanker arrival rate. The most important characteristic of this model is not depending on time[2-3].
Brito (2000) investigated the traffic condition in the Istanbul Strait by using the Markov chain

model in two cases. If the present condition of the traffic is not congested and is congested for the future condition to find the costs for any delays in these traffic conditions. According to Brito, the estimated cost of moving oil from Baku to Ceyhan is $1.00 to $2.00 per barrel, when the cost comes in at less than 20 cents per barrel if it has moved by tanker. According to his research; one of the ways to increase traffic flow in the Strait is to reduce the separation between ships, unfortunately this lead to an increased probability of accidents and coincides with Tan and Otay (1999) as the probability of an accident in the Strait rises with the square of the volume of traffic[4].
Otay and Ozkan (2003) developed a mathematical model to simulate the passage through the Istanbul Strait and focused on ship manoeuvring. The model estimated the probability of casualties by using the geographical characteristics. The model verified that ships proceeding southbound are more disadvantageous of ship handling, because of the surface current. That’s why the larger southbound ships are found to be the main cause of collisions and also the model gives the risk of collision as higher than grounding and stranding in the Strait. Their paper shows that the effect of ship manoeuvring on accidents depends on ship size and their position in the Strait. The risk maps for collision, grounding and stranding are presented in their paper. It shows that during the passage of 100,000 ships; 46 of them collided and 23 of them were stranded or grounded[5].
Yurtoren (2004) explained that the volume of traffic, both southbound and northbound and for different traffic regimes is increased from 3.2 ships/hour to 5.6 ships/hour. The latent environmental stress due to the geographical restrictions and ship handling difficulties, and the latent environmental stress due to traffic congestion increased slightly through the periods, in both routes. He defined the stress is rarely imposed by geographical restrictions in the south entrance of the Strait, but the stress due to traffic congestion is enormous. That’s why the south area of the Strait is the most difficult area to operate a ship. On the other hand, the middle and north area of the Strait has a comparatively high stress due to the geographical restrictions; but the stress due to traffic is not so great. Finally, he described the encounter criteria for large size ships passing through the Strait by using marine simulation[6].
Yazici and Otay (2006) developed a real time traffic control tool for safety routes; it can be applied not only in the Istanbul Strait but also in other waterways. The model consists of two algorithms for the main casualties as grounding and collision; the “Grounding Only” algorithm is for any grounding and/or stranding condition and the “Collision Combined” algorithm is employed when the time is less than 3 minutes before collision, includes the other algorithm. These two algorithms determine the total casualty probability for every route and the model gives a suggested course for the minimum probability[7].
Ece (2006) defined the navigational constraints of the Istanbul Strait, in a wide field as; geographical, meteorological, hydrographical, oceanographical, economic, strategic, legal issues, maritime traffic, the casualties and casualty statistics, current safety measures and innocent passage. The casualties and near miss are investigated by using the statistical methods for the different navigation regimes. In the part of statistical analysis, the collisions and contacts are evaluated as individual events based on the number of interfered ships in the event. And, a regression model predicts the probability of maritime accidents in the Istanbul Strait, as defined in

the paper[1].
3 The Risk Profile of the Istanbul Strait
The data of maritime accidents in the Istanbul Strait collected from various sources such as; T.C. Ministry of Transport Undersecretariat for Maritime Affairs, Turkish Maritime Pilots’ Association, Turkish Marine Research Foundation (TUDAV) and related publications, internet pages for the 75 years between 1930 and 2005[8-11]. Then, the accident database constituted into ten parameters and the variables are categorized as shown in Table 1. In the analysing part, the data of accidents between 1982 and 2005 are investigated for understanding of the general perspective, and the near miss is separated from accident database and not investigated in this study. Then, the time interval is divided into three periods as shown in Table 2. Also, collision and contact in the accident database are taken as one event. Some researchers utilize the accident data of collisions separately for each ship in collision. But this makes double counted data, and affects the results in reality. In any case of collision and contact, maybe only one side of the shipping is faulty or with two parts, the event and the result should be evaluated in one case as collision and/or contact.
The number of the data in maritime accidents is 541 and is used for analysing as shown in Table 2. The number of near miss between 1994 and 2005 is 175. To consider the maritime accident database, the authors wish to inform that there is much missing data, which is not recorded, or unknown data, due to insufficient recording of maritime casualties in the Istanbul Strait. That’s why this missing data is illustrated by “Unfounded: Unf.” in the database and it is shown in all Fig.s.
Table 1 Components of the accident database
Parameters Categories
Ship’s Name ×××
Flag ×××
Ship’s Type
General Cargo
Bulk Carrier
Tankers (Product, Chemical, LNG and LPG)
Passenger (Passenger, Ferryboat and Sea Bus)
Others
Gross Tonnage-GRT 0–500;–3,000;–10,000;–25,000; Over 25,000
Accident Date Date, Month, Year
Accident Time Daytime (D), Twilight (T), Nighttime (N)
Position of accident Area-A, Area-B, Area-C, Area-D
Type of accident Grounding Contact

Stranding
Collision
Fire
Sinking
Cause of accident
Human Error
Dense Traffic
Weather
Current
Restricted visibility
Failure
Security threats
Others
Remarks Death, injured or missed person, pilot onboard or not, etc.
Table 2 The number of accidents in the Istanbul Strait
Time Intervals are investigated in this study The Number of Accidents
Right-Side Navigation to TSS (1982-1993) 277
TSS to 2004 (1994-2003) 235
VTS to 2005 (2004-2005) 29
Total (Right-Side Navigation to 2005) (1982-2005) 541
4 Passing through the Istanbul Strait
The average numbers passing through the Istanbul Strait is 48,456 yearly, 4,038 for monthly and 133 for daily depend on last 10 years. The Fig. 2 shows the number of passing through the Istanbul Strait and is not enough to understand the existing (real) marine traffic in the Strait. This data just belongs to ships that have passed directly and entered/leaved any port in the Strait. They do not include the local traffic. The local traffic in the Strait is daily as 1,410 voyages of ferryboats, 76 voyages of small ferry, 125 voyages of sea bus and 645 voyages of pleasure boats and plus sailing boats, motor yacht and fishing boats[6].
0
10,000
20,000
30,000
40,000
50,000
60,000
1995 1996 1997 1998 1999 2000 2001 2002 2003 2004Year
Nu
mb
er
of
Sh
ips
Fig. 2 The number of passing through the Istanbul St r ait for 10 years

In Fig. 2, 54,564 ships passed through the Istanbul Strait in 2004 and 9,399 (17.2%) of them were tankers (product tanker, chemical tanker, LPG and LNG). The number of tankers increased year by year, from 9% to 17% as shown in Fig. 3.
y = 3565.5e0.0912x
R2 = 0.968
0
1,000
2,000
3,000
4,000
5,000
6,000
7,000
8,000
9,000
10,000
1995 1996 1997 1998 1999 2000 2001 2002 2003 2004Year
Nu
mb
er o
f T
an
kers
Fig. 3 Passing of tankers through the Istanbul St rai t for 10 years
In 2004, the monthly number of passages average was 4,547 and the daily average was 149. In 2003 the monthly average was 3,911, 129 daily. It shows that VTS which started to actual operate at the end of 2003, had an effective role for increasing the number of passage without making any concession to safety (the traffic increasing rate in the Strait is 16.2%, and it shows that the Strait is becoming full capacity under these maritime regulations and theme). Also, the ratio of ships’ length (less than 200 m) passing through the Strait is 94.4% and tonnage less than 500 GRT is 3.9% in 2004 as shown in Fig. 4. According to the “Maritime Traffic Regulations for the Turkish Straits” that known as 1998 Guidelines, large vessels have a length overall of 200 m. or more, and these vessels can not keep their course in the Traffic Separation Schemes[12]. The first maritime traffic regulations adopted by IMO Maritime Safety Committee (MSC) for the Turkish Straits came into force on 1st of July, 1994. It included some important precautions for safety passage in the Turkish Strait region, such as; establishment of TSS, ships longer than 200 m. can pass only in daytime, etc. In 1998, these regulations were revised after 4 years of practice and experience. IMO adopted 1998 Guidelines in MSC 71 and circulated IMO Rules and Recommendations as “Rules and Regulations on Navigation through the Strait of Istanbul, the Strait of Canakkale and the Marmara Sea” (IMO Resolution A.857 (20) and A.827 (19))[13].

0
10,000
20,000
30,000
40,000
50,000
1995 1996 1997 1998 1999 2000 2001 2002 2003 2004
Year
Nu
mb
er
of
Sh
ips
Over 200m. Under 200m.
More than 500 GRT Less than 500 GRT
Fig. 4 The number of passing based on ships’ length and gross tonnage
The number of passing based on Turkish flag and foreign flag shows that there is a decreasing ratio of Turkish flag from 39.1% in 1997 to 22.5% in 2004 as shown in Fig. 5.
y = -4356.4Ln(x) + 20634
R2 = 0.9292
0
5,000
10,000
15,000
20,000
25,000
30,000
35,000
40,000
45,000
1997 1998 1999 2000 2001 2002 2003 2004Year
Nu
mb
er
of
Sh
ips
Turkey Foreign Flag Log. (Turkey)
Fig. 5 Ships’ passing ratio under Turkish flag
According to the waiting hours for passing through the Istanbul Strait between 2000 and 2004, the longest duration for suspending traffic in the Strait is in 2004 (mainly for tankers passing). In 2004, the opening ratio of the Strait is 80%; it can also be interpreted as available capacity. On the other hand, the maximum passing was done in 2004; it also shows the effectiveness of VTS in the Turkish Strait. The waiting duration of maritime traffic in the Istanbul Strait is 8.8 days per year, due to sea and weather conditions such as fog, current, etc., less than half a day per year due to accidents and emergency situations and 3 days per year due to the other reasons, except tanker passage.

5 The maritime accidents in the Istanbul Strait
When the accident database is investigated, the causes of maritime accidents in the Istanbul Strait are identified as; Human error, Dense traffic, Weather conditions, Surface current, the Natural structure of the Istanbul Strait, Restricted visibility, Failure, Security Threats (Sabotage, etc.), and Others (high energy lines, insufficient navigational aids on shore side, insufficient communication, bad affect of the shore lights, etc.). Surface current is one of the most important factors in those accidents North to South, and it much affects southbound ships. This verifies the number of accidents is higher than which ships proceeding northbound[1]. However, when the ship proceeding the same direction with current, her speed increases and that affects to ships grounding and getting out of the own traffic line, so the potential of collision increases[14].
The Fig. 6 shows the frequency of accidents between 1982 and 2005. The decreasing ratio of accident is 20% in 2004 by comparing with the previous year and the least accidents were in 2005. There is a rapid decrease in the accidents.
0
5
10
15
20
25
30
35
40
1982 1983 1984 1985 1986 1987 1988 1989 1990 1991 1992 1993 1994 1995 1996 1997 1998 1999 2000 2001 2002 2003 2004 2005
Year
Nu
mb
er o
f A
ccid
en
ts
Fig. 6 The f requency of accidents between 1982 and 2005
The most accidents occurred in the winter season, February and March (12.7%), January (12.2%) then in December (10.2%), the minimum accidents occurred in spring season in April (5.0%) and June (5.9%) between 1982 and 2005, as shown in Fig. 7. On the other hand, after VTS has been provided the number of accidents in winter season decreased and there wasn’t any accident in April and October. It is supposed that there was no accident in April and October due to VTS.
The affect of light on the visual view is considered as three levels; day time (the clear view based on the sun light is luminous), twilight (the time duration between darkness and luminous) and night (there isn’t any sun light, completely darkness). The Fig. 8 shows the ratios of accidents occurred at day, twilight and night. Ece (2006) clarified the time of accidents based on watchkeeping times and explained that the highest accidents occurred between 04:00 and 08:00 (the ratio is 12.5%). She focused the main reason of that is human error, such as sleeplessness, fatigue and occupational boredom, etc.[1].

0%
2%
4%
6%
8%
10%
12%
14%
January February March April May June July August September October November December
Pe
rce
nta
ge
of
Ac
cid
en
t
Fig. 7 The percentage of accidents via to months between 1982 and 2005
0%
5%
10%
15%
20%
25%
30%
35%
40%
Day Tw ilight Nigth Unf.
Pe
rce
nta
ge
of
Ac
cid
en
t
Fig. 8 The accident percentage based on luminous situation
When the causes of accidents are investigated, human error has the highest affect to cause an accident. And secondly, the accidents occur due to rudder and engine failure. The environmental conditions (bad weather, foggy visibility and strong surface current) also have strong affect to cause an accident. On the other hand, the percentage of missing data is so high due to not recording the main reason of accidents properly. It is estimated that 17.5% of the missing data for the main reason of accidents is dense traffic, 9.3% of that belongs to the natural structure of the Strait and 5% of that belongs to human error[1].
The type of accident is defined into 6 categories as shown in Fig. 9. Collision (39.6%) and grounding (38.3%) are the highest accidents in the Strait and sinking (2.8%) is the minimum.
The area of the Istanbul Strait is divided into 4 areas according to the environmental traffic condition, such as; local traffic situation, strong surface current, sharp turnings and so on. The area between South Entrance and the line of Çengelköy-Ortaköy is defined as Area-A; it includes the mainly local traffic (especially crossing the TSS). The Area-B is between the line of Çengelköy-Ortaköy, and the line of Çubuklu-İstinye included the critical changing of route, due to strong surface current. The Area-C is between the line of Çubuklu-İstinye and Sariyer including the sharpest altering of course up to 80 degrees difference. The Area-D is between Sarıyer and North Entrance of the Strait including the final course altering, and then direct proceeding. The Area-A has the highest accidents (41.8%) among the other areas and the minimum accidents in Area-D (7.9%).

Contact
Sinking FireGrounding
StrandingCollision
Fig. 9 The ratio of accidents based on the type of accident
Fig. 10 shows the type of accident occurred in position among the areas. In Area-A, it is so clear that the main accident is collision. There is 62% of collisions occurred in this area. And, fire is the highest in Area-A. It can be explained as; the cause of the fire is mainly sabotage to passenger ships and almost all passenger terminals are in Area-A.
0
20
40
60
80
100
120
140
Area-A Area-B Area-C Area-D Unf.
Nu
mb
er o
f A
ccid
en
ts
Grounding Stranding Collision Contact Sinking Fire
Fig. 10 The f requency of accident based on the type of accident among the areas
In Area-B, stranding is the highest among the areas and also there is influential grounding. The effective surface current and counter currents are in Area-B and affect the ships to get out of their routes; then it is easier to lose control of the ship’s manoeuvrability for captains unfamiliar to the Strait. Grounding is the highest in Area-C compared with the other areas. There are many wrecks, shallow waters and sharper altering course in Area-C. The widest area of the Strait is Area-D. The highest accident in this area is collision due mainly to human error. On the other hand, the highest ratio for sinking belongs to Area-D among the other areas. This area is open for the bad weather and sea condition that comes from Black Sea and is dangerous for keeping ship’s stability, if there is not sufficient seaworthiness or cargo lashing. Because the main cause of many accidents in this area occurred due to the poor condition of ships. And, Area-D has higher fatality due to foundering and/or sinking. It is difficult to carry out search and rescue operations in such bad weather/rough sea condition.
According to ships’ type, general cargo ships have the highest accidents as shown in Fig. 11. And also, the percentage of accidents interfered by tankers shows Istanbul is face to face with the potential disaster. On the other hand the accidents of tankers between 2004 and 2005 (after VTS)

the accident ratio was dramatically decreased by a ratio of 1/8.
0%
5%
10%
15%
20%
25%
30%
35%
Bulk Carrier General Cargo Tankers Passenger Others Unf.
Pe
rce
nta
ge
of
Ac
cid
en
t
Fig. 11 The percentage of accidents based on the ships’ type
The highest ratio of accidents belongs to the ships are 500-3,000 GRT between 1982 and 2005 as shown in Fig. 12. The accident ratio of less than 500 GRT is 16.1 and for the ships over 25,000 GRT is 7.2%. The total accident ratio for the ships under 10,000 GRT is 3 times higher compared with over 10,000 GRT. But after 2004, the number of accident interfered under 10,000 GRT decreases dramatically by 50%.
0%
5%
10%
15%
20%
25%
30%
35%
0 - 500 .- 3,000 .- 10,000 .- 25,000 Over 25,000 Unf.
Gross Tonnage
Perc
en
tag
e o
f A
ccid
en
t
Fig. 12 The percentage of accidents based on the ships’ tonnage
The statistical analysis is carried out by using Microsoft Excel. The parameters are defined based on the accident database. Firstly, either there is any statistical relation among the parameters or not is investigated by using χ2 Test (Chi-Square Test) to define the differences or not[15]. The Chi-Square Test for accident year is carried out not only for the coming years in 1982-2005 but also for the time intervals (periods) as mentioned before into three periods. Then, the correlations (Pearson’s product moment correlation) among the parameters are investigated and tested if they are significant or not. Finally, the power and tendency among the parameters are interpreted. The statistical analysis can be summarized as below;
6 The Chi-Square Test
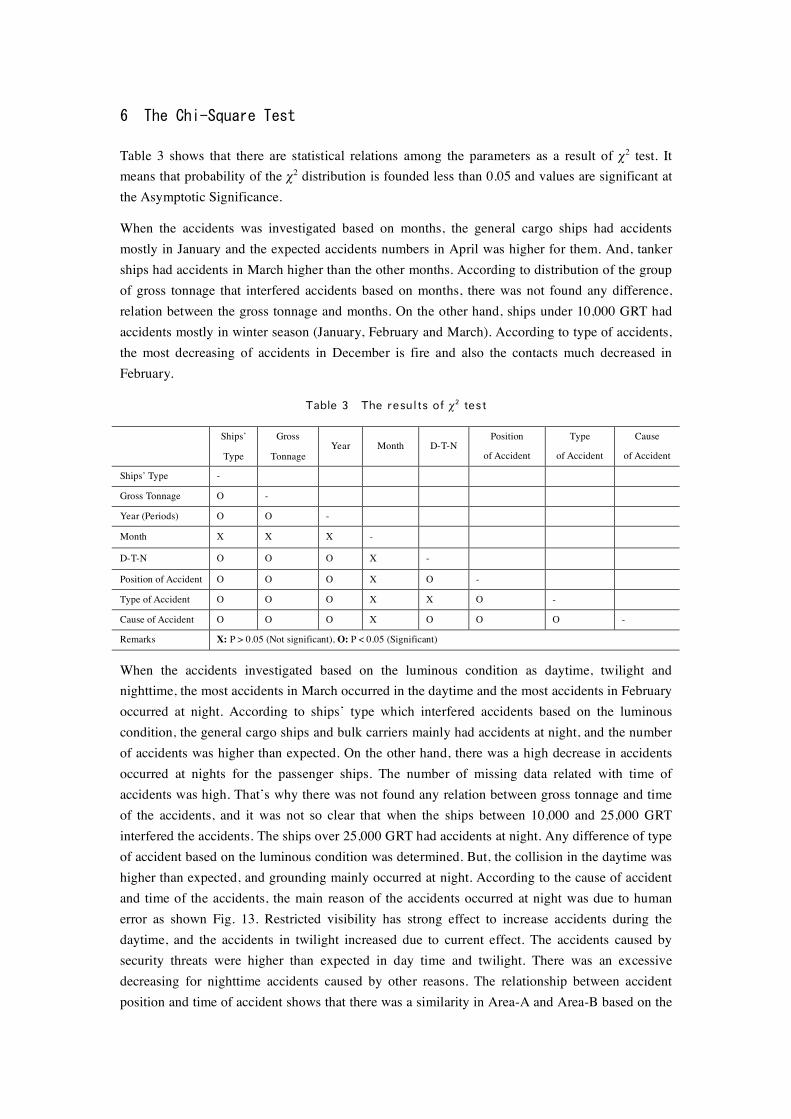
Table 3 shows that there are statistical relations among the parameters as a result of χ2 test. It means that probability of the χ2 distribution is founded less than 0.05 and values are significant at the Asymptotic Significance.
When the accidents was investigated based on months, the general cargo ships had accidents mostly in January and the expected accidents numbers in April was higher for them. And, tanker ships had accidents in March higher than the other months. According to distribution of the group of gross tonnage that interfered accidents based on months, there was not found any difference, relation between the gross tonnage and months. On the other hand, ships under 10,000 GRT had accidents mostly in winter season (January, February and March). According to type of accidents, the most decreasing of accidents in December is fire and also the contacts much decreased in February.
Table 3 The results of χ2 test
Ships’
Type
Gross
Tonnage Year Month D-T-N
Position
of Accident
Type
of Accident
Cause
of Accident
Ships’ Type -
Gross Tonnage O -
Year (Periods) O O -
Month X X X -
D-T-N O O O X -
Position of Accident O O O X O -
Type of Accident O O O X X O -
Cause of Accident O O O X O O O -
Remarks X: P > 0.05 (Not significant), O: P < 0.05 (Significant)
When the accidents investigated based on the luminous condition as daytime, twilight and nighttime, the most accidents in March occurred in the daytime and the most accidents in February occurred at night. According to ships’ type which interfered accidents based on the luminous condition, the general cargo ships and bulk carriers mainly had accidents at night, and the number of accidents was higher than expected. On the other hand, there was a high decrease in accidents occurred at nights for the passenger ships. The number of missing data related with time of accidents was high. That’s why there was not found any relation between gross tonnage and time of the accidents, and it was not so clear that when the ships between 10,000 and 25,000 GRT interfered the accidents. The ships over 25,000 GRT had accidents at night. Any difference of type of accident based on the luminous condition was determined. But, the collision in the daytime was higher than expected, and grounding mainly occurred at night. According to the cause of accident and time of the accidents, the main reason of the accidents occurred at night was due to human error as shown Fig. 13. Restricted visibility has strong effect to increase accidents during the daytime, and the accidents in twilight increased due to current effect. The accidents caused by security threats were higher than expected in day time and twilight. There was an excessive decreasing for nighttime accidents caused by other reasons. The relationship between accident position and time of accident shows that there was a similarity in Area-A and Area-B based on the

accidents occurring time. But, the difference among areas based on the accident time was determined, due to the missing data was high in Area-C for the accident time and expected numbers of accidents in the daytime. The highest accidents in daytime were occurred in Area-A, and the highest accidents at night were occurred in Area-C.
When the accidents investigated based on the ships’ type; there was a difference among the periods of navigation regime. Bulk carriers had more accidents in the year 1994-2003 and after 2004 there was an excessive decreasing for them. But, comparing with the other ships’ type had accidents after 2004, bulk carriers has more accidents than expected. Passenger ships have no interference in any accidents after 2004. Bulk carriers were the group which has highest accidents for over 10,000 GRT, and the general cargo ships were for less than 10,000 GRT. It shows that the number of bulk carries under 10,000 GRT decreased to have accident and also there was an excessive decreasing for the general cargo ships over 25,000 GRT. General cargo ships had the highest accidents due to human error. Failure mostly caused bulk carriers and general cargo ships for having accidents. The main reason to have accident for passengers was security threats. Bad weather conditions strongly affected to bulk carriers and tended to increase the number of accidents. Current had the most effect for general cargo ships, to cause an accident. Restricted visibility mainly affected to tankers and to be the reason for increasing tanker accidents. The passenger ships had more accidents in Area-A than in other areas and general cargo ships had more accidents in the other areas than Area-A, and also they had more accidents than expected in Area-B.
0
10
20
30
40
50
Human
Error
Dense
Traff ic
Weather Current Restricted
visibility
Failure Security Unf. Others
Nu
mb
er o
f A
cc
ide
nts
Day
Night
Tw ilight
Unf.
Fig. 13 The accident f requency based on luminous condition via to cause of accident
After 1994, there was a strong decrease of accidents for the ships over 10,000 GRT. On the other hand, less than 10,000 GRT had more accidents than expected and over 25,000 GRT had fewer accidents than assumed in the period of TSS. According to cause of accidents based on gross tonnage groups, human error strongly effected to the ships over 10,000 GRT. Failure and security mainly affected to ships under 10,000 GRT. The bad weather condition also affected to the ships between 10,000 GRT and 25,000 GRT and tended to increase accidents for this group. In Area-A the highest accident ratio belonged to under 10,000 GRT and in Area-B the ships over 25,000 GRT had more accidents than expected. There was a decreasing in Area-D for the ships 10-25,000 GRT. On the other hand, the missing date of tonnage in Area-C was high level.
When the type of accidents is considered, there was a decrease of groundings, stranding and fire

after 1994. Especially collision and grounding had dramatically decreased after VTS operation. Collision and fire were mainly occurred in Area-A, stranding was mainly occurred in Area-B, grounding was mainly occurred in Area-C and for Area-D sinking had the highest ratio. In Area-A, grounding and stranding were less than expected, but collision and fire increased. Stranding ratio increased in Area-B. Grounding in Area-C was higher than expected, but collision was less, and sinking increased in Area-D. The passenger and general cargo ships mostly interfered to collision, and for grounding general cargo ships and bulk carriers had more accidents. There was an increasing into groundings for bulk carrier and also there was a decreasing for them to have collision.
The most effective parameters to cause accident were human error and restricted visibility. After 1994, human error and failure increased and the affect of weather and visibility decreased in the accidents. And also, accidents due to security had dropped to zero level after 1994. The highest human error mainly occurred in collisions in restricted visibility. Groundings were mainly caused by human error and failure. The current tended to increase grounding. The main reason for sinking was bad weather. Fire mainly caused by security threats.
The accidents in Area-A and C increased after TSS, but for the other areas it decreased. After VTS, the accidents into all areas decreased, especially in Area-B and C. Human error and failure were the highest in Area-A, and also failure was higher in Area-C. The accidents due to restricted visibility decreased in Area-A, the accidents due to current and restricted visibility increased in Area-B, the accidents due to failure and bad weather increased in Area-C and the accidents due to restricted visibility increased in Area-D.
7 The correlation (Pearson’s product moment correlation)
Table 4 shows the coefficients of correlation among the parameters. The results were not determined as so powerful and significant. The coefficient of correlation was small but it can give some idea about the tendency among the parameters. E.g. there is a negative relation between ships’ type and accident year; ships’ type has positive relation with the other parameters. Year has a negative correlation with time of accident based on the luminous condition and cause of the accident, and correlation with the other parameters is positive.
Table 4 The results of correlation analysis
Ships’
Type
Gross
Tonnage Year Month D-T-N
Position
of Accident
Type
of
Accident
Cause
of Accident
Ships’ Type 1.000
Gross Tonnage 0.144* 1.000
Year -0.045* 0.042 1.000
Month 0.310 0.021 0.032 1.000
D-T-N 0.286* 0.113* -0.061* 0.301 1.000
Position of
Accident 0.224* 0.095* 0.021* 0.145 0.125* 1.000
Type of Accident 0.097* 0.036 0.022 0.009 0.014 0.187* 1.000
Cause of Accident 0.166* 0.108* -0.074 0.001 0.351* 0.084* 0.043 1.000
Remark * is significant according to t-test (P<0.05) of coefficients.
8 Research field
Until this part the potential risks for maritime accidents is explained by using accidents statistics and also some models are introduced as past work on the safety navigation through the Istanbul Strait. All these item mainly affect theoretical issues, unfortunately in practice all models and the estimations about the safety concept become insufficient, because of an including human factors. Human should be considered in the central of all systems. That’s why the models and analysis for the suggesting better countermeasures to improve safety should care about the human mechanism. Past works and also the statistical analysis such as explained in this paper are just enough to understand the condition and may recommend some safety measures on the environment, on management, on the traffic rules and so on. They can be called as “Simple Accident Model”[16].
When we defined the safety navigation system for the Istanbul Strait and/or the similar waterways based on the concept of Man, Machine, Media and Management (4M), the existing international rules and safety measures in the local region can cover the high ratio of Machine, Media and Management as follows:
To care about Media, there are excessive improvements in the Istanbul Strait, for example; Vessel Traffic Services and the components (facilities and technical equipments) of this system. And also the services of escort/tug, research and salvage, pilotage and the aids to navigation are improved. The environmental conditions are almost revised and many types of equipment are fitted for assisting of passage, but it doesn’t mean that is all. Navigators sometimes continue to have wrong interpretation or not to recognize some buoys, lights, etc. Or, they become confused by visual mixed and congested shore lights.
The rules related with safety navigation are improving under the international maritime conventions and the equipments on navigation support system are examined simultaneously improving of technology. The latest of them is Automatic Information System-AIS. At the 77th Session of Maritime Safety Committee (28 May-6 June 2003), the new technology on board merchant ships was issued for the efficiency and effectiveness of watchkeeping to use the systems to make better decisions, and to improve the safety of operations. The report said that; “Training for the use of such systems should take into account the special human element issues associated with the human machine interface, the recognition that automation changes a task it was meant to support and that operators will monitor less effectively when automation is installed.”
It is easy to say that the most important item based on the Machine concept is the human machine interface called as ergonomics (or human engineering). The interface should be as easy as serviceable. On the other hand, there are lots of information and many source of information on the bridge, and that makes the navigator become overload. And also, when there is a contradiction between these information sources (such as the difference of target tracking between ARPA and AIS), this situation tending to the navigator become more complex.
Kobayashi (2006) defined the behaviour of navigator as the function of navigator’s competency and navigational condition. When the difference between required competency by navigational environment and attainable competency by navigator exists, it tends navigator to make insufficient

behaviour. In other words, when a quantity of the task exceeds human competency, human behaviour would be insufficient[17]. And, this insufficient behaviour is a potential cause for maritime accident. Not for every time, but it is the risk of maritime accident. There are some researches on this issue by using the Ship Handling Simulator (SHS) for understanding of the navigator’s behaviour under his responsibility[18-20]. It shows that SHS is very effective tool. In this sense, the authors had parallel researches to investigated human factors on maritime field such as follows (they can be called as “Intermediate Accident Model”[16] and they are the fundamental researches):
Investigating of characteristics of the mental workload on actual ship with using Heart Rate Monitor-HRM in the Istanbul Strait in some cases such as berthing, unberthing, anchoring and passing through the Strait. In the paper, the navigators’ interactions among the bridge team were also founded[21].
Defining the view points of navigator as the results of eye movements by utilizing SHS. The navigator’s view points, fixation durations and changes in the view points were evaluated. The tendency was defined as the navigator firstly caring to the inside field (bridge) and then perceives outside field for understanding the situation. The equal balance between images of inside and outside of the bridge is the best way to realize the situational awareness in navigation[22]. In case of many collision accidents in the past, most of the causes in the accidents were judged as improper lookout as human error. On the other hand look out, the visual images in the environmental is an important source to take information about the own situation for any decision to consider about existing situation.
The characteristics of navigator and human reliability were investigated and some information was given for analyzing of human reliability. The Technique for Human Error Rate Prediction-THERP is one of the useful techniques for human reliability analysis. The main problem of that is how to design human behaviour and include some shortcomings. That’s why it is better to carry specific research to understand the characteristics of human as a navigator[23].
After that time, the main research will be a continuous study on the fundamental researches and it will be based on the main aim of this paper for developing a “Contemporary Accident Model” via to human error[16]. The following items are prepared for this aim:
The updated situation for the maritime safety and maritime accidents are considered (in this paper the knowledge about the maritime accident in the Istanbul Strait is updated and the risks are identified).
Simulator scenarios are developed for Istanbul Strait. And, two specific equipments (Heart Rate Monitor and Eye Mark Recorder) are involved for understanding of navigator behaviour. These equipments are considered as objective tool and a questionnaire is prepared for the subjective consideration. This questionnaire mainly consists of four parts. There are some questions for clarify the profile of participants at the first section. The first part will be answered before carrying out the scenario, the other questions related with the situation during the scenario and after completing the scenario, and the final part is for emergency cases.

After executing simulator scenarios, they are compared with another waterway as similar with Istanbul Strait. Seto Inland Sea (JAPAN) is the most available area for this purpose. Especially, for the fitting the same scale and for caring the most sharing patterns, the comparison will be as; Area-A in Istanbul Strait with Akashi Strait, Area-B with Kurishima Strait, Area-C with Kanmon Strait and Area-D with Bisan Seto. There will be some actual onboard experience for the Seto Inland Sea like as carried before in the Istanbul Strait.
Finally, we can get enough knowledge for understanding navigator’s behaviours. When the comparison is made for different waterways, the sharing human errors will be identified, and then appropriate measures can be defined on the contemporary model.
9 Conclusion
To investigate the maritime accidents, it is so important to keep information for reference and consideration of casual factors. According to IMO Resolution A.849 (20) “Code for the Investigation of Marine Casualties and Incidents” (1997), each Flag State has a duty to conduct an investigation into any accident (casualty) occurring to its ships. There is an obligation arising from Regulation I/21 of SOLAS for flag states to report casualties to the IMO. And also, the Code recommends Flag States to send a copy of the final report to the interested States, for invitation their significant and substantiated comments. There is an insufficient recording of maritime accidents in the Istanbul Strait, that’s why the missing data is so high. Especially, with two different kinds of missing data based on the categorization by researchers overlap strongly affect to results and tend to the consideration in wrong interpretations. After that it might be better to develop an accident database based on the Code, and then the analysis can be more qualified.
To evaluate the human behaviour, EMR, HRM and SHS are the useful tools. To minimise the human error, to develop the quality of rules better than its quantity. The aim should be more user-friendly for handling of the equipments by caring ergonomics. On the other hand the environmental condition is improving for navigator as having better working condition comparing with the past condition. In 2006, the working conditions were reviewed at the 94th Maritime Session of the International Labour Conference. Now is a good time for increasing the motivation on board for getting good performance and then the aimed for quality becomes closer. But, human factors of qualified personnel can not be omitted; getting the required competency with the difference of attainable competency becomes minimal for protecting any on board risk situation.
Reference
[1] Ece J N. “The Accident Analysis of the Strait of Istanbul from the Points of Safety Navigation and
Environment and Evaluation of Innocent Passage”. PhD Thesis. Gazi University, Institute of Science and
Technology, 2006.
[2] Tan B, Otay E N. A Stochastic Model for Vessel Casualties Resulting from Oil Tanker Traffic through
Narrow Waterways. Proc. 1st International Conference on Oil Spills in the Mediterranean and Black Sea
Regions. Istanbul: 15-18 Sep 1998: 881-885.
[3] Tan B, Otay E N. Modelling and Analysis of Vessel Casualties Resulting from Tanker Traffic through
Narrow Waterways. Naval Research Logistics, 1999(46)8: 871-892.

[4] Brito L D. Congestion of the Turkish Straits: A Market Alternative. World Congress of the Econometric
Society. Seattle, WA: 2000.
[5] Otay N E, Özkan Ş. “Stochastic Prediction of Maritime Accidents in the Strait of Istanbul. Proc of the 3rd
Intl Conf on Oil Spills in the Mediterranean and Black Sea Regions, Sep 2003: 92-104.
[6] Yurtoren C. A Study on Maritime Traffic Management in the Strait of Istanbul. PhD Thesis. Kobe University,
Maritime & Transportation System Science, 2004.
[7] Yazıcı M A, Otay E N. Navigation Support System for Narrow Waterways, a Case Study: Strait of Istanbul.
Proc ISCCBE. Montreal, Canada: June 2006 (in print).
[8] Unpublished Data of General Directorate of Coastal Safety and Salvage Administration.
<http://www.coastalsafety. gov.tr>/
[9] Unpublished Data of T.C. Undersecretariat of Maritime Seafarers. <http://www.denizcilik.gov.tr/>
[10] Unpublished Data of Turkish Pilots Association. <http://www.turkishpilots.org.tr/index.asp>/
[11] Unpublished Data of Turkish Marine Research Foundation. <http://www.tudav.org>/
[12] Maritime Traffic Regulations for the Turkish Straits, 98/11860, 06/11/1998: 23515 Repeating, 08.10.1998.
[13] IMO NAV 44/14. Report to the Maritime Safety Committee Sub-Committee on Safety of Navigation, 1998.
[14] Akten N. Analysis of Shipping Casualties in the Bosporus. The Journal of Navigation. The Royal Institute of
Navigation, Cambridge University Press, 2004 57 (3): 345-356.
[15] Kum S. Risk Assessment on Tanker Ships. MSc Thesis. Istanbul Technical University, Institute of Science
and Technology, 2005: 25-32.
[16] Asyalı E. Impact of Man-Machine Interface on Maritime Casualties. International Association of Maritime
Universities, 4th Annual General Assembly (AGA-4). Alexandria: 27-30 September 2003.
[17] Kobayashi H. Human Factor for Safe Navigation, Promotion of the Research on Mariners’ Characteristics.
International Conference on Marine Simulation and Ship Manoeuvrability (MARSIM 2006), 25-30 June
2006.
[18] Kobayashi H. Marine Casualty Analysis Using Ship Handling Simulator. Conference on Maritime Education
and Training, Preventing Accidents, Dealing with Emergencies, Coping with Casualties (PADECC). Opatija,
Croatia: 18-21 May 1999.
[19] Murata S, Kobayashi H. Quantitative Estimation of Safety Degree on Ship’s Operations. International
Conference on Marine Simulation and Ship Manoeuvrability (MARSIM’03). Kanazawa, Japan: 25-28
August 2003.
[20] Kobayashi H. Report on the Collaborative Research of Human Factor in Ship Handling. International Marine
Simulator Forum-IMSF Annual Meeting,.St. John’s, Newfoundland, Canada: 20-23 September 2005.
[21] Kum S, Satir T, Furusho M, Hayashi Y. Evaluation of BTM Effects with Heart Rate. Maritime Education
and Training (IMLA-13). St. Petersburg: September 2004.
[22] Kum S, Arslan O, Furusho M. Analysing Navigators’ Eye Movements by Utilizing Eye Mark Recorder on
the Ship Handling Simulator. Japan Institute of Navigation, Tokyo, May 2006.
[23] Kum S. Risk Assessment on Tanker Ships. MSc Thesis. Istanbul Technical University, Institute of Science
and Technology, 2005: 149-164.