name: date: period: score:...
TRANSCRIPT

Name: Date: Period: SCORE:
AP Statistics: Unit 2 “Take-Home” Test
RNBriones Concord High 1
HONOR PLEDGE FOR THIS EXAM:
After you have finished the test, please read the following statement and sign your name.
I pledge that I did not discuss any aspect of this test with anyone, that I neither gave nor received any assistance/aid onthis test, and that the work presented herein is entirely my own.
__________________________Signature
Part 1: Multiple Choice. (120 points)the UPPERCASE letter that corresponds to the best answer. (2 points each)
1) A study is conducted to determine if one can predict the yield of a crop based on the amount of yearly rainfall. Theresponse variable in this study isA) the yield of the crop. D) either bushels or inches of water.B) the amount of yearly rainfall. E) the month the crop is harvested.C) the experimenter.
2) A researcher is interested in determining if one can predict the score a student gets on a statistics exam from theamount of time the student spends studying for the exam. In this study, the explanatory variable isA) the researcher. D) the fact that this is a statistics exam.B) the students taking the exam. E) the amount of time spent studying for the exam.C) the score on the exam.
3) When creating a scatterplot, one shouldA) use only positive values of the explanatory variable. D) use a plotting scale that makes the overall trend roughly linear.B) use the horizontal axis for the explanatory variable. E) use the horizontal axis for the response variable.C) use a different plotting symbol depending on whether
the explanatory variable is categorical or the response variable is categorical.
Use the following to answer questions 4 and 5:
A researcher measures the height (in feet) and volume of usable lumber (in cubic feet) of 32 cherry trees. The goal is todetermine if the volume of a tree’s usable lumber can be estimated from the height of the tree. The results are plottedbelow.
4) In the study above, the response variable isA) number of trees.B) volume.C) height or volume; it doesn’t matter which is
considered the response variable.D) neither height nor volume; the measuring instrument
used to measure height is the response variable.E) height.
5) The scatterplot above suggests thatA) there is a positive association between height and volume.B) there is an outlier in the plot.C) both A and B.D) neither A nor B.E) the relationship between height and volume is nonlinear.
170
Name: Date: Period: SCORE:
AP Statistics: Unit 2 “Take-Home” Test
RNBriones Concord High 2
6) At a large university, the office responsible for scheduling classes notices that demand is low for classes that meetbefore 10:00 AM or after 3:00 PM and is high for classes that meet between 10:00 AM and 3:00 PM. Which of thefollowing may we conclude?A) There is an association between demand for classes and the time the classes meet.B) The association between demand for classes and time for classes is linear.C) There is a negative association between demand for classes and the time the classes meet.D) There is no association between demand for classes and the time the classes meet.E) There is a positive association between demand for classes and the time the classes meet.
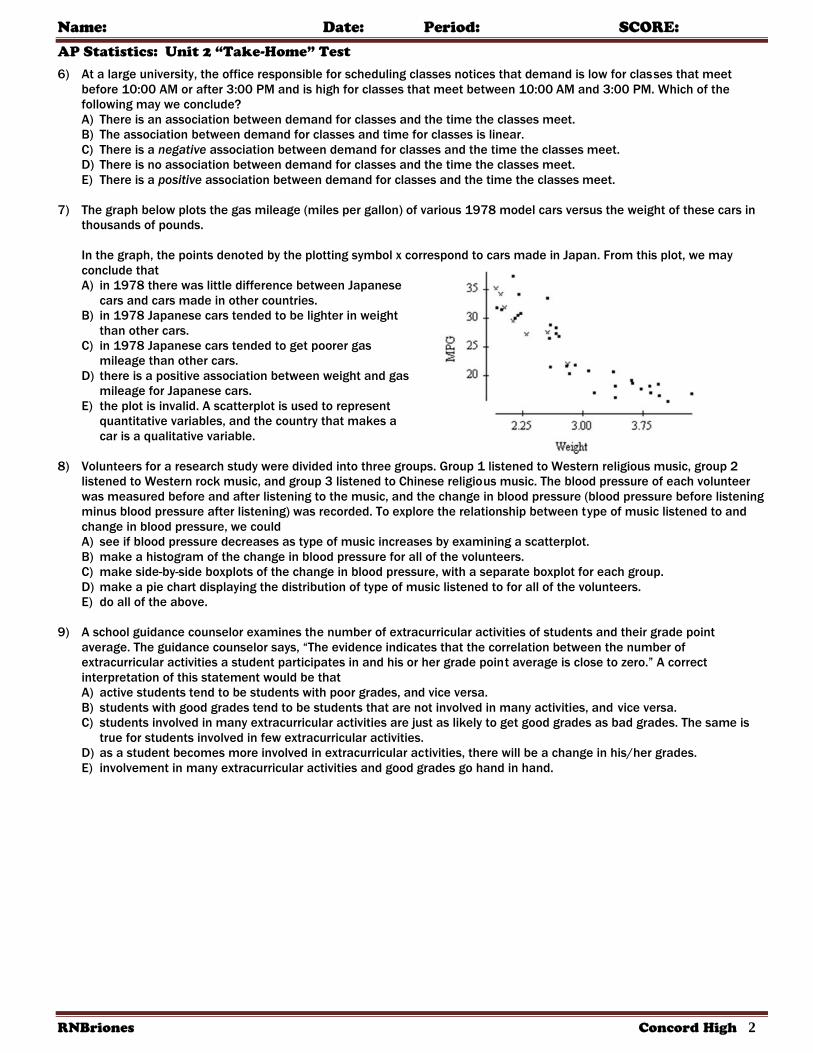
7) The graph below plots the gas mileage (miles per gallon) of various 1978 model cars versus the weight of these cars inthousands of pounds.
In the graph, the points denoted by the plotting symbol x correspond to cars made in Japan. From this plot, we mayconclude thatA) in 1978 there was little difference between Japanese
cars and cars made in other countries.B) in 1978 Japanese cars tended to be lighter in weight
than other cars.C) in 1978 Japanese cars tended to get poorer gas
mileage than other cars.D) there is a positive association between weight and gas
mileage for Japanese cars.E) the plot is invalid. A scatterplot is used to represent
quantitative variables, and the country that makes acar is a qualitative variable.
8) Volunteers for a research study were divided into three groups. Group 1 listened to Western religious music, group 2listened to Western rock music, and group 3 listened to Chinese religious music. The blood pressure of each volunteerwas measured before and after listening to the music, and the change in blood pressure (blood pressure before listeningminus blood pressure after listening) was recorded. To explore the relationship between type of music listened to andchange in blood pressure, we couldA) see if blood pressure decreases as type of music increases by examining a scatterplot.B) make a histogram of the change in blood pressure for all of the volunteers.C) make side-by-side boxplots of the change in blood pressure, with a separate boxplot for each group.D) make a pie chart displaying the distribution of type of music listened to for all of the volunteers.E) do all of the above.
9) A school guidance counselor examines the number of extracurricular activities of students and their grade pointaverage. The guidance counselor says, “The evidence indicates that the correlation between the number ofextracurricular activities a student participates in and his or her grade point average is close to zero.” A correctinterpretation of this statement would be thatA) active students tend to be students with poor grades, and vice versa.B) students with good grades tend to be students that are not involved in many activities, and vice versa.C) students involved in many extracurricular activities are just as likely to get good grades as bad grades. The same is
true for students involved in few extracurricular activities.D) as a student becomes more involved in extracurricular activities, there will be a change in his/her grades.E) involvement in many extracurricular activities and good grades go hand in hand.

Name: Date: Period: SCORE:
AP Statistics: Unit 2 “Take-Home” Test
RNBriones Concord High 3
10) A student wonders if people of similar heights tend to date each other. She measures herself, her dormitory roommate,and the women in the adjoining rooms; then she measures the next man each woman dates. Here are the data (heightsin inches):
Women 66 64 66 65 70 65Men 72 68 70 68 74 69
Which of the following statements is true?A) The variables measured are all categorical.B) There is a strong negative association between the heights of men and women, since the women are always smaller
than the men they date.C) Tall women tend to date short men.D) Any height above 70 inches must be considered an outlier.E) There is a positive association between the heights of men and women who date each other.
11) Which of the following statements about the correlation coefficient is true?A) The correlation coefficient measures the proportion of variability between the two variables.B) The correlation coefficient will be equal to 1 only if all the data lie on a perfectly horizontal straight line.C) The correlation coefficient measures the fraction of outliers that appear in a scatterplot.D) The correlation coefficient has no unit of measurement and must always lie between –1 and 1, inclusive.E) The correlation coefficient equals the proportion of times two variables lie on a straight line.
12) A study found a correlation of r = –0.61 between the gender of a worker and his or her income. We may correctlyconclude thatA) women earn more than men on the average.B) women earn less than men on the average.C) an arithmetic mistake was made, since correlation must always be positive.D) this result is incorrect, because computing rmakes no sense in this situation.E) on average, women earn 61% less than men.
13) Consider the scatterplot at the right.
According to the scatterplot, which of the following isa plausible value for the correlation coefficientbetween weight and MPG?A) -1.0 B) -0.9 C) -0.5D) 0.2 E) 0.7
14) Consider the scatterplot at the right.
The correlation between X and Y is approximatelyA) 0.999B) 0.8C) 0.5D) 0E) –0.7

Name: Date: Period: SCORE:
AP Statistics: Unit 2 “Take-Home” Test
RNBriones Concord High 4
15) Consider the scatterplot at the right.
We may conclude thatA) the correlation between X and Ymust be close to 1 since
there is a nearly perfect relationship between them.B) the correlation between X and Y shows a quadratic
relationship.C) the correlation between X and Y is close to 0.D) the correlation between X and Y could be any number
between –1 and 1. Without knowing the actual values of Xand Y we can say nothing more.
E) the correlation between X and Ymust be close to –1 sincethere is a nearly perfect relation between them, but it isnot a straight-line relation.
Use the following to answer questions 16 and 17:
I wish to determine the correlation between the height (in inches) and weight (in pounds) of 21-year-old males. To do this, Imeasure the height and weight of two 21-year-old men. The measured values are
Male #1 Male #2Height 70 75Weight 160 200
16) Referring to the information above, the correlation r computed from the measurements on these males isA) equal to 1.B) positive and between 0.25 and 0.75.C) near 0, but could be either positive or negative.D) exactly 0.E) Meaningless, since the slope is greater than 1.
17) Referring to the information above, which of the following units would the correlation coefficient r have?A) Inches B) Pounds C) Pounds per inch D) None, because r has no units E) Inches-pounds
18) Which of the following is true of the correlation coefficient r?A) It is a resistant measure of association.B) It does not change if either all the X-data or all the Y-data are multiplied by a constant.C) If r is the correlation between X and Y, then –r is the correlation between Y and X.D) r can never be 0 if there is a linear relationship between X and Y.E) All of the above.
19) The scatterplot at the right is from a small data set.
The data were classified as either type 1 or type 2. Those oftype 1 are indicated by o’s, those of type 2 by x’s. The overallcorrelation of the data in this scatterplot is
A) positive.B) near 0, since the overall data do not show a distinct pattern.C) near 0, because the o’s display a negative trend and the x’s
display a negative trend, but the trend from the o’s to the x’sis positive. The different trends cancel.
D) impossible to compute for such a data set.E) negative, since the o’s display a negative trend and the x’s
display a negative trend.
Name: Date: Period: SCORE:
AP Statistics: Unit 2 “Take-Home” Test
RNBriones Concord High 5
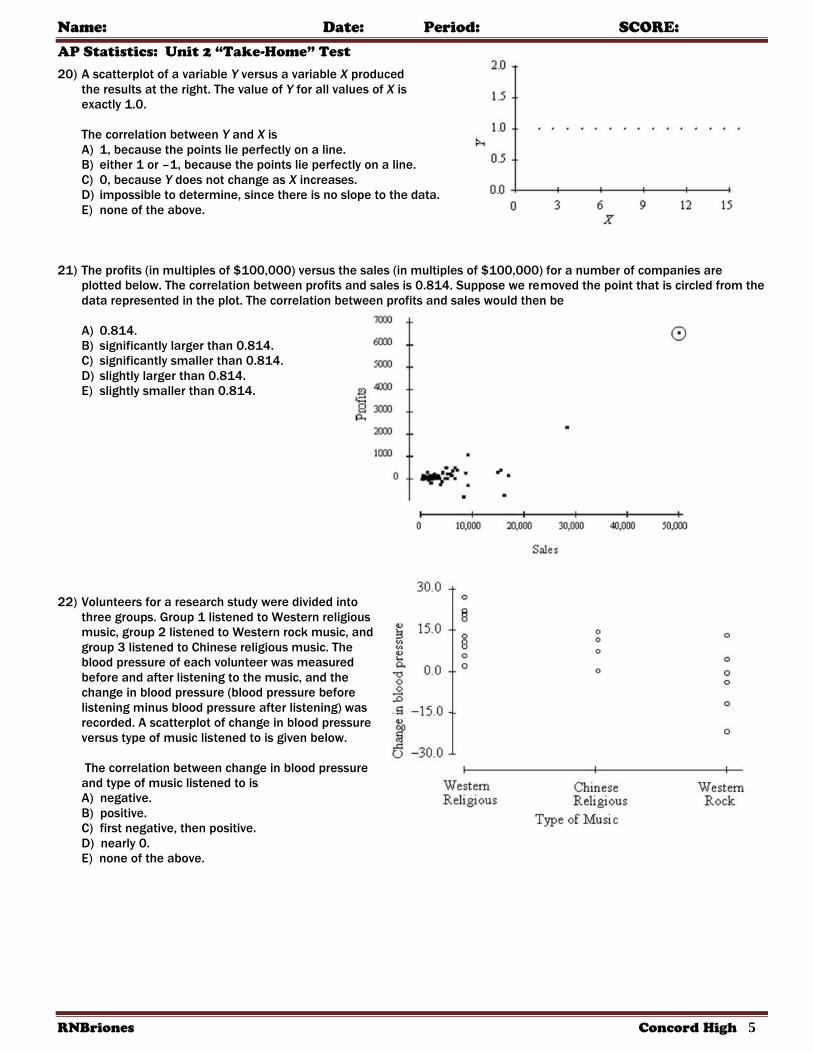
20) A scatterplot of a variable Y versus a variable X producedthe results at the right. The value of Y for all values of X isexactly 1.0.
The correlation between Y and X isA) 1, because the points lie perfectly on a line.B) either 1 or –1, because the points lie perfectly on a line.C) 0, because Y does not change as X increases.D) impossible to determine, since there is no slope to the data.E) none of the above.
21) The profits (in multiples of $100,000) versus the sales (in multiples of $100,000) for a number of companies areplotted below. The correlation between profits and sales is 0.814. Suppose we removed the point that is circled from thedata represented in the plot. The correlation between profits and sales would then be
A) 0.814.B) significantly larger than 0.814.C) significantly smaller than 0.814.D) slightly larger than 0.814.E) slightly smaller than 0.814.
22) Volunteers for a research study were divided intothree groups. Group 1 listened to Western religiousmusic, group 2 listened to Western rock music, andgroup 3 listened to Chinese religious music. Theblood pressure of each volunteer was measuredbefore and after listening to the music, and thechange in blood pressure (blood pressure beforelistening minus blood pressure after listening) wasrecorded. A scatterplot of change in blood pressureversus type of music listened to is given below.
The correlation between change in blood pressureand type of music listened to isA) negative.B) positive.C) first negative, then positive.D) nearly 0.E) none of the above.

Name: Date: Period: SCORE:
AP Statistics: Unit 2 “Take-Home” Test
RNBriones Concord High 6
23) The profits (in multiples of $100,000) versus thesales (in multiples of $100,000) for a number ofcompanies are plotted at the right.
Notice that in the plot, profits is treated as theresponse variable and sales as the explanatoryvariable. The correlation between profits andsales is 0.814. Suppose we had taken sales tobe the response variable and profits to be theexplanatory variable. In this case, the correlationbetween sales and profits would beA) 0.814.B) –0.814.C) 0.D) any number between -0.814 and 0.814, but we can’t state the exact value.E) 1, since the direction of the data doesn’t change.
24) At the right is a scatterplot of the calories and sodiumcontent (in milligrams) of several brands of meat hot dogs.The least-squares regression line has been drawn on theplot.
Based on the least-squares regression line in thisscatterplot, one would predict that a hot dog containing 100calories would have a sodium content (in milligrams) ofaboutA) 70 B) 350 C) 375 D) 400 E) 600
25) The British government conducts regular surveys ofhousehold spending. The average weekly householdspending on tobacco products and alcoholic beveragesfor each of 11 regions in Great Britain was recorded. Ascatterplot of spending on alcohol versus spending ontobacco is given below.
Which of the following statements is true?A) The observation (4.5, 6.0) is an outlier.B) There is clear evidence of a negative association
between spending on alcohol and spending on tobacco.C) The equation of the least-squares line for this plot would
be approximately 10 2 y x .D) The correlation coefficient for this data is 0.99.E) The observation in the lower right corner of the plot is
influential.
26) The fraction of the variation in the values of y that is explained by the least-squares regression of y on x isA) the correlation coefficient.B) the slope of the least-squares regression line.C) the square of the correlation coefficient.D) the intercept of the least-squares regression line.E) the residual.

Name: Date: Period: SCORE:
AP Statistics: Unit 2 “Take-Home” Test
RNBriones Concord High 7
27) In a statistics course, a linear regression equation was computed to predict a student’s final exam score from his/herscore on the first test. The equation of the least-squares regression line was
ˆ 10 0.9 y xwhere y represents the final exam score and x is the score on the first exam. Suppose Joe scores a 90 on the first exam.What would be the predicted value of his score on the final exam?A) 91.B) 90.C) 89.D) 81.E) It cannot be determined from the information given. We also need to know the correlation coefficient.
28) John’s parents recorded his height at various ages up to 66 months. Below is a record of the results.
Age (months) 36 48 54 60 66Height (inches) 35 38 41 43 45
Which of the following is the equation of the least-squares regression line of John’s height on age?(NOTE: You do not need to directly calculate the least-squares regression line to answer this question.)
A) Height = 12 × (Age). D) Height = 60 – 0.22 × (Age).
B) Height = 0.34 + 22.3 × (Age). E) Height = 22.3 + 0.34 × (Age).
C) Height = Age/12.
29) Foresters use regression to predict the volume of timber in a tree using easily measured quantities such as diameter.Let y be the volume of timber in cubic feet and x be the tree’s diameter in feet (measured at three feet above groundlevel). One set of data gives the following least-squares regression equation:
y = –30 + 60x
The predicted volume of timber in a tree of diameter 18 inches isA) 1080 cubic feet. B) 1050 cubic feet. C) 90 cubic feet. D) 60 cubic feet. E) 30 cubic feet.
30) A researcher wishes to determine whether the rate of water flow (in liters per second) over an experimental soil bed canbe used to predict the amount of soil washed away (in kilograms). The researcher measures the amount of soil washedaway for various flow rates and from these data calculates the least-squares regression line to be
(amount of eroded soil)[hat] = 0.4 + 1.3 × (flow rate)
The correlation between amount of eroded soil and flow rate would beA) 1/1.3B) 0.4C) 1.3D) positive, but we cannot say what the exact value is using the information given.E) either positive or negative. It is impossible to say anything about the correlation from the information given.
31) The least-squares regression line isA) the line that makes the square of the correlation in the data as large as possible.B) the line that makes the sum of the squares of the vertical distances of the data points from the line as small as
possible.C) the line that passes through the greatest number of data points.D) the line that best splits the data in half, with half of the points above the line and half below the line.E) all of the above.
32) Which of the following is true of the least-squares regression line?A) The slope is the change in the response variable that would be predicted by a unit change in the explanatory variable.B) It always passes through the point ( X , Y ), the means of the explanatory and response variables, respectively.C) It will only pass through all the data points if r = ± 1.D) No more than 50% of the residual values will be positive.E) All of the above.
Name: Date: Period: SCORE:
AP Statistics: Unit 2 “Take-Home” Test
RNBriones Concord High 8
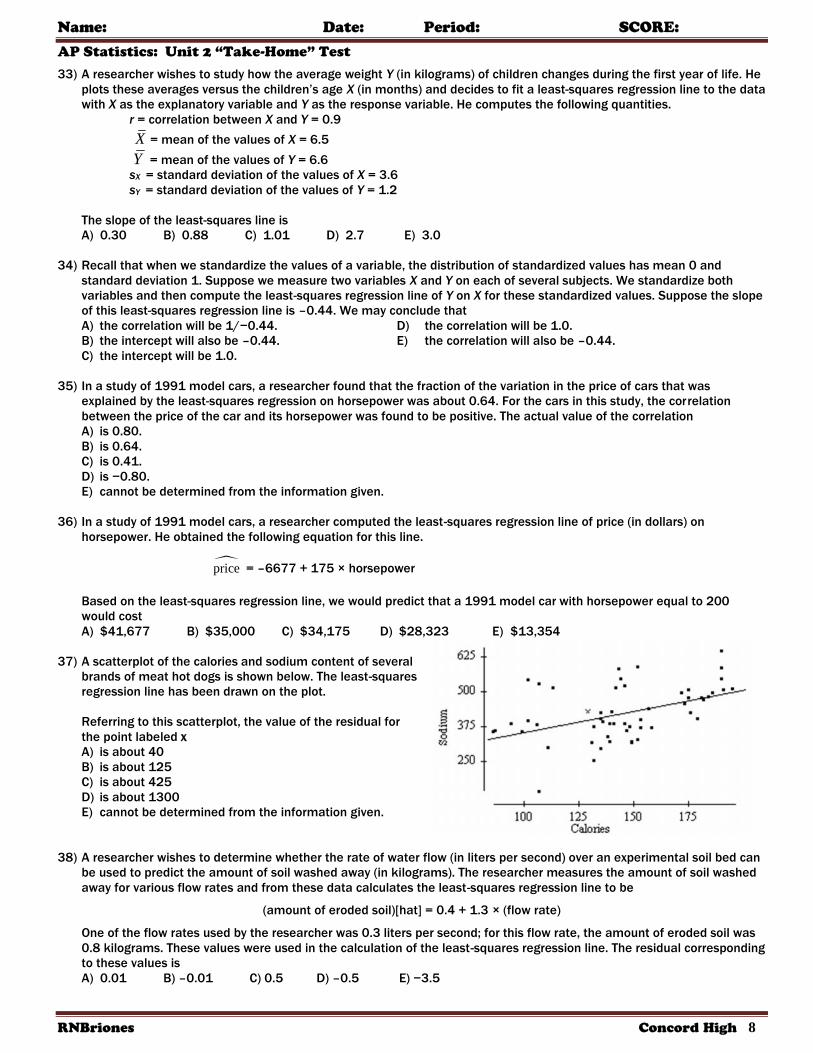
33) A researcher wishes to study how the average weight Y (in kilograms) of children changes during the first year of life. Heplots these averages versus the children’s age X (in months) and decides to fit a least-squares regression line to the datawith X as the explanatory variable and Y as the response variable. He computes the following quantities.
r = correlation between X and Y = 0.9X = mean of the values of X = 6.5Y = mean of the values of Y = 6.6sX = standard deviation of the values of X = 3.6sY = standard deviation of the values of Y = 1.2
The slope of the least-squares line isA) 0.30 B) 0.88 C) 1.01 D) 2.7 E) 3.0
34) Recall that when we standardize the values of a variable, the distribution of standardized values has mean 0 andstandard deviation 1. Suppose we measure two variables X and Y on each of several subjects. We standardize bothvariables and then compute the least-squares regression line of Y on X for these standardized values. Suppose the slopeof this least-squares regression line is –0.44. We may conclude thatA) the correlation will be 1/−0.44. D) the correlation will be 1.0.B) the intercept will also be –0.44. E) the correlation will also be –0.44.C) the intercept will be 1.0.
35) In a study of 1991 model cars, a researcher found that the fraction of the variation in the price of cars that wasexplained by the least-squares regression on horsepower was about 0.64. For the cars in this study, the correlationbetween the price of the car and its horsepower was found to be positive. The actual value of the correlationA) is 0.80.B) is 0.64.C) is 0.41.D) is −0.80.E) cannot be determined from the information given.
36) In a study of 1991 model cars, a researcher computed the least-squares regression line of price (in dollars) onhorsepower. He obtained the following equation for this line.
price = –6677 + 175 × horsepower
Based on the least-squares regression line, we would predict that a 1991 model car with horsepower equal to 200would costA) $41,677 B) $35,000 C) $34,175 D) $28,323 E) $13,354
37) A scatterplot of the calories and sodium content of severalbrands of meat hot dogs is shown below. The least-squaresregression line has been drawn on the plot.
Referring to this scatterplot, the value of the residual forthe point labeled xA) is about 40B) is about 125C) is about 425D) is about 1300E) cannot be determined from the information given.
38) A researcher wishes to determine whether the rate of water flow (in liters per second) over an experimental soil bed canbe used to predict the amount of soil washed away (in kilograms). The researcher measures the amount of soil washedaway for various flow rates and from these data calculates the least-squares regression line to be
(amount of eroded soil)[hat] = 0.4 + 1.3 × (flow rate)
One of the flow rates used by the researcher was 0.3 liters per second; for this flow rate, the amount of eroded soil was0.8 kilograms. These values were used in the calculation of the least-squares regression line. The residual correspondingto these values isA) 0.01 B) –0.01 C) 0.5 D) –0.5 E) −3.5

Name: Date: Period: SCORE:
AP Statistics: Unit 2 “Take-Home” Test
RNBriones Concord High 9
39) A response variable Y and explanatory variable X were measured on each of several subjects. A scatterplot of themeasurements is shown at the right. The least-squares regression line is shown in the plot.
Which of the following five plots is a plot of the residuals for thedata shown in the scatterplot above versus X?
A) B)
C) D)
E)
40) A least-squares regression line is fitted to a set of data. If one of the data points has a positive residual, thenA) the correlation between the values of the response and explanatory variables must be positive.B) the point must lie above the least-squares regression line.C) the slope of the least-squares regression line must be positive.D) the point must lie near the right edge of the scatterplot.E) all of the above.
41) Which of the following statements concerning residuals is true?A) The sum of the residuals is always 0.B) A plot of the residuals is useful for assessing the fit of the least-squares regression line.C) The value of a residual is the observed value of the response minus the value of the response that one would predict
from the least-squares regression line.D) If the data are linear, then the plot of the residuals should have no discernible pattern.E) All of the above.

Name: Date: Period: SCORE:
AP Statistics: Unit 2 “Take-Home” Test
RNBriones Concord High 10
42) Consider the scatterplot at the right.
The point indicated by the plotting symbol x would beA) a residual.B) influential.C) a z-score.D) a least-squares point.E) a partial outlier.
43) A sample of 79 companies was taken, and the annualprofits (y) were plotted against annual sales (x). Theplot is given below. All values in the plots are in units of$100,000.
The correlation between sales and profits is found to be0.814. Based on this information, we may concludewhich of the following?A) If the sales were less than $20,000, the equation of
the least-squares regression line would predict theprofits quite accurately.
B) There are clearly influential observations present.C) If we group the companies in the plot into those that
are small in size, those that are medium in size, andthose that are large in size and compute thecorrelation between sales and profits for each groupof companies separately, the correlation in eachgroup will be about 0.8.
D) Not surprisingly, increasing sales causes an increasein profits. This is confirmed by the large positivecorrelation.
E) All of the above.
44) The residual value of ,x y in a linear regression is
A) negative B) 0 C) positiveD) dependent on the value of r E) the value cannot be determined
45) If (12, 60) is an influential point for the regression line 7 908 4 098. .y x , then which of the following must be true?A) removal of (12, 60) will improve rB) removal of (12, 60) will not affect rC) removal of (12, 60) will change the value of the slope of the regression lineD) (12, 60) has a large residualE) none of these
46) A regression analysis of students' college grade point averages (GPAs) and their high school GPAsfound R2 = 0.311. Which of these is true?
I) High school GPA accounts for 31.1% of college GPA.II) 31.1% of college GPAs can be correctly predicted with this model.III) 31.1% of the variance in college GPA can be accounted for by the model.
A) II only B) I and II C) I only D) None E) III only
47) When using midterm exam scores to predict a student's final grade in a class, the student would prefer to have aA) positive residual, because that means the student's final grade is higher than we would predict with the model.B) negative residual, because that means the student's final grade is higher than we would predict with the model.C) negative residual, because that means the student's final grade is lower than we would predict with the model.D) positive residual, because that means the student's final grade is lower than we would predict with the model.E) residual equal to zero, because that means the student's final grade is exactly what we would predict with the model.
Name: Date: Period: SCORE:
AP Statistics: Unit 2 “Take-Home” Test
RNBriones Concord High 11
48) All but one of the statements below contains a mistake. Which one could be true?A) The correlation between weight and length of foot is 0.488.B) The correlation between gender and age is -0.171.C) If the correlation between blood alcohol level and reaction time is 0.73, then the correlation between reaction time
and blood alcohol level is -0.73.D) The correlation between the breed of a dog and its weight is 0.435.E) The correlation between height and weight is 0.568 inches per pound.
49) A correlation of zero between two quantitative variables means thatA) there is no association between the two variables.B) we have done something wrong in our calculation of r.C) there is no linear association between the two variables.D) none of theseE) re-expressing the data will guarantee a linear association between the two variables.
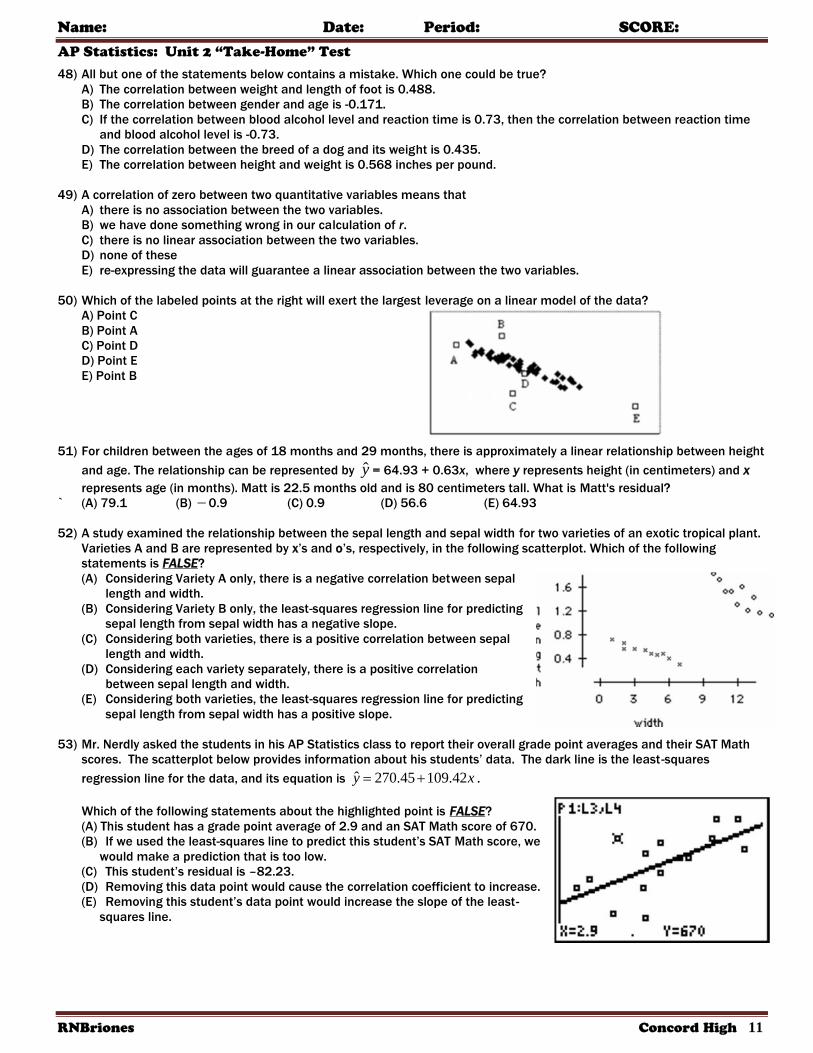
50) Which of the labeled points at the right will exert the largest leverage on a linear model of the data?A) Point CB) Point AC) Point DD) Point EE) Point B
51) For children between the ages of 18 months and 29 months, there is approximately a linear relationship between heightand age. The relationship can be represented by y = 64.93 + 0.63x, where y represents height (in centimeters) and xrepresents age (in months). Matt is 22.5 months old and is 80 centimeters tall. What is Matt's residual?
` (A) 79.1 (B) 0.9 (C) 0.9 (D) 56.6 (E) 64.93
52) A study examined the relationship between the sepal length and sepal width for two varieties of an exotic tropical plant.Varieties A and B are represented by x’s and o’s, respectively, in the following scatterplot. Which of the followingstatements is FALSE?(A) Considering Variety A only, there is a negative correlation between sepal
length and width.(B) Considering Variety B only, the least-squares regression line for predicting
sepal length from sepal width has a negative slope.(C) Considering both varieties, there is a positive correlation between sepal
length and width.(D) Considering each variety separately, there is a positive correlation
between sepal length and width.(E) Considering both varieties, the least-squares regression line for predicting
sepal length from sepal width has a positive slope.
53) Mr. Nerdly asked the students in his AP Statistics class to report their overall grade point averages and their SAT Mathscores. The scatterplot below provides information about his students’ data. The dark line is the least-squaresregression line for the data, and its equation is ˆ 270.45 109.42 y x .
Which of the following statements about the highlighted point is FALSE?(A) This student has a grade point average of 2.9 and an SAT Math score of 670.(B) If we used the least-squares line to predict this student’s SAT Math score, we
would make a prediction that is too low.(C) This student’s residual is –82.23.(D) Removing this data point would cause the correlation coefficient to increase.(E) Removing this student’s data point would increase the slope of the least-
squares line.

Name: Date: Period: SCORE:
AP Statistics: Unit 2 “Take-Home” Test
RNBriones Concord High 12
54) Suppose we fit a least-squares regression line to a set of data. What is true if a plot of the residuals shows a curvedpattern?(A) A straight line is not a good model for the data.(B) The correlation must be 0.(C) The correlation must be positive.(D) Outliers must be present.(E) The regression line might or might not be a good model for the data, depending on the extent of the curve.
55) A set of data relates the amount of annual salary raise and the performance rating. The least-squares regressionequation is ˆ 1400 2000 y x , where y is the raise amount and x is the performance rating. Which of statements is notcorrect?(A) For each increase of one point in performance rating, the raise will increase on average by $2000.(B) This equation produces predicted raises with an average error of 0.(C) A rating of 0 will yield a predicted raise of $1400.(D) The correlation between salary raise and performance rating is positive.(E) All of the above are true.
56) A regression of the amount of calories in a serving of breakfast cereal vs. the amount of fat gave the following results:Calories-hat = 97.1053 + 9.6525(Fat). Which of the following is FALSE?(A) It is estimated that for every additional gram of fat in the cereal, the number of calories increases by about 10.(B) It is estimated that in cereals with no fat, the total amount of calories is about 97.(C) If a cereal has 2 g of fat, then it is estimated that the total number of calories is about 116.(D) The correlation between amount of fat and calories is positive.(E) One cereal has 140 calories and 5 g of fat. Its residual is about 5 cal.
57) Which of the following statements is/are TRUE?I) Correlation and regression require explanatory and response variables.II) Scatterplots require that both variables be quantitative.III) Every least-squares regression line passes through ( , ).x y
(A) I and II only (B) I and III only (C) II and III only (D) I, II, and III (E) None of the above
58) All but one of the following statements contains a blunder. Which statement could be CORRECT?(A) There is a correlation of 0.54 between the position a football player plays and his weight.(B) We found a correlation of r = –0.63 between gender and political party preference.(C) The correlation between the gas mileage of a car and its weight is r = 0.71 mpg.(D) We found a high correlation (r = 1.09) between the height and age of children.(E) The correlation between planting rate and yield of tomatoes was found to be r = 0.23.
59) The owner of a chain of supermarkets notices that there is a positive correlation between the sales of beer and the salesof ice cream over the course of the previous year. During seasons when sales of beer were above average, sales of icecream also tended to be above average. Likewise, during seasons when sales of beer were below average, sales of icecream also tended to be below average. Which of the following would be a valid conclusion from these facts?A) The sales records must be in error. There should be no association between beer and ice cream sales.B) Temperature is clearly a lurking variable when considering sales of beer and ice cream.C) A scatterplot of monthly ice cream sales versus monthly beer sales would show that a straight line describes the
pattern in the plot, but it would have to be a horizontal line.D) Evidently, for a significant proportion of customers of these supermarkets, drinking beer causes a desire for ice
cream or eating ice cream causes a thirst for beer.E) None of the above.
60) Two variables, an explanatory variable x and a response variable y, are measured on each of several individuals. Thecorrelation between these variables is found to be 0.88. To help us interpret this correlation, we should do which of thefollowing?A) Compute the least-squares regression line of y on x and consider whether the slope is positive or negative.B) Interchange the roles of x and y (i.e., treat x as the response variable and y as the explanatory variable) and
recompute the correlation.C) Plot the data.D) Determine whether x or y has larger values before computing the residuals.E) All of the above.