name use scantron for questions 1 75. #76 83 on paper...
TRANSCRIPT
EC201 – Winter 2018 Midterm Exam - Jenkins
1
Name _____________________
Use Scantron For Questions 1 – 75. #76 – 83 on paper exam.
1) The decision about what goods and services will be produced in a market economy is made by
A) lawmakers in the government voting on what will be produced.
B) workers deciding to produce only what the boss says must be produced.
C) producers deciding what society wants most.
D) consumers and firms choosing which goods and services to buy or produce.
2) Economists assume that individuals
A) behave in unpredictable ways.
B) will never take actions to help others.
C) prefer to live in a society that values fairness above all else.
D) are rational and respond to incentives.
3) Which of the following generates productive efficiency?
A) competition among sellers
B) competition among buyers
C) government inspectors
D) government production rules and regulations
4) Marginal analysis involves undertaking an activity
A) until its marginal costs start declining.
B) only when its marginal benefits are positive.
C) until its marginal benefits equal marginal costs.
D) only if its marginal costs are greater than its marginal benefits.
5) Which of the following is not an example of an economic trade-off that a firm faces?
A) whether it is cheaper to produce with more machines or with more workers
B) whether it makes sense to outsource the production of a good or service
C) whether or not consumers will buy its products
D) whether it should produce more or less of its product
6) Which of the following is a positive economic statement?
A) The standard of living in the United States should be higher.
B) If the price of iPhones falls, a larger quantity of iPhones will be purchased.
C) The government should revamp the health care system.
D) The U.S. government should not have bailed out U.S. auto manufacturers.
7) Economic models
A) make no assumptions in order to remain as accurate as possible.
B) are simplified versions of reality.
C) can not be used to analyze real-world issues.
D) magnify the complexity of economic issues in order to provide useful data.

EC201 – Winter 2018 Midterm Exam - Jenkins
2
8) Which of the following statements about opportunity cost is true?
A) A perfectly rational consumer is able to reduce her opportunity costs to zero.
B) Marginal analysis involves comparing the marginal benefits and opportunity costs of an action.
C) The most efficient opportunities have negative costs.
D) Opportunity cost is the highest-value alternative that must be given up to engage in an activity.
9) A critical function of the government in facilitating the operation of a market economy is
A) producing goods and services for low-income households.
B) setting up and enforcing private property rights.
C) ensuring an equal distribution of income to all citizens.
D) controlling the market prices of food items.
10) Which of the following correctly describes the relationship between economic efficiency and economic
equity?
A) They are both automatically achieved in a free market economy.
B) They always call for opposite outcomes.
C) There is no conflict between the two goals.
D) There is often a trade-off between the two.
11) Which of the following is not a factor of production?
A) entrepreneurial ability
B) labor
C) bank loan
D) capital
True or False
12) In a mixed economy, the government decides how economic resources will be allocated.
13) Allocative efficiency is when a good or service is produced at the lowest possible cost.
14) Microeconomics is the study of the economy as a whole.
15) The basis for trade is the presence of both absolute and comparative advantages

EC201 – Winter 2018 Midterm Exam - Jenkins
3
This Figure is the production possibilities frontier (PPF) of a country producing two goods: paper and
steel. Questions 16-20.
16) Which of the following combinations (of steel and paper) is efficient?
A) Combinations V and Y
B) Combinations V, W, and X
C) Combination Y
D) Combinations V, W, X, and Y
17) Which of the following combinations could result from economic growth in the country?
A) Combinations V, W and X
B) Combination Z
C) Combination Y
D) Combinations V, W, X, and Z
18) If the economy is currently producing at point W, what is the opportunity cost of moving to point X?
A) 3 million tons of steel C) 5 million tons of paper
B) 19 million tons of steel D) 9 million tons of paper
19) If the economy is currently producing at point Y, what is the opportunity cost of moving to point W?
A) 2 million tons of steel C) 9 million tons of paper
B) zero D) 16 million tons of paper
20) Which of the following explains why increasing steel production requires progressively greater decreases in
paper production (i.e., moving from U to V to X)?
A) Combinations U, V, and X
B) Decreasing marginal opportunity costs
C) Constant marginal opportunity costs
D) Increasing marginal opportunity costs
V
Z U
EC201 – Winter 2018 Midterm Exam - Jenkins
4
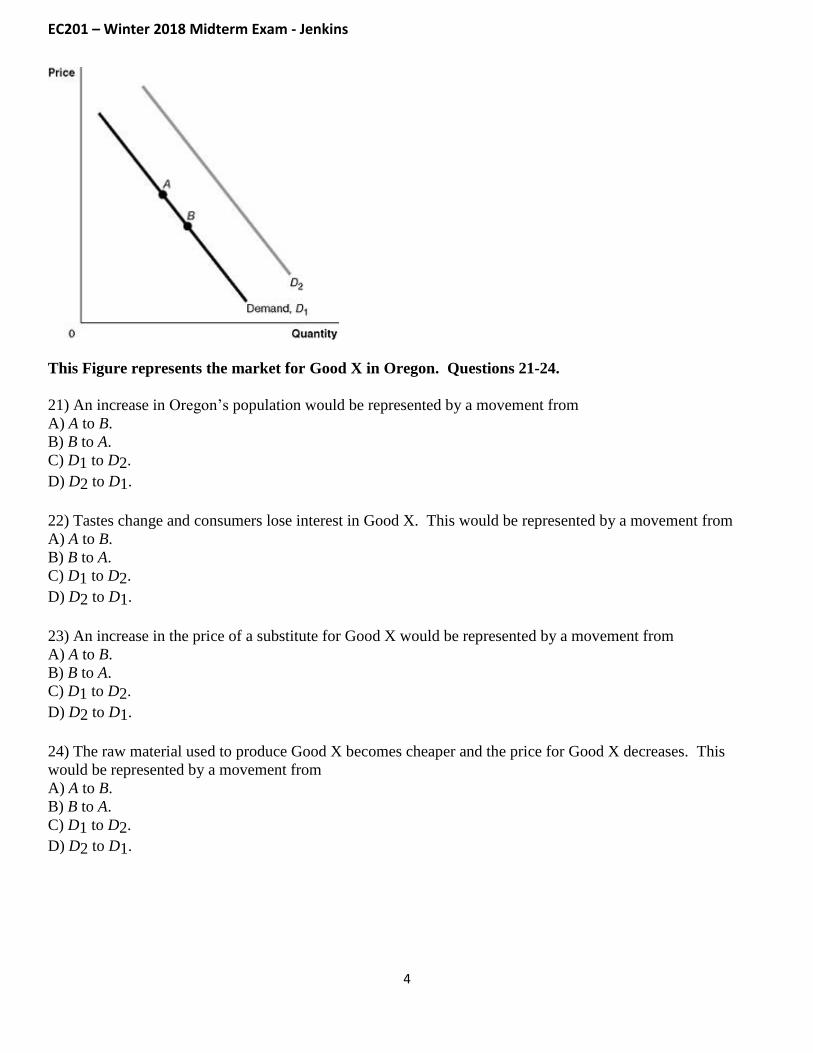
This Figure represents the market for Good X in Oregon. Questions 21-24.
21) An increase in Oregon’s population would be represented by a movement from
A) A to B.
B) B to A.
C) D1 to D2.
D) D2 to D1.
22) Tastes change and consumers lose interest in Good X. This would be represented by a movement from
A) A to B.
B) B to A.
C) D1 to D2.
D) D2 to D1.
23) An increase in the price of a substitute for Good X would be represented by a movement from
A) A to B.
B) B to A.
C) D1 to D2.
D) D2 to D1.
24) The raw material used to produce Good X becomes cheaper and the price for Good X decreases. This
would be represented by a movement from
A) A to B.
B) B to A.
C) D1 to D2.
D) D2 to D1.

EC201 – Winter 2018 Midterm Exam - Jenkins
5
25) One would speak of a change in the quantity of a good supplied, rather than a change in supply, if
A) supplier expectations about future prices change.
B) the price of the good changes.
C) the cost of producing the good changes.
D) prices of substitutes in production change.
26) In 2004, hurricanes damaged a large portion of Florida's orange crop. As a result of this, many orange
growers were not able to supply fruit to the market. If, following the hurricane, the price remained at its pre-
hurricane level, we would expect to see
A) a surplus of oranges.
B) the quantity demanded equal to the quantity supplied.
C) a shortage of oranges.
D) an increase in the demand for oranges.
Match each scenario with the appropriate diagram (may be used more than once)
Questions 27-30
27) Gradual global warming switches to intense global cooling and ice cream loses popularity. A quarter of the
ice cream shops in Portland close.
28) In response to lower world prices for pears, Aaron’s Unorthodox Orchards decides to decrease its output of
pears.
29) The minerals Wowsium and Yowsium are found in the same type of bedrock and thus tend to be mined
together. Wowsium has long been an additive to toothpaste. Yowsium has found a new application in Virtual
Reality (VR) systems and the price for Yowsium has gone up. Answer for supply/quantity supplied of
Wowsium.
30) A much-followed international consulting group publishes a new report in which it significantly lowers its
forecast for both the global economic growth rate and oil prices expected in the next year. Answer for
supply/quantity supplied of oil.
A B C D

EC201 – Winter 2018 Midterm Exam - Jenkins
6
Use this Figure to answer questions 31-34.
31) What is the equilibrium price and equilibrium quantity? 35) ______
A) $25 and 500 C) $20 and 600
B) $20 and 500 D) $25 and 800
32) At a price of $10, how many units will be demanded and how many will be sold? 36) ______
A) 200 demanded; 200 sold
B) 800 demanded; 600 sold
C) 600 demanded; 200 sold
D) 800 demanded; 200 sold
33) At a price of $25, there is a(n) _________ of ______ units. 37) ______
A) surplus and 200
B) shortage and 600
C) equilibrium and 300
D) surplus and 300
34) Which of the following products comes closest to having a perfectly inelastic demand?
A) gasoline
B) life-saving medication
C) iPhones
D) bus rides

EC201 – Winter 2018 Midterm Exam - Jenkins
7
Economists collected sales data for various products and estimated the following elasticities. Use the data
in the table to answer Questions 35-38.
Price elasticity of demand for Product Z -0.66
Cross-price elasticity of demand b/w Product Z & Product Y 0.97
Cross-price elasticity of demand b/w Product Z & Product X -1.18
Cross-price elasticity of demand b/w Product Z & Product W -0.44
Income elasticity of demand for Product Z 0.15
35) Product Z is a(n) ___________ good and a ____________.
A) inferior; necessity
B) normal; luxury
C) normal; necessity
D) significant; luxury
36) Product Z and Product Y are ____________ .
A) substitutes
B) complements
C) inferiorly complexed
D) normal
37) Product X and Product Z are ___________ and Product X has a _________ relationship with Product Z
than does Product W.
A) complements; weaker
B) substitutes; stronger
C) complements; more complicated
D) complements; stronger
38) If the price for Product Z declines, total revenues for Product Z would be expected to ______________ .
A) increase
B) stay the same
C) decrease
D) move in proportion to the price change
EC201 – Winter 2018 Midterm Exam - Jenkins
8
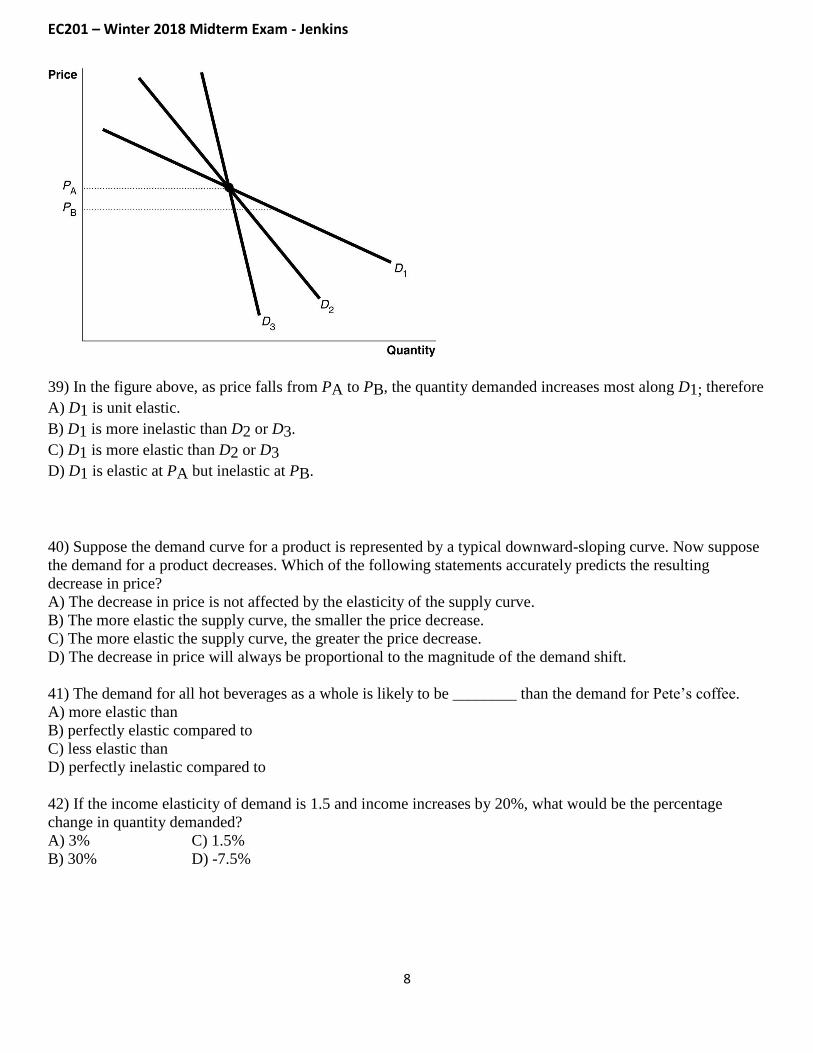
39) In the figure above, as price falls from PA to PB, the quantity demanded increases most along D1; therefore
A) D1 is unit elastic.
B) D1 is more inelastic than D2 or D3.
C) D1 is more elastic than D2 or D3
D) D1 is elastic at PA but inelastic at PB.
40) Suppose the demand curve for a product is represented by a typical downward-sloping curve. Now suppose
the demand for a product decreases. Which of the following statements accurately predicts the resulting
decrease in price?
A) The decrease in price is not affected by the elasticity of the supply curve.
B) The more elastic the supply curve, the smaller the price decrease.
C) The more elastic the supply curve, the greater the price decrease.
D) The decrease in price will always be proportional to the magnitude of the demand shift.
41) The demand for all hot beverages as a whole is likely to be ________ than the demand for Pete’s coffee.
A) more elastic than
B) perfectly elastic compared to
C) less elastic than
D) perfectly inelastic compared to
42) If the income elasticity of demand is 1.5 and income increases by 20%, what would be the percentage
change in quantity demanded?
A) 3% C) 1.5%
B) 30% D) -7.5%

EC201 – Winter 2018 Midterm Exam - Jenkins
9
43) Which of the following goods would have the most inelastic demand?
A) Vacation to Japan
B) Milk
C) Caviar
D) Tesla Roadster
True or False
44) A horizontal supply curve means supply is perfectly elastic.
45) A horizontal supply curve looks the same as a horizontal demand curve.
46) When demand is unit elastic, the price elasticity of demand equals 1.
47) A good with many close substitutes has less elastic demand than a good with few substitutes.
48) The supply curve for many products will be inelastic over a short period of time, but increasingly elastic
over longer periods of time.
Consumer Willingness to Pay
Billy Bob $24
Jerry Lee 21
Daisy Mae 15
Leigh Ann 12
Jethro 7
The table above lists the highest prices five consumers are willing to pay for a country music concert
ticket. They would only buy one ticket max.
49) If the price of one of the tickets is $18
A) Billy Bob and Leigh Anne will buy two tickets between them.
B) Jerry Lee will receive $3 of consumer surplus from buying one ticket.
C) Billy Bob and Daisy Mae receive a total of $18 of consumer surplus from buying one ticket each.
D) Daisy Mae, Leigh Ann, and Jethro will receive a total of $34 of consumer surplus since they will buy no
tickets.
50) Suppose price of a ticket is initially $25. Then, because ticket sales are slow, the price is
reduced from $25 to $12. Which of the following statements is accurate?
A) only two tickets will be sold.
B) consumer surplus decreases from $24 to $12.
C) consumer surplus increases from $0 to $24.
D) everyone will buy a ticket.

EC201 – Winter 2018 Midterm Exam - Jenkins
10
The Figure shows the market for apartments in Salmon City. Recently, the government imposed rent
control at R0. Prior to the rent ceiling going into effect, the equilibrium price was R*.
51) When R* was the price for apartments, what was the area that represented consumer surplus?
A) A + B + D
B) A + B + C
C) A + B + D + F
D) A + B + C + D + E + F
52) After the imposition of the ceiling, what is the area that represents apartment owners’ producer surplus?
A) F + G
B) D + E + F
C) F
D) G
53) With rent control, the quantity supplied is Q1. Suppose apartment owners ignore the law and rent this
quantity for the highest rent they can get. What is the highest rent they can get?
A) R* C) R0
B) R1 D) more than R1
54) What area represents the deadweight loss after the imposition of the ceiling?
A) G + H
B) J + H
C) C + E + J + H
D) C + E

EC201 – Winter 2018 Midterm Exam - Jenkins
11
Match term in Column B with the most appropriate one in Column A.
Column A Column B
55) Patents, copyrights A. Positive Externality
56) Flu vaccine B. Inferior Good
57) Ramen noodles C. Complements
58) Car & motor oil D. Property Rights
59) Toll road E. Nonrival & Excludable
60) If there is a positive externality in producing a product, then the market equilibrium price
A) is too high and equilibrium quantity is too low.
B) and equilibrium quantity are too low.
C) and equilibrium quantity are too high.
D) is too low and equilibrium quantity is too high.
61) The market demand for a public good can be determined by
A) adding up the total private benefits and external benefits that each quantity provides the citizens of a country.
B) adding up how much each citizen expects to consume at each possible price.
C) adding up how much each consumer is willing to pay for each unit of the public good.
D) estimating the value of the benefit that each unit provides and multiplying that by the number of consumers.
62) Private solutions to the problem of externalities are most likely to happen when
A) government actively encourages these solutions.
B) transactions costs are low and the number of bargaining parties is small.
C) transactions costs are low and the number of bargaining parties is large.
D) transactions costs are low and the monetary damages to third parties are high.
63) Which of the following is a source of market failure?
A) unforeseen circumstances which leads to the bankruptcy of many firms
B) a lack of government intervention in a market
C) incomplete property rights or inability to enforce property rights
D) an inequitable income distribution

EC201 – Winter 2018 Midterm Exam - Jenkins
12
The graph above shows a market with a negative externality. Questions 64-66.
64) The private profit-maximizing quantity for the firm is
A) Qa. C) Qb - Qd.
B) Qb. D) Qd.
65) If the government were to apply a Pigovian tax to bring about the efficient level of production, what should
the value of the tax be?
A) (Pf- Pb) per unit of output
B) (Pa- Pb) per unit of output
C) (Pa- Pc) per unit of output
D) Pa per unit of output
66) The cost of the negative externality should be
A) no larger than the marginal private cost
B) less than the subsidy for the inverse positive externality
C) equal to the amount of tax imposed by the government
D) equal to marginal benefits minus marginal costs

EC201 – Winter 2018 Midterm Exam - Jenkins
13
True or False
67) If social marginal cost is equal to private marginal cost in the production of a good, then there is no
externality.
68) At a competitive market equilibrium, marginal benefit and marginal cost are maximized.
69) Externalities affect consumers of goods whose production creates pollution.
70) Reducing pollution through a cap-and-trade system can be more economically efficient than other options
because it encourages pollution reduction to be done by the firms with the lowest reduction costs.
Match term in Column B with the most appropriate one in Column A.
Column A Column B
71) Free riding A. Common Resource
72) Tuna in ocean (outside
national boundaries) B. Public Good
73) Shortage C. Factor of production
74) Running shoes D. Price floor
75) Labor E. Excludable & Rival
76) Definitions & Examples – (2 pts each definition; 1 pt each example)
Provide a brief definition and relevant example (not found elsewhere on exam) for the following terms:
Substitutes
Definition: Goods or services that can be used for the same purpose
Example: Hot dog & hamburger; new car & used car
Negative externality
Definition: A cost that affects someone who is not directly involved in the production or consumption of a
good or service
Example: Air pollution from coal-fired electricity generation plant

EC201 – Winter 2018 Midterm Exam - Jenkins
14
77) Fill in the 2 blanks for the equation for the Midpoint Formula for price elasticity of demand. (1 pt)
(Q2 - __ Q1___) (P2 – P1)
------------------- X 100 ÷ ------------------- X 100
(Q1 + Q2)/2 (P1 + P2)/__ 2__
78) Imagine you own a pizza parlor. Currently, you sell 1,500 slices per week for $4.00 per slice. Then you
reduce the price to $3.00 per slice and you sell 2,500 slices per week. Find the price elasticity of demand using
the Midpoint Formula. Show work. (3 pts)
2500−15001500+2500
2
= 1000/2000 * 100 = 50%
3−44+3
2
= -1/3.5 * 100 = -28.6% PED = 50%
−28.6% = - 1.75
79) A year later, you decide to increase the price per pizza slice from $3.00 back to $4.00 and, using the
resulting sales data, you find a price elasticity of demand of -2.0. What is the percentage change in quantity
demanded due to the price change? Show work as needed. (2 pts) 4−3
(4+3)/2 = 1/3.5 * 100 = 28.6%
PED = % Ch in Quantity Demanded / % Ch in Price
-2.0 = X/28.6%
X = 2.0 * 28.6% = 57.2%
80) Using the price increase scenario in #79, you would expect total revenue for selling pizza to (1.5 pts)
A) increase
B) stay the same
C) move in proportion to the price change
D) decrease
81) Using the usual price-quantity graph, draw what the demand curve for #79 would look like (don’t use exact
numbers) and label it D1. On the same graph, also draw a perfectly inelastic supply curve and label it S1. (1 pt
each curve)
D
SP
Q
S1
D1
EC201 – Winter 2018 Midterm Exam - Jenkins
15
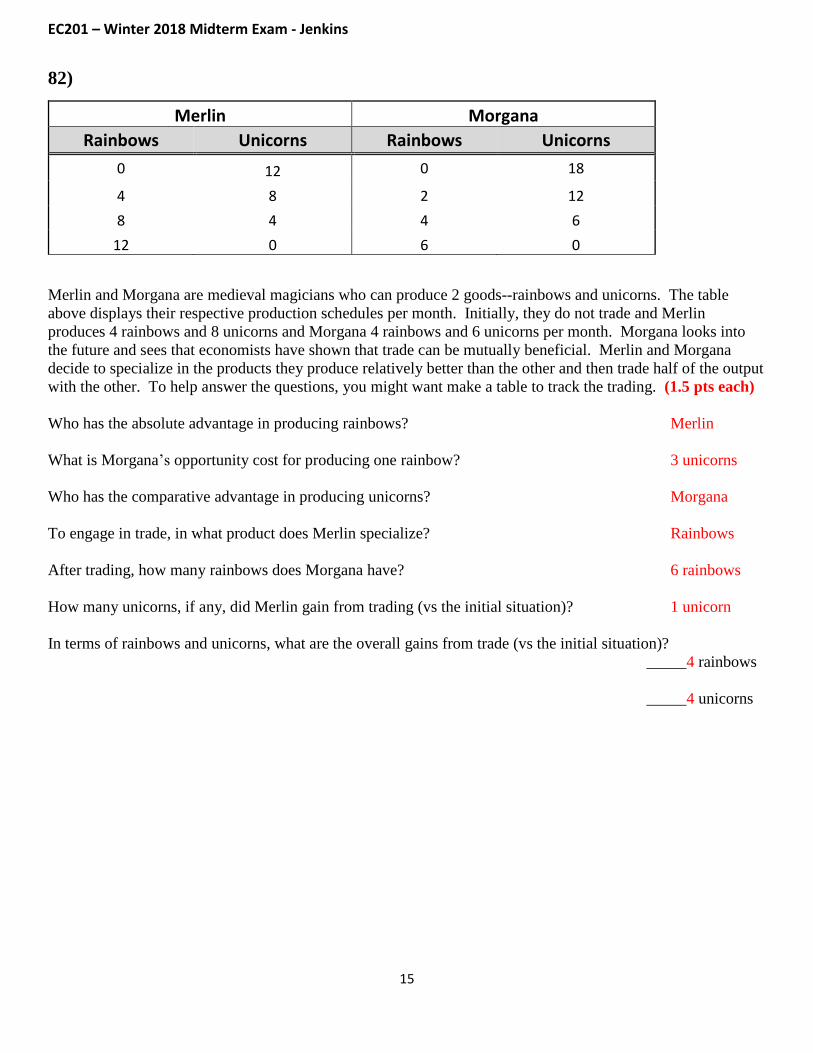
82)
Merlin Morgana
Rainbows Unicorns Rainbows Unicorns
0 12 0 18
4 8 2 12
8 4 4 6
12 0 6 0
Merlin and Morgana are medieval magicians who can produce 2 goods--rainbows and unicorns. The table
above displays their respective production schedules per month. Initially, they do not trade and Merlin
produces 4 rainbows and 8 unicorns and Morgana 4 rainbows and 6 unicorns per month. Morgana looks into
the future and sees that economists have shown that trade can be mutually beneficial. Merlin and Morgana
decide to specialize in the products they produce relatively better than the other and then trade half of the output
with the other. To help answer the questions, you might want make a table to track the trading. (1.5 pts each)
Who has the absolute advantage in producing rainbows? Merlin
What is Morgana’s opportunity cost for producing one rainbow? 3 unicorns
Who has the comparative advantage in producing unicorns? Morgana
To engage in trade, in what product does Merlin specialize? Rainbows
After trading, how many rainbows does Morgana have? 6 rainbows
How many unicorns, if any, did Merlin gain from trading (vs the initial situation)? 1 unicorn
In terms of rainbows and unicorns, what are the overall gains from trade (vs the initial situation)?
_____4 rainbows
_____4 unicorns

EC201 – Winter 2018 Midterm Exam - Jenkins
16
83) Apply your demand and supply analysis to the iPhone market, given that: (a) The vast majority of iPhone production takes place in China. A new minimum wage law in China
raises labor costs at manufacturing plants throughout China, including those making iPhones.
(b) An ingenious hack of the App Store cuts in half the number of apps available for iPhones and the
price of iPhone apps rises markedly
Complete the graph below showing the initial equilibrium quantity (Q1) and price (P1), any changes in the
supply and demand curves (S2, D2) and the equilibrium quantities and prices (Q2, P2) related to this scenario.
REMEMBER – your graph must include labels for all six (Q1, P1, etc.) to get full credit.
(10 pts in total)
a) Can we use this information to be certain whether the equilibrium quantity of iPhones a) Yes No
will increase, decrease, or stay the same?
b) If Yes, how will the equilibrium quantity change? (Skip if No) b) Decrease
c) Can we use this information to be certain whether the equilibrium price of iPhones c) Yes No
will increase, decrease, or stay the same?
d) If Yes, how will the equilibrium price change? (Skip if No) d) ________
Price
iPhones
D1
S1
S2
D2
Q1 Q2
P1, P2