namibia financial stability report - namfisa · 3(a) of the bank of namibia act, 1997 (no 15 of...
TRANSCRIPT
Namibia Financial Stability Report - April 2018 1Page
Namibia Financial Stability ReportApril 2018

Namibia Financial Stability Report - April 2018
IPageNamibia Financial Stability Report - April 2018
Members of the Financial System Stability Committee
Bank of Namibia
• Deputy Governor and Head of Financial Stability [Alternating Chairperson]• Director: Research• Director: Banking Supervision• Director: Financial Markets• Director: Payment and Settlement Systems• Director: Strategic Communications & Financial Sector Development• Advisors to the Governor• Chief Risk Officer
Namibia Financial Institutions Supervisory Authority (NAMFISA)
• Deputy CEO (Prudential Supervision) [Alternating Chairperson]• General Manager: Research, Policy and Statistics• General Manager: Insurance and Medical Aid• General Manager: Pension Funds and Friendly Societies• General Manager: Capital Markets• Manager: Corporate Communications
Ministry of Finance • Director: Economic Policy Advisory Services
© Bank of Namibia/NAMFISA
All rights reserved. No part of this publication may be reproduced, copied or transmitted in any form
or by any means, including but not limited to photocopying, recording and storing, without fully
acknowledging the Namibia Financial Stability Report as the source. The contents of this publication are
intended for general information only and are not intended to serve as financial or other advice. While
every precaution is taken to ensure the accuracy of information, the Bank of Namibia and NAMFISA are
neither liable to any person for inaccurate information nor for any opinion contained in this publication
Published by: Bank of Namibia71 Robert Mugabe AvenueWindhoekNAMIBIATel.: +264 61 283 5111http://www.bon.com.na
NAMFISA154 Independence AvenueSanlam Centre, 8th FloorWindhoekNAMIBIATel: +264 (61) 290 5000http://www.namfisa.com.na

Namibia Financial Stability Report - April 2018 IIPage
Bank of Namibia
Vision
Our vision is to be a centre of excellence - a
professional and credible institution - working in the
public interest, and supporting the achievement of
the national economic development goals.
MissionTo support economic growth and development
in Namibia, we act as fiscal advisor and banker to
the Government, promote price stability, manage
reserves and currency, and ensure sound financial
systems and conduct economic research.
Values
We speak our hearts,
We deliver as a team,
We do right things right,
We work smarter,
We value our differences and,
We help each other grow.
NAMFISA
VisionTo have a safe, a stable and fair financial system
contributing to the economic development of
Namibia in which consumers are protected.
MissionTo effectively regulate and supervise financial
institutions and to give sound advice to the Minister
of Finance.
ValuesWe are committed to teamwork,
We are passionate about service,
We act with integrity,
We drive performance excellence.
We are accountable,
We are agile.
Corporate Charters
Namibia Financial Stability Report - April 2018 IIIPage
AEs Advanced Economies
AfDB African Development Bank
ALSI All Share Price Index
AM Asset Managers
ATM Automatic Teller Machine
AuM Assets Under Management
BEL Best Estimate of Policyholder Liabilities
CCBG Committee of Central Bank Governors
CIS Collective Investment Schemes
CMA Common Monetary Area
CMA-CPOC Common Monetary Area Cross-border Payment Oversight Committee
CPI Consumer Price Index
DLTs Distributed Ledger Technologies
EFT Electronic Fund Transfers
EMDEs Emerging Markets and Developing Economies
EMEs Emerging Market Economies
EMV Euro-Pay MasterCard Visa
FIM Financial Institutions and Markets
FS Friendly Societies
FSAP Financial Sector Assessment Programme
FMI Financial Market Infrastructure
FNB First National Bank
FSR Financial Stability Report
FSSC Financial System Stability Committee
GDP Gross Domestic Product
GFSR Global Financial Stability Report
HPI House Price Index
IAIS International Association of Insurance Supervisors
ICP Insurance Core Principles
IMF International Monetary Fund
JSE Johannesburg Stock Exchange
LTD Loan-to-Deposit
LTFR Loan-to-Total Funding Ratio
LTI Long Term Insurance
LTV Loan-to-Value
MCR Minimum Capital Requirement
MPC Monetary Policy Committee
List of Abbreviations
Namibia Financial Stability Report - April 2018 IVPage
MoBEL Margin over the Best Estimate of policyholder Liabilities
NAD Namibia Dollar
NAMFISA Namibia Financial Institutions Supervisory Authority
NBFIs Non-bank Financial Institutions
NCPI Namibia Consumer Price Index
NISS Namibia Inter-Bank Settlement System
NPL Non-performing loan
NPS National Payment System
NSX Namibian Stock Exchange
PAN Payments Association of Namibia
PCIDSS Payment Card Industry Data Security Standards
PF Pension Fund
PFMIs Principles for Financial Market Infrastructure
POS Point-Of-Sale
PSCE Private Sector Credit Extension
RBOPF Risk-Based Oversight Policy Framework
ROA Return on Assets
ROE Return on Equity
ROI Return on Investment
RWCR Risk-Weighted Capital Ratio
SACU Southern African Customs Union
SARB South African Reserve Bank
SCR Solvency Capital Requirement
SOEs State Owned Enterprises
SSA Sub-Saharan Africa
STI Short Term Insurance
UK United Kingdom
US United States of America
VCs Virtual Currencies
VIX Volatility Index
WEO World Economic Outlook
Y-o-Y Year-on-Year
ZAR South African Rand
Namibia Financial Stability Report - April 2018 VPage
PREFACE
The purpose of the Financial Stability Report (FSR) is to identify risks and vulnerabilities
in the financial system and assess the resilience of the financial system to domestic and
external shocks. The Report also serves as a communication tool. The report presents
recommendations to the identified risks. Lastly, the report is published to inform the reader
on the soundness of the financial system, and what the regulators and government are
doing in order to mitigate risks to the Namibian financial system.
Financial system stability is defined as the resilience of the domestic financial system to
internal and external shocks, be they economic, financial, political or otherwise. It can also
be described as the absence of macroeconomic costs of disturbances in the system of
financial exchanges between households, corporates, and financial institutions.
The financial system in Namibia consists of financial markets, instruments, institutions and
infrastructure. The regulatory structure, while not strictly a part of the financial system, plays
an important role in regulating and monitoring the system. Under the mandate of Section
3(a) of the Bank of Namibia Act, 1997 (No 15 of 1997, as amended) the Bank of Namibia
has an objective “to promote and maintain a sound monetary, credit and financial system
in Namibia and sustain the liquidity, solvency and functioning of that system”. The stability
of the financial system is critical as the system provides important services to households,
corporates and the real economy.
This report is a joint effort between the Bank of Namibia and the Namibia Financial
Institutions Supervisory Authority (NAMFISA). The two institutions, which are entrusted with
the regulation of the financial system in Namibia, work closely to ensure a healthy financial
system. There is also active engagement between the Bank of Namibia, NAMFISA and the
Ministry of Finance to ensure a comprehensive assessment of systemic financial risks and
of policy actions to ensure lasting financial system stability.
Namibia Financial Stability Report - April 2018 VIPage
Contents
Preface V
I. INTRODUCTION AND SUMMARY 1
II. SUMMARY OF RISK ANALYSIS 5
III. MACROECONOMIC ENVIRONMENT 8
Global Economic Growth 8
Developments in the Financial Markets 10
Advanced Economies 10
Emerging Market Economies 11
Exchange Rate Developments 11
Monetary Policy Stance of South Africa 12
Domestic Economy 14
Output and Inflation 14
IV. DOMESTIC HOUSEHOLD AND CORPORATE DEBT INDICATORS 15
Household Debt to Disposable Income 15
Debt Servicing Ratio 18
Corporate Debt 19
V. PERFORMANCE OF THE BANKING SECTOR 24
Banking Sector Asset Growth 24
Profitability of the Banking Sector 25
Adequacy of Capital 26
Liquidity Position 27
Loan-to-Deposit (LTD) Ratio and Loan-to-Funding Ratio (LTFR) 29
Asset Quality 30
Large Exposures 31
Stress Test 35
Capital Adequacy Stress Test 39
Conclusion & Policy Options 41
Namibia Financial Stability Report - April 2018 VIIPage
VI. PERFORMANCE OF THE NON-BANKING FINANCIAL SECTOR 42
Industry assets 42
Developments in the Asset Management Industry 43
Sources of funds: Investment Management (IM) 44
Sources of funds: Collective Investment Schemes 45
Key NBFI Industry developments 47
Pension Funds 47
Key Risks 47
Exposures 47
Funding ratio 49
Investment Income 49
Long-term Insurance 50
Key Risks 50
Exposures 51
Investment Income 51
Solvency 52
VII. PAYMENTS INFRASTRUCTURE AND REGULATORY DEVELOPMENTS 55
Settlement Windows 56
Disruptions to the Namibia Interbank Settlement System (NISS) 56
Security of Retail Payments 57
VIII. CONCLUDING REMARKS AND POLICY IMPLICATIONS 62
BIBLIOGRAPHY 63
Namibia Financial Stability Report - April 2018 VIIIPage
Contents
Figure
Figure 1a: Risks to financial stability in Namibia 6
Figure 1b: Domestic financial stability risks map 7
Figure 2: Global growth and projections (annual percentage changes) 9
Figure 3: Volatility Index 10
Figure 4: Exchange rate movements of the Namibia Dollar against selected currencies 12
Figure 5: The JSE and NSX performance 13
Figure 6: Household debt to disposable income (Namibia & South Africa) 16
Figure 7: Growth in household debt and disposable income 17
Figure 8: Selected Interest Rates 18
Figure 9: Banking sector asset growth 24
Figure 10: Mortgage loans growth 25
Figure 11: Profitability of the banking sector 25
Figure 12: Capital adequacy 27
Figure 13: Liquidity position of the banking sector 28
Figure 14: Loan-to-Deposits (LTD) and Loan-to-Funding Ratios (LTFR) 29
Figure 15: Non-performing Loans as a percentage of total loans 30
Figure 16: Non-performing mortgage loans as percentage of total mortgage loans 31
Figure 17a: Banking sector large exposures and growth rate 32
Figure 17b: Sectoral composition of large exposures 32
Figure 18: Solvency stress test results 39
Figure 19: Liquidity stress test results 40
Figure 20: Sectorial composition (percent) of total NBFI assets 43
Figure 21: Assets per source of funds (investor), percent of total 44
Figure 22: Geographic asset allocation, percent of total, at year end 45
Figure 23: CIS assets per source of funds (investor), percent of total 46
Figure 24: Geographic asset allocation, percent of total 46
Figure 25a: Investment mix (percent), 2016 48
Figure 25b: Investment mix (percent), 2017 48
Figure 26: Funding ratio 49
Figure 27: Investment income 50
Figure 28a: Investment mix (percent), 2016 51
Namibia Financial Stability Report - April 2018 IXPage
Figure 28b: Investment mix (percent), 2017 51
Figure 29: Investment returns 52
Figure 30: Total assets vs. total liabilities 52
Figure 31: Value of payments processed in NISS 55
Figure 32: Proportions of payments processed in NISS settled in each settlement window 56
Table
Table 1: South Africa’s Consumer Price Index and Annual Inflation Rate (Dec. 2016=100) 12
Table 2: Household Debt and Disposable Income 15
Table 3: Debt servicing ratio (percentage) 18
Table 4: Domestic and external corporate debt (private sector and parastatals) 19
Table 5: SOEs and Private sector debt breakdown 20
Table 6: Foreign private sector debt and debt servicing 21
Table 7: Large exposures in relation to private sector credit extension 33
Table 8: Summary of the stress testing scenarios 39
Table 9: Total assets per sector 42
Table 10: Pension fund investment allocations, 2017 48
Table 11: Envisaged risk analytical tools 53
Box
BOX 1: IMPACT OF EXCESSIVE HOUSEHOLD INDEBTEDNESS ON FINANCIAL STABILITY AND ECONOMIC GROWTH 22Figure 1: Household debt to GDP ratio in selected economies 23
BOX 2: PROPERTY PRICE DEVELOPMENTS 33Figure 1: House Price Index (HPI) annual % change: 12 month moving average 34Figure 2: House Price Index (HPI) and Consumer Price Index (CPI): 1991:1 - 2017:12 35
BOX 3: NAMFISA’S CAPITAL ADEQUACY REQUIREMENT REGIME FOR SHORT-TERM AND LONG-TERM INSURERS 54Figure 1: The proposed capital adequacy requirements under the FIM Bill 54
BOX 4: CURRENT AND FUTURE DEVELOPMENTS IN PAYMENT AND SETTLEMENT SYSTEMS 59
Namibia Financial Stability Report - April 2018 1Page
I. INTRODUCTION AND SUMMARY
1 The Namibian financial system continued to be resilient amidst recessionary
economic conditions. Overall, the financial system and markets in Namibia remained
sound, profitable, with no disruptions or disorderly functioning of key financial
services despite unfavourable domestic economic conditions. Specifically, the
banking industry remained well capitalised and maintained capital levels well above
the minimum prudential requirements during 2017. The banking institutions displayed
healthy aggregate balance sheet growth, positive profitability and satisfactory liquidity
levels during the period under review. Given challenging economic conditions and
the associated shedding of jobs, disposable income has come under pressure,
resulting in a significant increase in the ratio of non-performing loans (NPLs). This
deterioration in asset quality however does not pose any immediate risk to banks as
they are adequately capitalised to offset this risk. Similarly, the non-bank financial
institutions (NBFIs) continued to be financially stable, sound, with growing assets, and
with no major risks. The payment system and infrastructure also continued to perform
efficiently and effectively, and with increasingly robust risk mitigating measures to
facilitate safe payments. House prices decelerated, however, with no threat to the
stability of the financial system. Household debt moderated marginally, while corporate
debt increased. Although both these ratios remained high when compared to those of
peer countries, the associated risks to financial stability remain minimal.
2 While still supportive of economic growth, global financial conditions have
tightened slightly. According to the IMF’s April 2018 Global Financial Stability Report
(GFSR), financial vulnerabilities which have accumulated during the years of very
low interest rates and volatility could put financial stability and economic growth at
risk. Going forward, easy financial conditions may further contribute to the build-up
of financial fragilities as well as increasing risk to the global financial stability and
economic growth over the short and medium-term. Although greater risk taking by
financial intermediaries is part of a healthy economic recovery, it may breed vulnerabilities
that could harm future growth if excessive, particularly when investors go over and
beyond risk tolerance into riskier instruments. In this regard, continued monitoring and
heightened vigilance is therefore essential.
Namibia Financial Stability Report - April 2018 2Page
3 Global growth, strengthened in 2017, supported by improved demand in
Advanced Economies (AEs) and the recovery of some Emerging Market and
Developing Economies (EMDEs) as well as strengthened economic activity in
Sub-Saharan Africa. Economic growth in the US improved on the back of strong
business investment, while the resilience of the growth momentum in the Euro Area
and Japan was underpinned by robust private consumption, investment and external
demand. EMDEs such as Brazil, Russia and Nigeria recovered significantly, which was
ascribed to growth in trade and investment, while growth in China remained healthy
owing to policy support, strong external demand, and progress in domestic reforms.
Growth in Sub-Saharan Africa improved mainly due to the Angolan, Nigerian and South
African economies.
4 The global economy is projected to expand further in 2018. According to the IMF’s
April 2018 World Economic Outlook (WEO), global output is estimated to increase
by 0.1 percentage point to 3.9 percent in 2018. The projected improvement in global
output is expected to emanate mainly from a marginally higher growth projected for
EMDEs and steady growth in AEs on account of strong sentiment and favourable
global financial conditions, which is expected to boost demand. Economic activity
in Sub-Saharan Africa is also expected to pick up. Generally, the upturn in global
economic activity is expected to continue in 2018.
5 The domestic economy contracted in 2017, compared to 2016. Real GDP in Namibia
is estimated to have contracted by 0.8 percent in 2017, from a positive growth of 0.7
percent in 2016, due to declines in construction, wholesale and retail trade and the
public sector. Growth is projected to improve steadily to 1.4 percent in 2018; however,
the risks to the domestic outlook remain pronounced, primarily due to persistently low
uranium prices and unpredictable rainfall that is expected to affect the performance of
the agricultural sector. The slowdown in the economy in 2017 has contributed to the
shedding of jobs in various sectors of the economy, thereby resulting in the increase
in NPL ratios as household income became constrained. Going forward however,
the relative improvement in economic growth is expected to contribute positively to
financial stability in Namibia.
6 While the level of household indebtedness moderated slightly, corporate debt grew
during the period under review. Household debt to disposable income moderated
Namibia Financial Stability Report - April 2018 3Page
from 84.1 percent in 2016 to 83.3 percent in 2017, in line with the slower growth in total
credit extended in 2017. In contrast, total corporate sector debt grew by 12.7 percent
in 2017, compared to 9.8 percent in 2016. The growth in the corporate debt stock
was attributed to a higher increase in foreign debt, compared to domestic debt to the
private sector. Foreign private sector debt grew by 20.3 percent as a result of base
effects attributed to the restructuring of debt to equity by some mining companies in
2016. Despite that the risks emanating from both the household debt and corporate
debt sectors remained well contained, that is, with no immediate threat to financial
stability. Continuous monitoring is nonetheless required.
7 Overall house price inflation for residential properties, though positive over
the last 5 years, continued to decelerate in 2017. With the economy sluggish and
grinding into recession in 2017 and the associated shedding of jobs, disposable income
remained under significant pressure. These macroeconomic challenges continued to
weigh on the Namibian housing market as annual house price inflation decelerated
to 4.0 percent in December 2017, in contrast to 5.4 percent during the same period
in 2016. The moderation in the housing market may however not pose a threat to
the stability of the financial system even if prices were to continue slowing, given
the sustained demand and a relatively smaller proportion of non-primary residential
properties.
8 Since the last FSR, the performance of the Namibian banking sector has been
sound, although the asset quality deteriorated. The banking industry remained
adequately capitalised and maintained capital positions well above the minimum
prudential requirements during 2017. The banking institutions’ assets continued to
grow, although the non-performing loans (NPLs) ratio which is the key measure of the
asset quality deteriorated significantly to 2.5 percent at the end of December 2017, up
from 1.5 percent during the same period in 2016.
9 The NBFI industry remained financially stable and sound and continued to grow
its assets, despite recessionary economic conditions in the domestic economy.
The NBFI asset base grew by 18.0 percent in 2017, driven mainly by a general increase
in investment income due to buoyant financial markets and thus improved market
returns during the period under review. Going forward, concentration risk within NBFIs
however needs to be monitored.
Namibia Financial Stability Report - April 2018 4Page
10 The payments system and infrastructure continued to perform efficiently and
effectively, and with increasingly robust risk mitigating measures to facilitate safe
payments. During the period under review, key payment systems and infrastructures
remained broadly available with no major disruptions or disorderly functioning that
may compromise the provision of key financial services that support the economy. The
Bank continued to fulfil its regulatory mandate as the overseer of the National Payment
System (NPS) in 2017, in line with the Payment Systems Management Act 18 of 2003,
as amended. Security efforts by the Bank and industry contributed to ensure that the
NPS and the broader financial sector remained stable, safe and secure, which in turn,
reinforced confidence in the financial system.
Namibia Financial Stability Report - April 2018 5Page
II. SUMMARY OF RISK ANALYSIS
This section presents a brief analysis of the main risks to the stability of the domestic
financial system. Consistent with sections III-VII of this Report, the analysis identifies risks
arising from: the external macroeconomic environment, trends in household and corporate
debt, and the domestic banking and non-banking institutions’ financial soundness
indicators, before concluding with an analysis of the payment and settlement system. The
risks are analysed and rated from low risk to high risk based on the probability of occurring
and the potential impact on financial stability in Namibia.
From a risk profile point of view, the key risk to Namibia’s financial system resulted
mainly from the country’s economic slowdown. Most risks to the financial system have
either remained low or unchanged with minimal potential impact on the financial system. Of
concern, however, is the sustained slowdown in the economy over the past 2 years, which
has the potential to reverse the current profiles of risks and increase vulnerability across the
board (Figure 1a). Although the slowdown in some of the economic activities could partly
be attributed to the fiscal consolidation efforts underway, the long-term objective of these
efforts are to restore and strengthen structural macroeconomic fundamentals, which could
aid the stability of the financial system in the medium to long run. Globally, growth which
has been gaining momentum, accompanied by improved commodity prices and favourable
financial conditions for the most part of 2017, has positively contributed to global financial
stability. Going forward, however, high levels of uncertainty in key markets may create
excessive volatility in financial markets, which can trigger a recession and/or slowdown and
potentially reverse or exacerbate the current profiles of the risks identified.
Namibia Financial Stability Report - April 2018 6Page
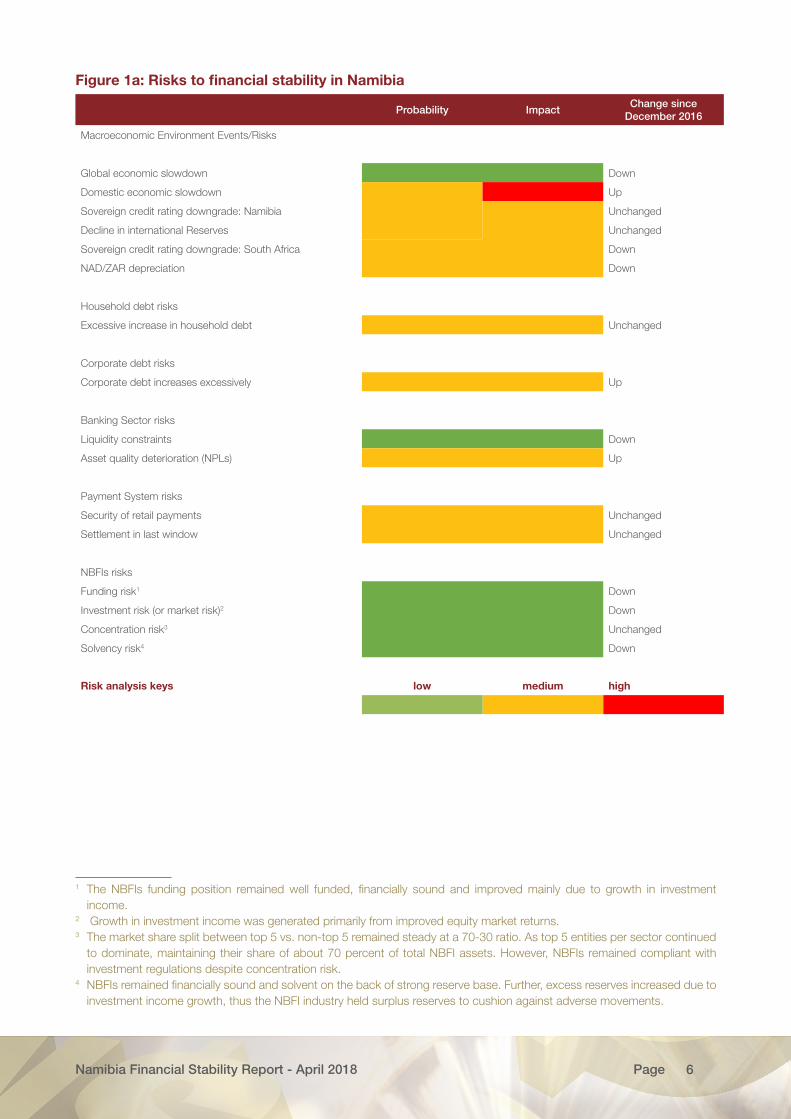
Figure 1a: Risks to financial stability in Namibia
Probability ImpactChange since
December 2016
Macroeconomic Environment Events/Risks
Global economic slowdown Down
Domestic economic slowdown Up
Sovereign credit rating downgrade: Namibia Unchanged
Decline in international Reserves Unchanged
Sovereign credit rating downgrade: South Africa Down
NAD/ZAR depreciation Down
Household debt risks
Excessive increase in household debt Unchanged
Corporate debt risks
Corporate debt increases excessively Up
Banking Sector risks
Liquidity constraints Down
Asset quality deterioration (NPLs) Up
Payment System risks
Security of retail payments Unchanged
Settlement in last window Unchanged
NBFIs risks
Funding risk1 Down
Investment risk (or market risk)2 Down
Concentration risk3 Unchanged
Solvency risk4 Down
Risk analysis keys low medium high
112
3
44
1 The NBFIs funding position remained well funded, financially sound and improved mainly due to growth in investment income.
2 Growth in investment income was generated primarily from improved equity market returns.3 The market share split between top 5 vs. non-top 5 remained steady at a 70-30 ratio. As top 5 entities per sector continued
to dominate, maintaining their share of about 70 percent of total NBFI assets. However, NBFIs remained compliant with investment regulations despite concentration risk.
4 NBFIs remained financially sound and solvent on the back of strong reserve base. Further, excess reserves increased due to investment income growth, thus the NBFI industry held surplus reserves to cushion against adverse movements.
Namibia Financial Stability Report - April 2018 7Page
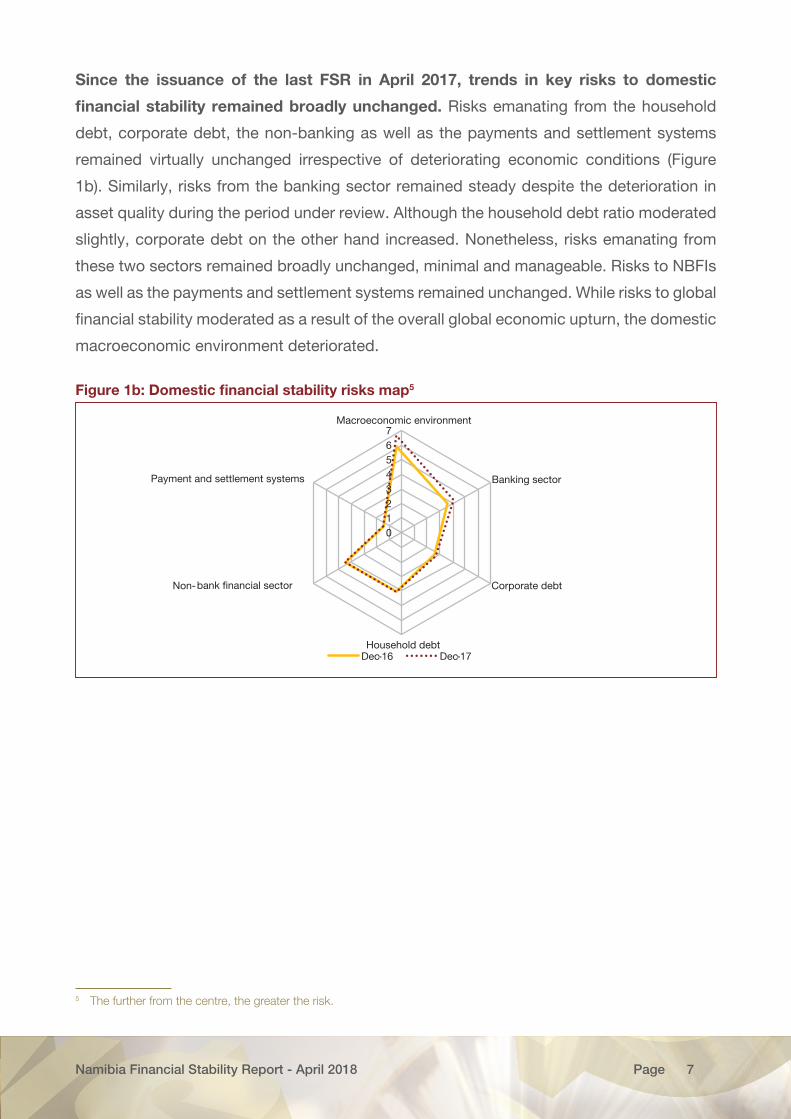
Since the issuance of the last FSR in April 2017, trends in key risks to domestic
financial stability remained broadly unchanged. Risks emanating from the household
debt, corporate debt, the non-banking as well as the payments and settlement systems
remained virtually unchanged irrespective of deteriorating economic conditions (Figure
1b). Similarly, risks from the banking sector remained steady despite the deterioration in
asset quality during the period under review. Although the household debt ratio moderated
slightly, corporate debt on the other hand increased. Nonetheless, risks emanating from
these two sectors remained broadly unchanged, minimal and manageable. Risks to NBFIs
as well as the payments and settlement systems remained unchanged. While risks to global
financial stability moderated as a result of the overall global economic upturn, the domestic
macroeconomic environment deteriorated.
Figure 1b: Domestic financial stability risks map5
01234567
Macroeconomic environment
Banking sector
Corporate debt
Household debt
Non-bank financial sector
Payment and settlement systems
Dec-16 Dec-17
5 The further from the centre, the greater the risk.
Namibia Financial Stability Report - April 2018 8Page
III. MACROECONOMIC ENVIRONMENT
Global Economic Growth
Global growth is estimated to have strengthened since the last Financial Stability
Report (FSR). According to the IMF’s April 2018 World Economic Outlook (WEO), the pace
of global output growth increased to 3.8 percent in 2017 from 3.2 percent in 2016, supported
by improvements in investment, trade and industrial production. The global growth for
2017 was broad-based reflecting enhanced activities in both Advanced Economies (AEs)
and Emerging Market and Developing Economies (EMDEs). In Advanced Economies,
real growth improved by 0.6 percentage point to 2.3 percent in 2017 driven by the US,
Eurozone and Japanese economies. Economic activity in some of the Emerging Market
and Developing Economies, in particular Russia, Brazil and Nigeria, registered notable
improvements.
GDP growth in AEs improved in 2017, owing to increased local and external demand,
reinforced by higher consumer and business confidence. Output and domestic
demand grew faster in 2017, compared to 2016. Economic growth in the US increased to
2.3 percent in 2017, from 1.5 percent in 2016, on the back of strong business investment
and a moderate recovery in the energy sector. Similarly, the growth momentum in the Euro
Area and Japan picked up in 2017 to 2.3 percent and 1.7 percent, up from 1.8 percent and
0.9 percent respectively in 2016, underpinned by robust private consumption, investment
and external demand. On the contrary, growth in the UK slowed to 1.8 percent from 1.9
percent over the same period due to subdued exports and a reduction in the growth rate
of the service sector.
EMDEs grew steadily driven by recoveries in some emerging market economies and
sustained growth in China and India. Key EMDEs, notably Brazil, Russia and Nigeria
recovered to record positive growth of 1.0, 1.5 and 0.8 percent in 2017 from the contractions
of 3.5, 0.2 and 1.6 percent, respectively in 2016, ascribed to growth in trade and investment.
Growth in China improved to 6.9 percent in 2017 from 6.7 percent in 2016, owing to policy
support, strong external demand, and progress in domestic reforms. In India growth also
remained strong at 6.7 percent, although it was down by 0.4 percentage point.
Namibia Financial Stability Report - April 2018 9Page
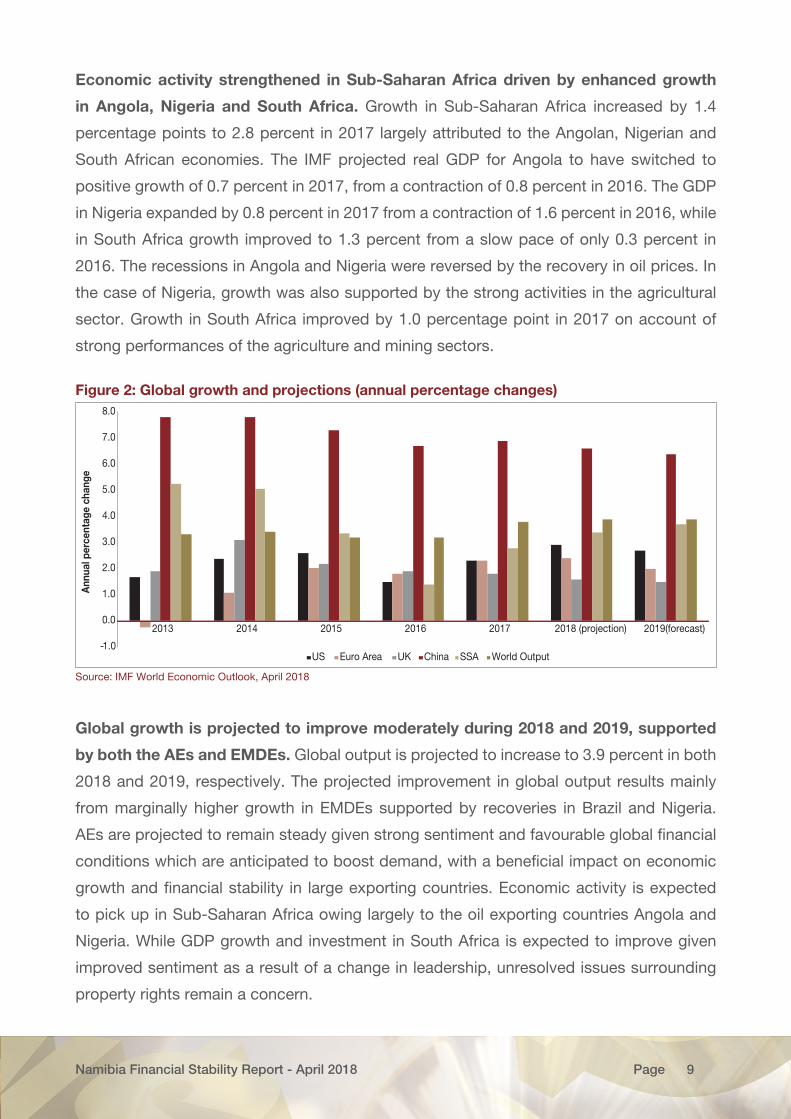
Economic activity strengthened in Sub-Saharan Africa driven by enhanced growth
in Angola, Nigeria and South Africa. Growth in Sub-Saharan Africa increased by 1.4
percentage points to 2.8 percent in 2017 largely attributed to the Angolan, Nigerian and
South African economies. The IMF projected real GDP for Angola to have switched to
positive growth of 0.7 percent in 2017, from a contraction of 0.8 percent in 2016. The GDP
in Nigeria expanded by 0.8 percent in 2017 from a contraction of 1.6 percent in 2016, while
in South Africa growth improved to 1.3 percent from a slow pace of only 0.3 percent in
2016. The recessions in Angola and Nigeria were reversed by the recovery in oil prices. In
the case of Nigeria, growth was also supported by the strong activities in the agricultural
sector. Growth in South Africa improved by 1.0 percentage point in 2017 on account of
strong performances of the agriculture and mining sectors.
Figure 2: Global growth and projections (annual percentage changes)
-1.0
0.0
1.0
2.0
3.0
4.0
5.0
6.0
7.0
8.0
2013 2014 2015 2016 2017 2018 (projection) 2019(forecast)
Ann
ual p
erce
ntag
e ch
ange
US Euro Area UK China SSA World Output
Source: IMF World Economic Outlook, April 2018
Global growth is projected to improve moderately during 2018 and 2019, supported
by both the AEs and EMDEs. Global output is projected to increase to 3.9 percent in both
2018 and 2019, respectively. The projected improvement in global output results mainly
from marginally higher growth in EMDEs supported by recoveries in Brazil and Nigeria.
AEs are projected to remain steady given strong sentiment and favourable global financial
conditions which are anticipated to boost demand, with a beneficial impact on economic
growth and financial stability in large exporting countries. Economic activity is expected
to pick up in Sub-Saharan Africa owing largely to the oil exporting countries Angola and
Nigeria. While GDP growth and investment in South Africa is expected to improve given
improved sentiment as a result of a change in leadership, unresolved issues surrounding
property rights remain a concern.
Namibia Financial Stability Report - April 2018 10Page
Risks to global growth are broadly balanced. On the upside, a rebound could prove
stronger as the increase in activity and relatively easy financial conditions reinforce each
other. On the downside, asset valuations and compressed term premiums elevate the
possibility of a financial market correction, which could dampen growth and confidence.
A possible trigger is a faster-than-expected increase in AEs’ core inflation and interest
rates as demand accelerates. If global sentiment remains strong and inflation muted, then
financial conditions could remain expansionary into the medium term, leading to a buildup
of financial vulnerabilities in AEs and EMDEs alike. Inward-looking policies, geopolitical
tensions, and political uncertainty in some countries also pose downside risks.
Developments in the Financial Markets
Advanced Economies
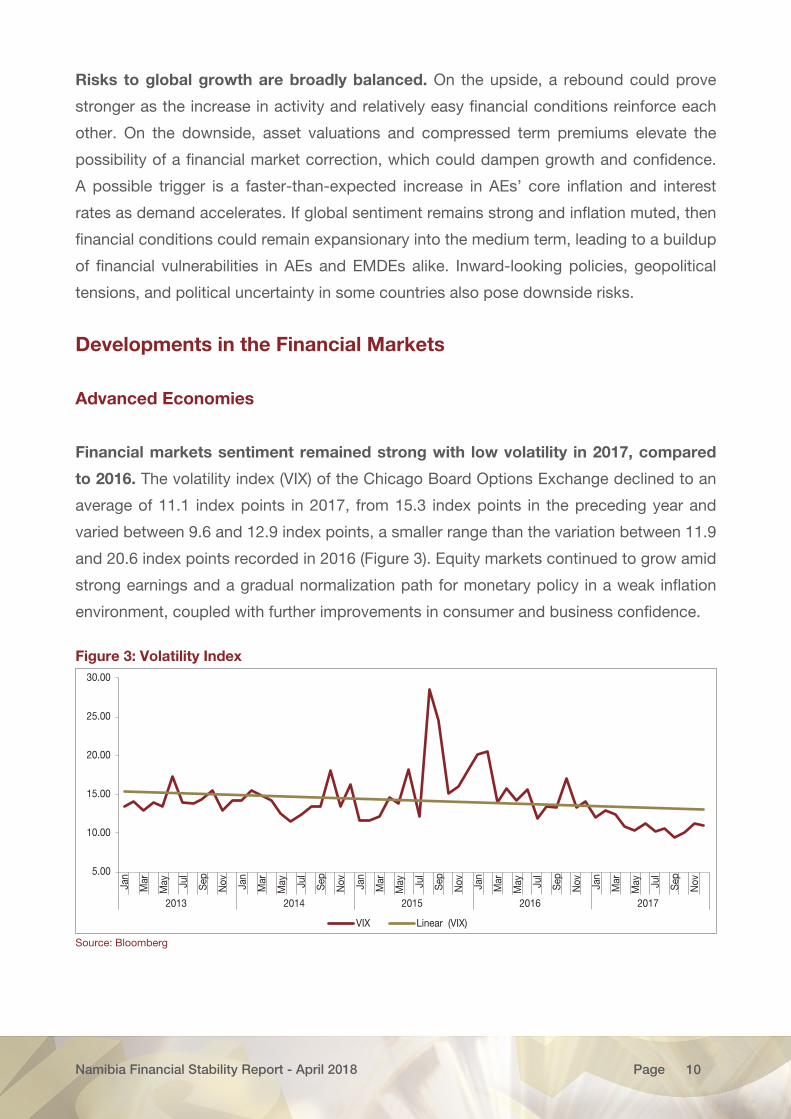
Financial markets sentiment remained strong with low volatility in 2017, compared
to 2016. The volatility index (VIX) of the Chicago Board Options Exchange declined to an
average of 11.1 index points in 2017, from 15.3 index points in the preceding year and
varied between 9.6 and 12.9 index points, a smaller range than the variation between 11.9
and 20.6 index points recorded in 2016 (Figure 3). Equity markets continued to grow amid
strong earnings and a gradual normalization path for monetary policy in a weak inflation
environment, coupled with further improvements in consumer and business confidence.
Figure 3: Volatility Index
5.00
10.00
15.00
20.00
25.00
30.00
Jan
Mar
May Ju
l
Sep
Nov Ja
n
Mar
May Ju
l
Sep
Nov Ja
n
Mar
May Ju
l
Sep
Nov Ja
n
Mar
May Ju
l
Sep
Nov Ja
n
Mar
May Ju
l
Sep
Nov
2013 2014 2015 2016 2017
VIX Linear (VIX)
Source: Bloomberg
Namibia Financial Stability Report - April 2018 11Page
The fixed income market was characterized by a mixed performance during the
period under review. The yield on 10-year US Treasury bonds declined by 20 basis points,
in line with markets pricing in a more gradual than initially expected normalization of the US
monetary policy and diminished fiscal stimulus expectations. Long-term sovereign bond
yields rose by about 10 basis points in the UK, while they remained stable in Germany and
Japan.
Emerging Market Economies
The performance of financial markets amongst EMDEs improved during 2017. The
major factors that contributed to enhanced performance in the period under review were
improved world trade volumes, increased oil prices and resilient capital flows to EMDEs.
During 2017 capital flow recovery continued and remained resilient after a significant decline
at the end of 2015 and the beginning of 2016. This was reflective of an increase in capital
flows to China and a robust global recovery in nonresident portfolio inflows in the first two
quarters of 2017 on the back of improved investors’ optimism with regard to the global
economic outlook as well as relatively easy financial conditions. EMDE currencies generally
strengthened relative to the US dollar, as investors’ search for yields continued. This search
for yields has led to greater capital flows to low-income countries, where enhanced policy
buffers in the form of higher international reserves can be beneficial for financial stability,
but can also be a risk when sentiment turns around.
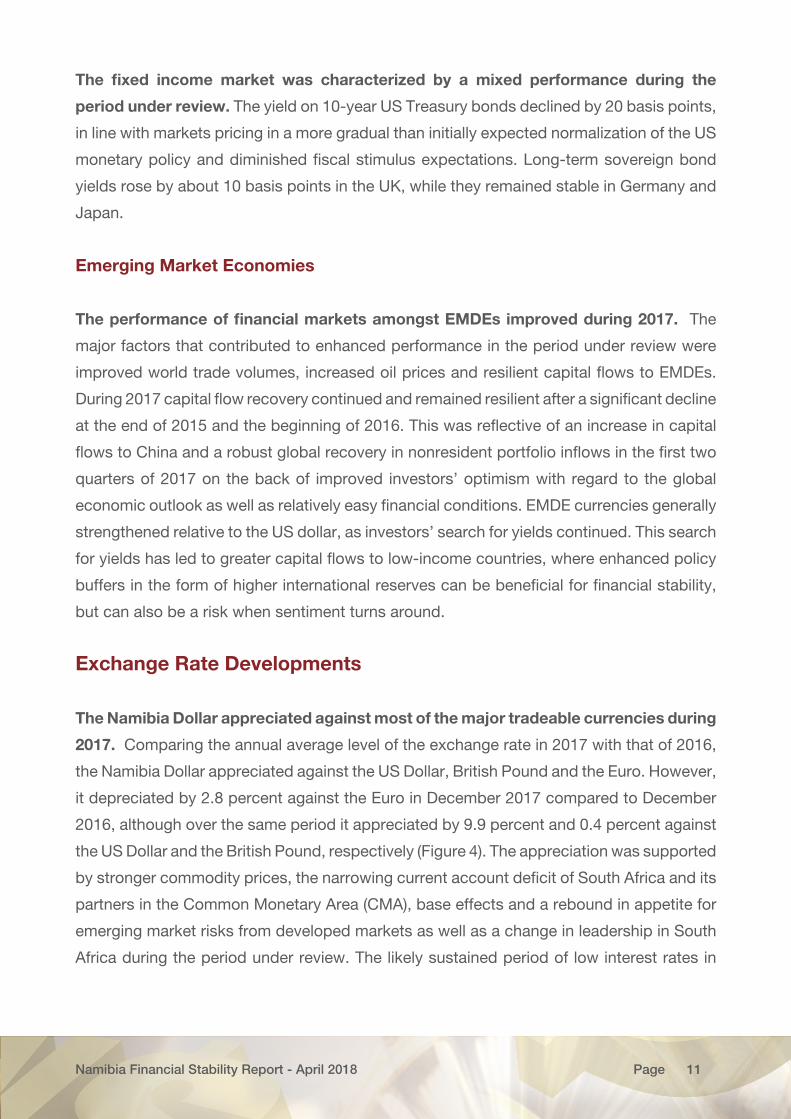
Exchange Rate Developments
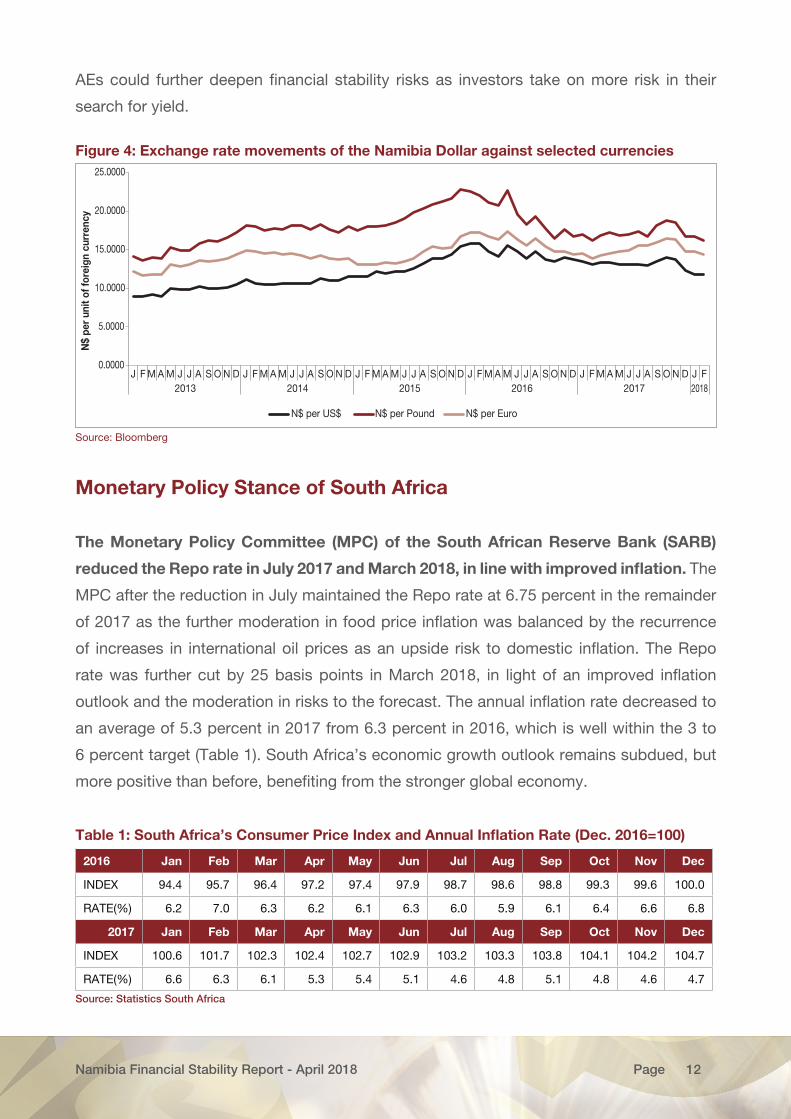
The Namibia Dollar appreciated against most of the major tradeable currencies during
2017. Comparing the annual average level of the exchange rate in 2017 with that of 2016,
the Namibia Dollar appreciated against the US Dollar, British Pound and the Euro. However,
it depreciated by 2.8 percent against the Euro in December 2017 compared to December
2016, although over the same period it appreciated by 9.9 percent and 0.4 percent against
the US Dollar and the British Pound, respectively (Figure 4). The appreciation was supported
by stronger commodity prices, the narrowing current account deficit of South Africa and its
partners in the Common Monetary Area (CMA), base effects and a rebound in appetite for
emerging market risks from developed markets as well as a change in leadership in South
Africa during the period under review. The likely sustained period of low interest rates in
Namibia Financial Stability Report - April 2018 12Page
AEs could further deepen financial stability risks as investors take on more risk in their
search for yield.
Figure 4: Exchange rate movements of the Namibia Dollar against selected currencies
0.0000
5.0000
10.0000
15.0000
20.0000
25.0000
J F M A M J J A S O N D J F M A M J J A S O N D J F M A M J J A S O N D J F M A M J J A S O N D J F M A M J J A S O N D J F2013 2014 2015 2016 2017 2018
N$
per
unit
of fo
reig
n cu
rren
cy
N$ per US$ N$ per Pound N$ per Euro
Source: Bloomberg
Monetary Policy Stance of South Africa
The Monetary Policy Committee (MPC) of the South African Reserve Bank (SARB)
reduced the Repo rate in July 2017 and March 2018, in line with improved inflation. The
MPC after the reduction in July maintained the Repo rate at 6.75 percent in the remainder
of 2017 as the further moderation in food price inflation was balanced by the recurrence
of increases in international oil prices as an upside risk to domestic inflation. The Repo
rate was further cut by 25 basis points in March 2018, in light of an improved inflation
outlook and the moderation in risks to the forecast. The annual inflation rate decreased to
an average of 5.3 percent in 2017 from 6.3 percent in 2016, which is well within the 3 to
6 percent target (Table 1). South Africa’s economic growth outlook remains subdued, but
more positive than before, benefiting from the stronger global economy.
Table 1: South Africa’s Consumer Price Index and Annual Inflation Rate (Dec. 2016=100)
2016 Jan Feb Mar Apr May Jun Jul Aug Sep Oct Nov Dec
INDEX 94.4 95.7 96.4 97.2 97.4 97.9 98.7 98.6 98.8 99.3 99.6 100.0
RATE(%) 6.2 7.0 6.3 6.2 6.1 6.3 6.0 5.9 6.1 6.4 6.6 6.8
2017 Jan Feb Mar Apr May Jun Jul Aug Sep Oct Nov Dec
INDEX 100.6 101.7 102.3 102.4 102.7 102.9 103.2 103.3 103.8 104.1 104.2 104.7
RATE(%) 6.6 6.3 6.1 5.3 5.4 5.1 4.6 4.8 5.1 4.8 4.6 4.7
Source: Statistics South Africa
Namibia Financial Stability Report - April 2018 13Page
The outlook for the monetary policy stance of the South African Reserve Bank (SARB)
remains a key factor to financial stability in Namibia. The dynamics that will inform
the policy stance entails amongst others the inflation outlook, the path of the exchange
rate of the Rand against major currencies and fiscal consolidation which could potentially
improve the scope for further monetary policy accommodation. Adverse developments in
these variables could induce the SARB to adjust the repo rate upwards which could result
in the Bank of Namibia following suit, exerting pressure on highly exposed corporate and
individual borrowers and financial stability in the country.
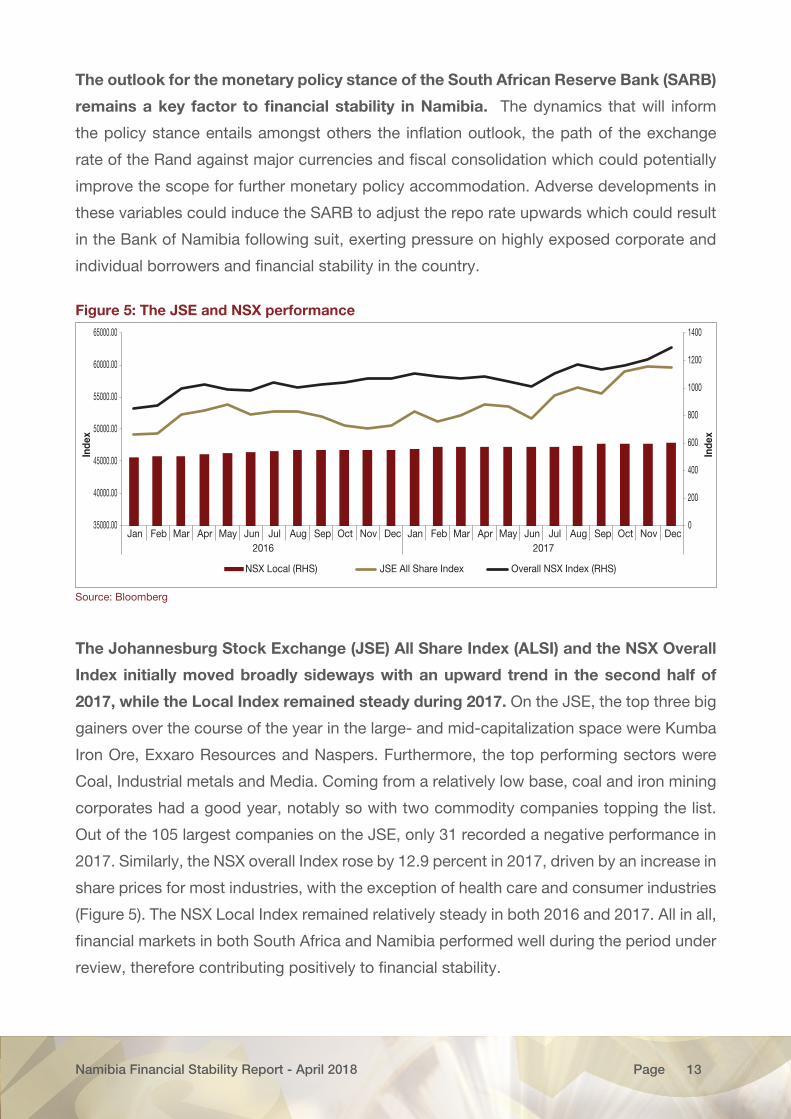
Figure 5: The JSE and NSX performance
0
200
400
600
800
1000
1200
1400
35000.00
40000.00
45000.00
50000.00
55000.00
60000.00
65000.00
Jan Feb Mar Apr May Jun Jul Aug Sep Oct Nov Dec Jan Feb Mar Apr May Jun Jul Aug Sep Oct Nov Dec2016 2017
Inde
x
Inde
x
NSX Local (RHS) JSE All Share Index Overall NSX Index (RHS)
Source: Bloomberg
The Johannesburg Stock Exchange (JSE) All Share Index (ALSI) and the NSX Overall
Index initially moved broadly sideways with an upward trend in the second half of
2017, while the Local Index remained steady during 2017. On the JSE, the top three big
gainers over the course of the year in the large- and mid-capitalization space were Kumba
Iron Ore, Exxaro Resources and Naspers. Furthermore, the top performing sectors were
Coal, Industrial metals and Media. Coming from a relatively low base, coal and iron mining
corporates had a good year, notably so with two commodity companies topping the list.
Out of the 105 largest companies on the JSE, only 31 recorded a negative performance in
2017. Similarly, the NSX overall Index rose by 12.9 percent in 2017, driven by an increase in
share prices for most industries, with the exception of health care and consumer industries
(Figure 5). The NSX Local Index remained relatively steady in both 2016 and 2017. All in all,
financial markets in both South Africa and Namibia performed well during the period under
review, therefore contributing positively to financial stability.
Namibia Financial Stability Report - April 2018 14Page
Domestic Economy
Output and Inflation
The domestic economy is estimated to have contracted and inflation declined during
2017. Real GDP in Namibia is estimated to have contracted by 0.8 percent in 2017 from a
positive growth of 0.7 percent in 2016, mainly driven by negative growth rates in construction,
wholesale and retail trade and the public sector. Other sectors such as manufacturing,
electricity and water, transport and communication slowed. Growth is projected to
improve steadily to 1.4 percent in 2018; however, the risks to the domestic outlook remain
pronounced, primarily due to persistently low uranium prices and unpredictable rainfall
that may affect the performance of the agricultural sector. The medium term growth is
expected to be supported by developments in the primary sector as well as the transport
and communication sectors. Annual average inflation fell to 6.2 percent in 2017 from 6.7
percent in 2016, with an inflation rate of 5.2 percent in December 2017. The slowdown in
2017 was caused by all the categories within the NCPI, with the exception of Education,
Transport and Health. Food inflation, in particular, slowed considerably in the wake of
improved agricultural conditions and a stronger exchange rate.
Namibia Financial Stability Report - April 2018 15Page
IV. DOMESTIC HOUSEHOLD AND CORPORATE DEBT INDICATORS
Household Debt to Disposable Income
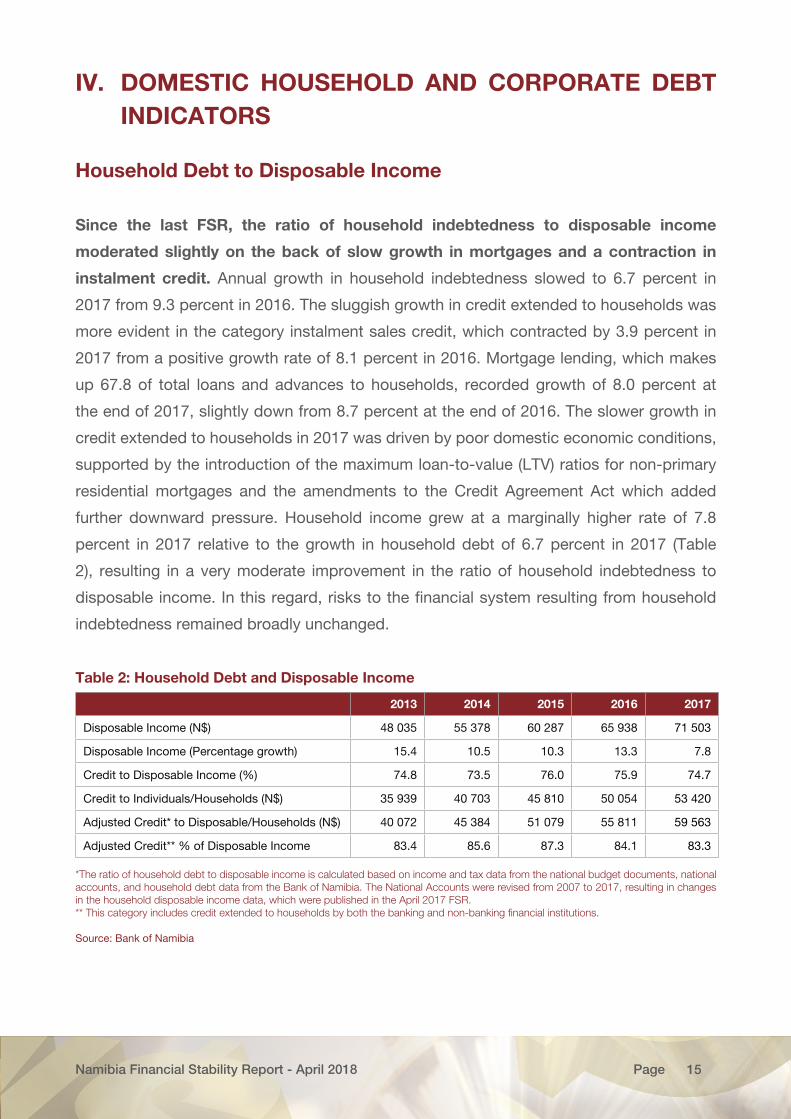
Since the last FSR, the ratio of household indebtedness to disposable income
moderated slightly on the back of slow growth in mortgages and a contraction in
instalment credit. Annual growth in household indebtedness slowed to 6.7 percent in
2017 from 9.3 percent in 2016. The sluggish growth in credit extended to households was
more evident in the category instalment sales credit, which contracted by 3.9 percent in
2017 from a positive growth rate of 8.1 percent in 2016. Mortgage lending, which makes
up 67.8 of total loans and advances to households, recorded growth of 8.0 percent at
the end of 2017, slightly down from 8.7 percent at the end of 2016. The slower growth in
credit extended to households in 2017 was driven by poor domestic economic conditions,
supported by the introduction of the maximum loan-to-value (LTV) ratios for non-primary
residential mortgages and the amendments to the Credit Agreement Act which added
further downward pressure. Household income grew at a marginally higher rate of 7.8
percent in 2017 relative to the growth in household debt of 6.7 percent in 2017 (Table
2), resulting in a very moderate improvement in the ratio of household indebtedness to
disposable income. In this regard, risks to the financial system resulting from household
indebtedness remained broadly unchanged.
Table 2: Household Debt and Disposable Income
2013 2014 2015 2016 2017
Disposable Income (N$) 48 035 55 378 60 287 65 938 71 503
Disposable Income (Percentage growth) 15.4 10.5 10.3 13.3 7.8
Credit to Disposable Income (%) 74.8 73.5 76.0 75.9 74.7
Credit to Individuals/Households (N$) 35 939 40 703 45 810 50 054 53 420
Adjusted Credit* to Disposable/Households (N$) 40 072 45 384 51 079 55 811 59 563
Adjusted Credit** % of Disposable Income 83.4 85.6 87.3 84.1 83.3
*The ratio of household debt to disposable income is calculated based on income and tax data from the national budget documents, national accounts, and household debt data from the Bank of Namibia. The National Accounts were revised from 2007 to 2017, resulting in changes in the household disposable income data, which were published in the April 2017 FSR. ** This category includes credit extended to households by both the banking and non-banking financial institutions.
Source: Bank of Namibia
Namibia Financial Stability Report - April 2018 16Page
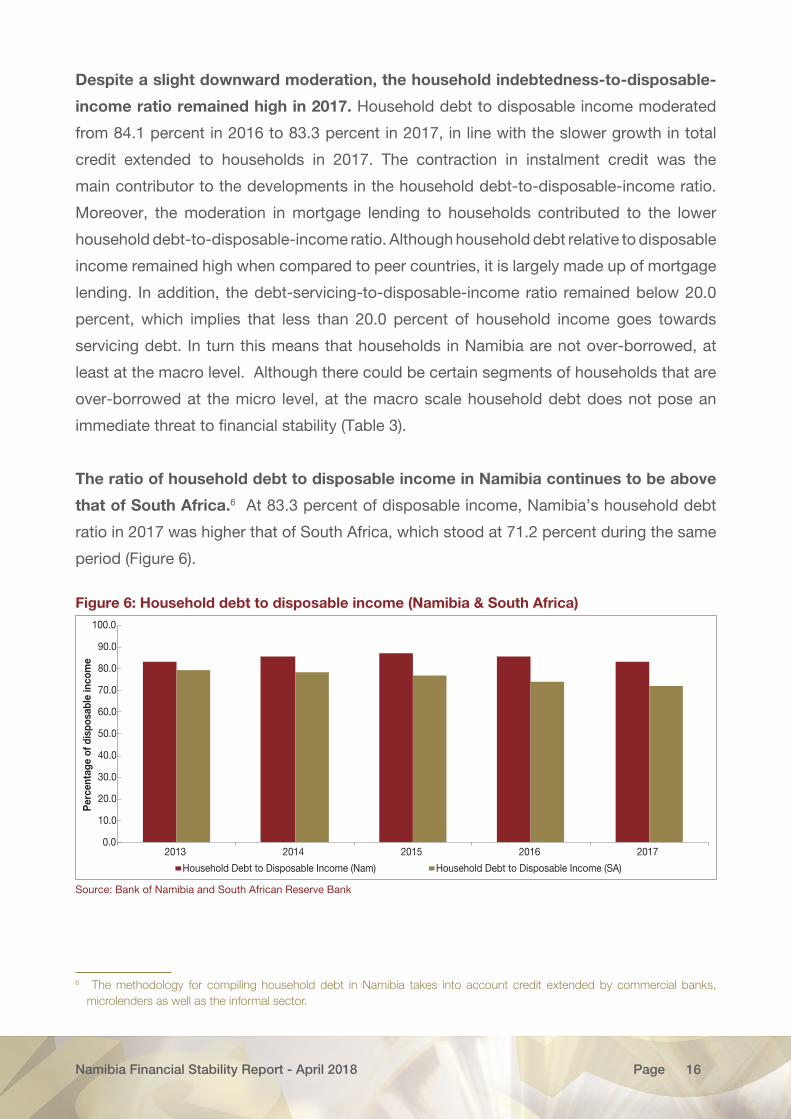
Despite a slight downward moderation, the household indebtedness-to-disposable-
income ratio remained high in 2017. Household debt to disposable income moderated
from 84.1 percent in 2016 to 83.3 percent in 2017, in line with the slower growth in total
credit extended to households in 2017. The contraction in instalment credit was the
main contributor to the developments in the household debt-to-disposable-income ratio.
Moreover, the moderation in mortgage lending to households contributed to the lower
household debt-to-disposable-income ratio. Although household debt relative to disposable
income remained high when compared to peer countries, it is largely made up of mortgage
lending. In addition, the debt-servicing-to-disposable-income ratio remained below 20.0
percent, which implies that less than 20.0 percent of household income goes towards
servicing debt. In turn this means that households in Namibia are not over-borrowed, at
least at the macro level. Although there could be certain segments of households that are
over-borrowed at the micro level, at the macro scale household debt does not pose an
immediate threat to financial stability (Table 3).
The ratio of household debt to disposable income in Namibia continues to be above
that of South Africa.6 At 83.3 percent of disposable income, Namibia’s household debt
ratio in 2017 was higher that of South Africa, which stood at 71.2 percent during the same
period (Figure 6).
Figure 6: Household debt to disposable income (Namibia & South Africa)
0.0
10.0
20.0
30.0
40.0
50.0
60.0
70.0
80.0
90.0
100.0
2013 2014 2015 2016 2017
Per
cent
age
of d
ispo
sabl
e in
com
e
Household Debt to Disposable Income (Nam) Household Debt to Disposable Income (SA)
Source: Bank of Namibia and South African Reserve Bank
6 The methodology for compiling household debt in Namibia takes into account credit extended by commercial banks, microlenders as well as the informal sector.
Namibia Financial Stability Report - April 2018 17Page
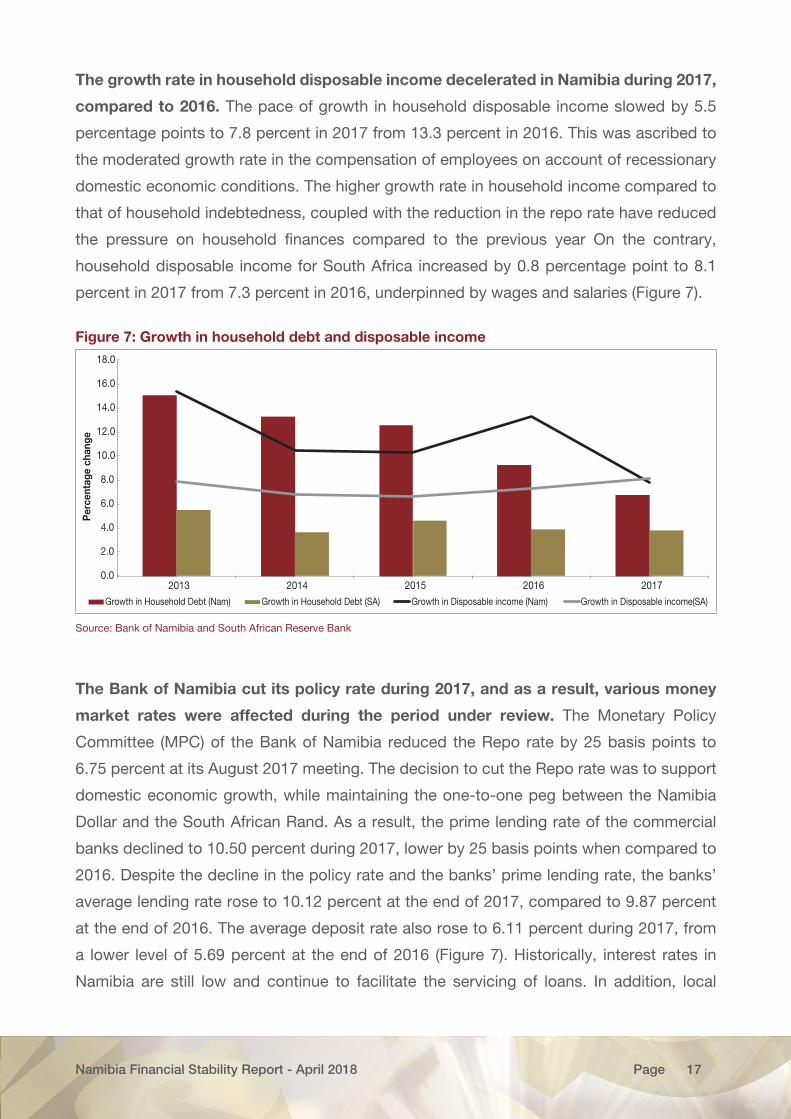
The growth rate in household disposable income decelerated in Namibia during 2017,
compared to 2016. The pace of growth in household disposable income slowed by 5.5
percentage points to 7.8 percent in 2017 from 13.3 percent in 2016. This was ascribed to
the moderated growth rate in the compensation of employees on account of recessionary
domestic economic conditions. The higher growth rate in household income compared to
that of household indebtedness, coupled with the reduction in the repo rate have reduced
the pressure on household finances compared to the previous year On the contrary,
household disposable income for South Africa increased by 0.8 percentage point to 8.1
percent in 2017 from 7.3 percent in 2016, underpinned by wages and salaries (Figure 7).
Figure 7: Growth in household debt and disposable income
0.0
2.0
4.0
6.0
8.0
10.0
12.0
14.0
16.0
18.0
2013 2014 2015 2016 2017
Per
cent
age
chan
ge
Growth in Household Debt (Nam) Growth in Household Debt (SA) Growth in Disposable income (Nam) Growth in Disposable income(SA)
Source: Bank of Namibia and South African Reserve Bank
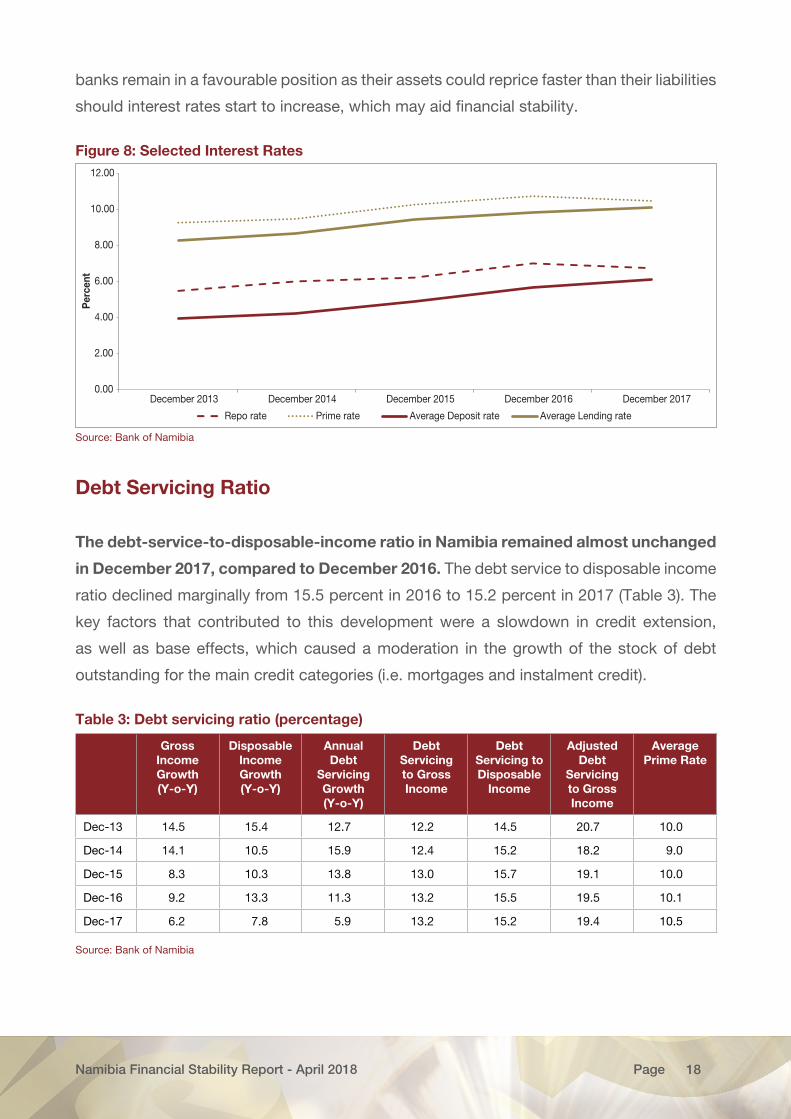
The Bank of Namibia cut its policy rate during 2017, and as a result, various money
market rates were affected during the period under review. The Monetary Policy
Committee (MPC) of the Bank of Namibia reduced the Repo rate by 25 basis points to
6.75 percent at its August 2017 meeting. The decision to cut the Repo rate was to support
domestic economic growth, while maintaining the one-to-one peg between the Namibia
Dollar and the South African Rand. As a result, the prime lending rate of the commercial
banks declined to 10.50 percent during 2017, lower by 25 basis points when compared to
2016. Despite the decline in the policy rate and the banks’ prime lending rate, the banks’
average lending rate rose to 10.12 percent at the end of 2017, compared to 9.87 percent
at the end of 2016. The average deposit rate also rose to 6.11 percent during 2017, from
a lower level of 5.69 percent at the end of 2016 (Figure 7). Historically, interest rates in
Namibia are still low and continue to facilitate the servicing of loans. In addition, local
Namibia Financial Stability Report - April 2018 18Page
banks remain in a favourable position as their assets could reprice faster than their liabilities
should interest rates start to increase, which may aid financial stability.
Figure 8: Selected Interest Rates
0.00
2.00
4.00
6.00
8.00
10.00
12.00
December 2013 December 2014 December 2015 December 2016 December 2017
Per
cent
Repo rate Prime rate Average Deposit rate Average Lending rate
Source: Bank of Namibia
Debt Servicing Ratio
The debt-service-to-disposable-income ratio in Namibia remained almost unchanged
in December 2017, compared to December 2016. The debt service to disposable income
ratio declined marginally from 15.5 percent in 2016 to 15.2 percent in 2017 (Table 3). The
key factors that contributed to this development were a slowdown in credit extension,
as well as base effects, which caused a moderation in the growth of the stock of debt
outstanding for the main credit categories (i.e. mortgages and instalment credit).
Table 3: Debt servicing ratio (percentage)
Gross Income Growth (Y-o-Y)
Disposable Income Growth (Y-o-Y)
Annual Debt
Servicing Growth (Y-o-Y)
Debt Servicing to Gross Income
Debt Servicing to Disposable
Income
Adjusted Debt
Servicing to Gross Income
Average Prime Rate
Dec-13 14.5 15.4 12.7 12.2 14.5 20.7 10.0
Dec-14 14.1 10.5 15.9 12.4 15.2 18.2 9.0
Dec-15 8.3 10.3 13.8 13.0 15.7 19.1 10.0
Dec-16 9.2 13.3 11.3 13.2 15.5 19.5 10.1
Dec-17 6.2 7.8 5.9 13.2 15.2 19.4 10.5
Source: Bank of Namibia
Namibia Financial Stability Report - April 2018 19Page
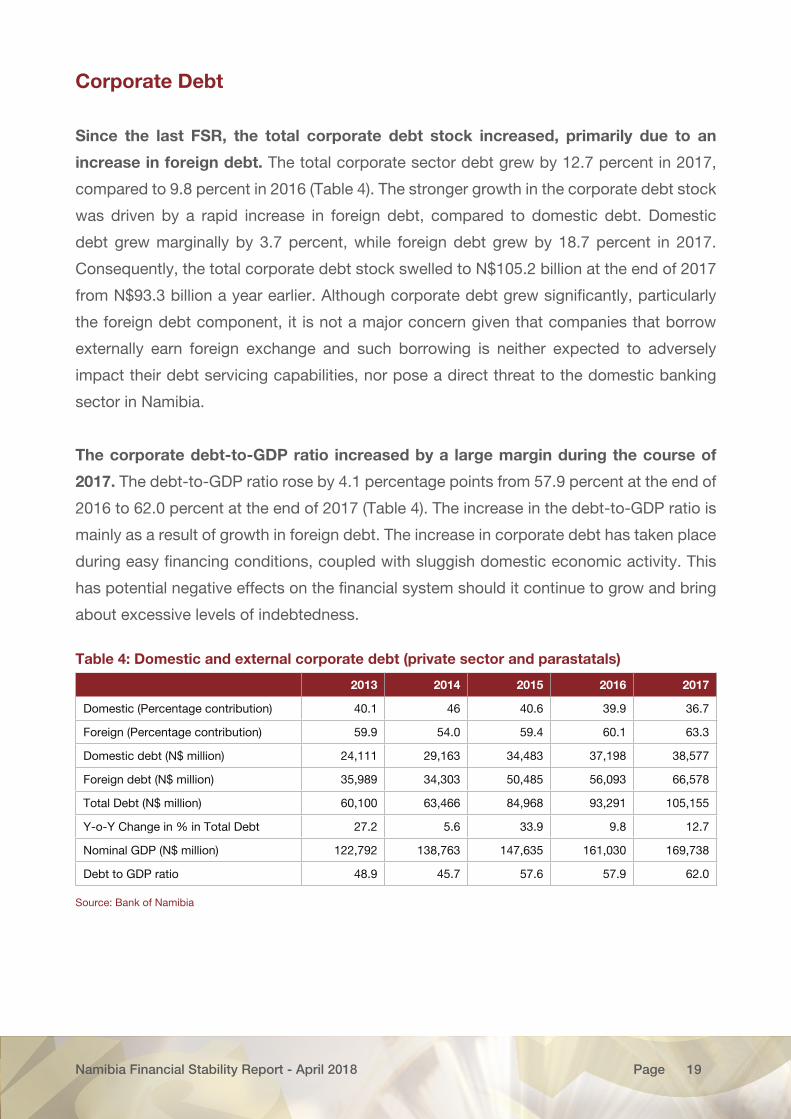
Corporate Debt
Since the last FSR, the total corporate debt stock increased, primarily due to an
increase in foreign debt. The total corporate sector debt grew by 12.7 percent in 2017,
compared to 9.8 percent in 2016 (Table 4). The stronger growth in the corporate debt stock
was driven by a rapid increase in foreign debt, compared to domestic debt. Domestic
debt grew marginally by 3.7 percent, while foreign debt grew by 18.7 percent in 2017.
Consequently, the total corporate debt stock swelled to N$105.2 billion at the end of 2017
from N$93.3 billion a year earlier. Although corporate debt grew significantly, particularly
the foreign debt component, it is not a major concern given that companies that borrow
externally earn foreign exchange and such borrowing is neither expected to adversely
impact their debt servicing capabilities, nor pose a direct threat to the domestic banking
sector in Namibia.
The corporate debt-to-GDP ratio increased by a large margin during the course of
2017. The debt-to-GDP ratio rose by 4.1 percentage points from 57.9 percent at the end of
2016 to 62.0 percent at the end of 2017 (Table 4). The increase in the debt-to-GDP ratio is
mainly as a result of growth in foreign debt. The increase in corporate debt has taken place
during easy financing conditions, coupled with sluggish domestic economic activity. This
has potential negative effects on the financial system should it continue to grow and bring
about excessive levels of indebtedness.
Table 4: Domestic and external corporate debt (private sector and parastatals)
2013 2014 2015 2016 2017
Domestic (Percentage contribution) 40.1 46 40.6 39.9 36.7
Foreign (Percentage contribution) 59.9 54.0 59.4 60.1 63.3
Domestic debt (N$ million) 24,111 29,163 34,483 37,198 38,577
Foreign debt (N$ million) 35,989 34,303 50,485 56,093 66,578
Total Debt (N$ million) 60,100 63,466 84,968 93,291 105,155
Y-o-Y Change in % in Total Debt 27.2 5.6 33.9 9.8 12.7
Nominal GDP (N$ million) 122,792 138,763 147,635 161,030 169,738
Debt to GDP ratio 48.9 45.7 57.6 57.9 62.0
Source: Bank of Namibia
Namibia Financial Stability Report - April 2018 20Page
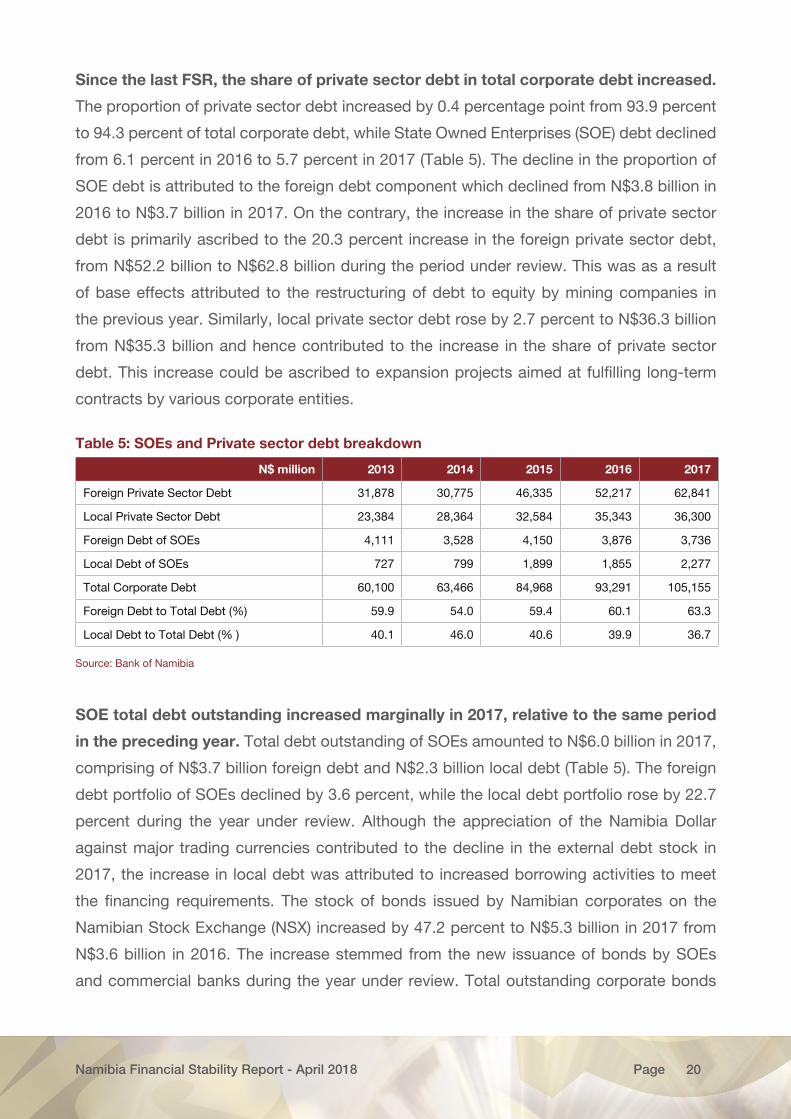
Since the last FSR, the share of private sector debt in total corporate debt increased.
The proportion of private sector debt increased by 0.4 percentage point from 93.9 percent
to 94.3 percent of total corporate debt, while State Owned Enterprises (SOE) debt declined
from 6.1 percent in 2016 to 5.7 percent in 2017 (Table 5). The decline in the proportion of
SOE debt is attributed to the foreign debt component which declined from N$3.8 billion in
2016 to N$3.7 billion in 2017. On the contrary, the increase in the share of private sector
debt is primarily ascribed to the 20.3 percent increase in the foreign private sector debt,
from N$52.2 billion to N$62.8 billion during the period under review. This was as a result
of base effects attributed to the restructuring of debt to equity by mining companies in
the previous year. Similarly, local private sector debt rose by 2.7 percent to N$36.3 billion
from N$35.3 billion and hence contributed to the increase in the share of private sector
debt. This increase could be ascribed to expansion projects aimed at fulfilling long-term
contracts by various corporate entities.
Table 5: SOEs and Private sector debt breakdown
N$ million 2013 2014 2015 2016 2017
Foreign Private Sector Debt 31,878 30,775 46,335 52,217 62,841
Local Private Sector Debt 23,384 28,364 32,584 35,343 36,300
Foreign Debt of SOEs 4,111 3,528 4,150 3,876 3,736
Local Debt of SOEs 727 799 1,899 1,855 2,277
Total Corporate Debt 60,100 63,466 84,968 93,291 105,155
Foreign Debt to Total Debt (%) 59.9 54.0 59.4 60.1 63.3
Local Debt to Total Debt (% ) 40.1 46.0 40.6 39.9 36.7
Source: Bank of Namibia
SOE total debt outstanding increased marginally in 2017, relative to the same period
in the preceding year. Total debt outstanding of SOEs amounted to N$6.0 billion in 2017,
comprising of N$3.7 billion foreign debt and N$2.3 billion local debt (Table 5). The foreign
debt portfolio of SOEs declined by 3.6 percent, while the local debt portfolio rose by 22.7
percent during the year under review. Although the appreciation of the Namibia Dollar
against major trading currencies contributed to the decline in the external debt stock in
2017, the increase in local debt was attributed to increased borrowing activities to meet
the financing requirements. The stock of bonds issued by Namibian corporates on the
Namibian Stock Exchange (NSX) increased by 47.2 percent to N$5.3 billion in 2017 from
N$3.6 billion in 2016. The increase stemmed from the new issuance of bonds by SOEs
and commercial banks during the year under review. Total outstanding corporate bonds
Namibia Financial Stability Report - April 2018 21Page
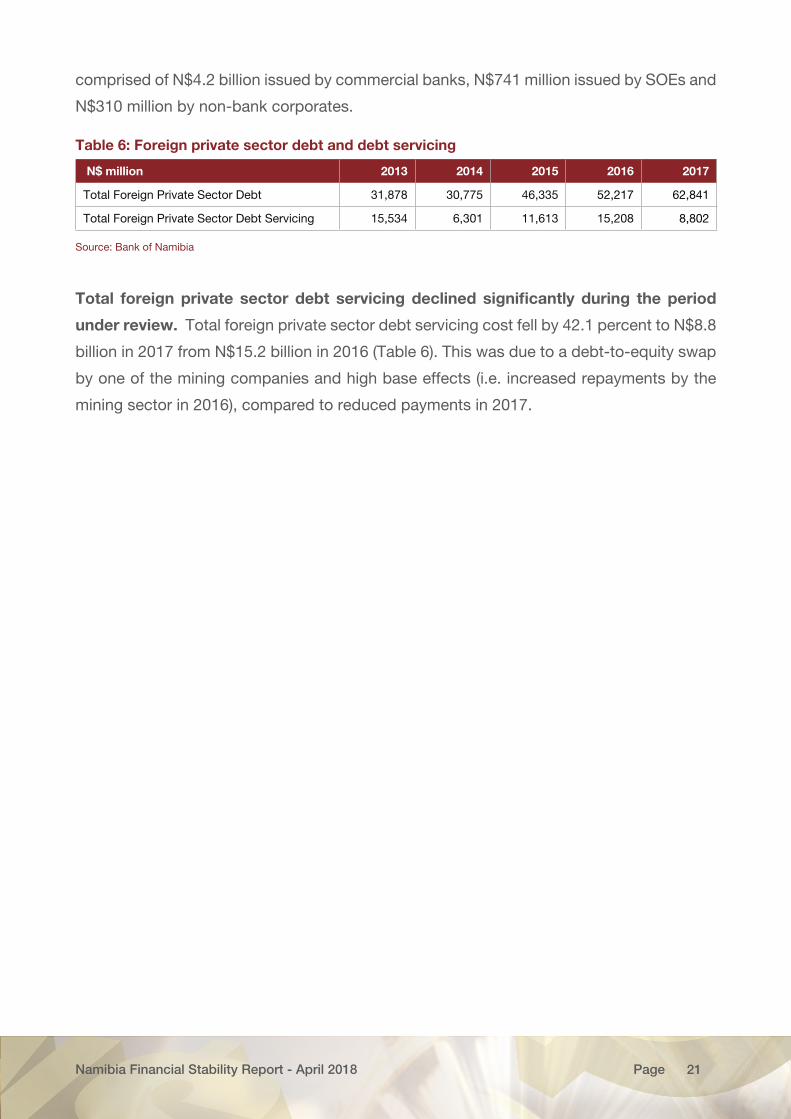
comprised of N$4.2 billion issued by commercial banks, N$741 million issued by SOEs and
N$310 million by non-bank corporates.
Table 6: Foreign private sector debt and debt servicing
N$ million 2013 2014 2015 2016 2017
Total Foreign Private Sector Debt 31,878 30,775 46,335 52,217 62,841
Total Foreign Private Sector Debt Servicing 15,534 6,301 11,613 15,208 8,802
Source: Bank of Namibia
Total foreign private sector debt servicing declined significantly during the period
under review. Total foreign private sector debt servicing cost fell by 42.1 percent to N$8.8
billion in 2017 from N$15.2 billion in 2016 (Table 6). This was due to a debt-to-equity swap
by one of the mining companies and high base effects (i.e. increased repayments by the
mining sector in 2016), compared to reduced payments in 2017.
Namibia Financial Stability Report - April 2018 22Page
BOX 1: IMPACT OF EXCESSIVE HOUSEHOLD INDEBTEDNESS ON
FINANCIAL STABILITY AND ECONOMIC GROWTH
An increasing number of empirical studies indicate that the benefits of debt-to-
GDP growth will gradually diminish when aggregate leverage7 is rising. A similar
conclusion was reached in a recently published IMF analysis8, according to which
excessive leverage could undermine economic growth in the future.
Furthermore, high private sector credit, including household debt, may increase the
medium-term likelihood of a financial crisis and could lead to lower economic growth.
Henceforth there is a certain trade-off between the short-term benefits of rising debt-
to-GDP growth and its medium-term costs to macroeconomic and financial stability.
In the short term, an increase in the household debt-to-GDP ratio is usually associated
with higher economic growth and lower unemployment; nonetheless the effects might
be reversed over the medium to longer term. These adverse effects are typically
stronger when household debt is higher and are therefore usually more pronounced for
advanced economies.
Overleveraging can be a risk to financial stability and a source of macroeconomic and
financial imbalances and crises. Disproportionate increases in household leverage are
associated with a higher likelihood of financial crises, and financial stability may be
adversely affected through two key channels. One channel is the adverse impact of
excessive debt on economic growth, employment, and disposable income, all of which
reduces the servicing capacity of households’ debt. Overleveraging may therefore stifle
credit demand by constraining households that wish to borrow. Another channel is the
deterioration in household sentiment in response to worsening economic developments,
and the consequent decline in households’ willingness to borrow.
Although it is difficult to define the point at which debt becomes excessive, the IMF
analysis finds that the association between household debt and future real GDP
growth turns negative at relatively low levels of household debt, i.e. exceeding 30
percent of GDP. When household debt is at 60 percent of GDP, its increase correlates
quite strongly with the increasing likelihood of a financial crisis. This suggests that
7 Leverage is defined in this box as borrowed funds that are used to finance consumption and investment.8 Valckx, N. et al., “Household debt and financial stability”, Global Financial Stability Report, IMF, October 2017.
Namibia Financial Stability Report - April 2018 23Page
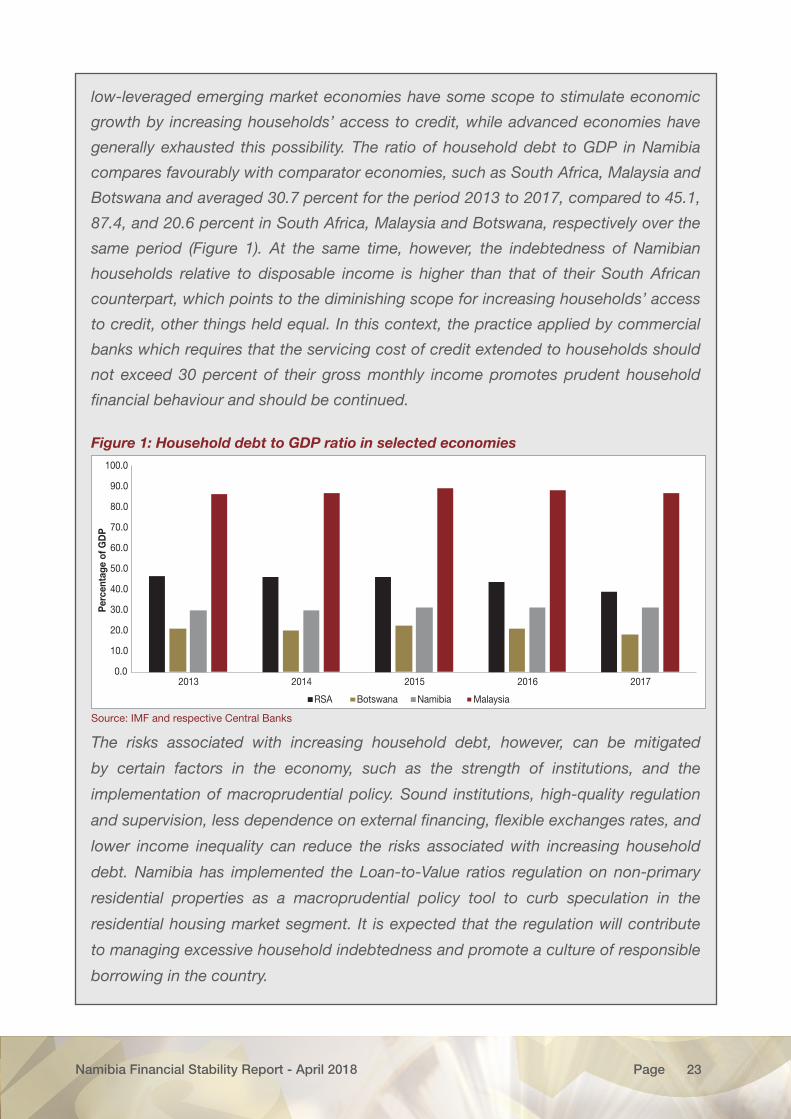
low-leveraged emerging market economies have some scope to stimulate economic
growth by increasing households’ access to credit, while advanced economies have
generally exhausted this possibility. The ratio of household debt to GDP in Namibia
compares favourably with comparator economies, such as South Africa, Malaysia and
Botswana and averaged 30.7 percent for the period 2013 to 2017, compared to 45.1,
87.4, and 20.6 percent in South Africa, Malaysia and Botswana, respectively over the
same period (Figure 1). At the same time, however, the indebtedness of Namibian
households relative to disposable income is higher than that of their South African
counterpart, which points to the diminishing scope for increasing households’ access
to credit, other things held equal. In this context, the practice applied by commercial
banks which requires that the servicing cost of credit extended to households should
not exceed 30 percent of their gross monthly income promotes prudent household
financial behaviour and should be continued.
Figure 1: Household debt to GDP ratio in selected economies
0.0
10.0
20.0
30.0
40.0
50.0
60.0
70.0
80.0
90.0
100.0
2013 2014 2015 2016 2017
Per
cent
age
of G
DP
RSA Botswana Namibia Malaysia
Source: IMF and respective Central Banks
The risks associated with increasing household debt, however, can be mitigated
by certain factors in the economy, such as the strength of institutions, and the
implementation of macroprudential policy. Sound institutions, high-quality regulation
and supervision, less dependence on external financing, flexible exchanges rates, and
lower income inequality can reduce the risks associated with increasing household
debt. Namibia has implemented the Loan-to-Value ratios regulation on non-primary
residential properties as a macroprudential policy tool to curb speculation in the
residential housing market segment. It is expected that the regulation will contribute
to managing excessive household indebtedness and promote a culture of responsible
borrowing in the country.
Namibia Financial Stability Report - April 2018 24Page
V. PERFORMANCE OF THE BANKING SECTOR
Banking Sector Asset Growth
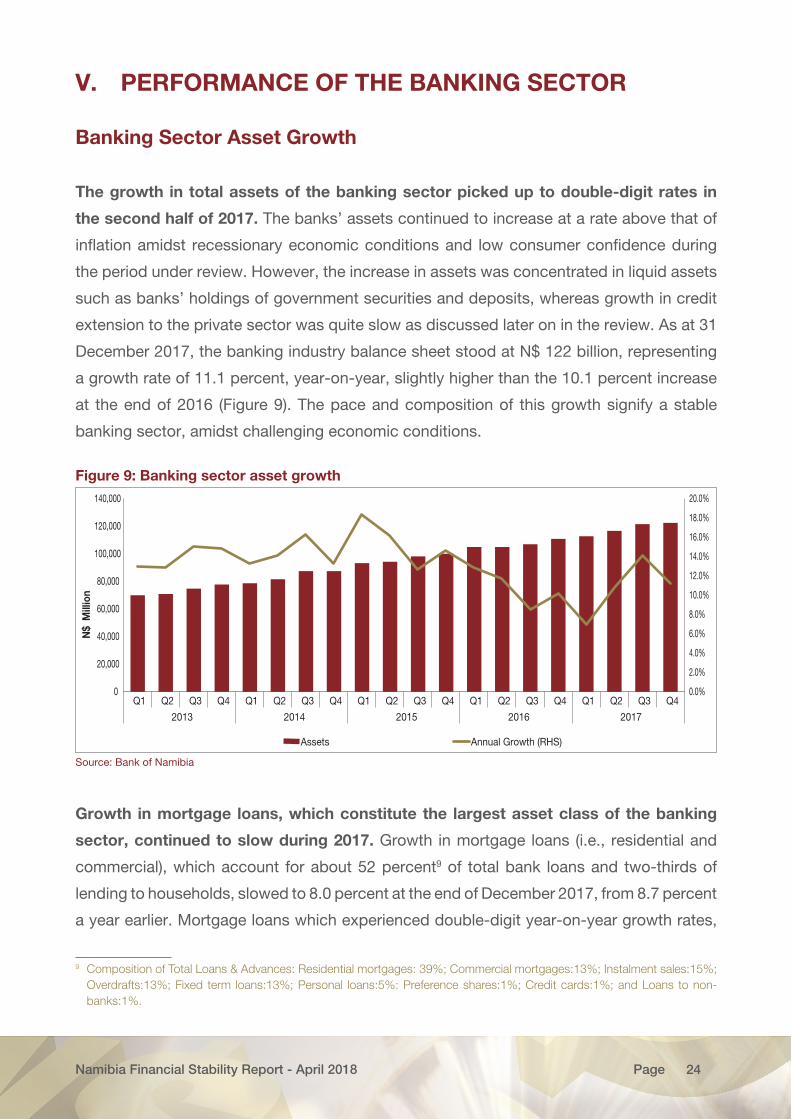
The growth in total assets of the banking sector picked up to double-digit rates in
the second half of 2017. The banks’ assets continued to increase at a rate above that of
inflation amidst recessionary economic conditions and low consumer confidence during
the period under review. However, the increase in assets was concentrated in liquid assets
such as banks’ holdings of government securities and deposits, whereas growth in credit
extension to the private sector was quite slow as discussed later on in the review. As at 31
December 2017, the banking industry balance sheet stood at N$ 122 billion, representing
a growth rate of 11.1 percent, year-on-year, slightly higher than the 10.1 percent increase
at the end of 2016 (Figure 9). The pace and composition of this growth signify a stable
banking sector, amidst challenging economic conditions.
Figure 9: Banking sector asset growth
0.0%
2.0%
4.0%
6.0%
8.0%
10.0%
12.0%
14.0%
16.0%
18.0%
20.0%
0
20,000
40,000
60,000
80,000
100,000
120,000
140,000
Q1 Q2 Q3 Q4 Q1 Q2 Q3 Q4 Q1 Q2 Q3 Q4 Q1 Q2 Q3 Q4 Q1 Q2 Q3 Q4
2013 2014 2015 2016 2017
N$
Mill
ion
Assets Annual Growth (RHS)
Source: Bank of Namibia
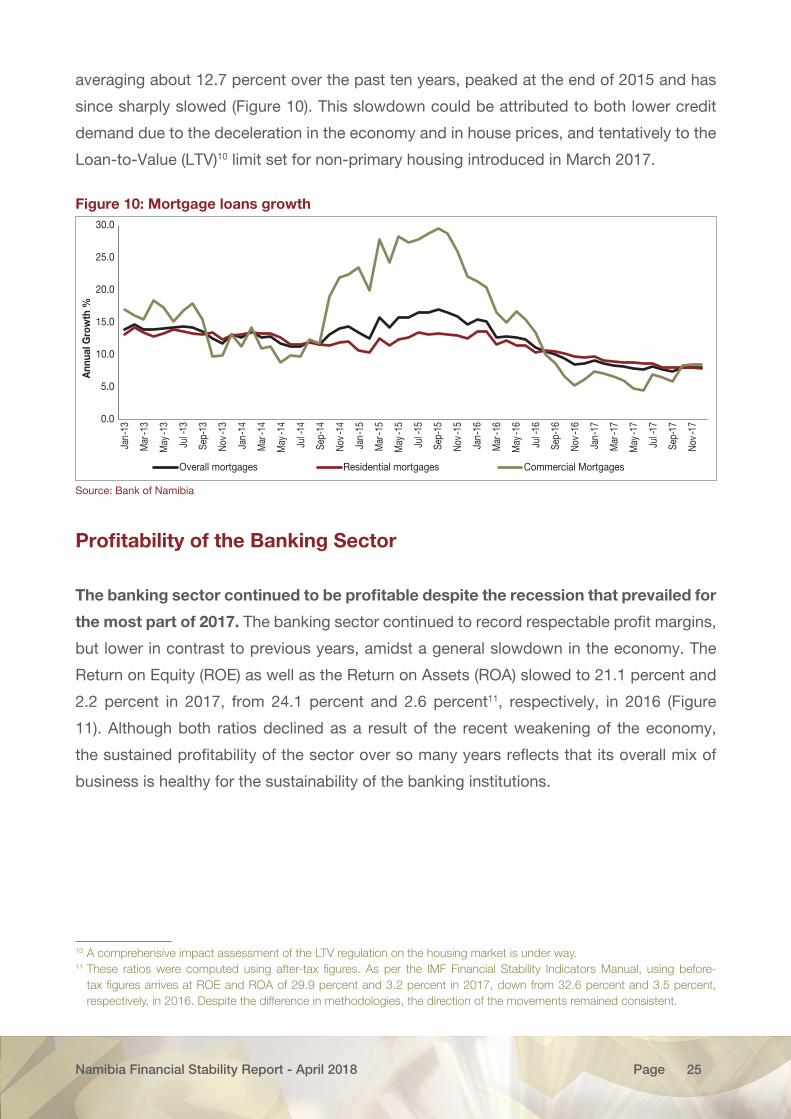
Growth in mortgage loans, which constitute the largest asset class of the banking
sector, continued to slow during 2017. Growth in mortgage loans (i.e., residential and
commercial), which account for about 52 percent9 of total bank loans and two-thirds of
lending to households, slowed to 8.0 percent at the end of December 2017, from 8.7 percent
a year earlier. Mortgage loans which experienced double-digit year-on-year growth rates,
9 Composition of Total Loans & Advances: Residential mortgages: 39%; Commercial mortgages:13%; Instalment sales:15%; Overdrafts:13%; Fixed term loans:13%; Personal loans:5%: Preference shares:1%; Credit cards:1%; and Loans to non-banks:1%.
Namibia Financial Stability Report - April 2018 25Page
averaging about 12.7 percent over the past ten years, peaked at the end of 2015 and has
since sharply slowed (Figure 10). This slowdown could be attributed to both lower credit
demand due to the deceleration in the economy and in house prices, and tentatively to the
Loan-to-Value (LTV)10 limit set for non-primary housing introduced in March 2017.
Figure 10: Mortgage loans growth
0.0
5.0
10.0
15.0
20.0
25.0
30.0
Jan-
13
Mar
-13
May
-13
Jul-
13
Sep-
13
Nov-
13
Jan-
14
Mar
-14
May
-14
Jul-
14
Sep-
14
Nov-
14
Jan-
15
Mar
-15
May
-15
Jul-
15
Sep-
15
Nov-
15
Jan-
16
Mar
-16
May
-16
Jul-
16
Sep-
16
Nov-
16
Jan-
17
Mar
-17
May
-17
Jul-
17
Sep-
17
Nov-
17
Ann
ual G
row
th %
Overall mortgages Residential mortgages Commercial Mortgages
Source: Bank of Namibia
Profitability of the Banking Sector
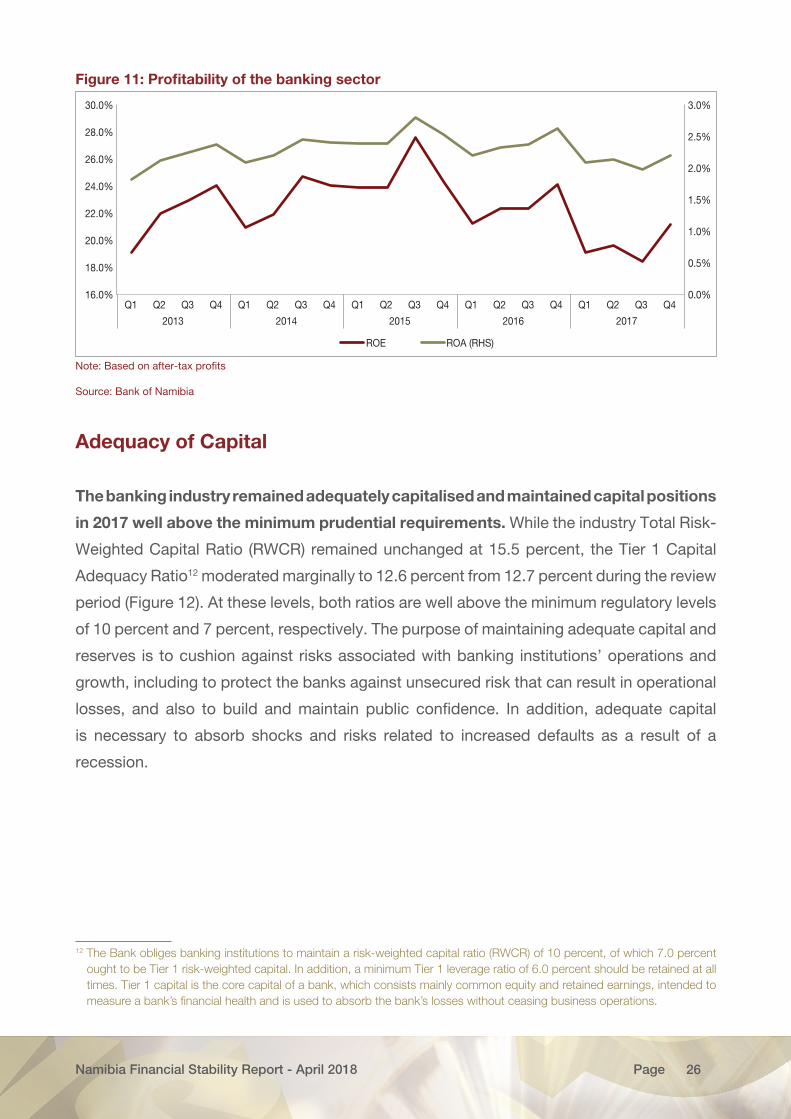
The banking sector continued to be profitable despite the recession that prevailed for
the most part of 2017. The banking sector continued to record respectable profit margins,
but lower in contrast to previous years, amidst a general slowdown in the economy. The
Return on Equity (ROE) as well as the Return on Assets (ROA) slowed to 21.1 percent and
2.2 percent in 2017, from 24.1 percent and 2.6 percent11, respectively, in 2016 (Figure
11). Although both ratios declined as a result of the recent weakening of the economy,
the sustained profitability of the sector over so many years reflects that its overall mix of
business is healthy for the sustainability of the banking institutions.
10 A comprehensive impact assessment of the LTV regulation on the housing market is under way.11 These ratios were computed using after-tax figures. As per the IMF Financial Stability Indicators Manual, using before-
tax figures arrives at ROE and ROA of 29.9 percent and 3.2 percent in 2017, down from 32.6 percent and 3.5 percent, respectively, in 2016. Despite the difference in methodologies, the direction of the movements remained consistent.
Namibia Financial Stability Report - April 2018 26Page
Figure 11: Profitability of the banking sector
0.0%
0.5%
1.0%
1.5%
2.0%
2.5%
3.0%
16.0%
18.0%
20.0%
22.0%
24.0%
26.0%
28.0%
30.0%
Q1 Q2 Q3 Q4 Q1 Q2 Q3 Q4 Q1 Q2 Q3 Q4 Q1 Q2 Q3 Q4 Q1 Q2 Q3 Q4
2013 2014 2015 2016 2017
ROE ROA (RHS)
Note: Based on after-tax profits
Source: Bank of Namibia
Adequacy of Capital
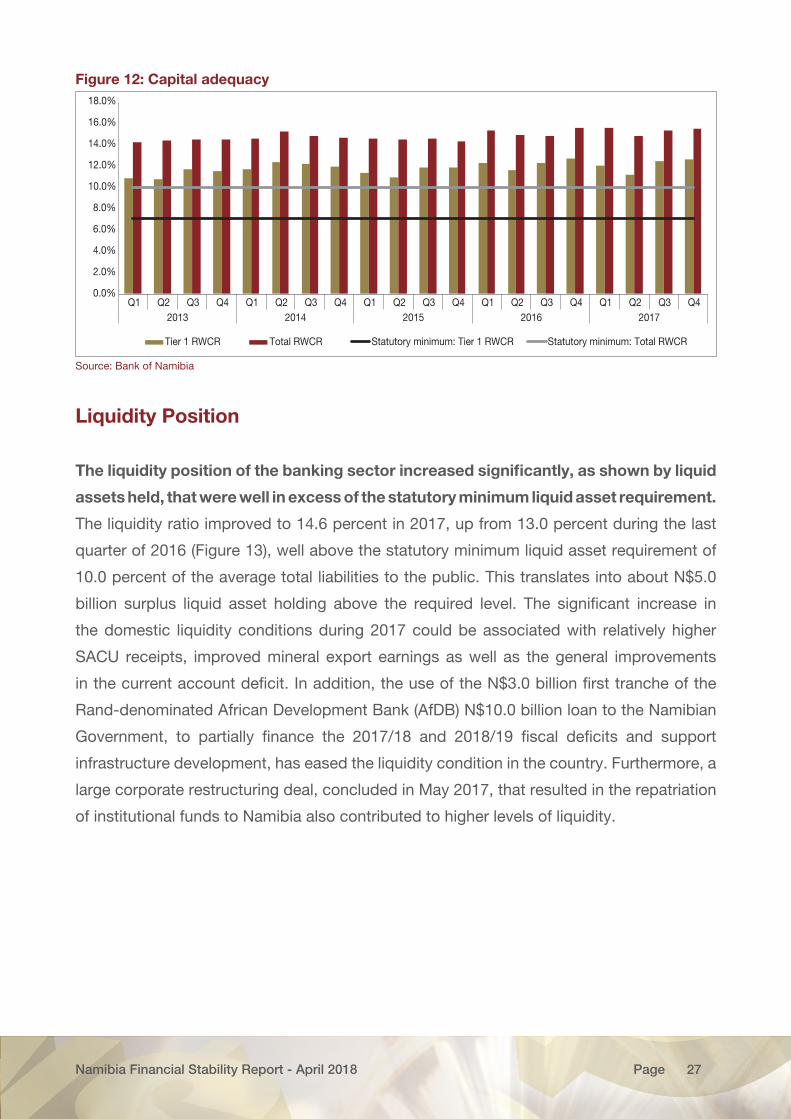
The banking industry remained adequately capitalised and maintained capital positions
in 2017 well above the minimum prudential requirements. While the industry Total Risk-
Weighted Capital Ratio (RWCR) remained unchanged at 15.5 percent, the Tier 1 Capital
Adequacy Ratio12 moderated marginally to 12.6 percent from 12.7 percent during the review
period (Figure 12). At these levels, both ratios are well above the minimum regulatory levels
of 10 percent and 7 percent, respectively. The purpose of maintaining adequate capital and
reserves is to cushion against risks associated with banking institutions’ operations and
growth, including to protect the banks against unsecured risk that can result in operational
losses, and also to build and maintain public confidence. In addition, adequate capital
is necessary to absorb shocks and risks related to increased defaults as a result of a
recession.
12 The Bank obliges banking institutions to maintain a risk-weighted capital ratio (RWCR) of 10 percent, of which 7.0 percent ought to be Tier 1 risk-weighted capital. In addition, a minimum Tier 1 leverage ratio of 6.0 percent should be retained at all times. Tier 1 capital is the core capital of a bank, which consists mainly common equity and retained earnings, intended to measure a bank’s financial health and is used to absorb the bank’s losses without ceasing business operations.
Namibia Financial Stability Report - April 2018 27Page
Figure 12: Capital adequacy
0.0%
2.0%
4.0%
6.0%
8.0%
10.0%
12.0%
14.0%
16.0%
18.0%
Q1 Q2 Q3 Q4 Q1 Q2 Q3 Q4 Q1 Q2 Q3 Q4 Q1 Q2 Q3 Q4 Q1 Q2 Q3 Q42013 2014 2015 2016 2017
Tier 1 RWCR Total RWCR Statutory minimum: Tier 1 RWCR Statutory minimum: Total RWCR
Source: Bank of Namibia
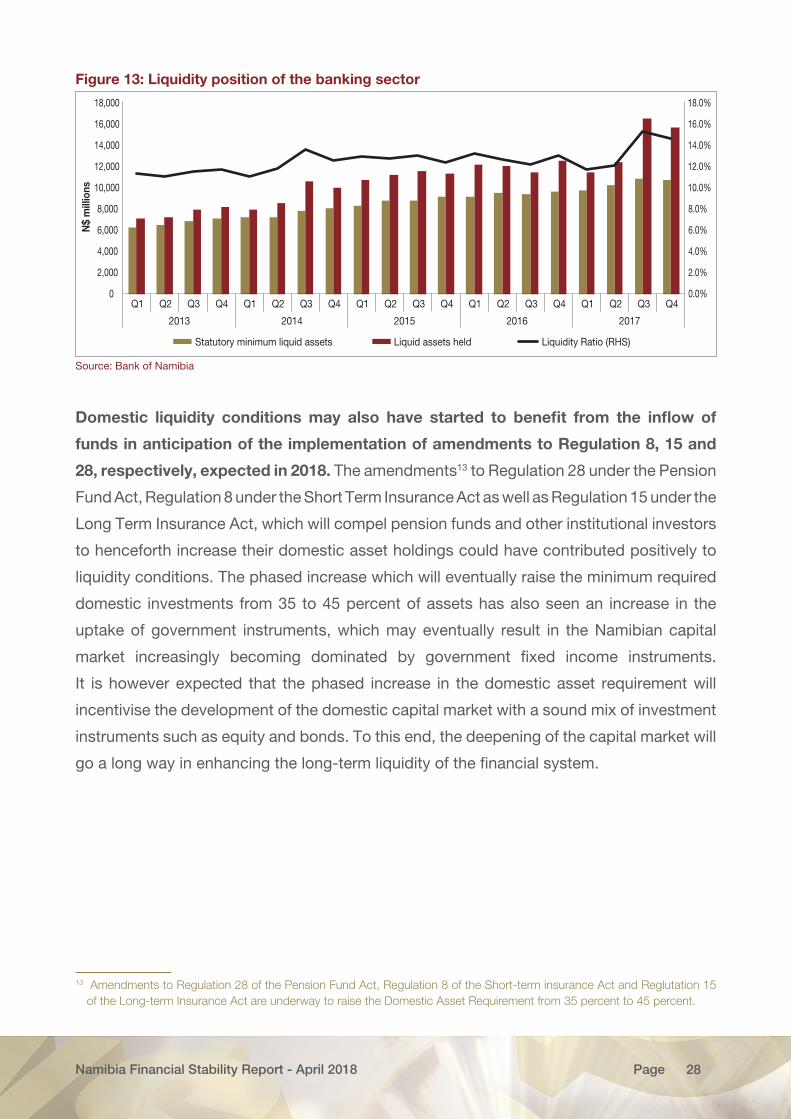
Liquidity Position
The liquidity position of the banking sector increased significantly, as shown by liquid
assets held, that were well in excess of the statutory minimum liquid asset requirement.
The liquidity ratio improved to 14.6 percent in 2017, up from 13.0 percent during the last
quarter of 2016 (Figure 13), well above the statutory minimum liquid asset requirement of
10.0 percent of the average total liabilities to the public. This translates into about N$5.0
billion surplus liquid asset holding above the required level. The significant increase in
the domestic liquidity conditions during 2017 could be associated with relatively higher
SACU receipts, improved mineral export earnings as well as the general improvements
in the current account deficit. In addition, the use of the N$3.0 billion first tranche of the
Rand-denominated African Development Bank (AfDB) N$10.0 billion loan to the Namibian
Government, to partially finance the 2017/18 and 2018/19 fiscal deficits and support
infrastructure development, has eased the liquidity condition in the country. Furthermore, a
large corporate restructuring deal, concluded in May 2017, that resulted in the repatriation
of institutional funds to Namibia also contributed to higher levels of liquidity.
Namibia Financial Stability Report - April 2018 28Page
Figure 13: Liquidity position of the banking sector
0.0%
2.0%
4.0%
6.0%
8.0%
10.0%
12.0%
14.0%
16.0%
18.0%
0
2,000
4,000
6,000
8,000
10,000
12,000
14,000
16,000
18,000
Q1 Q2 Q3 Q4 Q1 Q2 Q3 Q4 Q1 Q2 Q3 Q4 Q1 Q2 Q3 Q4 Q1 Q2 Q3 Q4
2013 2014 2015 2016 2017
N$
mill
ions
Statutory minimum liquid assets Liquid assets held Liquidity Ratio (RHS)
Source: Bank of Namibia
Domestic liquidity conditions may also have started to benefit from the inflow of
funds in anticipation of the implementation of amendments to Regulation 8, 15 and
28, respectively, expected in 2018. The amendments13 to Regulation 28 under the Pension
Fund Act, Regulation 8 under the Short Term Insurance Act as well as Regulation 15 under the
Long Term Insurance Act, which will compel pension funds and other institutional investors
to henceforth increase their domestic asset holdings could have contributed positively to
liquidity conditions. The phased increase which will eventually raise the minimum required
domestic investments from 35 to 45 percent of assets has also seen an increase in the
uptake of government instruments, which may eventually result in the Namibian capital
market increasingly becoming dominated by government fixed income instruments.
It is however expected that the phased increase in the domestic asset requirement will
incentivise the development of the domestic capital market with a sound mix of investment
instruments such as equity and bonds. To this end, the deepening of the capital market will
go a long way in enhancing the long-term liquidity of the financial system.
13 Amendments to Regulation 28 of the Pension Fund Act, Regulation 8 of the Short-term insurance Act and Reglutation 15 of the Long-term Insurance Act are underway to raise the Domestic Asset Requirement from 35 percent to 45 percent.
Namibia Financial Stability Report - April 2018 29Page
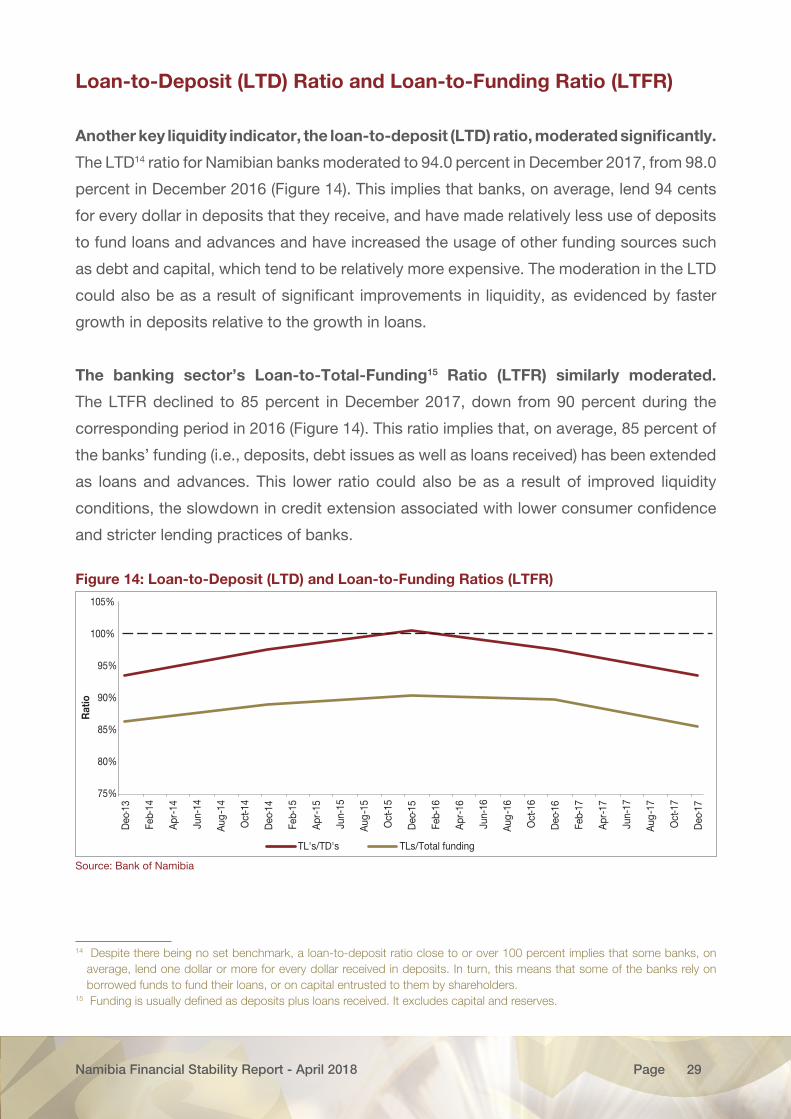
Loan-to-Deposit (LTD) Ratio and Loan-to-Funding Ratio (LTFR)
Another key liquidity indicator, the loan-to-deposit (LTD) ratio, moderated significantly.
The LTD14 ratio for Namibian banks moderated to 94.0 percent in December 2017, from 98.0
percent in December 2016 (Figure 14). This implies that banks, on average, lend 94 cents
for every dollar in deposits that they receive, and have made relatively less use of deposits
to fund loans and advances and have increased the usage of other funding sources such
as debt and capital, which tend to be relatively more expensive. The moderation in the LTD
could also be as a result of significant improvements in liquidity, as evidenced by faster
growth in deposits relative to the growth in loans.
The banking sector’s Loan-to-Total-Funding15 Ratio (LTFR) similarly moderated.
The LTFR declined to 85 percent in December 2017, down from 90 percent during the
corresponding period in 2016 (Figure 14). This ratio implies that, on average, 85 percent of
the banks’ funding (i.e., deposits, debt issues as well as loans received) has been extended
as loans and advances. This lower ratio could also be as a result of improved liquidity
conditions, the slowdown in credit extension associated with lower consumer confidence
and stricter lending practices of banks.
Figure 14: Loan-to-Deposit (LTD) and Loan-to-Funding Ratios (LTFR)
75%
80%
85%
90%
95%
100%
105%
Dec
-13
Feb-
14
Apr
-14
Jun-
14
Aug
-14
Oct
-14
Dec
-14
Feb-
15
Apr
-15
Jun-
15
Aug
-15
Oct
-15
Dec
-15
Feb-
16
Apr
-16
Jun-
16
Aug
-16
Oct
-16
Dec
-16
Feb-
17
Apr
-17
Jun-
17
Aug
-17
Oct
-17
Dec
-17
Rat
io
TL's/TD's TLs/Total funding
Source: Bank of Namibia
14 Despite there being no set benchmark, a loan-to-deposit ratio close to or over 100 percent implies that some banks, on average, lend one dollar or more for every dollar received in deposits. In turn, this means that some of the banks rely on borrowed funds to fund their loans, or on capital entrusted to them by shareholders.
15 Funding is usually defined as deposits plus loans received. It excludes capital and reserves.
Namibia Financial Stability Report - April 2018 30Page
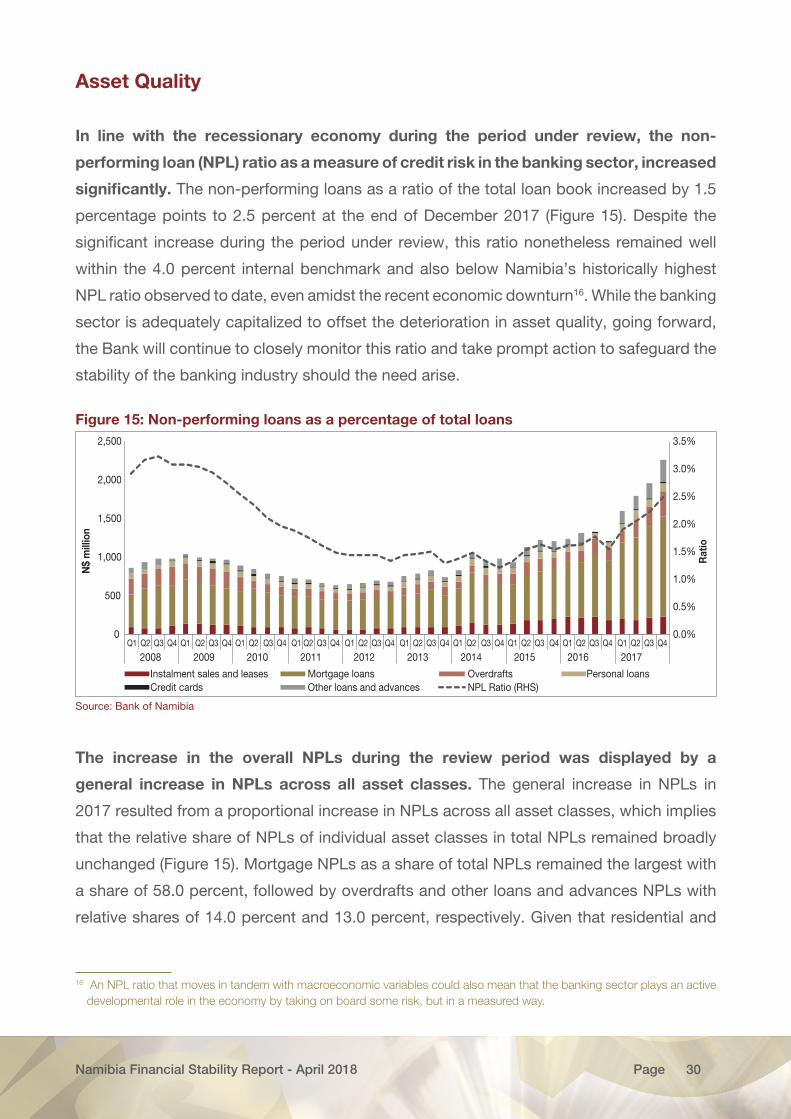
Asset Quality
In line with the recessionary economy during the period under review, the non-
performing loan (NPL) ratio as a measure of credit risk in the banking sector, increased
significantly. The non-performing loans as a ratio of the total loan book increased by 1.5
percentage points to 2.5 percent at the end of December 2017 (Figure 15). Despite the
significant increase during the period under review, this ratio nonetheless remained well
within the 4.0 percent internal benchmark and also below Namibia’s historically highest
NPL ratio observed to date, even amidst the recent economic downturn16. While the banking
sector is adequately capitalized to offset the deterioration in asset quality, going forward,
the Bank will continue to closely monitor this ratio and take prompt action to safeguard the
stability of the banking industry should the need arise.
Figure 15: Non-performing loans as a percentage of total loans
0.0%
0.5%
1.0%
1.5%
2.0%
2.5%
3.0%
3.5%
0
500
1,000
1,500
2,000
2,500
Q1 Q2 Q3 Q4 Q1 Q2 Q3 Q4 Q1 Q2 Q3 Q4 Q1 Q2 Q3 Q4 Q1 Q2 Q3 Q4 Q1 Q2 Q3 Q4 Q1 Q2 Q3 Q4 Q1 Q2 Q3 Q4 Q1 Q2 Q3 Q4 Q1 Q2 Q3 Q4
2008 2009 2010 2011 2012 2013 2014 2015 2016 2017
Rat
io
N$
mill
ion
Instalment sales and leases Mortgage loans Overdrafts Personal loansCredit cards Other loans and advances NPL Ratio (RHS)
Source: Bank of Namibia
The increase in the overall NPLs during the review period was displayed by a
general increase in NPLs across all asset classes. The general increase in NPLs in
2017 resulted from a proportional increase in NPLs across all asset classes, which implies
that the relative share of NPLs of individual asset classes in total NPLs remained broadly
unchanged (Figure 15). Mortgage NPLs as a share of total NPLs remained the largest with
a share of 58.0 percent, followed by overdrafts and other loans and advances NPLs with
relative shares of 14.0 percent and 13.0 percent, respectively. Given that residential and
16 An NPL ratio that moves in tandem with macroeconomic variables could also mean that the banking sector plays an active developmental role in the economy by taking on board some risk, but in a measured way.
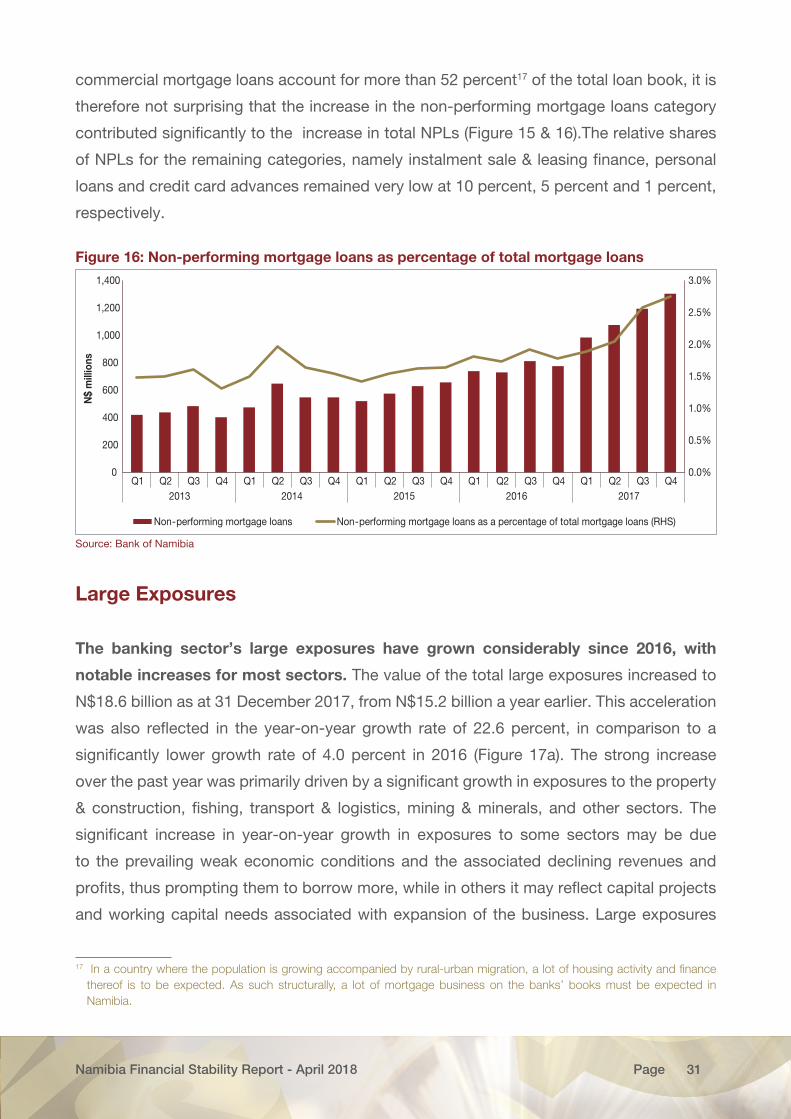
Namibia Financial Stability Report - April 2018 31Page
commercial mortgage loans account for more than 52 percent17 of the total loan book, it is
therefore not surprising that the increase in the non-performing mortgage loans category
contributed significantly to the increase in total NPLs (Figure 15 & 16).The relative shares
of NPLs for the remaining categories, namely instalment sale & leasing finance, personal
loans and credit card advances remained very low at 10 percent, 5 percent and 1 percent,
respectively.
Figure 16: Non-performing mortgage loans as percentage of total mortgage loans
0.0%
0.5%
1.0%
1.5%
2.0%
2.5%
3.0%
0
200
400
600
800
1,000
1,200
1,400
Q1 Q2 Q3 Q4 Q1 Q2 Q3 Q4 Q1 Q2 Q3 Q4 Q1 Q2 Q3 Q4 Q1 Q2 Q3 Q42013 2014 2015 2016 2017
N$
mill
ions
Non-performing mortgage loans Non-performing mortgage loans as a percentage of total mortgage loans (RHS)
Source: Bank of Namibia
Large Exposures
The banking sector’s large exposures have grown considerably since 2016, with
notable increases for most sectors. The value of the total large exposures increased to
N$18.6 billion as at 31 December 2017, from N$15.2 billion a year earlier. This acceleration
was also reflected in the year-on-year growth rate of 22.6 percent, in comparison to a
significantly lower growth rate of 4.0 percent in 2016 (Figure 17a). The strong increase
over the past year was primarily driven by a significant growth in exposures to the property
& construction, fishing, transport & logistics, mining & minerals, and other sectors. The
significant increase in year-on-year growth in exposures to some sectors may be due
to the prevailing weak economic conditions and the associated declining revenues and
profits, thus prompting them to borrow more, while in others it may reflect capital projects
and working capital needs associated with expansion of the business. Large exposures
17 In a country where the population is growing accompanied by rural-urban migration, a lot of housing activity and finance thereof is to be expected. As such structurally, a lot of mortgage business on the banks’ books must be expected in Namibia.
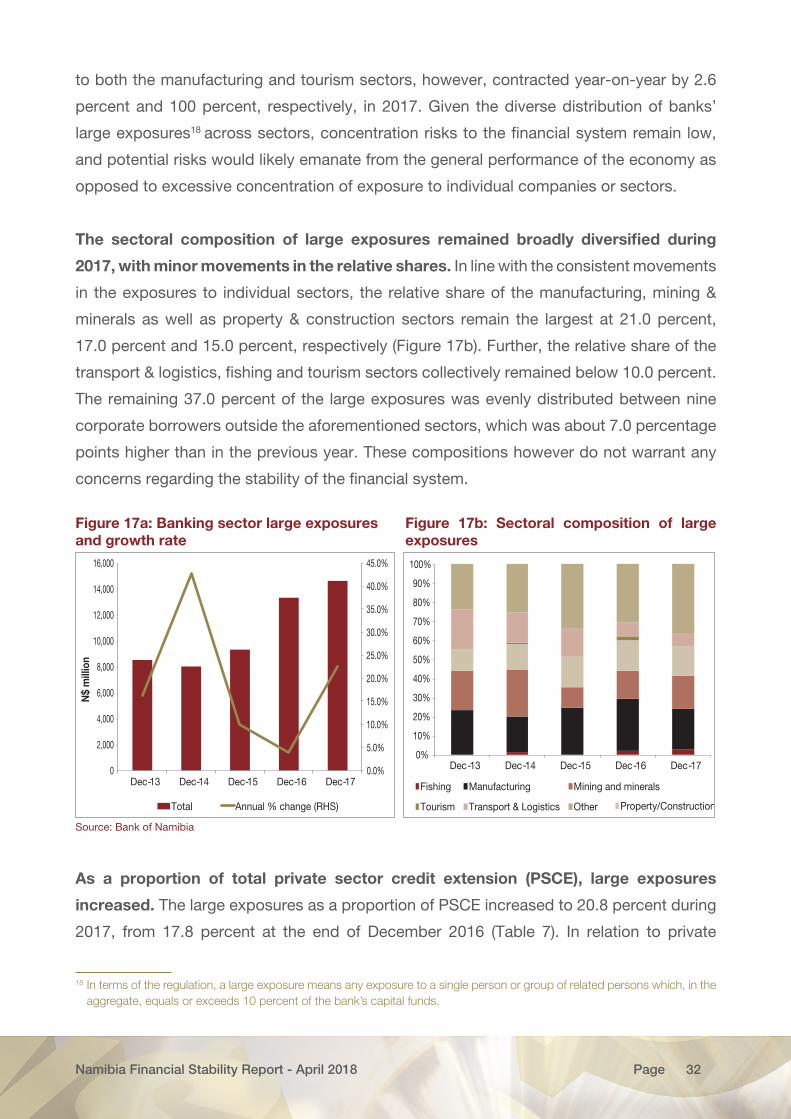
Namibia Financial Stability Report - April 2018 32Page
to both the manufacturing and tourism sectors, however, contracted year-on-year by 2.6
percent and 100 percent, respectively, in 2017. Given the diverse distribution of banks’
large exposures18 across sectors, concentration risks to the financial system remain low,
and potential risks would likely emanate from the general performance of the economy as
opposed to excessive concentration of exposure to individual companies or sectors.
The sectoral composition of large exposures remained broadly diversified during
2017, with minor movements in the relative shares. In line with the consistent movements
in the exposures to individual sectors, the relative share of the manufacturing, mining &
minerals as well as property & construction sectors remain the largest at 21.0 percent,
17.0 percent and 15.0 percent, respectively (Figure 17b). Further, the relative share of the
transport & logistics, fishing and tourism sectors collectively remained below 10.0 percent.
The remaining 37.0 percent of the large exposures was evenly distributed between nine
corporate borrowers outside the aforementioned sectors, which was about 7.0 percentage
points higher than in the previous year. These compositions however do not warrant any
concerns regarding the stability of the financial system.
Figure 17a: Banking sector large exposures and growth rate
Figure 17b: Sectoral composition of large exposures
0.0%
5.0%
10.0%
15.0%
20.0%
25.0%
30.0%
35.0%
40.0%
45.0%
0
2,000
4,000
6,000
8,000
10,000
12,000
14,000
16,000
Dec-13 Dec-14 Dec-15 Dec-16 Dec-17
N$
mill
ion
Total Annual % change (RHS)
0%
10%
20%
30%
40%
50%
60%
70%
80%
90%
100%
Dec-13 Dec-14 Dec-15 Dec-16 Dec-17
Fishing Manufacturing Mining and minerals
Property/ConstructionTourism Transport & Logistics Other
Source: Bank of Namibia
As a proportion of total private sector credit extension (PSCE), large exposures
increased. The large exposures as a proportion of PSCE increased to 20.8 percent during
2017, from 17.8 percent at the end of December 2016 (Table 7). In relation to private
18 In terms of the regulation, a large exposure means any exposure to a single person or group of related persons which, in the aggregate, equals or exceeds 10 percent of the bank’s capital funds.
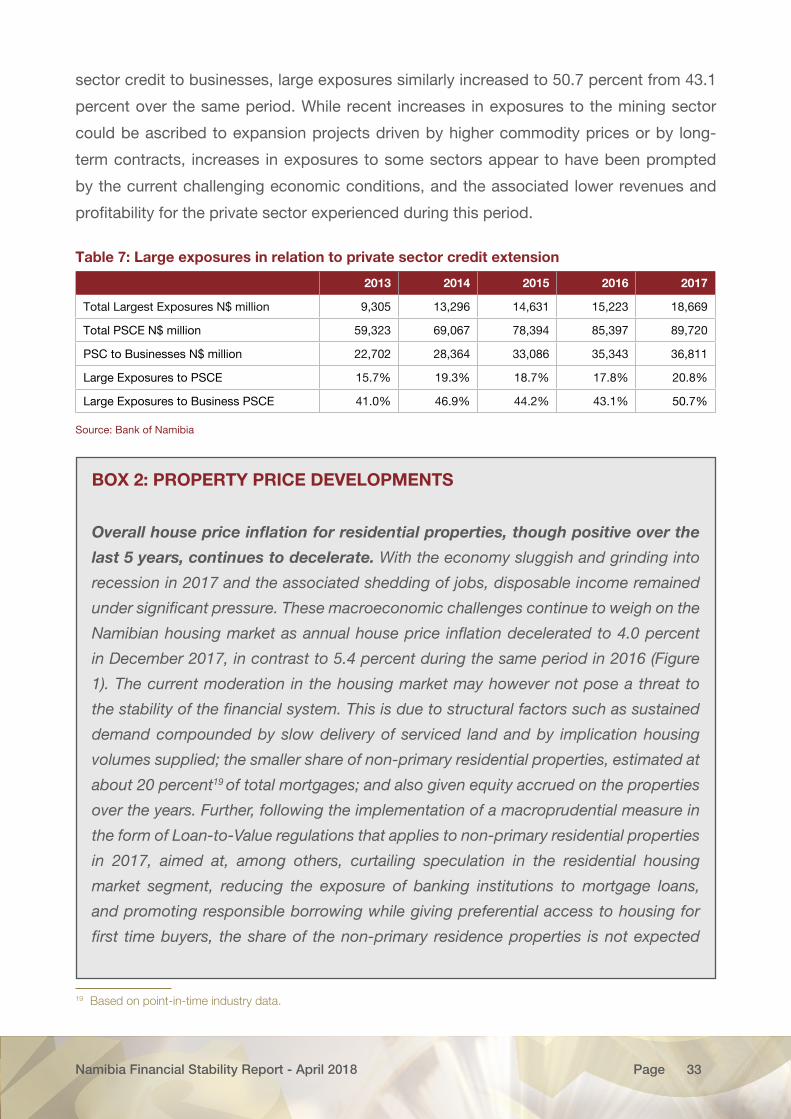
Namibia Financial Stability Report - April 2018 33Page
sector credit to businesses, large exposures similarly increased to 50.7 percent from 43.1
percent over the same period. While recent increases in exposures to the mining sector
could be ascribed to expansion projects driven by higher commodity prices or by long-
term contracts, increases in exposures to some sectors appear to have been prompted
by the current challenging economic conditions, and the associated lower revenues and
profitability for the private sector experienced during this period.
Table 7: Large exposures in relation to private sector credit extension
2013 2014 2015 2016 2017
Total Largest Exposures N$ million 9,305 13,296 14,631 15,223 18,669
Total PSCE N$ million 59,323 69,067 78,394 85,397 89,720
PSC to Businesses N$ million 22,702 28,364 33,086 35,343 36,811
Large Exposures to PSCE 15.7% 19.3% 18.7% 17.8% 20.8%
Large Exposures to Business PSCE 41.0% 46.9% 44.2% 43.1% 50.7%
Source: Bank of Namibia
19 Based on point-in-time industry data.
BOX 2: PROPERTY PRICE DEVELOPMENTS
Overall house price inflation for residential properties, though positive over the
last 5 years, continues to decelerate. With the economy sluggish and grinding into
recession in 2017 and the associated shedding of jobs, disposable income remained
under significant pressure. These macroeconomic challenges continue to weigh on the
Namibian housing market as annual house price inflation decelerated to 4.0 percent
in December 2017, in contrast to 5.4 percent during the same period in 2016 (Figure
1). The current moderation in the housing market may however not pose a threat to
the stability of the financial system. This is due to structural factors such as sustained
demand compounded by slow delivery of serviced land and by implication housing
volumes supplied; the smaller share of non-primary residential properties, estimated at
about 20 percent19 of total mortgages; and also given equity accrued on the properties
over the years. Further, following the implementation of a macroprudential measure in
the form of Loan-to-Value regulations that applies to non-primary residential properties
in 2017, aimed at, among others, curtailing speculation in the residential housing
market segment, reducing the exposure of banking institutions to mortgage loans,
and promoting responsible borrowing while giving preferential access to housing for
first time buyers, the share of the non-primary residence properties is not expected
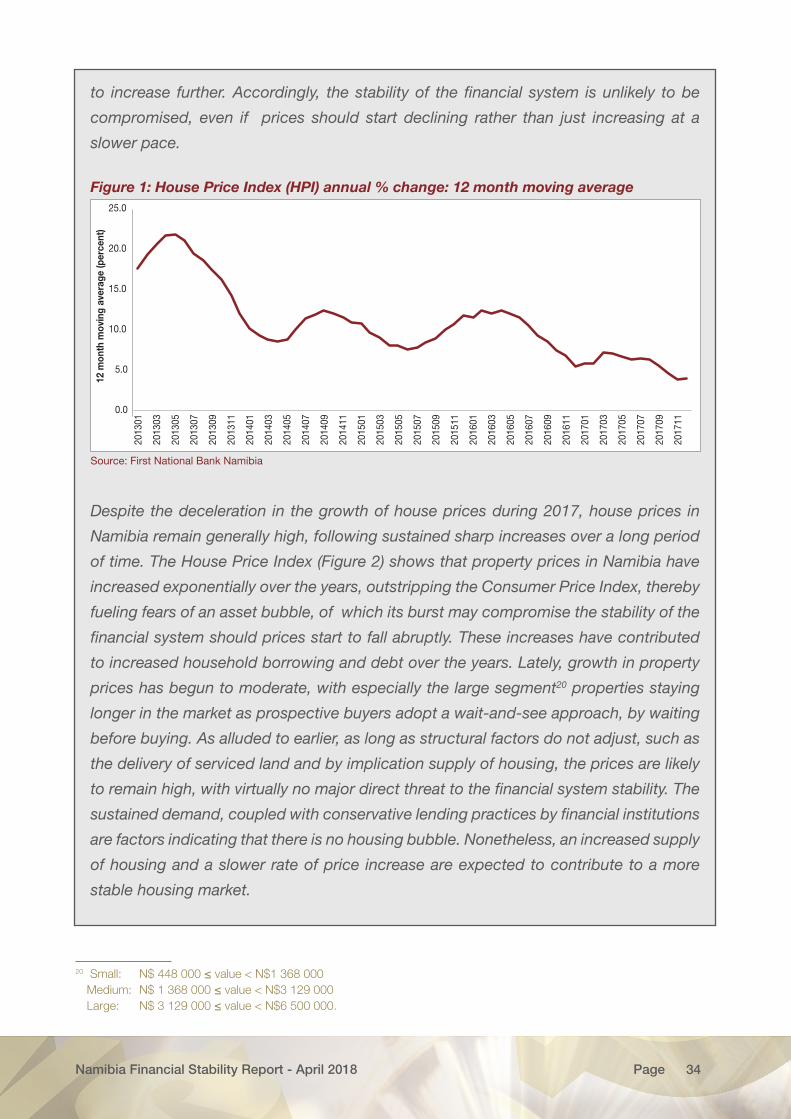
Namibia Financial Stability Report - April 2018 34Page
to increase further. Accordingly, the stability of the financial system is unlikely to be
compromised, even if prices should start declining rather than just increasing at a
slower pace.
Figure 1: House Price Index (HPI) annual % change: 12 month moving average
0.0
5.0
10.0
15.0
20.0
25.0
2013
01
2013
03
2013
05
2013
07
2013
09
2013
11
2014
01
2014
03
2014
05
2014
07
2014
09
2014
11
2015
01
2015
03
2015
05
2015
07
2015
09
2015
11
2016
01
2016
03
2016
05
2016
07
2016
09
2016
11
2017
01
2017
03
2017
05
2017
07
2017
09
2017
11
12 m
onth
mov
ing
aver
age
(per
cent
)
Source: First National Bank Namibia
Despite the deceleration in the growth of house prices during 2017, house prices in
Namibia remain generally high, following sustained sharp increases over a long period
of time. The House Price Index (Figure 2) shows that property prices in Namibia have
increased exponentially over the years, outstripping the Consumer Price Index, thereby
fueling fears of an asset bubble, of which its burst may compromise the stability of the
financial system should prices start to fall abruptly. These increases have contributed
to increased household borrowing and debt over the years. Lately, growth in property
prices has begun to moderate, with especially the large segment20 properties staying
longer in the market as prospective buyers adopt a wait-and-see approach, by waiting
before buying. As alluded to earlier, as long as structural factors do not adjust, such as
the delivery of serviced land and by implication supply of housing, the prices are likely
to remain high, with virtually no major direct threat to the financial system stability. The
sustained demand, coupled with conservative lending practices by financial institutions
are factors indicating that there is no housing bubble. Nonetheless, an increased supply
of housing and a slower rate of price increase are expected to contribute to a more
stable housing market.
20
20 Small: N$ 448 000 ≤ value < N$1 368 000 Medium: N$ 1 368 000 ≤ value < N$3 129 000 Large: N$ 3 129 000 ≤ value < N$6 500 000.
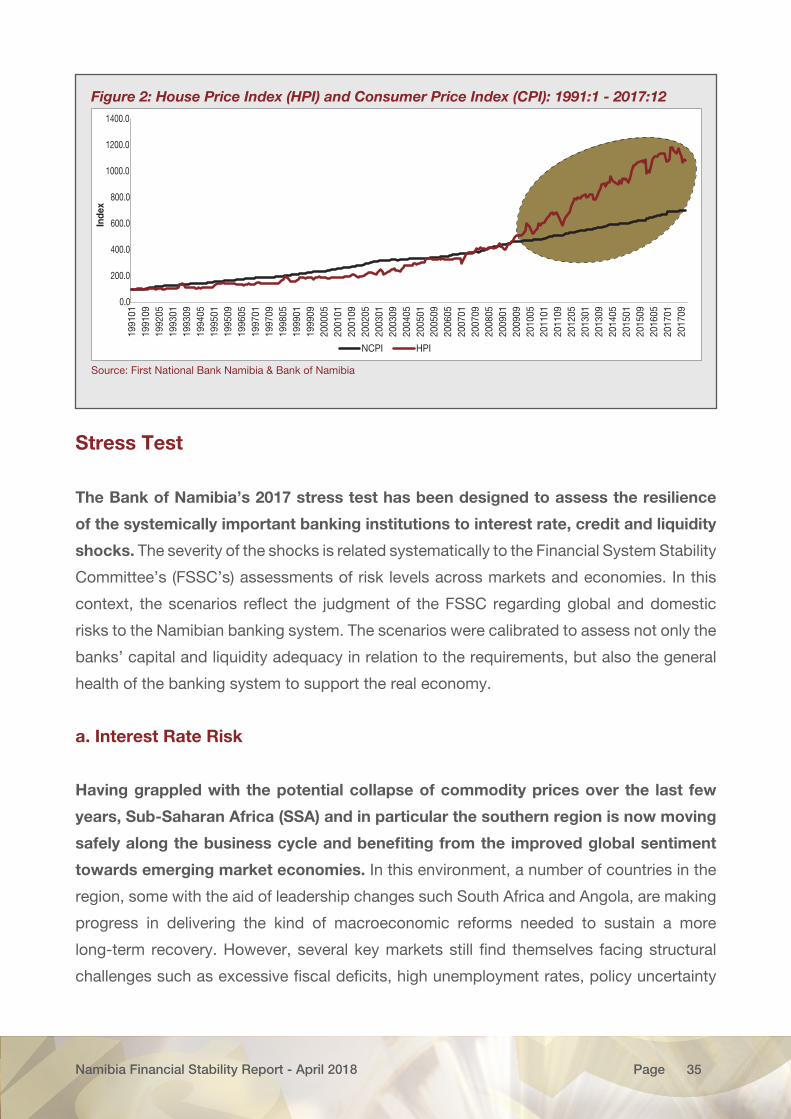
Namibia Financial Stability Report - April 2018 35Page
Stress Test
The Bank of Namibia’s 2017 stress test has been designed to assess the resilience
of the systemically important banking institutions to interest rate, credit and liquidity
shocks. The severity of the shocks is related systematically to the Financial System Stability
Committee’s (FSSC’s) assessments of risk levels across markets and economies. In this
context, the scenarios reflect the judgment of the FSSC regarding global and domestic
risks to the Namibian banking system. The scenarios were calibrated to assess not only the
banks’ capital and liquidity adequacy in relation to the requirements, but also the general
health of the banking system to support the real economy.
a. Interest Rate Risk
Having grappled with the potential collapse of commodity prices over the last few
years, Sub-Saharan Africa (SSA) and in particular the southern region is now moving
safely along the business cycle and benefiting from the improved global sentiment
towards emerging market economies. In this environment, a number of countries in the
region, some with the aid of leadership changes such South Africa and Angola, are making
progress in delivering the kind of macroeconomic reforms needed to sustain a more
long-term recovery. However, several key markets still find themselves facing structural
challenges such as excessive fiscal deficits, high unemployment rates, policy uncertainty
Figure 2: House Price Index (HPI) and Consumer Price Index (CPI): 1991:1 - 2017:12
0.0
200.0
400.0
600.0
800.0
1000.0
1200.0
1400.019
9101
1991
0919
9205
1993
0119
9309
1994
0519
9501
1995
0919
9605
1997
0119
9709
1998
0519
9901
1999
0920
0005
2001
0120
0109
2002
0520
0301
2003
0920
0405
2005
0120
0509
2006
0520
0701
2007
0920
0805
2009
0120
0909
2010
0520
1101
2011
0920
1205
2013
0120
1309
2014
0520
1501
2015
0920
1605
2017
0120
1709
Inde
x
NCPI HPI
Source: First National Bank Namibia & Bank of Namibia
Namibia Financial Stability Report - April 2018 36Page
and constrained alternative revenue sources. This augments pressure on future productive
capacities of these economies, and increases the region’s vulnerability to shocks when
sentiment eventually turns and the region finds itself in a less supportive global environment.
While growth in South Africa, one of the largest economies in the region, is expected
to improve moderately, accompanied by the recent strengthening of the Rand and
lower inflation, optimism should be exercised with caution. The South African economy
is estimated to have expanded by 1.3 percent in 2017, following a lower growth rate of
0.3 percent in the previous year, thereby defying general pessimistic expectations. Recent
inflation forecasts for 2018 have been lower than previously, with inflation expected to remain
within the target range. While the Rand has performed strongly in recent months, principally
on the back of a change in political leadership in South Africa and thus a reinforcement of
investor confidence and sentiment, it would be prudent to exercise caution, given pockets
of policy uncertainties. These uncertainties coupled with general elections in 2019 may turn
the renewed investors’ confidence around and weigh on the exchange rate of the Rand.
The performance of commodity prices, combined with the outcomes of the sovereign credit
ratings of the South African economy during 2018 may also influence the performance of
the Rand in the near future. In the end, while the South African Reserve Bank (SARB) has
been exercising accommodative monetary policy in recent times, it may at some stage be
prompted to increase interest rates so as to manage inflation. Inflationary pressures may
for instance come from the depreciation of the Rand and/or rising global food and energy
prices.
In order to maintain the currency peg, the Bank of Namibia may elect to also increase
the Repo rate to align interest rates with those in South Africa. Ultimately, the end
of the low interest rate environment may increase direct interest rate risk; that is, the risk
incurred by a bank when the interest rate sensitivities of its assets and liabilities in various
time bands are mismatched. While local banks are likely to be in a favourable position
initially, should interest rates start to increase, as their assets will reprice faster than their
liabilities, after some time the level of NPLs may start to increase further. To account for the
above scenario, the stress testing model assessed the impact of an interest rate increase
on net interest income stemming from repricing gaps in each time band, over a 12-month
horizon. The stress test results include the interest rate risk and credit risk scenarios, using
the following assumptions:
Namibia Financial Stability Report - April 2018 37Page
1 percentage point increase in the interest rate (Baseline scenario);
2 percentage points increase in the interest rate (Intermediate scenario);
3 percentage points increase in the interest rate (Adverse / severe scenario).
b. Credit Risk
The possible monetary policy tightening assumed above could prompt banks to
increase their prime lending rates, exacerbating the effects of the weak economy,
so that with a lag, further increases in NPLs may be expected. The effects of higher
interest rates could further strain household income and thus lead to higher default rates.
Further, the low growth environment in Namibia’s key trading partners in the region, external
shocks, coupled with a weaker domestic fiscal space could further lead to delinking of
Namibia’s growth trajectory from the stronger global growth dynamics in the short-term.
With the resultant further fiscal consolidation, this may imply that sectors which depend on
government contracts to service their loans may continue to endure an extended period
of hardship prompting them to shed more jobs, which may also strain disposable income
thus resulting in higher NPLs. The slowing property prices observed over the last year has
resulted in slower activity in the property market and in an increase in the vacancy rates of
residential, retail, commercial and industrial properties, and could negatively impact rental
incomes. This could further negatively affect the ability to service mortgage loans; and
given its share in the total assets on the banks’ book, higher NPLs may be expected.
The above scenario may ultimately result in higher default rates and NPLs across all
loan asset categories. To account for this shock, the following increases in the NPL ratio
were assumed:
1.5 percentage point increase in the NPL ratio above the current level (Baseline scenario);
3.0 percentage point increase in the NPL ratio above the current level (Intermediate
scenario); and
5.0 percentage point21 increase in the NPL ratio above the current level (Severe scenario).
21 The NPL percentage increases stated above, relate to the Namibian banking industry NPLs which demonstrated a historic industry high of 6.6 percent in 2001. During that time, the prime interest rate was 15.4 percent and the Repo rate was 11.25 percent; which reflects the same approximate magnitude increase above the current levels assumed in the adverse scenario of the Interest Rate Risk.
Namibia Financial Stability Report - April 2018 38Page
c. Liquidity Risk
Another concern is whether or not the banks are able to withstand liquidity shocks
if some of the depositors were to make sudden withdrawals of their funds from the
system. This assumption is made despite the banks being well-capitalized, having excess
liquid assets and being profitable, using the following assumptions:
3.97 percent of the total deposits withdrawn from the system; over 5 days (15 percent
of call deposits in total) (Baseline scenario)22;
7.95 percent of the total deposits withdrawn from the system; over 5 days (30 percent of
call deposits in total) (Intermediate scenario); and
13.24 percent of total deposits withdrawn from the system; over 5 days (50 percent of
the call deposits in total) (Adverse/Severe scenario)
Deposit withdrawals can be triggered principally by market conditions (unscheduled
withdrawals). Factors that may cause liquidity constraints include reduced government
spending due to fiscal consolidation; delayed tax refunds for corporates; capital flight to other
markets in search of better returns; dividend payments by subsidiaries of foreign entities;
and weak commodity prices that may dampen Namibia’s export earnings. Furthermore, the
growing loan book of the banking sector also exerts pressure on the liquidity conditions
of the banks, especially given suboptimal interbank lending, hence the need to assess the
banks’ resilience in terms of liquidity23. It is acknowledged, however, that the envisaged
phased increase in domestic asset requirement from 35 percent to 45 percent as a result
of the regulatory amendments to Regulation 8, 15 and 28 expected in 2018 could serve as
a buffer24 in the event of sudden withdrawals.
From the above shocks, the ultimate objective was to obtain an estimate of losses that
the banking institutions could face in the event of a significant shock, or combination
of shocks, and make recommendations pertaining to improved risk management or
capital add-ons. These shocks are believed to be plausible and yet sufficiently adverse. A
summary of these shocks is presented in Table 8 below.
22 Under stress, one expects the general public to respond. 23 The liquidity stress test is over a horizon of 5 days and does not account for the liquidity Contingency Funding Plan of each
bank which would represent cash inflows over the 5-day period.24 It is however noted that if an institutional investor is scared of the stability of the banking sector, it may decide to convert its
deposits with a bank in Namibia into central bank (BoN) notes.
Namibia Financial Stability Report - April 2018 39Page
Table 8: Summary of the stress testing scenarios
Risk Category Baseline Intermediate Severe
Credit risk (NPL Ratio) 1.5% 3.0% 5.0%
Interest Rate 100 basis point 200 basis points 300 basis points
Liquidity 3.97% of total deposits withdrawn over 5 days (15 % of call deposits)
7.95% of total deposits withdrawn ; over 5 days (30 % of call deposits)
13.24 % of total deposits withdrawn ; over 5 days (50 % of call deposits)
Exchange Rate 5%25 9% 15%
Other Variables: - 50% haircut on collateral - 50% Provisioning
25
Capital Adequacy Stress Test
Based on December 2017 data, the stress test results show that the banking sector
is adequately capitalized to withstand the impact of the potential increase in interest
rates, or that of adverse credit risk effects, in all scenarios. With respect to the baseline
and intermediate scenarios, the post-shock risk-weighted capital ratio stood at 14.3 percent
and 13.2 percent, respectively, well above the minimum regulatory level of 10 percent
(Figure 18). In the severe case scenario, however, with the continuation and exacerbation
of the assumed conditions and thus the erosion of capital, the post-shock risk-weighted
capital ratio is observed to decline to 11.7 percent, but still above the minimum regulatory
level. These results are broadly similar to those of December 2016, which implies that
the capital base of the banking sector is sufficient to absorb risks such as the significant
deterioration of the asset quality observed during 2017.
Figure 18: Solvency stress test results
0.0%
2.0%
4.0%
6.0%
8.0%
10.0%
12.0%
14.0%
16.0%
Baseline Intermediate Severe
Cap
ital A
dequ
acy
Rat
io
Pre-shock CAR Post-Shock CAR Minimum CAR
Source: Bank of Namibia
25 On average, the exchange rate is expected to depreciate at the same rate as the average inflation rate in a year. Given that the net foreign position of the Namibian banks is denominated in US$, £ and €, the exchange rate shock in this regard refers to the depreciation of the N$ against each of these currencies..
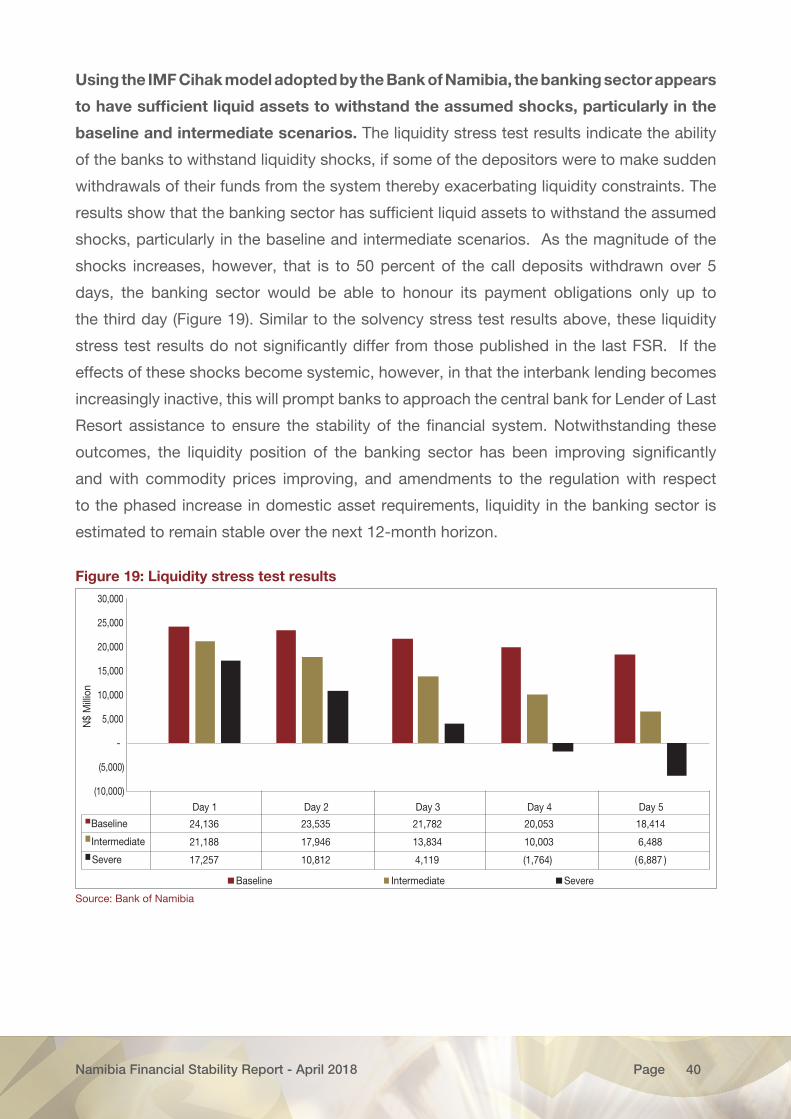
Namibia Financial Stability Report - April 2018 40Page
Using the IMF Cihak model adopted by the Bank of Namibia, the banking sector appears
to have sufficient liquid assets to withstand the assumed shocks, particularly in the
baseline and intermediate scenarios. The liquidity stress test results indicate the ability
of the banks to withstand liquidity shocks, if some of the depositors were to make sudden
withdrawals of their funds from the system thereby exacerbating liquidity constraints. The
results show that the banking sector has sufficient liquid assets to withstand the assumed
shocks, particularly in the baseline and intermediate scenarios. As the magnitude of the
shocks increases, however, that is to 50 percent of the call deposits withdrawn over 5
days, the banking sector would be able to honour its payment obligations only up to
the third day (Figure 19). Similar to the solvency stress test results above, these liquidity
stress test results do not significantly differ from those published in the last FSR. If the
effects of these shocks become systemic, however, in that the interbank lending becomes
increasingly inactive, this will prompt banks to approach the central bank for Lender of Last
Resort assistance to ensure the stability of the financial system. Notwithstanding these
outcomes, the liquidity position of the banking sector has been improving significantly
and with commodity prices improving, and amendments to the regulation with respect
to the phased increase in domestic asset requirements, liquidity in the banking sector is
estimated to remain stable over the next 12-month horizon.
Figure 19: Liquidity stress test results
Day 1 Day 2 Day 3 Day 4 Day 5
Baseline 24,136 23,535 21,782 20,053 18,414
Intermediate 21,188 17,946 13,834 10,003 6,488
Severe 17,257 10,812 4,119 (1,764) (6,887 )
(10,000)
(5,000)
-
5,000
10,000
15,000
20,000
25,000
30,000
N$
Mill
ion
Baseline Intermediate Severe
Source: Bank of Namibia
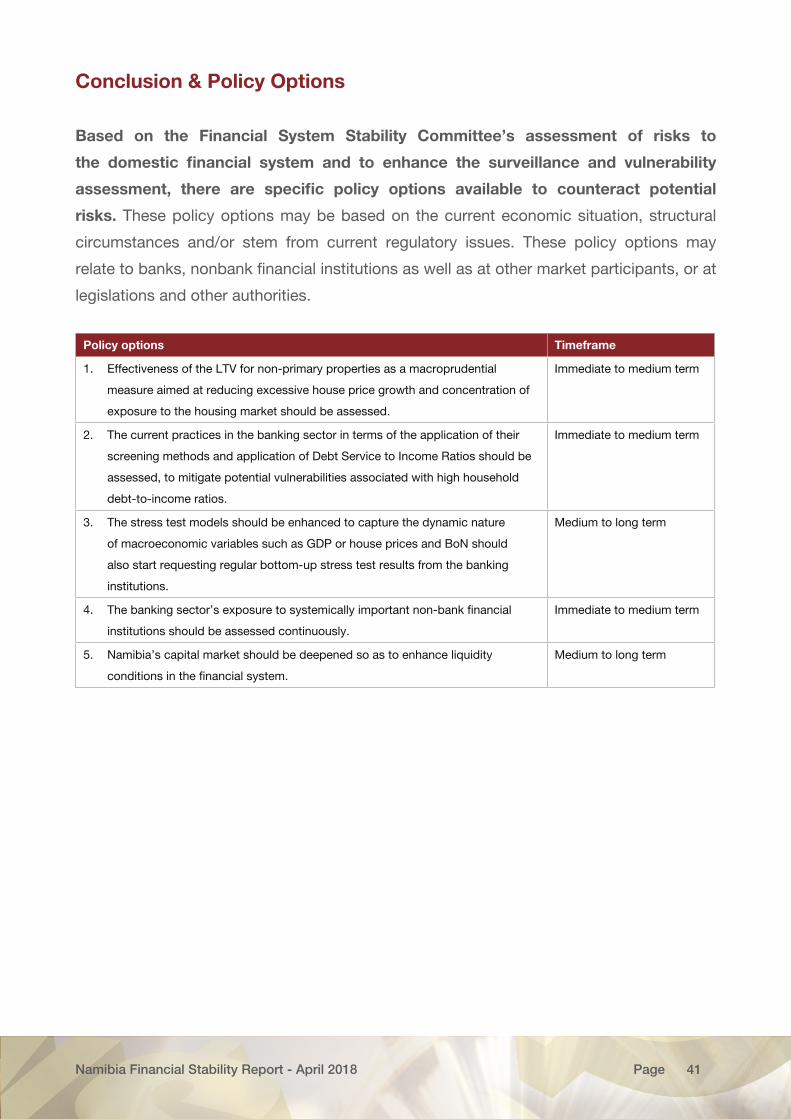
Namibia Financial Stability Report - April 2018 41Page
Conclusion & Policy Options
Based on the Financial System Stability Committee’s assessment of risks to
the domestic financial system and to enhance the surveillance and vulnerability
assessment, there are specific policy options available to counteract potential
risks. These policy options may be based on the current economic situation, structural
circumstances and/or stem from current regulatory issues. These policy options may
relate to banks, nonbank financial institutions as well as at other market participants, or at
legislations and other authorities.
Policy options Timeframe
1. Effectiveness of the LTV for non-primary properties as a macroprudential
measure aimed at reducing excessive house price growth and concentration of
exposure to the housing market should be assessed.
Immediate to medium term
2. The current practices in the banking sector in terms of the application of their
screening methods and application of Debt Service to Income Ratios should be
assessed, to mitigate potential vulnerabilities associated with high household
debt-to-income ratios.
Immediate to medium term
3. The stress test models should be enhanced to capture the dynamic nature
of macroeconomic variables such as GDP or house prices and BoN should
also start requesting regular bottom-up stress test results from the banking
institutions.
Medium to long term
4. The banking sector’s exposure to systemically important non-bank financial
institutions should be assessed continuously.
Immediate to medium term
5. Namibia’s capital market should be deepened so as to enhance liquidity
conditions in the financial system.
Medium to long term
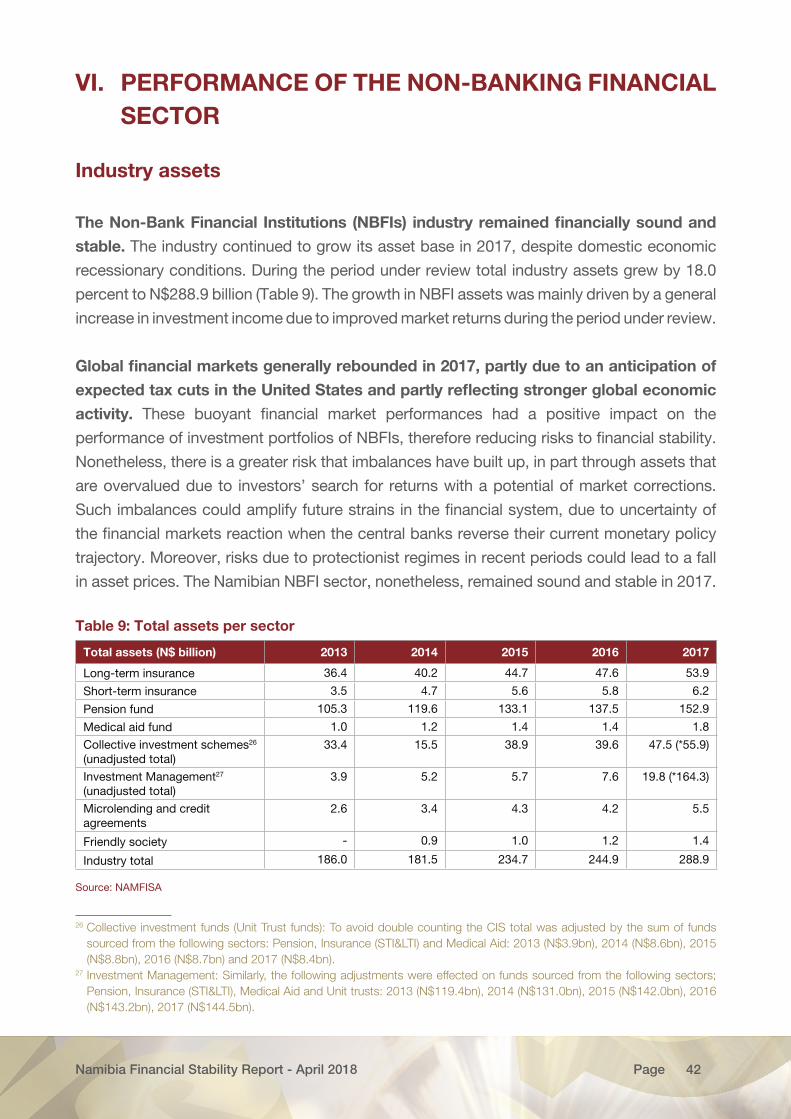
Namibia Financial Stability Report - April 2018 42Page
VI. PERFORMANCE OF THE NON-BANKING FINANCIAL SECTOR
Industry assets
The Non-Bank Financial Institutions (NBFIs) industry remained financially sound and
stable. The industry continued to grow its asset base in 2017, despite domestic economic
recessionary conditions. During the period under review total industry assets grew by 18.0
percent to N$288.9 billion (Table 9). The growth in NBFI assets was mainly driven by a general
increase in investment income due to improved market returns during the period under review.
Global financial markets generally rebounded in 2017, partly due to an anticipation of
expected tax cuts in the United States and partly reflecting stronger global economic
activity. These buoyant financial market performances had a positive impact on the
performance of investment portfolios of NBFIs, therefore reducing risks to financial stability.
Nonetheless, there is a greater risk that imbalances have built up, in part through assets that
are overvalued due to investors’ search for returns with a potential of market corrections.
Such imbalances could amplify future strains in the financial system, due to uncertainty of
the financial markets reaction when the central banks reverse their current monetary policy
trajectory. Moreover, risks due to protectionist regimes in recent periods could lead to a fall
in asset prices. The Namibian NBFI sector, nonetheless, remained sound and stable in 2017.
Table 9: Total assets per sector
Total assets (N$ billion) 2013 2014 2015 2016 2017
Long-term insurance 36.4 40.2 44.7 47.6 53.9
Short-term insurance 3.5 4.7 5.6 5.8 6.2
Pension fund 105.3 119.6 133.1 137.5 152.9
Medical aid fund 1.0 1.2 1.4 1.4 1.8
Collective investment schemes26 (unadjusted total)
33.4 15.5 38.9 39.6 47.5 (*55.9)
Investment Management27 (unadjusted total)
3.9 5.2 5.7 7.6 19.8 (*164.3)
Microlending and credit agreements
2.6 3.4 4.3 4.2 5.5
Friendly society - 0.9 1.0 1.2 1.4
Industry total 186.0 181.5 234.7 244.9 288.9
Source: NAMFISA 26 27
26 Collective investment funds (Unit Trust funds): To avoid double counting the CIS total was adjusted by the sum of funds sourced from the following sectors: Pension, Insurance (STI<I) and Medical Aid: 2013 (N$3.9bn), 2014 (N$8.6bn), 2015 (N$8.8bn), 2016 (N$8.7bn) and 2017 (N$8.4bn).
27 Investment Management: Similarly, the following adjustments were effected on funds sourced from the following sectors; Pension, Insurance (STI<I), Medical Aid and Unit trusts: 2013 (N$119.4bn), 2014 (N$131.0bn), 2015 (N$142.0bn), 2016 (N$143.2bn), 2017 (N$144.5bn).
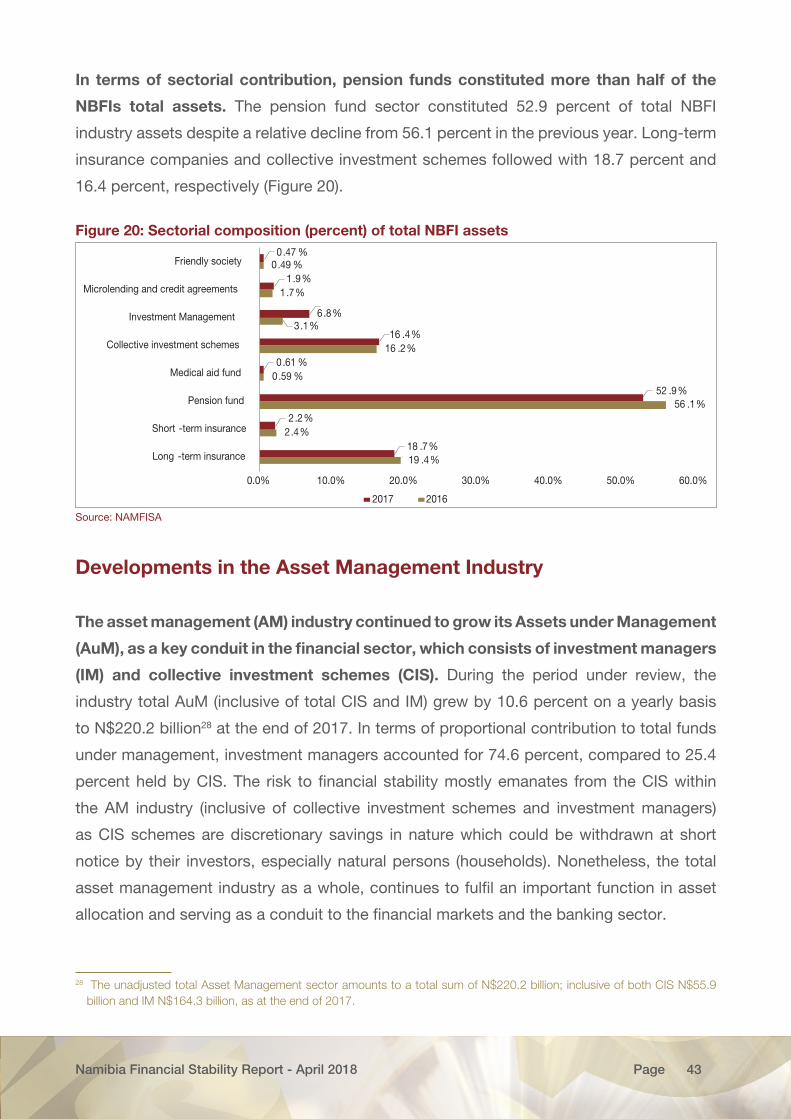
Namibia Financial Stability Report - April 2018 43Page
In terms of sectorial contribution, pension funds constituted more than half of the
NBFIs total assets. The pension fund sector constituted 52.9 percent of total NBFI
industry assets despite a relative decline from 56.1 percent in the previous year. Long-term
insurance companies and collective investment schemes followed with 18.7 percent and
16.4 percent, respectively (Figure 20).
Figure 20: Sectorial composition (percent) of total NBFI assets
19 .4%
2.4%
56 .1%
0.59 %
16 .2%
3.1%
1.7%
0.49 %
18 .7%
2.2%
52 .9%
0.61 %
16 .4%
6.8%
1.9%
0.47 %
0.0% 10.0% 20.0% 30.0% 40.0% 50.0% 60.0%
Long -term insurance
Short -term insurance
Pension fund
Medical aid fund
Collective investment schemes
Investment Management
Microlending and credit agreements
Friendly society
2017 2016
Source: NAMFISA
Developments in the Asset Management Industry
The asset management (AM) industry continued to grow its Assets under Management
(AuM), as a key conduit in the financial sector, which consists of investment managers
(IM) and collective investment schemes (CIS). During the period under review, the
industry total AuM (inclusive of total CIS and IM) grew by 10.6 percent on a yearly basis
to N$220.2 billion28 at the end of 2017. In terms of proportional contribution to total funds
under management, investment managers accounted for 74.6 percent, compared to 25.4
percent held by CIS. The risk to financial stability mostly emanates from the CIS within
the AM industry (inclusive of collective investment schemes and investment managers)
as CIS schemes are discretionary savings in nature which could be withdrawn at short
notice by their investors, especially natural persons (households). Nonetheless, the total
asset management industry as a whole, continues to fulfil an important function in asset
allocation and serving as a conduit to the financial markets and the banking sector.
28 The unadjusted total Asset Management sector amounts to a total sum of N$220.2 billion; inclusive of both CIS N$55.9 billion and IM N$164.3 billion, as at the end of 2017.
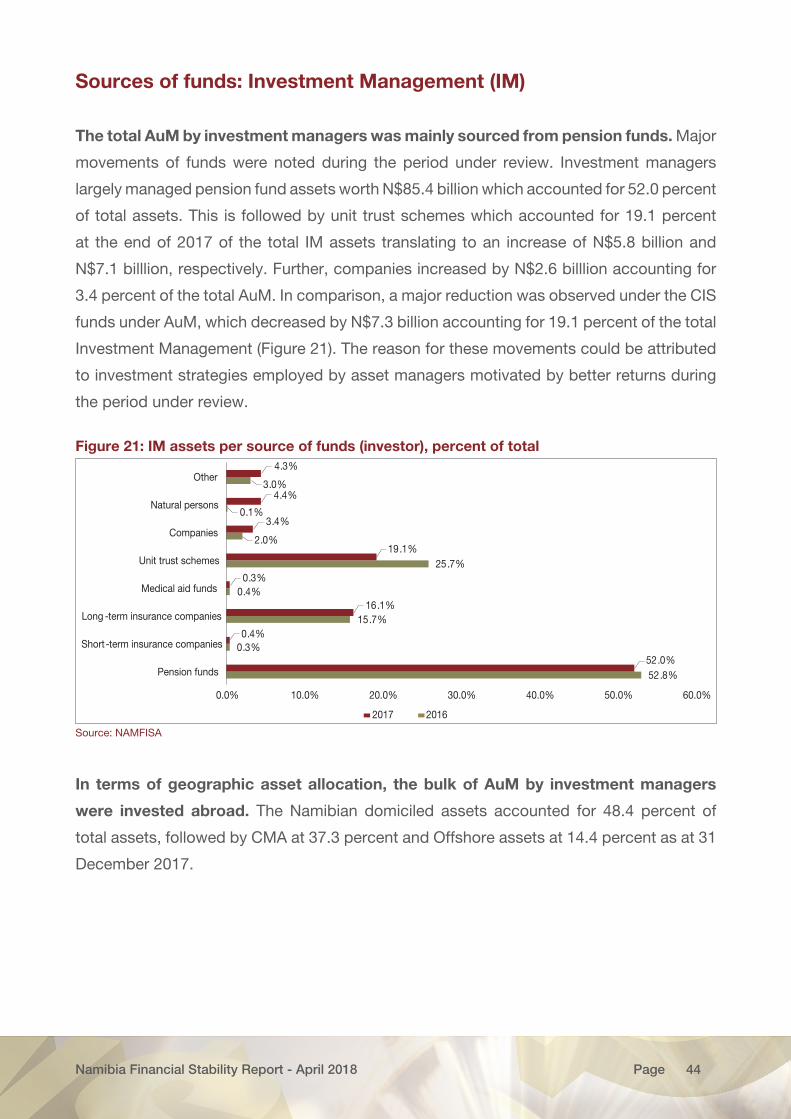
Namibia Financial Stability Report - April 2018 44Page
Sources of funds: Investment Management (IM)
The total AuM by investment managers was mainly sourced from pension funds. Major
movements of funds were noted during the period under review. Investment managers
largely managed pension fund assets worth N$85.4 billion which accounted for 52.0 percent
of total assets. This is followed by unit trust schemes which accounted for 19.1 percent
at the end of 2017 of the total IM assets translating to an increase of N$5.8 billion and
N$7.1 billlion, respectively. Further, companies increased by N$2.6 billlion accounting for
3.4 percent of the total AuM. In comparison, a major reduction was observed under the CIS
funds under AuM, which decreased by N$7.3 billion accounting for 19.1 percent of the total
Investment Management (Figure 21). The reason for these movements could be attributed
to investment strategies employed by asset managers motivated by better returns during
the period under review.
Figure 21: IM assets per source of funds (investor), percent of total
52.8%
0.3%
15.7%
0.4%
25.7%
2.0%
0.1%
3.0%
52.0%
0.4%
16.1%
0.3%
19.1%
3.4%
4.4%
4.3%
0.0% 10.0% 20.0% 30.0% 40.0% 50.0% 60.0%
Pension funds
Short-term insurance companies
Long -term insurance companies
Medical aid funds
Unit trust schemes
Companies
Natural persons
Other
2017 2016
Source: NAMFISA
In terms of geographic asset allocation, the bulk of AuM by investment managers
were invested abroad. The Namibian domiciled assets accounted for 48.4 percent of
total assets, followed by CMA at 37.3 percent and Offshore assets at 14.4 percent as at 31
December 2017.
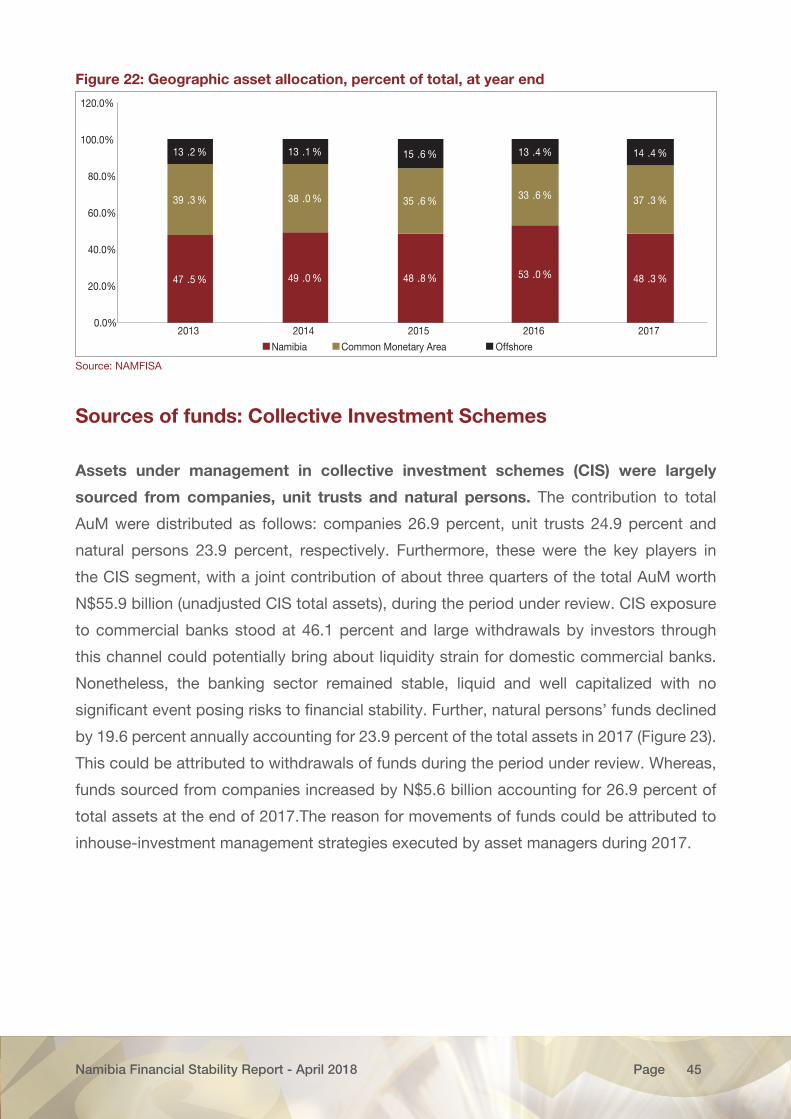
Namibia Financial Stability Report - April 2018 45Page
Figure 22: Geographic asset allocation, percent of total, at year end
47 .5 % 49 .0 % 48 .8 % 53 .0 % 48 .3 %
39 .3 % 38 .0 % 35 .6 % 33 .6 % 37 .3 %
13 .2 % 13 .1 % 15 .6 % 13 .4 % 14 .4 %
0.0%
20.0%
40.0%
60.0%
80.0%
100.0%
120.0%
2013 2014 2015 2016 2017
Namibia Common Monetary Area Offshore
Source: NAMFISA
Sources of funds: Collective Investment Schemes
Assets under management in collective investment schemes (CIS) were largely
sourced from companies, unit trusts and natural persons. The contribution to total
AuM were distributed as follows: companies 26.9 percent, unit trusts 24.9 percent and
natural persons 23.9 percent, respectively. Furthermore, these were the key players in
the CIS segment, with a joint contribution of about three quarters of the total AuM worth
N$55.9 billion (unadjusted CIS total assets), during the period under review. CIS exposure
to commercial banks stood at 46.1 percent and large withdrawals by investors through
this channel could potentially bring about liquidity strain for domestic commercial banks.
Nonetheless, the banking sector remained stable, liquid and well capitalized with no
significant event posing risks to financial stability. Further, natural persons’ funds declined
by 19.6 percent annually accounting for 23.9 percent of the total assets in 2017 (Figure 23).
This could be attributed to withdrawals of funds during the period under review. Whereas,
funds sourced from companies increased by N$5.6 billion accounting for 26.9 percent of
total assets at the end of 2017.The reason for movements of funds could be attributed to
inhouse-investment management strategies executed by asset managers during 2017.
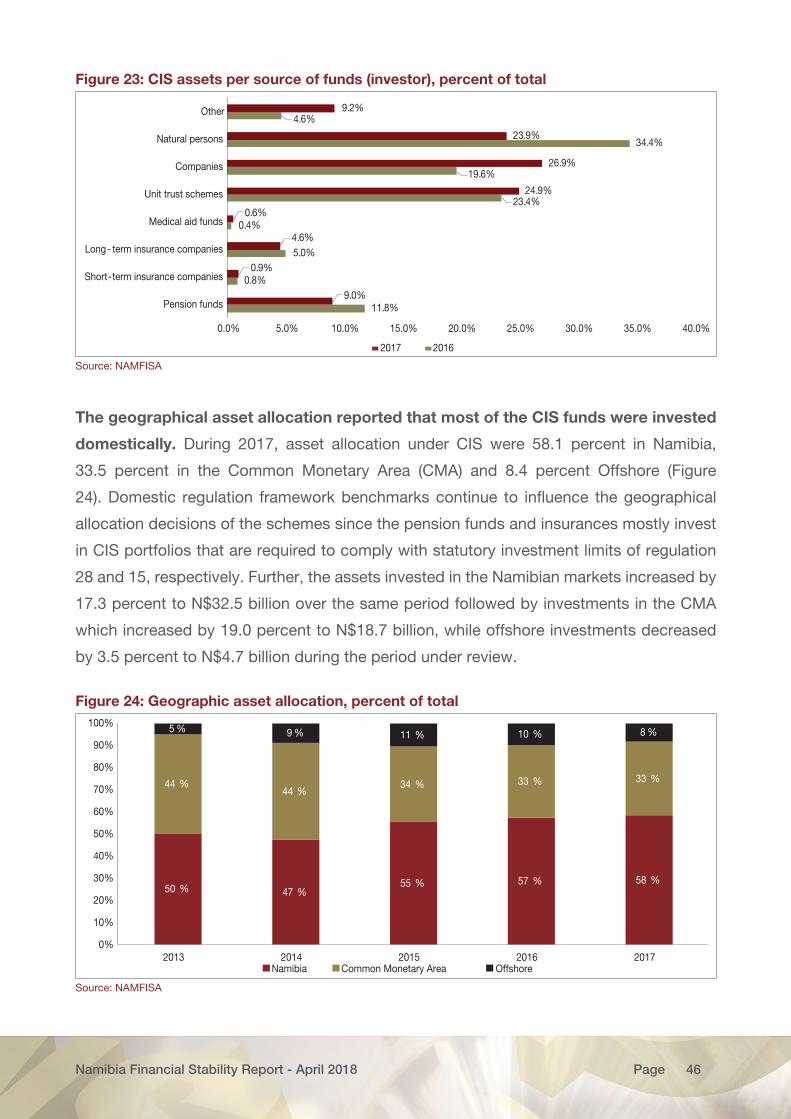
Namibia Financial Stability Report - April 2018 46Page
Figure 23: CIS assets per source of funds (investor), percent of total
2017 2016
11.8%
0.8%
5.0%
0.4%
23.4%
19.6%
34.4%
4.6%
9.0%
0.9%
4.6%
0.6%
24.9%
26.9%
23.9%
9.2%
0.0% 5.0% 10.0% 15.0% 20.0% 25.0% 30.0% 35.0% 40.0%
Pension funds
Short-term insurance companies
Long- term insurance companies
Medical aid funds
Unit trust schemes
Companies
Natural persons
Other
Source: NAMFISA
The geographical asset allocation reported that most of the CIS funds were invested
domestically. During 2017, asset allocation under CIS were 58.1 percent in Namibia,
33.5 percent in the Common Monetary Area (CMA) and 8.4 percent Offshore (Figure
24). Domestic regulation framework benchmarks continue to influence the geographical
allocation decisions of the schemes since the pension funds and insurances mostly invest
in CIS portfolios that are required to comply with statutory investment limits of regulation
28 and 15, respectively. Further, the assets invested in the Namibian markets increased by
17.3 percent to N$32.5 billion over the same period followed by investments in the CMA
which increased by 19.0 percent to N$18.7 billion, while offshore investments decreased
by 3.5 percent to N$4.7 billion during the period under review.
Figure 24: Geographic asset allocation, percent of total
Namibia Common Monetary Area Offshore
50 % 47 %55 % 57 % 58 %
44 %44 %
34 % 33 % 33 %
5 % 9 % 11 % 10 % 8 %
0%
10%
20%
30%
40%
50%
60%
70%
80%
90%
100%
2013 2014 2015 2016 2017
Source: NAMFISA
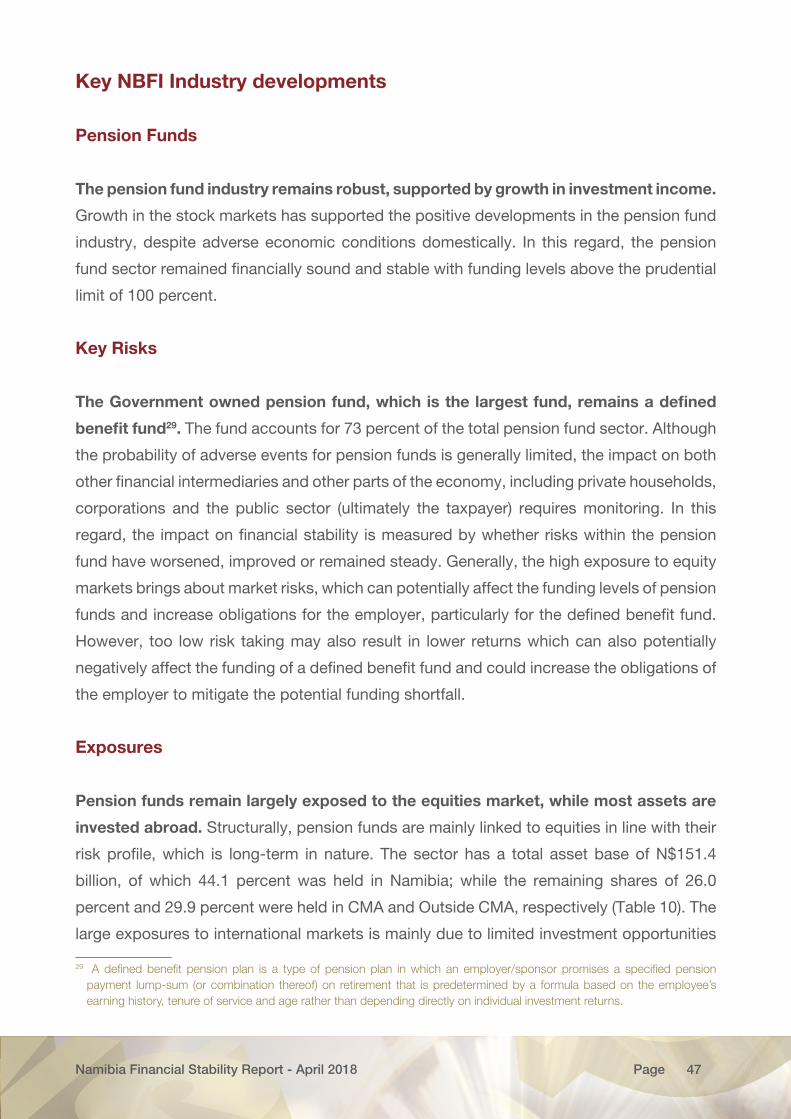
Namibia Financial Stability Report - April 2018 47Page
Key NBFI Industry developments
Pension Funds
The pension fund industry remains robust, supported by growth in investment income.
Growth in the stock markets has supported the positive developments in the pension fund
industry, despite adverse economic conditions domestically. In this regard, the pension
fund sector remained financially sound and stable with funding levels above the prudential
limit of 100 percent.
Key Risks
The Government owned pension fund, which is the largest fund, remains a defined
benefit fund29. The fund accounts for 73 percent of the total pension fund sector. Although
the probability of adverse events for pension funds is generally limited, the impact on both
other financial intermediaries and other parts of the economy, including private households,
corporations and the public sector (ultimately the taxpayer) requires monitoring. In this
regard, the impact on financial stability is measured by whether risks within the pension
fund have worsened, improved or remained steady. Generally, the high exposure to equity
markets brings about market risks, which can potentially affect the funding levels of pension
funds and increase obligations for the employer, particularly for the defined benefit fund.
However, too low risk taking may also result in lower returns which can also potentially
negatively affect the funding of a defined benefit fund and could increase the obligations of
the employer to mitigate the potential funding shortfall.
Exposures
Pension funds remain largely exposed to the equities market, while most assets are
invested abroad. Structurally, pension funds are mainly linked to equities in line with their
risk profile, which is long-term in nature. The sector has a total asset base of N$151.4
billion, of which 44.1 percent was held in Namibia; while the remaining shares of 26.0
percent and 29.9 percent were held in CMA and Outside CMA, respectively (Table 10). The
large exposures to international markets is mainly due to limited investment opportunities
29 A defined benefit pension plan is a type of pension plan in which an employer/sponsor promises a specified pension payment lump-sum (or combination thereof) on retirement that is predetermined by a formula based on the employee’s earning history, tenure of service and age rather than depending directly on individual investment returns.
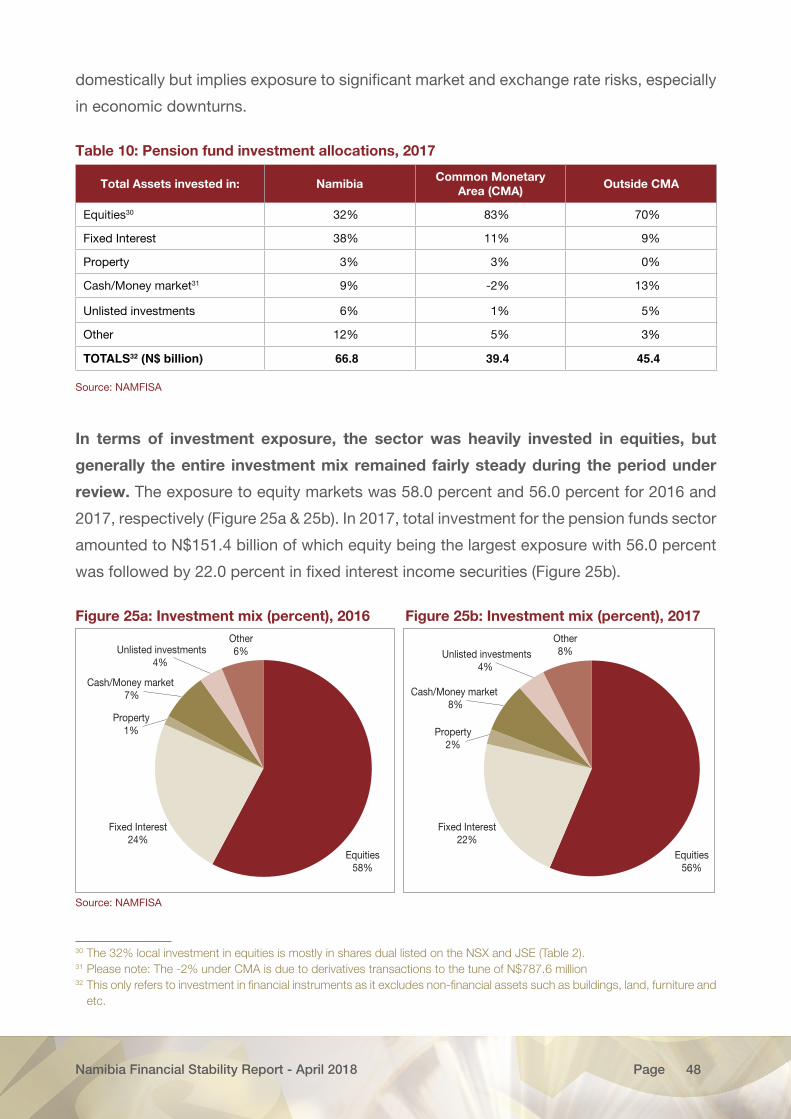
Namibia Financial Stability Report - April 2018 48Page
domestically but implies exposure to significant market and exchange rate risks, especially
in economic downturns.
Table 10: Pension fund investment allocations, 2017
Total Assets invested in: NamibiaCommon Monetary
Area (CMA)Outside CMA
Equities30 32% 83% 70%
Fixed Interest 38% 11% 9%
Property 3% 3% 0%
Cash/Money market31 9% -2% 13%
Unlisted investments 6% 1% 5%
Other 12% 5% 3%
TOTALS32 (N$ billion) 66.8 39.4 45.4
Source: NAMFISA
In terms of investment exposure, the sector was heavily invested in equities, but
generally the entire investment mix remained fairly steady during the period under
review. The exposure to equity markets was 58.0 percent and 56.0 percent for 2016 and
2017, respectively (Figure 25a & 25b). In 2017, total investment for the pension funds sector
amounted to N$151.4 billion of which equity being the largest exposure with 56.0 percent
was followed by 22.0 percent in fixed interest income securities (Figure 25b).
Figure 25a: Investment mix (percent), 2016 Figure 25b: Investment mix (percent), 2017
Property1%
Equities58%
Fixed Interest24%
Cash/Money market 7%
Unlisted investments4%
Other6%
Equities56%
Fixed Interest22%
Property2%
Cash/Money market 8%
Unlisted investments4%
Other8%
Source: NAMFISA 30 31 32
30 The 32% local investment in equities is mostly in shares dual listed on the NSX and JSE (Table 2).31 Please note: The -2% under CMA is due to derivatives transactions to the tune of N$787.6 million32 This only refers to investment in financial instruments as it excludes non-financial assets such as buildings, land, furniture and
etc.
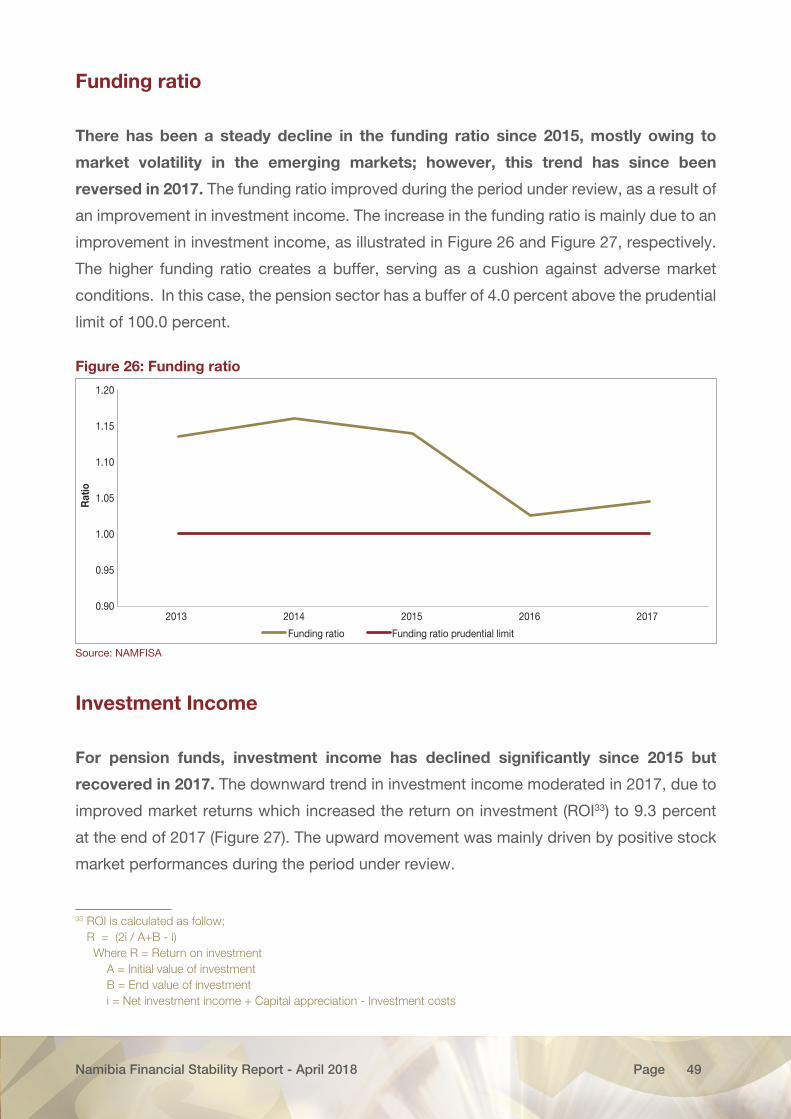
Namibia Financial Stability Report - April 2018 49Page
Funding ratio
There has been a steady decline in the funding ratio since 2015, mostly owing to
market volatility in the emerging markets; however, this trend has since been
reversed in 2017. The funding ratio improved during the period under review, as a result of
an improvement in investment income. The increase in the funding ratio is mainly due to an
improvement in investment income, as illustrated in Figure 26 and Figure 27, respectively.
The higher funding ratio creates a buffer, serving as a cushion against adverse market
conditions. In this case, the pension sector has a buffer of 4.0 percent above the prudential
limit of 100.0 percent.
Figure 26: Funding ratio
0.90
0.95
1.00
1.05
1.10
1.15
1.20
Rat
io
2013 2014 2015 2016 2017
Funding ratio Funding ratio prudential limit
Source: NAMFISA
Investment Income
For pension funds, investment income has declined significantly since 2015 but
recovered in 2017. The downward trend in investment income moderated in 2017, due to
improved market returns which increased the return on investment (ROI33) to 9.3 percent
at the end of 2017 (Figure 27). The upward movement was mainly driven by positive stock
market performances during the period under review.
33 ROI is calculated as follow; R = (2i / A+B - i) Where R = Return on investment A = Initial value of investment B = End value of investment i = Net investment income + Capital appreciation - Investment costs
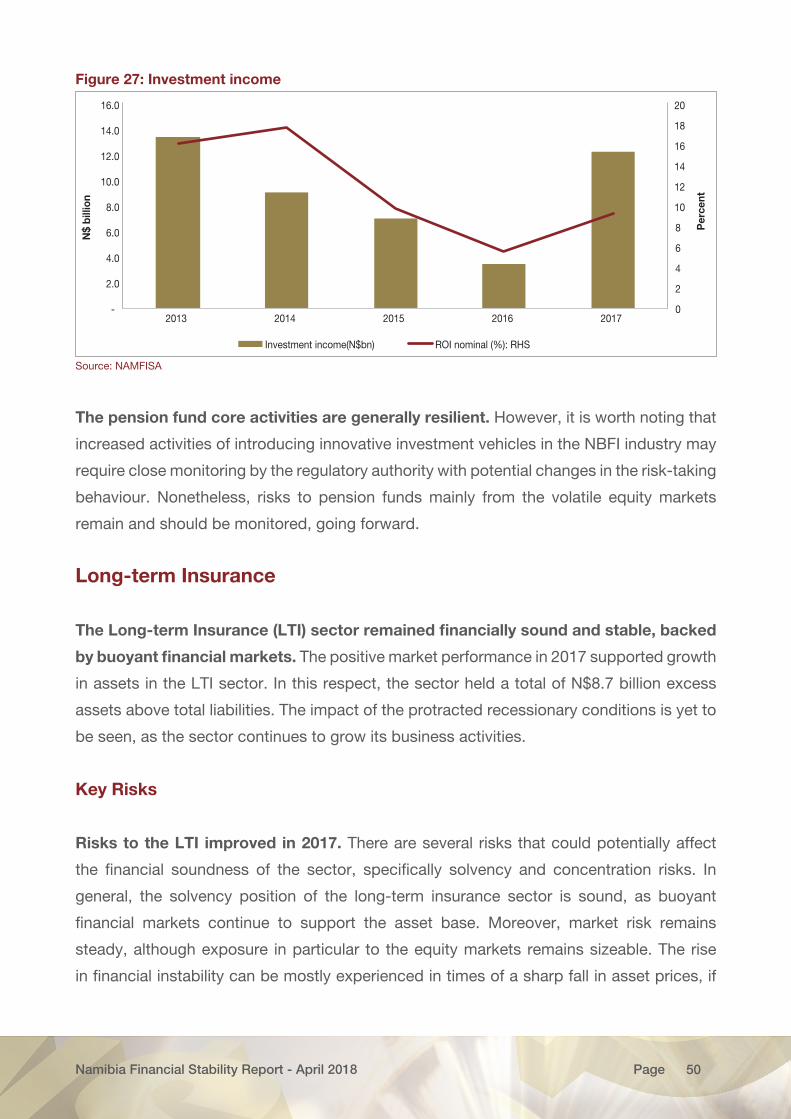
Namibia Financial Stability Report - April 2018 50Page
Figure 27: Investment income
0
2
4
6
8
10
12
14
16
18
20
-
2.0
4.0
6.0
8.0
10.0
12.0
14.0
16.0
2013 2014 2015 2016 2017
Per
cent
N$
billi
on
Investment income(N$bn) ROI nominal (%): RHS
Source: NAMFISA
The pension fund core activities are generally resilient. However, it is worth noting that
increased activities of introducing innovative investment vehicles in the NBFI industry may
require close monitoring by the regulatory authority with potential changes in the risk-taking
behaviour. Nonetheless, risks to pension funds mainly from the volatile equity markets
remain and should be monitored, going forward.
Long-term Insurance
The Long-term Insurance (LTI) sector remained financially sound and stable, backed
by buoyant financial markets. The positive market performance in 2017 supported growth
in assets in the LTI sector. In this respect, the sector held a total of N$8.7 billion excess
assets above total liabilities. The impact of the protracted recessionary conditions is yet to
be seen, as the sector continues to grow its business activities.
Key Risks
Risks to the LTI improved in 2017. There are several risks that could potentially affect
the financial soundness of the sector, specifically solvency and concentration risks. In
general, the solvency position of the long-term insurance sector is sound, as buoyant
financial markets continue to support the asset base. Moreover, market risk remains
steady, although exposure in particular to the equity markets remains sizeable. The rise
in financial instability can be mostly experienced in times of a sharp fall in asset prices, if
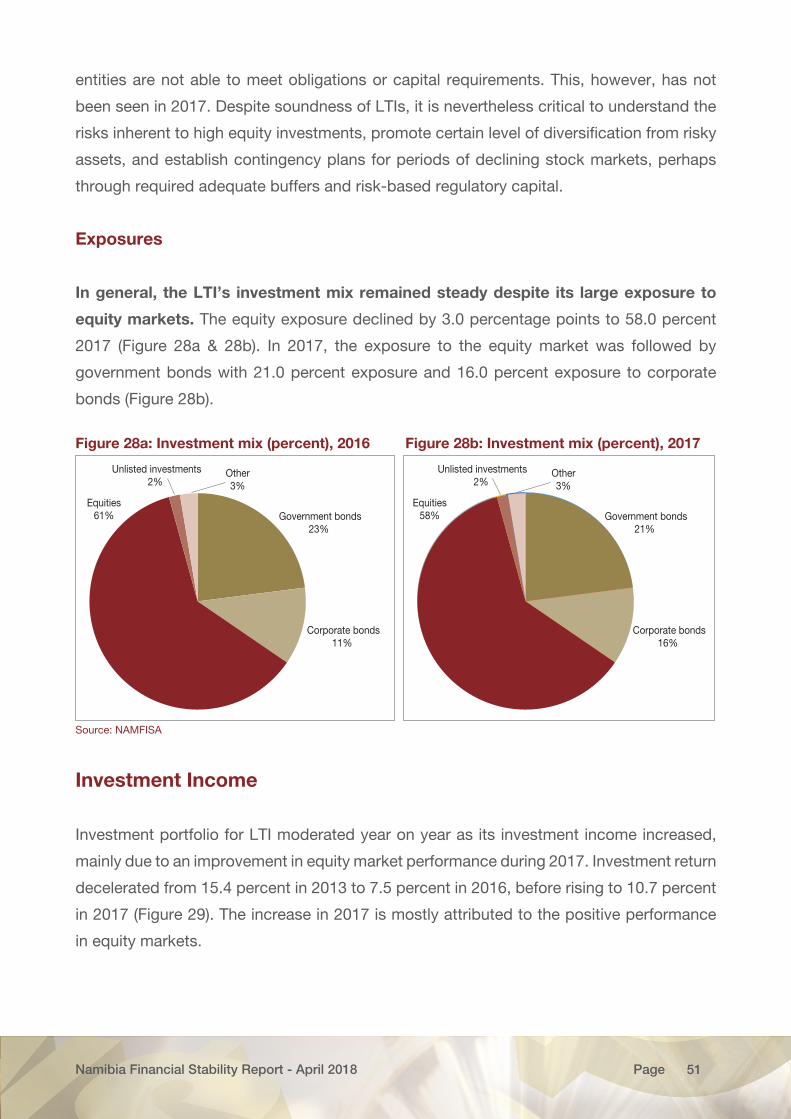
Namibia Financial Stability Report - April 2018 51Page
entities are not able to meet obligations or capital requirements. This, however, has not
been seen in 2017. Despite soundness of LTIs, it is nevertheless critical to understand the
risks inherent to high equity investments, promote certain level of diversification from risky
assets, and establish contingency plans for periods of declining stock markets, perhaps
through required adequate buffers and risk-based regulatory capital.
Exposures
In general, the LTI’s investment mix remained steady despite its large exposure to
equity markets. The equity exposure declined by 3.0 percentage points to 58.0 percent
2017 (Figure 28a & 28b). In 2017, the exposure to the equity market was followed by
government bonds with 21.0 percent exposure and 16.0 percent exposure to corporate
bonds (Figure 28b).
Figure 28a: Investment mix (percent), 2016 Figure 28b: Investment mix (percent), 2017
Equities61%
Unlisted investments2%
Government bonds23%
Corporate bonds11%
Other3%
Equities58%
Unlisted investments2%
Government bonds21%
Corporate bonds16%
Other3%
Source: NAMFISA
Investment Income
Investment portfolio for LTI moderated year on year as its investment income increased,
mainly due to an improvement in equity market performance during 2017. Investment return
decelerated from 15.4 percent in 2013 to 7.5 percent in 2016, before rising to 10.7 percent
in 2017 (Figure 29). The increase in 2017 is mostly attributed to the positive performance
in equity markets.
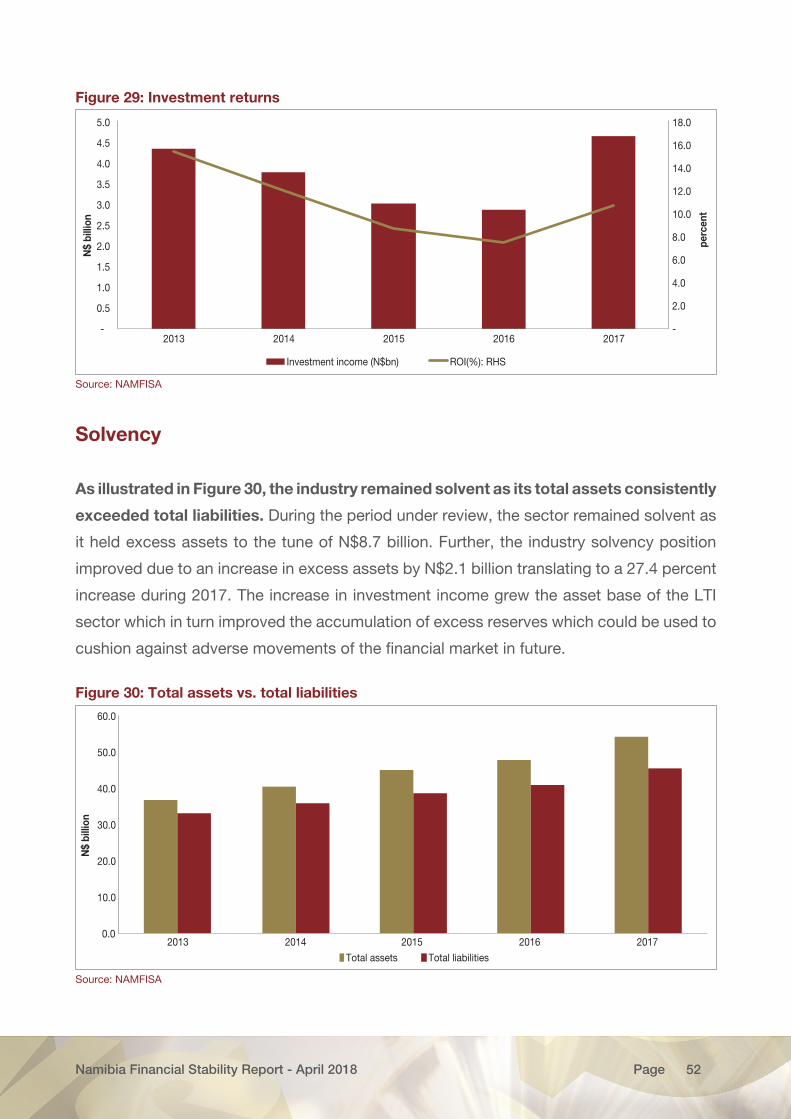
Namibia Financial Stability Report - April 2018 52Page
Figure 29: Investment returns
-
2.0
4.0
6.0
8.0
10.0
12.0
14.0
16.0
18.0
-
0.5
1.0
1.5
2.0
2.5
3.0
3.5
4.0
4.5
5.0
2013 2014 2015 2016 2017
perc
ent
N$
billi
on
Investment income (N$bn) ROI(%): RHS
Source: NAMFISA
Solvency
As illustrated in Figure 30, the industry remained solvent as its total assets consistently
exceeded total liabilities. During the period under review, the sector remained solvent as
it held excess assets to the tune of N$8.7 billion. Further, the industry solvency position
improved due to an increase in excess assets by N$2.1 billion translating to a 27.4 percent
increase during 2017. The increase in investment income grew the asset base of the LTI
sector which in turn improved the accumulation of excess reserves which could be used to
cushion against adverse movements of the financial market in future.
Figure 30: Total assets vs. total liabilities
0.0
10.0
20.0
30.0
40.0
50.0
60.0
2013 2014 2015 2016 2017
N$
billi
on
Total assets Total liabilities
Source: NAMFISA
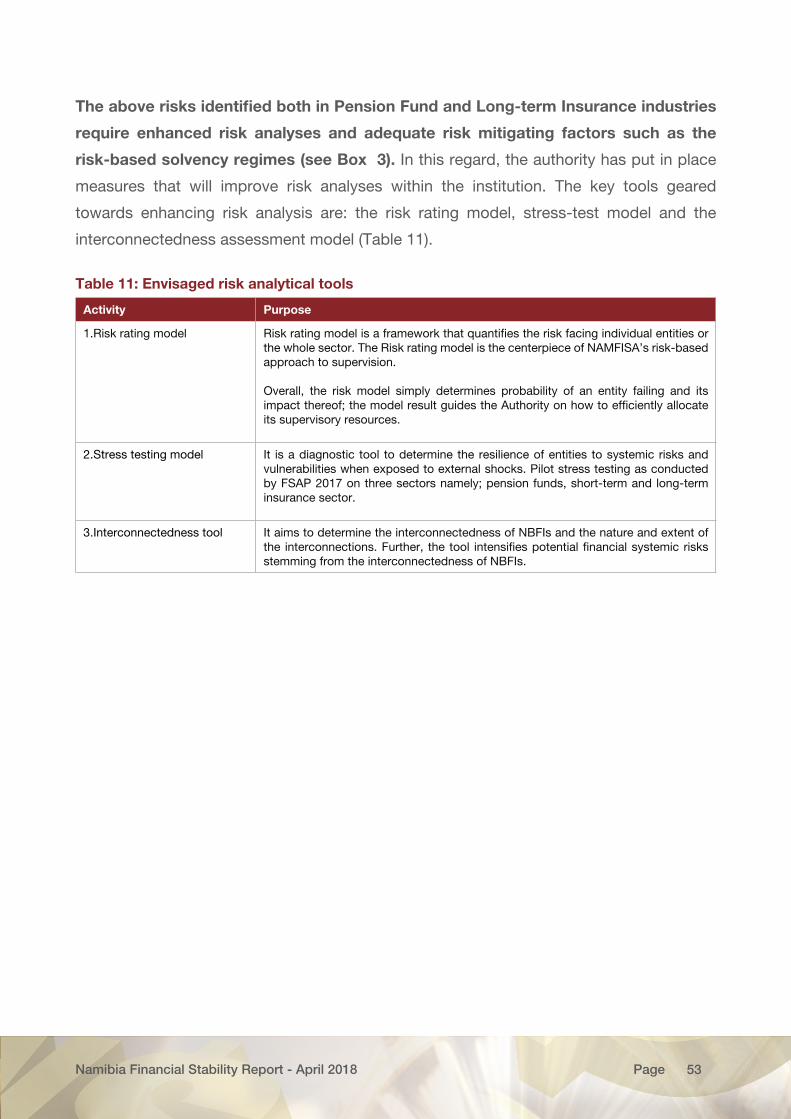
Namibia Financial Stability Report - April 2018 53Page
The above risks identified both in Pension Fund and Long-term Insurance industries
require enhanced risk analyses and adequate risk mitigating factors such as the
risk-based solvency regimes (see Box 3). In this regard, the authority has put in place
measures that will improve risk analyses within the institution. The key tools geared
towards enhancing risk analysis are: the risk rating model, stress-test model and the
interconnectedness assessment model (Table 11).
Table 11: Envisaged risk analytical tools
Activity Purpose
1.Risk rating model Risk rating model is a framework that quantifies the risk facing individual entities or the whole sector. The Risk rating model is the centerpiece of NAMFISA’s risk-based approach to supervision.
Overall, the risk model simply determines probability of an entity failing and its impact thereof; the model result guides the Authority on how to efficiently allocate its supervisory resources.
2.Stress testing model It is a diagnostic tool to determine the resilience of entities to systemic risks and vulnerabilities when exposed to external shocks. Pilot stress testing as conducted by FSAP 2017 on three sectors namely; pension funds, short-term and long-term insurance sector.
3.Interconnectedness tool It aims to determine the interconnectedness of NBFIs and the nature and extent of the interconnections. Further, the tool intensifies potential financial systemic risks stemming from the interconnectedness of NBFIs.
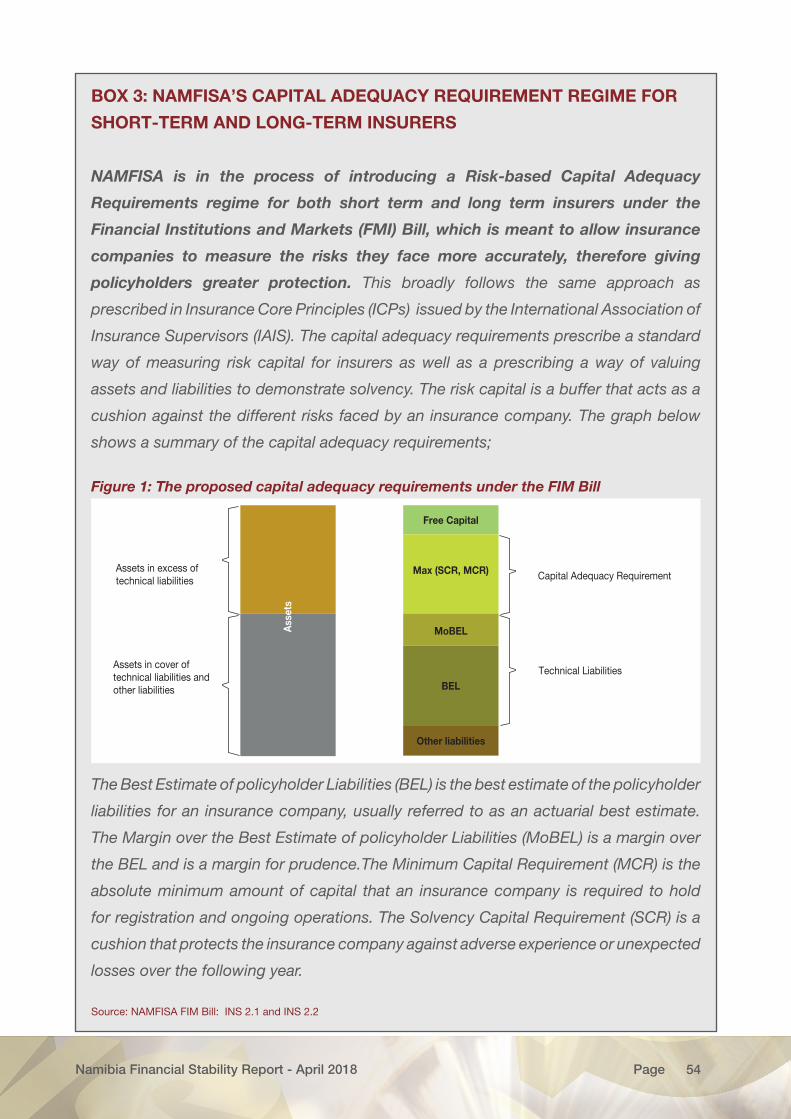
Namibia Financial Stability Report - April 2018 54Page
BOX 3: NAMFISA’S CAPITAL ADEQUACY REQUIREMENT REGIME FOR
SHORT-TERM AND LONG-TERM INSURERS
NAMFISA is in the process of introducing a Risk-based Capital Adequacy
Requirements regime for both short term and long term insurers under the
Financial Institutions and Markets (FMI) Bill, which is meant to allow insurance
companies to measure the risks they face more accurately, therefore giving
policyholders greater protection. This broadly follows the same approach as
prescribed in Insurance Core Principles (ICPs) issued by the International Association of
Insurance Supervisors (IAIS). The capital adequacy requirements prescribe a standard
way of measuring risk capital for insurers as well as a prescribing a way of valuing
assets and liabilities to demonstrate solvency. The risk capital is a buffer that acts as a
cushion against the different risks faced by an insurance company. The graph below
shows a summary of the capital adequacy requirements;
Figure 1: The proposed capital adequacy requirements under the FIM Bill
Ass
ets
Free Capital
Max (SCR, MCR)
MoBEL
BEL
Other liabilities
Capital Adequacy Requirement
Technical Liabilities
Assets in excess of technical liabilities
Assets in cover of technical liabilities and other liabilities
The Best Estimate of policyholder Liabilities (BEL) is the best estimate of the policyholder
liabilities for an insurance company, usually referred to as an actuarial best estimate.
The Margin over the Best Estimate of policyholder Liabilities (MoBEL) is a margin over
the BEL and is a margin for prudence.The Minimum Capital Requirement (MCR) is the
absolute minimum amount of capital that an insurance company is required to hold
for registration and ongoing operations. The Solvency Capital Requirement (SCR) is a
cushion that protects the insurance company against adverse experience or unexpected
losses over the following year.
Source: NAMFISA FIM Bill: INS 2.1 and INS 2.2
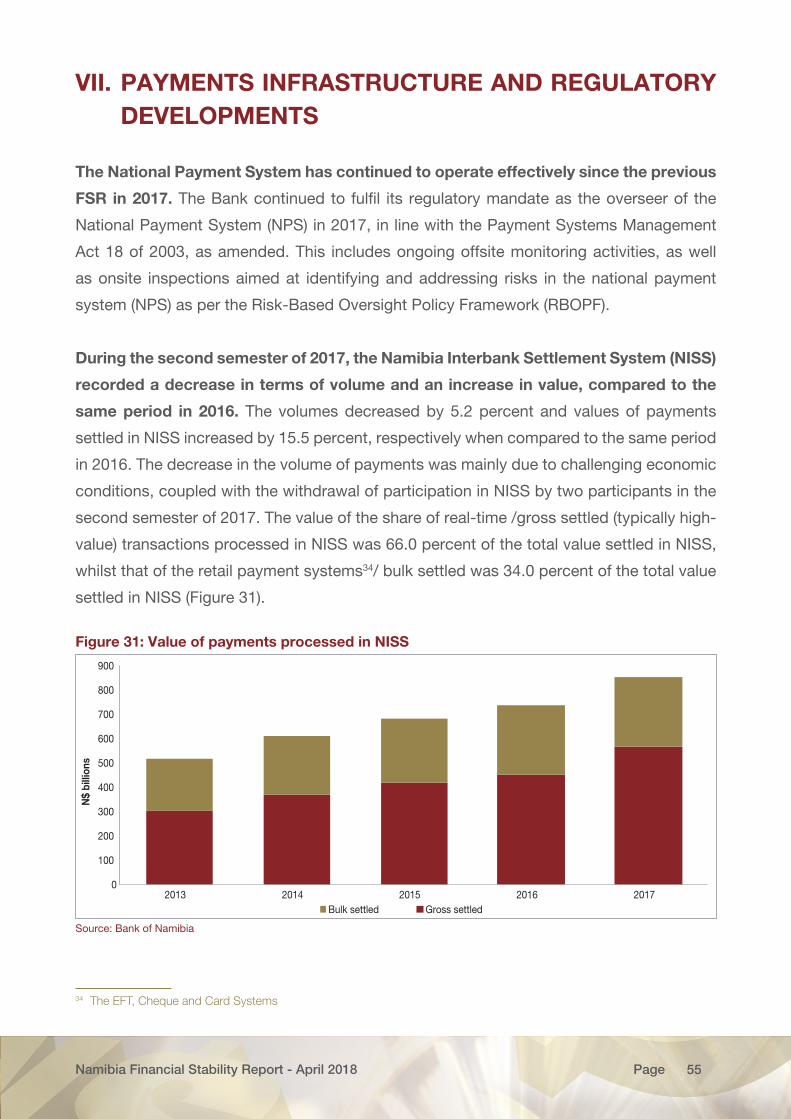
Namibia Financial Stability Report - April 2018 55Page
VII. PAYMENTS INFRASTRUCTURE AND REGULATORY DEVELOPMENTS
The National Payment System has continued to operate effectively since the previous
FSR in 2017. The Bank continued to fulfil its regulatory mandate as the overseer of the
National Payment System (NPS) in 2017, in line with the Payment Systems Management
Act 18 of 2003, as amended. This includes ongoing offsite monitoring activities, as well
as onsite inspections aimed at identifying and addressing risks in the national payment
system (NPS) as per the Risk-Based Oversight Policy Framework (RBOPF).
During the second semester of 2017, the Namibia Interbank Settlement System (NISS)
recorded a decrease in terms of volume and an increase in value, compared to the
same period in 2016. The volumes decreased by 5.2 percent and values of payments
settled in NISS increased by 15.5 percent, respectively when compared to the same period
in 2016. The decrease in the volume of payments was mainly due to challenging economic
conditions, coupled with the withdrawal of participation in NISS by two participants in the
second semester of 2017. The value of the share of real-time /gross settled (typically high-
value) transactions processed in NISS was 66.0 percent of the total value settled in NISS,
whilst that of the retail payment systems34/ bulk settled was 34.0 percent of the total value
settled in NISS (Figure 31).
Figure 31: Value of payments processed in NISS
0
100
200
300
400
500
600
700
800
900
2013 2014 2015 2016 2017
N$
billi
ons
Bulk settled Gross settled
Source: Bank of Namibia
34 The EFT, Cheque and Card Systems
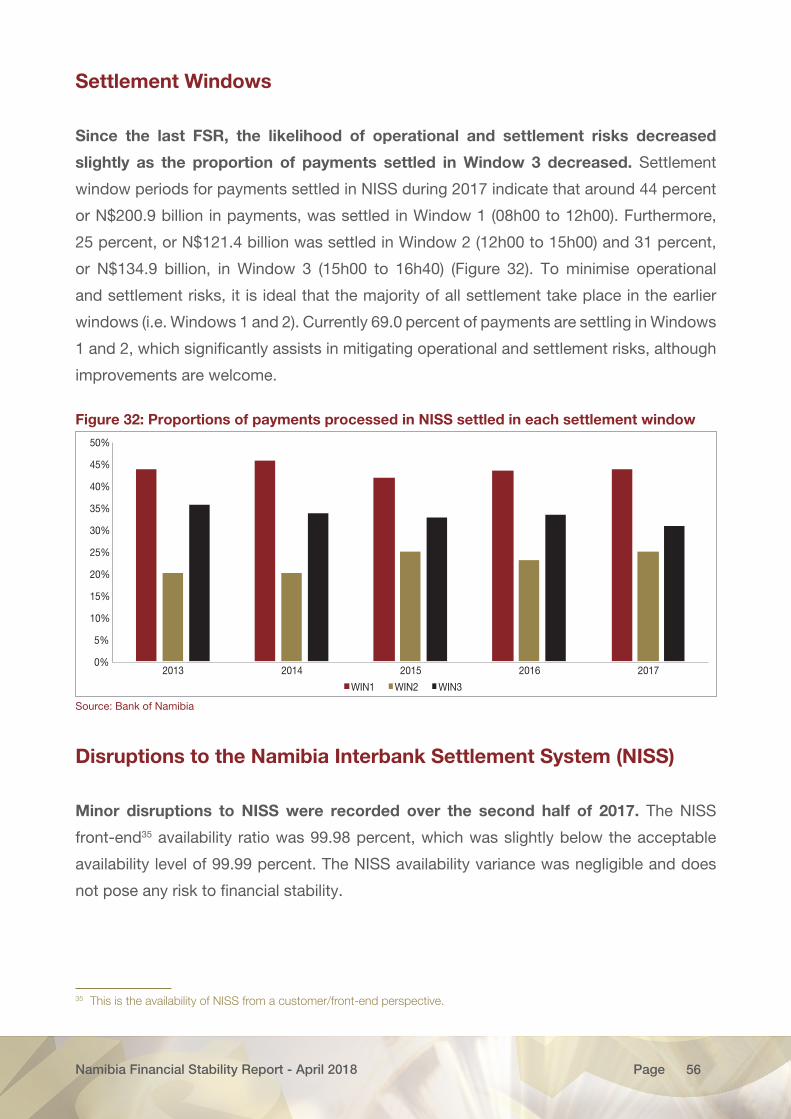
Namibia Financial Stability Report - April 2018 56Page
Settlement Windows
Since the last FSR, the likelihood of operational and settlement risks decreased
slightly as the proportion of payments settled in Window 3 decreased. Settlement
window periods for payments settled in NISS during 2017 indicate that around 44 percent
or N$200.9 billion in payments, was settled in Window 1 (08h00 to 12h00). Furthermore,
25 percent, or N$121.4 billion was settled in Window 2 (12h00 to 15h00) and 31 percent,
or N$134.9 billion, in Window 3 (15h00 to 16h40) (Figure 32). To minimise operational
and settlement risks, it is ideal that the majority of all settlement take place in the earlier
windows (i.e. Windows 1 and 2). Currently 69.0 percent of payments are settling in Windows
1 and 2, which significantly assists in mitigating operational and settlement risks, although
improvements are welcome.
Figure 32: Proportions of payments processed in NISS settled in each settlement window
0%
5%
10%
15%
20%
25%
30%
35%
40%
45%
50%
2013 2014 2015 2016 2017
WIN1 WIN2 WIN3
Source: Bank of Namibia
Disruptions to the Namibia Interbank Settlement System (NISS)
Minor disruptions to NISS were recorded over the second half of 2017. The NISS
front-end35 availability ratio was 99.98 percent, which was slightly below the acceptable
availability level of 99.99 percent. The NISS availability variance was negligible and does
not pose any risk to financial stability.
35 This is the availability of NISS from a customer/front-end perspective.
Namibia Financial Stability Report - April 2018 57Page
Security of Retail Payments
The total value of fraud within the NPS decreased when compared to 2016 which
resulted in the fraud-to-turnover ratio remaining below the set threshold of 0.05
percent. A safety index indicator is monitored by the Bank to ensure that the fraud-to-
turnover ratio is below 0.05 percent. The fraud-to-turnover ratio is calculated as a proportion
of the total value settled by Namibians using cheques, Electronic Fund Transfers (EFT) and
payment cards (debit, credit and hybrid cards). During 2017, the average fraud-to-turnover
ratio was 0.003 percent, a decrease when compared to the 0.006 percent recorded for
2016. The general decrease of fraud was mainly due to the increased adoption of the
Europay-MasterCard-Visa (EMV) compliant cards, which were introduced to combat card
fraud (card cloning). Industry recorded a decrease of 66.0 percent which was lost through
the use of cards as a payment instrument when compared to 2016. The EFT and cheques
streams remained the safer payment instruments for the reporting period. The total value
of fraud attributable to the EFT and cheque streams amounted to N$2.3 million and N$2.07
million, respectively.
The National Payments Systems stakeholders continue to collaborate and monitor
emerging fraud trends and related activities, and work with enforcement agencies
and consumer associations to avert fraud incidents involving retail payment systems.
There have been significant efforts by the payments industry to enhance business practices,
payments infrastructure and related products to better protect consumers against new
methods of perpetrating fraud. Furthermore, consumer awareness programmes are ongoing
and have assisted in creating public awareness on fraud risks and prevention measures.
Security efforts by the Bank and industry contribute to ensuring that the NPS and broader
financial sector remain stable, safe and secure, which in turn reinforces trust in the financial
system.
To combat fraud such as forged or counterfeited cards, the industry has embarked
upon an Europay-MasterCard-Visa (EMV) compliance project for various cards
used in the NPS. This international standard requires cards to have a “chip” instead
of a “magstripe” for authenticating card transactions, making it much more difficult for
cards to be cloned. The main objective of the EMV compliance project is to ensure the
timely implementation of EMV-compliant Chip and PIN cards in Namibia. The initiative is
expected to curb card fraud (card cloning) locally and internationally. As was previously
Namibia Financial Stability Report - April 2018 58Page
reported, 100 percent of all Point-Of-Sale (POS) and Automated Teller Machines (ATM)
are compliant, which means that all POS and ATMs can accept Chip and PIN cards. At the
end of 2017, 92.0 percent of the total number of cards in the NPS were EMV-compliant.
This is a significant improvement from the 64 percent reported in 2016. Furthermore, as
of 31 May 2018, all non-EMV-compliant cards will be discontinued and will no longer be
usable. Currently, all banks have devised strategies to get their clients to collect their EMV
compliant cards.
Protecting payment card data along all points in its journey i.e., from payment
initiation to payment settlement remains one of the strongest ways to prevent data
compromises that can lead to card fraud. PCI DSS compliance helps with the protection
of confidential card payment information across all payment points. The current PCI DSS
project plan indicates that all relevant NPS participants aim to be PCI DSS certified by 31
December 2018.
Namibia Financial Stability Report - April 2018 59Page
BOX 4: CURRENT AND FUTURE DEVELOPMENTS IN PAYMENT AND
SETTLEMENT SYSTEMS
The Determination on the Reduction of the Item Limit for Domestic Cheque
Payments within the Namibian NPS (PSD-2) was amended and gazetted
to postpone the phasing out of cheques to address legislative concerns by
recommending the amendment of the affected legislations to Government for
reform. The affected legislations make pertinent reference to cheques as a payment
instrument and is therefore deemed contradictory with the envisaged phasing out of
cheques in Namibia. Once progress is made on the aforementioned, the Bank will
provide the necessary communication with regard to the full implementation of the
undertaking. The cheque instrument is one of the most embattled instruments when it
comes to fraudulent transactions, because of current manual inefficient processes. The
phasing out of cheques and the utilising of other instruments will increase efficiency
and safety around payments processing for the consumer.
During 2017, stakeholders of the NPS participated in the review of the National
Payment System Vision 2020. The review assessed the progress and challenges
on the key strategies outlined in the 2020 Vision document. Annual reviews will be
conducted to ensure execution of the key strategies concerned with but not limited to
the financial inclusion and accessibility, governance of the NPS, fees and charges and
NPS Capacity. Continuous monitoring of the NPS Vision also ensures that the Bank and
relevant stakeholders contribute to the National Development Plan strategies, which
include the enhancement of the National Payment System infrastructure, safety, security
and cost effectiveness, as well as the creation of an enabling regulatory environment
for the financial and service sector.
In 2017, the Bank of Namibia released a position paper on Distributed Ledger
Technologies (DLTs) and Virtual Currencies (VCs). The position paper is aimed at
informing and educating the Namibian public and stating the Bank’s position on DLTs
and digital currencies with a specific focus on VCs. The overall position of the Bank is
that virtual currencies are not legal tender currencies or payment instruments in Namibia
and the establishment of virtual currency exchanges or bureaus is also not allowed in
Namibia. The Bank does however recognise the potential impact distributed ledger
Namibia Financial Stability Report - April 2018 60Page
technologies might have in Namibia. Distributed ledger technologies could introduce
efficiencies and less costly methods in the financial sector. The Bank is currently
conducting further research and investigations with a view to provide further regulatory
guidance on digital innovations inclusive of virtual currencies and other related financial
technologies.
In line with the NPS Vision 2020, the Bank has embarked on research around
interoperability in the National Payment System. A position paper will be issued
during 2018 which will outline the state of interoperability in Namibia and measures
that the industry should take to ensure that the interoperability objective of 70 percent
as outlined in the NPS Vision 2020 is achieved. This initiative contributes to making the
NPS and broader financial sector more efficient.
The Bank continues to undertake costing exercises with the system participants,
such as banks, as it works towards the determination of standards for fees and
charges. The information on the costs involved in the provision of payment services
is critical to ascertain that charges payable by users are in the public interest, promote
competition and efficiency and are cost-effective. Further research to understand the
cost of payment services provision will be conducted during 2018, in order to provide
the relevant information to set standards for fees and charges.
The Committee of Central Bank Governors (CCBG) granted approval for the
CMA Cross-border Payment Oversight Committee (CMA-CPOC) to normalise the
current unfitting practice of clearing and settlement of cross border low-value
credit EFT transactions within the Common Monetary Area. In executing the
mandate provided by the CCBG, the CMA-CPOC issued a directive on 15 May 2017
to that effect. Engagements towards the successful implementation of the directive
are ongoing and the Bank, which forms part of CMA-CPOC, continues to provide the
necessary guidance and support to the local participants to ensure that the directive is
duly implemented in the Namibian jurisdiction.
As part of its regulatory reform efforts, the Bank continues to review legislation
and supporting regulation. The revision of the Payment System Management Act,
as amended, is underway and will continue as a multi-year project. In 2017, the Bank
Namibia Financial Stability Report - April 2018 61Page
reviewed the Determination on Issuing of Electronic Money in Namibia (PSD-3), as
well as the Directive on the Conduct within the National Payment System in Namibia
(PSDIR-1). The review of these regulations are still underway.
In executing its mandate to ensure the safe, secure, efficient and cost-effective
operation of the National Payment System (NPS), the Bank ensures that the NPS
conforms to international standards for payment systems, such as the Principles
for Financial Market Infrastructure (PFMIs). Accordingly, the Bank has identified
systems in the National Payment System that are systemically important and has
designated Namclear (the automated Clearing house) and NISS as financial market
infrastructures in accordance with the PFMIs. FMIs are central to the clearance and
settlement of transactions in financial markets as well as the movement of money
nationally and globally. The PFMIs require that a designated systemically important
payment system observe and apply the standards set out and in particular provide
relevant information to its participants, relevant authorities and the broader public.
Namibia Financial Stability Report - April 2018 62Page
VIII. CONCLUDING REMARKS AND POLICY IMPLICATIONS
The Namibian financial system continued to be resilient amidst recessionary economic
conditions. Overall, the financial system and markets in Namibia remained sound, profitable,
and with no disruptions or disorderly functioning of key financial services despite unfavourable
domestic economic conditions. Specifically, the banking industry remained well capitalised
with capital levels well above the minimum prudential requirements during 2017. The banking
institutions displayed healthy aggregate balance sheet growth, profitability and satisfactory
liquidity levels during the period under review. Given challenging economic conditions and
the associated shedding of jobs, disposable income has been under pressure, resulting in
a significant increase in the ratio of non-performing loans (NPLs). This deterioration in the
asset quality however does not pose any immediate risk to banks as they are adequately
capitalised to offset this risk. Similarly, the non-bank financial institutions (NBFIs) continued to
be financially stable and sound with growing assets and minimal risks, despite recessionary
economic conditions in the domestic economy. The payments system and infrastructure also
continued to perform efficiently and effectively, and with increasingly robust risk mitigating
measures to facilitate safe payments. House prices decelerated, but however with no threat
to the stability of the financial system. Finally, household debt moderated, while corporate
debt increased. Although both these ratios remained high when compared to those of peer
countries, the associated risks to financial stability remain minimal.
Despite the generally healthy and sound Namibian financial system, specific pockets
of risk require monitoring and/or action, going forward. In this regard, the significant
increase in the NPL ratio in the banking sector and the concentration risks in the NBFIs sector
will continue to be monitored. In addition, the interconnectedness and exposures between
banks and non-bank financial institutions will also continue to be monitored. Finally, there are a
number of regulatory amendments, risk monitoring and surveillance enhancements underway
aimed at containing and managing risks to the financial system.
Globally, financial vulnerabilities which have accumulated during the years of very low
interest rates and volatility could put financial stability and economic growth at risk. Going
forward, easy financial conditions may further contribute to the build-up of financial fragilities
as well as increasing risk to the global financial stability and economic growth over the short
and medium-term. Although greater risk taking by financial intermediaries is part of a healthy
economic recovery, it may breed vulnerabilities that could harm future growth if excessive,
particularly when investors go over and beyond risk tolerance into riskier instruments. In this
regard, continued monitoring and heightened vigilance is therefore essential.
Namibia Financial Stability Report - April 2018 63Page
BIBLIOGRAPHY
Global Financial Stability Report April 2018 (IMF)
https://bmo.bmiresearch.com/article/view?article
https://www.slideshare.net/ /fnbhouse-price-indexjanuary-2018
World Economic Outlook April 2018 (IMF)

Namibia Financial Stability Report - April 2018 64Page