nandan denim ltd€¦ · nandan denim ltd buy - 1 of 22 ... chiripal industries ltd. (b) vishal...
TRANSCRIPT

Nandan Denim Ltd
BUY
- 1 of 22 - Friday, 2nd June, 2017
This document is for private circulation, and must be read in conjunction with the disclaimer on the last page.
ST
OC
K P
OIN
TE
R
Target Price Rs. 175 CMP Rs. 132 4QFY19E PE 7X
Index Details
Nandan Denim Ltd (NDL) is likely to report higher profits till FY19 due to
increased denim manufacturing capacity and backward integration in
spinning. Central and state government incentives will improve profitability
further. Denim fabric accounted for 93% of revenues in FY17.
We are optimistic about NDL’s prospects given that:
NDL is the largest denim fabric manufacturer with 110MMPA (Million
Meters Per Annum) capacity in India and is 4th largest in the world. It
would be serving the increasing demand of Indian and international
denim market. Exports would likely account for 30% of sales in next
two-three years.
Better market response, efficient capacity utilization and cost savings
on backward integration in yarn manufacturing would result in EBITDA
margin improvement from 15.6% in FY17 to 18.8% in FY19.
NDL will be eligible for interest subsidy of 5% as an integrated
Spinning facility (2% for standalone facility) from Central Government.
Gujarat’s reimbursement of state taxes on cotton helps improve
profitability and lower finance cost.
NDL has finished major capex programme in FY17 and benefits from
these assets begins from FY18. This will increase ROCE to 20.1% in
FY19 from 13.8% in FY17.
We launch coverage with a BUY rating and a price target of Rs. 175, arrived
at by applying 7X multiple to its EPS Rs. 24.6 for FY19. We believe that the
phase of flat PAT for FY16-17 is now over and expect to see 64% growth in
FY18 followed by 27% in FY19. This will lead to a re-rating to 7X from the
current 5X. Our target price suggests a return of 32.6% from the current
market price of Rs 132 over the next 12 months.
Sensex 31,273
Nifty 9,653
Industry Textiles
Scrip Details
Mkt Cap (Rs
cr) 641.21
BVPS (Rs) 87.4
O/s Shares (Cr) 4.80
Av Vol 1,34,372
52 Week H/L 105/165
Div Yield (%) 1.2
FVPS (Rs.) 10
Shareholding Pattern
Shareholders %
Promoters 58.3
Public 41.7
Total 100.0
Nandan Denim vs. Sensex
Key Financials (Rs. in Cr)
Y/E Mar Net
sales EBITDA PAT
EPS
(Rs.)
EPS
Growth (%) RoE (%)
ROCE
(%) P/E(x)
EV/EBITD
A
(x)
2016 1,157 191 63 13.9 16.4 21.2 20.8 9.5 5.5
2017 1,220 190 57 11.8 (15.2) 23.6 14.9 11.2 6.1
2018E 1,315 234 93 19.4 64.3 23.5 20.4 7.1 4.9
2019E 1,442 271 118 24.6 27.1 23.3 21.9 5.5 4.0
- 2 of 22- Friday, 2nd June, 2017
This document is for private circulation, and must be read in conjunction with the disclaimer on the last page.
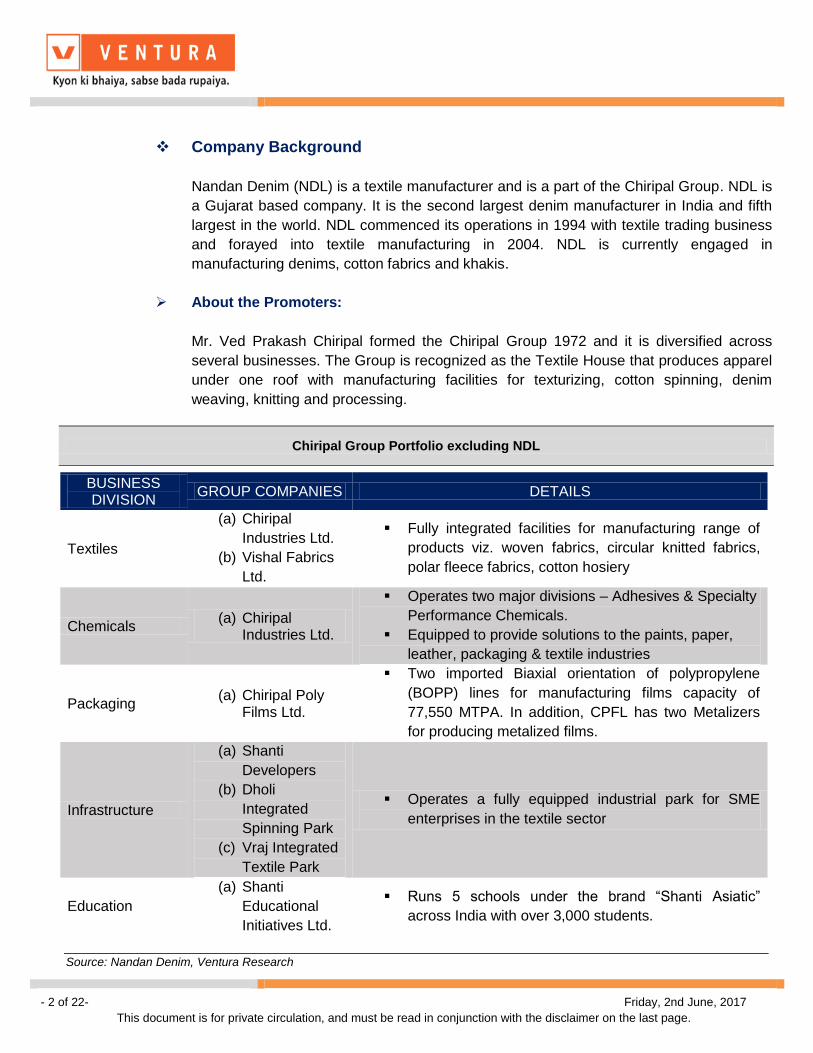
Company Background
Nandan Denim (NDL) is a textile manufacturer and is a part of the Chiripal Group. NDL is
a Gujarat based company. It is the second largest denim manufacturer in India and fifth
largest in the world. NDL commenced its operations in 1994 with textile trading business
and forayed into textile manufacturing in 2004. NDL is currently engaged in
manufacturing denims, cotton fabrics and khakis.
About the Promoters:
Mr. Ved Prakash Chiripal formed the Chiripal Group 1972 and it is diversified across
several businesses. The Group is recognized as the Textile House that produces apparel
under one roof with manufacturing facilities for texturizing, cotton spinning, denim
weaving, knitting and processing.
Chiripal Group Portfolio excluding NDL
Source: Nandan Denim, Ventura Research
BUSINESS DIVISION
GROUP COMPANIES DETAILS
Textiles
(a) Chiripal
Industries Ltd.
(b) Vishal Fabrics
Ltd.
Fully integrated facilities for manufacturing range of
products viz. woven fabrics, circular knitted fabrics,
polar fleece fabrics, cotton hosiery
Chemicals (a) Chiripal
Industries Ltd.
Operates two major divisions – Adhesives & Specialty
Performance Chemicals.
Equipped to provide solutions to the paints, paper,
leather, packaging & textile industries
Packaging (a) Chiripal Poly
Films Ltd.
Two imported Biaxial orientation of polypropylene
(BOPP) lines for manufacturing films capacity of
77,550 MTPA. In addition, CPFL has two Metalizers
for producing metalized films.
Infrastructure
(a) Shanti
Developers
(b) Dholi
Integrated
Spinning Park
(c) Vraj Integrated
Textile Park
Operates a fully equipped industrial park for SME
enterprises in the textile sector
Education
(a) Shanti
Educational
Initiatives Ltd.
Runs 5 schools under the brand “Shanti Asiatic”
across India with over 3,000 students.

- 3 of 22- Friday, 2nd June, 2017
This document is for private circulation, and must be read in conjunction with the disclaimer on the last page.
Product Portfolio
NDL is broadly present into two segments- denim fabrics, khakis and shirting fabrics. In
FY17, denim contributed to around 93% of the revenues while others are only 7%. NDL
produces premium khakis having a capacity of over 10 MN meters per annum. NDL is
the second largest manufacturer of denim in India. The denim fabric is available under
different collections as it has the capacity to produce 110 MN meters of denim per
annum.
Product Portfolio
Source: Nandan Denim, Ventura Research
93%
7%
Denim fabrics Others (khaki & Shirting fabrics)

- 4 of 22- Friday, 2nd June, 2017
This document is for private circulation, and must be read in conjunction with the disclaimer on the last page.
Key Investment Highlights:
Strong demand from Global and Indian Denim industry
India’s Denim Market
The denim market in India is growing at a consistent CAGR of 15%–18% despite a
slowdown in apparel exports and domestic market growth. The industry’s future looks
promising due to the following factors:
Rising disposable incomes
Rapid growth of the retail sector
The westernization trend prevalent in India
Booming internet retailing sector
Young population demographics (15-29-year-old) with higher spending power
A wide range of consumer segments that consider denim as an apparel of choice
owing to its comfort and style
Favored preference for denim amongst youth owing to its versatile association
Increasing usage of denim products by women and youth in smaller cities and
rural India
For a majority of the Indian youth, denim is not just a casual wear, but more of a fashion
statement. Almost 85% of the market by value is dominated by men, with 10%
contribution from the women segment and the kids segment contributing about 5% of the
market.
NDL has one of the largest domestic distribution networks, which will make it possible to
extend into unexplored markets (due to capacity constraint) from a competitive
perspective. NDL will not find it challenging to market additional production. Addition of
value-added products will enable NDL to reach customers where it was earlier unable to
match qualitative parameters.
International Denim Market
The Indian denim industry is also looking to increase its share of exports from the current
35%. The position is strengthened with the cotton availability advantage as compared to
other sizable producers in the world, who have to import it from other producing nations.
Increase in additional denim manufacturing capacities, encouraging textile policies and
favorable exchange rate movement will help India achieve a significant export growth.
The domestic and export ratio is expected to change from 65:35 to 55:45 by 2020.

- 5 of 22- Friday, 2nd June, 2017
This document is for private circulation, and must be read in conjunction with the disclaimer on the last page.
NDL Denim has got one full-fledged export department to cater to the export markets.
NDL intends to increase its share of exports from 15% to 30% over the next 2-3 years
through a focused approach that could widen marketing opportunities.
India Denim Sales
Export Denim Sales
Source: Nandan Denim, Ventura Research
Source: Nandan Denim, Ventura Research
Strategic Location of Manufacturing Facilities
NDL is located in Ahmedabad in Gujarat state, the textile hub of India. It is the largest
producer of denim fabric (65- 70%) in India and third largest in the world. Gujarat is also
the largest producer of cotton in India with ~31% share. Ahmedabad has infrastructure
connectivity through roads, rail, airport and ports.
NDL has the location advantage of being in close proximity to machinery vendor, fabric
dealers and leading garment manufacturers resulting in faster delivery and services.
Proximity to the market also helps in lowering the marking and transportation overheads
for NDL.
NDL has an advantage of low cost of production as raw material i.e. cotton, is easily
available in Gujarat. Gujarat meets around 70% of the cotton requirement of Nandan
Denim. There is an uninterrupted power supply in state of Gujarat. Easy availability of
skilled and unskilled labour in Gujarat is another advantage for NDL.
Leveraging the market network of Chiripal Group
NDL is leveraging the agent based domestic and global network of the Chiripal Group.
NDL has a pan- India network of ~35-40 distributors associated for almost a decade. NDL
864
997 951
1,130 1,153 1,165
-
200
400
600
800
1,000
1,200
1,400
FY14 FY15 FY16 FY17 FY18E FY19E
Rs. in Crores
72
136
168
90 100
206
-
50
100
150
200
250
FY14 FY15 FY16 FY17 FY18E FY19E
Rs. in crores

- 6 of 22- Friday, 2nd June, 2017
This document is for private circulation, and must be read in conjunction with the disclaimer on the last page.
has strategic tie- ups with 10 firms to exclusively sell NDL products. 2/3rd of the orders are
confirmed through long term agreements involving minimum yearly quantity commitment.
NDL has a global network of ~15 distributors spread across 8 countries- Peru, Mauritius,
Hong Kong, Dubai, Thailand, Bangladesh, New York and Columbia. It exports denim
fabrics to over 27 countries across the globe. The merchant’s exports through various
export houses to give an additional boost to exports.
Beneficial Policies of the Central and State Government
Central Textile policy (Technology Upgradation Fund Scheme)
The Government of India (GoI), Ministry of Textiles (MoT), introduced Technology
Upgradation Fund Scheme (TUFS) for Textile and Jute Industries on April 1, 1999. The
objective of the TUF Scheme is to leverage investments in technology up gradation with a
special emphasis on balanced development across the value chain. It aims at providing
capital for modernization of Indian textile industry at international interest rate.
Segments such as spinning, cotton ginning & pressing, silk reeling & twisting wool
scouring, combing and carpet industry, synthetic filament yarn texturizing, crimping and
twisting, Viscose Filaments Yarn (VFY)/ Viscose Staple Fiber (VSF), weaving/knitting,
fabric embroidery and technical including non-woven, garment, design studio, made-up
manufacturing, processing of fibers, yarns, fabrics, garments and made-ups and the jute
Leverage Chiripal Group Eco- System
Source: Nandan Denim, Ventura Research
Nandan Denim
Denim fabric, shirting fabric
Chiripal Industries
(Processing)
Chiripal Industries
(Petrochemical)
POY, FDY, DTY
Chiripal Polyfilms Thermal Films, Tape Textile Packaging film
Vishal Fabrics Shirting,
Synthetic, Button Weight
Denim Fabric
Customer Chiripal Customer Network

- 7 of 22- Friday, 2nd June, 2017
This document is for private circulation, and must be read in conjunction with the disclaimer on the last page.
industry is eligible to avail subsidy under this Scheme for their technology upgradation
requirements. NDL gets 5% interest subsidy and 10% capital subsidy for 7 years under
the Central Textile policy.
Gujarat Textile policy
The Gujarat government has introduced benefits to the textile sector to attract
investments in textile sector in the state. In addition to the interest subsidy by the Central
Government through TUFS, the Gujarat government offers additional interest subsidy for
5 years: 7% on spinning & garment facilities, 6% on Technical textiles and 5% on all other
facilities. The policy provides power tariff subsidy at Re. 1 per unit for 5 years, VAT
reimbursement for 8 years and 100% stamp duty reimbursement.
NDL is entitled to these subsidies and reimbursement under Central as well as Gujarat
policies. Thus, these benefits give a boost to the overall profitability of the company.
Management expects VAT reimbursement (for cotton purchased from Gujarat traders) up
to Rs. 400 crores (over next several years) on the capex of Rs. 612 crores FY18E
onwards which would be reflected as operating income.

- 8 of 22- Friday, 2nd June, 2017
This document is for private circulation, and must be read in conjunction with the disclaimer on the last page.
Margin improvement due to capacity expansion
NDL has increased its denim fabric manufacturing capacity, spinning capacity and
shirting capacity. The total Capex was Rs. 612 crores and was incurred in FY16-17. It
was funded through the Debt/ Equity ratio of 2.4:1.
The Capex includes expansion of denim capacity from 99 million meters per annum
(MMPA) to 110 MMPA; adding a shirting capacity of 10 MMPA and backward integrating
by increasing spinning capacity from 64 tons per day to 141 tons per day.
Efficient capacity utilization would result in EBITDA margin improvement from 14-15% to
19-20% till FY20. The expanded capacity would help to provide a wider product range
and effectively tap the increasing demand from both Indian and international market.
Key Benefits from Gujarat and other states policies
Source: Nandan Denim, Ventura Research
Textile Policy Gujarat Karnataka Maharashtra Rajasthan Madhya Pradesh
Interest Subsidy
7% for Spinning unit, 6% for
technical textiles, 5% For others
without any ceiling
- 12.5% without any
ceiling.
5% with an additional 1% on investment > Rs. 250 mn. 7% for technical textiles
5% for standalone units and 7% for integrated units.
Capital Subsidy -
Lower of 20% of assets value or Rs 2 mn. Additional
subsidy of lower of 5% of assets value
or Rs 0.5 mn for units in designated
textile parks.
10% for new projects.
- 25% for new machinery
Power Subsidy @ Rs 1/unit for 5
years @ Rs 1/unit - - -
Stamp Duty Reimbursement
100% reimbursement
100% reimbursement
- 50% exemption. -
VAT/Entry Tax Reimbursement
For 8 years Yes - 60%
reimbursement.
VAT and CST reimbursement or 8
years
Common Infra/ Textile Park/ Cluster Devp
50% with max limit of Rs 100
mn (Rs 300 mn) for spinning park of total project
cost.
10% - 40% of the project cost
depending upon the zone and
project size (Rs 100-200 mn)
Interest subsidy for textile park
- -

- 9 of 22- Friday, 2nd June, 2017
This document is for private circulation, and must be read in conjunction with the disclaimer on the last page.
Improvement in the operational flexibility
We expect improvement in the operational flexibility and overall profit margins due to
integrated facility and backward integration by NDL. Integrated facility will help NDL to
service the increasing market demand. Faster and timely executions would be possible
due to limited dependency on the external factors along the value chain. NDL will be able
to achieve optimum capacity utilization and also maintain consistency and high standards
expected by the clients.
NDL has expanded its spinning capacity from 64 tons per day to 141 tons per day. It
plans full backward integration in FY18. This backward integration would help it meet
significant percentage of yarn requirement in- house which would increase the margins
and give more control on the supply chain. Expanded spinning capacity will meet the
captive yarn requirement resulting in higher operating margins. The cost of cotton yarn
would be ~Rs. 150/kg, about 15% lower compared to the raw material purchased from
the market. This would help in better management of the working capital and improve the
operational efficiencies.
I
m
p
r
o
v
e
m
e
n
t
i
n
t
h
e
A
s
s
In-house production of yarn can result in ~15% cost savings
Source: Nandan Denim, Ventura Research
Spinning Economies
COST PER KG OF CAPTIVE YARN
Cotton yarn 1.14
Cotton Blended Price (Rs/kg of cotton) 112.0
Transport Cost (Rs/kg of cotton) 1.0
Commission (Rs/kg of cotton) @0.5% 0.6
VAT on Cotton @ 5% (Rs/kg of cotton) 5.6
Electricity Cost (Rs/Kg) 11.0
Electricity required (Kwh/kg) 1.7
Electricity Cost (Rs/Kwh) 6.4
Labour and other Costs (Rs/kg) 2.7
Total Cost of Captive Yarn (Rs/kg) 148.7
COST PER KG OF MARKET YARN
Cost of Market Yarn (Rs/kg) 165.0
Transport Cost - Market Yarn (Rs/kg) 1.0
VAT on Market Yarn @ 5% (Rs/kg) 8.3
Commission (Rs/kg of Yarn) @0.5% 0.3
Total Cost of Market Yarn (Rs/kg) 175.1

- 10 of 22- Friday, 2nd June, 2017
This document is for private circulation, and must be read in conjunction with the disclaimer on the last page.
Asset Turnover and Return ratios
NDL is expected to improve its asset turnover with the increase in the sales and
improvement in the margins post expansion. This would result in better operating
leverage and improved return ratios. The ROE is expected to improve from 14.9% in
FY17 to 21.5% in FY19E and the ROCE is expected to improve from 13.8% in FY17 to
19.7% in FY19E supported by improved profitability and efficient capital deployment.
ROE ROCE
Source: Nandan Denim Presentation, Ventura Research
Source: Nandan Denim presentation, Ventura Research
18.2
22.9 21.2
14.9
19.5
21.5
0
5
10
15
20
25
FY14 FY15 FY16 FY17 FY18 E FY19 E
in %age
16.8
20.7 20.8
13.8
17.0
19.7
0
5
10
15
20
25
FY14 FY15 FY16 FY17 FY18 E FY19 E
in %age

- 11 of 22- Friday, 2nd June, 2017
This document is for private circulation, and must be read in conjunction with the disclaimer on the last page.
Global Denim Industry:
The denim segment has always reigned as one of the leading segments in the fashion
industry. The blue denim has been a wardrobe staple and a fashion essential for
decades. According to NDL, global denim industry is expected to grow at a CAGR of over
6.5% during 2015 to 2020, with the market value expected to increase from $113 billion
to $153 billion. In terms of pricing behavior, the growth is expected to be the highest in
the Premium and Super Premium categories of the denim products with smaller base
numbers. The Latin Americas and Asia are expected to lead the growth in the segment.
Growth Forecast
Global market for Denim Jeans is forecast to reach $153 billion by 2020, driven by
increasing disposable income, westernization of work culture and the ensuing rise in
popularity of denim jeans as business causal wear. Denim jeans have presently become
a necessity and an essential wardrobe staple, as it provides comfort and has a longer life
span, compared to other apparels. Currently, jeans are available in a variety of colours
and styles to suit various consumer needs. Denim jeans have also demonstrated their
capability to transcend beyond age and gender barriers. It represents an evergreen
fashion trend and is widely endorsed by a number of fashion models. Growth in the
market is influenced by economic, social and demographic trends. Growing penetration of
casual wear in the workplace as a result of the retirement of aging baby boomers, and a
parallel rise in young professional workforce is benefitting growth in the market.
Indian Denim Industry:
NDL reports that India is the 2nd largest denim manufacturer in the world with 1,200
MMPA capacities, next only to China with 3,497 MMPA capacity. The installed capacity is
expected to increase to 2000 million meters in by FY18 owing to the huge demand of the
fabric. India’s share in the overall denim manufacturing capacities is ~10%, at present its
share in the global jeans trade works out to 2.5%. In terms of retail sales, due to the
popularity of denims in India, Denim wear market is expected to register a retail value
figure of Rs. 361 billion by 2020 from the level of Rs. 177 billion in 2015, growing at a
consistent CAGR above 15%.
Demand for Indian denim
According to NDL, the demand for Indian denim has witnessed a robust growth over the
past four years, growing at a CAGR of 23.6% during this period. The per capita
consumption of denim is the lowest in India – at 0.3 pairs per person, showcasing the
vast growth opportunity. The denim market will register a CAGR of 15-18% in the next 5
years, significantly outpacing the global denim apparel market CAGR growth of 3-5%.

- 12 of 22- Friday, 2nd June, 2017
This document is for private circulation, and must be read in conjunction with the disclaimer on the last page.
2nd
Largest Denim Fabric Capacity in the World
Indian Denim Apparel
Source: Nandan Denim Presentation, Ventura Research
Source: Nandan Denim presentation, Ventura Research
India is set to establish as the global denim fabric and apparel production hub. It is the 4th
largest fabric exporter in the world. Advantages to India:
Low cost and competitive currency.
Favorable government textile policies.
China’s decreasing competitive edge.
Growth drivers of the Indian denim industry
Domestic denim manufacturing is picking up pace with emergence of large and
improved units.
Fast-growing youth and urban population and more people wearing the fabric to
the workplace.
The young generation (either gender) has accepted denim as “normal” wear
rather than a “functional” wear.
Current domestic market is dominated by metro cities that account for almost two-
third of consumption, while having got less than 10% of national population.
With ever-expanding retail network of distribution and higher per capita income at
disposal in Tier II & III towns, the availability of denim will register an
improvement, leading to higher penetration.
3,497
1,200
1,082
880
698
406
164
15
China
India
Latin America
Others
Europe
North America
Africa
Australia
in MMPA
1,200
1,800
2,200
-
500
1,000
1,500
2,000
2,500
FY11 FY13 FY17
USD in Million

- 13 of 22- Friday, 2nd June, 2017
This document is for private circulation, and must be read in conjunction with the disclaimer on the last page.
The multiple price-point strategy of branded jeans is further fueling growth. With
affordable availability of better fabrics to 90% of the Indian population, the
segment is bound to register growth.
The rising number of working women, lifestyle changes and the evolving western
culture has driven the demand for western wear, specifically jeans, amongst
women in India.
Growing brand awareness and consciousness has given push to the organized
denim market
SWOT Analysis of Indian Denim Industry
Source: Company presentation, Ventura Research
Weaknesses: Non-availability cost efficient skilled labour. Not ready for diversification of products. Cost based market set up.
Opportunities: Growing domestic and international demands. Indian market is most reliable and efficient market for US, Europe & UK. Buyers. Product mix and product diversification.
Threats: Entry of multinational in domestic markets. Demand supply mismatch, resulting into oversupply position in Domestic Market. Stiff competition from other Asian countries such as China, Indonesia, Thailand, Bangladesh and Pakistan. Fast changing fashion and fabric demands.
Strengths: Existence of sufficient productive capacity. Managements with professional and business background. Existence of qualified technical personnel. Easy availability of raw materials. Large domestic market. Abundant availability of excellent quality cotton suitable for denim.

- 14 of 22- Friday, 2nd June, 2017
This document is for private circulation, and must be read in conjunction with the disclaimer on the last page.
Impact of Cotton on Denim
Denim is predominantly a cotton fabric. Cotton prices impact cotton yarn the most. Yarn
prices have a cascading effect on fabric. The higher the product is in the value chain, the
higher is the insulation from volatility of cotton prices.
NDL has not entered the highest value-added segment of garments. As a result, it is
exposed to cotton price volatility. It tries to pass on the increased cost of cotton to its
customers but there could be time lag and it may have to absorb some of the cotton price
increase itself.
Textile Industry Value Chain
Source: Company presentation, Ventura Research
Fibre Spinning/ Twisting
Weaving / Knitting
Bleaching Printing
Finishing
Make- up Retailing
Yarn Grey Fabric Finished fabric
Garment

- 15 of 22- Friday, 2nd June, 2017
This document is for private circulation, and must be read in conjunction with the disclaimer on the last page.
Key Risks
1. Industry Risk: Slowdown in the denim industry could impact business growth
2. Competition risk: Growing capacities by existing players and new players
entering the denim market could adversely affect realizations and business
profitability.
3. Geographic risk: An overdependence on a single geography could impact
business growth going forward.
4. Raw material risk: Non-availability of adequate cotton and volatility in the prices
of cotton could impede business profits and prospects.
5. Quality risk: Inability to match the stringent quality standards of leading
retailsbrands consistently could impact product offtake.
6. Working capital risk: Increased business scale would necessitate increased
working capital requirement.

- 16 of 22- Friday, 2nd June, 2017
This document is for private circulation, and must be read in conjunction with the disclaimer on the last page.
Financial Performance
NDL reported a growth in revenues by 29.8% YoY in 4QFY17 to Rs. 382 crores from 294
crores in 3QFY16. The problem faced by the company due to demonetization is over.
EBITDA for 4QFY17 was reported at Rs. 60 crores as against Rs. 47 crores in 4QFY16,
a growth of 28%. The EBITDA margins stood at 15.8% for 4QFY17 vs 16% in 4QFY16
due higher raw material prices as the industry supply chain faced difficulties post
demonetization and increasing cotton prices. The depreciation has increased due to the
completion of the capex in this quarter.
PAT declined by 5.7% YoY to Rs. 16 crores in 4QFY17 as against Rs. 17 crores in
4QFY16. The operating conditions are expected to be normalized from 1QFY18 with the
reducing effect of demonetization.
Quarterly Financial Performance (Rs. in crores)
Source: Nandan Denim, Ventura Research
Description 4QFY17 4QFY16 FY17 FY16
Net Sales 382 294 1,220 1,157
Growth (%) 29.8
5.5
Total expenditure 322 247 1,030 966
EBITDA 60 47 190 191
Margin (%) 15.8 16.0 15.6 16.5
Depreciation 35 16 86 66
EBIT (Ex. Other Income) 25 31 104 125
Non-operating Income 1 2 2 4
EBIT 26 33 106 129
Margin (%) 6.8 11.1 8.7 11.2
Finance Cost 13 11 36 41
Exceptional Items - - - -
PBT 13 21 70 88
Margin (%) 3.5 7.3 5.7 7.6
Prov. For Tax -3 5 13 25
Reported PAT 16 17 57 63
Margin (%) 4.2 5.6 4.6 5.5
Share of Associate - - - -
Minority Interest - - - -
Profit after Tax 16 17 57 63
Margin (%) 4.2 5.6 4.6 5.5

- 17 of 22- Friday, 2nd June, 2017
This document is for private circulation, and must be read in conjunction with the disclaimer on the last page.
Financial Outlook
NDL is expected to maintain its revenue growth track at a CAGR of 9% for FY17-FY19E
because of a) grip on denim business b) efficient capacity utilization and c) cost savings
on captive yarn. We expect the EBITDA margins to reach around 19% in FY19E due to
the reduction in expenses. The net profit is expected to grow at a CAGR of 42.5% for
FY17-FY19E with higher ROE and ROCE.
Growing Revenues margin and EBITDA margin, PAT
ROE, ROCE and Debt to Equity
Source: Nandan Denim, Ventura Research
Source: Nandan Denim, Ventura Research
Stable Working Capital going ahead
Source: Nandan Denim, Ventura Research
-
20
40
60
80
100
120
FY14 FY15 FY16 FY17 FY18E FY19E
no of days
Debtors day Inventory day Creditors day
0
5
10
15
20
25
-
0.20
0.40
0.60
0.80
1.00
1.20
1.40
1.60
1.80
2.00
FY14 FY15 FY16 FY17 FY18 E FY19 E
In % age
Debt/Equity ROE ROCE
0
2
4
6
8
10
12
14
16
18
20
-
200
400
600
800
1,000
1,200
1,400
1,600
FY14 FY15 FY16 FY17 FY18E FY19E
Net Revenues EBITDA margin PAT margin

- 18 of 22- Friday, 2nd June, 2017
This document is for private circulation, and must be read in conjunction with the disclaimer on the last page.
Valuation
We initiate coverage on Nandan Denim Ltd as a BUY with a price objective of Rs. 175.
This represents a potential upside of 32.6% from the CMP of Rs.132. At the CMP of Rs.
132, the stock is trading at 7.1X and 5.5X its estimated earnings for FY18 and FY19. We
have assigned a PE multiple of 7X on the Mar 19 EPS of Rs. 24.6 to arrive at the target
price. We are optimistic about the company due to:
Strong earnings momentum.
Improvement in the operating margins and operational flexibility.
Higher ROE and ROCE going forward
Attractive Valuation along with High Growth
Source: Ventura Research
Arvind Ltd
Vardhman Textiles
Sutlej Textiles
Nandan Denim
0%
2%
4%
6%
8%
10%
12%
0 5 10 15 20 25
Reve
nu
e C
AG
R f
or
2 y
rs
P.E Ratio for FY18E

- 19 of 22- Friday, 2nd June, 2017
This document is for private circulation, and must be read in conjunction with the disclaimer on the last page.
From FY13 to YTD, NDL’s P.E. has ranged from 2.5X to 13X. Considering the PAT and
overall growth over FY16-FY19E, we are assigning P.E. multiple of 7X for March-19E
(EPS at Rs. 24.6)
Share Price & P/E
Source: Ventura Research

- 20 of 22- Friday, 2nd June, 2017
This document is for private circulation, and must be read in conjunction with the disclaimer on the last page.
NDL trades at a discount compared to its peers, despite significant growth and margin
improvement visibility.
Peer Comparison for Financial performance with estimates
Source: Ventura Research, Reuters
In Rs Mn
Sales EBITDA PAT EBITDA
Mgn PAT Mgn
EPS ROE (%)
P/E (x)
P/BV (x)
EV/EBITDA (x)
Indian Peers
Arvind Ltd
FY17 9,236 928 314 10.1 3.4 12.1 9.0 31.3 2.6 13.7
FY18E 10,424 1,109 438 10.6 4.2 17.1 11.8 22.2 2.3 11.5
FY19E 11,889 1,358 574 11.4 4.8 23.3 14.9 16.3 2.0 9.4
Vardhman Textiles
FY17 6,067 1,717 981 28.3 15.8 163.0 17.8 7.9 1.9 7.6
FY18E 6,609 1,363 777 20.6 11.8 137.0 15.6 9.5 1.5 9.6
FY19E 7,369 1,591 927 21.6 12.6 166.0 16.6 7.8 1.3 8.0
Sutlej Textiles
FY17 2,287 282 158 12.3 6.9 96.4 19.0 9.5 2.0 5.4
FY18E 2,557 362 166 14.2 6.5 101.0 18.5 9.1 1.5 4.2
FY19E 3,003 448 238 14.9 7.9 145.0 22.4 7.8 1.3 3.4
Nandan Denim
FY17 1,220 190 57 15.6 4.6 11.8 14.9 11.2 1.5 6.1
FY18E 1,315 234 93 17.8 7.1 19.4 20.4 7.1 1.3 4.9
FY19E 1,442 271 118 18.8 8.2 24.6 21.9 5.5 1.1 4.0

- 21 of 22- Friday, 2nd June, 2017
This document is for private circulation, and must be read in conjunction with the disclaimer on the last page.
Financials and Projection
Y/E March (` crore) FY16 FY17 FY18E FY19E Y/E March (` crore) FY16 FY17 FY18E FY19E
Profit and Loss statement
Per Share Data (Rs) Net Sales 1,157 1,220 1,309 1,438 Adj. EPS 13.9 11.8 18.5 24.0
% Chg.
1.2 19.4 9.3 Cash EPS 32.2 37.6 29.9 38.8
Total Expenditure 966 1,030 1,081 1,171 DPS 2.8 2.2 3.9 5.0
% Chg.
-0.2 18.7 8.3 Book Value 74.3 87.4 102.1 121.0
EBITDA 191 190 229 266 Capital, Liquidity, Returns Ratio
EBITDA Margin % 16.5 17.7 18.1 18.8 Debt/ Equity (x) 1.4 1.3 1.0 0.7
Other Income 4 2 4 4 Current Ratio (x) 0.1 0.2 0.2 0.2
PBDIT 195 192 233 270 ROE (%) 21.2 23.6 23.5 23.3
Depreciation 66 86 80 80 ROCE (%) 20.8 17.6 19.9 22.2
Interest 41 36 29 30 Dividend Yield (%) 1.0 1.3 1.8 2.1
Exceptional Items 0.0 0.0 0.0 0.0 Valuation Ratio (x)
PBT 88 70 124 160 P/E 9.5 11.2 7.1 5.5
Tax Provisions 25 13 35 45 P/BV 1.8 1.5 1.3 1.1
Reported PAT 63 57 89 115 EV/Sales 0.9 0.9 0.9 0.8
Minority Interest 0.0 0.0 0.0 0.0 EV/EBITDA 5.5 6.1 5.0 4.1
PAT 63 57 89 115 Efficiency Ratio (x)
PAT margin (%) 5.5 7.6 7.6 8.3 Inventory (days) 91.3 100.0 110.0 110.0
Other opr Exp/ Sales (%) 0.0 0.0 0.0 0.0 Debtors (days) 38.6 40.4 45.0 50.0
Tax Rate (%) 28.1 21.6 33.0 33.0 Creditors (Days) 39.5 62.7 50.0 50.0
Balance Sheet
Cash Flow Statement
Share Capital 46 48 48 48 Profit Before Tax 88 70 124 160
Reserves and Surplus 293 372 442 534 Depreciation 66 86 80 80
Minority Interest 0.0 0.0 0.0 0.0 Working Capital Changes -27 4 -55 -39
Long Term Borrowings 318 422 420 400 Others 20 21 -5 -14
Deferred Tax Liability 23 21 20 20 Operating Cash Flow 147 180 144 187
Other Non-Current Liabilities 0.0 0.0 0.0 0.0 Capital Expenditure -182 -285 -60 -50
Total Liabilities 680 863 931 1,002 Other Investment Activities 2 3 -20 -20
Gross Block 824 1,199 1,249 1,299 Cash Flow from Investing -180 -282 -80 -70
Less: Acc. Depreciation 344 430 510 590 Changes in Share Capital 25 25 0.0 0.0
Net Block 480 769 739 709 Changes in Borrowings 59 115 -15 -57
Capital Work in Progress 90 0 10 10 Dividend and interest -52 -36 -48 -54
Non-Current Investments 7 3 3 3 Cash flow from Financing 32 104 -62 -112
Net Current Assets 90 82 168 269 Net Change in Cash -2 2 2 5
Long term Loans & Advances 12 8 10 10 Opening Cash Balance 19 17 20 22
Total Assets 680 863 930 1,002 Closing Cash Balance 17 20 22 27

- 22 of 22- Friday, 2nd June, 2017
This document is for private circulation, and must be read in conjunction with the disclaimer on the last page.
Disclosures and Disclaimer Ventura Securities Limited (VSL) is a SEBI registered intermediary offering broking, depository and portfolio management services to clients. VSL is member of BSE, NSE and MCX-SX. VSL is a depository participant of NSDL. VSL states that no disciplinary action whatsoever has been taken by SEBI against it in last five years except administrative warning issued in connection with technical and venial lapses observed while inspection of books of accounts and records. Ventura Commodities Limited, Ventura Guaranty Limited, Ventura Insurance Brokers Limited and Ventura Allied Services Private Limited are associates of VSL. Research Analyst (RA) involved in the preparation of this research report and VSL disclose that neither RA nor VSL nor its associates (i) have any financial interest in It which is the subject matter of this research report (ii) holds ownership of one percent or more in the securities of subject company (iii) have any material conflict of interest at the time of publication of this research report (iv) have received any compensation from the subject company in the past twelve months (v) have managed or co-managed public offering of securities for the subject company in past twelve months (vi) have received any compensation for investment banking merchant banking or brokerage services from the subject company in the past twelve months (vii) have received any compensation for product or services from the subject company in the past twelve months (viii) have received any compensation or other benefits from the subject company or third party in connection with the research report. RA involved in the preparation of this research report discloses that he / she has not served as an officer, director or employee of the subject company. RA involved in the preparation of this research report and VSL discloses that they have not been engaged in the market making activity for the subject company. Our sales people, dealers, traders and other professionals may provide oral or written market commentary or trading strategies to our clients that reflect opinions that are contrary to the opinions expressed herein. We may have earlier issued or may issue in future reports on the companies covered herein with recommendations/ information inconsistent or different those made in this report. In reviewing this document, you should be aware that any or all of the foregoing, among other things, may give rise to or potential conflicts of interest. We may rely on information barriers, such as "Chinese Walls" to control the flow of information contained in one or more areas within us, or other areas, units, groups or affiliates of VSL. This report is for information purposes only and this document/material should not be construed as an offer to sell or the solicitation of an offer to buy, purchase or subscribe to any securities, and neither this document nor anything contained herein shall form the basis of or be relied upon in connection with any contract or commitment whatsoever. This document does not solicit any action based on the material contained herein. It is for the general information of the clients / prospective clients of VSL. VSL will not treat recipients as clients by virtue of their receiving this report. It does not constitute a personal recommendation or take into account the particular investment objectives, financial situations, or needs of clients / prospective clients. Similarly, this document does not have regard to the specific investment objectives, financial situation/circumstances and the particular needs of any specific person who may receive this document. The securities discussed in this report may not be suitable for all investors. The appropriateness of a particular investment or strategy will depend on an investor's individual circumstances and objectives. Persons who may receive this document should consider and independently evaluate whether it is suitable for his/ her/their particular circumstances and, if necessary, seek professional/financial advice. And such person shall be responsible for conducting his/her/their own investigation and analysis of the information contained or referred to in this document and of evaluating the merits and risks involved in the securities forming the subject matter of this document. The projections and forecasts described in this report were based upon a number of estimates and assumptions and are inherently subject to significant uncertainties and contingencies. Projections and forecasts are necessarily speculative in nature, and it can be expected that one or more of the estimates on which the projections and forecasts were based will not materialize or will vary significantly from actual results, and such variances will likely increase over time. All projections and forecasts described in this report have been prepared solely by the authors of this report independently of It. These projections and forecasts were not prepared with a view toward compliance with published guidelines or generally accepted accounting principles. No independent accountants have expressed an opinion or any other form of assurance on these projections or forecasts. You should not regard the inclusion of the projections and forecasts described herein as a representation or warranty by VSL, its associates, the authors of this report or any other person that these projections or forecasts or their underlying assumptions will be achieved. For these reasons, you should only consider the projections and forecasts described in this report after carefully evaluating all of the information in this report, including the assumptions underlying such projections and forecasts. The price and value of the investments referred to in this document/material and the income from them may go down as well as up, and investors may realize losses on any investments. Past performance is not a guide for future performance. Future returns are not guaranteed and a loss of original capital may occur. Actual results may differ materially from those set forth in projections. Forward-looking statements are not predictions and may be subject to change without notice. We do not provide tax advice to our clients, and all investors are strongly advised to consult regarding any potential investment. VSL, the RA involved in the preparation of this research report and its associates accept no liabilities for any loss or damage of any kind arising out of the use of this report. This report/document has been prepared by VSL, based upon information available to the public and sources, believed to be reliable. No representation or warranty, express or implied is made that it is accurate or complete. VSL has reviewed the report and, in so far as it includes current or historical information, it is believed to be reliable, although its accuracy and completeness cannot be guaranteed. The opinions expressed in this document/material are subject to change without notice and have no obligation to tell you when opinions or information in this report change. This report or recommendations or information contained herein do/does not constitute or purport to constitute investment advice in publicly accessible media and should not be reproduced, transmitted or published by the recipient. The report is for the use and consumption of the recipient only. This publication may not be distributed to the public used by the public media without the express written consent of VSL. This report or any portion hereof may not be printed, sold or distributed without the written consent of VSL. This document does not constitute an offer or invitation to subscribe for or purchase or deal in any securities and neither this document nor anything contained herein shall form the basis of any contract or commitment whatsoever. This document is strictly confidential and is being furnished to you solely for your information, may not be distributed to the press or other media and may not be reproduced or redistributed to any other person. The opinions and projections expressed herein are entirely those of the author and are given as part of the normal research activity of VSL and are given as of this date and are subject to change without notice. Any opinion estimate or projection herein constitutes a view as of the date of this report and there can be no assurance that future results or events will be consistent with any such opinions, estimate or projection. This document has not been prepared by or in conjunction with or on behalf of or at the instigation of, or by arrangement with It or any of its directors or any other person. Information in this document must not be relied upon as having been authorized or approved by It or its directors or any other person. Any opinions and projections contained herein are entirely those of the authors. None of It or its directors or any other person accepts any liability whatsoever for any loss arising from any use of this document or its contents or otherwise arising in connection therewith. The information contained herein is not intended for publication or distribution or circulation in any manner whatsoever and any unauthorized reading, dissemination, distribution or copying of this communication is prohibited unless otherwise expressly authorized. Please ensure that you have read “Risk Disclosure Document for Capital Market and Derivatives Segments” as prescribed by Securities and Exchange Board of India before investing in Securities Market. Ventura Securities Limited
Corporate Office: 8th Floor, ‘B’ Wing, I Think Techno Campus, Pokhran Road no. 02, Off Eastern Express Highway, Thane (West) 400 607.
Financials and Projection