nano oil additives and their effect on uh-60 auxiliary
TRANSCRIPT

University of South Carolina University of South Carolina
Scholar Commons Scholar Commons
Theses and Dissertations
2016
Nano Oil Additives And Their Effect On UH-60 Auxiliary Power Unit Nano Oil Additives And Their Effect On UH-60 Auxiliary Power Unit
Performance Performance
James Patrick Folk University of South Carolina
Follow this and additional works at: https://scholarcommons.sc.edu/etd
Part of the Mechanical Engineering Commons
Recommended Citation Recommended Citation Folk, J. P.(2016). Nano Oil Additives And Their Effect On UH-60 Auxiliary Power Unit Performance. (Master's thesis). Retrieved from https://scholarcommons.sc.edu/etd/3786
This Open Access Thesis is brought to you by Scholar Commons. It has been accepted for inclusion in Theses and Dissertations by an authorized administrator of Scholar Commons. For more information, please contact [email protected].

NANO OIL ADDITIVES AND THEIR EFFECT ON UH-60 AUXILIARY POWER UNIT PERFORMANCE
by
James Patrick Folk
Bachelor of Science
University of South Carolina, 2014
Submitted in Partial Fulfillment of the Requirements
For the Degree of Master of Science in
Mechanical Engineering
College of Engineering and Computing
University of South Carolina
2016
Accepted by:
Abdel Bayoumi, Director of Thesis
Dale McCants, Reader
Lacy Ford, Senior Vice Provost and Dean of Graduate Studies

ii
© Copyright by James Patrick Folk, 2016
All Rights Reserved.

iii
ACKNOWLEDGEMENTS
I would like to thank Dr. Abdel Bayoumi for providing me with the opportunity to
perform research with CBM and for everything that he has done throughout my time in
graduate school. I am grateful for all of the support from my family and friends
throughout my college experience at USC. I would also like to thank Dr. Dale McCants
for providing valuable suggestions while reviewing my thesis. I am also very thankful for
all of the help and thesis recommendations provided by my friends and coworkers at
CBM.

iv
ABSTRACT
This study is designed to research the tribological properties of nano oils developed
by NanoPro MT and to determine their effects on fuel consumption in an UH-60
Blackhawk Auxiliary Power Unit (APU). For this work, two different nano oils were tested
and compared against the performance of conventional oil. The first nano oil mixture
contains proprietary nanodiamond particles and the second nano oil contains a mix of zinc
sulfide, boron nitride, and graphene particles. Aeroshell 560 was used as the conventional
oil and was blended with the nano particles to create both nano oils. This oil meets the
military specifications for use in the APU. The APU is part of a test stand that consists of
a turbine engine, an APU Tester, an Electronic Sequencing Unit, a fuel tank, a fuel flow
meter, a water brake dynamometer, and multiple other sensors. In addition to testing with
the APU, the oils were tested in an AH-64 Apache Intermediate Gear Box (IGB). Testing
was conducted on two separate test stands, one applying torque through an absorption
motor and one where no torque load was applied. These tests provide additional data for
determining the effects of friction by measuring vibration and temperature. Offline
analyses were also performed to characterize additional oil properties. Knowledge of these
properties was used while determining causes for the results of the other tests. Viscosity
and particle size information is vital when forming conclusions about the thermal and
tribological properties of the oils.
v
The research performed in this study utilizes data from each of these tests to
characterize the oil and to summarize the advantages and disadvantages associated with
the use of each oil. RStudio, Microsoft Excel, and Matlab were used to analyze the data
and perform calculations. T-tests were used to determine the variance, margin of error, and
percent error within individual runs. Analysis of Variance (ANOVA) and Tukey’s Honest
Significant Difference Test (HSD) were employed to compare results between runs. In all
of the calculations a 95% confidence interval was used. The results of this study show that
varying the concentration of nanoparticles in Aeroshell 560 turbine oil can drastically
change the thermal properties of the oil. This research also suggests that Aeroshell 560
turbine oil containing zinc sulfide, boron nitride, and graphene particles can provide
significant improvements in fuel efficiency and friction reduction. Oil containing
nanodiamond particles also improves performance of the APU and IGB, but not to the same
extent as the other nano oil. A small improvement in efficiency could result in millions of
dollars of fuel savings for the U.S. Army if the oil is implemented fleet wide in the APU
and even more if the idea is translated to the main power source of the aircraft, the T700
turbo jet engine.

vi
TABLE OF CONTENTS
ACKNOWLEDGEMENTS ............................................................................................... iii
ABSTRACT ....................................................................................................................... iv
LIST OF TABLES ........................................................................................................... viii
LIST OF FIGURES ............................................................................................................ x
LIST OF SYMBOLS ......................................................................................................... xi
LIST OF ABBREVIATIONS ........................................................................................... xii
Chapter 1: INTRODUCTION............................................................................................. 1
1.1 Background ............................................................................................................... 1
1.2 Literature Review ...................................................................................................... 2
1.3 Problem Definition .................................................................................................... 3
1.4 Problem Solution ....................................................................................................... 4
Chapter 2: TEST STAND DESCRIPTIONS AND PROCEDURES ................................. 6
2.1 Tail Rotor Drive Train ............................................................................................... 6
2.2 No Load Test Stand ................................................................................................... 7
2.3 Auxiliary Power Unit Test Stand ............................................................................ 10
2.4 Small Engine Test Stand ......................................................................................... 15
2.5 Procedures for Offline Analyses ............................................................................. 17
Chapter 3: PRESENTATION OF RESULTS................................................................... 19
vii
3.1 TRDT Results .......................................................................................................... 19
3.2 No Load Test Results .............................................................................................. 21
3.3 APU Test Results .................................................................................................... 22
3.4 Small Engine Results .............................................................................................. 34
3.5 Results From Offline Analyses ............................................................................... 39
CHAPTER 4: DISCUSSION OF RESULTS ................................................................... 45
4.1 Tail Rotor Drivetrain ............................................................................................... 45
4.2 No Load Test Stand ................................................................................................. 45
4.3 Auxiliary Power Unit .............................................................................................. 47
4.4 Small Engine Test Stand ......................................................................................... 51
CHAPTER 5: CONCLUSION ......................................................................................... 53
REFERENCES ................................................................................................................. 56
APPENDIX A: RSTUDIO SAMPLE CODE ................................................................... 58
APPENDIX B: SAMPLES OF DATA ............................................................................. 59
APPENDIX C: SENSOR ACCURACY .......................................................................... 68

viii
LIST OF TABLES
Table 3.1 TRDT Data for Conventional Oil ..................................................................... 20
Table 3.2 TRDT Data for Batch A.1................................................................................. 20
Table 3.3 TRDT Oil Data Comparison ............................................................................. 21
Table 3.4 No Load Temperature Differences (°F) ............................................................ 22
Table 3.5 Conventional Oil APU Data ............................................................................. 23
Table 3.6 Conventional Oil Data for 7 Runs .................................................................... 24
Table 3.7 Conventional Oil Temperatures ........................................................................ 25
Table 3.8 Vibration Data for Conventional Oil ................................................................ 25
Table 3.9 Batch A Oil Data............................................................................................... 26
Table 3.10 Batch A Oil Average for 7 Runs ..................................................................... 26
Table 3.11 Batch A Oil Temperatures .............................................................................. 27
Table 3.12 Vibration Data for Batch A Oil ....................................................................... 27
Table 3.13 Batch B Oil Data for 7 Runs ........................................................................... 28
Table 3.14 Batch B Oil Average for 7 Runs ..................................................................... 28
Table 3.15 Batch B Oil Temperatures .............................................................................. 29
Table 3.16 Vibration Data for Batch B Oil ....................................................................... 29
Table 3.17 Efficiency and Fuel Flow Results ................................................................... 31
Table 3.18 Oil Temperature Results ................................................................................. 33
Table 3.19 Batch A and Batch B vs Conventional Results .............................................. 34
Table 3.20 Small Engine Efficiency Results .................................................................... 35

ix
Table 3.21 Comparison of Small Engine Efficiency Results ........................................... 36
Table 3.22 Small Engine Temperature Results ................................................................. 36
Table 3.23 Comparison of Small Engine Temperature Results ........................................ 37
Table 3.24 Small Engine Vibration Results ...................................................................... 38
Table 3.25 Comparison of Small Engine Vibration Data ................................................. 39
Table 3.26 Dynamic Viscosities of Oils at Various Temperatures ................................... 39
Table B.1 Sample of APU Oil Temperature Data ............................................................ 59
Table B.2 Sample of APU Efficiency Data ...................................................................... 59
Table B.3 Sample of No Load Data .................................................................................. 60
Table B.4 Sample of TRDT Data ..................................................................................... 61
Table B.5 Conventional APU Efficiency Data ................................................................. 62
Table B.6 Batch A APU Data ........................................................................................... 64
Table B.7 Batch B APU Data ........................................................................................... 66
Table C.1 Accuracy of Sensors ......................................................................................... 68

x
LIST OF FIGURES
Figure 2.1 Tail Rotor Drive Train Test Stand ..................................................................... 6
Figure 2.2 No Load Test Stand ........................................................................................... 8
Figure 2.3 IGB Thermocouples .......................................................................................... 9
Figure 2.4 APU Test Stand ............................................................................................... 10
Figure 2.5 Small Engine Test Stand ................................................................................. 15
Figure 3.1 Boxplots of Oil Efficiency for Each Oil Type ................................................. 31
Figure 3.2 Efficiency Graph for Each Run ....................................................................... 32
Figure 3.3 Box Plot of Oil Temperatures.......................................................................... 33
Figure 3.4 Graph of Oil Viscosities .................................................................................. 40
Figure 3.5 Image of Large Particles in the Initial Batch B Nano Oil ............................... 41
Figure 3.6 Image of Batch B Nano Oil ............................................................................. 42
Figure 3.7 Image of Nano Oil Batch A ............................................................................. 43
Figure 3.8 TEM Image of Nano Particles ......................................................................... 44
Figure 3.9 Transient APU Oil Temperature ..................................................................... 48
Figure 3.10 Oil Filter Before and After Testing ............................................................... 50
Figure A.1 Sample RStudio Code ..................................................................................... 58

xi
LIST OF SYMBOLS
�̇� Output power
�̇�𝑖𝑛 Energy input from fuel
�̇�𝑓𝑢𝑒𝑙 Mass flow rate of fuel
x Vibration data in a time domain
N Number of vibration data points
𝒲 Volumetric fuel flow rate
δ Ratio of measured barometric pressure to standard sea level barometric pressure
θ Ratio of measured ambient temperature to a standard temperature of 15°C

xii
LIST OF ABBREVIATIONS
AED ................................................................................. Aviation Engineering Directorate
ANOVA ............................................................................................... Analysis of Variance
APU..................................................................................................... Auxiliary Power Unit
CI............................................................................................................ Condition Indicator
DA1 ........................................................................................................... Data Algorithm 1
ESU ............................................................................................... Electronic Sequence Unit
FFT ................................................................................................... Fast Fourier Transform
FM4 .........................................................................................Fourth-Order Figure of Merit
HSD........................................................................................ Honest Significant Difference
IDB ...................................................................................................... Input Duplex Bearing
IGB ......................................................................................................Intermediate Gearbox
IRB ....................................................................................................... Input Roller Bearing
MSPU .................................................................................. Modern Signal Processing Unit
ODB ................................................................................................. Output Duplex Bearing
ORB ................................................................................................... Output Roller Bearing
RMS .........................................................................................................Root Mean Square
STA ........................................................................................... Synchronous Time Average
TEM ...............................................................................Transmission Electron Microscope
TRDT ................................................................................................ Tail Rotor Drive Train
1
CHAPTER 1: INTRODUCTION
1.1 Background
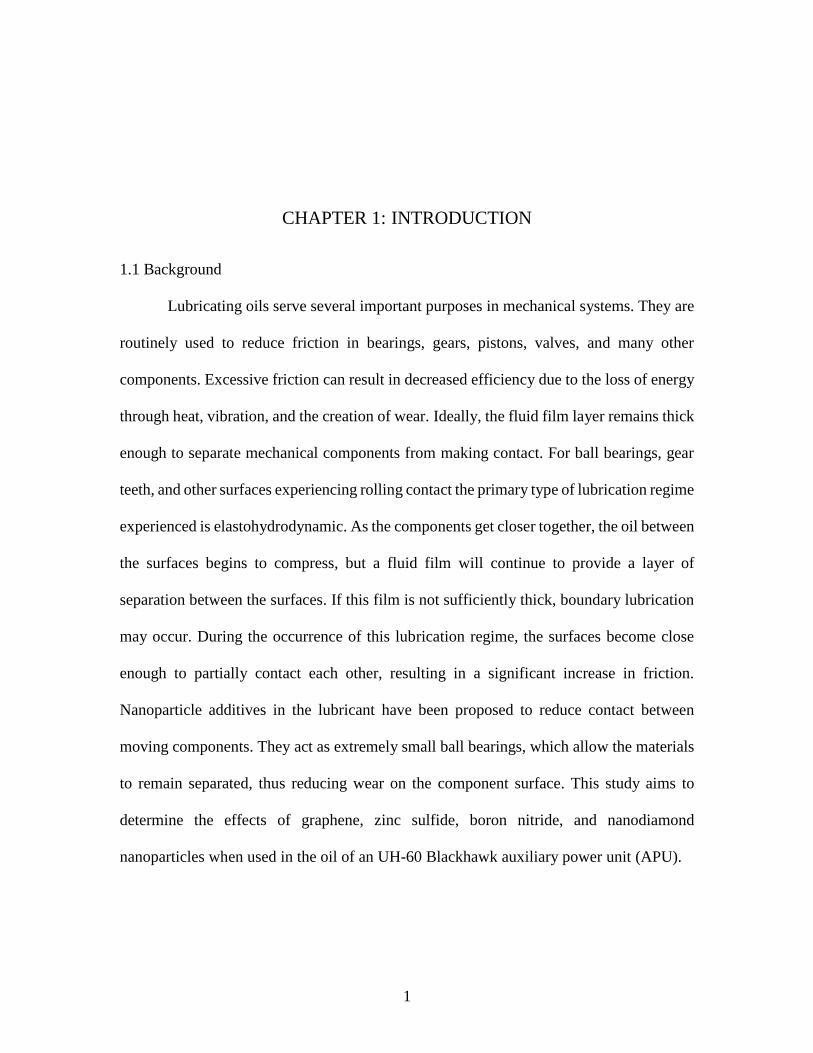
Lubricating oils serve several important purposes in mechanical systems. They are
routinely used to reduce friction in bearings, gears, pistons, valves, and many other
components. Excessive friction can result in decreased efficiency due to the loss of energy
through heat, vibration, and the creation of wear. Ideally, the fluid film layer remains thick
enough to separate mechanical components from making contact. For ball bearings, gear
teeth, and other surfaces experiencing rolling contact the primary type of lubrication regime
experienced is elastohydrodynamic. As the components get closer together, the oil between
the surfaces begins to compress, but a fluid film will continue to provide a layer of
separation between the surfaces. If this film is not sufficiently thick, boundary lubrication
may occur. During the occurrence of this lubrication regime, the surfaces become close
enough to partially contact each other, resulting in a significant increase in friction.
Nanoparticle additives in the lubricant have been proposed to reduce contact between
moving components. They act as extremely small ball bearings, which allow the materials
to remain separated, thus reducing wear on the component surface. This study aims to
determine the effects of graphene, zinc sulfide, boron nitride, and nanodiamond
nanoparticles when used in the oil of an UH-60 Blackhawk auxiliary power unit (APU).
2
1.2 Literature Review
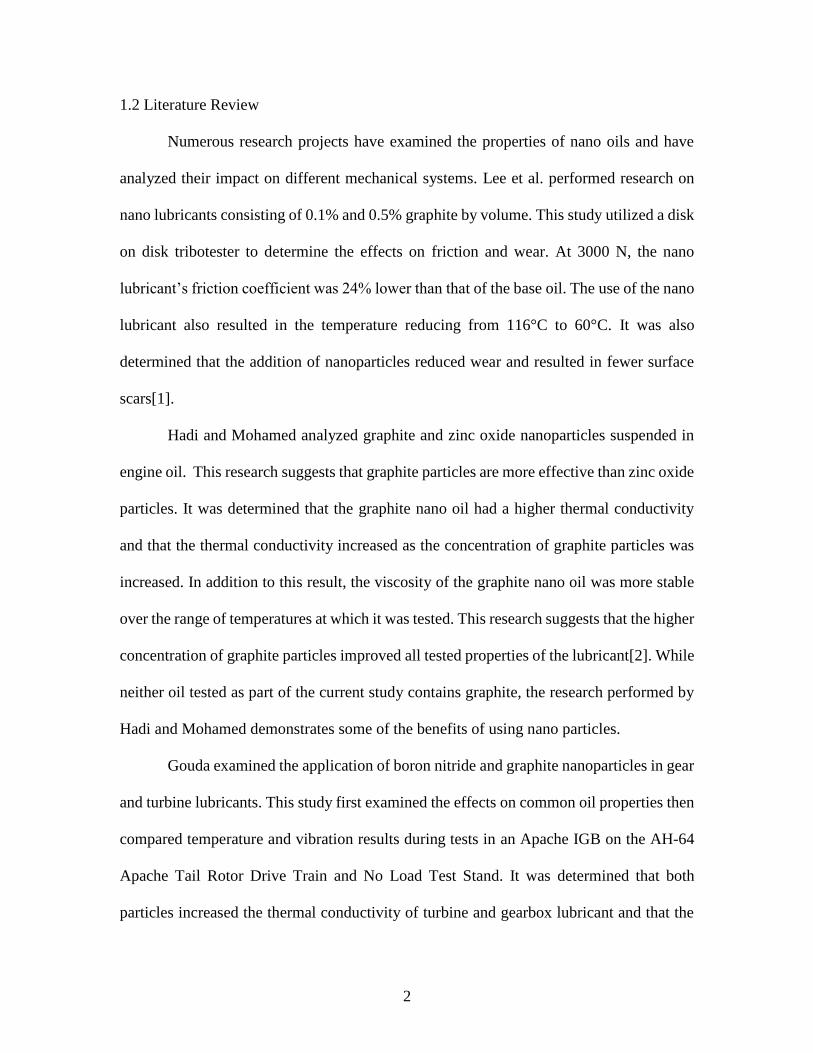
Numerous research projects have examined the properties of nano oils and have
analyzed their impact on different mechanical systems. Lee et al. performed research on
nano lubricants consisting of 0.1% and 0.5% graphite by volume. This study utilized a disk
on disk tribotester to determine the effects on friction and wear. At 3000 N, the nano
lubricant’s friction coefficient was 24% lower than that of the base oil. The use of the nano
lubricant also resulted in the temperature reducing from 116°C to 60°C. It was also
determined that the addition of nanoparticles reduced wear and resulted in fewer surface
scars[1].
Hadi and Mohamed analyzed graphite and zinc oxide nanoparticles suspended in
engine oil. This research suggests that graphite particles are more effective than zinc oxide
particles. It was determined that the graphite nano oil had a higher thermal conductivity
and that the thermal conductivity increased as the concentration of graphite particles was
increased. In addition to this result, the viscosity of the graphite nano oil was more stable
over the range of temperatures at which it was tested. This research suggests that the higher
concentration of graphite particles improved all tested properties of the lubricant[2]. While
neither oil tested as part of the current study contains graphite, the research performed by
Hadi and Mohamed demonstrates some of the benefits of using nano particles.
Gouda examined the application of boron nitride and graphite nanoparticles in gear
and turbine lubricants. This study first examined the effects on common oil properties then
compared temperature and vibration results during tests in an Apache IGB on the AH-64
Apache Tail Rotor Drive Train and No Load Test Stand. It was determined that both
particles increased the thermal conductivity of turbine and gearbox lubricant and that the

3
thermal conductivity rose as the concentrations of particles were increased. For identical
concentrations of nano particles, graphite resulted in a higher thermal conductivity. It was
also observed that both particles increased the viscosity of the oils. The results from the No
Load tests suggest that temperature and vibration continued to be reduced for
concentrations up to 2% in gearbox lubricant. The 2.5% concentration caused an increase
in temperature and vibration[3].
Nasiri-Khuzani et al. performed fuel consumption and wear tests in agricultural
tractors running with nano diamond particles. These tests were conducted on eight Massey
Ferguson Model 399 tractors with viscosity, fuel consumption, and additional variables
being analyzed at 65, 90, 115, and 150 hours of run time. It was shown that viscosity was
increased by the addition of nanoparticles. This research concluded that wear in cylinders,
drive shafts, and gears was reduced by 68% while wear in rings and bearings was reduced
by 64%. It also suggests that fuel consumption was reduced by 21%[4].
Fernandez studied power loss in bearings and gears. In this thesis, it was determined
that the efficiency of a gearbox can be improved by modifying the oil. This study analyzes
friction and viscosity of different oils and studies their effects on power loss in a wind
turbine gearbox. It was found that oils with slightly higher viscosities improved the
efficiency of gears, while the oils with slightly lower viscosities seemed to improve the
performance of bearings[5].
1.3 Problem Definition
Lee et al., Hadi, and Mohamed perform valuable research which expands the
current knowledge of nano lubricants and their basic properties. Gouda expands on this by
4
performing a more in depth study of these properties in addition to testing nano oils in
actual military helicopter components. The fuel efficiency and wear research of Nasiri-
Khuzani et al. is more similar to research performed as part of the current study. While
these studies determine important properties of nano additives and suggest that there are
substantial benefits to using nano oils, they do not analyze the effects of these additives in
a turbine engine. The goal of this research is to further enhance the understanding of nano
oil properties while determining any benefits associated with the use of nano particle oils
in the UH-60 APU. Based on the previous studies, reducing friction in the APU should
reduce wear while improving fuel efficiency. Improving fuel efficiency and the rate of
wear in the APU may result in large cost savings, if the proposed oil proves effective and
is implemented across an entire fleet of aircraft. Wear reduction may also result in fewer
component failures, which improves safety and reduces maintenance costs.
1.4 Problem Solution
The nano oil performance is compared using multiple tests to develop a more
complete understanding of the effects of the particles in oil. Aeroshell 560 is used as the
conventional oil as well as the base oil with which the nano particles are mixed to create
the nano oils. It meets the military specifications for use in the APU. The exact
compositions of nano particles in each oil is proprietary information and is not disclosed
as part of this study. The lubricants are tested in the TRDT, No Load, and APU test stands.
These test stands and the test procedures are explained in detail in Chapter 2. In addition
to these tests, offline analyses are performed to provide a better understanding of the oils
and their properties. Thermal and tribological properties including; friction, heat transfer,

5
viscosity, and particle size were analyzed in addition to fuel efficiency. The lubricant
characteristics will be discussed and compared to those found in previous research and new
findings for turbine effects are discussed. For this study, the oil containing nanodiamond
is referred to as Batch A and the oil containing zinc sulfide, boron nitride, and graphene is
Batch B.
6
CHAPTER 2: TEST STAND DESCRIPTIONS AND PROCEDURES
2.1 Tail Rotor Drive Train
2.1.1 Description of TRDT
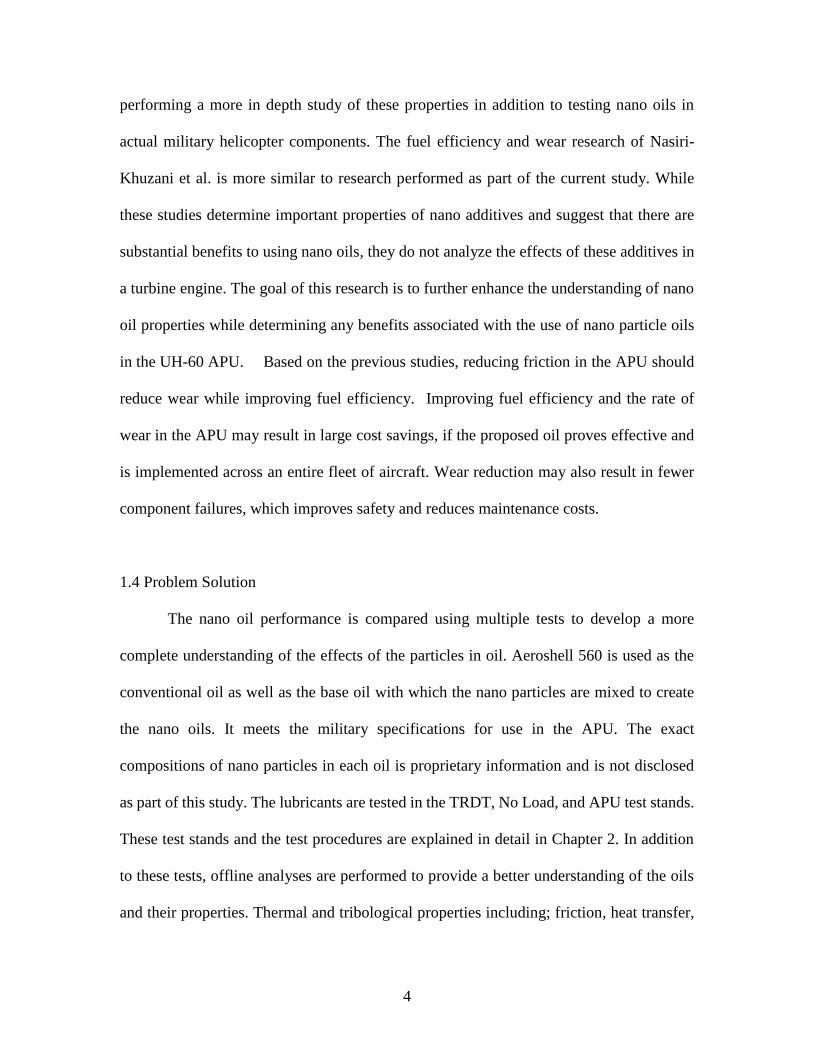
The TRDT can be seen in Figure 2.1. It has been certified by The Aviation
Engineering Directorate (AED) as sufficiently replicating flight conditions. It is composed
of several AH-64 drive train components. The input motor is not shown in the image, but
it rotates the #3 drive shaft which connects to the #4 drive shaft at the Forward Hanger
Bearing. Drive shaft #4 connects to Drive Shaft #5 at the Aft Hanger Bearing. This shaft
connects to the Intermediate Gearbox (IGB). Drive shaft #6 connects the IGB to the Tail
Rotor Gearbox. Another motor, identical to the input motor, applies torque to the system.
The absorption motor can apply 150% of the load that is created by the engines on the
Apache and spins at 4,863 rpm, which matches the rpm experienced in flight.
FIGURE 2.1 TAIL ROTOR DRIVE TRAIN TEST STAND

7
2.1.2 TRDT Test Procedure
The IGB was filled with 650 ml of conventional oil and installed on the TRDT.
Twenty surveys were taken over five hours. This was performed five times to ensure that
the data would be statistically significant. It was determined that all of the conventional oil
could not be drained from the IGB without performing a change out. To prevent the
inconsistencies associated with removing and reassembling components, 325 ml of
conventional oil was removed using a pump and a concentrated Batch A.1 nano oil mixture
was added. The one in Batch A.1 stands for the variation of that batch. For this work there
are two iterations of Batch A. This oil was mixed with the remaining 325 ml of
conventional oil to result in the desired concentration. The IGB was tested again for five
hours, and repeated for five runs, with twenty surveys collected for each test. Then Batch
A.1 nano oil and conventional oil results were compared. It should be noted that Batch B
oil was not tested as part of this study. Batch B oil testing in the TRDT is detailed in the
future work section of this document.
2.2 No Load Test Stand
2.2.1 Description of No Load stand
Figure 2.2 shows the No Load Test Stand. It is similar to the TRDT except that a
torque load cannot be applied to the system. A five horsepower electric motor is used to
spin the drive shafts instead of the 800 horsepower motor that is found on the TRDT. The
No Load Test Stand can also be seen in the back of Figure 2.1. It is comprised of the same
#3 through #5 drive shafts, hanger bearings, and IGB that are found on the TRDT. It does
not have a #6 driveshaft, Tail Rotor Gearbox, or Output Motor. It can test components at
the full operating speed of 4,863rpm while using far less power. This makes initial testing

8
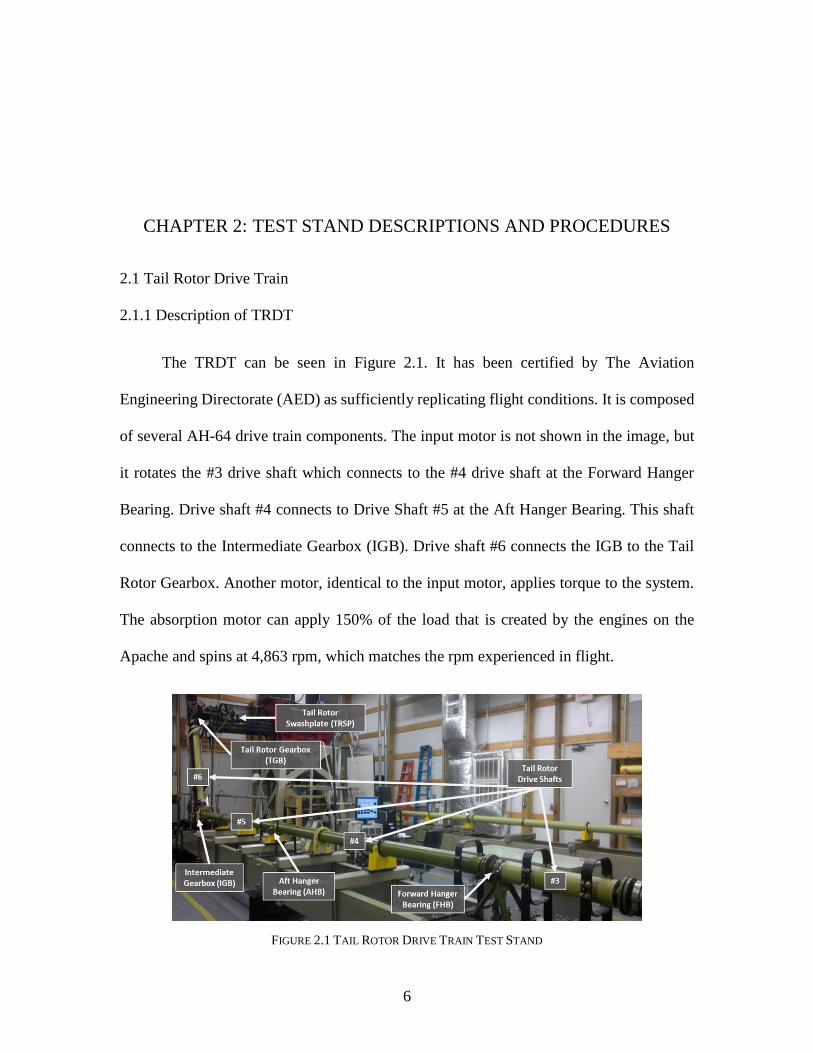
much cheaper while still providing valuable data. The IGB is equipped with four
thermocouples. The temperature can be measured at the Input Roller Bearing (IRB), Input
Duplex Bearing (IDB), Output Roller Bearing (ORB), and the Output Duplex Bearing
(ODB). These thermocouples are shown in Figure 2.3.
FIGURE 2.2 NO LOAD TEST STAND
9
FIGURE 2.3 IGB THERMOCOUPLES
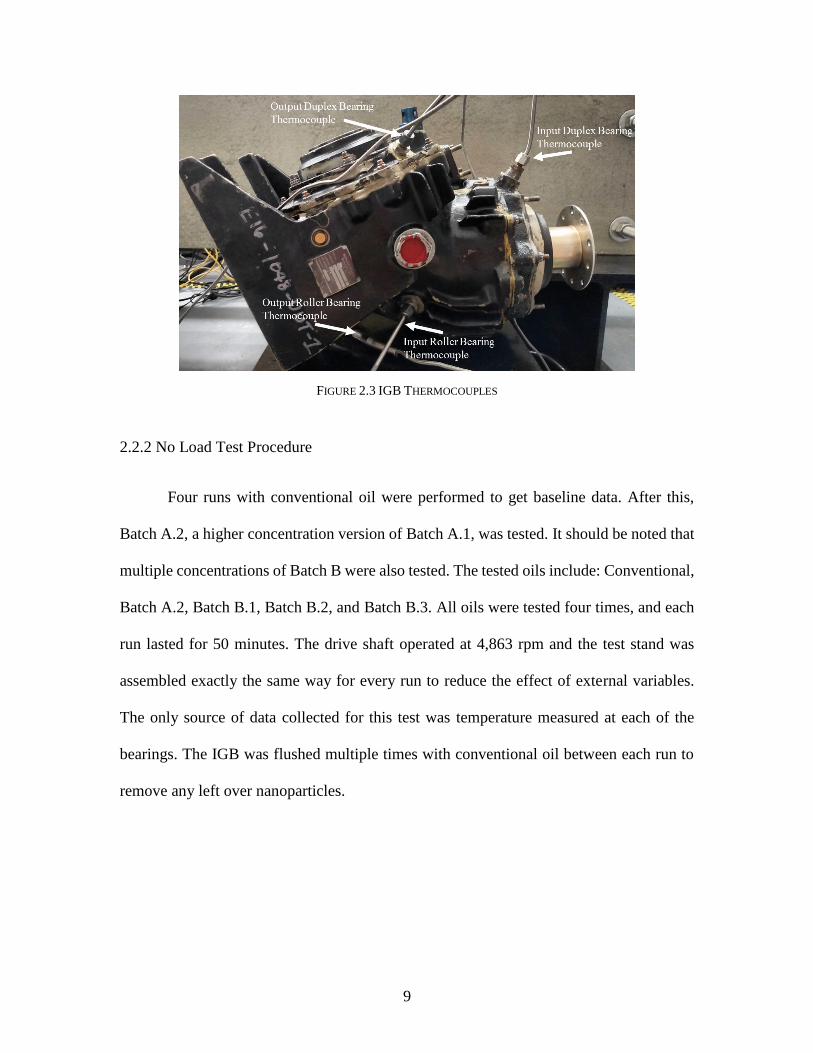
2.2.2 No Load Test Procedure
Four runs with conventional oil were performed to get baseline data. After this,
Batch A.2, a higher concentration version of Batch A.1, was tested. It should be noted that
multiple concentrations of Batch B were also tested. The tested oils include: Conventional,
Batch A.2, Batch B.1, Batch B.2, and Batch B.3. All oils were tested four times, and each
run lasted for 50 minutes. The drive shaft operated at 4,863 rpm and the test stand was
assembled exactly the same way for every run to reduce the effect of external variables.
The only source of data collected for this test was temperature measured at each of the
bearings. The IGB was flushed multiple times with conventional oil between each run to
remove any left over nanoparticles.

10
2.3 Auxiliary Power Unit Test Stand
2.3.1 Description of APU Test Stand
FIGURE 2.4 APU TEST STAND
Figure 2.4 shows the APU Test Stand. The battery, control box, and fuel pump can
be seen on the left side of the image. The APU is near the center of the image, while the
fuel flow meter, the remote servo control, the extended exhaust, and the water brake
dynamometer are not shown in this picture.
The system operates by the fuel boost pump causing fuel to flow from the fuel tank
to the inlet port on the APU. After the turbine reaches full speed and can consume fuel
without any additional assistance, the boost pump is turned off. This fuel continuously

11
combusts and causes the turbine to rotate, which transfers torque through the reduction
drive assembly to the output shaft. The water brake dynamometer is attached to this shaft,
and is controlled by a hose which is connected to a pressure regulator then to a manual
valve outfitted with a pressure gauge. The pressure regulator prevents inconsistent water
pressure from affecting the torque applied by the water brake. The flow rate of water is
adjusted to create a consistent torque load on the output shaft of the APU.
To reduce noise effect, the APU test stand is located inside a building equipped
with sound dampening foam. Exhaust gases flow out of the APU, through a ducting system
outside of the building. The exhaust system contains a muffler to further reduce sound and
the outlet side is directed upward to direct the noise away from the ground and populated
areas.
2.3.2 APU Test Procedure
Before operation, the APU is checked to ensure that the equipment is fully
functional and that there are no observable problems. A pre-test checklist is standard
operating procedure before each run. The Electronic Sequence Unit (ESU) is used to start
the APU and maintain its operation. The ESU automatically goes through the startup
process, brings the APU to full operating speed, and maintains constant turbine speed. This
process is controlled by the APU Tester, which can be seen on the left side of Figure 2.4.
The APU runs were performed uninterrupted for 45 minutes. Continuous vibration,
oil temperature, exhaust temperature, RPM, fuel consumption, and torque readings were
collected throughout the duration of each run. In addition to these readings, humidity,
ambient temperature, and barometric pressure were recorded throughout each run. The

12
APU was shut down and allowed to cool to ambient temperature between runs. Seven runs
were performed for Conventional, Batch A, and Batch B oils. All conventional oil testing
was performed first; this prevented the possibility of contaminating the conventional oil
with nano particles. The APU was flushed with conventional oil between Batch A and
Batch B runs to remove any leftover nanodiamond particles. The dynamometer provided a
consistent torque during the tests. The measurements taken during a 30 minute continuous
torque portion of each test were compared.
Data is analyzed using RStudio and Microsoft Excel. The overall efficiency, oil
temperature, and vibration data are compared between the oil types. The fuel flow rate is
not directly compared, because slight inconsistencies in RPM and torque are present due
to small variances in water pressure and the human error associated with manually
adjusting the torque. To account for this, the overall efficiency of the APU is calculated
and used for this study. This is performed using Equation 2.1. This relates the output power
(�̇�) to the input power from the fuel (�̇�𝑖𝑛). Output power is calculated using Equation 2.2.
RPM and torque were measured with the water brake dynamometer. The input power is
determined from the mass flow rate of the fuel and the energy density of the fuel. The lower
heating value is used for energy density, because energy is lost from the latent heat of
vaporization. The input power calculation is shown in Equation 2.3
13
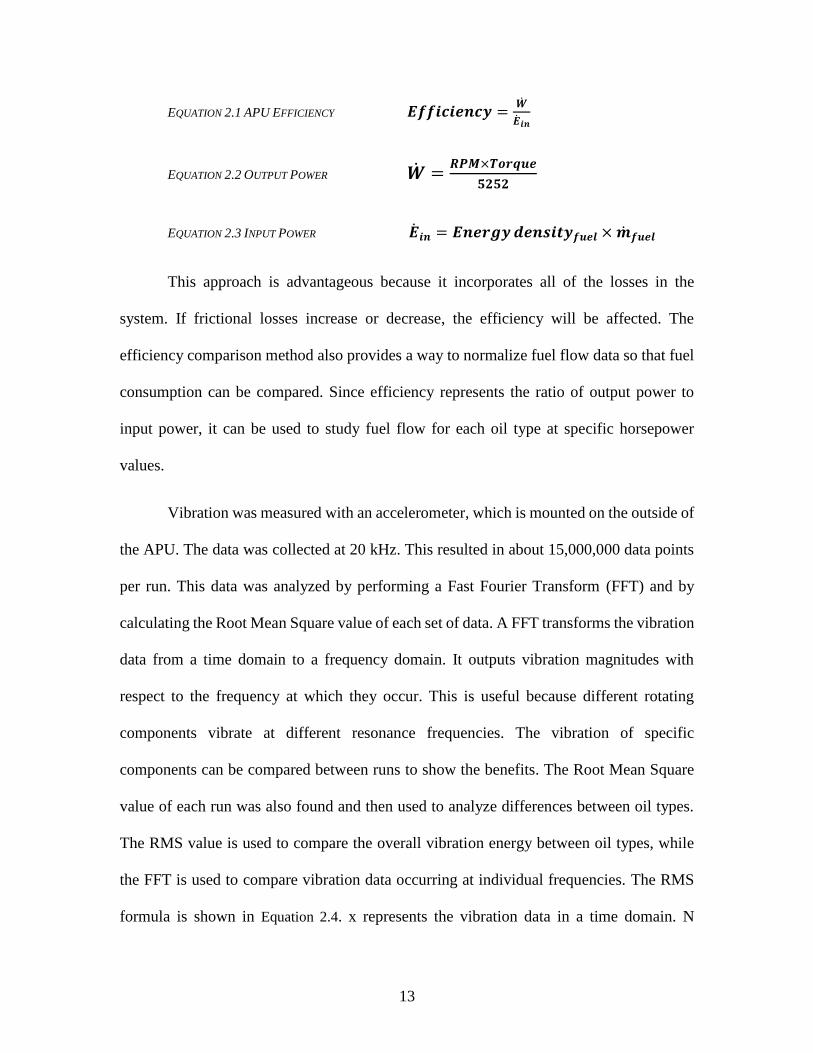
EQUATION 2.1 APU EFFICIENCY 𝑬𝒇𝒇𝒊𝒄𝒊𝒆𝒏𝒄𝒚 =�̇�
�̇�𝒊𝒏
EQUATION 2.2 OUTPUT POWER �̇� =𝑹𝑷𝑴×𝑻𝒐𝒓𝒒𝒖𝒆
𝟓𝟐𝟓𝟐
EQUATION 2.3 INPUT POWER �̇�𝒊𝒏 = 𝑬𝒏𝒆𝒓𝒈𝒚 𝒅𝒆𝒏𝒔𝒊𝒕𝒚𝒇𝒖𝒆𝒍 × �̇�𝒇𝒖𝒆𝒍
This approach is advantageous because it incorporates all of the losses in the
system. If frictional losses increase or decrease, the efficiency will be affected. The
efficiency comparison method also provides a way to normalize fuel flow data so that fuel
consumption can be compared. Since efficiency represents the ratio of output power to
input power, it can be used to study fuel flow for each oil type at specific horsepower
values.
Vibration was measured with an accelerometer, which is mounted on the outside of
the APU. The data was collected at 20 kHz. This resulted in about 15,000,000 data points
per run. This data was analyzed by performing a Fast Fourier Transform (FFT) and by
calculating the Root Mean Square value of each set of data. A FFT transforms the vibration
data from a time domain to a frequency domain. It outputs vibration magnitudes with
respect to the frequency at which they occur. This is useful because different rotating
components vibrate at different resonance frequencies. The vibration of specific
components can be compared between runs to show the benefits. The Root Mean Square
value of each run was also found and then used to analyze differences between oil types.
The RMS value is used to compare the overall vibration energy between oil types, while
the FFT is used to compare vibration data occurring at individual frequencies. The RMS
formula is shown in Equation 2.4. x represents the vibration data in a time domain. N

14
represents the number of values in the data. The square of the vibration data is averaged
and then the square root is found.
EQUATION 2.4 RMS EQUATION 𝑹𝑴𝑺(𝒙) = √𝟏
𝑵∑ 𝒙𝟐
Multiple studies suggest that ambient conditions can affect turbine efficiency[6,7].
This was accounted for by applying a correction factor to the fuel flow. Torque was held
constant by the water brake and the APU maintains a constant rpm by adjusting fuel flow,
so correction factors were not applied to the torque or rpm values. The fuel flow correction
factor was originally developed by Warner and Auyer in 1945 and later analyzed by the
National Advisory Committee for Aeronautics and the American Society of Mechanical
Engineers. The equation for corrected fuel flow is shown in Equation 2.5. 𝒲𝑓𝑢𝑒𝑙 represents
the measured volumetric fuel flow. 𝒲𝐶𝑜𝑟𝑟𝑒𝑐𝑡𝑒𝑑 𝑓𝑢𝑒𝑙 is the fuel flow after the correction is
applied. δ is the ratio of measured barometric pressure to a standard sea level barometric
pressure. θ is the ratio of measured ambient temperature to a standard temperature of 15°C.
The corrected volumetric fuel flow is multiplied by the density of the fuel to determine the
mass flow rate of the fuel[8].
EQUATION 2.5 CORRECTED FUEL FLOW 𝓦𝑪𝒐𝒓𝒓𝒆𝒄𝒕𝒆𝒅 𝒇𝒖𝒆𝒍 = 𝓦𝒇𝒖𝒆𝒍
𝜹√𝜽
Oil temperature was also corrected for effects caused by the difference in ambient
temperature. Federal Aviation Regulations were used to account for these effects. The
ambient temperature was subtracted from 100°F and then added to the oil temperature[9].
This can be seen in Equation 2.6.
15
Equation 2.6 Correction for Oil Temperature 𝐓𝐨𝐢𝐥_𝐜𝐨𝐫𝐫𝐞𝐜𝐭𝐞𝐝 = 𝐓𝐨𝐢𝐥 + (𝟏𝟎𝟎℉ − 𝐓𝐚𝐦𝐛𝐢𝐞𝐧𝐭)
The average oil temperature throughout each run was determined, then a Tukey
HSD test was performed to compare the runs for each oil type. All of the data is presented
and discussed in Chapters 3 and 4.
2.4 Small Engine Test Stand
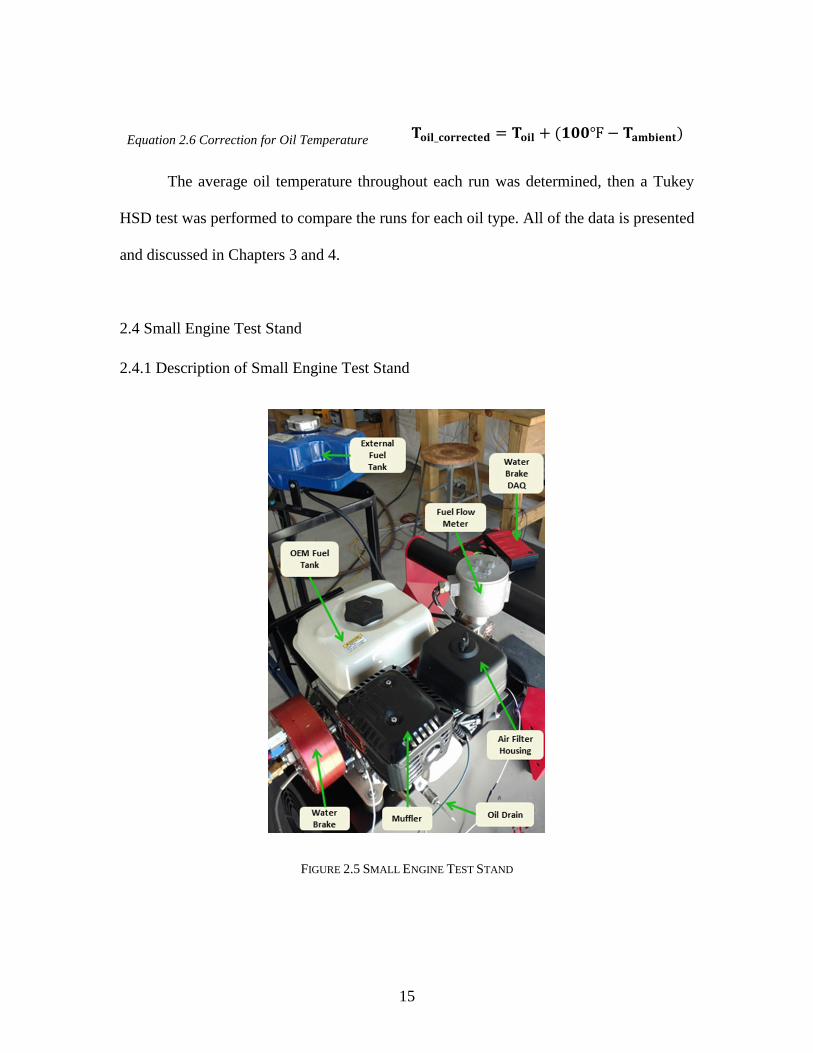
2.4.1 Description of Small Engine Test Stand
FIGURE 2.5 SMALL ENGINE TEST STAND

16
Figure 2.5 shows the Small Engine Test Stand. A 5.5 HP Honda GX200 4-stroke
engine was used for this test. A fuel flow meter is mounted between the fuel tank and the
engine to measure the fuel flow rate. The water brake dynamometer is attached to the output
shaft so that a consistent torque load can be applied. RPM, torque, and ambient conditions
are measured by the dynamometer. A DAQ utilizing LabView software is used for
gathering oil temperature and fuel flow data.
2.4.2 Small Engine Test Procedure
A ten hour run was performed to break-in the engine. After this, four runs were
performed for each type of oil. The engine was cooled after each sixty minute run until the
oil temperature lowered to the ambient temperature. Five types of oil were tested. These
include: Penzoil High Mileage 5W-30, Penzoil High Mileage 5W-30 with a nanodiamond
additive, AeroShell 560, AeroShell 560 with nanodiamond particles (Batch A), and
AeroShell 560 with graphene, zinc sulfide, and boron nitride particles (Batch B).
The Penzoil and AeroShell base oils were used to flush the engine between runs.
This removed nanoparticles that were left in the engine and returned the engine to a
baseline state. ANOVA and Tukey’s HSD were used for analyzing data from the last 30
minutes of each run. This allowed time for the engine to reach steady state operating
conditions. Equation 2.7 shows the correction factor used to account for variances in
ambient barometric pressure and temperature. P is ambient barometric pressure in millibars
and T is ambient temperature in °C. Equation 2.6 is used as the correction factor for oil
temperature.

17
Equation 2.7 Correction Factor for Efficiency 𝒄𝒇 = 𝟏. 𝟏𝟕𝟔 [(𝟗𝟗𝟎
𝑷) (
𝑻 + 𝟐𝟕𝟑
𝟐𝟗𝟖)
𝟏𝟐
] − 𝟎. 𝟏𝟕𝟔
2.5 Procedures for Offline Analyses
2.5.1 Viscosity
Viscosity is measured using a Brookfield Engineering Co. LVDV II viscometer.
This is a cone and plate type rotary viscometer. The torque meter used for this is a calibrated
beryllium-copper spring which connects the rotating cone to the drive mechanism. A
sample of the oil is placed between the cone and plate. The resistance to rotation, caused
by the fluid, is then measured. This resistance creates a torque that is proportional to the
shear stress in the fluid and this value is converted to dynamic viscosity in mPa·s from pre-
calculated values in the software. The system is accurate to within ±1.0% and
reproducibility is within ± 0.2%[10]. A Thermo NESLAB thermal bath was used to control
the temperature of the sample and has a temperature accuracy of within 0.1°C. The
Conventional, Batch A, and Batch B samples were tested at each ten degree increment
ranging from 20°C to 90°C. Nine measurements were taken at each temperature.
2.5.2 Optical Microscopy
During the mixing process of the oils, clumps of particles were visibly noticeable
in the original Batch B oil. To determine the size of these clumps, a KEYENCE VHX-
5000 optical microscope with a lens capable of 5000x magnification was used. Batch A
and Batch B were both examined and the size of the particle clumps was measured.

18
2.5.3 Transmission Electron Microscopy
A Hitachi H8000 TEM was used to measure the size of individual particles in the
Batch B oil. This device has a resolution of 1.5 nm and a magnification of 2,000-800,000x.
The sample had to be dried before it could be placed in the TEM. From there, the oil was
diluted with acetone and placed on a hot plate with a magnetic stirring device. The acetone
evaporated off, along with small amounts of oil. This was performed multiple times then
the solution was placed on a wafer and allowed to dry before being placed in the machine.
The types of the individual particles could not be identified, but their size could be
measured.

19
CHAPTER 3: PRESENTATION OF RESULTS
3.1 TRDT Results
Temperature and vibration Condition Indicator (CI) data were analyzed and
compared for the TRDT runs. CIs provide information about the condition of a mechanical
component and are derived from accelerometer data by using signal processing methods.
The CIs used for this study are Input FM4, Output FM4, Input DA1, and Output DA1.The
fourth-order figure of merit (FM4) is used to find localized faults in gear teeth. These faults
include chips, cracks, or spalling. FM4 is defined as the absolute kurtosis of the difference
signal normalized by the square of variance of the difference signal[11]. Data Algorithm 1
(DA1) is useful for detecting an overall energy increase in the signal. This usually indicates
a distributed gear fault, such as uniform wear of gear teeth. It is calculated by subtracting
the RMS of the synchronous time average (STA) from the average of the STA[12]. The
results for individual runs are shown in the following sections. The calculations used to
compare Conventional Oil to Batch A.1 oil were performed in RStudio.
3.1.1 Conventional Oil Results
The average values along with the margins of error for each Conventional Oil run
are shown in Table 3.1. It is shown that the percent error is below 2.3% for every run,
which indicates the data is consistent throughout the iterations.

20
TABLE 3.1 TRDT DATA FOR CONVENTIONAL OIL
3.1.2 Nano Oil Results
The average values along with the margins of error for each Batch A.1 run are shown
in Table 3.2. The results for the temperature and all 4 CIs are provided. The percent error
is below 1.6 % for every run.
TABLE 3.2 TRDT DATA FOR BATCH A.1
3.1.3 TRDT Oil Comparison
The Temperature, Input FM4, Output FM4, Input DA1, and Output DA1 data, for
every run of each type of oil was analyzed in RStudio. ANOVA and Tukey’s honest
significant difference (HSD) tests are used to analyze the data. ANOVA is used to
determine the means of variables for multiple oil types. Tukey HSD is then used to apply
a 95% confidence interval and to compare the values calculated by the ANOVA test.
Temp (° F) Input FM4 Output FM4 Input DA1 Output DA1
Run 1 212.50 ± 1.53 3.23 ± 0.31 2.90 ± 0.11 7.31 ± 0.17 7.18 ± 0.18
Run 2 211.69 ± 2.35 3.23 ± 0.23 2.93 ± 0.15 7.37 ± 0.24 7.22 ± 0.20
Run 3 210.75 ± 3.30 3.36 ± 0.29 2.89 ± 0.18 7.31 ± 0.14 7.13 ± 0.13
Run 4 209.87 ± 3.16 3.58 ± 0.24 2.91 ± 0.13 6.78 ± 0.26 6.58 ± 0.24
Run 5 212.13 ± 2.45 3.33 ± 0.37 2.96 ± 0.16 6.70 ± 0.20 6.49 ± 0.20
Conventional
Temp (° F) Input FM4 Output FM4 Input DA1 Output DA1
Run 1 213.59 ± 1.29 3.46 ± 0.16 2.88 ± 0.17 6.99 ± 0.20 6.69 ± 0.13
Run 2 213.53 ± 2.10 3.56 ± 0.22 2.87 ± 0.11 7.20 ± 0.22 6.81 ± 0.20
Run 3 213.52 ± 1.77 2.99 ± 0.21 2.83 ± 0.13 7.25 ± 0.20 6.96 ± 0.18
Run 4 214.90 ± 2.06 3.45 ± 0.29 2.81 ± 0.17 7.50 ± 0.19 7.17 ± 0.15
Run 5 212.43 ± 2.61 3.21 ± 0.29 2.82 ± 0.17 7.32 ± 0.26 6.99 ± 0.21
Batch A.1

21
TABLE 3.3 TRDT OIL DATA COMPARISON
The results from the Tukey’s HSD test are shown in Table 3.3. The difference in
means of the data is statistically significant for Temperature, Output FM4, and Input DA1.
There is not a significant difference for Input FM4 and Output DA1, so those CIs were not
affected by the oil type. The Temperature and Input DA1 CIs were both higher with the
Batch A.1 oil. Output FM4 was slightly lower for Batch A.1.
After reviewing these results, it was determined that the concentration of
nanodiamond particles was too low in Batch A.1. A new oil, Batch A.2, was developed for
further testing. There were multiple concentrations of Batch B, so the No Load test stand
was used to compare these concentrations, along with the Batch A.2 oil, to determine the
optimal oils for APU testing. The lower cost of No Load testing results in a more efficient
testing method to compare these oils.
3.2 No Load Test Results
Temperature data from the last 20 minutes of each run was analyzed in RStudio.
ANOVA and Tukey’s HSD tests were used to analyze the data. Table 3.4 shows the results
from the No Load testing. Conventional oil was tested first. The difference in average
temperature between conventional oil and each nano oil, at each location, is shown in this
table. A positive value indicates that the temperature rose by that amount, while a negative
value indicates that the temperature decreased by that amount.
Temp [C] InputFM4 OutputFM4 Input DA1 Output DA1
Change from
Conv to Batch A.11.22 ± 0.38 -0.01 ± 0.09 -0.08± 0.04 0.16 ± 0.09 0.00 ± 0.09
p-value 1.57E-09 0.749 0.000361 0.0004508 0.92001
22
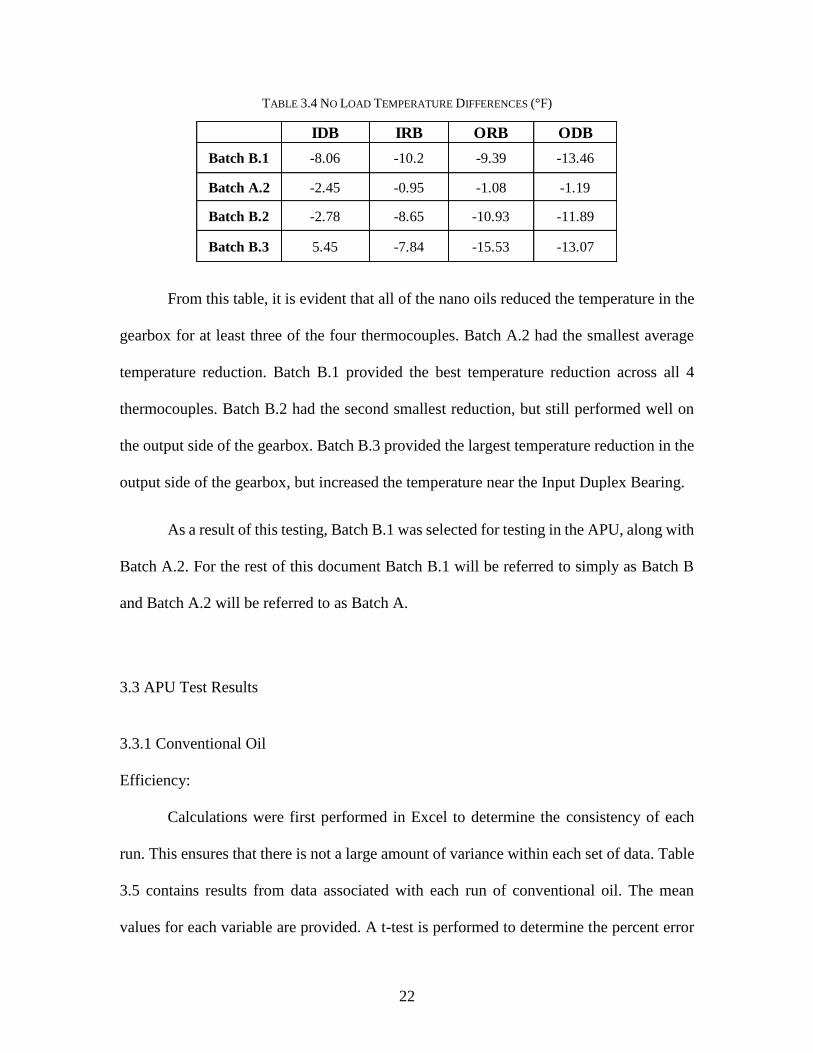
TABLE 3.4 NO LOAD TEMPERATURE DIFFERENCES (°F)
From this table, it is evident that all of the nano oils reduced the temperature in the
gearbox for at least three of the four thermocouples. Batch A.2 had the smallest average
temperature reduction. Batch B.1 provided the best temperature reduction across all 4
thermocouples. Batch B.2 had the second smallest reduction, but still performed well on
the output side of the gearbox. Batch B.3 provided the largest temperature reduction in the
output side of the gearbox, but increased the temperature near the Input Duplex Bearing.
As a result of this testing, Batch B.1 was selected for testing in the APU, along with
Batch A.2. For the rest of this document Batch B.1 will be referred to simply as Batch B
and Batch A.2 will be referred to as Batch A.
3.3 APU Test Results
3.3.1 Conventional Oil
Efficiency:
Calculations were first performed in Excel to determine the consistency of each
run. This ensures that there is not a large amount of variance within each set of data. Table
3.5 contains results from data associated with each run of conventional oil. The mean
values for each variable are provided. A t-test is performed to determine the percent error
IDB IRB ORB ODB
Batch B.1 -8.06 -10.2 -9.39 -13.46
Batch A.2 -2.45 -0.95 -1.08 -1.19
Batch B.2 -2.78 -8.65 -10.93 -11.89
Batch B.3 5.45 -7.84 -15.53 -13.07

23
in the data for a 95% confidence interval. The equation for percent error in a data set is
shown in Equation 3.1. The variance in the data is multiplied by the tcritical value and
divided by the square root of the degree of freedom. Torque is the controlled variable. A
pressure regulator, along with manual adjustment of a valve, results in a very consistent
torque load throughout each run. This is evident from the small percent error in each run’s
set of data. Fuel flow is the dependent variable. Equation 2.1 is used to find efficiency from
horsepower and flow rate. The data analyzed from the final 30 minutes of each run
consisted of approximately 1,800 data points for fuel flow and efficiency. Torque and RPM
were sampled more frequently and consisted of about 18,000 data points.
EQUATION 3.1 𝑃𝑒𝑟𝑐𝑒𝑛𝑡 𝐸𝑟𝑟𝑜𝑟 =
𝑉𝑎𝑟𝑖𝑎𝑛𝑐𝑒 × 𝑡𝑐𝑟𝑖𝑡𝑖𝑐𝑎𝑙
√𝑑𝑒𝑔𝑟𝑒𝑒 𝑜𝑓 𝑓𝑟𝑒𝑒𝑑𝑜𝑚
TABLE 3.5 CONVENTIONAL OIL APU DATA
Table 3.6 shows the average values across all seven runs. The standard deviation is
not shown since it is less than the error associated with the measuring devices, because of
the large number of data points collected during each run. 14.80 ft-lb of torque was applied
and the output shaft spun at 12009.62 RPM. This results in 33.84 hp of output power. The
Fuel Flow (mL/s) HP RPM Torque(ft-lb) Efficiency
Run 1 13.11 34.00 12022.32 14.86 5.48
Run 2 13.19 33.81 12024.19 14.77 5.42
Run 3 12.90 34.04 12009.54 14.89 5.58
Run 4 12.73 33.58 11998.14 14.70 5.57
Run 5 12.72 33.81 11987.68 14.81 5.61
Run 6 12.98 33.78 12018.55 14.76 5.50
Run 7 12.86 33.86 12006.95 14.81 5.56
Conventional

24
corrected fuel rate is 12.93 mL/s. The APU was 5.53% efficient during the seven runs with
conventional oil.
TABLE 3.6 CONVENTIONAL OIL DATA FOR 7 RUNS
Oil Temperature:
The oil temperature was analyzed from the 15 to 45 minute portion of each run.
The correction factor was applied by using Equation 2.6. This correction factor was
designed to be used for temperature in Fahrenheit. The data was then converted to Celsius
before the Tukey HSD test was performed. The average oil temperature for each run can
be seen in Table 3.7. The averages for each run are shown with and without the correction
for ambient temperature effects.
Fuel Flow(mL/s) Hp (Hp) Brake (RPM) Torque (ft-lb) Efficiency (%)
Mean 12.93 33.84 12009.62 14.80 5.53
Standard Deviation 0.18 0.15 13.38 0.06 0.07
Variance 0.03 0.02 178.91 0.00 0.00
n 7.00 7.00 7.00 7.00 7.00
df 6.00 6.00 6.00 6.00 6.00
t statistic (df) (95%) 2.37 2.37 2.37 2.37 2.37
Margin of Error 0.03 0.02 172.74 0.00 0.00
% Error 0.23% 0.07% 1.44% 0.03% 0.08%
Conventional Average

25
TABLE 3.7 CONVENTIONAL OIL TEMPERATURES
Equation 2.6 corrects the oil temperature to represent the results that would be
expected for an ambient temperature of 100°F (37.78°C). From this table, it is evident that
the correction factor greatly reduced the percent error in the data between the seven runs.
Vibration:
TABLE 3.8 VIBRATION DATA FOR CONVENTIONAL OIL
Table 3.8 shows the vibration data for the runs performed with conventional oil.
The average peak magnitude occurs at a frequency of 6,418.41 Hz. The variation in this is
caused by the rotational speed of the drive shaft during each run. The average peak
magnitude is 2.53 g and the average RMS is 25.90 g.
Oil Temp [°F] Oil Temp [°C] Corrected Temp [°F] Corrected Temp [°C]
Run 1 170.45 76.92 211.18 99.54
Run 2 169.14 76.19 211.76 99.87
Run 3 182.41 83.56 214.07 101.15
Run 4 187.90 86.61 211.94 99.97
Run 5 189.51 87.50 210.21 99.01
Run 6 175.80 79.89 211.85 99.92
Run 7 180.79 82.66 210.25 99.03
Mean 179.43 ± 8.00 81.90 ± 4.44 211.61 ± 1.31 99.78 ± 0.73
Conventional Oil
Peak Magnitude Peak Frequency Location (Hz) RMS
Run 1 2.23 6426.90 21.95
Run 2 2.54 6426.10 23.58
Run 3 3.05 6417.00 28.85
Run 4 2.86 6413.20 31.76
Run 5 3.27 6404.80 31.85
Run 6 2.48 6420.70 26.31
Run 7 1.25 6420.20 16.98
Mean 2.53 ± 0.66 6418.41 ± 7.68 25.90 ± 5.46
Conventional Oil Vibration Data
26
3.3.2 Batch A
Efficiency:
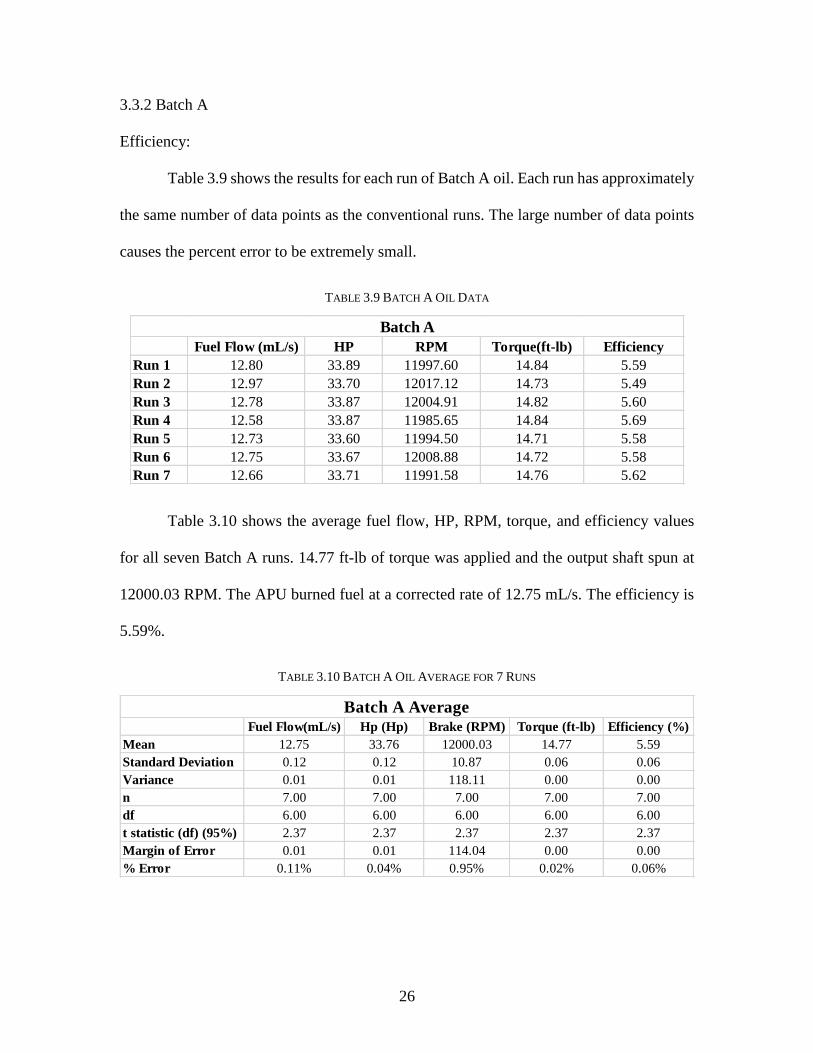
Table 3.9 shows the results for each run of Batch A oil. Each run has approximately
the same number of data points as the conventional runs. The large number of data points
causes the percent error to be extremely small.
TABLE 3.9 BATCH A OIL DATA
Table 3.10 shows the average fuel flow, HP, RPM, torque, and efficiency values
for all seven Batch A runs. 14.77 ft-lb of torque was applied and the output shaft spun at
12000.03 RPM. The APU burned fuel at a corrected rate of 12.75 mL/s. The efficiency is
5.59%.
TABLE 3.10 BATCH A OIL AVERAGE FOR 7 RUNS
Fuel Flow (mL/s) HP RPM Torque(ft-lb) Efficiency
Run 1 12.80 33.89 11997.60 14.84 5.59
Run 2 12.97 33.70 12017.12 14.73 5.49
Run 3 12.78 33.87 12004.91 14.82 5.60
Run 4 12.58 33.87 11985.65 14.84 5.69
Run 5 12.73 33.60 11994.50 14.71 5.58
Run 6 12.75 33.67 12008.88 14.72 5.58
Run 7 12.66 33.71 11991.58 14.76 5.62
Batch A
Fuel Flow(mL/s) Hp (Hp) Brake (RPM) Torque (ft-lb) Efficiency (%)
Mean 12.75 33.76 12000.03 14.77 5.59
Standard Deviation 0.12 0.12 10.87 0.06 0.06
Variance 0.01 0.01 118.11 0.00 0.00
n 7.00 7.00 7.00 7.00 7.00
df 6.00 6.00 6.00 6.00 6.00
t statistic (df) (95%) 2.37 2.37 2.37 2.37 2.37
Margin of Error 0.01 0.01 114.04 0.00 0.00
% Error 0.11% 0.04% 0.95% 0.02% 0.06%
Batch A Average

27
Oil Temperature:
Table 3.11 shows the average oil temperature for each run. The averages are shown
with and without the correction for ambient temperature effects.
TABLE 3.11 BATCH A OIL TEMPERATURES
As was the case for conventional oil, the correction for ambient temperature effects
caused the percent error in the data to be substantially reduced. This data is compared to
the data for conventional oil in section 3.3.1.
Vibration:
TABLE 3.12 VIBRATION DATA FOR BATCH A OIL
Oil Temp(°F) Oil Temp(°C) Corrected Temp(°F) Corrected Temp(°C)
Run 1 184.68 84.82 211.69 99.83
Run 2 171.91 77.73 209.97 98.87
Run 3 181.22 82.90 210.95 99.42
Run 4 185.89 85.49 205.99 96.66
Run 5 183.40 84.11 205.15 96.19
Run 6 177.54 80.86 211.35 99.64
Run 7 182.17 83.43 208.51 98.06
Mean 180.97 ± 4.82 82.77 ± 2.68 209.09 ± 2.63 98.38 ± 1.46
Batch A Oil
Peak Magnitude Peak Frequency Location (Hz) RMS
Run 1 2.30 6411.50 23.80
Run 2 2.42 6423.80 26.63
Run 3 2.10 6417.20 22.05
Run 4 1.26 6405.30 17.05
Run 5 0.71 6411.40 15.52
Run 6 1.00 6417.90 17.23
Run 7 1.75 6408.70 19.25
Mean 1.65 ± 0.67 6413.69 ± 6.29 20.22 ± 4.07
Batch A Vibration Data

28
Table 3.12 shows the vibration data for Batch A oil. The average peak magnitude
occurs at a frequency of 6,413.69 Hz. The average peak magnitude is 1.65 g and the average
RMS is 20.22 g.
3.3.3 Batch B
Efficiency:
Table 3.13 provides data for each of the Batch B runs. The percent error in the data
is less than two hundredths of a percent for every variable.
TABLE 3.13 BATCH B OIL DATA FOR 7 RUNS
The average data for each variable is provided in Table 3.14. The efficiency is
5.70%, the fuel flow is 12.50 mL/s, the RPM was 11,990.02, the torque is 14.76 ft-lbs, and
the output power was 33.70 HP.
TABLE 3.14 BATCH B OIL AVERAGE FOR 7 RUNS
Fuel Flow (mL/s) HP RPM Torque(ft-lb) Efficiency
Run 1 12.70 33.76 12012.45 14.76 5.61
Run 2 12.55 33.66 12006.26 14.72 5.67
Run 3 12.39 34.09 11968.97 14.96 5.81
Run 4 12.73 33.84 12010.53 14.80 5.62
Run 5 12.48 33.63 11989.59 14.73 5.69
Run 6 12.29 33.68 11970.98 14.78 5.79
Run 7 12.35 33.21 11971.35 14.57 5.68
Batch B
Fuel Flow(mL/s) Hp (Hp) Brake (RPM) Torque (ft-lb) Efficiency (%)
Mean 12.50 33.70 11990.02 14.76 5.70
Standard Deviation 0.17 0.27 19.76 0.12 0.08
Variance 0.03 0.07 390.32 0.01 0.01
n 7.00 7.00 7.00 7.00 7.00
df 6.00 6.00 6.00 6.00 6.00
t statistic (df) (95%) 2.37 2.37 2.37 2.37 2.37
Margin of Error 0.03 0.07 376.86 0.01 0.01
% Error 0.23% 0.20% 3.14% 0.09% 0.10%
Batch B Average

29
Oil Temperature:
The oil temperature data for Batch B is shown in Table 3.15. The temperatures,
with and without the ambient temperature correction, are provided. Again, the percent error
is reduced. The average temperature is noticeably higher than it is for Conventional and
Batch A testing.
TABLE 3.15 BATCH B OIL TEMPERATURES
Vibration:
TABLE 3.16 VIBRATION DATA FOR BATCH B OIL
Oil Temp(°F) Oil Temp(°C) Corrected Temp(°F) Corrected Temp(°C)
Run 1 203.63 95.35 227.68 108.71
Run 2 204.68 95.93 225.27 107.37
Run 3 211.83 99.90 219.01 103.89
Run 4 199.90 93.28 227.87 108.82
Run 5 208.14 97.86 224.06 106.70
Run 6 217.68 103.16 221.31 105.17
Run 7 216.99 102.77 223.35 106.31
Mean 208.98 ± 6.81 98.32 ± 3.78 224.08 ± 3.23 106.71 ± 1.80
Batch B Oil
Peak Magnitude Peak Frequency Location (Hz) RMS
Run 1 1.62 6422.80 18.78
Run 2 0.87 6417.50 15.49
Run 3 2.30 6396.80 24.03
Run 4 0.90 6416.70 15.79
Run 5 1.33 6405.20 18.62
Run 6 1.35 6391.20 18.93
Run 7 1.43 6396.80 21.88
Mean 1.40 ± 0.48 6406.71 ± 12.34 19.07 ± 3.06
Batch B Vibration Data

30
The vibration data for Batch B is provided in Table 3.16. The average peak
magnitude is 1.40 g and occurs at 6,406.71 Hz. The average RMS is 19.07 g. These values
show that the APU had lower vibration using Batch B than with Batch A or conventional
oil.
3.3.4 APU Oil Comparison
The efficiency, oil temperature, and vibration data were compared for all three oils.
This was performed by running an ANOVA test and a Tukey HSD with RStudio. This test
outputs the difference in each variable, between each type of oil. A 95% confidence interval
was chosen.
Efficiency:
Batch A and Batch B are each compared to the conventional oil. The results suggest
that both improve overall APU efficiency. The p-value is calculated as part of the Tukey
HSD test. It is calculated to determine if values are significantly different and can range
from zero to one. A small p-value, typically less than 0.05, means that the calculated values
are different. The p-value is less than 2x10-16 for all of these calculations. This provides
very good evidence that the data is statistically different. This test was performed for a 95%
confidence interval. It can be seen from the boxplot in Figure 3.1 that Batch B has the
highest efficiency. Figure 3.2 provides another visual representation of the data with the
efficiency graphed for each run. From the Tukey HSD test, the efficiency for Batch A oil
is 0.05% higher than conventional and the efficiency for Batch B is 0.16% higher than that

31
of Conventional oil. The average values for fuel flow, torque, RPM, and efficiency are
shown in Table 3.17.
TABLE 3.17 EFFICIENCY AND FUEL FLOW RESULTS
FIGURE 3.1 BOXPLOTS OF OIL EFFICIENCY FOR EACH OIL TYPE
Oil TypeAverage Corrected
Fuel Flow (mL/s)
Average Output
Torque (ft-lb)Average RPM
Average
Efficiency(%)
Conventional 12.93 14.80 12009.62 5.54
Batch A 12.75 14.77 12000.03 5.59
Batch B 12.50 14.76 11990.02 5.70
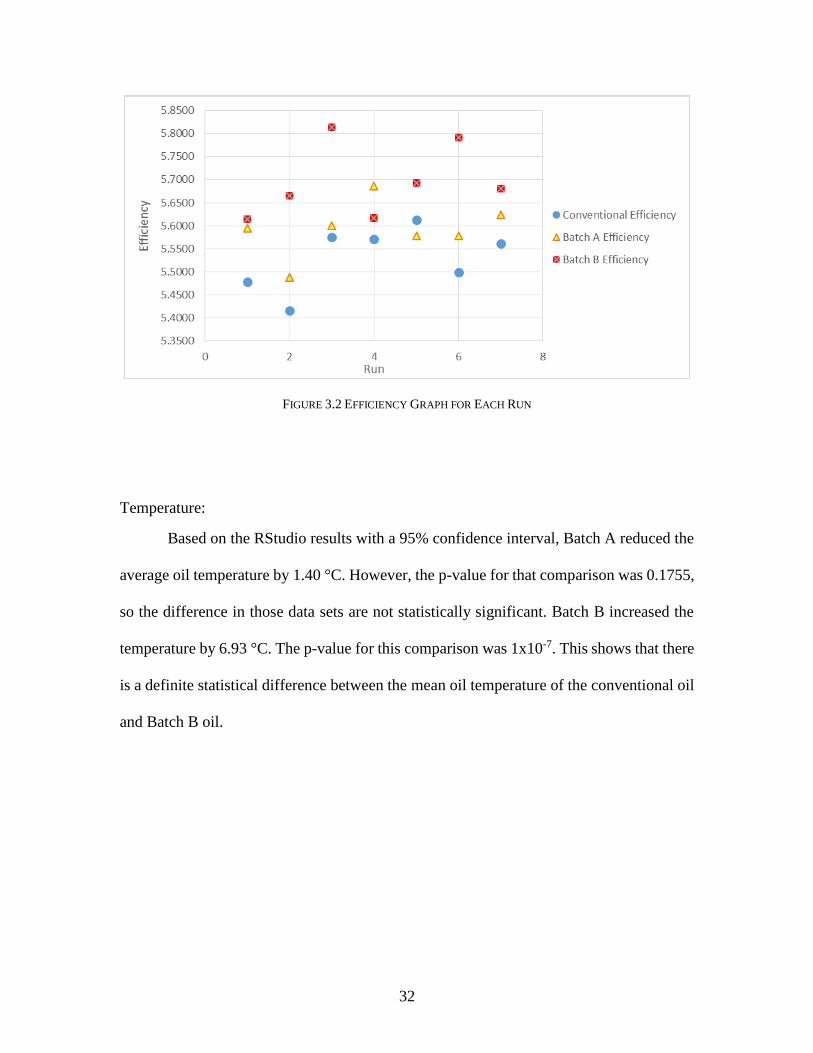
32
FIGURE 3.2 EFFICIENCY GRAPH FOR EACH RUN
Temperature:
Based on the RStudio results with a 95% confidence interval, Batch A reduced the
average oil temperature by 1.40 °C. However, the p-value for that comparison was 0.1755,
so the difference in those data sets are not statistically significant. Batch B increased the
temperature by 6.93 °C. The p-value for this comparison was 1x10⁻⁷. This shows that there
is a definite statistical difference between the mean oil temperature of the conventional oil
and Batch B oil.

33
TABLE 3.18 OIL TEMPERATURE RESULTS
FIGURE 3.3 BOX PLOT OF OIL TEMPERATURES
Figure 3.3 is a box plot of the oil temperatures. From the figure, it is evident that
the Batch B oil operated at a much higher temperature than the other two oils. An increase
in temperature can be a result of increased friction or from increased heat transfer from a
higher temperature at another location, such as the combustor.
Vibration:
The vibration data for each type of nano oil is compared to the conventional oil
using RStudio. ANOVA and Tukey HSD tests were used to analyze the data.
Oil Temp [°F] Oil Temp [°C] Corrected Temp [°F] Corrected Temp [°C]
Conventional 179.43 ± 8.00 81.90 ± 4.44 211.61 ± 1.31 99.78 ± 0.73
Batch A 180.97 ± 4.82 82.77 ± 2.68 209.09 ± 2.63 98.38 ± 1.46
Batch B 208.98 ± 6.81 98.32 ± 3.78 224.08 ± 3.23 106.71 ± 1.80

34
TABLE 3.19 BATCH A AND BATCH B VS CONVENTIONAL RESULTS
Table 3.19 shows the vibration results. The values represent the reduction in
vibration when using each nano oil instead of conventional oil. The p values are also shown
for each calculation. The p-value for the RMS comparison between Batch A and
conventional is very close to 0.05, so the statistical significance of that RMS value is
questionable. The other values are well below 0.05, so they are statistically significant.
Both oils show a reduction in peak vibrations and RMS, but Batch B shows a larger
decrease in both types of vibration. This is important because energy is converted to create
vibration and can result in a decrease in efficiency. Excessive vibration can also accelerate
wear and component failures.
3.4 Small Engine Results
3.4.1 Efficiency
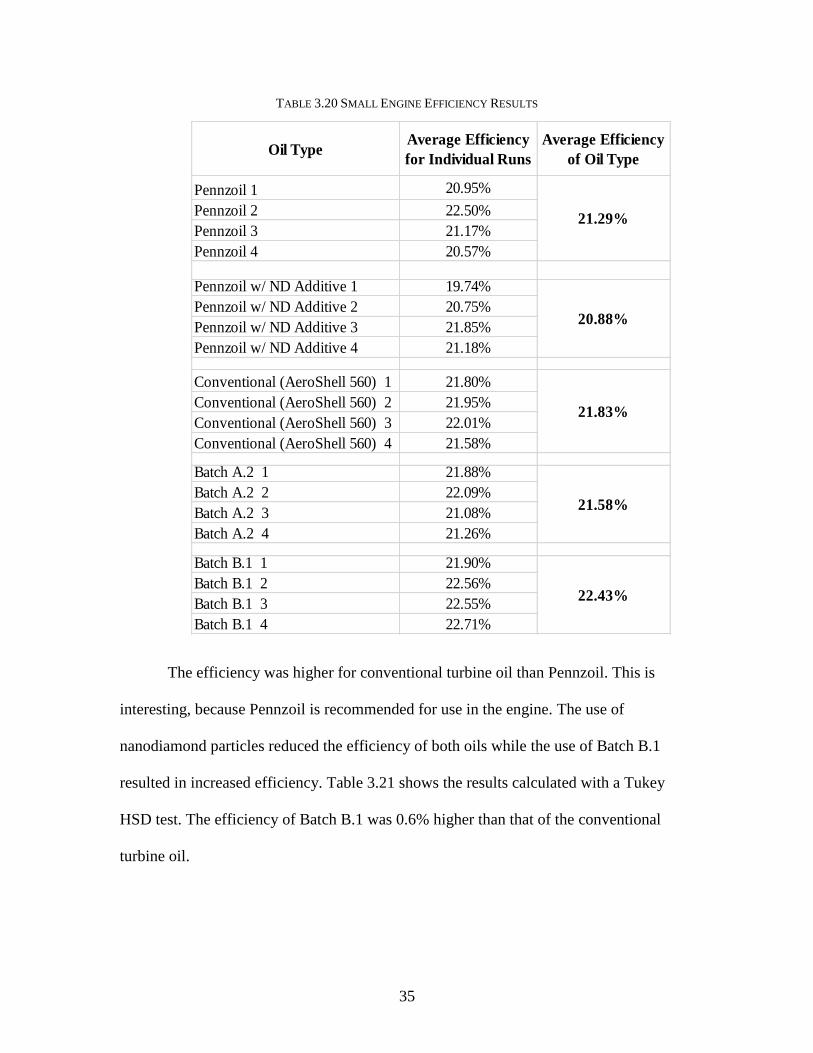
Table 3.20 shows the efficiency results for each run for all five types of oil along
with the average efficiency for each type.
Oil Comparison Peak Magnitude (g) p-value for Magnitude RMS (g) p-value for RMS
Batch A vs Conventional -0.88 0.04 -5.68 0.06
Batch B vs Conventional -1.12 0.01 -6.82 0.02
Vibration Data for Nano Oils Compared to Conventional Oil
35
TABLE 3.20 SMALL ENGINE EFFICIENCY RESULTS
The efficiency was higher for conventional turbine oil than Pennzoil. This is
interesting, because Pennzoil is recommended for use in the engine. The use of
nanodiamond particles reduced the efficiency of both oils while the use of Batch B.1
resulted in increased efficiency. Table 3.21 shows the results calculated with a Tukey
HSD test. The efficiency of Batch B.1 was 0.6% higher than that of the conventional
turbine oil.
Oil TypeAverage Efficiency
for Individual Runs
Average Efficiency
of Oil Type
Pennzoil 1 20.95%
Pennzoil 2 22.50%
Pennzoil 3 21.17%
Pennzoil 4 20.57%
Pennzoil w/ ND Additive 1 19.74%
Pennzoil w/ ND Additive 2 20.75%
Pennzoil w/ ND Additive 3 21.85%
Pennzoil w/ ND Additive 4 21.18%
Conventional (AeroShell 560) 1 21.80%
Conventional (AeroShell 560) 2 21.95%
Conventional (AeroShell 560) 3 22.01%
Conventional (AeroShell 560) 4 21.58%
Batch A.2 1 21.88%
Batch A.2 2 22.09%
Batch A.2 3 21.08%
Batch A.2 4 21.26%
Batch B.1 1 21.90%
Batch B.1 2 22.56%
Batch B.1 3 22.55%
Batch B.1 4 22.71%
21.29%
20.88%
21.83%
21.58%
22.43%

36
TABLE 3.21 COMPARISON OF SMALL ENGINE EFFICIENCY RESULTS
Temperature:
Table 3.22 shows the temperature results for each run for all five types of oil along
with the average efficiency for each type.
TABLE 3.22 SMALL ENGINE TEMPERATURE RESULTS

37
The oil temperature was also lower for AeroShell oil than for Pennzoil. The
addition of nanodiamonds resulted in lower oil temperatures for both oil types. The
conventional oil containing graphene, zinc sulfide, and boron nitride particles also
operated at a lower oil temperature than the conventional oil. The data comparison from
the Tukey HSD results can be seen in Table 3.23.
TABLE 3.23 COMPARISON OF SMALL ENGINE TEMPERATURE RESULTS
Vibration:
Table 3.24 shows the vibration results for each run of all five types of oil in addition
to the average efficiency for each type.

38
TABLE 3.24 SMALL ENGINE VIBRATION RESULTS
Unlike the efficiency and temperature results, the conventional oil resulted in
higher vibration values than Pennzoil. The nanodiamond additives increased overall
vibration when used in both types of oil, but not significantly. The Batch B.1 runs had the
lowest RMS values and using this oil instead of conventional oil resulted in a 15.4%
reduction in RMS. The vibration comparisons from the Tukey HSD test are shown in
Table 3.25. Based on the p-values, the addition of nanodiamond particles did not result in
a statistically significant change in RMS values. The p-value for Batch B.1 is much lower
than 0.05, so 15.4% reduction in vibration is statistically significant.
39
TABLE 3.25 COMPARISON OF SMALL ENGINE VIBRATION DATA
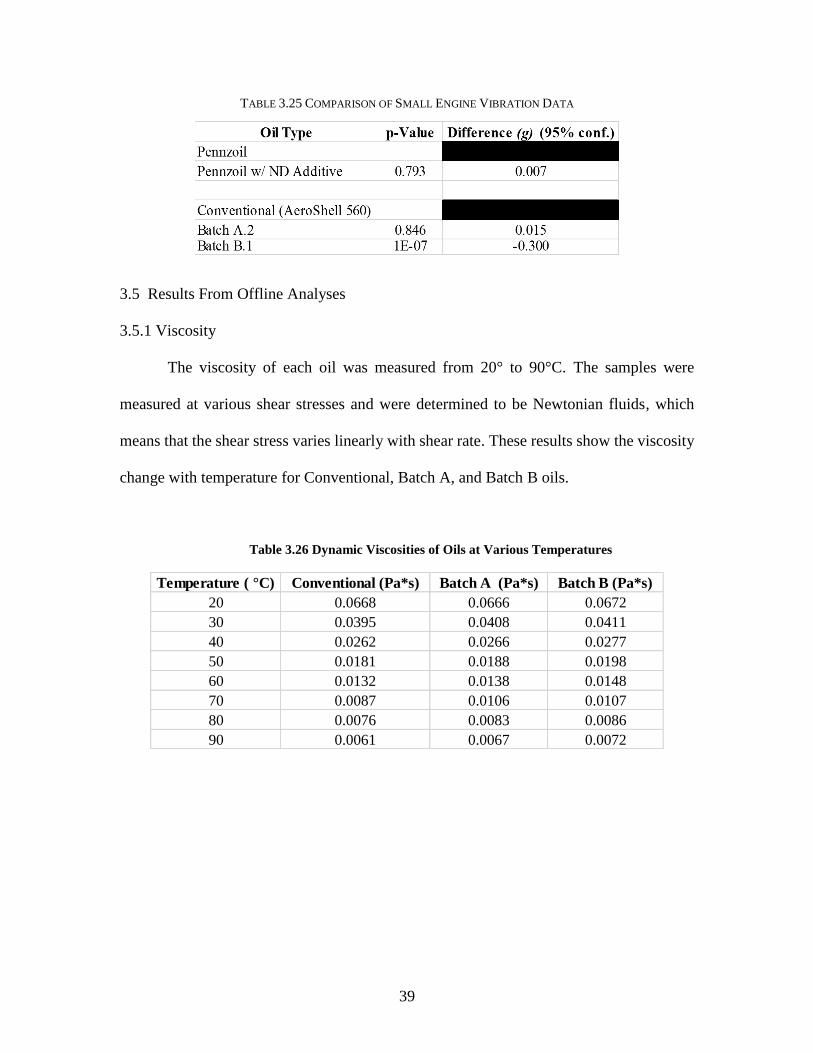
3.5 Results From Offline Analyses
3.5.1 Viscosity
The viscosity of each oil was measured from 20° to 90°C. The samples were
measured at various shear stresses and were determined to be Newtonian fluids, which
means that the shear stress varies linearly with shear rate. These results show the viscosity
change with temperature for Conventional, Batch A, and Batch B oils.
Table 3.26 Dynamic Viscosities of Oils at Various Temperatures
Temperature ( °C) Conventional (Pa*s) Batch A (Pa*s) Batch B (Pa*s)
20 0.0668 0.0666 0.0672
30 0.0395 0.0408 0.0411
40 0.0262 0.0266 0.0277
50 0.0181 0.0188 0.0198
60 0.0132 0.0138 0.0148
70 0.0087 0.0106 0.0107
80 0.0076 0.0083 0.0086
90 0.0061 0.0067 0.0072

40
FIGURE 3.4 GRAPH OF OIL VISCOSITIES
Table 3.26 and Figure 3.4 show the dynamic viscosities of the three types of oil.
Batch A has a higher viscosity than Conventional oil and Batch B has the highest viscosity
at every temperature. It is important for an oil to maintain an acceptable viscosity at higher
temperatures if it is designed for use in a jet engine. The oil temperature in the APU was
between 85°C and 105°C for most of the runs. At 90°C, the viscosity of Batch B was
17.97% higher than the viscosity of the Conventional oil. This would cause a reduction in
surface to surface contact, but also increase the drag force associated with spinning a
bearing in oil. It is important to maximize the reduction in surface contact while keeping
the drag force as low as possible.

41
3.5.2 Optical Microscopy
The optical microscope showed that there were large particles present in the initial
Batch B oil. Some of these particles were over 200µm. This can be seen in Figure 3.5.
FIGURE 3.5 IMAGE OF LARGE PARTICLES IN THE INITIAL BATCH B NANO OIL
Because these particles are so much larger than the pores in the APU oil filter, a
second Batch B oil was created to remove these large particles. The initial Batch B oil was
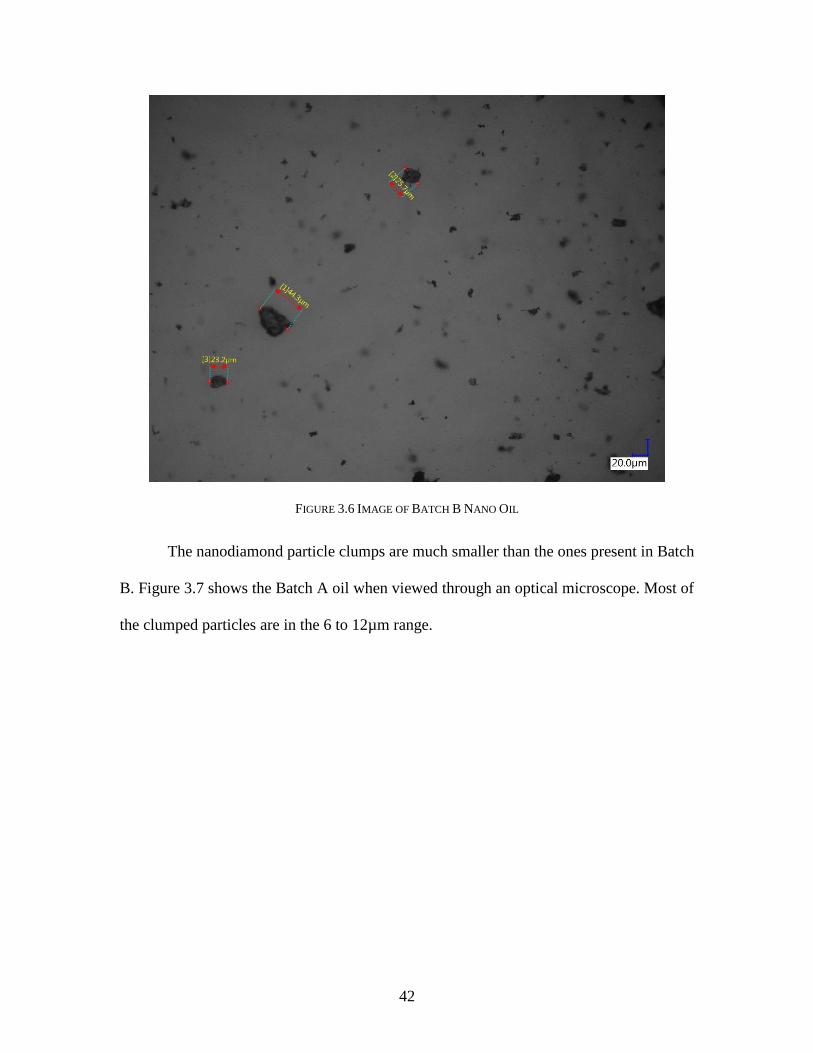
passed through a filter by NanoPro MT. While the particle size was reduced, Figure 3.6
shows that they were still in the 20 to 40µm range. The APU has a 10µm oil filter, so these
particles could still clog the filter.
42
FIGURE 3.6 IMAGE OF BATCH B NANO OIL
The nanodiamond particle clumps are much smaller than the ones present in Batch
B. Figure 3.7 shows the Batch A oil when viewed through an optical microscope. Most of
the clumped particles are in the 6 to 12µm range.

43
FIGURE 3.7 IMAGE OF NANO OIL BATCH A
3.5.3 Transmission Electron Microscopy
The Batch B particles were dried and observed with a transmission electron
microscope (TEM). The optical microscope could view the large clumps, but not the
individual particles. Figure 3.8 is an image taken with the TEM. Some of the oil could not
be removed. This caused the large clump of particles in the center of the image. A few
individual nano particles are circled in red. Based on the scale, these particles are very
close to 4nm. This suggests that the large particles observed with the optical microscope
are clumps of these nano particles.

44
FIGURE 3.8 TEM IMAGE OF NANO PARTICLES
45
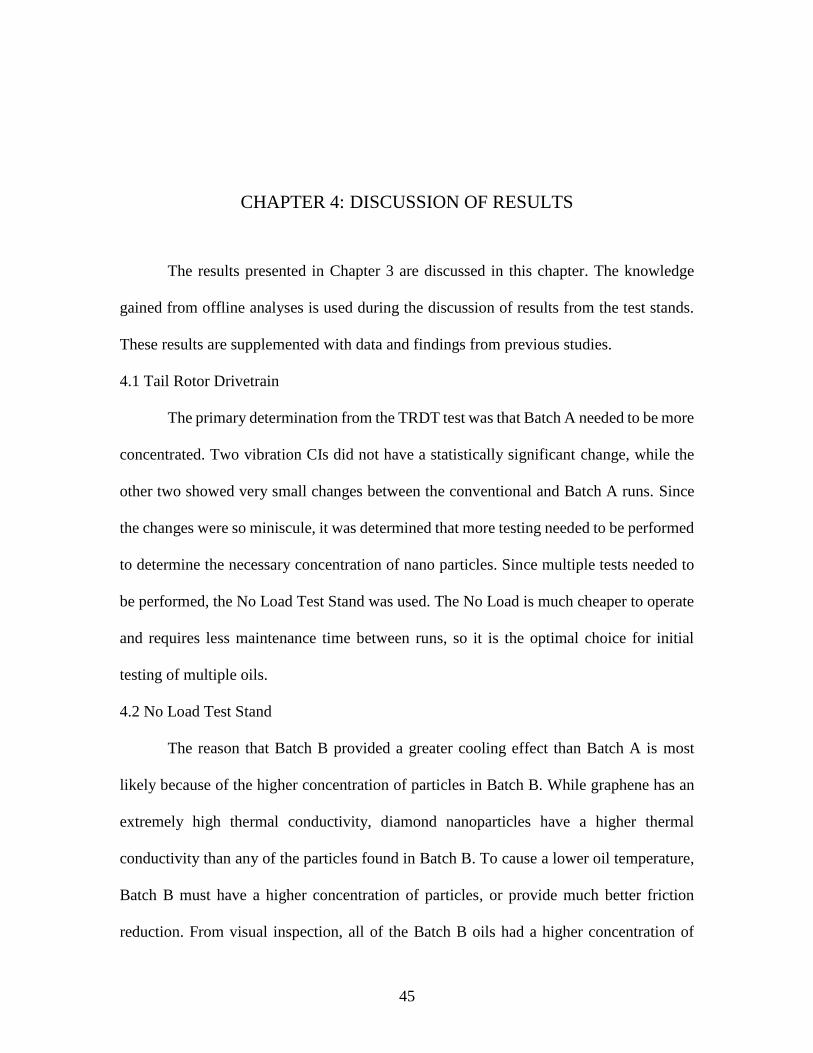
CHAPTER 4: DISCUSSION OF RESULTS
The results presented in Chapter 3 are discussed in this chapter. The knowledge
gained from offline analyses is used during the discussion of results from the test stands.
These results are supplemented with data and findings from previous studies.
4.1 Tail Rotor Drivetrain
The primary determination from the TRDT test was that Batch A needed to be more
concentrated. Two vibration CIs did not have a statistically significant change, while the
other two showed very small changes between the conventional and Batch A runs. Since
the changes were so miniscule, it was determined that more testing needed to be performed
to determine the necessary concentration of nano particles. Since multiple tests needed to
be performed, the No Load Test Stand was used. The No Load is much cheaper to operate
and requires less maintenance time between runs, so it is the optimal choice for initial
testing of multiple oils.
4.2 No Load Test Stand
The reason that Batch B provided a greater cooling effect than Batch A is most
likely because of the higher concentration of particles in Batch B. While graphene has an
extremely high thermal conductivity, diamond nanoparticles have a higher thermal
conductivity than any of the particles found in Batch B. To cause a lower oil temperature,
Batch B must have a higher concentration of particles, or provide much better friction
reduction. From visual inspection, all of the Batch B oils had a higher concentration of
46
particles than Batch A. This would cause an improvement in heat transfer performance
because all of the nanoparticles, especially diamond and graphene, have a much higher
thermal conductivity than just the base oil.
Since Batch B.3 has the highest concentration of particles, it makes sense for it to
provide the most heat transfer from the output side of the gearbox. The data, along with
visual inspection of the oil, also suggests that this high concentration results in the oil being
too thick to reliably flow through the input side of the gearbox. This may have increased
friction, which caused the Input Duplex Bearing to increase in temperature. Batch B.2
resulted in lower temperatures than the Conventional oil at every thermocouple, but seemed
to follow the same trend that is evident with Batch B.3. The IDB thermocouple measured
the smallest temperature difference, while the thermocouples on the output side measured
a larger temperature difference when compared to the conventional oil. Batch B.1 had the
lowest nanoparticle concentration out of the Batch B oils and the data suggests that it causes
the most uniform heat transfer. This is most likely due to the fact that the less viscous oil
could flow throughout the gearbox with less resistance than the more concentrated Batch
B oils.
These results agree with what was found by Gouda and Nasiri-Khuzani et al. The
viscosities of the nano oils were higher than that of the base oil. The nano oils provided
better friction reduction and heat transfer than the base oil. Like Gouda’s tests, it was
determined that at a certain point, excess particles can reduce performance. Batch A results
can be compared to findings of Nasiri-Khuzani et al., because nanodiamond particles were
used for both studies. Batch A did provide better heat transfer and lubrication performance
than conventional oil, so this study helps to confirm the findings from the research
47
performed in tractor engines. The data cannot be directly compared to APU performance,
however, because of the physical differences between a jet engine and a four stroke engine.
4.3 Auxiliary Power Unit
The main goal of this research is to determine if there are any benefits when using
nano oils instead of Aeroshell 560 in the APU. The results show that there is an increase
in efficiency for Batch A and Batch B. Batch A reduced the peak vibration by 35% and the
RMS by 22%. The use of Batch B resulted in a 44% reduction in peak vibration and a 26%
reduction in the RMS. This suggests that friction was reduced by a substantial amount.
Vibration can result from contact of surface asperities during mixed-boundary lubrication
and can be greatly reduced when an elastohydrodynamic regime occurs. This type of
lubrication involves a compressible layer of oil that provides complete separation of the
two surfaces. Oil with a higher viscosity usually results in a thicker boundary layer between
surfaces. While this reduces friction between components, drag forces in the oil increase.
The ideal lubricant should have the minimum viscosity required to provide an
elastohydrodynamic regime throughout all operating conditions. The results suggest that
both nano oils improve the fluid film, resulting in decreased vibration and increased
efficiency.
The increase in temperature for Batch B oil is an unexpected outcome and requires
additional testing to completely determine the cause. Increased friction usually causes
increased vibration and heat. Batch B most likely reduced overall friction, because of the
heat reduction in the IGB, the efficiency improvement in the APU, the vibration reduction
in the APU, and the small engine results. This suggests that the higher APU oil temperature
48
was caused by another factor. There are several possible causes for the temperature
increase. These include increased heat transfer from the combustor, a friction increase in
only certain components, internal oil friction from nano particles of different densities and
configurations, or decreased oil flow due to the clogged filter.
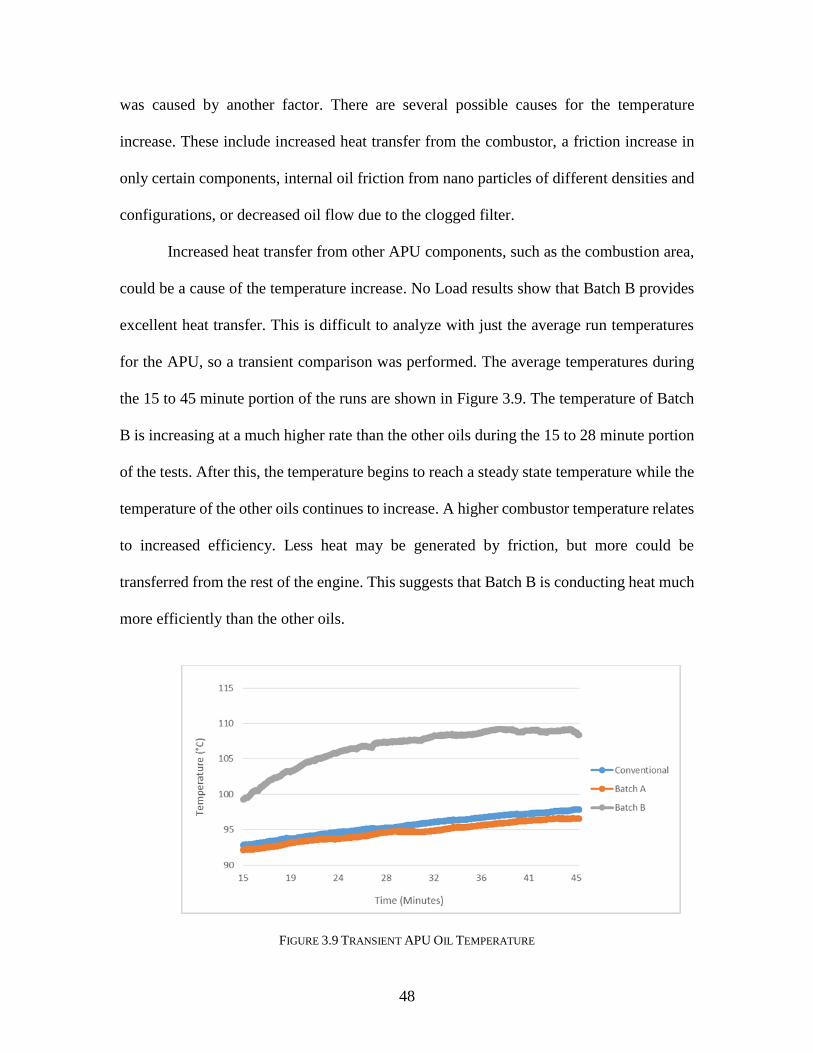
Increased heat transfer from other APU components, such as the combustion area,
could be a cause of the temperature increase. No Load results show that Batch B provides
excellent heat transfer. This is difficult to analyze with just the average run temperatures
for the APU, so a transient comparison was performed. The average temperatures during
the 15 to 45 minute portion of the runs are shown in Figure 3.9. The temperature of Batch
B is increasing at a much higher rate than the other oils during the 15 to 28 minute portion
of the tests. After this, the temperature begins to reach a steady state temperature while the
temperature of the other oils continues to increase. A higher combustor temperature relates
to increased efficiency. Less heat may be generated by friction, but more could be
transferred from the rest of the engine. This suggests that Batch B is conducting heat much
more efficiently than the other oils.
FIGURE 3.9 TRANSIENT APU OIL TEMPERATURE

49
The runs were not performed until steady state temperatures were reached for
multiple reasons. The APU on an UH-60 usually runs for less than 30 minutes before
takeoff. Analyzing steady-state data would not provide useful information for realistic
scenarios. In addition to this, steady-state testing would require much longer runs and larger
quantities of jet fuel. Figure 3.9 suggests that Batch B may lower friction, but also have a
lower specific heat which causes its temperature to rise at a faster rate. The combustor may
also be operating at a higher temperature because of reduced friction. The oil could get
hotter due to this increase in temperature.
An increase in bearing friction along with a decrease in gear friction could also be
a cause for the increased temperature. The study performed by Fernandes examined the
effects of viscosity on gears and bearings. This showed that higher viscosity oils improved
the efficiency of gears, while reducing the efficiency of bearings[5]. This is further
confirmed by the fact that oils designed for only gear lubrication, such as AGL, have a
much higher viscosity than turbine oils. Since Batch B has a higher viscosity than
conventional oil, it may improve efficiency in the gear train. The efficiency of the bearings
may be reduced because of drag forces associated with the more viscous lubricant. This
could result in more heat generation.
There is little literature concerning the third possible cause for the higher oil
temperature occuring with increased efficiency. Ruyek et al. consider nanoparticle size and
mass while deterimining the drag forces, but didn’t consider the effects of different
particles flowing through the oil simultaneously. It was discovered that mass and volume
affect the drag forces and that the forces are anisotropic[13]. Zinc sulfide, boron nitride,

50
and graphene have very different densities and shapes. The drag forces on each type of
particle could vary by a large amount. The linear and centrifugal forces would not cause
identical acceleration for different particle types. These particles may reduce friction
between contacting surfaces, but could cause more friction within the fluid from the
collision of nanoparticles.
The final theory provides the most likely cause of increased temperature for Batch
B oil. The nano particle aggregations were measured with the optical microscope and found
to be larger than 40 microns. The APU has an oil filter with 10 micron pores, so the clumps
are caught in the filter. This is evident in Figure 3.10. The filter was changed between each
type of oil. It begins to clog as it collects these particles, which results in a decrease in oil
flow. If the flow rate of the oil is decreased, the heat from combustion would transfer out
of the oil sump at a slower rate. This could cause Batch B to reach a higher temperature
even though it has a higher thermal conductivity.
FIGURE 3.10 OIL FILTER BEFORE AND AFTER TESTING

51
The results show that there are promising benefits of using Batch A or Batch B oil
instead of Aeroshell 560 in the APU. The nano oils need additional refinement before being
considered ideal, but already provide some benefits. The clumping problems must be
addressed before it could be considered for use in auxiliary power units during flight and
the concentrations could be adjusted to provide optimal thermal conductivity and viscosity.
Both oils provide overall efficiency improvements. While the reduction in fuel
consumption is fairly small, it could provide a large cost savings when considered across
an entire fleet of helicopters. Increasing the life of components by reducing wear could
provide additional cost savings. If the oil filter clogging issue can be solved, switching to
Batch B oil can improve APU performance.
4.4 Small Engine Test Stand
The efficiency and temperature improvements when using turbine oil instead of
motor oil in the small engine are interesting and warrant further research, but the primary
purpose of this study is to determine the effects of nanoparticle additives in base oils. The
AeroShell and Penzoil comparison will be briefly discussed, but this section will primarily
focus on the nano additive results.
One explanation for the increased efficiency and increased vibration is that there
are multiple types of friction in a 4 stroke engine and the less viscous turbine oil may
improve some types while making others worse. For instance, turbine oil may be viscous
enough to maintain an elastohydrodynamic boundary layer between the piston and cylinder
wall because the normal force acting on the cylinder wall by the motion of the piston is
fairly small for a 5.5 hp engine and the force is primarily in the perpendicular direction.

52
The turbine oil may not provide sufficient lubrication for other components, such as
between gear teeth and between the cams and valve stems. This could result in increased
vibration and wear.
Based on the efficiency, temperature, and vibration results, Batch B.1 performed
the best in the small engine. Efficiency improved by 0.6% over turbine oil and by 1.14%
when compared to Pennzoil. Eventhough Batch B.1 increased APU oil temperature, it
lowered the operating temperature of the oil in the small engine. It is worth noting that the
small engine does not have an oil filter. This provides further evidence that it is more
efficient at transferring heat and reducing friction than the conventional oil and that the
APU temperature increase was caused by decreased oil flow because of the filter becoming
clogged. The increase in efficiency and the large reduction in vibration suggest that Batch
B.1 reduces friction throughout the small engine.
Batch A.2 and the Pennzoil with nanodiamond additives experienced similar results
during small engine testing. Both decreased engine efficiency, decreased oil temperature,
and had a small or negligible effect on vibration. The decrease in efficiency could be a
result of the hard nano diamond particles being used in an application where a full boundary
layer is already formed by just the base oil. These hard particles could cause scuffing on
surfaces such as the piston or cylinder walls and a more significant increase in vibration
would be noticable with extended testing. The nanodiamonds have a much higher thermal
conductivity than the base oils, so any temperature increase due to friction could be
negligible because of the increase in heat tranfer.
53
CHAPTER 5: CONCLUSION
This research compares two different types of nano oils and analyzes results from
multiple tests to determine any benefits associated with using these oils as replacements
for the conventional Aeroshell 560 turbine oil. This is performed by collecting fuel
efficiency, temperature, and vibration data from the TRDT, No Load Test stand, APU Test
Stand, and the Small Engine Test stand. Viscosity and particle size measurements are also
collected and utilized while comparing the oils.
Batch A consists of nanodiamond particles suspended in Aeroshell 560 oil. The use
of this oil resulted in a lower oil temperature during testing on the No Load Test Stand, but
did not significantly affect oil temperature in the APU. It provided some improvement to
fuel efficiency in the APU while greatly reducing vibration. These results suggest that
Batch A does provide some benefits over the conventional oil.
Batch B contains zinc sulfide, boron nitride, and graphene nano particles. It caused
the No Load Test Stand to operate at a much lower temperature than Batch A or
conventional oil, but it resulted in a much higher oil temperature in the APU. While
temperature greatly increased, vibration was substantially reduced. The use of Batch B in
the APU and small engine resulted in the highest fuel efficiency for both tests. Because of
54
the increase in fuel efficiency and vibration reduction, the increased temperature is most
likely not caused by an increase in friction. There are several explanations for this
occurrence, but clogging of the oil filter is the most probable cause.
Both nano oils provide thermal and lubricating enhancements for the APU and IGB.
Even though the current versions of the oils do not provide an exceptionally large increase
in fuel efficiency, the results are promising and even a slight increase can provide
substantial fuel cost savings if the oils are considered for fleet wide use in the APU and
additional UH-60 components. The reduction in vibration can reduce component failures,
which could reduce maintenance requirements and result in additional cost savings. The
only concern with these oils comes from the images of large particle clumps and the large
particle deposits on the APU oil filter. There is a possibility that clogging the filter could
result in the APU overheating and automatically shutting down. In conclusion, both oils
provide some benefits over conventional oil when used in the APU, but should be further
optimized to improve nanoparticle suspension in the oil and to prevent particles from
forming into large aggregates.
There are several future studies that could be performed to further this research.
Some of these studies would expand upon the results of this research, while others can
provide valuable information about additional UH-60 and AH-64 components and testing
methods. These include: Batch B particle refinement then further testing to monitor oil
filter clogging, a cost benefit analysis, tests to a CI change-out effects study, additional
TRDT testing, modeling of the APU, and testing of additional concentrations and types of
nano oils.

55
The clogging issue must be fixed before Batch B can be considered for use in an
actual aircraft. Further testing, consisting of longer runs, should be performed with a
refined Batch B oil to monitor this. A cost benefit analysis would provide a better
understanding of the benefits associated with using these oils and would help to determine
if the fuel efficiency increase would provide cost savings after considering the costs
associated with adding nanoparticles to the conventional oil. During the TRDT portion of
this research, it was determined that removing and reinstalling the IGB can result in large
variations in temperature and CIs. Future work can be performed to further determine the
effects of these change-outs and discover additional methods for avoiding variations in the
results. In addition to this, further testing of Batch A and Batch B oils could be performed
in the TRDT. This would provide additional data about the thermal and friction reducing
properties of the oils. Additional research and APU testing could provide the opportunity
to develop a computational model of the APU. Utilizing additional thermocouples and
accelerometers while gathering data for various concentrations of oils, could provide
enough information to create a model capable of predicting efficiency, temperature, and
vibration results.

56
REFERENCES
[1] Lee, Chang-Gun, Yu-Jin Hwang, Young-Min Choi, Jae-Keun Lee, Cheol Choi, and Je-
Myung Oh. "A Study on the Tribological Characteristics of Graphite Nano
Lubricants." International Journal of Precision Engineering and Manufacturing Int. J.
Precis. Eng. Manuf. 10.1 (2009): 85-90. Web.
[2] Hadi, Nazir Jawad, and Dhey Jawad Mohamed. The Effect of Nanoparticles on the Flow
and Physical Behavior of Engine Lubricant Oil. Thesis. Collage of Materials
Engineering /Polymer and Petrochemical Industry Department Babylon
University/Iraq
[3] Gouda, Kareem. "Application of Lubricants in the Ah-64d Helicopter Gearboxes for
Improvement of Condition-based Maintenance Practices." Thesis. University of South
Carolina, 2015.
[4] Nasiri-Khuzani, Asoodar, Rahnama, and Rahnama. "Evaluation of Engine Parts Wear
Using Nano Lubrication Oil in Agricultural Tractors Nano Lubrication." Global
Journal of Science Frontier Research Agriculture and Veterinary Sciences 1st ser. 12.8
(2012)
[5] FERNANDES, CARLOS MIGUEL DA COSTA GOMES. POWER LOSS IN ROLLING
BEARINGS AND GEARS LUBRICATED WITH WIND TURBINE GEAR OILS.
Thesis. DEPARTAMENTO DE ENGENHARIA MECÂNICA FACULDADE DE
ENGENHARIA UNIVERSIDADE DO PORTO, 2015. Print.
[6] Kakaras, E., A. Doukelis, A. Prelipceanu, and S. Karellas. "Inlet Air Cooling Methods for
Gas Turbine Based Power Plants." J. Eng. Gas Turbines Power Journal of Engineering
for Gas Turbines and Power 128.2 (2006): 312. Web.
[7] Farouk, Naeim, Liu Sheng, and Qaisar Hayat. "Effect of Ambient Temperature on the
Performance of Gas Turbines Power Plant." International Journal of Computer Science
Issues 3rd ser. 10.1 (2013): n. pag. Web.
[8] Sanders, Newell D. Performance Parameters for Jet-Propulsion Engines. Tech. no. 1106.
1946. Print.
[9] "ECFR — Code of Federal Regulations." ECFR — Code of Federal Regulations. U.S.
Government Publishing Office, Web. 09 Mar. 2016.
[10] Wells-Brookfield Cone/Plate. Brookfield, n.d. Web. 22 Mar. 2016.
<http://www.brookfieldengineering.com/products/viscometers/laboratory-wb-
coneplate.asp>.
[11] Edwards, Travis Steven. "METHODS FOR DETERMINING GREASE SERVICE
LEVELS IN AN AH-64D INTERMEDIATE GEARBOX USING ON-BOARD
SENSORS." Thesis. University of South Carolina, 2012.
[12] Antolic, Lance J., and Jeremy S. Branning. Evaluation of Gear Condition Indicator
Performance on Rotorcraft Fleet. Rep. Print.
[13] Rudyak, Belkin, and Tomilina. Force Acting on a Nanoparticle in a Fluid. Rep. N.p.:
Pleiades, 2008. Print
[14] Seireg, Ali. Friction and Lubrication in Mechanical Design. New York: Marcel Dekker,
1998. Print.

57
[15] Gas Turbine Engine Auxiliary Power Unit T-62T-40-1. Tech. no. TM 1-2835-208-23&P.
Print.
[16] Kanniah, Vinod, "0 CHARACTERIZATION" (2012). Theses and Dissertations--
Chemical and Materials Engineering. Paper 8.
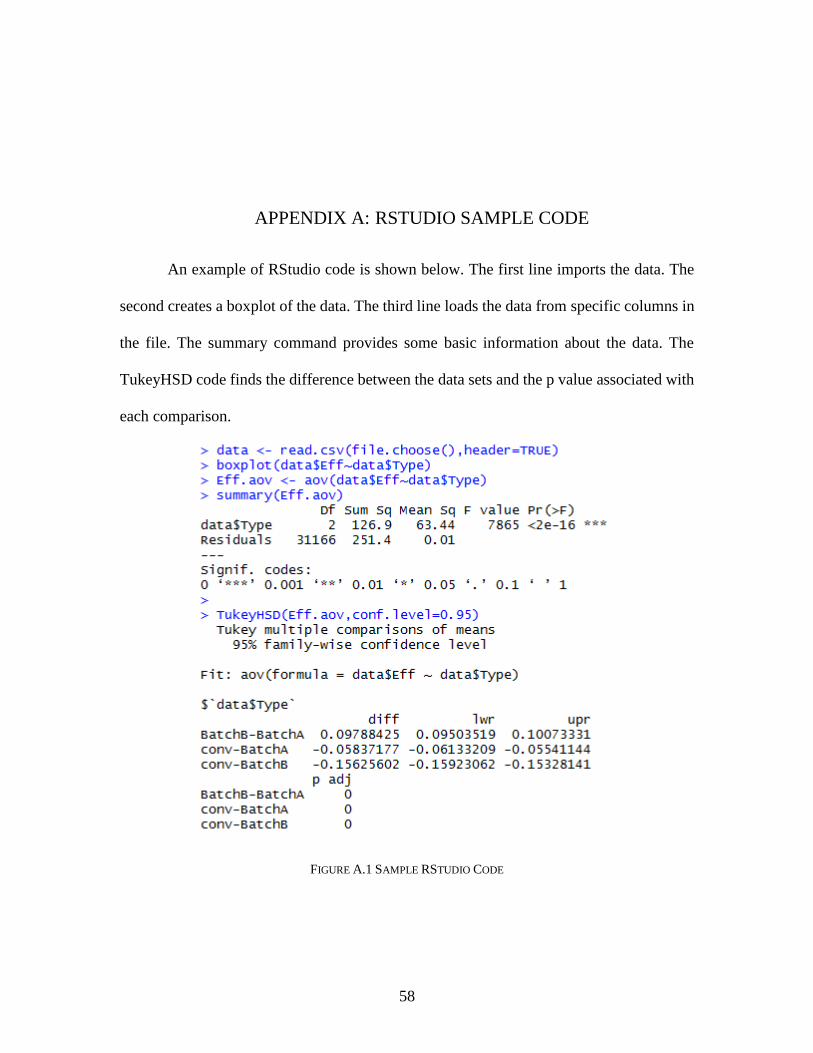
58
APPENDIX A: RSTUDIO SAMPLE CODE
An example of RStudio code is shown below. The first line imports the data. The
second creates a boxplot of the data. The third line loads the data from specific columns in
the file. The summary command provides some basic information about the data. The
TukeyHSD code finds the difference between the data sets and the p value associated with
each comparison.
FIGURE A.1 SAMPLE RSTUDIO CODE

59
APPENDIX B: SAMPLES OF DATA
Excerpts of data for the TRDT, No Load, and APU testing are provided here.
TABLE B.1 SAMPLE OF APU OIL TEMPERATURE DATA
TABLE B.2 SAMPLE OF APU EFFICIENCY DATA
Time(s) Time(min) Oil Temp(°F) Oil Temp(°C) Ambient Temp (°C) Ambient Temp (°F) Corrected Temp(°F)
900 15 153.684431 67.60246167 13.33333333 56 197.684431
900.2 15.00333 153.691388 67.60632667 13.33333333 56 197.691388
900.4 15.00667 153.691388 67.60632667 13.33333333 56 197.691388
900.6 15.01 153.726621 67.62590056 13.33333333 56 197.726621
900.8 15.01333 153.706134 67.61451889 13.33333333 56 197.706134
901 15.01667 153.705795 67.61433056 13.33333333 56 197.705795
901.2 15.02 153.704965 67.61386944 13.33333333 56 197.704965
901.4 15.02333 153.710089 67.61671611 13.33333333 56 197.710089
901.6 15.02667 153.744737 67.635965 13.33333333 56 197.744737
901.8 15.03 153.748972 67.63831778 13.33333333 56 197.748972
902 15.03333 153.733986 67.62999222 13.33333333 56 197.733986
902.2 15.03667 153.747143 67.63730167 13.33333333 56 197.747143
902.4 15.04 153.753061 67.64058944 13.33333333 56 197.753061
902.6 15.04333 153.761569 67.64531611 13.33333333 56 197.761569
902.8 15.04667 153.744522 67.63584556 13.33333333 56 197.744522
Conventional Oil Run 1
Time(S) Time(min)
Fuel
Flow(mL/s) Hp
Brake
(RPM)
Torque
(ft-lb)
Energy
Density (MJ/L) Efficiency A-Temp Humidity A-Temp
Barometric
Pressure
900.0005 15.000008 13.104348 33.65 12023 14.7 35.3 5.424492194 67 68.91 19.44444 30.51
33.64 12023 14.69 67 68.91 19.44444 30.51
33.64 12024 14.69 67 68.91 19.44444 30.51
33.65 12024 14.7 67 68.91 19.44444 30.51
33.69 12024 14.72 67 68.91 19.44444 30.51
33.76 12024 14.75 67 68.91 19.44444 30.51
33.84 12023 14.78 67 68.9 19.44444 30.51
33.9 12022 14.81 67 68.9 19.44444 30.51
33.94 12022 14.83 67 68.9 19.44444 30.51
33.96 12021 14.84 67 68.9 19.44444 30.51
901.0005 15.016676 13.121739 33.95 12021 14.84 5.465599705 67 68.9 19.44444 30.51
33.93 12021 14.82 67 68.9 19.44444 30.51
33.88 12021 14.8 67 68.89 19.44444 30.51
33.83 12021 14.78 67 68.89 19.44444 30.51
33.8 12021 14.77 67 68.89 19.44444 30.51
33.78 12021 14.76 67 68.89 19.44444 30.51
33.77 12021 14.75 67 68.89 19.44444 30.51
33.74 12021 14.74 67 68.89 19.44444 30.51
33.72 12021 14.73 67 68.89 19.44444 30.51
33.69 12022 14.72 67 68.89 19.44444 30.51
902.0006 15.033343 13.156522 33.68 12023 14.71 5.407797544 67 68.89 19.44444 30.51
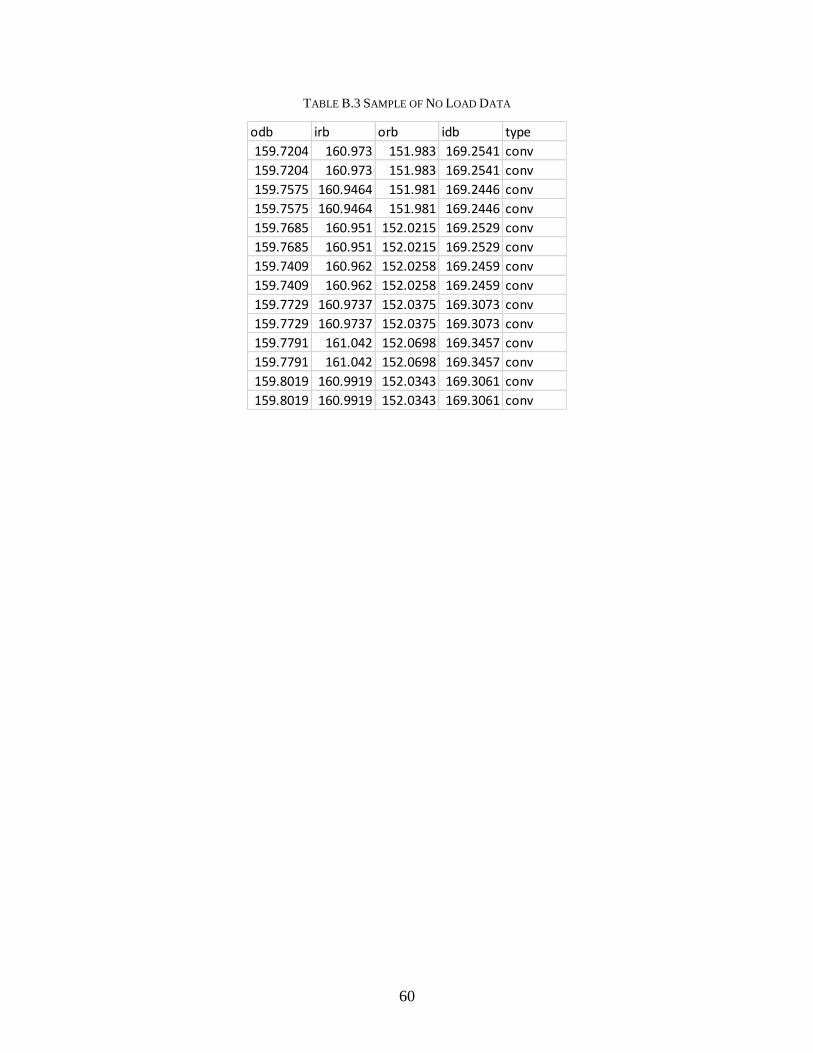
60
TABLE B.3 SAMPLE OF NO LOAD DATA
odb irb orb idb type
159.7204 160.973 151.983 169.2541 conv
159.7204 160.973 151.983 169.2541 conv
159.7575 160.9464 151.981 169.2446 conv
159.7575 160.9464 151.981 169.2446 conv
159.7685 160.951 152.0215 169.2529 conv
159.7685 160.951 152.0215 169.2529 conv
159.7409 160.962 152.0258 169.2459 conv
159.7409 160.962 152.0258 169.2459 conv
159.7729 160.9737 152.0375 169.3073 conv
159.7729 160.9737 152.0375 169.3073 conv
159.7791 161.042 152.0698 169.3457 conv
159.7791 161.042 152.0698 169.3457 conv
159.8019 160.9919 152.0343 169.3061 conv
159.8019 160.9919 152.0343 169.3061 conv

61
TABLE B.4 SAMPLE OF TRDT DATA
Run 1 Temp (° F) Input FM4 Output FM4 Input DA1 Output DA1
Mean 212.5045 3.2262 2.90015 7.3087 7.17975
Standard Deviation 1.529514801 0.313698078 0.109835415 0.167423227 0.176049298
Variance 2.339415526 0.098406484 0.012063818 0.028030537 0.030993355
Margin of Error 1.123310441 0.047251559 0.005792649 0.013459342 0.01488199
% Error 0.528605484 1.464619651 0.199736189 0.184155082 0.20727728
Run 2 Temp (° F) Input FM4 Output FM4 Input DA1 Output DA1
Mean 211.6857 3.2304 2.9323 7.37065 7.2194
Standard Deviation 2.345027283 0.231203123 0.148893498 0.243208439 0.201860139
Variance 5.499152958 0.053454884 0.022169274 0.059150345 0.040747516
Margin of Error 2.640512499 0.025667278 0.010644957 0.028402051 0.019565618
% Error 1.247374054 0.794554185 0.363024129 0.385339846 0.271014458
Run 3 Temp (° F) Input FM4 Output FM4 Input DA1 Output DA1
Mean 210.7535 3.3646 2.88655 7.305 7.12655
Standard Deviation 3.304377121 0.287054992 0.177119786 0.13681605 0.126653475
Variance 10.91890816 0.082400568 0.031371418 0.018718632 0.016041103
Margin of Error 5.242900804 0.039566045 0.015063524 0.008988072 0.00770241
% Error 2.48769335 1.175950916 0.521852176 0.123039995 0.108080491
Run 4 Temp (° F) Input FM4 Output FM4 Input DA1 Output DA1
Mean 209.868 3.57665 2.9123 6.7788 6.5809
Standard Deviation 3.159036495 0.240913672 0.133428909 0.255468939 0.235765919
Variance 9.979511579 0.058039397 0.017803274 0.065264379 0.055585568
Margin of Error 4.791833444 0.027868611 0.008548547 0.03133781 0.026690363
% Error 2.283260642 0.779181942 0.293532495 0.462291403 0.405573142
Run 5 Temp (° F) Input FM4 Output FM4 Input DA1 Output DA1
Mean 212.1305 3.33245 2.95665 6.70145 6.48795
Standard Deviation 2.445585658 0.368687498 0.159587387 0.203540886 0.201806962
Variance 5.980889211 0.135930471 0.025468134 0.041428892 0.04072605
Margin of Error 2.871826413 0.065269344 0.012228961 0.019892792 0.019555311
% Error 1.353801746 1.958599358 0.413608677 0.296843105 0.301409699
Conventional

62
TABLE B.5 CONVENTIONAL APU EFFICIENCY DATA
Fuel Flow(mL/s) Hp (Hp) Brake (RPM) Torque (ft-lb) Efficiency
Mean 13.1137 34.0050 12022.3173 14.8556 5.4782
Standard Deviation 0.1105 0.2453 5.9897 0.1124 0.0602
Variance 0.0122 0.0602 35.8760 0.0126 0.0036
n 1800 17991 17991 17991 1800
df 1799 17990 17990 17990 1799
t statistic (df) (95%) 1.96 1.96 1.96 1.96 1.96
Margin of Error 0.0006 0.0009 0.5243 0.0002 0.0002
% Error 0.0043% 0.0026% 0.0044% 0.0012% 0.0031%
Fuel Flow(mL/s) Hp (Hp) Brake (RPM) Torque (ft-lb) Efficiency
Mean 13.1879 33.8065 12024.1884 14.7665 5.4157
Standard Deviation 0.1181 0.1856 3.2003 0.0818 0.0555
Variance 0.0140 0.0345 10.2420 0.0067 0.0031
n 1777 17761 17761 17761 1777
df 1776 17760 17760 17760 1776
t statistic (df) (95%) 1.96 1.96 1.96 1.96 2.96
Margin of Error 0.0006 0.0005 0.1506 0.0001 0.0002
% Error 0.0049% 0.0015% 0.0013% 0.0007% 0.0040%
Fuel Flow(mL/s) Hp (Hp) Brake (RPM) Torque (ft-lb) Efficiency
Mean 12.8992 34.0443 12009.5384 14.8886 5.5758
Standard Deviation 0.1269 0.1998 6.1996 0.0924 0.0625
Variance 0.0161 0.0399 38.4349 0.0085 0.0039
n 1800 18000 18000 18000 1800
df 1799 17999 17999 17999 1799
t statistic (df) (95%) 1.96 1.96 1.96 1.96 2.96
Margin of Error 0.0007 0.0006 0.5615 0.0001 0.0003
% Error 0.0058% 0.0017% 0.0047% 0.0008% 0.0049%
Fuel Flow(mL/s) Hp (Hp) Brake (RPM) Torque (ft-lb) Efficiency
Mean 12.7359 33.5821 11998.1394 14.7004 5.5707
Standard Deviation 0.1397 0.2301 6.3737 0.1041 0.0653
Variance 0.0195 0.0530 40.6240 0.0108 0.0043
n 1800 18001 18001 18001 1800
df 1799 18000 18000 18000 1799
t statistic (df) (95%) 7.96 1.96 1.96 1.96 2.96
Margin of Error 0.0037 0.0008 0.5935 0.0002 0.0003
% Error 0.0288% 0.0023% 0.0049% 0.0011% 0.0053%
Run 3
Run 4
Run 2
Run 1
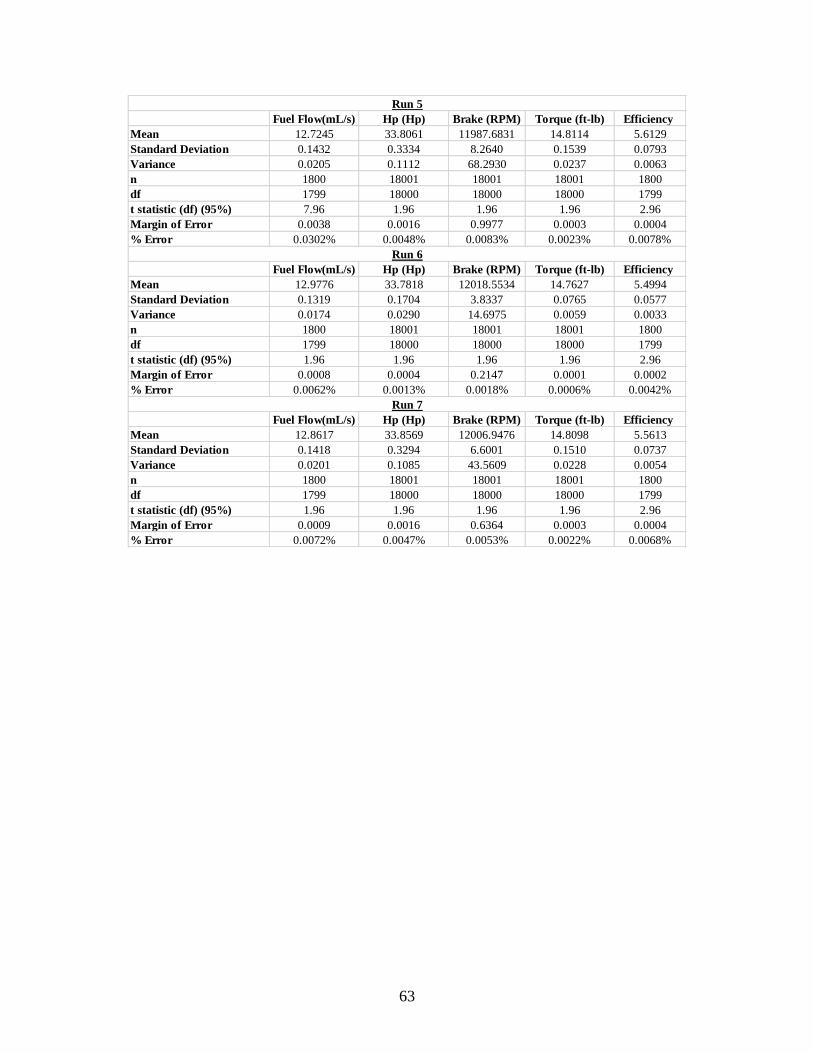
63
Fuel Flow(mL/s) Hp (Hp) Brake (RPM) Torque (ft-lb) Efficiency
Mean 12.7245 33.8061 11987.6831 14.8114 5.6129
Standard Deviation 0.1432 0.3334 8.2640 0.1539 0.0793
Variance 0.0205 0.1112 68.2930 0.0237 0.0063
n 1800 18001 18001 18001 1800
df 1799 18000 18000 18000 1799
t statistic (df) (95%) 7.96 1.96 1.96 1.96 2.96
Margin of Error 0.0038 0.0016 0.9977 0.0003 0.0004
% Error 0.0302% 0.0048% 0.0083% 0.0023% 0.0078%
Fuel Flow(mL/s) Hp (Hp) Brake (RPM) Torque (ft-lb) Efficiency
Mean 12.9776 33.7818 12018.5534 14.7627 5.4994
Standard Deviation 0.1319 0.1704 3.8337 0.0765 0.0577
Variance 0.0174 0.0290 14.6975 0.0059 0.0033
n 1800 18001 18001 18001 1800
df 1799 18000 18000 18000 1799
t statistic (df) (95%) 1.96 1.96 1.96 1.96 2.96
Margin of Error 0.0008 0.0004 0.2147 0.0001 0.0002
% Error 0.0062% 0.0013% 0.0018% 0.0006% 0.0042%
Fuel Flow(mL/s) Hp (Hp) Brake (RPM) Torque (ft-lb) Efficiency
Mean 12.8617 33.8569 12006.9476 14.8098 5.5613
Standard Deviation 0.1418 0.3294 6.6001 0.1510 0.0737
Variance 0.0201 0.1085 43.5609 0.0228 0.0054
n 1800 18001 18001 18001 1800
df 1799 18000 18000 18000 1799
t statistic (df) (95%) 1.96 1.96 1.96 1.96 2.96
Margin of Error 0.0009 0.0016 0.6364 0.0003 0.0004
% Error 0.0072% 0.0047% 0.0053% 0.0022% 0.0068%
Run 6
Run 7
Run 5

64
TABLE B.6 BATCH A APU DATA
Fuel Flow(mL/s) Hp (Hp) Brake (RPM) Torque (ft-lb) Efficiency
Mean 12.7989 33.8904 11997.5960 14.8360 5.5941
Standard Deviation 0.1362 0.2042 5.5552 0.0940 0.0678
Variance 0.0185 0.0417 30.8606 0.0088 0.0046
n 1800 18001 18001 18001 1800
df 1799 18000 18000 18000 1799
t statistic (df) (95%) 1.96 1.96 1.96 1.96 1.96
Margin of Error 0.0009 0.0006 0.4508 0.0001 0.0002
% Error 0.0067% 0.0018% 0.0038% 0.0009% 0.0038%
Fuel Flow(mL/s) Hp (Hp) Brake (RPM) Torque (ft-lb) Efficiency
Mean 12.9734 33.7006 12017.1163 14.7289 5.4876
Standard Deviation 0.0439 0.2561 5.6623 0.1165 0.0415
Variance 0.0019 0.0656 32.0612 0.0136 0.0017
n 1800 18001 18001 18001 1800
df 1799 18000 18000 18000 1799
t statistic (df) (95%) 1.96 1.96 1.96 1.96 1.96
Margin of Error 0.0001 0.0010 0.4684 0.0002 0.0001
% Error 0.0007% 0.0028% 0.0039% 0.0013% 0.0015%
Fuel Flow(mL/s) Hp (Hp) Brake (RPM) Torque (ft-lb) Efficiency
Mean 12.7755 33.8669 12004.9126 14.8168 5.6001
Standard Deviation 0.0486 0.2830 7.4557 0.1312 0.0472
Variance 0.0024 0.0801 55.5876 0.0172 0.0022
n 1800 18001 18001 18001 1800
df 1799 18000 18000 18000 1799
t statistic (df) (95%) 1.96 1.96 1.96 1.96 1.96
Margin of Error 0.0001 0.0012 0.8121 0.0003 0.0001
% Error 0.0009% 0.0035% 0.0068% 0.0017% 0.0018%
Fuel Flow(mL/s) Hp (Hp) Brake (RPM) Torque (ft-lb) Efficiency
Mean 12.5847 33.8699 11985.6532 14.8418 5.6856
Standard Deviation 0.0742 0.1793 6.2165 0.0842 0.0479
Variance 0.0055 0.0322 38.6445 0.0071 0.0023
n 1795 17941 17941 17941 1795
df 1794 17940 17940 17940 1794
t statistic (df) (95%) 1.96 1.96 1.96 1.96 1.96
Margin of Error 0.0003 0.0005 0.5655 0.0001 0.0001
% Error 0.0020% 0.0014% 0.0047% 0.0007% 0.0019%
Batch A Run 4
Batch A Run 1
Batch A Run 2
Batch A Run 3
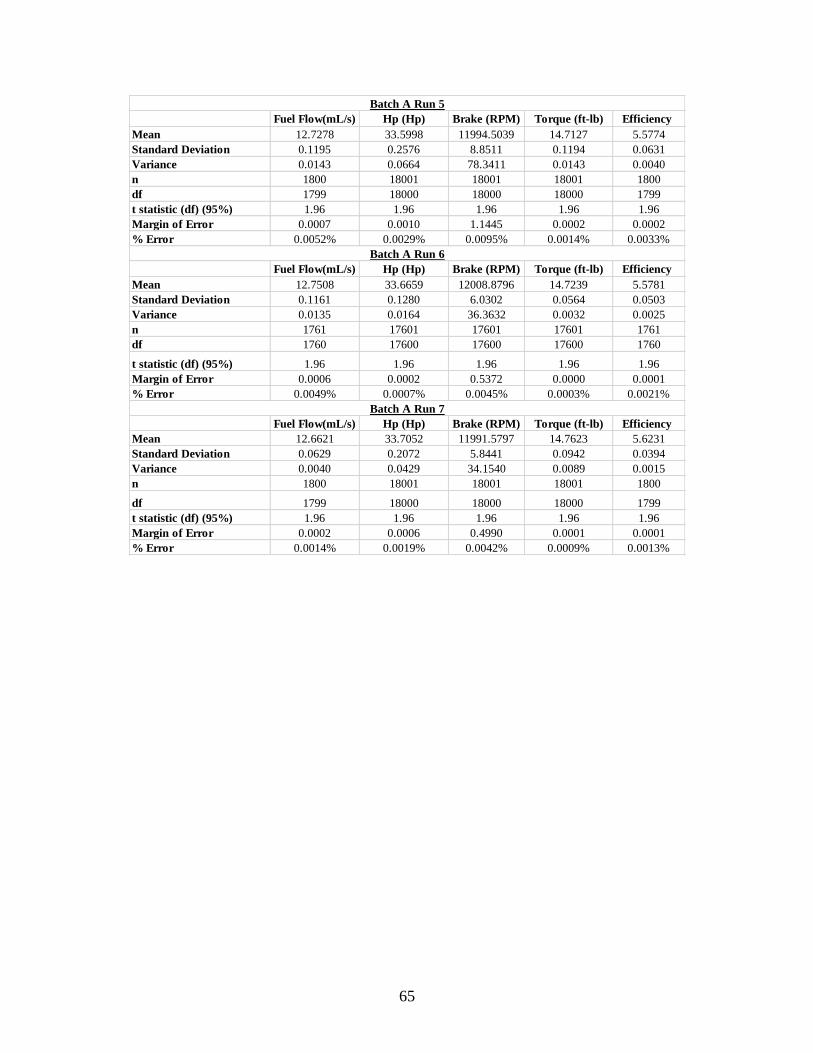
65
Fuel Flow(mL/s) Hp (Hp) Brake (RPM) Torque (ft-lb) Efficiency
Mean 12.7278 33.5998 11994.5039 14.7127 5.5774
Standard Deviation 0.1195 0.2576 8.8511 0.1194 0.0631
Variance 0.0143 0.0664 78.3411 0.0143 0.0040
n 1800 18001 18001 18001 1800
df 1799 18000 18000 18000 1799
t statistic (df) (95%) 1.96 1.96 1.96 1.96 1.96
Margin of Error 0.0007 0.0010 1.1445 0.0002 0.0002
% Error 0.0052% 0.0029% 0.0095% 0.0014% 0.0033%
Fuel Flow(mL/s) Hp (Hp) Brake (RPM) Torque (ft-lb) Efficiency
Mean 12.7508 33.6659 12008.8796 14.7239 5.5781
Standard Deviation 0.1161 0.1280 6.0302 0.0564 0.0503
Variance 0.0135 0.0164 36.3632 0.0032 0.0025
n 1761 17601 17601 17601 1761
df 1760 17600 17600 17600 1760
t statistic (df) (95%) 1.96 1.96 1.96 1.96 1.96
Margin of Error 0.0006 0.0002 0.5372 0.0000 0.0001
% Error 0.0049% 0.0007% 0.0045% 0.0003% 0.0021%
Fuel Flow(mL/s) Hp (Hp) Brake (RPM) Torque (ft-lb) Efficiency
Mean 12.6621 33.7052 11991.5797 14.7623 5.6231
Standard Deviation 0.0629 0.2072 5.8441 0.0942 0.0394
Variance 0.0040 0.0429 34.1540 0.0089 0.0015
n 1800 18001 18001 18001 1800
df 1799 18000 18000 18000 1799
t statistic (df) (95%) 1.96 1.96 1.96 1.96 1.96
Margin of Error 0.0002 0.0006 0.4990 0.0001 0.0001
% Error 0.0014% 0.0019% 0.0042% 0.0009% 0.0013%
Batch A Run 5
Batch A Run 6
Batch A Run 7
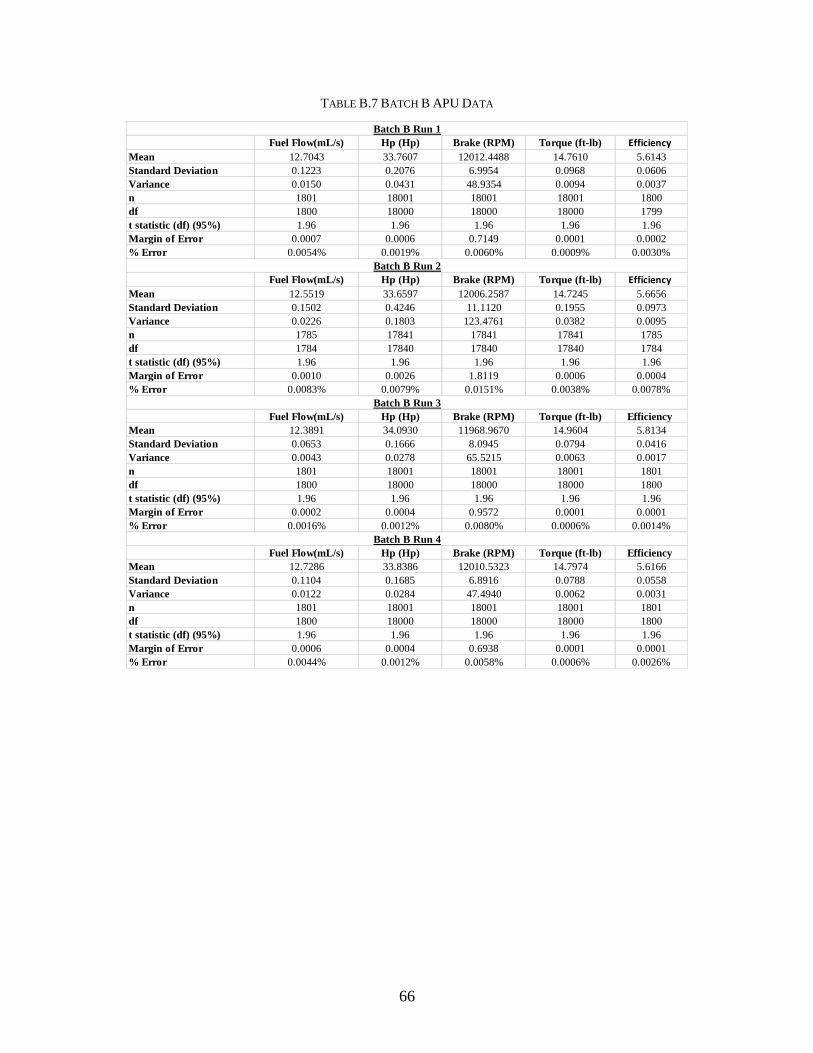
66
TABLE B.7 BATCH B APU DATA
Fuel Flow(mL/s) Hp (Hp) Brake (RPM) Torque (ft-lb) Efficiency
Mean 12.7043 33.7607 12012.4488 14.7610 5.6143
Standard Deviation 0.1223 0.2076 6.9954 0.0968 0.0606
Variance 0.0150 0.0431 48.9354 0.0094 0.0037
n 1801 18001 18001 18001 1800
df 1800 18000 18000 18000 1799
t statistic (df) (95%) 1.96 1.96 1.96 1.96 1.96
Margin of Error 0.0007 0.0006 0.7149 0.0001 0.0002
% Error 0.0054% 0.0019% 0.0060% 0.0009% 0.0030%
Fuel Flow(mL/s) Hp (Hp) Brake (RPM) Torque (ft-lb) Efficiency
Mean 12.5519 33.6597 12006.2587 14.7245 5.6656
Standard Deviation 0.1502 0.4246 11.1120 0.1955 0.0973
Variance 0.0226 0.1803 123.4761 0.0382 0.0095
n 1785 17841 17841 17841 1785
df 1784 17840 17840 17840 1784
t statistic (df) (95%) 1.96 1.96 1.96 1.96 1.96
Margin of Error 0.0010 0.0026 1.8119 0.0006 0.0004
% Error 0.0083% 0.0079% 0.0151% 0.0038% 0.0078%
Fuel Flow(mL/s) Hp (Hp) Brake (RPM) Torque (ft-lb) Efficiency
Mean 12.3891 34.0930 11968.9670 14.9604 5.8134
Standard Deviation 0.0653 0.1666 8.0945 0.0794 0.0416
Variance 0.0043 0.0278 65.5215 0.0063 0.0017
n 1801 18001 18001 18001 1801
df 1800 18000 18000 18000 1800
t statistic (df) (95%) 1.96 1.96 1.96 1.96 1.96
Margin of Error 0.0002 0.0004 0.9572 0.0001 0.0001
% Error 0.0016% 0.0012% 0.0080% 0.0006% 0.0014%
Fuel Flow(mL/s) Hp (Hp) Brake (RPM) Torque (ft-lb) Efficiency
Mean 12.7286 33.8386 12010.5323 14.7974 5.6166
Standard Deviation 0.1104 0.1685 6.8916 0.0788 0.0558
Variance 0.0122 0.0284 47.4940 0.0062 0.0031
n 1801 18001 18001 18001 1801
df 1800 18000 18000 18000 1800
t statistic (df) (95%) 1.96 1.96 1.96 1.96 1.96
Margin of Error 0.0006 0.0004 0.6938 0.0001 0.0001
% Error 0.0044% 0.0012% 0.0058% 0.0006% 0.0026%
Batch B Run 1
Batch B Run 2
Batch B Run 3
Batch B Run 4

67
Fuel Flow(mL/s) Hp (Hp) Brake (RPM) Torque (ft-lb) Efficiency
Mean 12.4767 33.6261 11989.5893 14.7302 5.6934
Standard Deviation 0.0595 0.3245 10.0074 0.1500 0.0547
Variance 0.0035 0.1053 100.1490 0.0225 0.0030
n 1801 18001 18001 18001 1801
df 1800 18000 18000 18000 1800
t statistic (df) (95%) 1.96 1.96 1.96 1.96 1.96
Margin of Error 0.0002 0.0015 1.4631 0.0003 0.0001
% Error 0.0013% 0.0046% 0.0122% 0.0022% 0.0024%
Fuel Flow(mL/s) Hp (Hp) Brake (RPM) Torque (ft-lb) Efficiency
Mean 12.2860 33.6795 11970.9832 14.7764 5.7911
Standard Deviation 0.0601 0.0582 9.2657 0.0331 0.0302
Variance 0.0036 0.0034 85.8526 0.0011 0.0009
n 1801 18001 18001 18001 1801
df 1800 18000 18000 18000 1800
t statistic (df) (95%) 1.96 1.96 1.96 1.96 1.96
Margin of Error 0.0002 0.0000 1.2542 0.0000 0.0000
% Error 0.0014% 0.0001% 0.0105% 0.0001% 0.0007%
Fuel Flow(mL/s) Hp (Hp) Brake (RPM) Torque (ft-lb) Efficiency
Mean 12.3508 33.2087 11971.3484 14.5696 5.6799
Standard Deviation 0.1404 0.6488 8.6274 0.2915 0.1005
Variance 0.0197 0.4209 74.4322 0.0850 0.0101
n 1801 18001 18001 18001 1801
df 1800 18000 18000 18000 1800
t statistic (df) (95%) 1.96 1.96 1.96 1.96 1.96
Margin of Error 0.0009 0.0061 1.0874 0.0012 0.0005
% Error 0.0074% 0.0185% 0.0091% 0.0085% 0.0086%
Batch B Run 5
Batch B Run 6
Batch B Run 7

68
APPENDIX C: SENSOR ACCURACY
TABLE C.1 ACCURACY OF SENSORS
Sensor Accuracy
Thermocouples ± 0.4%
Accelerometers ± 5.0%
Fuel Flow Meter ± 0.2%
Water Brake Torque ± 0.5% FS