nano tungsten carbide for remediation … · carbide (wc). the catalyst was prepared via...
TRANSCRIPT

VOT 78088
NANO TUNGSTEN CARBIDE FOR REMEDIATION CHLOROFLOUROCARBON
ABD. RAHIM YACOB
JABATAN KIMIA, FAKULTI SAINS, UNIVERSITI TEKNOLOGI MALAYSIA
2009

ACKNOWLEDGEMENT
I would like to express my sincere gratitude to my respectful supervisors,
Assoc. Prof. Dr. Abdul Rahim Yacob for all his guidance, advice and encouragement.
His kindness and generosity in sharing knowledge and experience is very much
appreciated.
I also would like to thank all the lectures especially to Assoc. Prof. Dr. Asiah
Hussain and Dr. Zaiton Majid and staffs in Chemistry Department, Ibnu Sina Institute
for always been helpful and friendly in helping me to solve my problems through out
the period of my research.
I’m very grateful to the ‘Black Diamond’ research group, Dr. Abdul Rahim
Yacob, Ratna and Asraf for being so cooperative and contribute brilliant ideas in
completing this research successfully. To all my colleagues, thank you so much for all
those times, advices and efforts.
I must express my profound thanks to the Fundamental Research Grant
Scheme (FRGS 78088).and PGD Scholarship.
Last but certainly not least, to my adored family members my dad Mr.
Inderan, my mom Mrs. Diawanai, my sister Puganeswary and my Brothers Kathir and
Vimel. I would like to thank all of you from bottom of my heart for being so
supportive. Not forgotten my dearest friend Anilarasu and my lovely juniors Kavi,
Praveen and Uma Shangkar for the kind motivation whenever I’m down. Thank you
so much.

PREFACE
This thesis is the result of my work carried out in the Department of Chemistry,
Universiti Teknologi Malaysia between December 2005 and December 2007 under
the supervision of Assoc. Prof. Dr. Abdul Rahim Yacob. Part of my work described in
this thesis has been sent for exhibition participations and reported in the following
publications:
1. Abd. Rahim, Y., and Vicin isvarri, I (2007). “Haute Superficie De Carbure De
Tungstene Pourla Remediation De CFC”. Exhibition participation for the
Innova Eureka Exhibition, Silver medal. Brussels, Belgium, 22-25 November
2007.
2. Abd. Rahim, Y. and Vicinisvarri I (2007). “High Surface Area Tungsten
Carbide Catalyst Supported on Activated Carbon for the
Hydrodehalogenation of Chlorofluorocarbon” Exhibition participation for the
PECIPTA 2007. Gold medal award. Kuala Lumpur convention Centre, 10-12
August 2007.
3. Abd. Rahim Y., Zaiton A. M., Asiah H., Ratna Sari Dewi D. and Vicin isvarri
I. “Kernel WC for Rocket Thruster’s Fuel. (2007). Exhibition participation for
the Malaysia Technology Exhibition 2006. Bronze medal award. Putra World
Trade Centre, Kuala Lumpur. 29-31 March 2007.
4. Abd. Rahim Y., Zaiton A. M., Asiah H., Ratna Sari Dewi D. and Vicin isvarri
I. (2006). “BLACK DIAMOND”-NanoTungsten Carbide for Hard Metal
Tools. Exhibition participation for the Malaysia Technology Exhibition 2006.
Bronze medal award. Putra World Trade Centre, Kuala Lumpur. 23-25
February 2006.

5. Vicinisvarri I., Abd. Rahim Y., Asiah H. and Ratna Sari Dewi D. (2006).
Preparation and Characterization of Tungsten Catalyst on Activated Carbon.
Poster presented at the Annual Fundamental Science Seminar 2005. Ibnu Sina
Institute, UTM Skudai, Johor. 6-7 June 2006.
6. Ratna Sari Dewi D, Abd. Rahim Y., Zaiton A. M. and Vicinisvarri I. (2005).
Comparison and Physical Characterization of Various Source of High Surface
Area Carbon Prepared by Different Types of Activation. Poster presented at
the Simposium Kimia Analisis Malaysia 18. Hyatt Regency Hotel, Johor
Bahru. 12-14 September 2005.

ABSTRACT
The importance of activated carbon as adsorbent, catalyst and catalyst support has been increased in industry and environmental applications for its special features; a very high surface area absorbency, inertness, and porosity. The surface structure and porosity of an activated carbon largely depended on the starting materials and the activation method used. In this study, activated carbons were prepared from palm kernel shell by chemical activation using zinc chloride under both nitrogen flow and vacuum condition. The effects of impregnation ratio (ZnCl2 to palm kernel shell) and activation condition on the surface properties of carbons were carefully studied in order to optimize these parameters. All the prepared activated carbons were characterized using FTIR, single point BET surface area, nitrogen adsorption analysis, FESEM-EDX and Thermogravimetry analysis. The selected activated carbons were used as a carbon source as well as catalyst support in the preparation of tungsten carbide (WC). The catalyst was prepared via sublimation technique where the metal precursor tungsten hexacarbonyl and activated carbon were milled together and heat-treated at 700 ºC and 950 ºC in Helium flow. Two sets of WC catalysts with 6 percent and 15 percent tungsten content were prepared. The heat-treated catalysts were characterized by XRD, single point BET surface area and FESEM-EDX. The performance of the optimal prepared WC catalyst was tested on dichlorodifluoromethane, CFC-12 in hydrodehalogenation reaction. The results show that the impregnation ratio and the activation conditions had significant effect on the properties of activated carbon prepared. In this study the activated carbon prepared with ZnCl2 impregnation ratio of 1:1 under nitrogen flow (AC-1Z-N) showed the highest surface area, 878 cm2g-1 with micropore volume around 0.36 cm2g-1. While, the catalyst with 15% tungsten content supported on AC-1Z-N showed the highest formation of tungsten carbide and found to be very active in the hydrodehalogenation reaction of CFC-12.

ABSTRAK
Kepentingan karbon teraktif sebagai bahan penyerap, pemangkin dan penyokong pemangkin semakin meningkat dalam industri kimia disebabkan ciri-ciri unik seperti luas permukaan yang besar, lengai and struktur keliangannya. Struktur permukaan dan sifat keliangan karbon teraktif sangat bergantung kepada bahan pemula dan kaedah pengaktifan. Dalam kajian ini karbon teraktif telah disediakan dengan menggunakan tempurung kelapa sawit melalui kaedah pengaktifan kimia menggunakan zink klorida di bawah aliran gas nitrogen dan keadaan vakum. Kesan nisbah bahan pengaktif ZnCl2 kepada tempurung kelapa sawit telah dikaji untuk membentuk parameter yang optima. Pencirian teliti telah dilakukan menggunakan FTIR, penjerapan titik tunggal BET, analisis penjerapan nitrogen, FESEM-EDX dan TGA. karbon teraktif yang terpilih telah digunakan sebagai sumber karbon dan juga sebagai bahan penyokong kepada mangkin tungsten karbida, WC. Dalam kajian ini mangkin WC telah disediakan melalui teknik pemejalwapan dimana tungsten hexakarbonil dan karbon teraktif digiling dan dipanaskan pada suhu 700 ºC dan 950 ºC dalam aliran gas helium. Dua set sampel WC dengan kandungan tungsten 6% dan 15% telah disediakan. Pencirian pemangkin WC telah dilakukan menggunakan XRD, titik tunggal BET dan FESEM-EDX. Prestasi mangkin telah diuji melalui tindak balas diklorodiflorometana, CFC-12 hydrodehalogenasi. Keputusan pencirian menunjukkan bahawa nisbah ZnCl2 kepada tempurung kelapa sawit dan keadaan pengaktifan memberi kesan yang penting keatas sifat karbon teraktif. Dalam kajian ini karbon teraktif yang telah disediakan dengan nisbah ZnCl2 kepada tempurung kelapa sawit, 1:1 mempunyai luas permukaan yang tinggi iaitu 878 m2g-1 dengan isipadu mikroliang 0.36 m3g-1. Sementara mangkin dengan kandungan 15% tungsten yang disediakan dengan AC-1Z-N menunjukkan pembentukan tungsten karbida yang tertinggi dan didapati sangat aktif dalam tindak balas CFC-12 hidrodehalogenasi.

TABLE OF CONTENTS
CHAPTER TITLE PAGE
DECLARATION ii
DEDICATION iii
ACKNOWLEDGEMENTS iv
PREFACE v
ABSTRACT vi
ABSTRAK vii
TABLE OF CONTENTS viii
LIST OF TABLES xii
LIST OF FIGURES xiv
LIST OF SYMBOLS / ABBREVIATIONS xvii
LIST OF APPENDICES xix
1 INTRODUCTION
1.1 Problem Statement 3
1.2 Objective of the Research 4
1.3 Scope of Studies 4
2 LITERATURE REVIEWS
2.1 Activated Carbon 6
2.1.1 Physical Properties of Activated Carbon 7

2.2 Agricultural Byproduct as Raw Material 8
2.3 Preparation of Activated Aarbon 10
2.3.1 Selecting Raw Material 10
2.3.2 Pre-treatment 12
2.3.3 Carbonization 12
2.3.4 Activation 13
2.3.4.1 Activation with Zinc Chloride 14
2.3.5 Washing 15
2.4 Catalyst Support 15
2.4.1 Activated Carbon as Catalyst Support 18
2.5 Transition metal carbides 19
2.5.1 Tungsten Carbide in Catalytic Usages 21
2.6 Chlorofluorocarbons (CFCs) 22
2.6.1 Remediation and Conversion of CFCs 23
2.6.2 Hydrodehalogenation of CFCs on Tungsten
Carbide 25
2.7 Preparation of Tungsten Carbide 27
2.8 Fourier Transform Infrared (FTIR) 28
2.9. Nitrogen adsorption analysis 29
2.9.1 Adsorption Isotherms 31
2.9.2 Brunauer, Emmett and Teller (BET)
Surface Area 33
2.9.3 The t-plot 34
2.10 Thermogravimetry Analysis (TGA) 35
2.11 Field Emission Scanning Electron Microscopy
(FESEM) and Energy Dispersive X-ray
Spectroscopy (EDX) 36
2.12 X-ray Diffraction (XRD) 37
2.13 Gas Chromatography (GC) 39
3 EXPERIMENTAL
3.1 Instrumentations 41
3.2 Chemicals 43

3.3 Preparation of Activated Carbon 43
3.3.1 Preparation of raw material 43
3.3.2 Chemical activation 44
3.4 Preparation of Tungsten Carbide 46
3.5 Sample Characterization 48
3.5.1 Characterization of activated carbon 48
3.5.2 Characterization of tungsten carbide 49
3.6 Catalytic testing-Hydrodehalogenation of CFC-12 49
4 RESULTS AND DISCUSSION
4.1 General 51
4.2 Characterization of Activated Carbons 51
4.2.1 Fourier Transform Infrared Spectroscopy 52
4.2.2 Nitrogen Adsorption Analysis 56
4.2.2.1 Single Point BET Surface Area 57
4.2.2.2 BDDT Isotherms and Pore Size
Distribution 59
4.2.2.3 The t-plot 65
4.2.3 FESEM analysis of Activated Carbons 67
4.2.4 Energy Dispersive X-ray Analysis 72
4.2.5 Thermogravimetry Analysis 73
4.2.5.1 Thermogravimetry Analysis of
Raw palm Kernel Shell 74
4.2.5.2 Thermogravimetry analysis of
Activated Carbon in Air Flow 75
4.2.5.3 Thermogravimetry Analysis of 78
Activated Carbon in Nitrogen Flow
4.3 Tungsten Carbide Catalyst 80
4.3.1. X-ray diffraction 81
4.3.1.1 XRD analysis of Tungsten Carbide
Catalyst Supported on AC-1Z-N 81
4.3.1.2 XRD analysis of Tungsten Carbide
Catalyst Supported on AC-1Z-V 85

4.3.2 Field Emission Scanning Electron
Microscopy 88
4.3.3 Single point BET Surface Area 91
4.4 Hydrodehalogenation of CFC-12 93
5 CONCLUSIONS 97
REFERENCES 99
APPENDICES 108
LIST OF TABLES

TABLE NO. TITLE PAGE
2.1 Classification of pores of a porous material 8
2.2 Agricultural by-products used to produce activated carbon 9
2.3 Physical and chemical properties of supports 17
2.4 Type of catalyst supports and their applications 18
3.1 Notation for tungsten carbide samples 48
4.1 Sample notation for activated carbons 53
4.2 Vibration wavenumber and functional groups
of the samples 57
4.3 Surface area and pore volume of activated carbon 67
4.4 EDX analysis of activated carbons 74
4.5 Percentage of weight loss of AC-1Z-N and AC-1Z-V
in air flow 78
4.6 Percentage of weight loss of AC-1Z-N and AC-1Z-V
in nitrogen flow 80
4.7 Notation for the samples prepared 82
4.8 Relative intensity of main peaks for AC-1Z-N
supported catalysts 85
4.9 Relative intensity of main peaks for AC-1Z-V
supported catalysts 89
4.10 Single point BET surface area of samples 93


LIST OF FIGURES
FIGURE NO. TITLE
PAGE
2.1 structure of transition metal carbides 20
2.2 The gas sorption process 30
2.3 Types of BDDT physisorption isotherm 32
2.4 X-ray scattered by atoms in an ordered lattice
interfere constructively in direction given by Braggs Law 39
2.5 Diagram of a gas chromatograph 41
3.1 Flow diagram for the preparation of activated carbon 46
3.2 Schematic diagram of vacuum line system 47
3.3 Schematic set-up used for heat-treatment of tungsten
carbide catalyst 49
3.4 Schematic set-up for hydrodehalogenation catalytic reaction 51
4.1 FTIR spectra for raw palm kernel shell, commercial
activated carbon and samples activate in vacuum condition 54
4.2 FTIR spectra for raw pal kernel shell, commercial activated
carbon and amples activate in nitrogen flow 55
4.3 Single point BET surface area of raw-PKS and prepared

activated carbon 58
4.4 BDDT isotherm of AC-1Z-N and AC-1Z-V 61
4.5 Pore size distribution graph of AC-1Z-N 62
4.6 Pore size distribution graph of AC-1Z-V 62
4.7 BDDT isotherm of AC-2Z-N and AC-2Z-V 64
4.8 Pore size distribution of AC-2Z-N 65
4.9 Pore size distribution of AC-2Z-V 65
4.10 Micrograph of raw-PKS with magnification of 500x 69
4.11 Micrograph of AC-1Z-Nwith magnification of 150x 70
4.12 Micrograph of AC-1Z-N with magnification of 7500x 70
4.13 Micrograph of AC-1Z-V with magnification of 150x 71
4.14 Micrograph of AC-1Z-V with magnification of 500x 71
4.15 Micrograph of AC-2Z-N with magnification of 250x 72
4.16 Micrograph of AC-2Z-N with magnification of 350x 73
4.17 TGA/DTG of raw-PKS 75
4.18 TGA/DTG of AC-1Z-N in air flow 77
4.19 TGA/DTG of AC-1Z-V in air flow 77
4.20 TGA/DTG of AC-1Z-N in nitrogen flow 79
4.21 TGA/DTG of AC-1Z-V in nitrogen flow 80
4.22 X-ray diffractogram of samples with 6 percent of tungsten
content supported on AC-1Z-N 83
4.23 X-ray diffractogram of samples with 15 percent of tungsten
content supported on AC-1Z-N 84
4.24 X-ray diffractogram of samples with 6 percent of tungsten
content supported on AC-1Z-V 87
4.25 X-ray diffractogram of samples with 15 percent of tungsten
content supported on AC-1Z-V 88
4.26 Micrograph of ACN-15-950 with magnification of 140x 90
4.27 Micrograph of ACV-15-950 with magnification of 840x 90
4.28 EDX of ACN-15-950 91
4.29 EDX of ACV-15-950 92
4.30 Chromatogram of CFC-12 gas 95
4.31 Chromatogram of product mixture at different temperature 96
4.32 Conversion of CFC-12 97

LIST OF SYMBOLS / ABBREVIATIONS
°C - degree Celsius
μm - micrometer
BET - Brunauer-Emmett-Teller
cm - centimetre
DTA - Differential thermal analysis
EDX - Energy Dispersive X-ray analysis
Eq. - Equation
FTIR - Fourier Transformation Infra red
g - gram
ID - internal diameter
K - Kelvin
ksi - kips per linear foot
kV - kilo volt
mA - mili ampere
NA - nitrogen adsorption
mL - millilitre
nm - nanometer
rpm - rotation per minute

TG - Thermogravimetry
XRD - X-ray Diffraction
θ - Half angle of diffraction beam
λ - wavelength

LIST OF APPENDICES
APPENDIX NO. TITLE PAGE
1 Calculation of weight used from atomic weight
percentage ratio of tungsten and activated carbon
support in tungsten carbide preparation 110
2 Nitrogen Adsorption Data of AC-1Z-N 111
3 Nitrogen Adsorption Data of AC-1Z-V 112
4 Nitrogen Adsorption Data of AC-2Z-N 113
5 Nitrogen Adsorption Data of AC-2Z-V 114
6 t-Plot Analysis of AC-1Z-N 115
7 t-Plot Analysis of AC-1Z-V 117
8 t-Plot Analysis of AC-2Z-N 119
9 t-Plot Analysis of AC-2Z-V 121
10 EDX Spectrum of AC-1Z-N 123
11 EDX Spectrum of AC-1Z-V 124
12 EDX Spectrum of AC-2Z-N 125
13 EDX Spectrum of ACN-15-950 126
14 EDX Spectrum of ACN-15-950 127

CHAPTER 1
INTRODUCTION
Activated carbons are carbonaceous materials that have highly developed
porosity and internal surface area. They are widely used in a number of applications,
such as separation and storage of gases; recovery of chemical products, removal of
organic pollutants from drinking water and also as catalyst support. The increasing
usage and competitiveness of activated carbon prices, has prompted the usage of
agricultural by-products such as coconut shell (Azevedo et al., 2007), pistachio shell
(Lua et al., 2004), saw dust (Mohanty et al., 2005), and walnut shell (Alvim-Ferraz et
al., 2003) as raw materials to prepare activated carbon. The physical properties of an
activated carbon depend on the raw material and its treatment (Manocha, 2003).
Base on a study done by Kawser and Farid (2000), Malaysia generates 7.7
million tonnes of empty fruit bunches 6.0 million tonnes of fibre and 2.4 million
tonnes of palm kernel shell every year. These by-products often considered as waste
and have cause significant disposal problem. Therefore, in this research palm kernel
shell was used as a starting material to prepare activated carbon in addition it is also a
feasible solution to this environmental issue. The prepared activated carbon is then
used as the carbon source as well as catalyst support for tungsten carbide catalyst.
The most important parameters for the catalyst support are inertness, porosity
and surface area (Cameron et al., 1990) Activated carbon is a material that combines
all these characteristics optimally and additionally it has unique properties like its

stability in both acidic and basic media, high surface area, microporosity, and cost
effectiveness (Jankowska et al., 1991, and Auer et al., 1998).
The catalytic properties of tungsten carbide have attracted interest since Levy
and Boudard (1973) first discovered that the carbides of groups IV-VI resemble the
catalytic properties similar to those of Platinum group metals. Since then they have
been investigated for application in heterogeneous catalysis. To date, the use of
tungsten carbide as well as other transition metal carbides as heterogeneous catalysts
has grown (Keller et al., 1991; Moreno-Castilla et al., 2001 and Oxley et al., 2004)
Several methods have been developed for the preparation of tungsten carbide
and mostly involve solid precursor and reducing agent (Gao and Kear, 1997; Liang et
al., 2003). In general the resulting carbide has a low surface area. Therefore in this
research tungsten carbide catalyst supported on activated carbon was prepared to
obtain a high surface area catalyst. The catalyst was then tested on
hydrodehalogenation of dichlorodifluoromethane (CCl2F2; CFC-12).
The widespread application of CFCs in industry including refrigeration, foam
blowing agent and cleaning agent cause severe damage to the ozone layer and
contributed significantly to global warming. Thus, destruction of ozone depleting
substances especially CFCs has been attract many researchers interest since their
production and uses have been phase out under international agreement known as
Montreal Protocol (UNEP 2000). Presently, several treatment technologies are
available such as thermal incineration, catalytic conversion and activated carbon
adsorption. Among them catalytic conversion of CFCs into valuable compounds like
hydrofluorocarbon (HFC) seem to be an attractive technique (Yu et al., 2006).
In past few years, the catalytic performances of transition metal carbide
catalyst for hydrodehalogenation of CFCs have been studies because of their low cost
and Platinum-like behaviour in catalysis (Delannoy et al., 2000 and Oxley et al.,
2004);. Thus, the tungsten carbide catalyst prepared in this research can be a potential
substitute for the traditional catalyst platinum and palladium.

In this study, high surface area tungsten carbide catalyst supported on
activated carbon was prepared. Locally obtained palm kernel shell was used as
starting material to produce activated carbon. The resulting catalyst was then tested in
catalytic hydrodehalogenation reaction of dichlorodifluoromethane, CFC-12.
1.1 Problem Statement
Palm kernel shell, is an abundant tropical waste from palm oil processing mills
in tropical countries like Malaysia and Thailand. They either treat the waste by
disposing it or use it as fuel. To economically utilize these agricultural by-products, it
is proposed to use them as prospective starting materials for the preparation of
activated carbon.
For the past few years a number of studies have been conducted on the
preparation of activated carbon from palm kernel shells. However, so far there is no
research has been done on application of palm kernel shell base activated carbon as
tungsten carbide catalyst support. Tungsten carbide catalyst has exhibited platinum-
like catalytic properties but is difficult to prepare with high surface area. The present
work was devoted to study kernel shell base activated carbon as the carbon source as
well as catalyst support towards synthesis a high surface area tungsten carbide
catalyst. The optimal prepared tungsten carbide catalyst was tested on catalytic
hydrodehalogenation of CFC-12 to find an economic approach to the remediation of
CFCs.

1.2 Objective of the Research
The objectives of this research are as follows:
1) To prepare high surface area activated carbon from palm kernel shells.
2) To study the surface physical properties of the prepared activated
carbon support.
3) To prepare and optimize condition for high surface area tungsten
carbide catalyst using activated carbon.
4) To carry out the catalytic testing of hydrodehalogenation of CFC-12
using the optimal laboratory prepared tungsten carbide catalyst.
1.3 Scope of Studies
The first part of this study is concentrated on preparing the high surface area
activated carbon using locally obtained raw material, palm kernel shells. Activated
carbons were prepared by chemical activation using zinc chloride under both nitrogen
flow and vacuum condition. The effects of impregnation ratio (ZnCl2 to palm kernel
shell) and activation condition on the surface properties of carbons were studied in
order to optimize these parameters. The prepared activated carbons will be
characterized using several techniques which are, Fourier transform infrared (FTIR),
single point BET analysis, nitrogen adsorption, field emission scanning electron
microscopy (FESEM) and Thermogravimetry analysis (TGA).

The prepared activated carbons used as the carbon source as well as catalyst
support for tungsten carbide catalyst. The catalyst was prepared via sublimation
technique followed by heat-treatment.
Catalytic testing hydrodehalogenation of CFC-12 was carried out using the
optimal laboratory prepared tungsten carbide. The performances of tungsten carbide
catalyst at temperature range from 200 ºC to 350 ºC were studied as an alternative for
the expensive commercially available catalyst.

CHAPTER 2
LITERATURE REVIEW
2.1 Activated Carbon
Activated carbon is an amorphous form of carbon which shows a very
disordered of graphite-like crystalline composed of complex aromatic-aliphatic forms.
The crystallites are randomly oriented and extensively interconnected (Radovic,
2001).
The structure of an activated carbon may be visualized as a stack of poorly
developed aromatic sheets, distributed and cross-linked in a random manner,
separated by disordered carbonaceous matter and inorganic matter (ash) derivated
from the raw material. The anisotropic crystallite alignment is associated with the
presence of void (Bandosz, 2006). During the activation process, the spaces between
crystallites become cleared of less organized carbonaceous matter and at the same
time some of the carbon is removed from the crystallites. The resulting channels
through the graphitic regions and interstices between the crystallites of the activated
carbon make up the porous structure which usually has large surface area. Thus, the
pore size distributions for a typical activated carbon are complex and cover a wide
range of pore widths (Jankowska et al., 1991; Jaroniec et al., 1996).

2.1.1 Physical properties of activated carbon
The adsorption capacity of an activated carbon depends largely on the
presence of pore structure. The surface area and pore structure are perhaps the main
physical properties that characterize activated carbon and are interrelated to each other
(Ahmad et al., 2007; Prauchner and Rodriguez-Reinoso, 2007).
The surface of any solid is hardly ever truly plane on an atomic scale but there
are always present cracks and fissures some of which may penetrate very deeply, and
these will contribute towards the internal surface. Meanwhile the superficial cracks
and indentations will contribute towards the external surface. The external surface
may be taken to include all the prominence and all of those cracks which are wider
than they are deep and internal surface on the other will then comprise the walls of all
cracks, pores and cavities which are deeper than they are wide (Ponec et al.,1974).
Usually commercial activated carbons have specific surface areas ranging
from 400-1500 m2g-1 (Marsh and Rodriguez-Reinoso, 2006). However, recently
values of up to 4000 m2g-1 are found for some super activated carbon and these are
unrealistically high. Generally, the larger the specific surface area, the higher will be
its adsorption capacity. (Lua and Guo, 1998).
The pore systems of an activated carbon are of many different kinds that may
vary greatly both in size and in shape within a solid. According to the International
Union of Pure and Applied Chemistry (IUPAC), the pores of a porous material are
classified in three categories as shown in Table 2.1 (Kinoshita, 1987). These values
represent the width, i.e. the distance between the pore wall for slit-shape pores and the
radius for cylindrical pores. The classification of pores is introduced based on
nitrogen, N2 adsorption at 77 K, where N2 molecules adsorbed by different
mechanisms (multilayer adsorption, capillary condensation and micropore filling.)
(Radovic, 2001).
Table 2.1: Classification of pores of a porous material

Type of pores Diameter of pores (nm)
Macropores >50
Mesopores 2-50
Micropores <2
Each of these groups of pores plays a specific role in the adsorption process.
Macropores, >50 nm, is considered as being open surface, and assists only with
transport of adsorptive into interior of carbon particles, where adsorption takes place
mainly in the micropores (Marsh and Rodriguez-Reinoso, 2006). The process of
filling their volume with adsorbate takes place via the mechanism of multilayer
adsorption. Mesopores (2-50 nm) also perform as the main transport arteries for the
adsorbate. In mesopores the volume filled with adsorbate via the mechanism of
capillary condensation. Micropores, <2 nm, have sizes comparable with those of
adsorbed molecules. The energy of adsorption in micropores is substantially greater
than that for adsorption in mesopores or at non-porous surface, which cause a
particularly large increase of adsorption capacity for small equilibrium pressure of
adsorbate. In, micropores adsorption proceeds via the mechanism of volume filling
(Jankowska et al., 1991).
2.2 Agricultural by-products as raw material for activated carbon
Agricultural by-products have proved to be promising raw materials for the
preparation of activated carbons because of the availability at low cost. Table 2.2
summarizes some of the agricultural residues that were used to produce activated
carbon. The BET surface area and pore volume of the activated carbon are also
tabulated in the same table. Other precursors such as minerals (bituminous coal and
lignite) have high degree of inorganic material, of the order of 20% (Minkova et al.,
1991), which necessitates demineralization followed by washing steps so that the

material obtains certain properties (Kinoshita, 1987) required for the preparation of
activated carbons. In addition high content of inorganic material lowers the resulting
yield of the final product. Consequently the total cost and time of the preparation
process increase (Galiatsatou et al., 2001). In construct, the low ash content and
absence of sulphur and heavy metals in the agricultural raw material eliminates some
time consuming and expensive procedural steps. Therefore, the preparation of
activated carbon from agricultural by-products has been encouraged, since they are
considered as waste and their use in this manner would prevent their accumulation.
Table 2.2: Agricultural by-products used to produce activated carbon
Agricultural
by-product
BET surface area
(m2g-1)
Micropore
volume (cm3g -1)
Reference
Pistachio nut-shell 1579 0.322 Lua et al (2004)
Apricot stone 728 0.320 Youssef et al (2005)
Coconut shell 2114 1.142 Azevedo et al. (2007)
Oil palm wood 1084 Not reported Ahmad et al. (2007)
Tectona grandis sawdust
585 0.442 Mohanty et al. (2005)
Olive stone 686 0.200 Galiatsatou et al. (2001)
Almond shell 438 Not reported Alvim-Ferraz et al. (2003)
Oil palm (Elaeis guineensis) is a major source of edible oil which is extracted
from its fruits. However, palm-oil mills produced large amount of solid wastes, such
as extracted palm oil fibres, palm shells, palm gases, stones and empty fruit bunches.
For example, here in Malaysia, more than two million tons (dry weight) of extracted
oil palm fibre are estimated to be generated annually (Lua and Guo., 1998). It is
estimated that for every one million tonnes of palm oil produced, 0.8 million tonnes of
palm shells is created (Daud et al., 2000). Based on a total oil production in Malaysia
of 7.4 million tonnes in 1993, the amount of palm shell generated in that year alone
was about 6 million tonnes. To economically utilize these agricultural by-products, it

is proposed to use them as prospective starting materials for the preparation of
activated carbon as they have high density, relatively high carbon content and low ash
content.
Palm kernel shell (endocarp) is a lignocellulosic material which content 29.7%
cellulose, 47.7% halocellulose and 53.4% lignin (Suhas et al., 2007). Studies were
made to compare the pore development in activated carbons produced under identical
conditions from palm shell and coconut shell by Daud and Ali (2004). It was stated
that the surface area and the porosity of palm kernel shell based carbons which are
high lignin content, were found to be more compared to coconut based carbons
(30.1% lignin).
2.3 Preparation of activated carbon
Basically, the preparation of activated carbon consists of four steps, namely
selection of raw materials, pretreatment, carbonization, activation and finally washing.
However, the main process for manufacturing activated carbon only involves two
steps; the carbonization of the raw material and activation of the carbonized product.
2.3.1 Selecting of raw materials
In the selection of an appropriate raw material for preparation of activated
carbon, several factors are taken into consideration. Industrially, inexpensive raw
material with high carbon and low ash content is preferred as raw material for the
production of activated carbon. High density of the precursor and sufficient volatile
content are of considerable importance. Evolution of volatiles during pyrolysis results

in porous char, essential for making activated carbons (Manocha, 2003). While high
density contributes to enhanced structural strength of the carbon, essential to
withstand excessive particle crumble during use (Stiles, 1987).
It is widely agreed that the pore structure and pore size distribution of an
activated carbon is largely determined by the nature of the starting material. A study
conducted by Rodriguez-Reinoso and Solana (1989) on several agricultural wastes
such as peach stone, sherry stone, palm stone and almond shell found that the
botanical family of the material influences the pore size distribution as well as the
pore size.
One of the parameter which differentiates one material from another is the
material composition, cellulose, halocellulose and lignin. Gergova et al. (1994)
produced activated carbon from grape seed and cherry stone and attributes the
predominantly mesopore and macropore structure of the carbon produced from them
to the high lignin content in the raw material. The work also revealed the possibility
of selecting raw materials to produce activated carbon with certain pore distribution
by recognizing their differences in material content. For example, if an activated
carbon with significant amount of mesopores and macropores is required, it may be
produced from lignocellulosic materials that contain comparatively high percentage of
lignin content.
In this research palm kernel shells which have high density, relatively high
fixed carbon, and low ash content were used as starting material to produce high
surface area activated carbon.
2.3.2 Pre-treatment

The raw material will need pretreatments prior to its activation. In the case of
regular powdered or granular carbons, the raw material must first be prepared to
require size by grinding and sieving. Sometimes, a washing step is applied with water
or acid in order to remove any dirt coming with the raw material and to reduce any
mineral matter.
2.3.3 Carbonization
Carbonization process involves pyrolysis of the raw material at moderate
temperature (100-400 ºC) in the absence of air, normally performed in the presence of
a stream of nitrogen (N2) and carbon dioxide (CO2) to remove the volatile matters and
produce chars with rudimentary pore structures (Manocha, 2003; Marsh and
Rodriguez-Reinoso, 2006) .
During the carbonization of the raw materials, heteroatoms such as oxygen,
hydrogen and nitrogen are eliminated as volatile gaseous products and the residual
elementary carbon atoms are then grouped into stacks of flat aromatic sheets cross
linked in a random manner. Since the arrangement of these sheets is irregular, it
leaves free interstices among them. The porosity of char which refers to the interstices
is not then completely accessible and tends to be filled or partially blocked with tars
and other decomposition product s which become disorganized carbon (Rodriguez-
Reinoso, 1997).
Carbonization temperature has the most significant effect followed by, the
nitrogen flow rate and then finally the carbonization residence time. Generally
increasing carbonization temperature reduces yield of activated carbon. According to
Putun et al. (2005), increasing temperature leads to a decreased yield solid and an
increased yield of liquid and gasses. As the temperature is raised, there is a rise in ash
and fixed carbon percentage and there is a decrease in volatile matter. Consequently,

higher temperature yields chars of greater quality. The decrease in the char yield with
increasing temperature could either be due to greater primary decomposition of
biomass at higher temperature or secondary decomposition of char residue.
2.3.4 Activation
As discussed above, during the carbonization the free interstices present in
carbon filled or at least partially blocked by tar substances. The resulting carbonized
product has only a very small adsorption capacity (Bandosz, 2006). The purpose of
activation is to enlarge the diameters of pores which are created during the
carbonization process and to create some new porosity. Activation can be carried out
by physical and chemical means (Auer et al., 1998).
Physical activation is a process by which the carbonized product develops
porous structure and extended surface area on heat treatment in the temperature range
from 800-1000 ºC in the presence of suitable oxidizing gases such as steam or CO2,
(Rodriguez-Reinoso et al., 1995; Ratna et al., 2005).
In chemical activation process the two steps, carbonization and activation
carried out simultaneously, with the precursor being mixed with chemical activating
agents, as dehydrating agents and oxidants. Once the impregnation step is complete,
heat treatment is carried out under a flow of nitrogen and the resulting carbon is
washed to eliminate remaining chemical (Molina-Sabio and Rodriguez-Reinoso,
2004). Chemical activation offers several advantages since it is carried out in a single
step, performed at lower temperatures and therefore resulting in development of a
better porous structure (Ioannidou and Zabaniotou et al., 2007). The chemical agents
normally used such as zinc chloride, phosphoric acid, calcium chloride or potassium
hydroxide. In this study activated carbons were prepared via chemical activation using
zinc chloride.

2.3.4.1 Activation with zinc chloride
Zinc chloride was the principal method of chemical activation up to 1970, and
it is still used in China. Initially, the precursor is mixed with the chemical (ZnCl2) in
an aqueous solution to form a paste and the mixture kept at around 85-110 ºC with out
evaporation. In this way, the swelling of the interior channels of the botanic structure
allows for better access of the reactant to the interior of the particle. Further partial or
complete evaporation of solution will force the incorporation of the reactant to the
interior of the particles. After the evaporation, the impregnated carbon heat treated in
an inert atmosphere at temperature between 600 – 750 ºC (Marsh and Rodriguez-
Reinoso, 2006). During the heat treatment ZnCl2 acts as a dehydrating agent
favouring the elimination of hydrogen and oxygen as water instead of Cox or
hydrocarbons. Thus inhibiting the loss of volatile matter as well as tars and leaving
behind more fixed carbon and consequently a higher reaction solid yield (Almansa et
al., 2004).
The extent of chemical activation can significantly alter the characteristics of
the produced carbons. According to Caturla et. al., (1991), at high ZnCl2
concentrations, some ZnCl2 remains in external part of the carbon particles and
widens the porosity by a localized decomposition of organic matter. This process
results in the enhancement of meso and macropore formation. Ahmadopour and Do
(1997) described pore evolution with respect activating agents and showed that
micropore formation is predominant when ZnCl2 to precursor mass ratio is less than
one. They also observed that when impregnation ratio is greater than 2, pore widening
becomes the dominant mechanism and meso pores formed.
Preparation of activated carbons by chemical activation in inert atmosphere
such as nitrogen had been carried out by many researches (Molina-Sabio and
Rodriguez-Reinoso, 2004; Khalili et al., 2000); however, chemical activation of palm
kernel shell base carbon under vacuum conditions seldom reported in the literature.

Therefore, in this study the effects of different parameters, the impregnation ratio and
the activation condition (nitrogen gas and vacuum) on pore development were
studied.
2.3.5 Washing
Some applications need very pure activated carbons, and to comply with this
need many manufacturers remove most of the ash components by washing the carbon
with water or acids such as hydrochloric or nitric acid. In some cases a more
exhaustive washing is requires the use of hydrofluoric acids to eliminate the
aluminosilicate components of the ash. The washing process is very important when
the carbon is to be used in pharmaceutical preparations, food industries or in catalysis
particularly when the carbon is used either as a catalyst or a catalyst support.
Furthermore, the high ash content and impurities may influence the activity of catalyst
(Auer et al., 1998)
2.4 Catalyst Support
Catalyst support is vital important in today’s chemical industry. The primary
aim of the support is to improve dispersion significantly and provide access to a much
large number of catalytically active species. In addition, the support may also be
added to stabilize the catalyst against agglomeration and sintering (Stiles, 1987).
Normally catalyst supports are consist of inert substances that provide a means
of spreading out an expensive catalyst ingredient, especially precious metal in order to
achieve a greater effective utilization of the metal compare with a bulk metal system.

The most important physical characteristics of a catalyst support are hardness, surface
area, porosity and pore size distribution (Winterbottom and King, 1999).
High surface area and well developed porosity are essential for achieving large
metal dispersions, which usually results in high catalytic activity. The pore size
distribution plays an important role, for it not only determines the surface area
available but also control the diffusion of substrate molecules to catalytically active
site and thus exhibit higher activity.
Normally, the nature of reaction system largely determines the type of catalyst
support. For a liquid phase reaction, in which large or complex molecules are being
processed, it is essential that the pore size be relatively large which means that the
surface area must be relatively low. The definition of low surface area would be in the
range from 1 to 125 m2g-1, whereas high surface area would be in the range of 125 to
2000 m2g-1 (Stiles, 1987). Generally, catalysts for the activation of hydrogen
(hydrogenation Moreno-Castilla et al., 2001), hydrodehalogenation (Delannoy et al.,
2000), hydrodesulfurization and hydronitrogenation (Landau, 1997) require high
surface area support, whereas selective oxidations such as olefin epoxidation (Yu et
al., 2007) need low surface area support to suppress the undesirable reactions.
Basically in selecting an appropriate support for a particular catalyst, a
numerous physical and chemical aspects must be taken into account. Table 2.3 shows
the desirable physical and chemical properties to be considered in choosing a support
(Winterbottom, 1999; Hagen, 2006).
Table 2.3: Physical and chemical properties of supports
Physical properties Chemical properties

i. surface area (activity and
distribution of catalyst)
i. Inert to undesirable reactions
ii. Porosity (mass and heat transport) ii. Stable under reaction and
regeneration condition
iii. Partical size and shape (pore
diffusion)
iii. Interaction with active component
(to improve activity and selectivity)
iv. Mechanical stability (abrasion and
durability)
iv. Stabilize the catalyst against
sintering
v. Thermal stability (catalyst lifetime
and regenerability)
v. Minimise catalyst poisoning
vi. Bulk density (active component
content per unit reactor volume)
vii. Separability (filterability of powder
catalysts)
There are various types of catalyst supports available commercially.
Table 2.4 shows the type of catalyst supports and their applications in chemical
industry. Among these supports, alumina, silica, zeolite and activated carbon are used
in most of the industrial catalytic process (Rodriguez-Reinoso, 1997; Winterbottom,
1999).
Table 2.4: Type of catalyst supports and their applications (Stiles, 1987)

Support Specific surface
area (m2g -1) Applications
Alumina 160-300 Hydrogenation, dehydrogenation and
metathesis.
Alumina silicate >800 Cracking reactions, dehydration,
isomerazation and ammoxidation.
Silica 200-1000 Polymerization, hydrogenation,
oxidation and NOx reduction
Titania 40-200 Selective oxidation, oxidation of o-
xylene to phthalic anhydride.
Activated carbon 600-2000 hydrogenation with precious metal
catalysts (fine chemical), oxidation.
Clay 50-300 Hydrogenation and condensation
Zeolites 300-600 Refinery processing, byfunctional
catalysis and organic synthesis.
2.4.1 Activated Carbon as Catalyst Support
Activated carbon has been used for decades in heterogeneous catalysis. It is
used predominantly as a support for metal catalysts especially precious metal in fine
chemicals, petroleum refining and also environmental applications.
A very important point for the economic use of precious metal catalysts in
chemical industry is recovery, refining and recycling of the metal. This procedure is
simplified by the use of activated carbon as support where this material can be burnt
off, and produce high concentrated ashes that permit and economical recovery of
precious metal. This technology is also environmental friendly, for it does not produce
large amount of solid waste that need to be land filled (Auer et al., 1998).

Today activated carbon supported catalysts are used in a vast number of
catalytic reactions. The majority of the reactions involved hydrogenation reactions.
Hydrogenation of nitrobenzene (Perez et al., 1997), ethylene (Moreno-Castilla et al.,
2001), halogenated nitroaromatic compound and carbon monoxide in alcohol
synthesis (Zhong-rui et al., 2001) are some of the reaction that used activated carbon
supported catalyst. In environmental applications activated carbon supported catalysts
are used in conversion of halocarbons towards remediation of ozone layer depletion
(Oxley et al., 2004).
2.5 Transition metal carbide
The transition metals also known as transition elements occupy the space
between group 2 and group 3 of the periodic table. The incorporation of carbon into
lattices of early transition metals (IVB-VIB) produces compounds with unique
physical, chemical and catalytic properties, which combine the characteristic
properties of three different classes materials: covalent solids, ionic crystals and
transition metals. These resulting alloys are referred to transition metal carbides. The
carbides are well known for their hardness, strength, high melting points, and also
characteristics of ceramic materials (Toth, 1971).
The carbides of early transition metal are often characterized by simple crystal
structures. The metal atoms form lattices of face–centered cubic (fcc), hexagonal
packed (hcp), or simple hexagonal (hex) structures, while carbon atoms reside in
interstitial sites between metal atoms (Oyama, 1996). Figure 2.1 show respectives
structures of transition metal carbides. Reffering to Figure 2.1 the open and filled
circles represent metal and non-metal atoms (carbon), respectively. In general, carbon
atoms occupy the largest interstitial sites available, for this reason, transition metal
carbides are often termed interstitial alloys (Chen, 1996).

Figure 2.1: structure of transition metal carbides
Theoretical band calculations of transition metal carbides have indicated that
the bonding in these compounds involves simultaneous contribution from metallic,
covalent and ionic bonding. The metallic bonding is related to the rearrangement of
metal-metal bonds; the covalent contribution is due to the formation of covalent bonds
between metal and nonmetal atoms; and the ionic is characterized by the charge
transfer between metal and nonmetal atoms. The formation of carbide modifies the
nature of the d band of the parent metal, which in turn gives rise to catalytic properties
that are different from those of the parent metals but similar to those of group VIII
noble metals (Oyama and Keiffer, 1992).
Carbides have been demonstrated to have excellent catalytic activities in
variety of reactions, including hydrogenolysis, hydrogenation, dehydrogenation,
isomerization, hydrodesulfurization, hydrodenitrogenation and ammonia synthesis.
One of the primary interests in the applications of carbides in these reactions was to
use them as cheaper alternative catalysts to replace group VIII noble metals. In many
Face centered cubic
TiC, VC, NbC α-MoC1-x, β-WC1-x
Hexagonal closed packed
β-Mo2C, W2C, Re2C
SingleHexagonal WC, MoC

cases the catalytic activities of carbide resemble those of noble metals. Another
potential catalytic advantage of carbides is that they often show higher sulfur and
nitrogen tolerance than the noble metals.
2.5.1 Tungsten carbide in catalytic usages
The catalytic properties of tungsten carbide have attracted interest since Levy
and Boudart (1973) drew some parallels from qualitative points of view between WC
and Pt. They found that WC catalyzes the formation of water from hydrogen and
oxygen at room temperature, the reduction of tungsten trioxide by hydrogen in the
presence of water, and isomerization of 2,2-dimethylpropene to 2-methylbuthane.
This catalytic behaviour, which is typical of platinum, is not exhibited at all by
tungsten.
Levy and Boudart (1973) speculated that the catalytic properties of WC
resulted from electronic structure. They suggested that carbon electron increased the
apparent electron to atom ratio, producing a more Pt-like electronic structure. This
observation was wrongly interpreted as a speculation that there was electron transfer
from carbon to tungsten d band producing a Pt like charge distribution and hence, Pt
like chemical properties. Latter, the similarity between Fermi level electronic density
of states (DOS) for Pt and WC was confirmed by number of spectroscopic
investigations. In these investigations the XPS spectra of W, WC and Pt were
compared. It was found that there were in fact similarities between the Fermi level
DOS for Pt and WC but not for W and Pt or W and WC (Houston et al., 1974;
Bennett et al., 1974). These observations support the conjecture of Levy and Boudart
that the similarity in catalytic properties is indeed due to electronic factors.
Subsequent investigations demonstrated that WC was good catalyst for a wide
variety of reactions that typically utilized Pt as catalysts. Thus the use of WC as
heterogeneous catalyst has grown. WC catalyzed reactions studied over the past 25

years include NH3 synthesis (Sourabh et al., 2007), ethylene hydrogenation (Morena-
Castilla et al., 2001), hydrazine decomposition (Rodrigues et al., 1997), and CO
hydrogenation (Patterson et al., 2003).
2.6 Chlorofluorocarbons (CFCs)
Chlorofluorocarbons (CFCs) are a class of chemicals that contain only atoms
of carbon, chlorine, and fluorine. They have many desirable properties such as
inertness, stability and compressibility which make them ideal for many applications.
CFCs were first introduced in the 1930s as safe replacements for refrigerants
and air-conditioners. Initially CCl3F was used as a cooling medium in refrigerators
while CCl2F2 in air-conditioners both stationary (room) and mobile (vehicles) ones.
The popularity of Freons has increased when Abplanalp, the first to use CC12F2 as
propellants in spray cans containing deodorants and hair spray (Wayne, 2000). Later
they were widely applied in technological sprays of paints, varnishes and
pharmaceuticals (e.g. CF3CC1F2). Intense development of technology has extended
the use of halocarbons, e.g. in medicine for sterilisation of surgical instruments
(CC12FCC1F2), and as blowing agents in the fabrication of flexible and rigid foams
(CCI3F, CC12F2, CC12FCC1F2) used for thermal insulation in building engineering.
The compounds being excellent cleaning and fat removing agents have been
commonly applied in the electronics industry (CC12FCC1F2, CC1F2CC1F2) and also
as industrial solvents (CCl4, CHCl3, CH3CC13, CH2C12, C2C14) (Wayne, 2000).
These widespread uses eventually resulted in large emissions of CFCs into the
atmosphere and because of their low chemical reactivity, CFCs typically have long
atmospheric residence times, and as a consequence are distributed globally. In 1974,
Molina and Rowland hypothesized that when CFCs reached the stratosphere they
would break down to release chlorine atoms. The chlorine atoms would then react
with stratospheric ozone, breaking it down into oxygen (Wachowski et al.,2001).

CFCs have been implicated in the accelerated depletion of ozone in the Earth's
stratosphere. Since stratospheric ozone absorbs much of the sun's ultraviolet radiation,
decreased stratospherel ozone levels could lead to increased ground-level ultraviolet
radiation. This could adversely affect crop growth, and also lead to increases in
cataracts and nonmelanoma skin cancer. Because of the harmful effects on mankind,
CFCs have been classified as controlled and regulated substances in Montreal
Protocol. According to the agreement, their production and usage was stopped
immediately in the developed countries and by 2010 in developing countries.
Therefore, more efforts in research and development are aimed at the development of
CFC alternatives and also in the destruction or conversion of CFCs (UNEP, 2000).
2.6.1 Remediation and Conversion of CFCs
The banning of CFCs has lead to research to identify other chemicals that can
be used in the same applications but without the same environmental concerns. An
ideal CFC substitute is one whose properties are close to that of existing CFC, with
added specification that it does not destroy the ozone layer and therefore has a low
global warming potential, low toxicity and a shorter atmospheric life time ensures that
the molecule is degraded in the troposphere, leaving little chance for its entry into
stratosphere. The presence of hydrogen in the molecule promotes attack by hydroxyl
radicals in the atmosphere leading to more rapid breakdown and shorter atmospheric
lifetimes. Thus hydrochlorofluorocarbons (HCFCs) with greatly reduced atmospheric
life ranging from 2-25 years are acting as intermediates for the CFCs (Rao et al.,
2003). Hydrofluorocarbons (HFCs) with no chlorine atoms, even though they seem to
be real substitutes for CFCs, are more difficult to synthesis than CFCs.
In addition to the development of CFC alternatives, it is also important to
destroy the large quantities of existing CFCs in an efficient manner. The most widely
used substances in CFC family are CFC-12 (refrigerant), CFC-11 (blowing agent),

and CFC-113 (cleaning agent). Because of their ozone depletion potential in the
stratospheric ozone layer, in addition to development of their alternatives and methods
to destroy existing CFCs need to be established.
There are several approaches to the remediation of CFCs. These include
activated carbon adsorption, thermal incineration, catalytic oxidation and
hydrodehalogenation (HDH). While treatment with activated carbon can aid in
recovery and recycling of halogenated solvents, it is not a viable method for
destruction of CFCs. Thermal incineration (≥900 ºC) is successful at destroying
halogenated organics; however, the presence of oxygen during the process can lead to
the formation of even more toxic secondary pollutants such as polyhalogenated
dioxins and furans (Soderstrom and Marklund, 2002). Emission from incineration
plants are major contribution to the 3000 kg of polyhalogenated dioxins and furans
produced every year (Brzuzy and Hites, 1996). Catalytic oxidation allows for the use
of low temperature (<600 ºC), but current catalysts have relatively low activity
(Corella and Toledo, 2002).
Hydrodehalogenation (HDH) of CFCs has been identified as a better process
for their transformation as yield either HCFCs or HFCs that has low or almost zero
ozone depletion potential (ODP) value. In this study catalytic HDH testing was
carried out on CFC-12 using the prepared tungsten carbide catalyst.
2.6.2 Hydrodehalogenation of CFCs on tungsten carbide
Catalytic hydrodehalogenation of CFCs produces HCFCs and HFCs at lower
temperatures (<300 ºC) and is the most promising of the remediation technique
available (Oxley et al., 2004). A typical reaction mechanism on the formation of
CFC-12 (CH2F2) through HDH of CCl2F2 may be represented in the following way
(Rao et al., 2003).

(Eq.2.1) Dissociative adsorption of hydrogen over metal surface
(Eq.2.2) Metal halogen exchange between reactant and catalyst surface.
(Eq.2.3) Formation of difluorocarbene with hydrogen.
(Eq.2.4) Associative desorption of carbene with hydrogen.
However this reaction condition and nature of support influence the formation
of HCFC-22 (CHClF2) or methane in addition to HFC-32 (CH2F2). Thus depending
on the condition, the reaction may further proceed as follows (Rao et al., 2003):
Nature of support, H2/CFC-12 ratio and the reaction temperature influence the
selectivity to different products and also the catalyst stability. The commonly used
supports for hydrodehalogeation are either neutral supports such as activated carbon
and graphite or acidic supports such as AlO3 and AlF3 as they expected to offer better
S=CF2 + S-H + S-Cl CHClF2 + 3S (Eq.2.5)
S=CF2 + 2S-H S=CHF + 2S + HF (Eq.2.6)
S=CHF + S-H S-CH2F + S (Eq.2.7)
S=CH2F + S-H CH3 + 2S (Eq.2.8)
S=CH2 + 2S-H CH4 +3S (Eq.2.9)
H2 + 2S2S-H (Eq.2.1)
CCl2F2 + S-H S-CClF2 + HCl (Eq.2.2)
SCClF2 + S-HS=CF2 + HCl (Eq.2.3)
S=CF2 + 2S-H 3S + CH2F2 (Eq.2.4)
S = catalyst support

resistance to corrosion reaction condition (evolution of HCl and HF) during course of
the reaction.
Although previously Palladium, platinum and Rhodium has been the preferred
catalyst for hydrodehalogenation of CFCs, transition metal carbides, especially
Molybdenum (Mo) and tungsten (W) carbides are also well known to show interesting
behaviors in HDH reaction. Indeed Delannoy et al., (2000) have reported that
tungsten and molybdenum carbides catalyse hydrodehalogenation CFC-115
(CF3CF2Cl). It was found that selectivity towards pentafluoroethane (HFC -125)
decreases in the following sequence of: WC2>WC1-x>MoC1-x. In another study Oxley
et al., (2004) used sonochemically prepared Mo2C and W2C to perform catalytic HDH
of several halogenated organic compounds including CFC-12. They noted that the
both catalysts were selective, active and stable for all substrates tested. In this study
catalytic HDH reaction was performed on tungsten carbide catalyst supported on
activated carbon.
2.7 Preparation of Tungsten Carbide
High surface area tungsten carbide catalyst is known to posses catalytic
properties similar to ruthenium, iridium, palladium and platinum. Conventional
preparation methods for carbides have been inherited from the metallurgical industry
and involve the reaction of metal compounds with graphite carbon at very high
temperature (1600 ºC). Abdul Rahim et al., (2005); Ratna (2007) synthesis tungsten
carbide by reacting tungsten powder and palm kernel base activated carbon via
carburization under nitrogen and vacuum condition. But the resulting carbide give a
very low surface area (15 m2g-1) and unsuitable for use as catalyst. A high surface
area is desirable for increasing the number of available catalytic sites. Many methods
have been developed for the preparation of high surface area carbides in order to
optimize the catalytic efficiency of the carbides (Toth, 1971). It is also found that the
catalytic properties of carbide materials strongly depend on their surface structure and

composition, which are closely associated with the preparation methods. The
representative method is the temperature programmed reaction between oxide
precursors and a flow of hydrogen and carbon-containing gases, such as CH4 (Keller
et al., 1991), C2H6 (Claridge et al., 2000), C4H10 (Xiao et al., 2000) and CO (Lemaitre
et al., 1986). However resulting carbide surface is usually contaminated by polymeric
carbon from the pyrolysis of carbon-containing gases and the carbon blocks the pores,
covers the active sites, and difficult to remove (Liang et al., 2003).
In a study conducted by Alvarez-merino et al.(2000), high surface area
tungsten carbide catalyst supported on activated carbon has been prepared via
sublimation technique followed by heat treatment at moderate temperature.
Ammonium tungstate and tungsten hexacarbonyl were used as metal precursors. The
results showed that the carbide catalysts give a high surface area. It also found that the
catalyst prepared from solid precusors (tungsten hexacarbonyl) showed greater
proportion of tungsten carbide compare to liquid precursor (ammonium tungstate),
which could be due to its greater dispersion favoring the transformation of tungsten
trioxide into tungsten and tungsten carbide.
In this study tungsten carbide catalysts with different metal content were
prepared using tungsten hexacarbonyl W(CO)6 precursor, which was deposited on
activated carbons prepared in laboratory from palm kernel shell. Since the starting
materials for the production of these carbides are abundant and cheap, it is suggested
that they can be potential substitute for the rare and expensive noble metals
(Vicinisvarri et al., 2006).
2.8 Fourier Transform Infrared (FTIR)

Infrared (IR) spectroscopy is the subset of spectroscopy that deals with the
infrared region of the electromagnetic spectrum. Simply, it is the absorption
measurement of different IR frequencies by a sample positioned in the path of an IR
beam. The main objective of IR spectroscopic analysis is to determine the chemical
functional groups in the sample. Different functional groups absorb characteristic
frequencies of IR radiation. Using various sampling accessories, IR spectrometers can
accept a wide range of sample types such as gases, liquids, and solids. Thus, IR
spectroscopy is an important tool for structural elucidation and compound
identification.
The IR portion of the electromagnetic spectrum is commonly divided into
three region; the near -IR, mid -IR, and far –IR, named for their relation to the visible
spectrum. The far IR, (400-10 cm-1) has low energy and requires the use of
specialized optical materials and sources. It is used for analysis of organic, inorganic,
and organometallic compounds involving heavy atoms. It provides useful information
to structural studies such as conformation and lattice dynamics of samples.The mid-IR
(4000-400 cm-1) is used to study the fundamental vibrations and associated rotational-
vibrational structure, whilst the higher energy near-IR (14000-4000 cm-1) can excite
overtone or harmonic vibrations (Lange, 1985).
Molecular bonds vibrate at various frequencies depending on the elements and
the type of bonds. For any given bond, there are several specific frequencies at which
it can vibrate. The vibrational frequencies are determined by the shape of the
molecular potential energy surface, the masses of the atoms and eventually by the
associated vibronic coupling. For a molecule to show infrared absorptions, the electric
dipole moment of the molecule must change during the vibration. This is the selection
rule for infrared spectroscopy.
To measure a sample, a beam of IR light is passed through the sample and the
amount of energy adsorb at each wavelength is recorded. Fourier transform IR (FTIR)
spectroscopy is a measurement technique which measure all wavelength at once
compare to dispersive IR spectroscopy. Instead of recording the amount of energy
absorbed when the frequency of IR light is varied (monochromator), the IR light is
guided through an interferometer. After passing the sample, the measured signal is the

interferogram. Performing a mathematical Fourier transform on this signal, results in a
transmittance or absorbance spectrum which shows at which wavelengths the sample
absorbs the IR and allows an interpretation of which bonds are present (Lange, 1985).
Fourier Transform Infrared (FTIR) technique has brought significant practical
advantages to infrared spectroscopy. FTIR spectrometers are cheaper than
conventional spectrometers because build ing of interferometers is easier than
fabrication of monochromator. In addition, measurement of a single spectrum is faster
for the FTIR technique because the information at all frequencies is collected
simultaneously. This allows multiple samples to be collected and averaged together
resulting in an improvement in sensitivity.
2.9 Nitrogen Adsorption Analysis
Gas adsorption is commonly used in surface characterization. It allows one to
determine the specific surface area, pore volume and pore size distribution as well as
surface properties. Nitrogen gas is used for its nonpolar and inert criteria as it is
adsorbed and desorbed on porous solids.
Figure 2.2 illustrates the gas sorption process. Before performing gas sorption,
the solid adsorbent under investigation must first evacuate to ca. 10 -4 Torr for several
hours to remove contaminants such as water and oil. Figure 2.2 (a) shows a solid
particle containing cracks and pores of different sizes and shapes after its
pretreatment. Once clean, the sample is brought to constant temperature by means of
external bath. Then, small amounts of a gas (the adsorbate) are admitted in steps into
the evacuated sample chamber. Gas molecules that stick to the surface of the solid
(adsorbent) are said to be adsorbed and tend to form a thin layer that covers the entire
adsorbent surface (Figure 2.2 (b). Based on the well-known Brunauer, Emmett and
Teller (B.E.T.) theory, one can estimate the number of molecules required to cover the
adsorbent surface with a monolayer of adsorbed molecules, Nm . Multiplying Nm by the
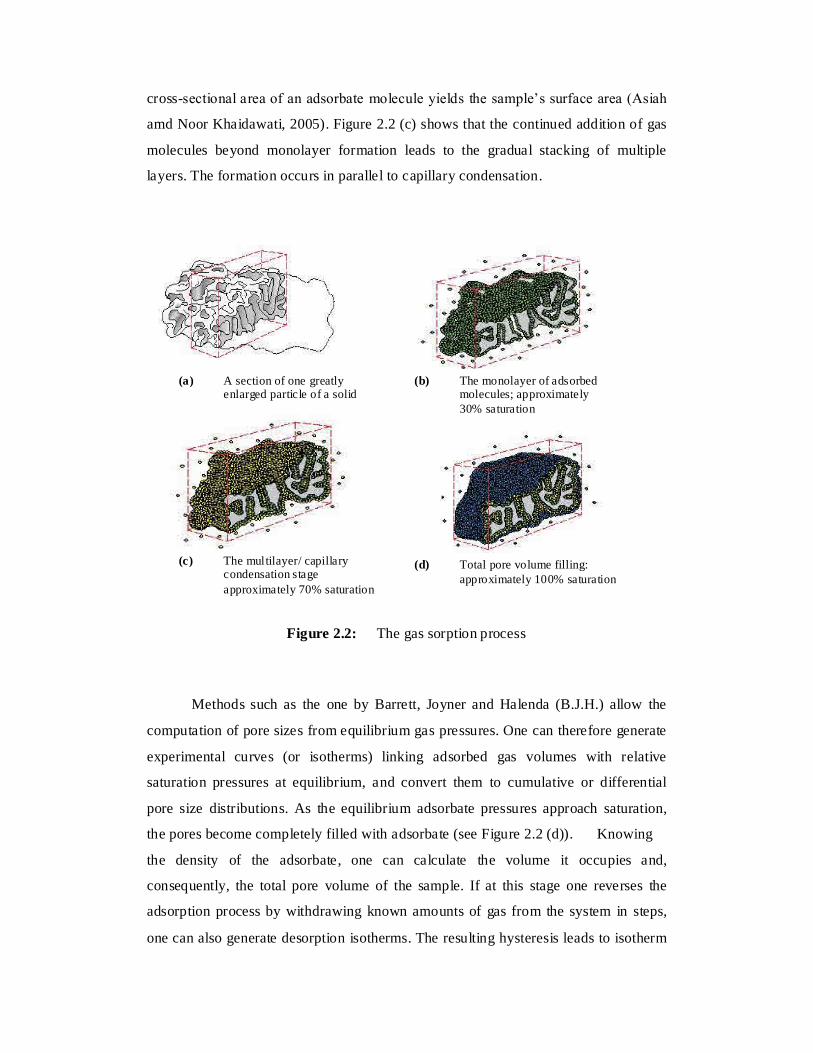
cross-sectional area of an adsorbate molecule yields the sample’s surface area (Asiah
amd Noor Khaidawati, 2005). Figure 2.2 (c) shows that the continued addition of gas
molecules beyond monolayer formation leads to the gradual stacking of multiple
layers. The formation occurs in parallel to capillary condensation.
Figure 2.2: The gas sorption process
Methods such as the one by Barrett, Joyner and Halenda (B.J.H.) allow the
computation of pore sizes from equilibrium gas pressures. One can therefore generate
experimental curves (or isotherms) linking adsorbed gas volumes with relative
saturation pressures at equilibrium, and convert them to cumulative or differential
pore size distributions. As the equilibrium adsorbate pressures approach saturation,
the pores become completely filled with adsorbate (see Figure 2.2 (d)). Knowing
the density of the adsorbate, one can calculate the volume it occupies and,
consequently, the total pore volume of the sample. If at this stage one reverses the
adsorption process by withdrawing known amounts of gas from the system in steps,
one can also generate desorption isotherms. The resulting hysteresis leads to isotherm
(a) A section of one greatly enlarged particle of a solid
(b) The monolayer of adsorbed molecules; approximately 30% saturation
(c) The multilayer/ capillary condensation stage approximately 70% saturation
(d) Total pore volume filling: approximately 100% saturation

shapes that can be mechanistically related to those expected from particular pore
shapes.
2.9.1 Adsorption Isotherms
An adsorption isotherm is the relation between the amount of gas adsorbed on
a given surface at constant temperature and the pressure of the gas in equilibrium with
it. The shape of adsorption isotherm reflects the adsorbent surface structure.
According to the BDDT classification proposed by Brunauer, Deming,
Deming and Teller, there are five types isotherm shapes namely Type I, II, III, IV and
V. The sixth isotherm, Type VI shape was discovered later. All six typical types of
isotherm are illustrated in Figure 2.3.
Type I isotherms exhibit prominent adsorption at low relative pressures and
then level off. It is usually considered to be indicative adsorption in micropores or
monolayer adsorption due to adsorbate-adsorbent interactions. Type II and III
isotherms refer the formation of multilayer on many macroporous solid in such a
manner that the amount adsorbed gas increase gradually as the relative pressure
increase. Type II and III were differentiate depending on the surface properties given
solid. There maybe a pronounced stage of monolayer formation (Type II) that has
monolayer coverage. Type III can be observed when lateral interaction between
adsorbed molecules is strong in comparison to interaction between adsorbent surface
and adsorbate due to incomplete monolayer coverage (Hussain, and Mohd Saiyudin,
2005).

Figure 2.3: Types of BDDT physisorption isotherm
In Type IV and V isotherms, hysteresis loops are observed. The hysteresis
loop indicates the presence of mesopores in the adsorbent. Type IV isotherm signifies
a mesoporous material while Type V signifies a mixture of mesopores and
macropores. Type VI isotherm indicates that the adsorbent surface contains few
groups of energetically uniform sites. The stepped isotherm is the result of stepwise
multilayer adsorption of gas molecules. However this behavior in rather rare in the
study of activated carbon.

2.9.2 Brunauer, Emmett and Teller (BET) Surface Area
The data of nitrogen adsorption is very useful in the determination of the
Brunauer, Emmett and Teller (BET) Surface Area (SBET) of the sample. The graph of
the adsorption data is plotted using BET equation (Eq.2.10).
00
)1(1)( P
PCV
CCVPPV
Pmm
(Eq.2.10)
where;
P = equilibrium pressure of nitrogen gas
P0 = saturation pressure of nitrogen gas
V = volume of nitrogen adsorbed at pressure P
Vm = volume adsorbed when the entire surface is covered with monolayer of
nitrogen molecules
C = BET constant
A plot of P/ V(P0-P) against P/P0 will result in a straight line. By using the
value of the slope (s) and intercept (i), we can calculate the value of Vm, using Eq.2.11
isVm
1
(Eq.2.11)
The value of Vm can then be used to calculate the value of BET surface area
(SBET), Eq.2.12
0
22414NA
VS m
mBET (Eq.2.12)

where;
Am = average area of one adsorbate molecule in the complete monolayer
N0 = Avogardo number
When nitrogen is used as adsorbate, the value of Am is 16.2 x 10⁻²⁰ m2. By
substituting the value of Am and N0 into Eq.2.12, we can get a simplif ied equation,
Eq.2.13, which can be used to determine the BET surface area of the sample.
mBET VS 35.4 (Eq.2.13)
2.9.3 The t-plot
To determine the micropore volume and micropore surface area, the method of
t-plot is frequently used. In t-plot analysis method, the quantity of nitrogen adsorbed
is plotted against the statistical thickness of the adsorbed film, t. Harkins- Jura
equation (Eq.2.14) is used to produce the t- plot.
t (Å)2/1
0/log0340.099.13
PP
(Eq.2.14)
The intercept, i, of the t-plot graph can be converted to liquid volume to give
the micropore volume, VMP (Eq.2.15). The constant 0.001547 tells the conversion
factor of nitrogen gas volume to liquid.
)(001547.0 13 gcmiVMP (Eq.2.15)

The gradient, s, of the straight line within the range of 3.5-6.0 Å gives the
external surface area, Sext (Eq.2.16).
)(47.15 12 gmsSext (Eq.2.16)
The micropore surface area, SMP is the difference between SBET and Sext (Eq.2.17).
extBETMP SSS (Eq.2.17)
2.10 Thermogravimetry Analysis (TGA)
Thermogravimetry is an analytical technique in which the mass (weight) of
sample is monitored versus time or temperature while the temperature of sample is
programmed under certain atmosphere. The result of detection is presented
graphically as a plot of weight % versus time or temperature. Such plot is known as
thermogram. From the thermogram, we are able to determine the step of reaction
when sample undergoes heating, the thermal stability, the temperature at which
certain reaction takes place. In this study, TGA is important in determining the
optimum activation temperature for the production of activated carbon, and also to
ensure that the conversion of palm kernel shell to activated carbon is complete.
The essential components of the equipment used are a recording balance,
furnace, temperature programmer, sample holder, an enclosure for establishing the
required atmosphere, and a means of recording and displaying the data.
Balance sensitivity is usually around one microgram, with a total capacity of a
few hundred milligrams. A typical operating range for the furnace is ambient to
1000°C, with heating rates up to 100°C/min. The quality of the furnace atmosphere
deserves careful attention, particularly the ability to establish an inert (oxygen-free)
atmosphere, and it is useful to be able to quickly change the nature of the atmosphere.
Compatibility between the materials of construction and the sample and its
decomposition products, and the gaseous atmosphere, must be considered. Sample
holder materials commonly available include aluminium, platinum, silica, and
alumina.
Indication of the sample temperature is by a thermocouple close to the sample.
Careful calibration for temperature is important, especially for kinetic studies. Various
means are available for temperature calibration, which is not a trivial matter, though
reproducibility is often more important than absolute accuracy. Weight calibration is
readily achieved using standard weights (Heal and Haines, 2002)
Many factors influence the form of the TG curve, both sample and instrument
related, some of which are interactive. The primary factors are heating rate and
sample size, an increase in either of which tends to increase the temperature at which
sample decomposition occurs, and to decrease the resolution between successive mass
losses. The particle size of the sample material, the way in which it is packed, the
crucible shape, and the gas flow rate can also affect the progress of the reaction.
Careful attention to consistency in experimental details normally results in good
repeatability. On the other hand, studying the effect of deliberate alterations in such
factors as the heating rate can give valuable insights into the nature of the observed
reactions.
2.11 Field Emission Scanning Electron Microscopy (FESEM) and Energy
Dispersive X-ray Spectroscopy (EDX)

The Field Emission Scanning Electron Microscopy (FESEM) is a versatile,
non-destructive technique that reveals detailed information about the morphology and
particle sizes. It can produce images of sample surface up to 1000x and even 10000x
magnification (Bertin, 1975).
When the electrons are liberated from a field emission source and accelerated
in a high electrical field gradient. Within the high vacuum column these so-called
primary electrons are focused and deflected by electronic lenses to produce a narrow
scan beam that bombards the object. As a result secondary electrons are emitted from
each spot on the object. The angle and velocity of these secondary electrons relates to
the surface structure of the object (Oatley, 1972). A detector catches the secondary
electrons and produces an electronic signal. This signal is amplified and transformed
to a video scan-image that can be seen on a monitor or to a digital image that can be
saved and processed further.
Another analysis that can be carried out by emitting beams of electrons is the
Electron Dispersive X-ray analysis (EDX). It is a spectroscopic technique that enables
us to determine the main composition of a sample. In an EDX, an X-ray beam is
emitted to the surface of sample. The interaction of X-ray with the surface electrons
produces X-ray lines with different photon energies. The principal of EDX is the
separation of X-ray lines based on their photon energies (Bertin, 1975). Since the
photon energies of X-ray lines produced are characteristics of the elements, we can
determine the main composition of element in the sample.
2.12 X-ray Powder Diffraction (XRD)
X-ray powder diffraction is a non-destructive technique widely applied for the
characterization of crystalline materials. It also has been traditionally used for phase
identification, quantitative analysis and the determination of structure imperfections
X-rays are relatively short-wavelength, high-energy beams of electromagnetic
radiation (Perego, 1998) They are sufficiently energetic to penetrate solids and
suitable to probe their internal structure. XRD is the elastic scattering of x-ray photons
by atoms in periodic lattice.
XRD uses single or multiphase specimens comprising a random orientation of
small crystallites. Each crystallite in turn is made up of a regular, ordered array of
crystal lattice. An ordered arrangement of the crystal lattice contains planes of high
electron density. A monochromatic beam of X-ray photons will be scattered by these
atomic electrons and when the scattered photons interfere with each other, diffraction
will occur. Figure 2.4 illustrates diffraction of x-ray by crystal lattice. In general, one
diffracted line will occur for each unique set of plane in the lattice. In a diffraction
pattern from the crystal lattice, a number of reflections are generated, each one being
associated to a lattice plane, and occurring at an angular position (2θ), depended on
the related interplanar spacing, d and on x-ray wavelength (λ) in Bragg’s Law
(Equation 2.18)
sin2dn (n = 1,2,3..) (Eq.2.18)
Where:
n = the order of the diffracted beam
λ = wavelength of the incident X-ray beam
d = distance between 2 lattice planes
θ = angle of the incident X-ray beam

Figure 2.4: X-ray scattered by atoms in an ordered lattice interfere constructively
in direction given by Braggs Law (Richardson, 1989)
A diffraction pattern is typically in the form of a graph of diffraction angle
(interplanar) spacing against diffracted line intensity. Each of these unique patterns
can act as an empirical ‘‘fingerprint’’ for the identification of the various phases,
using pattern recognition techniques based on a file of standard single-phase patterns.
Besides that diffraction patterns also used to identify the crystallographic
phases that are presence in the sample and which are shown by a sharp and narrow
diffraction lines. Basically for the amorphous phases, XRD gives either very broad
and weak diffraction or no diffraction at while crystalline phases gave sharp and
strong lines.
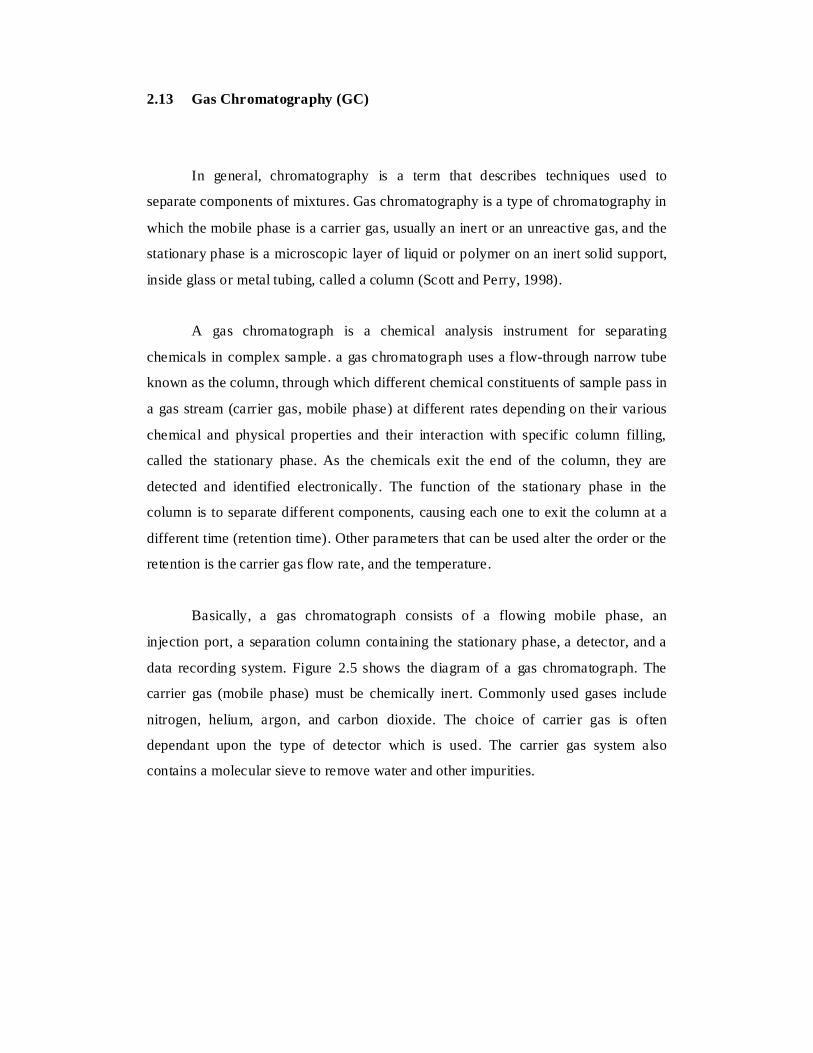
2.13 Gas Chromatography (GC)
In general, chromatography is a term that describes techniques used to
separate components of mixtures. Gas chromatography is a type of chromatography in
which the mobile phase is a carrier gas, usually an inert or an unreactive gas, and the
stationary phase is a microscopic layer of liquid or polymer on an inert solid support,
inside glass or metal tubing, called a column (Scott and Perry, 1998).
A gas chromatograph is a chemical analysis instrument for separating
chemicals in complex sample. a gas chromatograph uses a flow-through narrow tube
known as the column, through which different chemical constituents of sample pass in
a gas stream (carrier gas, mobile phase) at different rates depending on their various
chemical and physical properties and their interaction with specific column filling,
called the stationary phase. As the chemicals exit the end of the column, they are
detected and identified electronically. The function of the stationary phase in the
column is to separate different components, causing each one to exit the column at a
different time (retention time). Other parameters that can be used alter the order or the
retention is the carrier gas flow rate, and the temperature.
Basically, a gas chromatograph consists of a flowing mobile phase, an
injection port, a separation column containing the stationary phase, a detector, and a
data recording system. Figure 2.5 shows the diagram of a gas chromatograph. The
carrier gas (mobile phase) must be chemically inert. Commonly used gases include
nitrogen, helium, argon, and carbon dioxide. The choice of carrier gas is often
dependant upon the type of detector which is used. The carrier gas system also
contains a molecular sieve to remove water and other impurities.
Figure 2.5: Diagram of a gas chromatograph
The most common injection method is where a microsyringe is used to inject
sample through a rubber septum into a flash vapouriser port at the head of the column.
The temperature of the sample port is usually about 50 C higher than the boiling
point of the least volatile component of the sample.
Generally there are two types of column, packed column and capillary column.
Packed columns contain a finely divided, inert, solid support material coated with
liquid stationary phase. Most packed columns are 1.5–10 m in length and have an
internal diameter of 2–4 mm. On the other hand capillary columns have an internal
diameter of a few tenths of a millimeter.
A number of detectors are used in gas chromatograph. The most common are
the flame ionization detector (FID) and the thermal conductivity detector (TCD). Both
are sensitive to wide range of components and both work over a wide range of
concentrations. While TCDs are essentially universal and can be used to detect any
component other than carrier gas, FIDs are sensitive primarily to hydrocarbons and
are more sensitive to them than TCD. However, an FID cannot detect water. Both
detectors are quite robust. Since TCD is non-destructive, it can be operated in-series
before an FID (destructive), thus providing complementary detection of the same
eluents (Scott and Perry, 1998).
CHAPTER 3
EXPERIMENTAL
3.1 Instrumentations
The physical characterization of the prepared activated carbons and tungsten
carbide catalysts were carried out using FTIR, Nitrogen adsorption analysis, single
point BET, FESEM, TGA, XRD and EDX. The hydrodehalogenation reaction of
CFC-12 was analyzed using gas chromatography.
Fourier Transform Infrared (FTIR) analysis was done using Shimadzu 8300
spectrometer. The samples were well mixed with potassium bromide in 1:100 ratios.
and compressed under pressure of 7 tonnes for about 5 minutes in order to form a thin
transparent pallet. The FTIR spectra were recorded in a range of 4000–400 cm-1.
The adsorption isotherms and data were recorded using the Micromeritics
ASAP 2010. In the nitrogen adsorption analysis, dry gas nitrogen was flowed through
the sample. The volume of nitrogen adsorbed on the sample at 77 K was monitored
versus the gas pressure. The result was presented as an isotherm, which is a plot of
volume of gas adsorbed (Vads) versus relative pressure (P/P0). From the shape of the
isotherm, the type, shape and size of pores in the sample were determined.

The single point Brunauer-Emmet Teller (BET) surface area of the sample was
measured at 77 K using Micromeritics Pulse Chemisorb 2705. Sample was degassed
at 150ºC for an hour for eliminate impurities as well as for dehydration purpose. The
adsorption and desorption process were carried out for few times until constant values
were obtained and the specific surface area of the sample was calculated.
The thermogram was obtained using Mettler-Toledo TG50 Analyzer. The
sample was placed in a ceramic crucible in the TG analyzer. Then the sample was
heated from 40ºC with the rate of 10ºC per minutes with nitrogen gas flow to ensure
inert atmosphere.
The surface morphology and element composition of the sample was analyzed
using FESEM 6701F microscope with energy of 15.0 V couple with EDX analyzer.
The grounded sample was sputtered on aluminium stub that covered with carbon
cement tape. The stub was place into the vacuum chamber of FESEM instrument. The
morphology scanning was done in different magnification to obtain clear images.
The phase and identification of the tungsten carbide catalysts were carried out
using Bruker X-ray powder diffractometer. The XRD diffractograms were recorded
with CuKα radiation source with λ= 0.15418 nm at 40 kV and 30 mA. The 2θ range
used was from 20° to 90° at a scanning speed of 0.05 per second. The identification of
peaks is based on JCPDS-ICDD database incorporated in the software.
Gas chromatography of hydrodehalogenation of CFC was recorded using a
Hewlett Packed model 5890. Helium gas was used as the mobile phase and column
Inowax with (Polyethylene glycol) 0.25 µm thickness, 30 m length and 0.20 mm
internal diameter was used as stationary phase with flame ionized detector (FID). The
column was operated from 40ºC up to 150ºC with the rate 5ºC/min.
3.2 Chemicals

Tungsten hexacabonyl, W(CO)6 powders (98%) and commercial activated
carbon (99.9%) with molecular weight of 351.90 gmol-1 and 12.01 gmol-1 respectively
were purchased from Scharlau Chemise S.A. Zinc chloride (ZnCl2) and sodium
carbonate (Na2CO3) from MERCK were used along with concentrated hydrochloric
acid (HCl), 37% w/w and concentrated sulfuric acid (H2SO4) 99% w/w.
Dichlorodifllouromethane (CFC-12) was purchased from Zar Air-Conditioning
Engineering. Nitrogen, hydrogen and helium gases used were supplied by Malaysian
Oxygen Bhd. The palm kernel shells were obtained from Kulai palm oil mill.
3.3 Preparation of Activated Carbon
3.3.1 Preparation of Raw Material
The palm kernel shells collected from Kulai palm oil mill were washed with
tap water repeatedly to remove the impurities and dried under the sunlight. The dried
palm kernel shells were grinded using a mechanical grinder and then the particles
were sieved to selected particle sizes of 1.18-2.36 mm. The particles were soaked in
aqueous solution of 30% sulphuric acid for period of 24 hours. Finally the particles
were thoroughly washed with distilled water to remove acid and dried under sunlight
to eliminate moisture. The washing process with acid was termed as pretreatment.
3.3.2 Chemical Activation

Zinc chloride was dissolved in 100 ml of concentrated hydrochloric acid (37%
w/w) and 150 mL deionized water and then impregnated into the palm kernel shells
for the ratio of 1:1 and 2:1. The mixture was stirred and heated at 100-110ºC on a hot
plate until it is fully dried. The resulting chemically treated char was then kept in an
oven overnight for dehydration purpose. The activation was carried out in two
different conditions separately. Flow diagram for the preparation of activated carbon
is shown in Figure 3.1
Prior to activation, the tube furnace was purged with nitrogen gas flow. The
treated char was placed in a quartz tube and heated in nitrogen gas flow up to 700ºC
for 2 hours. When the process of activation accomplished, the prepared activated
carbon was undergo washing process. First, the sample was neutralized with diluted
Na2CO3 solution and deionized water in order to remove zinc chloride. Then the
samples were washed with 2N HCl solution for 12 hours under reflux with aim of
removing sulphur and some ash and washed with distilled water reflux for 6 hours.
Sample was then dehydrated in oven at 100ºC overnight. The sample obtained
labelled as AC-1Z-N and AC-2Z-N.

Figure 3.1: Flow diagram for the preparation of activated carbon.
Palm Kernel shell (100 g)
ZnCl2 (100 g) +
Concentrated HCl (100 mL) +
Deionized water (150 mL)
Heat at 100-110ºC
Dehydrate in oven overnight
Activation under a Nitrogen gas flow at temperature 700ºC
for 2 hours
Activation under vacuum condition at temperature 700ºC
for 2 hours
Wash neutralize with diluted Na2CO3
solution and deionized water, reflux 12h with 2N HCl followed by 6h reflux
with distilled water
Dehydrate in oven overnight
AC-1Z-N
Wash, dry, grind and sieve to selected particle sizes 1.18 -2.36 mm
Pretreatment Acid wash with 30% sulphuric acid
ZnCl2 (200 g) +
Concentrated HCl (100 mL) +
Deionized water (150 mL)
AC-2Z-N AC-1Z-V AC-2Z-V

As for the second activation condition about 0.5 g of treated char was placed
in a quartz tube and connected to a vacuum line system. The schematic diagram of the
vacuum line system used for activation under vacuum condition is as shown in Figure
3.2. The sample was heated at 700ºC about 2 hours under 1x 10⁻³ mbar pressure and
followed by washing process. The washing process was done in the same manner as
the preparation of AC-1Z-N and AC-2Z-N. The resulting sample labelled as AC-1Z-V
and AC-2Z-V.
Figure 3.2: Schematic diagram of vacuum line system.
3.4 Preparation of Tungsten Carbide
There are few common methods used to prepare tungsten carbide catalyst and
most used involved reaction of solid precursor, either as metal or oxide with gas phase
containing reducing agent or carbonizing agent. In this research tungsten carbide
catalyst was prepared without using any reducing agent. The catalyst was prepared

using tungsten hexacarbonyl and activated carbon as precursors. It is found to be a
suitable method to prepared high surface area catalyst (Morena-Castilla et al., 2001).
The percentage of tungsten content used for the catalyst mixture are 6 and 15
percent, whereby the weight was calculated by atomic ratio of the elements (refer
Appendix 1.0). Table 3.1 shows the notation for tungsten carbide catalyst produced.
Table 3.1: Notation for tungsten carbide catalyst produced.
Notation Type of carbon Tungsten content (%)
Temperature of heat
treatment ACN-6-700 AC-1Z-N 6 700
ACN-15-700 AC-1Z-N 15 700
ACV-6-700 AC-1Z-V 6 700
ACV-15-700 AC-1Z-V 15 700
ACN-6-950 AC-1Z-N 6 950
ACN-15-950 AC-1Z-N 15 950
ACV-6-950 AC-1Z-V 6 950
ACV-15-950 AC-1Z-V 15 950
In preparing the catalyst, tungsten hexacarbonyl powder was mixed with the
appropriate amount of activated carbon. The prepared sample was put together with
stainless steel balls (20mm in diameter) in a stainless steel container, and sealed under
argon atmosphere. This closed container mechanically rotated for about 2 hours using
high energy ball mill, Fritsch Pulverisette 6 at a rotation speed of 200 rpm to force the
carbonyl to sublime evenly onto the activated carbon.
Finally the catalyst was heated in a tube furnace. Prior to heat treatment, the
furnace was purged with Helium gas to ensure the system is in inert condition. The
sample was placed in a porcelain boat and an open ended quartz tube was used to
support the sample boat in the furnace. The sample was heated in Helium gas flow at

700 and 950ºC at the heating rate 10ºC/min for period of 4 hours. Figure 3.3 shows
the schematic set-up used for heat-treatment of tungsten carbide catalyst.
Figure 3.3: Schematic set-up used for heat-treatment of tungsten carbide catalyst.
3.5 Sample Characterization
3.5.1 Characterization of Activated Carbon
All the activated carbon samples were characterized using Fourier
transform infrared (FTIR), single point BET surface area analysis,
nitrogen adsorption analysis, Thermogravimetry analysis, (TGA), Field
Emission Scanning Electron Microscopy (FESEM) and Energy Dispersive X-ray
analysis (EDX).
Sample’s boat
Quartz tube
Tube furnace
Adapter
Gas inlet Valve
Gas outlet

3.5.2 Characterization of Tungsten Carbide
Prepared catalysts were studied by various characterization techniques in order
to learn about the physical properties. The outcome will be useful to determine the
catalyst performance and potential in hydrodehalogenation catalytic reaction. All the
tungsten carbide catalysts were characterized using X-ray diffraction, Field Emission
Scanning Electron Microscopy (FESEM), and single point BET surface area analysis.
3.6 Catalytic Testing–Hydrodehalogenation reaction of
dichlorodifluoromethane
Prior to the catalytic reaction, the prepared catalyst was reduced in hydrogen
gas flow (25 cm3/min) using a tube furnace. The catalyst was heated at 400ºC at the
rate of 8 ºC/min and hold at 400ºC for 3 hours.
Then about 1 g of the reduced catalyst was placed in the glass micro reactor.
The hydrodehalogenation reaction of dichlorodifluoromethane (CFC-12) was
conducted in a glass flow system at temperature ranging from 200 to 350ºC. The
schematic set-up for the hydrodehalogenation catalytic reaction is shown in Figure
3.4. The flow of CFC-12 and hydrogen gas was metered using a flow controller at the
rate of 2.5 cm3/min and 25 cm3/min respectively.
The composition of the product evolved at the reactor outlet was collected in
gas collector and were analyzed using gas chromatography with FID detector and
inowax column.

Figure 3.4: Schematic set-up for hydrodehalogenation catalytic reaction
1
2
3
4
6
7
8 9
10
5
1- CFC-12
2- H2 gas
3- He gas
4- Flow meter
5- Mix chamber
6- valve
7- microrector
8- furnace
9- sample collector
10- GC

CHAPTER 4
RESULTS AND DISCUSSION
3.2 General
The results in this study are divided into three parts. The first being the results
of the characterization of activated carbon followed by the characterization of
tungsten carbide catalyst. The last part is on the catalytic testing of tungsten carbide
catalyst for the hydrodehalogenation of dichlorodifluoromethane (CCl2F2, CFC-12).
4.2 Characterization of activated carbons
Four types of activated carbon were prepared from palm kernel shell by
chemical activation using ZnCl2 under both nitrogen and vacuum conditions. The
activation process was carried out at different impregnation ratio (i.e.ZnCl2 to palm
kernel shell mass ratio). The activated carbons prepared were labelled as in Table 4.1.

Table 4.1: Sample notation for activated carbon
Notation Description
com-AC Commercial activated carbon
AC-1Z-N Activated under nitrogen flow with impregnation ratio of 1:1
AC-2Z-N Activated under nitrogen flow with impregnation ratio of 2:1
AC-1Z-V Activated under vacuum condition with impregnation ratio of 1:1
AC-2Z-V Activated under vacuum condition with impregnation ratio of 2:1
4.2.1 Fourier transform infrared spectroscopy
Analysis using FTIR helps to identify the presence of functional groups in the
raw palm kernel shell and the activated carbon. This technique provides information
on the effect of the activation process that has been carried out and also provides
evidence of the phase transformation occurred after the activation.
Figure 4.1 shows the spectra of raw palm kernel shell (raw-PKS), commercial
activated carbon (com-AC), and samples activated in vacuum condition, AC-1Z-V
and AC-2Z-V. Figure 4.2 shows the raw-PKS and com-AC spectra along with
samples activated in nitrogen gas flow, AC-1Z-N and AC-2Z-N.
From the combined spectra on both Figure 4.1 and 4.2, it can be observed that
the FTIR spectrum of raw-PKS shows many peaks belonging to different functional
groups. This spectrum is quite similar to that of pistachio-nut (Lua and Yang, 2005),
which is a type of lignocellulosic material. Linocellulosic materials are biomass
composed primarily of lignin and cellulose. Agricultural residues such as palm kernel
shell, trees and grasses are examples of lignocellulosic biomass.

Figure 4.1: FTIR spectra of raw palm kernel shell, commercial activated carbon
and samples activated in vacuum condition
%T
com-AC
AC-2Z-V
AC-1Z-V
raw-PKS
4000.0 3000 2000 1500 1000 500 400.0 cm-1

Figure 4.2: FTIR spectra of raw palm kernel shell, commercial activated carbon
and samples activated in nitrogen flow
In the raw-PKS spectrum the strong peak appeared at 3428 cm-1and is related
to the hydroxyl group. Usually, the location of the hydrogen-bonded OH groups in the
range of 3200-3650 cm-1 is assigned to alcohols and phenols (Stuart, 2004.). The band
located at 2920 cm-1 corresponds to the C-H sp3 stretching in the methyl and
methylene groups. This band is contrary to C-H vibrations bands for –CH3─ and
%T
raw-PKS
com-AC
AC-1Z-N
AC-2Z-N
4000.0 3000 2000 1500 1000 500 400.0
cm-1

─CH2=, which are located around 1379 cm-1 and 1465 cm-1, and is very useful in
identifying the methyl and methylene groups. While the presence of weak band at
2130 cm-1 is attributed to C≡C vibrations in the alkyne groups. Another peak is
observed at 1735 cm-1 which represents the stretching of (C=O) carbonyl groups. The
raw-PKS spectrum also reveals a band at 1609 cm-1, 1515 cm-1 and 1427 cm-1
corresponding to the stretching of C=C in aromatic compounds. A peak at 1250 cm-1
and a subsequent small rise at 1165 cm-1 could be assigned to the stretching of C-O in
esters, ethers or phenol groups. A small shoulder at 1110 cm-1 and a relatively intense
band at 1035 cm-1 could be attributed to the (R-OH) alcohol groups. From the
analysis, it can be suggested that the main oxygen groups present in the raw-PKS are
carbonyl groups, ethers, esters, alcohols and the phenol groups.
Unlike the spectrum showed by raw-PKS, spectra for all the prepared
activated carbons, AC-1Z-V, AC-2Z-V, AC-1Z-N and AC-2Z-N illustrate less
adsorption peaks. During the carbonization process most of the functional group
elements were removed by pyrolytic decomposition of the raw-PKS, and the
carbonized product was formed, having a structure more or less disordered elementary
graphite- like crystallites with poorly developed porous structure. During the
activation process the spaces between elementary crystallites become cleared of less
organized carbonaceous compounds and at the same time, carbon is also removed
(Mowla et al., 2003). In addition, acid washing would result in the decomposition of
some carbonyl groups and the subsequent release of their by-products as volatile
matter, remaining activated carbon with different properties then the parent biomass
material (Lua and Yang, 2005).
Basically all the samples showed weak and broad peaks around 3350–3450
cm-1 belonging to the hydroxyl groups. The intensity of the peak decreases with the
formation of activated carbon, suggesting the expecting loss of hydroxyl groups
through volatilization during the activation process. Although the samples were
prepared with different chemical ratio in nitrogen gas flow and vacuum condition
there was a similarity in the absorption patterns.
Both figures show apparent decrease in the broad C─ O peak around 1000-
1300 cm-1and C=C adsorption band around 1500-1650 cm-1. This is another evidence

of functionality loss in activated carbon samples. The spectra for prepared activated
carbon and commercial activated carbon showed a great similarity. Table 4.2
summarized the vibration wave number data incorporating functional groups from the
FTIR spectrum of raw-PKS.
Table 4.2: Vibration wavenumber and functional groups of the samples.
Sample Peak (cm-1) Functional group raw-PKS 3428 O─H stretching
2920 C─H (sp3) stretching 2130 C≡C stretching 1735 C=O stretching 1609, 1515and 1427 C=C stretching (aromatic) 1379 and 1465 C─H bending (-CH3 and -CH2)
1250and 1165 C─ O Stretching
(esters, ethers or phenol groups) 1110 and 1035 C─ O stretching (alcohol groups)
897, 851, 770 and 607 C─H out of plane bending in
benzene derivative AC-1Z-V 3368 O─H stretching AC-2Z-V 3373 O─H stretching AC-1Z-N 3412 O─H stretching AC-2Z-N 3379 O─H stretching
4.2.2 Nitrogen adsorption analysis
Nitrogen adsorption analysis was carried out to study the effect of
impregnation ratio (ZnCl2 to palm kernel shell) and the activation condition on the
texture of activated carbon. The textural properties of the all prepared activated
carbon namely AC-1Z-N, AC-1Z-V, AC-2Z-N and AC-2Z-V were measured using
Micrometric ASAP 2010 apparatus by means of nitrogen adsorption at 77 K. From
the analysis, the BET single point surface area of all the prepared activated carbons
was determined. The BDDT adsorption isotherm and pore size distribution plot were
used to evaluate the porosity of the activated carbon. In addition, empirical t-plot was
applied to nitrogen adsorption isotherms to obtained more information about the pore

texture.
4.2.2.1 Single point BET surface area
The single point BET surface area analysis at temperature of 77 K was
performed to determine the surface area. All the data collected, including the raw-
PKS are presented in the form of a bar chart in Figure 4.3.
179
1
714
878
500
0
200
400
600
800
1000
Raw
-PK
S
AC
-1Z
-N
AC
-2Z
-N
AC
-1Z
-V
AC
-2Z
-V
Sample
Sin
gle
Poi
nt S
urfa
ce A
rea
(m2 g-1
)
Figure 4.3: Single point BET surface area of raw-PKS and prepared activated
carbons.
The result showed that initially the surface area of the raw-PKS is 1 m2g-1.
However after the activation process the surface area of all the activated carbons
increased drastically and exhibited extensively higher surface area than the raw-PKS.
The highest surface area was obtained in AC-1Z-N with 878 m2g-1 followed by AC-
1Z-V with 714 m2g-1. The AC-2Z-N exhibits moderate surface area of 500 m2g-1.
Among the prepared activated carbon AC-2Z-V has the lowest surface area of 179
m2g-1, which is not in the range of activated carbon surface area. Typically, the
surface area of an activated carbon ranged from 400 – 1500 m2g-1 (Knozinger et al.,

1999).
From the results obtained, the activated carbon prepared with impregnation
ratio (ZnCl2 to palm kernel shell) of 1:1 gave significantly higher surface area. These
results strongly suggests that the chemical activating agent ZnCl2 has contributed to
the increase in the surface area by creating new pores and enlarge the diameter of
existing pores. However, the surface area of the activated carbon decreases when the
impregnation ratio increases to 2:1. When the chemical ratio increases the strong
inhibition of tar formation by ZnCl2 chemical promotes substantial release of volatiles
from the carbon structure and contributes to substantial increase in widening of pores.
Therefore, the creation of larger pores becomes more dominant resulting in a decrease
in microporosity which resulted in the low surface area. (Suhas et al., 2007; Lua and
Yang 2005).
Besides the impregnation ratio, the activation condition also plays an
important role in the preparation of activated carbon. In this study the carbon
activated in nitrogen flow (AC-1Z-N and AC-2Z-N) have considerably higher surface
area. This result suggests that the volatiles were quickly removed away from the pores
and the sample surface under nitrogen flow (300 cm3min-1), thereby reducing the
possibility of volatile deposition on the pores and sample surface which will otherwise
clog the pores and reduce the surface area (Lua et al., 2000).
The above findings lead to the conclusion that the impregnation ratio and the
activation condition have a notable influence on the process yield. However, the
single point BET surface area should not be taken as the only parameter to evaluate
the physical properties of activated carbon. Thus, the pore texture of all the prepared
activated carbons was further studied.
4.2.2.2 BDDT Isotherms and Pore Size Distribution
Nitrogen adsorption analysis is also known as pore texture analysis. It gives a

complete physical characterization including the surface area, type of pore, pore
volume and diameter of pores. Hence, in this study all the prepared activated carbon
samples were sent for nitrogen adsorption analysis. By using the data of nitrogen
adsorption, the BDDT isotherms and pore size distribution graphs were plotted. The
shape of BDDT isotherm can provide qualitative information on the adsorption
process and the extent of the surface area available to the adsorbate.
The BDDT isotherms for the activated carbon prepared in nitrogen gas flow
and vacuum condition with different chemical ratios are displayed in Figure 4.4 and
4.6. The amount of nitrogen adsorbed was plotted against the relative pressure, P/P0
of nitrogen where P is vapor pressure and P0 is saturated vapor pressure. Referring to
Figure 4.4 it is obvious that the BDDT isotherms of AC-1Z-N and AC-1Z-V are very
similar in shape. These are type I isotherm, which represent microporous solid,
according to IUPAC classification. The isotherms exhibit a pronounced increase in
the volume of nitrogen adsorbed for low relative pressure and a weak increase at
higher relative pressure, almost horizontal plateau indicating the dominant presence of
micropores in the samples (Asiah and Noor Khaidawati, 2005). In both isotherms of
AC-1Z-N and AC-1Z-V a very narrow hysteresis loop can be observed at relative
pressure higher than 0.4, indicating the presence of mesopores. Thus, small amount of
mesopores is believed to be present and this statement is supported by the pore size
distribution plot.

Figure 4.4: BDDT isotherm of AC-1Z-N and AC-1Z-V.
The pore size distribution plots of AC-1Z-N and AC-1Z-V are shown in
Figure 4.5 and 4.6. The general trend of pore size distribution graph is similar under
both nitrogen flow and vacuum condition. Referring to Figure 4.5, there is a small
shoulder at a pore diameter of 120 Å implying that small amount of mesopores might
be present in AC-1Z-N. While, for AC-1Z-V two shoulder type of peaks observed in
the mesopores region. A small shoulder occurred at 120 Å another shoulder at 38 Å.
As the pore diameter decrease to 20 Å, the graphs tend to increase sharply. This
indicates the presence of micropores. It can thus be suggested that activated carbons
prepared with impregnation ratio of 1:1 in nitrogen flow and vacuum condition are
microporous material that contain a very small amount of mesopores.

Figure 4.5: Pore size distribution graph of AC-1Z-N.
Figure 4.6: Pore size distribution graph of AC-1Z-V

On the other hand, when the impregnation ratio increases to 2:1, the BDDT
isotherms begin to change considerably. Figure 4.7 shows the BDDT isotherms of
AC-2Z-N and AC-2Z-V. It can be seen clearly that the isotherms are also type I
isotherms similar to AC-1Z-N and AC-1Z-V. The isotherms exhibit the high uptake of
nitrogen gas at low relative pressure. However the widening of hysteresis loop
becomes obvious in BDDT isotherms of AC-2Z-N and AC-2Z-V. The presence of
hysteresis loop at relative pressure higher than 0.4 indicates the formation of
mesopores. In the BDDT isotherm of AC-2Z-N it was found that the hysteresis loop
does not close up at relative pressure of 0.4, but expands to low pressure of 0.15. The
hysteresis loop which occurs at relative pressure less than 0.4 is defined as low
pressure loop (LPH). This phenomenon is due to the swelling of activated carbon
particles during the adsorption process. The swelling distorts the structure of activated
carbon by prising apart weak junctions and open up cavities which were previously
inaccessible to adsorbate molecules. Since the distortion is not elastic, some
molecules become trapped and can escape very slowly or possibly not at all during the
desorption process (Figueiredo and Moulijn, 2005)
The fact that mesopores are present in AC-2Z-N and AC-2Z-V is supported by
pore size distribution. Figure 4.8and 4.9 present the pore size distribution graph for
AC-2Z-N and AC-2Z-V. In the pore size distribution graph of AC-2Z-N a sharp peak
is observed at 35 Å and a small shoulder around 48 Å. Whereas, For AC-2Z-V
besides a sharp peak at 35 Å, there are 2 extra broad peaks are observed at 120 Å and
210 Å. This indicated that different size of mesopores is presence in the samples. The
occurrence of mesopores peaks confirm to the presence of hysteresis loop at high
pressure in nitrogen adsorption. As the pore diameter decrease to 20 Å the graphs tend
to increase sharply, which signifies the presence of micropores. These results show
that AC-2Z-N and AC-2Z-V contain both mesopores and micropores.

Figure 4.7: BDDT isotherm of AC-2Z-N and AC-2Z-V

Figure 4.8: Pore size distribution graph of AC-2Z-N
Figure 4.9: Pore size distribution graph of AC-2Z-V

From the above discussion above, it can be suggested that the impregnation
ratio plays a fairly important role in the formation of mesopores which is parallel to
the observation of opening of the hysteresis loop (Figure 4.7). In addition, the
activation condition influences the adsorption capacity of resulting activated carbon.
The amount of adsorbed nitrogen is indicative of the adsorption capacity of activated
carbon. In general, From BDDT isotherms it can be suggested that the activated
carbons prepared in nitrogen flow possess higher adsorption capacity compare to
vacuum activation. This is most probably due to in the vacuum condition; reduce
pressure results in a decrease in temperature. Hence, the sample temperature would
lower than 700ºC set for the furnace. A lower temperature would mean reduced
release of volatiles, giving a weak pore formation, resulting low adsorption capacity
(Lua and Yang 2005).
4.2.2.3 The t-plot
The t-plot of Harkin-Jura is one of the empirical methods used to compare
experimental isotherm with the standard obtained on suitable nonporous reference
solid (Asiah and Noor Khaidawati, 2005). In this study, Harkin-Jura equation and
nitrogen adsorption data were used to produce the t-plot (refer Appendix 6.0 to
Appendix 9.0). The gradient of the straight line gives the external surface area, Sex,
whereas the intercept gives micropore volume. The micropore surface area was
calculated by subtracting the external surface area from the total BET surface area.
The data for all the prepared activated carbons were tabulated in Table 4.3. From the
table, it can be seen that the activated carbons prepared with impregnation ratio of 1:1
in both nitrogen atmosphere and vacuum condition (AC-1Z-N and AC-1Z-V) have
average pore diameter 1.95 nm and 1.92 nm respectively. Typically micropores are
pores with diameter range between 1 to 20 nm (Marsh and Rodriguez-Reinoso, 2006).
This shows that majority of the pores in these activated carbon structure are
micropores. This statement is supported by the BDDT isotherm (Figure 4.4), where
the both isotherms of AC-1Z-N and AC-1Z-V are of type I isotherm.

Table 4.3: Surface area and pore volume of activated carbon
Sample AC-1Z-N AC-1Z-V AC-2Z-N AC-2Z-V
BET surface area, SBET (m2g-1) 884 699 486 181
Average pore diameter (nm)
1.95 1.92 2.02 2.04
Micropore volume, VMP (cm3g-1) 0.36 0.28 0.19 0.05
Micropore surface area, SMP (m2g-1)
786 585 405 119
External surface area, Sex (m2g-1) 98 114 81 62
Note: SMP = SBET ─ SEXT
On the other hand, the pore diameter for AC-2Z-N and AC-2Z-V increase to
2.02 nm and 2.04 nm respectively, indicate the presence of mesopores. This is most
probably when the impregnation ratio of 1:1; the initial weak inhibition of tar
formation by ZnCl2 influence the release of volatiles to produces predominantly
micropores in the carbon structure, with limited development of mesopores or
macropores. However, when the ratio increases to 2, strong inhibition of tar formation
by the ZnCl2 chemical promotes substantial release of volatile from carbon structure.
This then contributed to the increase in the pore widening. The micropores can be
subsequently converted to mesopores and even macropores (Mohanty et al., 2005).
Therefore, increasing the impregnation ratio in nitrogen flow and vacuum condition
resulted in reduced micropore volume. It can be observed that the AC-1Z-N has 0.36
cm3g-1, whereas the micropore volume decreased to 0.28 cm3g-1 in AC-2Z-N.
This result is supported by the value of micropore surface area and the external
surface area. The micropore surface area of AC-1Z-N and AC-1Z-V is higher than
their external surface area. This implies that the high surface area of in AC-1Z-N and
AC-1Z-V is probably contributed mainly by micropores. While for AC-2Z-V, which
has lowest BET surface area of 181 m2g-1, shows that more than one third of the total
BET surface area is contributed by the external surface area.(62 m2g-1). This indicated
that even though micropores are present, they are possibly present in small amount
and their contributions are comparatively small. This result is in agreement with the

BDDT isotherms where the opening of hysteresis loop implies the presence of
mesopores in the activated carbons prepared with the impregnation ratio of 2:1.
In summary, the activated carbon prepared in nitrogen flow with the
impregnation ratio of 1:1 produced high surface area micropores carbon. As the
activated carbons prepared in this study are intended for gas phase reaction, the
presence of microporosity is critical. Hence, AC-1Z-N, AC-1Z-V and AC-2Z-N were
selected for further analysis.
4.2.3 FESEM analysis of activated carbons.
The FESEM analysis was employed to study the surface morphology and the
porosity of the activated carbon. The FESEM micrographs also provide information
on the structural changes in the palm kernel shell anatomy during the activation
process.
Figure 4.10 shows the micrograph of raw-PKS. The surface of raw-PKS is
dense and planar without any cracks and crevices. This would account for its poor or
negligible BET surface area (Figure 4.3). The wood-grain could be seen clearly on the
surface since oil palm shell is a typical type of lignocellulosic materials.
Figure 4.11 shows the micrograph of AC-1Z-N at 150x magnification. In
contrast, for the AC-1Z-N, there were no more lignocellulosic structures on surface
but many cavities over the surface, forming a system of advanced pore network. The
frame work development was so rapid, resulting in too much cavities and leads to
crack formation. Due to this well developed pores, the AC-1Z-N possessed high BET
surface area ((Figure 4.3). Figure 4.12 shows the micrograph of AC-1Z-N at higher
magnification 7500x. The micrograph magnifies the internal cavities which are now
clearly visible. Direct measurement from the micrograph shows that the average pore
diameter is 1μm. The surface of the AC-1Z-N seems to be clearer and smoother than

raw-PKS surface due to the removal of volatile compounds and impurities during the
activation process and followed by hydrochloric acid –wash.
Figure 4.10: Micrograph of raw-PKS with magnification of 500x
Figure 4.13 shows the micrograph of AC-1Z-V with magnif ication of 150x.
Cavities with different size and different shape could be observed. It can bee seen that
there were more solidified areas in appearance compare to AC-1Z-N where the
surface is full of cavities. At higher magnification (Figure 4.14) the presences of
internal cavities can be observed. It can also be seen that some small white particles
are scattered on the surface of the carbon, probably due to the presence of remaining
ZnCl2 residues or some other impurities.
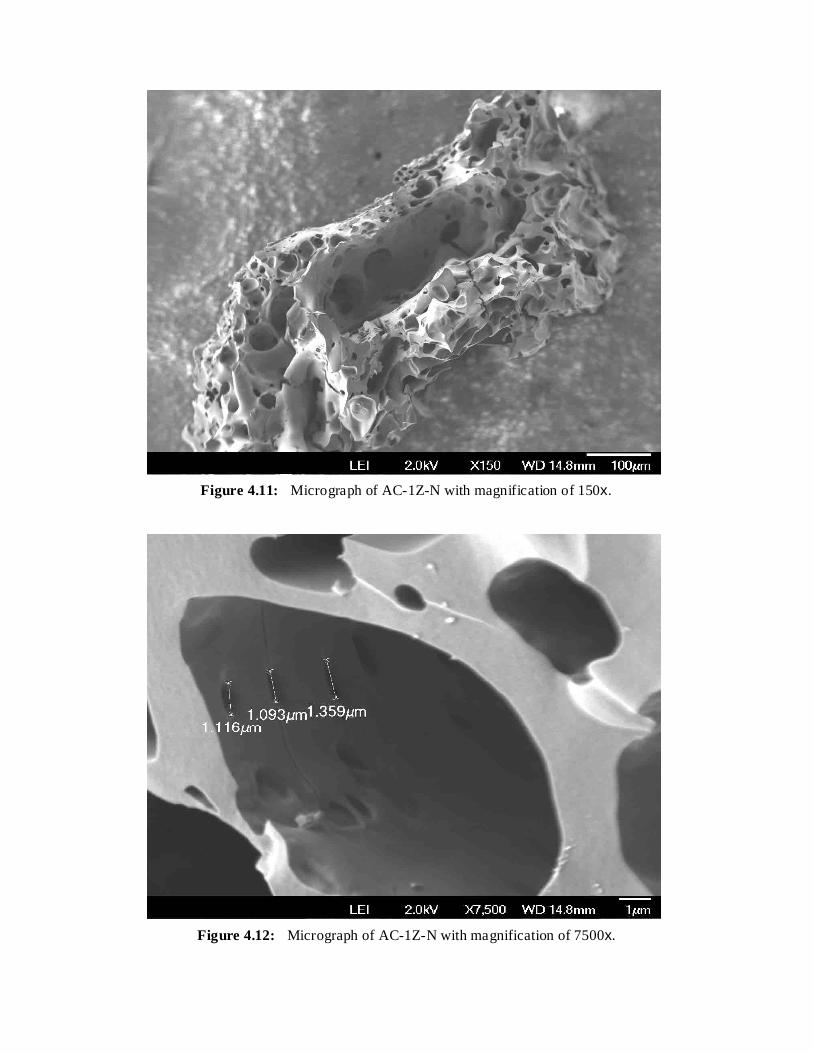
Figure 4.11: Micrograph of AC-1Z-N with magnification of 150x.
Figure 4.12: Micrograph of AC-1Z-N with magnification of 7500x.

Figure 4.13: Micrograph of AC-1Z-Vwith magnification of 150x.
Figure 4.14: Micrograph of AC-1Z-V with magnification of 500x.

Figure 4.15 and 4.16 present the FESEM micrograph of AC-2Z-N at different
magnification. Unlike the previous activated carbons (Figure 4.11and 4.13), when the
impregnation ratio increase, the solid surface of palm kernel shell has transformed to
less dense and uneven textures with bigger cavities, resembling a mixture of wood
shavings. The formation of pores in activated carbons resulted from the evaporation of
ZnCl2 during activation, leaving the space previously occupied by the ZnCl2. As the
impregnation ratio increased to 2, the intense release of volatile from carbon structure
contributes to substantial increase in the widening of the pores. This finding is parallel
to the micropore surface area obtained earlier in subtopic 4.2.2.3. The result showed
that the micropore surface area had decreased when the impregnation ratio increases
to 2.
Figure 4.15: Micrograph of AC-2Z-N with magnification of 200x

Figure 4.16: Micrograph of AC-2Z-N with magnification of 350x.
4.2.4 Energy Dispersive X-ray analysis (EDX)
Energy Dispersive X-ray (EDX) analysis was carried out during on the surface
of activated carbons. The value or the data obtained with EDX analysis is only a
rough estimation of the surface elemental composition. It should not be regarded as an
absolute composition of the activated carbon.
The surface composition of three activated carbon samples namely AC-1Z-N,
AC-1Z-V and AC-2Z-N, are tabulated in Table 4.4. Among the three samples, AC-
1Z-N showed the highest percentage of carbon, 97.23% followed by AC-2Z-N and
AC-1Z-V. The presence of zinc and chlorine elements was detected in all the samples,
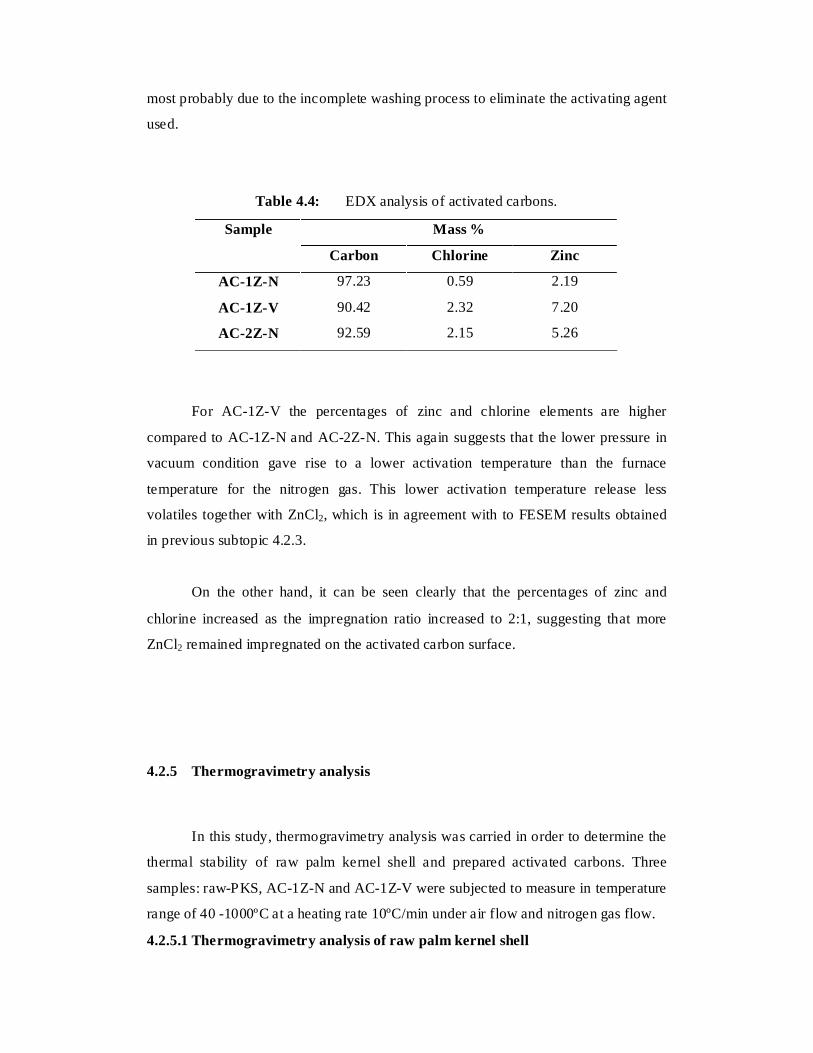
most probably due to the incomplete washing process to eliminate the activating agent
used.
Table 4.4: EDX analysis of activated carbons.
Mass % Sample
Carbon Chlorine Zinc
AC-1Z-N 97.23 0.59 2.19
AC-1Z-V 90.42 2.32 7.20
AC-2Z-N 92.59 2.15 5.26
For AC-1Z-V the percentages of zinc and chlorine elements are higher
compared to AC-1Z-N and AC-2Z-N. This again suggests that the lower pressure in
vacuum condition gave rise to a lower activation temperature than the furnace
temperature for the nitrogen gas. This lower activation temperature release less
volatiles together with ZnCl2, which is in agreement with to FESEM results obtained
in previous subtopic 4.2.3.
On the other hand, it can be seen clearly that the percentages of zinc and
chlorine increased as the impregnation ratio increased to 2:1, suggesting that more
ZnCl2 remained impregnated on the activated carbon surface.
4.2.5 Thermogravimetry analysis
In this study, thermogravimetry analysis was carried in order to determine the
thermal stability of raw palm kernel shell and prepared activated carbons. Three
samples: raw-PKS, AC-1Z-N and AC-1Z-V were subjected to measure in temperature
range of 40 -1000ºC at a heating rate 10ºC/min under air flow and nitrogen gas flow.
4.2.5.1 Thermogravimetry analysis of raw palm kernel shell

The TGA of raw palm kernel shell (raw-PKS) was conducted in air flow with
the temperature range of 40 - 850ºC. Figure 4.17 shows three stages of thermal
decomposition behavior of raw-PKS. The first stage range from 40 - 200ºC, presents
15% weight loss due to the moisture release.
Figure 4.17: TGA/DTG curves of raw-PKS
In the temperature range of 200 - 500ºC, a weight loss of 55% is observed.
Such weight loss is attributed to the decomposition or oxidation of the organic
compounds such as lignin and cellulose in the raw-PKS. Naturally palm kernel shell
contains about 30% of cellulose, 47% of halocellulose and 53% of lignin (Daud and
Ali, 2004).
On the other hand, there are no significant changes in weight when the sample
was heated above 500ºC. It is believed that the organic compounds in raw-PKS were
oxidized completely at 500ºC, which is typical of lignocellulosic materials (Hu et al.,
2000; 2001 and Boonamnuayvitaya et al., 2005). Therefore in this study, a

temperature of 700ºC was used as the activation temperature for the preparation of
activated carbon. The activation temperature was 200ºC higher than 500ºC to ensure
the complete decomposition of organic compounds and liberation of volatiles.
4.2.5.2 Thermogravimetry analysis of activated carbons in air flow
Figure 4.18 and 4.19 show the weight loss TG/DTG curves of AC-1Z-N and
AC-1Z-V. Generally both activated carbons exhibit similar pattern of weight loss. The
weight loss process of activated carbons may be divided into three main stages,
namely stage I, stage II and stage III. The percentage loss at each stage and their
respective temperature range are summarized in Table 4.5.
The weight loss at stage I can be assigned to the dehydration of activated
carbons. This could be explained by the hydroscopic nature of activated carbon that
adsorbs moisture from atmosphere. The weight loss of AC-1Z-N and AZ-1Z-V is
approximately 15% and 27% respectively. The results show that AC-1Z-V has higher
percentage of moisture content. This is most probably due to the presence of zinc
chloride residues in AC-1Z-V as shown in EDX results obtained in earlier subtopic
4.2.4. The presence of zinc chloride which acts as the dehydrating agent adsorbed
more water molecules in the air during the sample preparation resulted to high
moisture content.

Figure 4.18: TGA/DTG curves of AC-1Z-N in air flow.
Figure 4.19: TGA/DTG curves of AC-1Z-V in air flow.
Sample: AC-1Z-V AIR, 6.9400 mg %
0
50
°C 100 200 300 400 500 600 700 900 800
%
-20
0
20
40
60
80
100
°C 100 200 300 400 500 800 900 600 700
Sample: AC-1Z-N AIR, 10.600 mg

Table 4.5: Percentage of weight loss of AC-1Z-N and AC-1Z-V in air flow.
Weight loss (%) Activated
carbon Stage I
40-140ºC
Stage II
140-400ºC
Stage III
400-840ºC
Residue
840-1000ºC
AC-1Z-N 15 4 80 1
AC-1Z-V 27 5 59 4
On the other hand, the weight loss in stage II is ascribed to the decomposition
of low temperature volatile organic functional groups present in the activated carbon
samples. Stage II occurs within the temperature range of 140ºC to 400ºC. The weight
loss of AC-1Z-N and AC-1Z-V is approximately 4% and 5% respectively. It can be
seen that the difference in volatile matters was not distinct. Referring to the Figure
4.18 and 4.19, the weight loss was gradual and different from the raw-PKS (Figure
4.17), where a large peak appeared between 200 - 500ºC corresponding to the
decomposition of volatile organic compounds. Thus, it can be suggested that the
ZnCl2 impregnation and activation process has a significant effect on the pyrolysis
behavior of palm kernel shell.
At temperature higher than 400ºC, the weight was lost significantly, shown by
a broad peak. The evolution obviously represents the combustion of carbon in the air.
Thus, the weight loss in this stage might be a rough indication of the carbon content of
activated carbons. The weight loss in this stage is 80% and 59% for AC-1Z-N and
AC-1Z-V respectively. It was found that the raw-PKS are high in volatile matter
content and low in fixed carbon content. However, after the activation process the
volatile matter of the activated carbons has decreased whilst the carbon content
increased. The chemical activating agent, ZnCl2 causes hydrogen and oxygen atoms in
the palm kernel shell to be stripped away as water rather than as hydrocarbons or
oxygenated organic compounds. As a result, the carbon content increase. The results
also show that the carbon content in AC-1Z-N is higher than AC-1Z-V, probably due
to the lower temperature in vacuum condition.

As the temperature increase to 1000ºC, the weight of activated carbons is
almost stable. The remaining weight of the activated carbons was approximately 1%
and 4% respectively for AC-1Z-N and AC-1Z-V. This heavy remaining weight can be
explained by the presence of the unreacted activating agent impregnated during
carbonization and the inorganic constituent was left on the carbon surface irremovable
during washing process.
4.2.5.3 Thermogravimetry analysis of activated carbons in nitrogen flow
Figure 4.20 and 4.21 shows the TG and DTG curves of AC-1Z-N and AC-1Z-
V in nitrogen flow. The weight loss process was divided into two stages. The
percentage of weight loss at each stage is summarized in Table 4.6.
Figure 4.20: TGA/DTG curves of AC-1Z-N in nitrogen flow.
Sample: AC-1Z-N-N2, 9.8800 mg %
0
20
40
60
80
100 200 500 600 700 900 °C 100 200 300 400 500 600 700 800 900

Figure 4.21: TGA and DTG curves of AC-1Z-V in nitrogen flow.
The weight loss observed in stage I corresponds to the dehydration of
activated carbons. In this stage AC-1Z-N and AC-1Z-V is 18% and 30% respectively.
This result is consistent with the TGA results obtained in air flow, which has been
discussed in details in previous subtopic 4.2.5.2.
Table 4.6: Percentage of weight loss of AC-1Z-N and AC-1Z-V in nitrogen flow.
Weight loss (%)
Activated carbon Stage I
40-200ºC
Stage II
200-1000ºC
AC-1Z-N 18 7
AC-1Z-V 30 11
In the stage II, when the temperature increases up to 1000ºC, the weight loss
was gradual. The profile suggests that the weight loss in this stage can be
approximately described by the decomposition of volatile organic functional groups.
Sample: AC-1Z-V-N2, 10.2700 mg %
0
20
40
60
80
100 200 500 600 700 900 °C 100 200 400 500 600 700 800 900 300

Referring to the Figure 4.20 and 4.21 AC-1Z-N exhibited the lowest percentage of
weight loss with only 7%, whereas AC-1Z-V showed 11% of weight loss. This is as
expected activation in nitrogen flow converted more volatiles into pure carbons,
resulting in activated carbon with high thermal stability. Meanwhile, AC-1Z-V
contained large amount of organic functional groups, suggesting that conversion of
volatile matters was incomplete in vacuum condition.
4.3 Tungsten carbide catalyst
The tungsten carbide catalysts were produced using the previously prepared
activated carbon. As the catalyst in this study is intended for gas phase catalytic
reaction, the maximum possible surface area is sought. Hence, AC-1Z-N and AC-1Z-
V with high surface area were selected and used as carbon source as well as catalyst
support for the carbide catalyst.
The catalysts were prepared with two different metal content namely, 6% and
15% tungsten using tungsten hexacarbonyl as precusors. The catalysts so prepared
were heat treated at 700ºC and 950ºC in helium flow. The samples then characterized
using XRD, SEM, EDX and single point BET. The effect of tungsten content, type of
activated carbon and the temperature of heat treatment on the formation of tungsten
carbide were investigated. Notations for samples prepared are shown in Table 4.7.

Table 4.7: Notation for the samples prepared
Notation Type of carbon Tungsten content (%)
Temperature of heat
treatment (ºC) ACN-6-700 AC-1Z-N 6 700
ACN-15-700 AC-1Z-N 15 700
ACV-6-700 AC-1Z-V 6 700
ACV-15-700 AC-1Z-V 15 700
ACN-6-950 AC-1Z-N 6 950
ACN-15-950 AC-1Z-N 15 950
ACV-6-950 AC-1Z-V 6 950
ACV-15-950 AC-1Z-V 15 950
4.3.1 X-ray diffraction (XRD)
4.3.1.1 XRD analysis of tungsten carbide catalyst supported on AC-1Z-N
The chemical state of metallic compound phase was studied by XRD after the
supported catalysts were heat treated in helium flow at different temperatures. The
diffractogram patterns of AC-6-700 and AC-6-950 illustrated in Figure 4.22. The
XRD pattern of ACN-6-700 shows three major peaks of tungsten carbide, WC at 2θ
values of approximately 31.398, 35.656 and 48.229º. The minor peaks were identified
as tungsten trioxide, WO3 and tungsten semicarbide, W2C. The presence of WO3
peaks indicates that the reduction of tungsten oxide was not complete at 700ºC.
Meanwhile, the formation of W2C is possibly due to the incomplete transformation
into tungsten carbide.

When the sample was heat treated at 950ºC (ACN-6-950), the diffractogram
peaks corresponding to metallic tungsten oxide in the form of WO3 and WO2 can still
be found. However W2C and WC were the predominant phases. The main peaks of
W2C were observed at 2θ values of 34.351, 38.346, 39.521, 52.875 and 61.543º.
While the presence of WC peaks was seen at 2θ values of 31.403, 35.651 and 48.335
º. Besides the existence of the carbide and oxide, metallic tungsten was detected at
41.592 and 73.122 º of 2θ values. From the results obtained, it can be assumed that the
reduction proceed via the formation of tungsten trioxide, tungsten dioxide, tungsten,
tungsten semicarbide and tungsten carbide (Kim and Kim et al., 2004).
Figure 4.22: X-ray diffractogram of samples with 6 percent of tungsten content
supported on AC-1Z-N
20 30 40 50 60 70 80 90
Tungsten Carbide, WC Tungsten Carbide, W2C
Tungsten, W Tungsten oxide, WO3
Tungsten Oxide, WO2
Inte
nsity
(Cps
)
2-Theta- Scale
ACN-6-950
ACN-6-700

Figure 4.23 shows the diffractogram patterns of ACN-15-700 and ACN-15-
950 respectively. Similar to the previous samples, the presence of tungsten carbide,
tungsten semicarbide and tungsten oxide are also observed in ACN-15-700.
Nonetheless, the major peaks observed are still tungsten carbide.
Figure 4.23: X-ray diffractogram of samples with 15 percent of tungsten content
supported on AC-1Z-N
On the other hand, when the temperature is increased to 950ºC the tungsten
oxide phases became invisible and only a mixture of metallic tungsten carbide,
tungsten semicarbide and tungsten can be obtained. It was presumed that the tungsten
oxide was reduced by the carbon support to metallic tungsten at 950ºC and that is
20 30 40 50 60 70 80 90
Tungsten Carbide, WC
Tungsten Semicarbide, W2C Tungsten Tungsten Oxide, WO3
ACN-15-700
ACN-15-950
2-Theta- Scale
In
tens
ity (C
ps)

reacted with the carbon support yielding different carbides. The major peaks of
tungsten carbide peaks were observed at 2θ values of 31.430, 35.617, 48.252 and
64.296 º. While the 2θ values of tungsten semicarbide peaks are 34.351, 37.947,
39.323, 52.110, 61.546, 69.571 and 75.600 º.
Table 4.8 shows the relative intensity of peaks after heat treatment in helium
flow at different temperature. The formation of tungsten carbide is the highest for
ACN-15-950 followed by ACN-15-700, ACN-6-700 and ACN-6-950 with relative
intensity of 100.0, 81.9, 75.5 and 53.1 respectively. In the case of AC-6-950, the
relative intensity of tungsten carbide peaks is lower than AC-6-700 due to substantial
amount of tungsten is in the form of semicarbide. It is noteworthy that samples with
15 percent tungsten content has better formation of WC than 6 percent tungsten,
possibly due to the mobility of tungsten species increased in larger proportion when
the tungsten content increased (Alvarez-Merino et al., 2000).
Table 4.8: Relative intensity of main peaks for AC-1Z-N supported catalysts
Sample ACN-6-700 ACN-6-950 ACN-15-700 ACN-15-950
Tungsten carbide, WC
75.5 53.1 81.9 100.0
tungsten semicarbide, W2C
70.4 100.0 96.4 87.0
Tungsten oxide, WO3 100.0 43.2 61.3 -
Tungsten oxide, WO2
- 51.0 - -
Meanwhile, the intensity of tungsten oxide peaks reduced as the tungsten
content and temperature increased. From the data obtained it can be seen clearly that
ACN-6-700 forms the highest tungsten oxide with relative intensity of 100. This is in
agreement with Moreno-Castilla et al., (2001) where the formation of tungsten oxide
decrease when the tungsten content increased.

4.3.1.2 XRD analysis on tungsten carbide catalyst supported on AC-1Z-V
In this sub-topic, XRD analysis was carried out on the tungsten carbide
samples supported on AC-1Z-V. The diffractogram patterns obtained from the XRD
analysis for ACV-6-700 and ACV-6-950 are depicted in Figure 4.24. The
diffractogram shows the presence of tungsten carbide. For ACV-6-700 the WC peaks
were identified at 2θ values of 31.655, 36.207 and 48.700 º. Meanwhile, for ACV-6-
950 the WC peaks were appeared at 2θ values of 31.291, 36.214 and 48.552 º.
However, in both samples the major peaks were identified as zinc tungsten oxide
(ZnWO4) and the remaining peaks were identified as WO3.
The formation of ZnWO4 is due to the carbon source used, AC-1Z-V which is
the chemically activated carbon using ZnCl2. The presence of zinc particle is observed
from the micrograph of the activated carbon, AC-1Z-V (see Figure 4.14) as indicated
by the EDX result (Table 4.4). The zinc ions were not removed entirely during the
washing process of the activated carbon after impregnated on the surface of the
carbons.

Figure 4.24: X-ray diffractogram of samples with 6 percent of tungsten content
supported on AC-1Z-V
Figure 4.25 shows the diffractogram patterns for samples with 15 percent
tungsten content. In both samples, major peaks were identified as tungsten dioxide.
No tungsten trioxide peaks were observed, which means tungsten trioxide was reduce
to tungsten dioxide during the heat treatment. Meanwhile, minor peaks were identified
as tungsten carbide. The existence of ZnWO4 can also be seen in these samples.
ACV-6-950
20 30 40 50 60 70 80 90
Inte
nsity
(Cps
)
2-Theta- Scale
Tungsten Carbide, WC Tungsten Oxide, WO3
Zinc tungsten Oxide, ZnWO4
ACV-6-700

Figure 4.25: X-ray diffractogram of samples with 15 percent of tungsten content
supported on AC-1Z-V
The relative intensity of the main peaks is shown in Table 4.9. From the data
obtained, ACV-6-950 shows the highest tungsten carbide formation while ACV-15-
700 shows the lowest relative intensity of tungsten carbide peak. However, there is no
exact pattern observed towards the formation of WC indicates that the tungsten
content and the heat treatment temperature affected the WC formation. This can be
explained by the presence of zinc residues in the carbon source, which reacted with
tungsten and formed ZnWO4. As a result the formation of tungsten carbide is reduced
compared to the previous samples prepared from AC-1Z-N.
From the results obtained, it can be seen that the intensity of ZnWO4 peaks
reduced when the tungsten content increased. This is possibly due to the substantial
20 30 40 50 60 70 80 90
Inte
nsity
(Cps
)
2-Theta- Scale
ACV-15-950
Tungsten Carbide, WC Tungsten Oxide, WO2
Zinc tungsten Oxide, ZnWO4
ACV-15-700

amount of tungsten exists in the form of tungsten dioxide. The table clearly showed
that the 6 percent tungsten content formed tungsten trioxide, whereas 15 percent
tungsten formed tungsten dioxide. The formation of WO3 and WO2 in the case of the
AC-1Z-V supported catalysts is a function of tungsten content. The ratio of O/W
decrease as the tungsten increase and become 2.
Table 4.9: Relative intensity of main peaks for AC-1Z-V supported catalysts
Sample ACV-6-700 ACV-6-950 ACV-15-700 ACV-15-950 Tungsten carbide,
WC 36.5 58.2 32.4 42.0
Tungsten oxide,
WO3 54.4 80.3 - -
Tungsten oxide,
WO2 - - 100.0 100.0
Zinc tungsten
oxide, ZnWO4 100.0 100.0 64.6 57.5
4.3.2 Field Emission Scanning Electron Microscopy
The surface morphology of the samples was studied using Field Emission
Scanning Electron Microscopy (FESEM). In subtopic 4.3.1.1, it had been shown that
the catalyst sample supported on AC-1Z-N with 15 percent tungsten content and heat
treated at 950ºC gives better formation of tungsten carbide. While the XRD results in
previous subtopic show that the presence of Zinc tungsten oxide, ZnWO4 in all the
catalyst supported on AC-1Z-V. However, ACV-15-950 was selected to compare the
surface morphology with ACN-15-950. Figure 4.26 and 4.27 show the FESEM
micrographs of ACN-15-950 and ACV-15-950 respectively.

From the micrograph, morphology changes were observed in the structure of
catalysts as compared to the AC-1Z-N (see Figure 4.11) and AC-1Z-V (see Figure
4.13). It can be seen clearly that the tungsten species particles are well dispersed on
the surface of activated carbon. Pores which are clearly seen in activated carbon
supports (Figure 4.11 and Figure 4.13) were unnoticeable after catalyst preparation.
Figure 4.26: Micrograph of ACN-15-950 with magnification of 140x

Figure 4.27: Micrograph of ACV-15-950 with magnification of 800x
The EDX analysis was carried out on the samples. Figure 4.28 and Figure 4.29
show the EDX analysis for ACN-15-950 and ACV-15-950 respectively. From the
results, the presence of zinc peaks in ACV-15-950 is in agreement with XRD results
(see subtopic 4.3.1.2), whereby the carbon source used is chemically activated carbon
using ZnCl2. The intensity of the carbon peak it is clearly shown that the carbon from
the support dominated the surface area, meaning that the catalyst is either not
distributed evenly, or have been entered into the carbon pores due to the high surface
area and porosity.
The presence of oxygen peak in ACV-15-950 probably comes from tungsten
oxide phases, which is in agreement with XRD result (Figure4.25).The oxygen peak
in ACN-15-950 may be contributes by the water molecules or functional groups
adsorbed on the catalyst surface during the sample preparation as there is no peak of
tungsten oxide detected in the XRD analysis (Figure 4.23).
0.00 1.50 3.00 4.50 6.00 7.50 9.00 10.50 12.00 13.50 15.00
keV
WC1 Area012
0
800
1600
2400
3200
4000
4800
5600
6400
7200
Cou
nts
C
OW
W
W W W W
W
WW
Figure 4.28: EDX of ACN-15-950
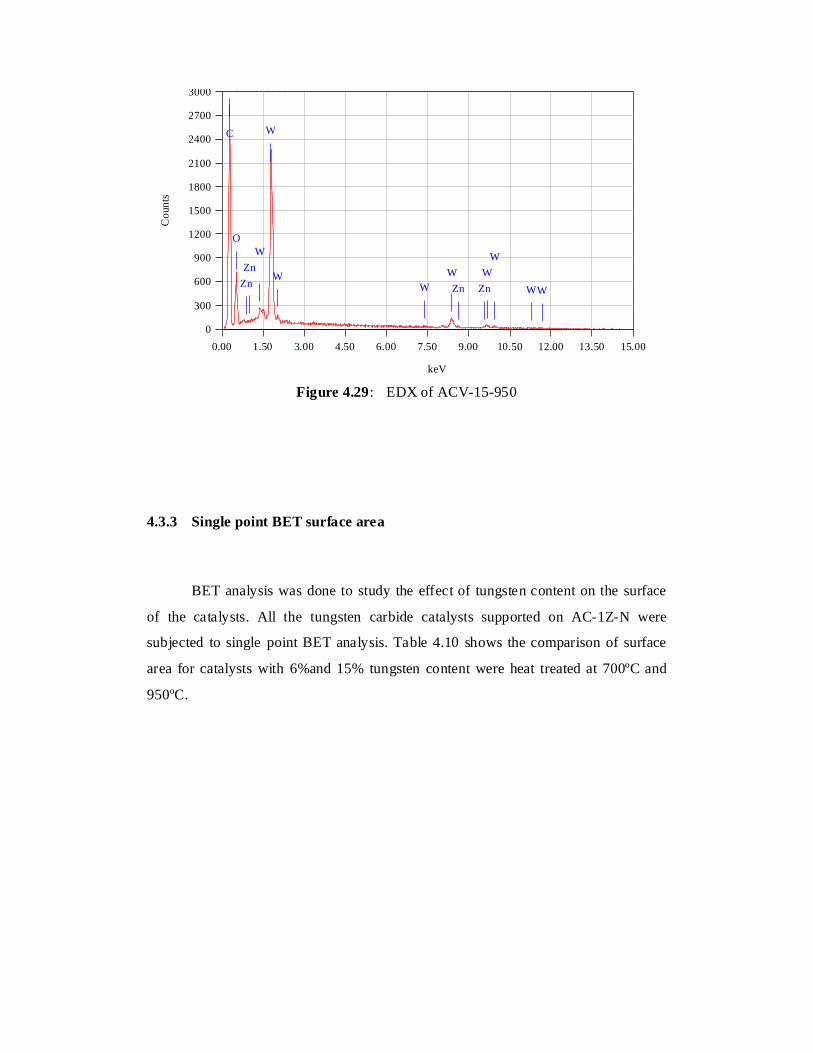
0.00 1.50 3.00 4.50 6.00 7.50 9.00 10.50 12.00 13.50 15.00
keV
WC2 Area008
0
300
600
900
1200
1500
1800
2100
2400
2700
3000
Cou
nts
C
O
Zn
Zn
Zn Zn
W
W
WW
W W
W
WW
Figure 4.29: EDX of ACV-15-950
4.3.3 Single point BET surface area
BET analysis was done to study the effect of tungsten content on the surface
of the catalysts. All the tungsten carbide catalysts supported on AC-1Z-N were
subjected to single point BET analysis. Table 4.10 shows the comparison of surface
area for catalysts with 6%and 15% tungsten content were heat treated at 700ºC and
950ºC.

Table 4.10: Single point BET surface area of samples
Sample BET surface area (m2g-1)
Activated carbon (AC-1Z-N) 878
ACN-6-700 744
ACN-6-950 630
ACN-15-700 594
ACN-15-950 354
The surface area decreased with the increased in tungsten content. The highest
surface area was obtained in ACN-6-700 with 744 m2g-1 followed by ACN-6-950
with 630 m2g-1. While ACN-15-700 and ACN-15-950 give 594 m2g-1and 354 m2g-1
respectively.
For ACN-6-700, the surface area of the sample is mainly contributed by the
activated carbon. As the tungsten content increased to 15% the surface area decreased.
This might be due to the pore structure in activated carbons which consists of an
interconnected network of pores of different size; micro, meso and macropores. Gas
molecules during the BET analysis can only reach microporosity by passing through
meso and macropores. However, when large metal content are deposited on an
activated carbon there is the possibility of blocking the entrance of large pores, which
would also block the access to a portion of smaller pores. Therefore, the higher the
tungsten content the more micropores are blocked and the lower the surface area
(Alvarez-Merino et al., 2000; Perez-Cadenas et al., 2003).
The results also show that the surface area decreased as the temperature of
heat treatment increased. The tungsten particles were sintered when the treatment
temperature increased resulting in the loss of surface area (Moreno-Castilla et al.,
2001).

4.4 Hydrodehalogenation of CFC-12
Catalytic hydrodehalogenation of dichlorodifluoromethane (CCl2F2, CFC-12)
was carried out using the previously prepared tungsten carbide catalyst. From the
finding earlier, it is also deduced that the samples with 15 percent tungsten content
heat treated at 950ºC shows better formation of tungsten carbide. It is also deduced
that catalyst supported on AC-1Z-N is better than catalyst supported on AC-1Z-V. In
order to choose the optimally prepared catalyst for the hydrodehalogenation reaction,
ACN-15-950 was selected due to its considerably high surface area and the absence of
tungsten oxide species which is inactive in hydrodehalogenation reaction.
The hydrodehalogenation reaction in the system was carried out in the
microreactor whereby the mixed gas of CFC-12 and H2 as well as He as carrier gas
were passed over the tungsten carbide catalyst. The catalyst was placed in a reactor
furnace. The reaction temperature was increased from 200 to 350ºC and the
composition of the products was analysis using gas chromatography.
Figure 4.30 shows the GC chromatogram of CFC-12 gas. A sharp peak was
observed at the retention time (Rt) of 1.936 minutes. Figure 4.31 shows the GC
chromatograms of product mixture obtained from hydrodehalogenation of CFC-12 at
different temperature. All the chromatograms show a similar pattern with three main
peaks. It was found that besides the existence of the CFC-12 peak, two extra peaks
were identified around Rt value of 2.5 and 3.5 minutes. Although the identification of
the products was not done, the presence of these two peaks is significant enough to
prove that CFC-12 was successfully hydrodehalogenated with the prepared catalyst,
ACN-15-950.
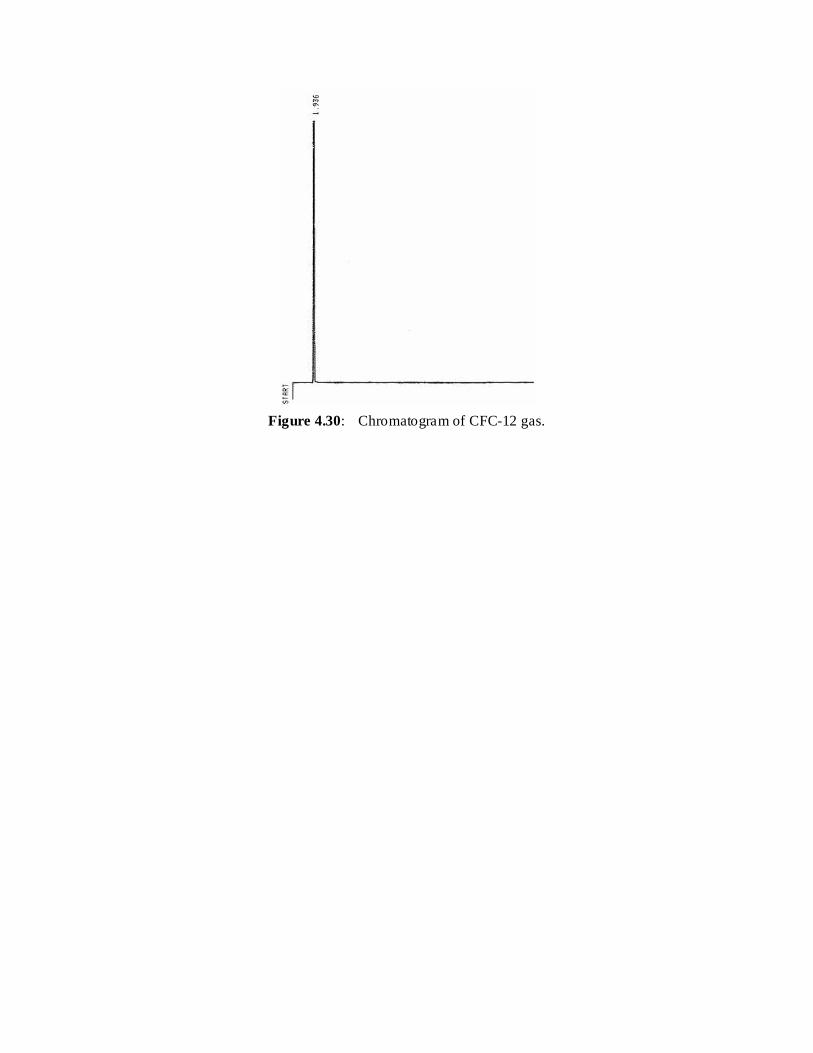
Figure 4.30: Chromatogram of CFC-12 gas.

Figure 4.31: Chromatograms of product mixture at different temperature.
Figure 4.32 presents the conversion of CFC-12 at different reaction
temperatures. It is clear that the conversion increase with the reaction temperature. At
200ºC about 93% of conversion was detected. When the reaction temperature is
increased to 250ºC the conversion of CFC-12 increased to 96% over ACN-15-950.
The highest conversion was recorded at the reaction temperature of 350ºC with 98%.
250 ºC
200 ºC
300 ºC
350 ºC

It was found that the catalyst shows a rapid deactivation in the early stages of
the reaction. This deactivation is most probably attributed to a site blocking
phenomenon due to a strong deposit of polymeric carbon and of hydrofluorocarbon
polymers (Delonnoy et al., 2000). However, the high conversion of CFC-12 showed
by AC-15-950 suggests that it could be an alternative catalyst for catalytic
hydrodehalogenationn of CFCs.
Figure 4.32: Conversion of CFC-12
89
90
91
92
93
94
95
96
97
98
99
Co
nve
rsio
n, %
200 250 300 350
Temperature (ºC)

CHAPTER 5
CONCLUSION
In conclusion, this study has achieved all the stated objectives. Four types of
carbons were successfully prepared and characterized. The study showed that the ratio
of ZnCl2 to palm kernel shell and condition of activation process influenced the
physical properties of an activated carbon.
The FTIR results indicated that all the reacted palm kernel shells were
successfully converted into carbon after 2 hours of activation. Single point BET
surface area of all the carbons prepared were obtained and AC-1Z-N showed the
highest surface area with 878 m2g-1. This supported by FESEM micrographs, which
shows a well developed internal cavities and clean surface compare to AC-1Z-V.
Nitrogen adsorption analysis shows that AC-1Z-N indeed has high micropore surface
area and micropore volume with average pore diameter of 1.95 nm. It was found that
activation under nitrogen flow, the characteristics of the carbons produced are better
than those under vacuum condition. The results showed that at ZnCl2 impregnation
ratio of 1:1, the activated carbon were predominantly micropores, while when the
ratio increased to two the micropore volume declined.
In this study AC-1Z-N is found to be the optimal activated carbon prepared
and it showed that palm kernel shells can be a better source of high surface area
activated carbon.
This research also has succeeded in preparing tungsten carbide catalyst using
the previously prepared activated carbon AC-1Z-N and AC-1Z-V. The results showed

that the type of carbon support, tungsten content and temperature of heat treatment
influence the formation of tungsten carbide. From XRD analysis it was found that
tungsten carbide supported on AC-1Z-N showed better formation of tungsten carbide.
The catalyst supported on AC-1Z-N with 15 percent tungsten content and heat treated
at 950 ºC was found to be the high tungsten carbide formation. It also observed that
Zn ions were present in all the samples prepared from AC-1Z-V.
Finally the catalytic hydrodehalogenation of CFC-12 has successfully carried
out using the optimal prepared tungsten carbide, ACN-15-950, which give a positive
results. However, the catalyst shows a rapid deactivation in the early stages of the
reaction. It was suggested that it could be an alternative routes for the traditional
catalyst used, Pd/C for it showed similarity towards the hydrodehalogenation of CFC-
12.

REFERENCES
Ahmad, A.L., Loh, M.M., Aziz, J.A. (2007). Preparation and characterization of
activated carbon from oil palm wood and its evaluation on Methylene blue
adsorption. Dyes and Pigments, 75, 263-272.
Ahmadpour, A. and Do, D.D. (1997). The preparation of activated carbon from
macadamia nutshell by chemical activation. Carbon, 12, 1723-1732.
Almansa, C., Molina-Sabio, M. and Rodriguez-Reinoso, F. (2004). Adsorption of
methane into ZnCl2-activated carbon derived discs.Microporous and
Mesoporous Materials, 76, 185-191.
Alvarez-Merino, M.A., Carrasco-Marin, F., Fierro, J.L.G. and Moreno-Castilla, C.
(2000). Tungsten catalysts supported on activated carbon. I. Preparation and
characterization after their heat treatment in inert atmosphere. Journal of
Catalysis, 192, 363-373.
Alvim-Ferraz, M.C.M. and Gaspar, C.M.T.B (2003). Micropore size distribution of
activated carbons impregnated after carbonization. Journal of Porous
Materials, 10, 47-55.
Asiah, H. and Noor Khaidawati, M.S.(2005). Introduction to surface and colloid
chemistry. Johor:Universiti Teknologi Malaysia.
Auer, E., Freud, A., Pietsch, J. and Tacke, T. (1998). Carbons as supports for
industrial metal catalysts. Applied Catalysts A: General, 173; 259-271.

Azevedo, D.C.S., Araujo,J.C.S., Bastos-Neto, M., Torres,A.E.B., Jaguaribe, E.F. and
Cavalcante, C.L. (2007). Microporous and Mesoporous Materials, 100, 361-
364.
Bandosz, J.T. (2006) Activated Carbon Surfaces in Environmental Remediation.
Academic Press.
Bertin, E.P.(1975). Principle and Practice of X-ray Spectroscopic Analysis. New
York Plenum Press.
Boonamnuayvitaya, V., Sae-ung, S. and Tanthapanichakoon (2005). Preparation of
activated carbons from coffee residue for the adsorption of formaldehyde.
Separation and Purification Technology, 42, 159-168.
Brzuzy, L.P. and Hites, R.A. (1996). Global mass balance for polychlorinated
dibenzo-p-dioxins and dibenzofurans.Environ. Sci. technol, 30, 1797-1804.
Cameron, D.S., Cooper, S.J., Dodgson, I.L., Harrison, B., and Jenkins, J.W. (1990).
Carbons as supports for precious metal catalyst. Catalysis Today, 7, 113-137.
Caturla, F., Molina-Sabio, M. and Rodriguez-Reinoso, F (1991). Preparation of
activated carbon by chemical activation with ZnCl2. Carbon, 29, 999-1007.
Chen, J.G. (1996). Carbide and Nitride Overlayers on Early Transition Metal
Surfaces: Preparation, Characterization, and Reactivities. Chemical Reviews,
96(4), 1477-1498
Claridge, J.B., York, A.P.E., Brungs, A.J., Green, M.L.H. (2000). Study of the
temperature-programmed reaction synthesis of early transition metal carbide
and nitride catalyst materials from oxide precursors. Chem. Mater., 12(1), 132-
142.

Corella, J. and Toledo, J.M. (2002). Testing total oxidation catalysts for gas
cleanup in waste incineration at pilot scale. Ind. Eng. Chem. Res., 41,1171-
1181
Daud, W.M.A.W., Ali, W.S.W. and Sulaiman, M.Z. (2000). The effects of
carbonization temperature on pore development in palm-shell-activated
carbon. Carbon, 38, 1925-1932.
Daud, W.M.A.W and Ali, W.S.W. (2004). Comparison of activated carbon produced
from palm kernel shell and coconut shell. Bioresorce Technology, 93, 63-69.
Daud, W.M.A.W., Ali W.S.W. (2004). Comparison on pore development of
activated carbon produced from palm kernel shell and coconut shell.
Biosource Technology , 93, 63-69.
Delannoy, L., Giraudon, J.-M., Granger, P.,Leclercq, L and Leclercq, G. Group VI
transition metal carbides as alternatives in the hydrodechorination of
chlorofluorocarbons. Catalysis today, 59, 231-240.
Figueiredo, J.L. Moulijn. J.A. (2005) Carbon and Coal Gasification: Science and
technology. Springer.
Galiatsatou, P., Metaxas, M. and Kasselouri-Rigopoulou, V. (2001). Mesoporous
activated carbon from agricultural byproducts. Microchimica Acta, 136, 147-
152.
Gao, L. and Kear, B.H. (1997). Synthesis of nanophase WC powder by a
displacement reaction process. Nanostructured Materials, 9, 205-208.
Gergova, K., Petrov, N. and Eser, S. (1994). Adsorption properties and
microstructure of activated carbons produced from agricultural by products by
steam activation. Carbon, 32, 693-702.
Hagen, J. (2006). Industrial Catalysis: A Practical Approach. Wiley-VCH.

Houston, J.E., laramore, G.E. and Park, R.L (1974). Surface Electronic Properties of
Tungsten, Tungsten Carbide, and Platinum. Science, 185, 258-260.
Hu, Z., Srinivasan M.P., Ni, Y. and Shi, X.F. (2000). Mesoporous high surface area
activated carbon produced from coconut shell. Adsorption Science and
Technology:Proceedings of the Second Pacific Basin Conference, 269-273.
Hu, Z., Srinivasan M.P.and Ni, Y.(2001). Novel activation process for preparing
highly microporous and mesoporous activated carbons. Carbon, 39, 877-886.
Hussain, A. and Mohd Saiyudin, N.K.W. (2005). Introduction to Surface and Colloid
Chemistry. Monograph 1st ed. Universiti Teknologi Malaysia.
Ioannidou, I. and Zabaniotou, A. (2007). Agricultural residues as precursors for
activated carbon production-A Review. Renewable and Sustainable Energy
Reviews, 11, 1966-2005.
Jankowska, H., Swatkowski, A.and Choma, J. (1991). Active Carbon. Poland: Ellis
Horwood.
Jaroniec M., Gilpin R.K., Rainier J. and Choma J. (1996). Characterization of
microporous carbons by using TGA curves measured under controlled
conditions. Thermochimica Acta, 272, 65-73.
Kawser Md., j. and farid nash, A. (2000). Oil Palm Shell as a source of phenol.
Journal of Oil Palm Research,12 (1), 86-94.
Keller, V.,Cheval, M., Vayer, M., Ducros, R. and Maire G. (1991). Tungsten
carbides as substitutes of platinoids in heteogeneous catalysis. I. The effect of
surface composition on reaction of Methycyclopentane on tungsten carbides.
Catalysis Letter, 10, 137-148.

Khalili, N.R., Campbell, M., Sandi, G. and Golas, J. (2000). Production of micro- and
mesoporous activated carbon from paper mill sludge. I. Effect of zinc chloride
activation. Carbon, 38, 1905-1915.
Kim, J.C. and Kim, B.K. (2004). Synthesis of nanosized tungsten carbide powder by
the chemical vapor condensation process. Scripta Materialia, 50, 969-972.
Kinoshita, K. (1987). Carbon, Electrochemical and Physicochemical Properties.
Wiley-Interscience.
Knozinger, H., Ertl, G and Weitkamp, J. (1999). Preparation of Solid Catalysts.
Willey-VCH.
Landau, M.V. (1997). Deep hydrotreating of middle distillates from crude and shale
oils.Catalysis Today, 36 (4), 393-429.
Lange N.A. (1985). Handbook of Chemistry. 13th ed. New York: McGraw Hill.
Lemaitre, J., Vidick, B. and Delmon, B.(1986). Control of the catalytic activity of
tungsten carbides. I: Preparation of highly dispersed tungsten carbides. Journal
of Catalysis, 99, 415-427.
Levy, R.B and Boudard, M. (1973). Platinum-like of tungsten carbide in surface
catalysis. Science , 181, 547-549.
Liang, C., Tian, F., Wei, Z., Xin, Q. and Li, C. (2003). The synthesis of
nanostructured W2C on ultrahigh surface area carbon materials via
carbothermal hydrogen reduction. Nanotechnology, 14, 955-958.
Lua, A. C. and Guo, J (1998). Preparation and characterization of chars from oil
palm waste. Carbon, 36 (11), 1663-1670.

Lua, A.C., Lau, F.Y. and Guo, J. (2000). Preparation and characterization of
activated carbon from oil-palm shells. Sustainable Energy and Environmental
Technologies: Proceeding of the third Asia Pacific Conference, 425-429.
Lua, A. C.and Yang, T. (2004). Effect of activation temperature on the textural and
chemical properties of potassium hydroxide activated carbon prepared from
pistachio-nut shell. Journal of Colloid and interface Science, 274, 594-601
Lua, A.C. and Yang, T. (2005). Characteristics of activated carbon prepared from
pistachio-nut shell by zinc chloride activation under nitrogen and vacuum
conditions. Journal of Colloid and Interface Science, 290, 505–513.
Manocha, M.S (2003). Porous Carbons. Sadhana, 28, 335-348.
Marsh, H. and Rodriguez-Reinoso, F. (2006). Activated carbon. Elsevier.
Minkova, V., Razvigorova, M., Goranova, M., Ljutzkanov, L.and Angelova, G.
(1991). Effect of water vapour on the pyrolysis of solid fuels. I. Effect of water
vapour during the pyrolysis of solid fuels on the yield and composition of the
liquid products. Fuel, 70, 713-719.
Mohanty, K., Das, D. and Biswas, M.N. (2005). Adsorption of phenol from aqueous
solutions using activated carbons prepared from Tectona grandis sawdust by
ZnCl2 activation. Chemical Engineering Journal, 115, 121-131.
Molina-Sabio M. and Rodriguez-Reinoso F. (2004). Role of chemical activation in
the development of carbon porosity. Colloids and Surface A: Physicochem.
Eng. Aspects, 241, 15-25.
Morena-Castilla, C., Alvarez-Merino, M.A., Carrasco-Marin, F., and Fierro, J.L.G.
(2001). Tungsten and tungsten carbide supported on activated carbon: surface
structures and performance for ehylene hydrogenation. Langmuir , 17, 1752-
1756.

Mowla, D., Do, D.D., Katsumi Kaneko. (2003). Adsorption of water vapor on
activated carbon: A brief overview. Chemistry and Physics of Carbon, 28,
230- 241.
Oatley, C.W. (1972). The scanning Electron Microscopy. Cambridge: Cambridge
University Press, 66-78.
Oxley, J.D., Mdleleni, M.M, and Suslick K.S. (2004). Hydrodehalogenation with
sonochemically prepared Mo2C and W2C. Catalysis Today, 88, 139-151.
Oyama S.T. and Keiffer R.(1992). Carbides. In: Kirk-Othmer. Encyclopedia of
Chemical Technology. 4th ed. New York: John Wiley & Sons.
Oyama, S.T. (1996). Chemistry of Transition Metal Carbides and Nitrides.Springer.
Patterson, P.M, Das, T.K, Davis, B.B. (2003).Carbon monoxide hydrogenation over
molybdenum and tungsten carbides. Applied Catalysis A:General, 251, 449-
455.
Perego, G. (1998). Characterization of heterogeneous catalyst by X-ray diffraction
techniques. Catalysis Today, 41, 251-259.
Perez, M.C., Martinez de Lecea, C.S. and Solano, L.A. (1997). Platinum supported
on activated carbon cloths as catalyst for nitrobenzene hydrogenation. Applied
catalysis A: General, 151, 461-475.
Perez-Cadenas, A.F., Moreno-Castilla, C., Maldonad-Hodar, F.J. and Fierro, J.L.G.
(2003). Tungsten oxide catalysts supported on activated carbons: Effect of
tungsten precursor and treatment on dispersion, distribution, and surface
acidity of catalysts. Journal of Catalysis, 217, 30-37.
Ponec V., Knor Z. and Cemy S. (1974). Adsorption on Solid. Butterworth: London.

Putun A.E.,Ozbay, N., Onal, E.P. and Putun, E. (2005). Fixed-bed pyrolysis of cotton
stalk for liquid and solid products. Fuel Process Technology, 86, 1207-1219.
Prauchner, J.M., Rodriguez-Reinoso. F. (2007). Preparation of granular activated
carbons for adsorption of natural gas. Microporous and Mesoporous
Materials, xxx, xxx-xxx.
Radovic, R.L. (2001).Chemistry and Physics of Carbon: A Series of Advances. CRC
Press.
Rao, P.K., Rao, K.S. and Padmasri, A.H. (2003). Transformation of
chlorofluorocarbons through catalytic hydrodehalogenation. CATTECH, 7(6),
218-225.
Ratna, S.D.D., (2007). Preparation and characterization of tungsten carbide from
carbon of palm kernel shells. Universiti Teknologi Malaysia. Master Thesis.
Richardson, J.T. (1989). Principal of Catalyst Development. Plenum Press, New
York and London. 194.
Rodrigues, J.A., Cruz, G.M., Buglia, G., Boudart, M. and Djega-Mariadassou.
(1997). Nitride and carbide of molybdenum and tungsten as substitutes of
iridium for the catalysts used for space communication. Catalysis Letter, 45, 1-
3.
Rodriguez-Reinoso, F. and Solano, A.L. (1989). Microporous structure of activated
carbons as revealed by adsorption methods. In: Thrower, A. (Ed.), Chemistry
and Physics of Carbon P, 21, 2-141.
Rodriguez-Reinoso F., Molina-Sabio M .and Gonzalez M.T. (1995). The use of
steam and CO2 as activating agents in the preparation of activated carbons.
Carbon, 33, 15-23.
Rodriguez-Reinoso, F. (1997). The role of carbon materials in heterogeneous
catalysis. Carbon, 36 (3), 159-175.

Scott, R.P.W. and Perry, J.A. (1998). Introduction to Analytical Gas
Chromatography. CRC press.
Soderstrom, G. and Marklund, S.(2002). The influence of bromine in the formation
of halogenated dioxins in combustion processes. Environ. Sci. Technol, 36,
1959.
Sourabh S., Pansare, Walter T., James G. and Goodwin Jr.(2007). Ammonia
decomposition on tungsten carbide. Catalysis Communications, 8, 649-654.
Stiles, B.A. (1987). Catalyst Supports and Supported Catalysts. Butterworths.
Stuart, B (2004). Infrared spectroscopy: Fundamental and applications. John Wiley
and Sons. 71-94.
Suhas, P.J.M., Carrott, M.M.L., Carrott, R. (2007). Lignin-from natural adsorbent to
activated carbon: A review. Bioresource Technology, 98, 2301-2312.
Toth L.E. (1971).Transition Metal Carbides and Nitrides. New York: Academic
Press.
Wachowski, L., Kirszensztenjn, P. and Foltynowicz. (2001). Ecological replament of
ozone–depleting substances.Polish Journal of Enviromental Studies, 10, 415-
435.
Winterbottom, J.M., King, M.B. (1999). Reactor Design for Chemical Engineers.
CRC Press.
Xiao, T., York, A.P.E., Williams, V.C., Al-Megren, H., Hanif, A., Zhou, X., Green,
M. L. H. (2000). Preparation of molybdenum Carbides using butane and their
catalytic performance. Chem Mater, 12(12), 3896-3905.

Youssef, A.M., Radwan, N.R.E., Adbel-Gawad, I. and Singer and G.A.A. (2005).
Colloids and Surfaces A: Physicochem. Eng. Aspects, 252, 143-151.
Yu, K., Gu, Z., Ji, R., Lan-Lan, L., Ding, F., Zhang, C. and Liu, S. (2007). Effect of
pore size on the performance of mesoporous material supported chiral Mn(III)
salen complex for the epoxidation of unfunctionalized olefins. Journal of
Catalysis, 252, 312-320.
Zhong-rui, L., Yi-Lu, F., Jiang, M., Tian-duo, H., Liu, t. and Ya-ning, X. (2001).
Active carbon supported Mo–K catalysts used for alcohol synthesis. Journal of
Catalysis, 199, 155-161.

Appendix 1.0
Calculation of weight used from atomic weight percentage ratio of tungsten and
activated carbon support in tungsten carbide preparation
Example : W6/AC-N with ratio tungsten to activated carbon 6: 94
Weight of tungsten carbide catalyst prepared = 3 g
Weight of W = 6 % x 3 g
= 0.18 g
Weight of tungsten salt = x RMM W(CO)6
W(CO)6
= x 351.902 g/mole
= 0.34455 g
Weight of AC-N = x 94 %
= 2.82 g
Appendix 2.0
Nitrogen Adsorption Data of AC-1Z-N
0.18 g
RAM W
0.18 g
183.84 g/mole
0.18 g
6 %

APPENDIX 3.0
Nitrogen Adsorption Data of AC-1Z-V
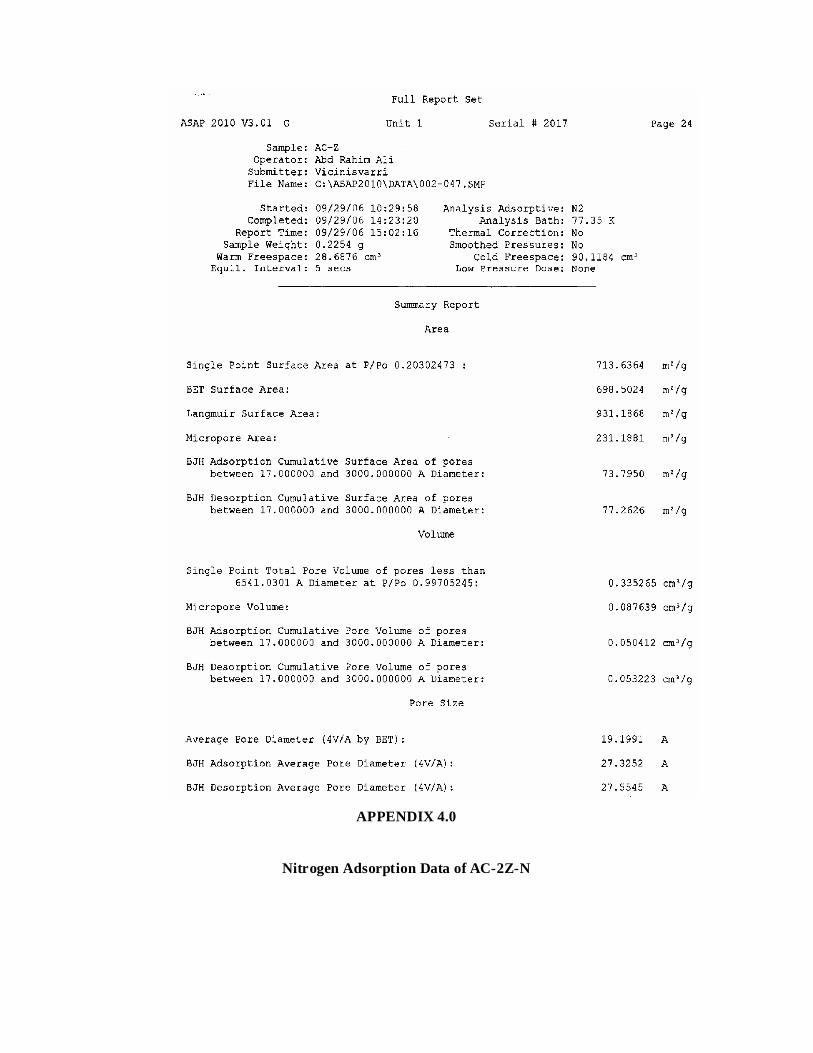
APPENDIX 4.0
Nitrogen Adsorption Data of AC-2Z-N

APPENDIX 5.0
Nitrogen Adsorption Data of AC-2Z-V

APPENDIX 6.0
t-Plot Analysis of AC-1Z-N
Harkin-Jura equation:

t(Å) =
2/1
/log0340.0
99.13
PoP
Data :
P/PO 0.0340-log(P/PO) t (nm) Vads(cm3g -1) 0.009745770 2.045184 0.261543 173.9976 0.028634526 1.577110 0.297836 195.5121 0.059679388 1.258176 0.333456 214.2914 0.076875622 1.148211 0.349058 221.7777 0.100405806 1.032242 0.368144 230.2261 0.120893893 0.951596 0.383427 236.3384 0.141594462 0.882954 0.398052 241.5948 0.162450542 0.823279 0.412226 246.1643 0.183576117 0.770184 0.426198 250.1135 0.204131104 0.724091 0.439554 253.4904 0.250134881 0.635826 0.469072 259.3094 0.304687142 0.550146 0.504278 264.0002 0.348863334 0.491345 0.533600 266.5389 0.399267142 0.432736 0.568587 268.4961 0.449261002 0.381501 0.605565 269.9432 0.499556191 0.335416 0.645828 271.0830 0.549478738 0.294049 0.689761 272.0813 0.59974597 0.256033 0.739199 272.8856 0.64943923 0.221461 0.794803 272.8856 0.69956040 0.189175 0.859958 273.5986
y = 63.611x + 231.29
R2 = 0.9138
0
50
100
150
200
250
300
350
0.0 0.1 0.2 0.3 0.4 0.5 0.6 0.7 0.8 0.9 1.0
Statistical thickness (nm)
Vo
l Ad
s (c
m3 /g
ST
P)

Calculation : t-Plot equation: 29.23161.63 xy
Intercept, i = 231.29
Micropore volume, VMP = 231.29 x 0.001547 cm3/g
= 0.3578 cm3/g
Slope, s = 63.61
External surface area, Sex = 63.61 x 0.1 x 15.47 m2/g
= 98.40 m2/g
BET surface area, SBET = 883.9791 m2/g
Micropore surface area = 883.9791 – 98.40 m2/g
= 785.57m2/g
APPENDIX 7.0
t-Plot Analysis of AC-1Z-V
Harkin-Jura equation
t(Å) =
2/1
/log0340.099.13
PoP
Data:
P/PO 0.0340-log(P/PO) t(nm) Vads(cm3g-1) 0.009598230 2.051809 0.261120 162.2812 0.030940146 1.543478 0.301064 178.9416 0.061937125 1.242049 0.335614 189.5982 0.079974776 1.131047 0.351697 193.5397 0.102049407 1.025190 0.369408 197.1282 0.122923975 0.944363 0.384892 199.7114 0.144217589 0.874982 0.399861 201.8031 0.164582825 0.814341 0.414482 203.4110 0.183889143 0.769444 0.426403 204.6620
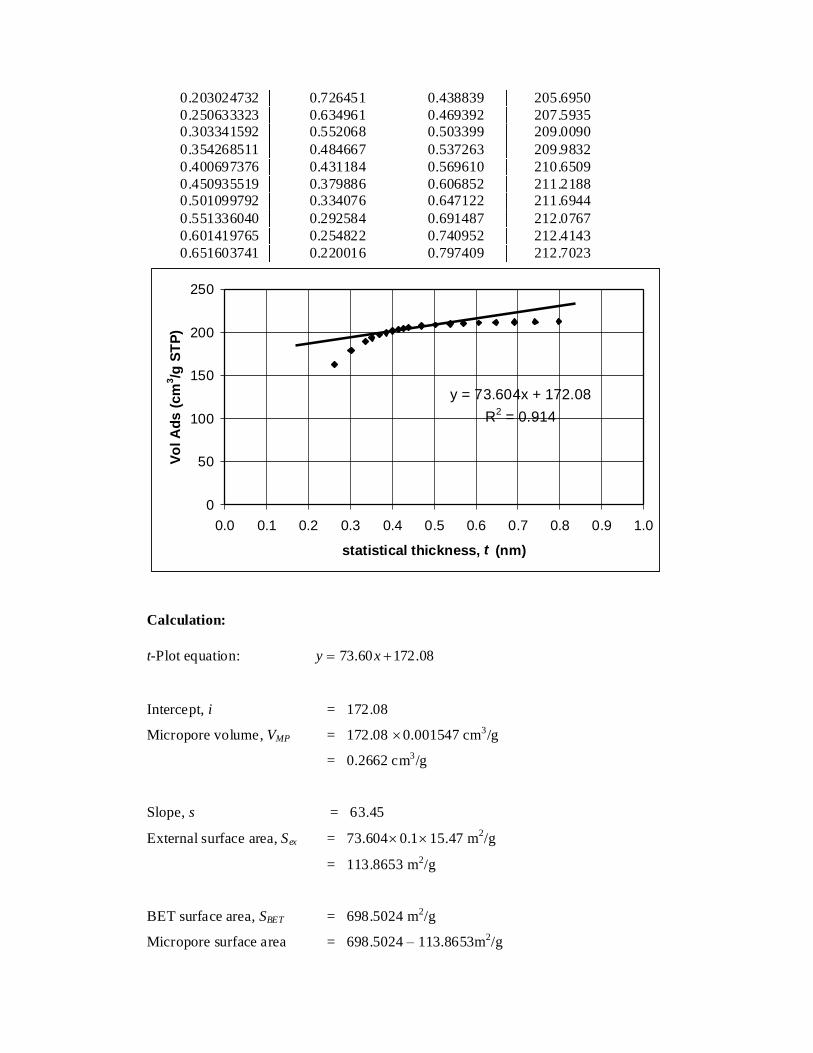
0.203024732 0.726451 0.438839 205.6950 0.250633323 0.634961 0.469392 207.5935 0.303341592 0.552068 0.503399 209.0090 0.354268511 0.484667 0.537263 209.9832 0.400697376 0.431184 0.569610 210.6509 0.450935519 0.379886 0.606852 211.2188 0.501099792 0.334076 0.647122 211.6944 0.551336040 0.292584 0.691487 212.0767 0.601419765 0.254822 0.740952 212.4143 0.651603741 0.220016 0.797409 212.7023
y = 73.604x + 172.08
R2 = 0.914
0
50
100
150
200
250
0.0 0.1 0.2 0.3 0.4 0.5 0.6 0.7 0.8 0.9 1.0
statistical thickness, t (nm)
Vo
l Ad
s (
cm3 /g
ST
P)
Calculation: t-Plot equation: 08.17260.73 xy
Intercept, i = 172.08
Micropore volume, VMP = 172.08 0.001547 cm3/g
= 0.2662 cm3/g
Slope, s = 63.45
External surface area, Sex = 73.6040.115.47 m2/g
= 113.8653 m2/g
BET surface area, SBET = 698.5024 m2/g
Micropore surface area = 698.5024 – 113.8653m2/g

= 584.6371 m2/g
Appendix 8.0
t-Plot Analysis of AC-2Z-N
Harkin-Jura equation:
t(Å) =
2/1
/log0340.099.13
PoP
Data:
P/P0 0.0340-log(P/P0) t(nm) Vads(cm3g-1) 0.009817579 2.041996 0.261747 123.9698 0.028716995 1.575861 0.297954 130.3478 0.064571799 0.223957 0.790363 135.1238 0.080810386 1.126533 0.352401 136.6074 0.100680500 1.031055 0.368356 138.1701 0.120763012 0.952066 0.383332 139.6766 0.141254766 0.883997 0.397817 140.8537 0.161293722 0.826383 0.411451 141.8953 0.180937247 0.776472 0.424469 142.8319 0.200859060 0.731109 0.437439 143.6869 0.250054181 0.635966 0.469021 145.3370 0.301078459 0.555320 0.501923 146.8095 0.351310661 0.488309 0.535256 148.0501 0.400107051 0.431823 0.569188 149.1366 0.450210661 0.380584 0.606294 150.0833 0.500190677 0.334864 0.646360 150.8794 0.550085885 0.293569 0.690325 151.6417 0.600174262 0.255723 0.739647 152.3420 0.650214407 0.220943 0.795735 152.9243

y = 52.021x + 119.94
R2 = 0.9552
0
20
40
60
80
100
120
140
160
180
0 0.1 0.2 0.3 0.4 0.5 0.6 0.7 0.8 0.9 1
Statistical thickness, t (nm)
Vo
l A
ds
(c
m3/g
ST
P)
Calculation : t-Plot equation: 94.119021.52 xy
Intercept, i = 119.94
Micropore volume, VMP = 119.94 x 0.001547 cm3/g
= 0.18555 cm3/g
Slope, s = 52.021
External surface area, Sex = 52.021x 0.1 x 15.47 m2/g
= 80.4765 m2/g
BET surface area, SBET = 485.6073 m2/g
Micropore surface area = 485.6073 – 80.4765
= 405.1323 m2/g

Appendix 9.0
t-Plot Analysis of AC-2Z-V
Harkin-Jura equation:
t(Å) =
2/1
/log0340.099.13
PoP
Data:
P/P0 0.0340-log(P/P0) t (nm) Vads(cm3g-1) 0.009595220 2.051945 0.261111 34.7249 0.030673138 1.547242 0.300697 39.7328 0.063517098 1.231109 0.337101 43.7101 0.076957289 1.147750 0.349128 44.9137 0.100652107 1.031177 0.368334 46.6964 0.121095418 0.950872 0.383573 47.9950 0.142012239 0.881674 0.398341 49.1378 0.163188768 0.821310 0.412720 50.1338 0.184387727 0.768268 0.426729 51.0296 0.205926480 0.720288 0.440713 51.8132 0.250877720 0.634538 0.469548 53.1468 0.307050488 0.546790 0.505823 54.3826 0.360013087 0.477682 0.541177 55.2662 0.399842130 0.432111 0.568998 55.8312 0.451176387 0.379654 0.607037 56.4460 0.501018152 0.334147 0.647054 56.9838 0.551694028 0.292302 0.691820 57.4556 0.601867349 0.254499 0.741422 57.8314 0.649990502 0.221093 0.795466 58.1204
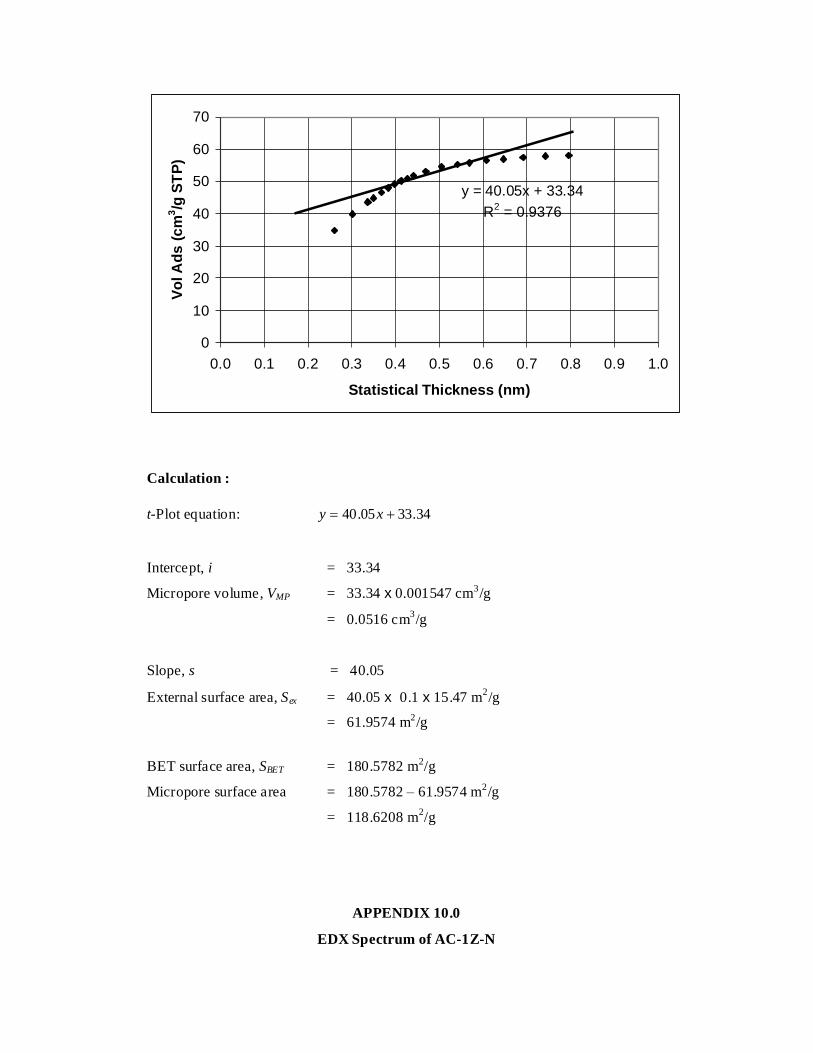
y = 40.05x + 33.34R2 = 0.9376
0
10
20
30
40
50
60
70
0.0 0.1 0.2 0.3 0.4 0.5 0.6 0.7 0.8 0.9 1.0
Statistical Thickness (nm)
Vo
l Ad
s (c
m3/g
ST
P)
Calculation : t-Plot equation: 34.3305.40 xy
Intercept, i = 33.34
Micropore volume, VMP = 33.34 x 0.001547 cm3/g
= 0.0516 cm3/g
Slope, s = 40.05
External surface area, Sex = 40.05 x 0.1 x 15.47 m2/g
= 61.9574 m2/g
BET surface area, SBET = 180.5782 m2/g
Micropore surface area = 180.5782 – 61.9574 m2/g
= 118.6208 m2/g
APPENDIX 10.0
EDX Spectrum of AC-1Z-N

APPENDIX 11.0
EDX Spectrum of AC-1Z-V

APPENDIX 12.0
EDX Spectrum of AC-2Z-N

APPENDIX 13.0
EDX Spectrum of ACN-15-950

APPENDIX 14.0
EDX Spectrum of ACV15-950
012012
0.2 mm0.2 mm0.2 mm0.2 mm0.2 mm
Title : IMG1 --------------------------- Instrument : 6701F Volt : 15.00 kV Mag. : x 150 Date : 2007/09/06 Pixel : 512 x 384
0.00 1.50 3.00 4.50 6.00 7.50 9.00 10.50 12.00 13.50 15.00
keV
WC1 Area012
0
800
1600
2400
3200
4000
4800
5600
6400
7200
Cou
nts
C
OW
W
W W W W
W
WW
ZAF Method Standardless Quantitative Analysis Fitting Coefficient : 0.2766 Element (keV) Mass% Error% Atom% Compound Mass% Cation K C K 0.277 62.51 0.05 84.53 58.2131 O K 0.525 13.11 0.28 13.31 11.6558 W M 1.774 24.37 0.37 2.15 37.7479 Total 100.00 100.00
Acquisition Parameter Instrument : 6701F Acc. Voltage : 15.0 kV Probe Current: 2.56160 nA PHA mode : T4 Real Time : 71.96 sec Live Time : 50.00 sec Dead Time : 30 % Counting Rate: 3532 cps Energy Range : 0 - 20 keV

008008
100 µm100 µm100 µm100 µm100 µm
Title : IMG1 --------------------------- Instrument : 6701F Volt : 15.00 kV Mag. : x 500 Date : 2007/09/06 Pixel : 512 x 384
0.00 1.50 3.00 4.50 6.00 7.50 9.00 10.50 12.00 13.50 15.00
keV
WC2 Area008
0
300
600
900
1200
1500
1800
2100
2400
2700
3000
Cou
nts
C
O
Zn
Zn
Zn Zn
W
W
WW
W W
W
WW
Acquisition Parameter Instrument : 6701F Acc. Voltage : 15.0 kV Probe Current: 2.56160 nA PHA mode : T4 Real Time : 63.79 sec Live Time : 50.00 sec Dead Time : 21 % Counting Rate: 2483 cps Energy Range : 0 - 20 keV
ZAF Method Standardless Quantitative Analysis Fitting Coefficient : 0.3011 Element (keV) Mass% Error% Atom% Compound Mass% Cation K C K 0.277 48.98 0.05 78.08 35.9162 O K 0.525 14.51 0.20 17.36 14.7909 Zn K 8.630 3.97 1.86 1.16 7.1727 W M 1.774 32.55 0.33 3.39 48.7412 Total 100.00 100.00