nanohydroxyapatite synthesis using optimized process
TRANSCRIPT

Bull. Mater. Sci., Vol. 39, No. 1, February 2016, pp. 133–145. c© Indian Academy of Sciences.
Nanohydroxyapatite synthesis using optimized process parametersfor load-bearing implant
FEVEN MATTEWS MICHAEL1, M KHALID1,∗ , C T RATNAM2, W RASHMI3,
M E HOQUE4 and MOHAMMAD REZA KETABCHI1
1Division of Manufacturing and Industrial Processes, Faculty of Engineering, University of Nottingham
Malaysia Campus, Jalan Broga, 43500 Semenyih, Selangor, Malaysia2Radiation Processing Technology Division, Malaysian Nuclear Agency, Bangi, Selangor, Malaysia3Energy Research Group, School of Engineering, Taylor’s University, 47500 Subang Jaya, Selangor, Malaysia4Department of Biomedical Engineering, King Faisal University Al-Hofuf, Al-Ahsa 31982, Kingdom of Saudi Arabia
MS received 9 June 2015; accepted 14 September 2015
Abstract. In this study, nanohydroxyapatite (NHA) was synthesized using calcium nitrate tetrahydrate and
diammonium hydrogen phosphate via the precipitation method assisted with ultrasonication. Three independent
process parameters: temperature (T) (70, 80 and 90◦C), ultrasonication time (t) (20, 25 and 30 min), and ampli-
tude (A) (60, 65 and 70%) were studied and optimized using response surface methodology based on 3 factors and 5
level central composite design. The responses of the model were analysed with the help of the particle size measured
from field-emission scanning electron microscopy and Brunauer–Emmett–Teller (BET). The surface area of particle
was measured with BET and the thermal stability of the powder was measured using thermogravimetric analysis.
Finally, with the optimized process parameters obtained from the model, the NHA powder was synthesised and val-
idated against the predicted value. The results show a good agreement with an average error 8% between the actual
and predicted values. Moreover, the thermal stability and porosity of synthesized NHA was further improved after
calcination. This improvement could be due to the removal of impurities from the NHA powder after calcination as
indicated by the Fourier transform infrared spectroscopy and energy-dispersive X-ray spectroscopy.
Keywords. Nanohydroxyapatite; ultrasonication; response surface methodology; calcination; optimization.
1. Introduction
Nanohydroxyapatite (NHA) Ca10(PO4)6(OH)2, a major con-
stituent of the inorganic segment of human bone [1,2], is a
bioceramic material that can easily be synthesized. However,
the morphological, thermal stability, and chemical properties
of this NHA powder can be greatly influenced by the tech-
nique used and by modulating the conditions of the synthesis
[3]. So far, the most reported technique used to synthesize
NHA is the direct precipitation method, which is conside-
red to be simple and cost effective. Nonetheless, the quality
of the powder synthesized is poor due to the formation of
agglomerated particles [4]. This limitation can be overcome
with the help of ultrasonication, where the agglomerates can
be broken down into smaller sizes and homogeneously dis-
persed [5]. From many studies conducted [6], calcination of
the NHA powder has shown to improve the homogeneous
dispersion of the powder and further enhances the densifi-
cation of the powder due to increase in surface area. This
in turn, improves the mechanical properties of the synthe-
sized NHA powder. Moreover, calcination has also proved
∗Author for correspondence ([email protected])
to improve the quality of the NHA powder by removing the
impurities that could be present either during synthesize or
due to environmental reaction [7].
In this study, NHA powder was synthesized using the
precipitation technique accompanied by ultrasonication. The
influence of different ultrasonication parameters on the prop-
erties of NHA powder was studied by varying the ultrasonic
time and amplitude as well as the temperature of the solution.
The uniqueness of this study is the application of response
surface methodology (RSM), which is an effective statisti-
cal technique used to optimize the process parameters hav-
ing three or more factors [8]. The advantage of using RSM
is the reduction in the number of experimental runs needed
to evaluate multiple process parameters and their interaction.
In addition, it is more efficient, easier to arrange and inter-
pret the experimental results compared with others. There-
fore, in this study central composite design (CCD), one of
the RSMs based on 3 factors and 5 level designs is used
to obtain the optimum condition to synthesize NHA pow-
der. This analysis was based on the thermal stability, particle
size and surface area of the NHA powder. Finally, the effect
of calcination on the NHA powder was also investigated by
calcinating the NHA powder synthesized at the optimum
condition.
133

134 Feven Mattews Michael et al
2. Materials and methodology
2.1 Materials
The chemicals used to synthesize NHA such as di-ammonium
hydrogen phosphate (A.P.), calcium nitrate tetrahydrate
(C.P.), ammonium solution (30%) (A.P.), and absolute alco-
hol 99.7% (denatured) (A.P.) were purchased from LGC
Scientific, Malaysia. Hydroxyapatite nanopowder (≥97%
and <200 nm (Brunauer–Emmett–Teller (BET))) used for
comparison purpose was purchased from Sigma-Aldrich. All
chemicals were analytical grades and were used without
further modification.
2.2 Sample preparation
A solution of 50 ml of 1 M calcium nitrate tetrahydrate and
35 ml of 0.6 M diammonium hydrogen phosphate was pre-
pared with the assistance of ultrasonication (Cole Palmer
ultrasonic processor). The pH of the solution was adjusted
with ammonium solution. After the reactions were comple-
ted, the solutions were vacuum filtered and washed with water
and ethanol. The washed precipitates (NHA) were collected
and kept in the hot air oven to dry at 70◦C for overnight. The
dried NHA powder was then used for further characterization.
2.3 Characterization tests
2.3a BET: The specific surface area of the powder was
then determined using BET (micromeritics ASAP 2020 sur-
face area and porosity analyser). The powdered samples were
degassed using a Unit 1—S/N: 720, port 1 at 300◦C for 1 h
prior to analyses. BET analysis provides a precise spe-
cific surface area from which the particle size of synthe-
sized NHA was calculated. Based on the theoretical density
(3.156 g cm−3) of NHA [9], the particle size was calculated
using
D (nm) =6
Swρw
. (1)
2.3b Thermogravimetric analysis (TGA): The thermal
degradation of the synthesized NHA was measured
using a thermogravimetric analyzer (TGA, Mettler Toledo
TGA/DSC 1 equipped with STARe System). Less than 15 mg
of NHA powder was heated at 10◦C min−1 from room tem-
perature to 1000◦C. The analysis was conducted under nitro-
gen atmosphere at a constant flow rate of 10 ml min−1, in
order to avoid unwanted oxidation.
2.3c Field-emission scanning electron microscope
(FESEM): The particle size and elemental composition of
the powder were examined using FESEM (FEI Quanta 400).
The sample was subjected to low vacuum at an accelerating
voltage of 20 kV, current of 60–90 mA and working dis-
tance of about 8.2 mm. An average of few measurements
of the particle size was taken and standard deviation was
calculated.
2.3d Fourier transform infrared (FTIR) spectroscopy:
The chemical functional group of the NHA powder was char-
acterized using FTIR spectroscopy (Perkin Elmer Spectrum
2000). The spectrometer was operated with 50 scans at
4 cm−1 resolution and within the range of 4000–400 cm−1 for
each sample. All FTIR spectra were recorded in absorbance
unit. The test was conducted by preparing a disk from a
mixture of NHA and KBr at a weight ratio of 0.2–1%.
2.3e X-ray diffraction (XRD): XRD patterns for the NHA
powder samples were collected by Panalytical X’Pert Pro
model using Cu-Kα radiation (λ = 0.15418 nm). Data were
collected over the range of 2θ values from 15◦ to 80◦ with
step size of 0.2◦ and stop time of 2.5 s.
2.3f Transmission electron microscope (TEM): The mor-
phology and the particle size of the synthesized NHA pow-
der were evaluated using TEM (Jeol-JEM-2100). The sam-
ple was prepared by dispersing the NHA powder into ethanol
using 1 h sonication. Later, the samples were observed under
TEM using a voltage of 200 kV.
2.3g Zeta-sizer: The particle size distribution of the NHA
powder was measured using Zeta-sizer (ZS, Malvern Zeta-
sizer nano). The sample was prepared by dispersing the NHA
powder into water using sonication for 1h. A drop of the
prepared sample was then diluted with distilled water in the
disposable cuvette and measured.
2.4 Experimental design and statistical analysis
The optimization of ultrasonication-related process param-
eters to synthesize NHA powder was conducted using
response surface methodology (RSM). The experiment was
carried out with the help of central composite design (CCD)
with 3 factors and 5 levels as shown in table 1. The three
independent parameters used for this study are tempera-
ture of the solution (T ) (70–90◦C), ultrasonic time (t) (20–
30 min), and amplitude, i.e., ultrasonic power (A) (60–70%).
The complete design consisted of 20 runs, where run 15–20
were used to evaluate the pure error whereas runs 13 and 14
Table 1. Independent parameters used in CCD for NHA
synthesis.
Levels
Parameters/factors −α −1 0 +1 +α
Temperature 63.18 70 80 90 96.82
Ultrasonic time 16.59 20 25 30 33.41
Amplitude 56.59 60 65 70 73.41
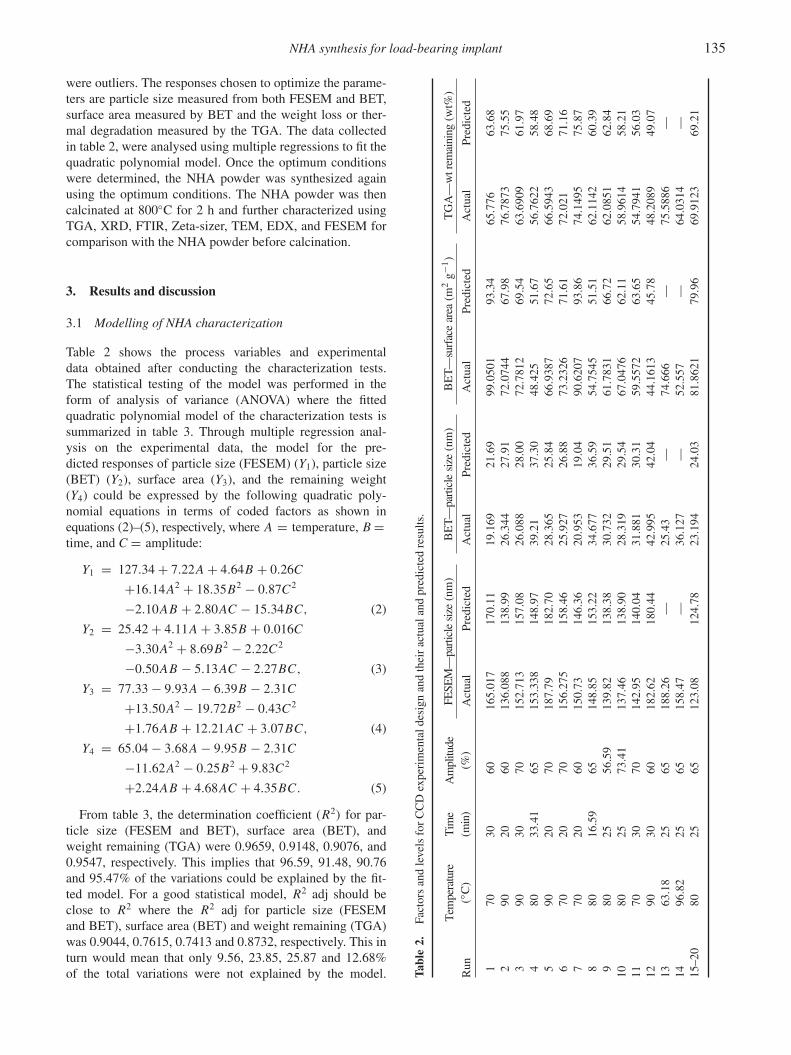
NHA synthesis for load-bearing implant 135
were outliers. The responses chosen to optimize the parame-
ters are particle size measured from both FESEM and BET,
surface area measured by BET and the weight loss or ther-
mal degradation measured by the TGA. The data collected
in table 2, were analysed using multiple regressions to fit the
quadratic polynomial model. Once the optimum conditions
were determined, the NHA powder was synthesized again
using the optimum conditions. The NHA powder was then
calcinated at 800◦C for 2 h and further characterized using
TGA, XRD, FTIR, Zeta-sizer, TEM, EDX, and FESEM for
comparison with the NHA powder before calcination.
3. Results and discussion
3.1 Modelling of NHA characterization
Table 2 shows the process variables and experimental
data obtained after conducting the characterization tests.
The statistical testing of the model was performed in the
form of analysis of variance (ANOVA) where the fitted
quadratic polynomial model of the characterization tests is
summarized in table 3. Through multiple regression anal-
ysis on the experimental data, the model for the pre-
dicted responses of particle size (FESEM) (Y1), particle size
(BET) (Y2), surface area (Y3), and the remaining weight
(Y4) could be expressed by the following quadratic poly-
nomial equations in terms of coded factors as shown in
equations (2)–(5), respectively, where A = temperature, B =
time, and C = amplitude:
Y1 = 127.34 + 7.22A + 4.64B + 0.26C
+16.14A2 + 18.35B2 − 0.87C2
−2.10AB + 2.80AC − 15.34BC, (2)
Y2 = 25.42 + 4.11A + 3.85B + 0.016C
−3.30A2 + 8.69B2 − 2.22C2
−0.50AB − 5.13AC − 2.27BC, (3)
Y3 = 77.33 − 9.93A − 6.39B − 2.31C
+13.50A2 − 19.72B2 − 0.43C2
+1.76AB + 12.21AC + 3.07BC, (4)
Y4 = 65.04 − 3.68A − 9.95B − 2.31C
−11.62A2 − 0.25B2 + 9.83C2
+2.24AB + 4.68AC + 4.35BC. (5)
From table 3, the determination coefficient (R2) for par-
ticle size (FESEM and BET), surface area (BET), and
weight remaining (TGA) were 0.9659, 0.9148, 0.9076, and
0.9547, respectively. This implies that 96.59, 91.48, 90.76
and 95.47% of the variations could be explained by the fit-
ted model. For a good statistical model, R2 adj should be
close to R2 where the R2 adj for particle size (FESEM
and BET), surface area (BET) and weight remaining (TGA)
was 0.9044, 0.7615, 0.7413 and 0.8732, respectively. This in
turn would mean that only 9.56, 23.85, 25.87 and 12.68%
of the total variations were not explained by the model. Tab
le2.
Fac
tors
and
level
sfo
rC
CD
exper
imen
tal
des
ign
and
thei
rac
tual
and
pre
dic
ted
resu
lts.
Tem
per
ature
Tim
eA
mplitu
de
FE
SE
M—
par
ticl
esi
ze(n
m)
BE
T—
par
ticl
esi
ze(n
m)
BE
T—
surf
ace
area
(m2
g−
1)
TG
A—
wtre
mai
nin
g(w
t%)
Ru
n(◦
C)
(min
)(%
)A
ctual
Pre
dic
ted
Act
ual
Pre
dic
ted
Act
ual
Pre
dic
ted
Act
ual
Pre
dic
ted
170
30
60
165.0
17
170.1
119.1
69
21.6
999.0
501
93.3
465.7
76
63.6
8
290
20
60
136.0
88
138.9
926.3
44
27.9
172.0
744
67.9
876.7
873
75.5
5
390
30
70
152.7
13
157.0
826.0
88
28.0
072.7
812
69.5
463.6
909
61.9
7
480
33.4
165
153.3
38
148.9
739.2
137.3
048.4
25
51.6
756.7
622
58.4
8
590
20
70
187.7
9182.7
028.3
65
25.8
466.9
387
72.6
566.5
943
68.6
9
670
20
70
156.2
75
158.4
625.9
27
26.8
873.2
326
71.6
172.0
21
71.1
6
770
20
60
150.7
3146.3
620.9
53
19.0
490.6
207
93.8
674.1
495
75.8
7
880
16.5
965
148.8
5153.2
234.6
77
36.5
954.7
545
51.5
162.1
142
60.3
9
980
25
56.5
9139.8
2138.3
830.7
32
29.5
161.7
831
66.7
262.0
851
62.8
4
10
80
25
73.4
1137.4
6138.9
028.3
19
29.5
467.0
476
62.1
158.9
614
58.2
1
11
70
30
70
142.9
5140.0
431.8
81
30.3
159.5
572
63.6
554.7
941
56.0
3
12
90
30
60
182.6
2180.4
442.9
95
42.0
444.1
613
45.7
848.2
089
49.0
7
13
63.1
825
65
188.2
6—
25.4
3—
74.6
66
—75.5
886
—
14
96.8
225
65
158.4
7—
36.1
27
—52.5
57
—64.0
314
—
15–20
80
25
65
123.0
8124.7
823.1
94
24.0
381.8
621
79.9
669.9
123
69.2
1
136 Feven Mattews Michael et al
Tab
le3.
Anal
ysi
sof
var
iance
for
the
fitt
edquad
rati
cm
odel
of
the
char
acte
riza
tion
of
NH
Asy
nth
esiz
ed.
FE
SE
M—
par
ticl
esi
ze(n
m)
BE
T—
par
ticl
esi
ze(n
m)
BE
T—
surf
ace
area
(m2
g−
1)
TG
A—
wt
rem
ainin
g(w
t%)
So
urc
eS
SD
FM
SF
-val
ue
p-v
alu
eS
SD
FM
SF
-val
ue
p-v
alu
eS
SD
FM
SF
-val
ue
p-v
alu
eS
SD
FM
SF
-val
ue
p-v
alue
Model
5876
9652.9
15.7
20.0
037
536.5
959.6
15.9
70.0
317
2655.9
9295.1
5.4
60.0
38
733.7
981.5
211.7
10.0
072
Res
idual
207.7
541.5
449.9
65
9.9
9270.4
05
54.0
834.8
05
6.9
6
Lac
kof
fit
207.7
2103.8
49.9
62
24.9
8270.4
02
135.2
34.8
02
17.4
0
Pure
erro
r0
30
03
00
30
03
0
Cor.
tota
l6983
17
689
17
3599.9
17
921.6
17
R2=
0.9
659,A
djR
2=
0.9
044,
R2=
0.9
148,A
djR
2=
0.7
615,
R2=
0.9
076,A
djR
2=
0.7
413,
R2=
0.9
547,A
djR
2=
0.8
732,
C.V
.=4.4
8C
.V.=
11.5
2C
.V.=
10
.17
C.V
.=4.0
2
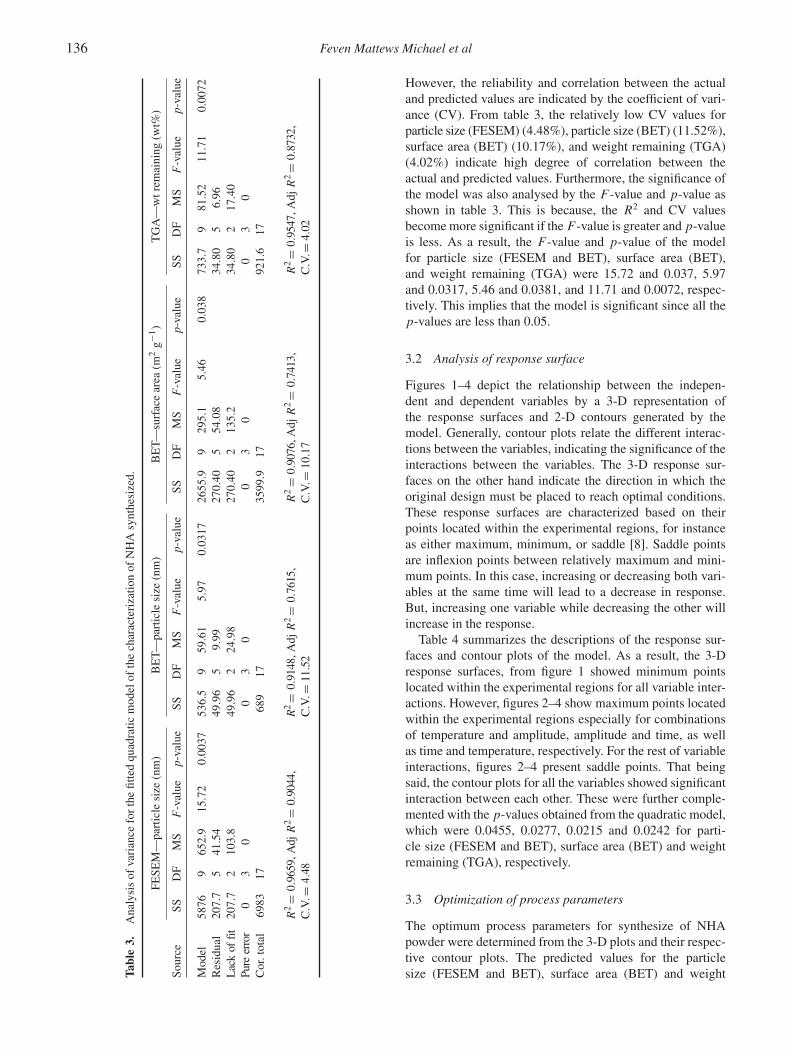
However, the reliability and correlation between the actual
and predicted values are indicated by the coefficient of vari-
ance (CV). From table 3, the relatively low CV values for
particle size (FESEM) (4.48%), particle size (BET) (11.52%),
surface area (BET) (10.17%), and weight remaining (TGA)
(4.02%) indicate high degree of correlation between the
actual and predicted values. Furthermore, the significance of
the model was also analysed by the F -value and p-value as
shown in table 3. This is because, the R2 and CV values
become more significant if the F -value is greater and p-value
is less. As a result, the F -value and p-value of the model
for particle size (FESEM and BET), surface area (BET),
and weight remaining (TGA) were 15.72 and 0.037, 5.97
and 0.0317, 5.46 and 0.0381, and 11.71 and 0.0072, respec-
tively. This implies that the model is significant since all the
p-values are less than 0.05.
3.2 Analysis of response surface
Figures 1–4 depict the relationship between the indepen-
dent and dependent variables by a 3-D representation of
the response surfaces and 2-D contours generated by the
model. Generally, contour plots relate the different interac-
tions between the variables, indicating the significance of the
interactions between the variables. The 3-D response sur-
faces on the other hand indicate the direction in which the
original design must be placed to reach optimal conditions.
These response surfaces are characterized based on their
points located within the experimental regions, for instance
as either maximum, minimum, or saddle [8]. Saddle points
are inflexion points between relatively maximum and mini-
mum points. In this case, increasing or decreasing both vari-
ables at the same time will lead to a decrease in response.
But, increasing one variable while decreasing the other will
increase in the response.
Table 4 summarizes the descriptions of the response sur-
faces and contour plots of the model. As a result, the 3-D
response surfaces, from figure 1 showed minimum points
located within the experimental regions for all variable inter-
actions. However, figures 2–4 show maximum points located
within the experimental regions especially for combinations
of temperature and amplitude, amplitude and time, as well
as time and temperature, respectively. For the rest of variable
interactions, figures 2–4 present saddle points. That being
said, the contour plots for all the variables showed significant
interaction between each other. These were further comple-
mented with the p-values obtained from the quadratic model,
which were 0.0455, 0.0277, 0.0215 and 0.0242 for parti-
cle size (FESEM and BET), surface area (BET) and weight
remaining (TGA), respectively.
3.3 Optimization of process parameters
The optimum process parameters for synthesize of NHA
powder were determined from the 3-D plots and their respec-
tive contour plots. The predicted values for the particle
size (FESEM and BET), surface area (BET) and weight

NHA synthesis for load-bearing implant 137
Figure 1. Response surface plot and contour plot of temperature of solution, ultrasonic time, and amplitude and their effect
on the particle size of NHA measured through FESEM.
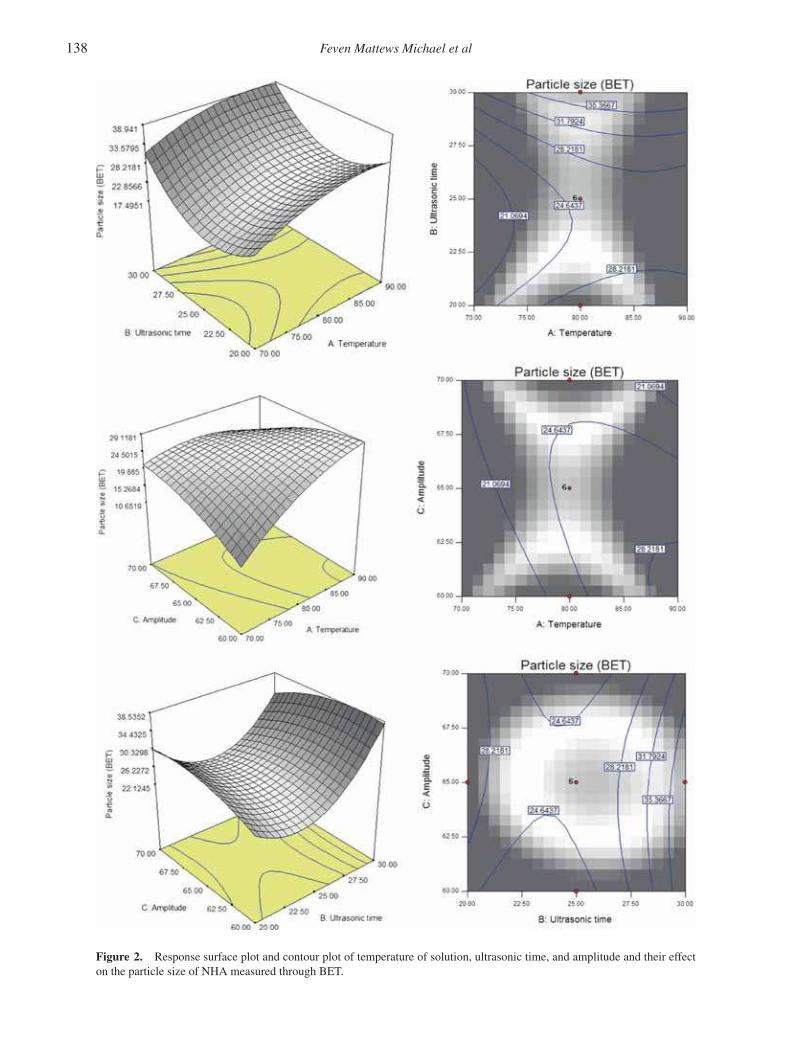
138 Feven Mattews Michael et al
Figure 2. Response surface plot and contour plot of temperature of solution, ultrasonic time, and amplitude and their effect
on the particle size of NHA measured through BET.

NHA synthesis for load-bearing implant 139
Figure 3. Response surface plot and contour plot of temperature of solution, ultrasonic time, and amplitude and their effect
on the surface area of NHA measured through BET.

140 Feven Mattews Michael et al
Figure 4. Response surface plot and contour plot of temperature of solution, ultrasonic time, and amplitude and their effect on the
weight loss of NHA after TGA analysis.
NHA synthesis for load-bearing implant 141
Table 4. Summarized description of the response surfaces and contour plots.
Figures Variable interaction Response surface plot Contour plot
1 Ultrasonic time vs. Minimum point located inside the Simple circular pattern—
temperature experimental region significant interaction
Amplitude vs. temperature Minimum point located inside the Stationary ridge pattern—
experimental region significant interaction
Amplitude vs. ultrasonic time Minimum point located inside the Stationary ridge pattern—
experimental region significant interaction
2 Ultrasonic time vs. temperature Saddle points—inflexion points between relatively Eclipse with minimax pattern—
maximum and minimum significant interaction
Amplitude vs. temperature Maximum point located inside the Eclipse pattern—
experimental region significant interaction
Amplitude vs. ultrasonic time Saddle points which are inflexion points between Eclipse with minimax pattern—
relatively maximum and minimum significant interaction
3 Ultrasonic time vs. temperature Saddle points which are inflexion points between Eclipse with minimax pattern—
relatively maximum and minimum significant interaction
Amplitude vs. temperature Minimum point located inside the Eclipse with minimax pattern—
experimental region significant interaction
Amplitude vs. ultrasonic time Maximum point located inside the Eclipse with minimax pattern—
experimental region significant interaction
4 Ultrasonic time vs. temperature Maximum point located inside the Eclipse with rising ridge pattern—
experimental region significant interaction
Amplitude vs. temperature Saddle points which are inflexion points between Eclipse with minimax pattern—
relatively maximum and minimum significant interaction
Amplitude vs. ultrasonic time Minimum point located inside the Eclipse with rising ridge pattern—
experimental region significant interaction
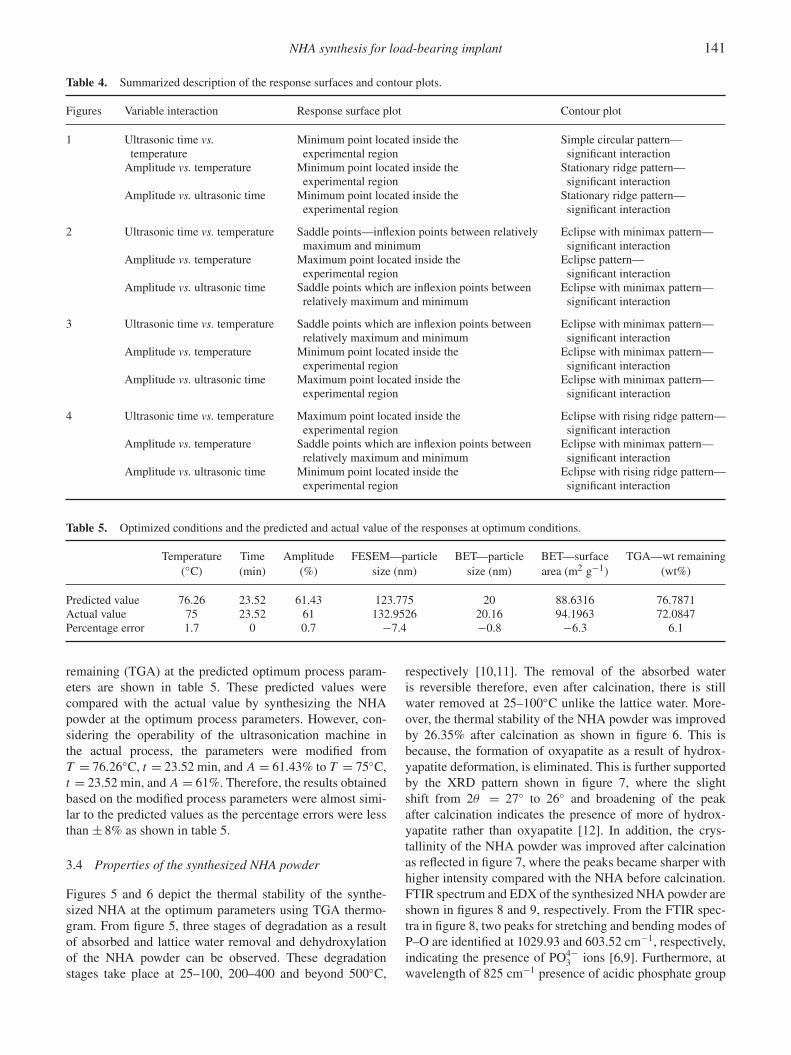
Table 5. Optimized conditions and the predicted and actual value of the responses at optimum conditions.
Temperature Time Amplitude FESEM—particle BET—particle BET—surface TGA—wt remaining
(◦C) (min) (%) size (nm) size (nm) area (m2 g−1) (wt%)
Predicted value 76.26 23.52 61.43 123.775 20 88.6316 76.7871
Actual value 75 23.52 61 132.9526 20.16 94.1963 72.0847
Percentage error 1.7 0 0.7 −7.4 −0.8 −6.3 6.1
remaining (TGA) at the predicted optimum process param-
eters are shown in table 5. These predicted values were
compared with the actual value by synthesizing the NHA
powder at the optimum process parameters. However, con-
sidering the operability of the ultrasonication machine in
the actual process, the parameters were modified from
T = 76.26◦C, t = 23.52 min, and A = 61.43% to T = 75◦C,
t = 23.52 min, and A = 61%. Therefore, the results obtained
based on the modified process parameters were almost simi-
lar to the predicted values as the percentage errors were less
than ± 8% as shown in table 5.
3.4 Properties of the synthesized NHA powder
Figures 5 and 6 depict the thermal stability of the synthe-
sized NHA at the optimum parameters using TGA thermo-
gram. From figure 5, three stages of degradation as a result
of absorbed and lattice water removal and dehydroxylation
of the NHA powder can be observed. These degradation
stages take place at 25–100, 200–400 and beyond 500◦C,
respectively [10,11]. The removal of the absorbed water
is reversible therefore, even after calcination, there is still
water removed at 25–100◦C unlike the lattice water. More-
over, the thermal stability of the NHA powder was improved
by 26.35% after calcination as shown in figure 6. This is
because, the formation of oxyapatite as a result of hydrox-
yapatite deformation, is eliminated. This is further supported
by the XRD pattern shown in figure 7, where the slight
shift from 2θ = 27◦ to 26◦ and broadening of the peak
after calcination indicates the presence of more of hydrox-
yapatite rather than oxyapatite [12]. In addition, the crys-
tallinity of the NHA powder was improved after calcination
as reflected in figure 7, where the peaks became sharper with
higher intensity compared with the NHA before calcination.
FTIR spectrum and EDX of the synthesized NHA powder are
shown in figures 8 and 9, respectively. From the FTIR spec-
tra in figure 8, two peaks for stretching and bending modes of
P–O are identified at 1029.93 and 603.52 cm−1, respectively,
indicating the presence of PO4−3 ions [6,9]. Furthermore, at
wavelength of 825 cm−1 presence of acidic phosphate group

142 Feven Mattews Michael et al
–0.0012
–0.001
–0.0008
–0.0006
–0.0004
–0.0002
0
0.0002
0.0004
0.0006
0.0008
0 200 400 600 800 1000
Wei
gh
t lo
ss (
%)
Temperature (oC)
NHA at opt cond
Cal NHA at opt cond
Figure 5. DTGA result for the NHA synthesized at the optimized condition before
and after calcination.
70
75
80
85
90
95
100
105
110
0 200 400 600 800 1000
Wei
gh
t lo
ss (
%)
Temperature (°C)
NHA at opt cond
Cal NHA at opt cond
Figure 6. TGA result for the NHA synthesized at the optimized condition before and
after calcination.
(a)
(b)
2 =26o
Figure 7. XRD patterns for the NHA synthesized at the optimized condition (a) before calcination and (b) after
calcination.
NHA synthesis for load-bearing implant 143
0
20
40
60
80
100
120
140
160
180
200
40080012001600200024002800320036004000
Inte
nsi
ty (
%)
Wavelength (cm–1)
NHA at opt cond NHA after calcination
O−HO−H
O−H O−H
P−OP−O
P−OP−O
NH+
4
HPO42–
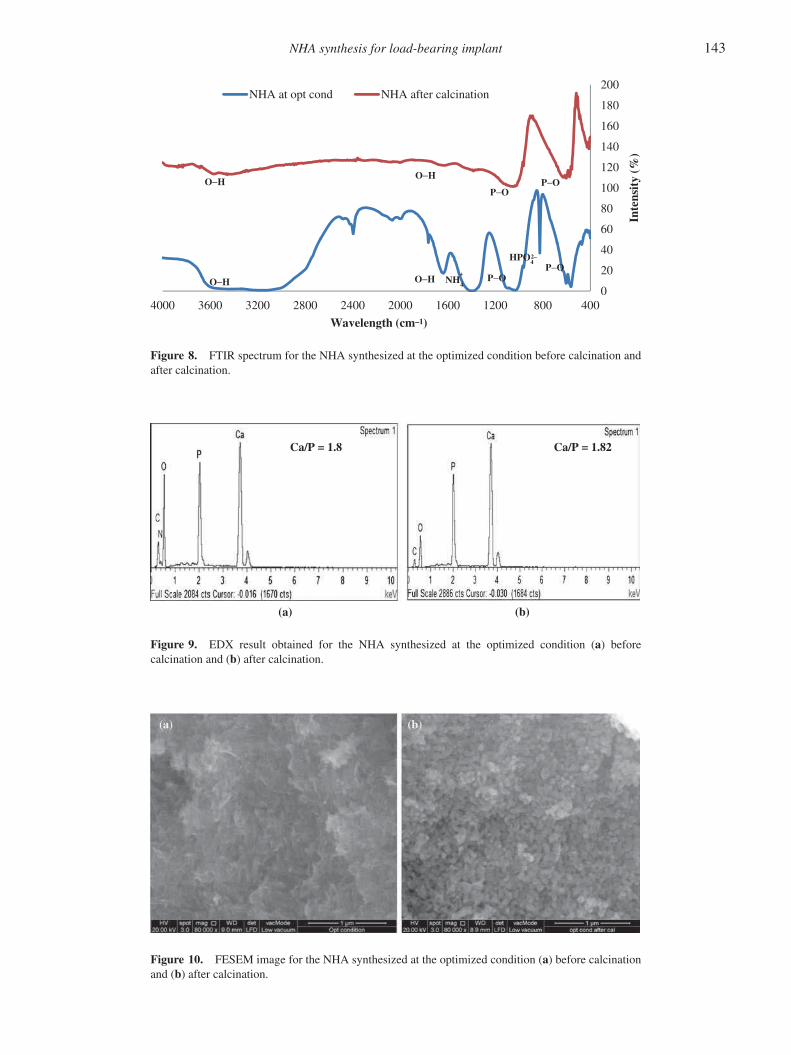
Figure 8. FTIR spectrum for the NHA synthesized at the optimized condition before calcination and
after calcination.
(a) (b)
Ca/P = 1.8 Ca/P = 1.82
Figure 9. EDX result obtained for the NHA synthesized at the optimized condition (a) before
calcination and (b) after calcination.
Figure 10. FESEM image for the NHA synthesized at the optimized condition (a) before calcination
and (b) after calcination.
144 Feven Mattews Michael et al
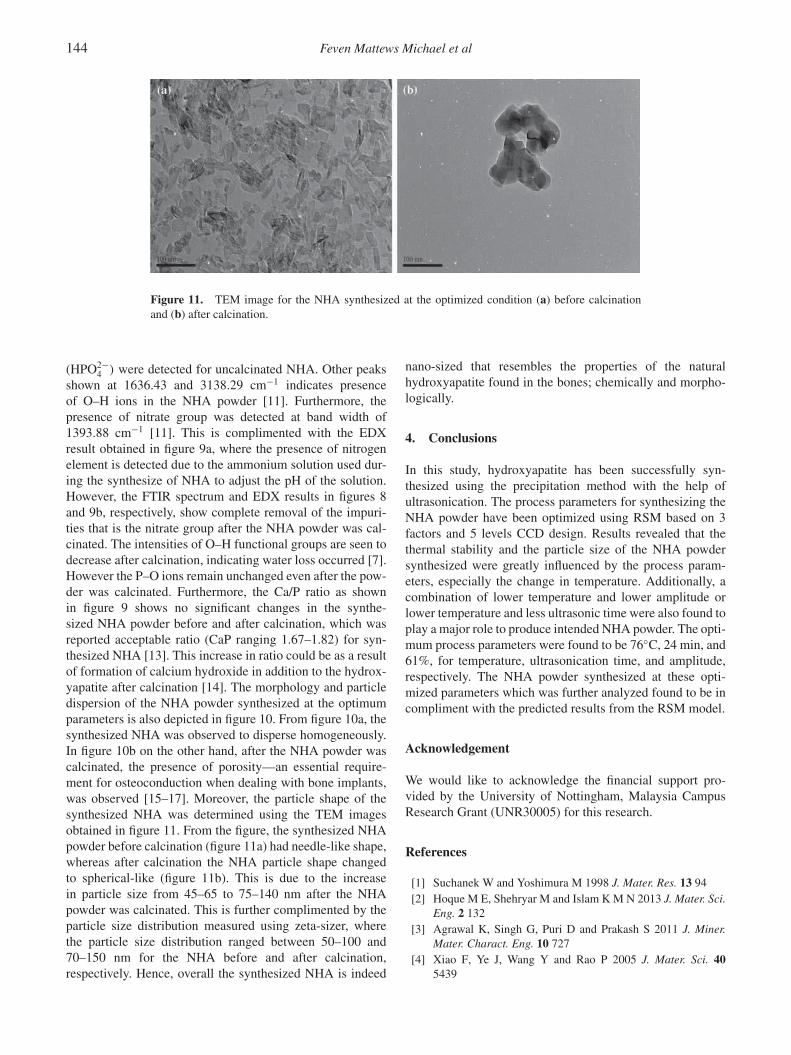
Figure 11. TEM image for the NHA synthesized at the optimized condition (a) before calcination
and (b) after calcination.
(HPO2−4 ) were detected for uncalcinated NHA. Other peaks
shown at 1636.43 and 3138.29 cm−1 indicates presence
of O–H ions in the NHA powder [11]. Furthermore, the
presence of nitrate group was detected at band width of
1393.88 cm−1 [11]. This is complimented with the EDX
result obtained in figure 9a, where the presence of nitrogen
element is detected due to the ammonium solution used dur-
ing the synthesize of NHA to adjust the pH of the solution.
However, the FTIR spectrum and EDX results in figures 8
and 9b, respectively, show complete removal of the impuri-
ties that is the nitrate group after the NHA powder was cal-
cinated. The intensities of O–H functional groups are seen to
decrease after calcination, indicating water loss occurred [7].
However the P–O ions remain unchanged even after the pow-
der was calcinated. Furthermore, the Ca/P ratio as shown
in figure 9 shows no significant changes in the synthe-
sized NHA powder before and after calcination, which was
reported acceptable ratio (CaP ranging 1.67–1.82) for syn-
thesized NHA [13]. This increase in ratio could be as a result
of formation of calcium hydroxide in addition to the hydrox-
yapatite after calcination [14]. The morphology and particle
dispersion of the NHA powder synthesized at the optimum
parameters is also depicted in figure 10. From figure 10a, the
synthesized NHA was observed to disperse homogeneously.
In figure 10b on the other hand, after the NHA powder was
calcinated, the presence of porosity—an essential require-
ment for osteoconduction when dealing with bone implants,
was observed [15–17]. Moreover, the particle shape of the
synthesized NHA was determined using the TEM images
obtained in figure 11. From the figure, the synthesized NHA
powder before calcination (figure 11a) had needle-like shape,
whereas after calcination the NHA particle shape changed
to spherical-like (figure 11b). This is due to the increase
in particle size from 45–65 to 75–140 nm after the NHA
powder was calcinated. This is further complimented by the
particle size distribution measured using zeta-sizer, where
the particle size distribution ranged between 50–100 and
70–150 nm for the NHA before and after calcination,
respectively. Hence, overall the synthesized NHA is indeed
nano-sized that resembles the properties of the natural
hydroxyapatite found in the bones; chemically and morpho-
logically.
4. Conclusions
In this study, hydroxyapatite has been successfully syn-
thesized using the precipitation method with the help of
ultrasonication. The process parameters for synthesizing the
NHA powder have been optimized using RSM based on 3
factors and 5 levels CCD design. Results revealed that the
thermal stability and the particle size of the NHA powder
synthesized were greatly influenced by the process param-
eters, especially the change in temperature. Additionally, a
combination of lower temperature and lower amplitude or
lower temperature and less ultrasonic time were also found to
play a major role to produce intended NHA powder. The opti-
mum process parameters were found to be 76◦C, 24 min, and
61%, for temperature, ultrasonication time, and amplitude,
respectively. The NHA powder synthesized at these opti-
mized parameters which was further analyzed found to be in
compliment with the predicted results from the RSM model.
Acknowledgement
We would like to acknowledge the financial support pro-
vided by the University of Nottingham, Malaysia Campus
Research Grant (UNR30005) for this research.
References
[1] Suchanek W and Yoshimura M 1998 J. Mater. Res. 13 94
[2] Hoque M E, Shehryar M and Islam K M N 2013 J. Mater. Sci.
Eng. 2 132
[3] Agrawal K, Singh G, Puri D and Prakash S 2011 J. Miner.
Mater. Charact. Eng. 10 727
[4] Xiao F, Ye J, Wang Y and Rao P 2005 J. Mater. Sci. 40
5439

NHA synthesis for load-bearing implant 145
[5] Tang E, Huang M and Lim L 2003 Int. J. Pharm. 265 103
[6] Gopi D, Govindaraju K, Victor C A P, Kavitha L
and Rajendiran N 2008 Spectrochim. Acta Part A: Mol.
Biomol. Spectrosc. 70 1243
[7] Pang Y X and Bao X 2003 J. Eur. Ceram. Soc. 23 1697
[8] Bezerra M A, Santelli R E, Oliveira E P, Villar L S and
Escaleira L A 2008 Talanta 76 965
[9] Scalera F, Gervaso F, Sanosh K, Sannino A and Licciulli A
2013 Ceram. Int. 39 4839
[10] Eslami H, Solati-Hashjin M, Tahriri M and Bakhshi F 2010
Mater. Sci.—Poland. 28 5
[11] Singh A 2012 Bull. Mater. Sci. 35 1031
[12] Gross K A, Gross V and Berndt C C 1998 J. Am. Ceram. Soc.
81 106
[13] Bonfield W and Gibson I R 2003 Method for the preparation
of carbonated hydroxyapatite compositions. Google Patents
[14] Ansari M, Naghib S M, Moztarzadeh F and Salati A 2011
Ceramics-Silikaty 55 123
[15] Rosa A L, Beloti M M and van Noort R 2003 Dent. Mater. 19
768
[16] Annaz B, Hing K, Kayser M, Buckland T and Silvio L 2004
J. Microsc. 215 100
[17] Okamoto M, Dohi Y, Ohgushi H, Shimaoka H, Ikeuchi M,
Matsushima A et al 2006 J. Mater. Sci.: Mater. Med. 17 327