nanoparticle/polymer assembled microcapsules with ph...
TRANSCRIPT
Full Paper
Nanoparticle/Polymer AssembledMicrocapsules with pH Sensing Property
Pan Zhang, Xiaoxue Song, Weijun Tong,* Changyou Gao
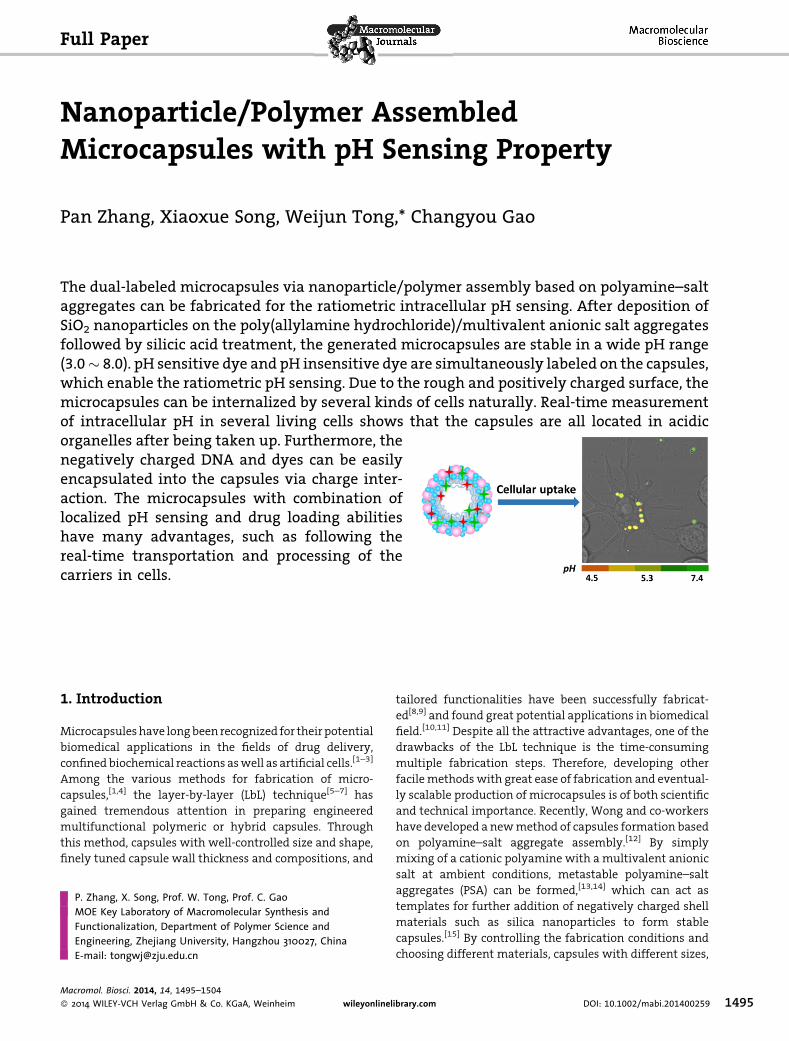
The dual-labeled microcapsules via nanoparticle/polymer assembly based on polyamine–saltaggregates can be fabricated for the ratiometric intracellular pH sensing. After deposition ofSiO2 nanoparticles on the poly(allylamine hydrochloride)/multivalent anionic salt aggregatesfollowed by silicic acid treatment, the generated microcapsules are stable in a wide pH range(3.0� 8.0). pH sensitive dye and pH insensitive dye are simultaneously labeled on the capsules,which enable the ratiometric pH sensing. Due to the rough and positively charged surface, themicrocapsules can be internalized by several kinds of cells naturally. Real-time measurementof intracellular pH in several living cells shows that the capsules are all located in acidic
organelles after being taken up. Furthermore, thenegatively charged DNA and dyes can be easilyencapsulated into the capsules via charge inter-action. The microcapsules with combination oflocalized pH sensing and drug loading abilitieshave many advantages, such as following thereal-time transportation and processing of thecarriers in cells.P. Zhang, X. Song, Prof. W. Tong, Prof. C. GaoMOE Key Laboratory of Macromolecular Synthesis andFunctionalization, Department of Polymer Science andEngineering, Zhejiang University, Hangzhou 310027, ChinaE-mail: [email protected]
� 2014 WILEY-VCH Verlag GmbH & Co. KGaA, WeinheimMacromol. Biosci. 2014, 14, 1495–1504
wileyonlinelibrary.
1. Introduction
Microcapsuleshave longbeen recognized for theirpotential
biomedical applications in the fields of drug delivery,
confined biochemical reactions aswell as artificial cells.[1–3]
Among the various methods for fabrication of micro-
capsules,[1,4] the layer-by-layer (LbL) technique[5–7] has
gained tremendous attention in preparing engineered
multifunctional polymeric or hybrid capsules. Through
this method, capsules with well-controlled size and shape,
finely tuned capsule wall thickness and compositions, and
tailored functionalities have been successfully fabricat-
ed[8,9] and found great potential applications in biomedical
field.[10,11] Despite all the attractive advantages, one of the
drawbacks of the LbL technique is the time-consuming
multiple fabrication steps. Therefore, developing other
facilemethodswith great ease of fabrication and eventual-
ly scalable production of microcapsules is of both scientific
and technical importance. Recently, Wong and co-workers
have developed a newmethod of capsules formation based
on polyamine–salt aggregate assembly.[12] By simply
mixing of a cationic polyamine with a multivalent anionic
salt at ambient conditions, metastable polyamine–salt
aggregates (PSA) can be formed,[13,14] which can act as
templates for further addition of negatively charged shell
materials such as silica nanoparticles to form stable
capsules.[15] By controlling the fabrication conditions and
choosing different materials, capsules with different sizes,
DOI: 10.1002/mabi.201400259 1495com
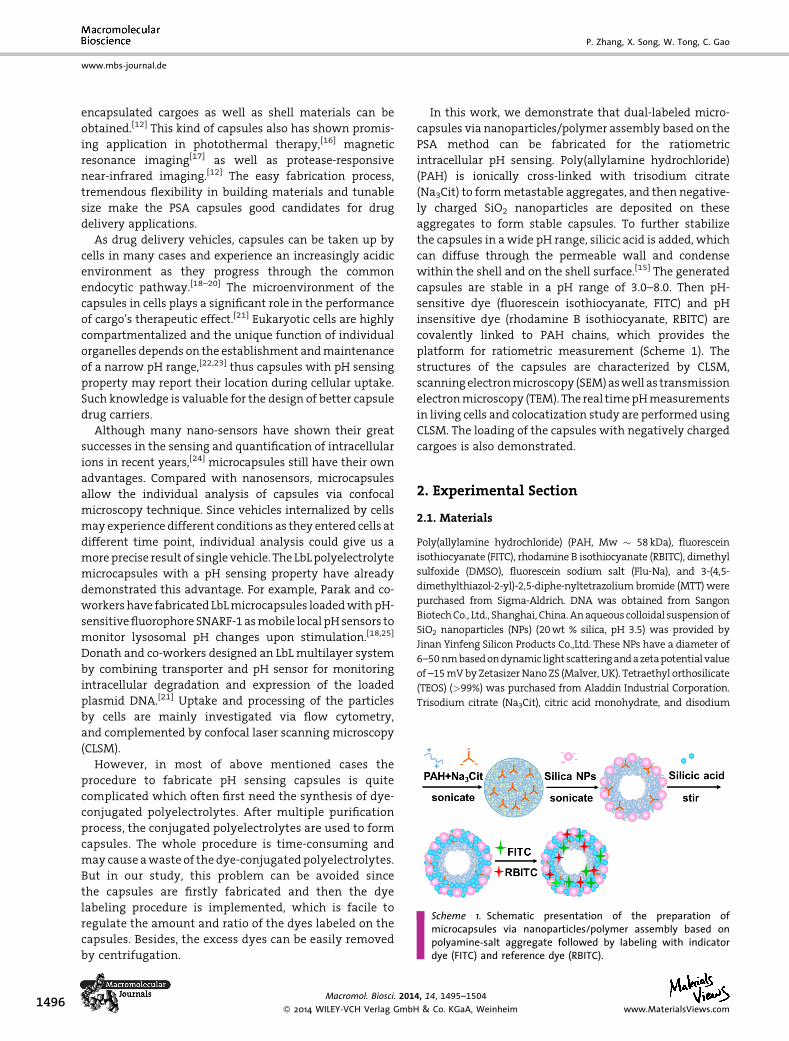
Scheme 1. Schematic presentation of the preparation ofmicrocapsules via nanoparticles/polymer assembly based onpolyamine-salt aggregate followed by labeling with indicatordye (FITC) and reference dye (RBITC).
www.mbs-journal.de
P. Zhang, X. Song, W. Tong, C. Gao
1496
encapsulated cargoes as well as shell materials can be
obtained.[12] This kind of capsules also has shown promis-
ing application in photothermal therapy,[16] magnetic
resonance imaging[17] as well as protease-responsive
near-infrared imaging.[12] The easy fabrication process,
tremendous flexibility in building materials and tunable
size make the PSA capsules good candidates for drug
delivery applications.
As drug delivery vehicles, capsules can be taken up by
cells in many cases and experience an increasingly acidic
environment as they progress through the common
endocytic pathway.[18–20] The microenvironment of the
capsules in cells plays a significant role in the performance
of cargo’s therapeutic effect.[21] Eukaryotic cells are highly
compartmentalized and the unique function of individual
organelles depends on the establishment andmaintenance
of a narrow pH range,[22,23] thus capsules with pH sensing
property may report their location during cellular uptake.
Such knowledge is valuable for the design of better capsule
drug carriers.
Although many nano-sensors have shown their great
successes in the sensing and quantification of intracellular
ions in recent years,[24] microcapsules still have their own
advantages. Compared with nanosensors, microcapsules
allow the individual analysis of capsules via confocal
microscopy technique. Since vehicles internalized by cells
may experience different conditions as they entered cells at
different time point, individual analysis could give us a
moreprecise result of single vehicle. The LbLpolyelectrolyte
microcapsules with a pH sensing property have already
demonstrated this advantage. For example, Parak and co-
workers have fabricated LbLmicrocapsules loadedwithpH-
sensitivefluorophore SNARF-1asmobile local pHsensors to
monitor lysosomal pH changes upon stimulation.[18,25]
Donath and co-workers designed an LbLmultilayer system
by combining transporter and pH sensor for monitoring
intracellular degradation and expression of the loaded
plasmid DNA.[21] Uptake and processing of the particles
by cells are mainly investigated via flow cytometry,
and complemented by confocal laser scanning microscopy
(CLSM).
However, in most of above mentioned cases the
procedure to fabricate pH sensing capsules is quite
complicated which often first need the synthesis of dye-
conjugated polyelectrolytes. After multiple purification
process, the conjugated polyelectrolytes are used to form
capsules. The whole procedure is time-consuming and
may cause awaste of the dye-conjugatedpolyelectrolytes.
But in our study, this problem can be avoided since
the capsules are firstly fabricated and then the dye
labeling procedure is implemented, which is facile to
regulate the amount and ratio of the dyes labeled on the
capsules. Besides, the excess dyes can be easily removed
by centrifugation.
Macromol. Biosci. 201
� 2014 WILEY-VCH Verlag GmbH
In this work, we demonstrate that dual-labeled micro-
capsules via nanoparticles/polymer assembly based on the
PSA method can be fabricated for the ratiometric
intracellular pH sensing. Poly(allylamine hydrochloride)
(PAH) is ionically cross-linked with trisodium citrate
(Na3Cit) to formmetastable aggregates, and then negative-
ly charged SiO2 nanoparticles are deposited on these
aggregates to form stable capsules. To further stabilize
the capsules in awide pH range, silicic acid is added, which
can diffuse through the permeable wall and condense
within the shell and on the shell surface.[15] The generated
capsules are stable in a pH range of 3.0–8.0. Then pH-
sensitive dye (fluorescein isothiocyanate, FITC) and pH
insensitive dye (rhodamine B isothiocyanate, RBITC) are
covalently linked to PAH chains, which provides the
platform for ratiometric measurement (Scheme 1). The
structures of the capsules are characterized by CLSM,
scanningelectronmicroscopy (SEM)aswell as transmission
electronmicroscopy (TEM). The real timepHmeasurements
in living cells and colocatization study are performed using
CLSM. The loading of the capsules with negatively charged
cargoes is also demonstrated.
2. Experimental Section
2.1. Materials
Poly(allylamine hydrochloride) (PAH, Mw � 58kDa), fluorescein
isothiocyanate (FITC), rhodamine B isothiocyanate (RBITC), dimethyl
sulfoxide (DMSO), fluorescein sodium salt (Flu-Na), and 3-(4,5-
dimethylthiazol-2-yl)-2,5-diphe-nyltetrazoliumbromide (MTT) were
purchased from Sigma-Aldrich. DNA was obtained from Sangon
BiotechCo., Ltd., Shanghai, China.Anaqueouscolloidal suspensionof
SiO2 nanoparticles (NPs) (20wt % silica, pH 3.5) was provided by
Jinan Yinfeng Silicon Products Co.,Ltd. These NPs have a diameter of
6–50nmbasedondynamic lightscatteringandazetapotentialvalue
of –15mVbyZetasizerNanoZS (Malver, UK). Tetraethyl orthosilicate
(TEOS) (>99%) was purchased from Aladdin Industrial Corporation.
Trisodium citrate (Na3Cit), citric acid monohydrate, and disodium
4, 14, 1495–1504
& Co. KGaA, Weinheim www.MaterialsViews.com
Nanoparticle/Polymer Assembled Microcapsules . . .
www.mbs-journal.de
hydrogen phosphate dodecahydrate (Na2HPO4) were purchased
from Sinopharm Chemical Reagent Co.,Ltd. LysoTracker Green was
obtained from Invitrogen Co., USA. All chemicals were used as
received.Thewaterusedthroughoutall experimentswasprepared in
aMilliporeMilli-Q Referencepurification systemwith a resistanceof
18.2MV cm�1.
2.2. Fabrication of SiO2 NPs/PAH Capsules
PAH-citrate aggregateswerefirst prepared bymixing PAHsolution
(10mL, 2mgmL�1) and Na3Cit solution (25mL, 28.83mM) under
ultrasonication for 10s. The resulting suspension turned turbid
immediately, indicating the formation of PAH-citrate aggre-
gates.[14] After 2min aging, 25mL of 1.2wt% SiO2 NPs solution
(pH 3.5, adjusted with 1M HCl) was added into the prepared PAH-
citrate aggregates suspension under ultrasonication for 20 s. Then
themixed suspensionwasaged for 2hunder shaking to formstable
SiO2NPs/PAHcapsules. Toobtainmorestable capsules inawidepH
range, silicic acid treatment of the SiO2 NPs/PAH capsules was
further conducted. First, 0.31mL TEOS was added to a mixture of
24.44mL water and 0.25mL 0.1M HCl to form silicic acid clusters
with a composition of Si(OH)4.[13] After aged for 30min, the silicic
acid solution (25mL in total) was added into the above 60mL SiO2
NPs/PAH capsules suspension. After stirred for 30min at room
temperature, the capsules were separated by centrifugation
(4000 rpm, 3min), washed three times with water, and finally
dispersed in water for later use.
2.3. Fabrication of Dual-Labeled Microcapsules
The requireddyes (67mL FITCand185mLRBITC) fromstock solution
(1mgmL�1 in DMSO) were added into 52mL microcapsule
suspension (�1� 108 microcapsules per mL in NaHCO3/Na2CO3
buffer solution, pH 9.4). The mixture was agitated at room
temperature in dark for 12h. Then the labeled capsules were
separated by centrifugation (4000 rpm, 3min) and washed three
timeswithwater to remove free dyes. For the fabrication of RBITC-
labeled microcapsules, only RBITC was added and the following
procedures were the same as described above.
2.4. Cell Culture
Murine macrophage cell RAW 246.7, human HepG2 cells and
human endothelial cells (CRL-1730) were obtained from the Cell
Bank of Typical Culture Collection of the Chinese Academy of
Sciences (Shanghai, China). Primary human normal liver cells
(Hepli cells) were obtained from the First Affiliated Hospital,
College of Medicine, Zhejiang University. The RAW 246.7 cells and
HepG2 cells were cultured in Dulbecco’s modified eagle media
(DMEM, Gibco, USA) consisting of high-glucose, supplemented
with 10% fetal bovine serum (FBS, Sijiqing Inc., Hangzhou, China),
100UmL�1 penicillin, and 100mgmL�1 streptomycin and cultured
at 37 8C in a 5% CO2 humidified environment. The Hepli cells were
maintained in DMEM consisting of low-glucose, supplemented
with 10% FBS, 100UmL�1 penicillin, and 100mgmL�1 streptomy-
cin and cultured at 37 8C in a 5% CO2 humidified environment. The
CRL-1730 cells were maintained with regular growth medium
Macromol. Biosci. 20
� 2014 WILEY-VCH Verlag Gmwww.MaterialsViews.com
consisting of high-glucose RPMI 1640 supplementedwith 10% FBS,
100UmL�1 penicillin, and 100mgmL�1 streptomycin and cultured
at 37 8C in a 5% CO2 humidified environment.
2.5. Generation of in Vitro Calibration Curve
In vitro pH calibration curves were obtained from CLSM images of
themicrocapsules inbufferswithartificial cytoplasm frompH3.8 to
7.8. To prepare buffers with artificial cytoplasm,[24] RAW 246.7 cells
(1� 106 per mL in water) were broken by sonication for 30min and
thenmixedwithbuffers (volumeratio1:2), and thepHwasadjusted.
Images were captured by a sequential line scanning model, with
excitation at 488nmand 543nm, respectively. The emission signals
were collected from 500 to 550nm for the green channel and from
570 to 630nm for the red channel, respectively. The background
fluorescence was zeroed by adjusting the gain and offset values. All
images were taken under the same settings (e.g., laser power, gain,
pinhole and zoom). Image processing and analysis were performed
on the Leica software (LAS AF Lite). Region of interest (ROI) was
selected based on peripheries of the microcapsules. The ratio of the
grey values between the two channels was calculated for
quantitative ratiometric analysis. 30 individual capsules in three
images were analyzed for each pH value measurement. Calibration
curve was generated by plotting the average values together with
the standard deviation versus pH values.
2.6. CLSM Imaging and Localized Intracellular pH
Measurement
The RAW 246.7 cells were seeded in a 20-mm glass bottom cell
culture dish at a density of 7� 104 cells per well at 37 8C. After24h, the culture medium was changed and dual-labeled micro-
capsules were added at a capsule/cell ratio of 50:1. The concentra-
tion of the capsules stock solution was determined by a counting
chamber. Cells were incubated with microcapsules for 24h (and
3h and 6h for the kinetic study). Before CLSM imaging, the cells
were rinsed 3 times with phosphate-buffered saline (PBS) to
remove non-adhered microcapsules and then kept in culture
medium without phenol-red for CLSM imaging. The cells were
mounted on the microscope stage equipped with a temperature
controlled incubator box and CO2 supply for optimal growth
conditions during observation. Cells were imaged in a sequential
line scanning mode by 488 and 543nm lasers along with a bright
field image. Generally, 20–40 positions were selected and more
than 100 capsules were analyzed. The same procedures were
done for the intracellular pH measurement of HepG2, CRL-1730
and Hepli cells after 24 h uptake of microcapsule sensors.
2.7. Co-localization
RAW 246.7 cells were seeded in a 20-mm glass bottom cell culture
dish at a density of 7�104 cells per well at 37 8C for 24h. After
treated with RBITC-labeled microcapsules at a concentration of 50
capsules per cell for 24h, the cells were washed 3 times with PBS
and incubatedwith LysoTracker Green at 37 8C for another 30min.
They were then washed and imaged by CLSM as described above.
Images processing were conducted using Image J (NIH).
14, 14, 1495–1504
bH & Co. KGaA, Weinheim 1497
www.mbs-journal.de
P. Zhang, X. Song, W. Tong, C. Gao
1498
2.8. Loading of Negatively Charged Molecules
Due to the remaining positive charges of PAH, negatively charged
molecules can be easily loaded into the capsules. Fish sperm DNA
was chosen as the negatively charged biomacromolecular model
drug. The unlabeled SiO2 NPs/PAH microcapsules (�1.25� 109
microcapsulespermL)were incubated inDNAsolution (1mgmL�1,
0.05MNaCl) for12hunderconstantshaking.The resultantcapsules
were washed with fresh 0.05M NaCl solution thrice and finally
washed twicewithwater. The supernatantwas carefully collected
for UV–vis spectroscopy measurement (Shimadzu UV-vis 2550).
The concentration of the supernatant was determined at 260nm
and by referring to a calibration curve. The amount of loaded DNA
was calculated by the difference of the feeding drug to the
determined in the supernatant. All data were averaged from 3
parallel experiments. For fluorescent microscope (Zeiss Axiovert
200) observation, FITC-DNA was synthesized according to the
literature.[26,27] Low-molecular-weight model drug Flu-Na was
loaded in the same way.
2.9. Characterizations
2.9.1. Confocal Laser Scanning Microscopy (CLSM)
Confocal images were taken with Leica TCS SP5 confocal scanning
system equipped with a 63�oil immersion objective. A drop of
capsules suspensionwasappliedontoa glass slide for visualization
after theywereprecipitated.Todeterminethecapsulesdiameter,at
least 200 capsules, dispersed in PBS, were analyzed by Image J
software.
2.9.2. Scanning Electron Microscopy (SEM)
Adropof SiO2NPs/PAHcapsules suspensionwas applied on a glass
slide and dried in air overnight. After sputtered with gold, the
samples were observed with HITACHI S-4800 instrument at an
operation voltage of 3 kV.
2.9.3. Transmission Electron Microscopy (TEM)
The SiO2 NPs/PAH capsules were washed with graded ethanol/
water solutions. The sample was embedded into epoxy resin and
ultramicrotomed into thin sections, whichwere transferred onto a
carbon film-coated copper grid and observed by a Philips Tecnal-10
TEM.
2.9.4. Zeta potential measurements
ZetapotentialmeasurementswereperformedonZetasizerNanoZS
(Malver, UK). The results were averaged from 3 parallel
measurements.
2.9.5. Fluorescence Spectroscopy
For the pH-sensingmeasurement, universal buffer solutions of pH
ranging from 3.8 to 7.8 were first prepared using stock solutions of
Na2HPO4 (250mL,0.2M) andcitric acidmonohydrate (250mL,0.1M)
with different volumes.[28] Then the series of buffer solutionswere
mixed with water (volume ratio of 2:1). The pH was measured by
Macromol. Biosci. 201
� 2014 WILEY-VCH Verlag GmbH
FE-20-FiveEasyTM pH meter (Mettler Toledo, Switzerland). Then
microcapsules were mixed with buffer solutions (�1� 108 micro-
capsules permL). The emission signals in the ranges of 510–560nm
(excited at 488nm) and 570–620nm (excited at 543nm) were
collected using FL-55 fluorometer (Perkin Elmer, Japan),
respectively.
2.9.6. Fluorescence reversibility of microcapsules with pH
ThepHof themicrocapsules buffer solutionwas switchedbetween
4.0 and 7.0 repeatedly by 2M HCl or NaOH. The fluorescence
emission spectra excited at 488nmand 543nmwere recorded. The
ratio of signal (R¼ I525/I585) was calculated from the fluorescence
intensity at 525nm and 585nm.
3. Results and Discussion
3.1. Fabrication of SiO2 NPs/PAH Microcapsules with
pH Sensing Property
Compared with other techniques, the polyamine–salt
aggregates assembly method has several advantages. The
fabrication process only involves simplemixing and can be
conducted at mild conditions in aqueous solution. By
changing the fabrication conditionsandbuildingmaterials,
the size as well as the composition can be tuned to fulfill
various applications. Furthermore, different cargoes can be
easily encapsulated by using them as one of building
materials.[12] Thus this kind of capsules can be easily
fabricated in large scale and are good candidates for
functional drug delivery vehicles.
In our study, the capsules were fabricated by this
technique. The amine groups on PAH chains can be
ionically cross-linked by trivalent citrate anions to form
aggregates immediately when mixed with Na3Cit. Then
negatively charged silica nanoparticles were assembled on
these aggregates, which served as templates to generate
SiO2NPs/PAHmicrocapsules.[13] But thegeneratedcapsules
were not stable below pH 4, which is near the isoelectric
point of silica.[29] In this case the capsules were disas-
sembled due to the charge lose of silica. To further stabilize
the capsules, the silicic acid treatment was applied. The
generated capsules can hold stable structures in buffers
with pH ranging from 3.0 to 8.0, and thereby meet the
intracellular pH sensing requirement. The obtained capsu-
les can be well dispersed in aqueous solution (Figure 1a).
They have an average size of 1.7� 0.3mm. The capsules are
positively charged with a zeta potential of 20.9� 0.7mV
due to the presence of PAH amine groups exposed at the
capsule surface. This size distribution as well as the
positively charged surface can facilitate cell uptake of
the capsules. Bymixingwith dye solutions, FITC and RBITC
were covalently linked to the microcapsules through
the reaction between their isothiocyanate groups and the
amino groups of PAH. The capsules showahollowstructure
4, 14, 1495–1504
& Co. KGaA, Weinheim www.MaterialsViews.com
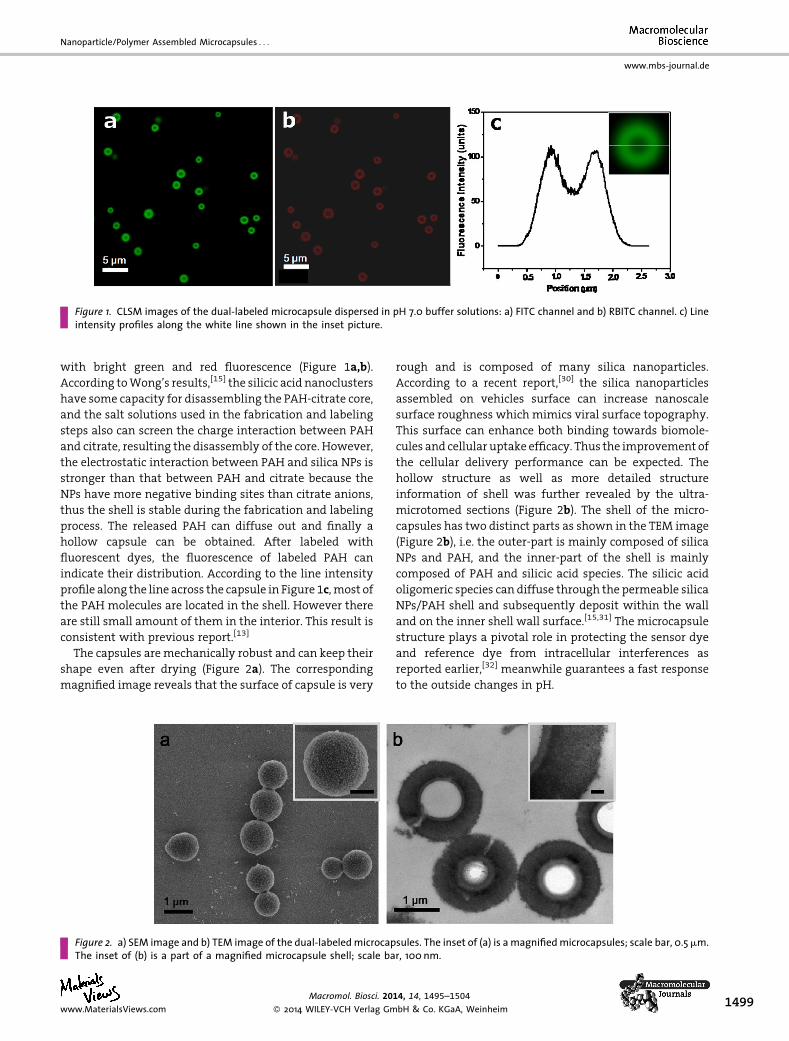
Figure 1. CLSM images of the dual-labeled microcapsule dispersed in pH 7.0 buffer solutions: a) FITC channel and b) RBITC channel. c) Lineintensity profiles along the white line shown in the inset picture.
Nanoparticle/Polymer Assembled Microcapsules . . .
www.mbs-journal.de
with bright green and red fluorescence (Figure 1a,b).
According toWong’s results,[15] the silicic acid nanoclusters
have some capacity for disassembling the PAH-citrate core,
and the salt solutions used in the fabrication and labeling
steps also can screen the charge interaction between PAH
and citrate, resulting the disassembly of the core. However,
the electrostatic interaction between PAH and silica NPs is
stronger than that between PAH and citrate because the
NPs have more negative binding sites than citrate anions,
thus the shell is stable during the fabrication and labeling
process. The released PAH can diffuse out and finally a
hollow capsule can be obtained. After labeled with
fluorescent dyes, the fluorescence of labeled PAH can
indicate their distribution. According to the line intensity
profile along the line across the capsule in Figure 1c,most of
the PAH molecules are located in the shell. However there
are still small amount of them in the interior. This result is
consistent with previous report.[13]
The capsules aremechanically robust and can keep their
shape even after drying (Figure 2a). The corresponding
magnified image reveals that the surface of capsule is very
Figure 2. a) SEM image and b) TEM image of the dual-labeledmicrocapThe inset of (b) is a part of a magnified microcapsule shell; scale ba
Macromol. Biosci. 20
� 2014 WILEY-VCH Verlag Gmwww.MaterialsViews.com
rough and is composed of many silica nanoparticles.
According to a recent report,[30] the silica nanoparticles
assembled on vehicles surface can increase nanoscale
surface roughness which mimics viral surface topography.
This surface can enhance both binding towards biomole-
cules and cellular uptake efficacy. Thus the improvement of
the cellular delivery performance can be expected. The
hollow structure as well as more detailed structure
information of shell was further revealed by the ultra-
microtomed sections (Figure 2b). The shell of the micro-
capsules has two distinct parts as shown in the TEM image
(Figure 2b), i.e. the outer-part is mainly composed of silica
NPs and PAH, and the inner-part of the shell is mainly
composed of PAH and silicic acid species. The silicic acid
oligomeric species can diffuse through the permeable silica
NPs/PAH shell and subsequently deposit within the wall
and on the inner shell wall surface.[15,31] The microcapsule
structure plays a pivotal role in protecting the sensor dye
and reference dye from intracellular interferences as
reported earlier,[32] meanwhile guarantees a fast response
to the outside changes in pH.
sules. The inset of (a) is a magnifiedmicrocapsules; scale bar, 0.5mm.r, 100nm.
14, 14, 1495–1504
bH & Co. KGaA, Weinheim 1499
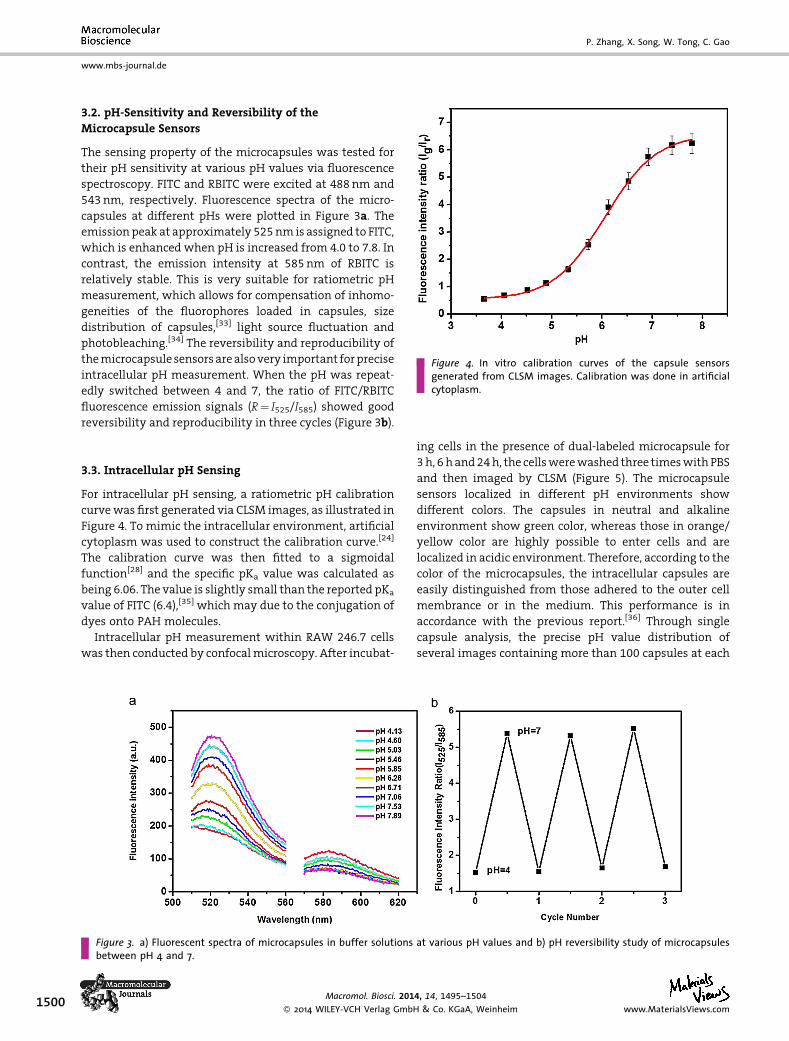
Figure 4. In vitro calibration curves of the capsule sensorsgenerated from CLSM images. Calibration was done in artificialcytoplasm.
www.mbs-journal.de
P. Zhang, X. Song, W. Tong, C. Gao
1500
3.2. pH-Sensitivity and Reversibility of the
Microcapsule Sensors
The sensing property of the microcapsules was tested for
their pH sensitivity at various pH values via fluorescence
spectroscopy. FITC and RBITC were excited at 488nm and
543nm, respectively. Fluorescence spectra of the micro-
capsules at different pHs were plotted in Figure 3a. The
emission peak at approximately 525nm is assigned to FITC,
which is enhanced when pH is increased from 4.0 to 7.8. In
contrast, the emission intensity at 585nm of RBITC is
relatively stable. This is very suitable for ratiometric pH
measurement, which allows for compensation of inhomo-
geneities of the fluorophores loaded in capsules, size
distribution of capsules,[33] light source fluctuation and
photobleaching.[34] The reversibility and reproducibility of
themicrocapsule sensorsarealsovery important forprecise
intracellular pH measurement. When the pH was repeat-
edly switched between 4 and 7, the ratio of FITC/RBITC
fluorescence emission signals (R¼ I525/I585) showed good
reversibility and reproducibility in three cycles (Figure 3b).
3.3. Intracellular pH Sensing
For intracellular pH sensing, a ratiometric pH calibration
curvewas first generated via CLSM images, as illustrated in
Figure 4. To mimic the intracellular environment, artificial
cytoplasm was used to construct the calibration curve.[24]
The calibration curve was then fitted to a sigmoidal
function[28] and the specific pKa value was calculated as
being 6.06. The value is slightly small than the reported pKa
value of FITC (6.4),[35] which may due to the conjugation of
dyes onto PAH molecules.
Intracellular pH measurement within RAW 246.7 cells
was then conducted by confocalmicroscopy. After incubat-
Figure 3. a) Fluorescent spectra of microcapsules in buffer solutionsbetween pH 4 and 7.
Macromol. Biosci. 201
� 2014 WILEY-VCH Verlag GmbH
ing cells in the presence of dual-labeled microcapsule for
3 h, 6 hand24h, the cellswerewashed three timeswithPBS
and then imaged by CLSM (Figure 5). The microcapsule
sensors localized in different pH environments show
different colors. The capsules in neutral and alkaline
environment show green color, whereas those in orange/
yellow color are highly possible to enter cells and are
localized in acidic environment. Therefore, according to the
color of the microcapsules, the intracellular capsules are
easily distinguished from those adhered to the outer cell
membrance or in the medium. This performance is in
accordance with the previous report.[36] Through single
capsule analysis, the precise pH value distribution of
several images containing more than 100 capsules at each
at various pH values and b) pH reversibility study of microcapsules
4, 14, 1495–1504
& Co. KGaA, Weinheim www.MaterialsViews.com
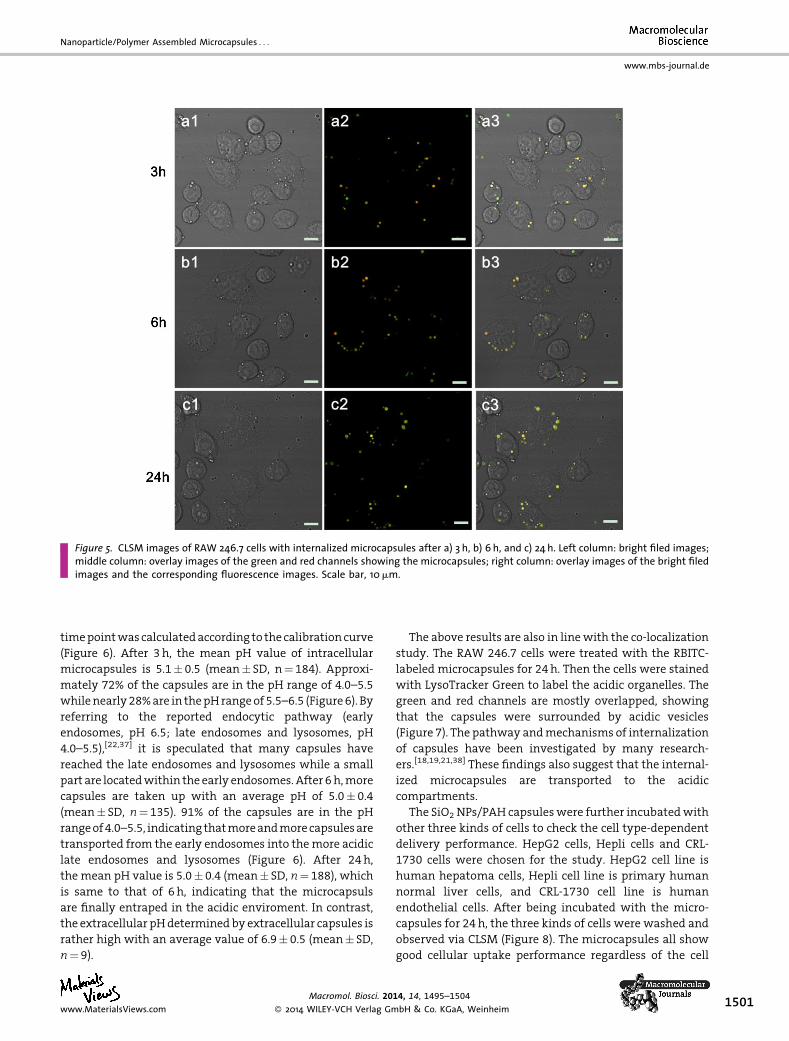
Figure 5. CLSM images of RAW 246.7 cells with internalized microcapsules after a) 3 h, b) 6 h, and c) 24 h. Left column: bright filed images;middle column: overlay images of the green and red channels showing the microcapsules; right column: overlay images of the bright filedimages and the corresponding fluorescence images. Scale bar, 10mm.
Nanoparticle/Polymer Assembled Microcapsules . . .
www.mbs-journal.de
timepointwascalculatedaccording to thecalibrationcurve
(Figure 6). After 3 h, the mean pH value of intracellular
microcapsules is 5.1� 0.5 (mean� SD, n¼ 184). Approxi-
mately 72% of the capsules are in the pH range of 4.0–5.5
whilenearly28%are in thepHrangeof5.5–6.5 (Figure6). By
referring to the reported endocytic pathway (early
endosomes, pH 6.5; late endosomes and lysosomes, pH
4.0–5.5),[22,37] it is speculated that many capsules have
reached the late endosomes and lysosomes while a small
part are locatedwithin the early endosomes.After 6h,more
capsules are taken up with an average pH of 5.0� 0.4
(mean� SD, n¼ 135). 91% of the capsules are in the pH
rangeof4.0–5.5, indicating thatmoreandmorecapsulesare
transported from the early endosomes into themore acidic
late endosomes and lysosomes (Figure 6). After 24h,
the mean pH value is 5.0� 0.4 (mean� SD, n¼ 188), which
is same to that of 6h, indicating that the microcapsuls
are finally entraped in the acidic enviroment. In contrast,
the extracellular pHdeterminedby extracellular capsules is
rather high with an average value of 6.9� 0.5 (mean� SD,
n¼ 9).
Macromol. Biosci. 20
� 2014 WILEY-VCH Verlag Gmwww.MaterialsViews.com
The above results are also in linewith the co-localization
study. The RAW 246.7 cells were treated with the RBITC-
labeled microcapsules for 24h. Then the cells were stained
with LysoTracker Green to label the acidic organelles. The
green and red channels are mostly overlapped, showing
that the capsules were surrounded by acidic vesicles
(Figure 7). The pathway andmechanisms of internalization
of capsules have been investigated by many research-
ers.[18,19,21,38] These findings also suggest that the internal-
ized microcapsules are transported to the acidic
compartments.
The SiO2 NPs/PAH capsuleswere further incubatedwith
other three kinds of cells to check the cell type-dependent
delivery performance. HepG2 cells, Hepli cells and CRL-
1730 cells were chosen for the study. HepG2 cell line is
human hepatoma cells, Hepli cell line is primary human
normal liver cells, and CRL-1730 cell line is human
endothelial cells. After being incubated with the micro-
capsules for 24 h, the three kinds of cells were washed and
observed via CLSM (Figure 8). The microcapsules all show
good cellular uptake performance regardless of the cell
14, 14, 1495–1504
bH & Co. KGaA, Weinheim 1501
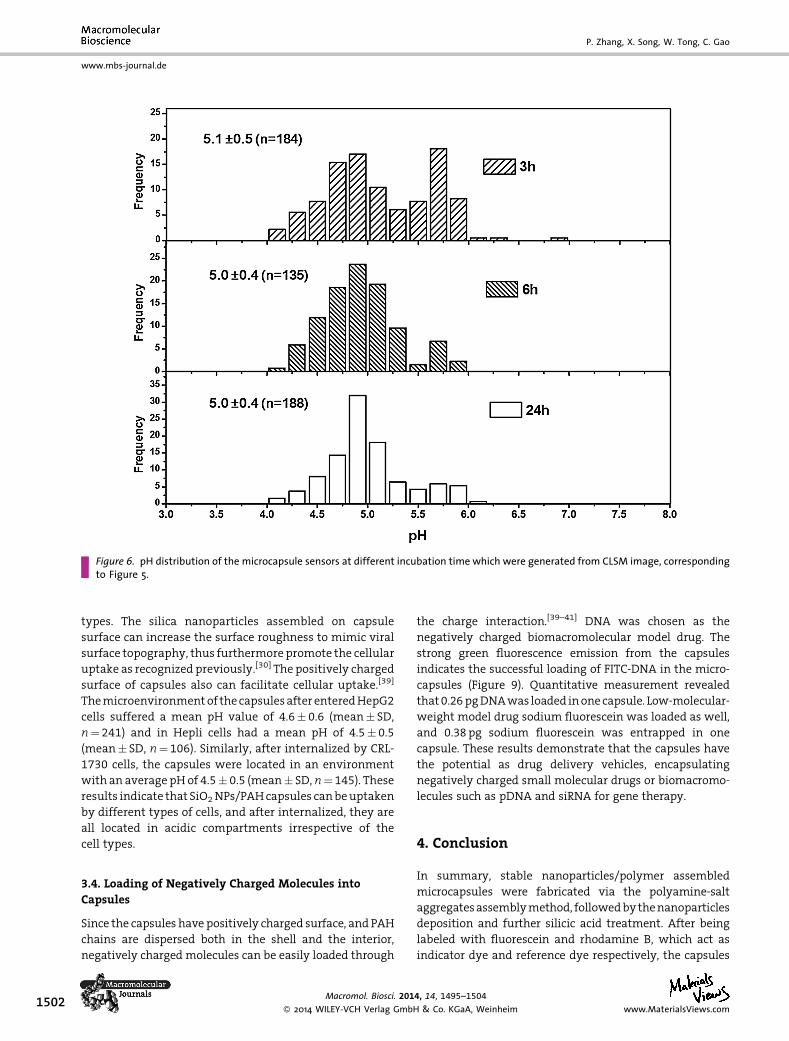
Figure 6. pH distribution of the microcapsule sensors at different incubation time which were generated from CLSM image, correspondingto Figure 5.
www.mbs-journal.de
P. Zhang, X. Song, W. Tong, C. Gao
1502
types. The silica nanoparticles assembled on capsule
surface can increase the surface roughness to mimic viral
surface topography, thus furthermore promote the cellular
uptake as recognized previously.[30] The positively charged
surface of capsules also can facilitate cellular uptake.[39]
Themicroenvironmentof thecapsulesafter enteredHepG2
cells suffered a mean pH value of 4.6� 0.6 (mean� SD,
n¼ 241) and in Hepli cells had a mean pH of 4.5� 0.5
(mean� SD, n¼ 106). Similarly, after internalized by CRL-
1730 cells, the capsules were located in an environment
with an average pHof 4.5� 0.5 (mean� SD,n¼ 145). These
results indicate that SiO2NPs/PAHcapsules canbeuptaken
by different types of cells, and after internalized, they are
all located in acidic compartments irrespective of the
cell types.
3.4. Loading of Negatively Charged Molecules into
Capsules
Since the capsules have positively charged surface, and PAH
chains are dispersed both in the shell and the interior,
negatively charged molecules can be easily loaded through
Macromol. Biosci. 201
� 2014 WILEY-VCH Verlag GmbH
the charge interaction.[39–41] DNA was chosen as the
negatively charged biomacromolecular model drug. The
strong green fluorescence emission from the capsules
indicates the successful loading of FITC-DNA in the micro-
capsules (Figure 9). Quantitative measurement revealed
that0.26pgDNAwas loaded inonecapsule. Low-molecular-
weight model drug sodium fluorescein was loaded as well,
and 0.38pg sodium fluorescein was entrapped in one
capsule. These results demonstrate that the capsules have
the potential as drug delivery vehicles, encapsulating
negatively charged small molecular drugs or biomacromo-
lecules such as pDNA and siRNA for gene therapy.
4. Conclusion
In summary, stable nanoparticles/polymer assembled
microcapsules were fabricated via the polyamine-salt
aggregatesassemblymethod, followedbythenanoparticles
deposition and further silicic acid treatment. After being
labeled with fluorescein and rhodamine B, which act as
indicator dye and reference dye respectively, the capsules
4, 14, 1495–1504
& Co. KGaA, Weinheim www.MaterialsViews.com
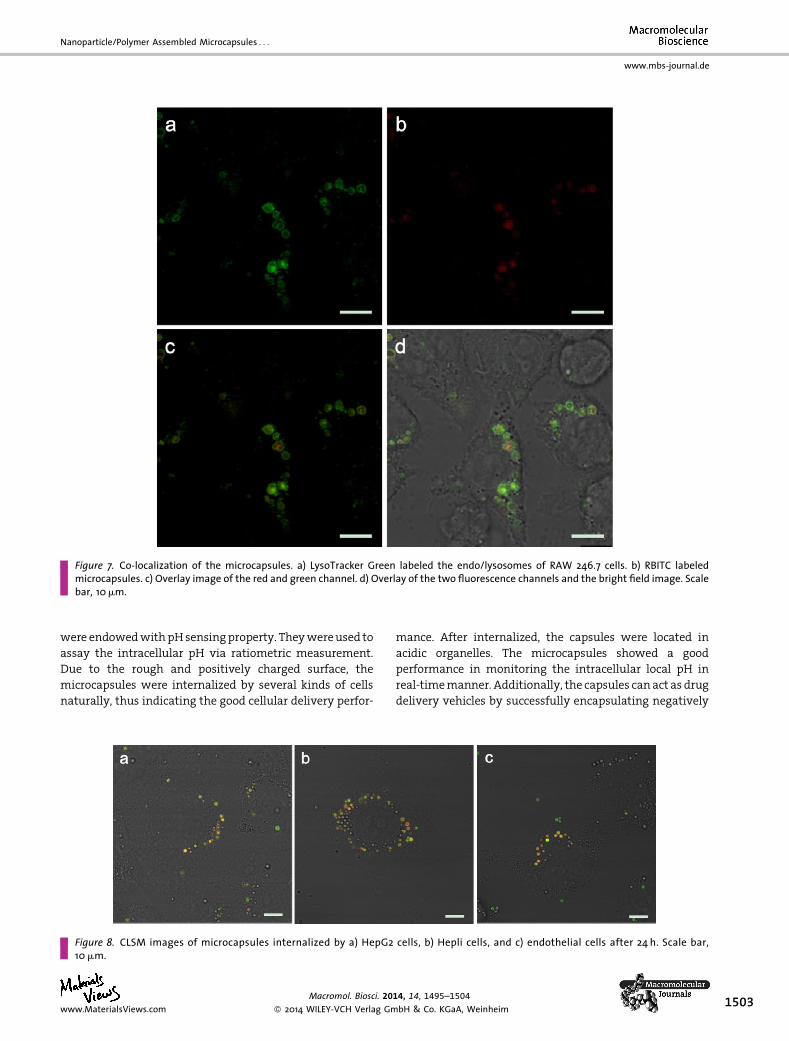
Figure 7. Co-localization of the microcapsules. a) LysoTracker Green labeled the endo/lysosomes of RAW 246.7 cells. b) RBITC labeledmicrocapsules. c) Overlay image of the red and green channel. d) Overlay of the two fluorescence channels and the bright field image. Scalebar, 10mm.
Nanoparticle/Polymer Assembled Microcapsules . . .
www.mbs-journal.de
were endowedwithpHsensingproperty. Theywereused to
assay the intracellular pH via ratiometric measurement.
Due to the rough and positively charged surface, the
microcapsules were internalized by several kinds of cells
naturally, thus indicating the good cellular delivery perfor-
Figure 8. CLSM images of microcapsules internalized by a) HepG210mm.
Macromol. Biosci. 20
� 2014 WILEY-VCH Verlag Gmwww.MaterialsViews.com
mance. After internalized, the capsules were located in
acidic organelles. The microcapsules showed a good
performance in monitoring the intracellular local pH in
real-timemanner. Additionally, the capsules canact as drug
delivery vehicles by successfully encapsulating negatively
cells, b) Hepli cells, and c) endothelial cells after 24 h. Scale bar,
14, 14, 1495–1504
bH & Co. KGaA, Weinheim 1503
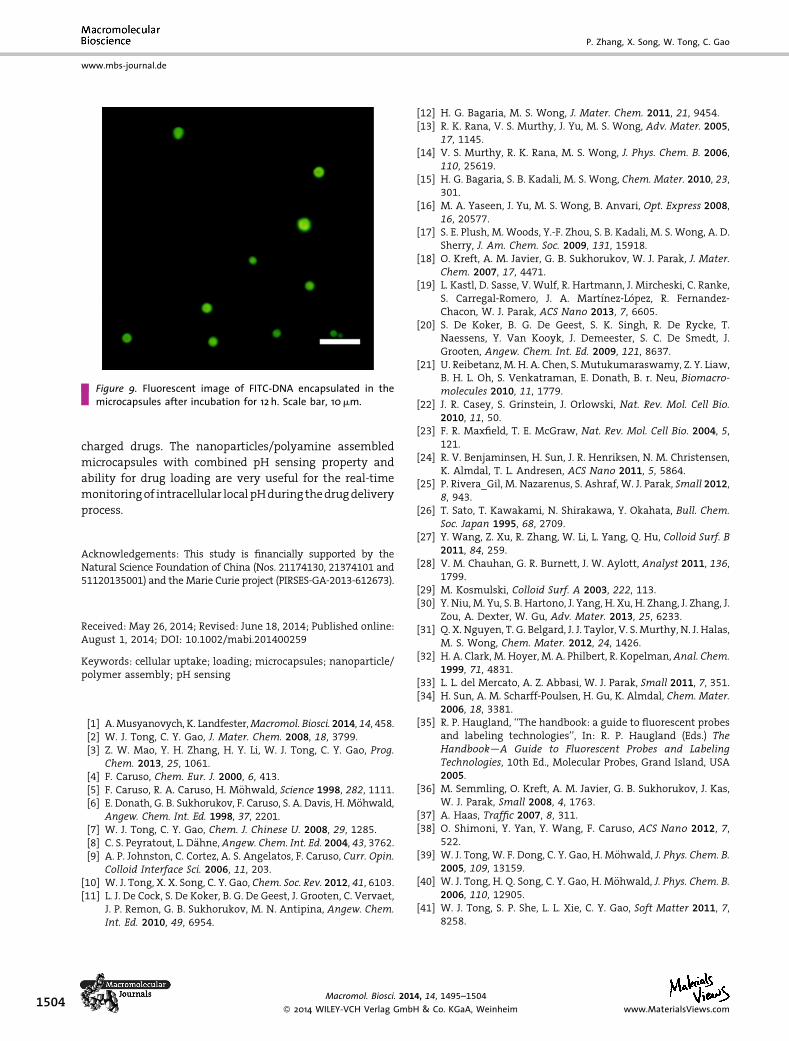
Figure 9. Fluorescent image of FITC-DNA encapsulated in themicrocapsules after incubation for 12 h. Scale bar, 10mm.
www.mbs-journal.de
P. Zhang, X. Song, W. Tong, C. Gao
1504
charged drugs. The nanoparticles/polyamine assembled
microcapsules with combined pH sensing property and
ability for drug loading are very useful for the real-time
monitoringof intracellular localpHduring thedrugdelivery
process.
Acknowledgements: This study is financially supported by theNatural Science Foundation of China (Nos. 21174130, 21374101 and51120135001) and theMarie Curie project (PIRSES-GA-2013-612673).
Received: May 26, 2014; Revised: June 18, 2014; Published online:August 1, 2014; DOI: 10.1002/mabi.201400259
Keywords: cellular uptake; loading; microcapsules; nanoparticle/polymer assembly; pH sensing
[1] A.Musyanovych, K. Landfester,Macromol. Biosci. 2014, 14, 458.[2] W. J. Tong, C. Y. Gao, J. Mater. Chem. 2008, 18, 3799.[3] Z. W. Mao, Y. H. Zhang, H. Y. Li, W. J. Tong, C. Y. Gao, Prog.
Chem. 2013, 25, 1061.[4] F. Caruso, Chem. Eur. J. 2000, 6, 413.[5] F. Caruso, R. A. Caruso, H. M€ohwald, Science 1998, 282, 1111.[6] E. Donath, G. B. Sukhorukov, F. Caruso, S. A. Davis, H. M€ohwald,
Angew. Chem. Int. Ed. 1998, 37, 2201.[7] W. J. Tong, C. Y. Gao, Chem. J. Chinese U. 2008, 29, 1285.[8] C. S. Peyratout, L. D€ahne,Angew. Chem. Int. Ed. 2004, 43, 3762.[9] A. P. Johnston, C. Cortez, A. S. Angelatos, F. Caruso, Curr. Opin.
Colloid Interface Sci. 2006, 11, 203.[10] W. J. Tong, X. X. Song, C. Y. Gao, Chem. Soc. Rev. 2012, 41, 6103.[11] L. J. De Cock, S. De Koker, B. G. De Geest, J. Grooten, C. Vervaet,
J. P. Remon, G. B. Sukhorukov, M. N. Antipina, Angew. Chem.Int. Ed. 2010, 49, 6954.
Macromol. Biosci. 201
� 2014 WILEY-VCH Verlag GmbH
[12] H. G. Bagaria, M. S. Wong, J. Mater. Chem. 2011, 21, 9454.[13] R. K. Rana, V. S. Murthy, J. Yu, M. S. Wong, Adv. Mater. 2005,
17, 1145.[14] V. S. Murthy, R. K. Rana, M. S. Wong, J. Phys. Chem. B. 2006,
110, 25619.[15] H. G. Bagaria, S. B. Kadali, M. S. Wong, Chem. Mater. 2010, 23,
301.[16] M. A. Yaseen, J. Yu, M. S. Wong, B. Anvari, Opt. Express 2008,
16, 20577.[17] S. E. Plush, M. Woods, Y.-F. Zhou, S. B. Kadali, M. S. Wong, A. D.
Sherry, J. Am. Chem. Soc. 2009, 131, 15918.[18] O. Kreft, A. M. Javier, G. B. Sukhorukov, W. J. Parak, J. Mater.
Chem. 2007, 17, 4471.[19] L. Kastl, D. Sasse, V. Wulf, R. Hartmann, J. Mircheski, C. Ranke,
S. Carregal-Romero, J. A. Mart�ınez-L�opez, R. Fernandez-Chacon, W. J. Parak, ACS Nano 2013, 7, 6605.
[20] S. De Koker, B. G. De Geest, S. K. Singh, R. De Rycke, T.Naessens, Y. Van Kooyk, J. Demeester, S. C. De Smedt, J.Grooten, Angew. Chem. Int. Ed. 2009, 121, 8637.
[21] U. Reibetanz,M. H. A. Chen, S. Mutukumaraswamy, Z. Y. Liaw,B. H. L. Oh, S. Venkatraman, E. Donath, B. r. Neu, Biomacro-molecules 2010, 11, 1779.
[22] J. R. Casey, S. Grinstein, J. Orlowski, Nat. Rev. Mol. Cell Bio.2010, 11, 50.
[23] F. R. Maxfield, T. E. McGraw, Nat. Rev. Mol. Cell Bio. 2004, 5,121.
[24] R. V. Benjaminsen, H. Sun, J. R. Henriksen, N. M. Christensen,K. Almdal, T. L. Andresen, ACS Nano 2011, 5, 5864.
[25] P. Rivera_Gil, M. Nazarenus, S. Ashraf, W. J. Parak, Small 2012,8, 943.
[26] T. Sato, T. Kawakami, N. Shirakawa, Y. Okahata, Bull. Chem.Soc. Japan 1995, 68, 2709.
[27] Y. Wang, Z. Xu, R. Zhang, W. Li, L. Yang, Q. Hu, Colloid Surf. B2011, 84, 259.
[28] V. M. Chauhan, G. R. Burnett, J. W. Aylott, Analyst 2011, 136,1799.
[29] M. Kosmulski, Colloid Surf. A 2003, 222, 113.[30] Y. Niu,M. Yu, S. B. Hartono, J. Yang, H. Xu, H. Zhang, J. Zhang, J.
Zou, A. Dexter, W. Gu, Adv. Mater. 2013, 25, 6233.[31] Q. X. Nguyen, T. G. Belgard, J. J. Taylor, V. S.Murthy, N. J. Halas,
M. S. Wong, Chem. Mater. 2012, 24, 1426.[32] H. A. Clark, M. Hoyer, M. A. Philbert, R. Kopelman,Anal. Chem.
1999, 71, 4831.[33] L. L. del Mercato, A. Z. Abbasi, W. J. Parak, Small 2011, 7, 351.[34] H. Sun, A. M. Scharff-Poulsen, H. Gu, K. Almdal, Chem. Mater.
2006, 18, 3381.[35] R. P. Haugland, ‘‘The handbook: a guide to fluorescent probes
and labeling technologies’’, In: R. P. Haugland (Eds.) TheHandbook—A Guide to Fluorescent Probes and LabelingTechnologies, 10th Ed., Molecular Probes, Grand Island, USA2005.
[36] M. Semmling, O. Kreft, A. M. Javier, G. B. Sukhorukov, J. Kas,W. J. Parak, Small 2008, 4, 1763.
[37] A. Haas, Traffic 2007, 8, 311.[38] O. Shimoni, Y. Yan, Y. Wang, F. Caruso, ACS Nano 2012, 7,
522.[39] W. J. Tong, W. F. Dong, C. Y. Gao, H. M€ohwald, J. Phys. Chem. B.
2005, 109, 13159.[40] W. J. Tong, H. Q. Song, C. Y. Gao, H. M€ohwald, J. Phys. Chem. B.
2006, 110, 12905.[41] W. J. Tong, S. P. She, L. L. Xie, C. Y. Gao, Soft Matter 2011, 7,
8258.
4, 14, 1495–1504
& Co. KGaA, Weinheim www.MaterialsViews.com