nanotubes complexed with dna and
TRANSCRIPT

7/27/2019 Nanotubes Complexed With DNA And
http://slidepdf.com/reader/full/nanotubes-complexed-with-dna-and 1/13
SH A ET AL. VOL. XXX ’ NO. XX ’ 00 0–
00 0 ’ XXXX
www.acsnano.org
A
CXXXX American Chemical Society
Nanotubes Complexed with DNA andProteins for Resistive-Pulse Sensing Jingjie Sha,†,‡ Tawfique Hasan,§ Silvia Milana,§ Cristina Bertulli,‡ Nicholas A. W. Bell,‡ Giulia Privitera,§
Zhonghua Ni,†
Yunfei Chen,†
Francesco Bonaccorso,§,^
Andrea C. Ferrari,§
Ulrich F. Keyser,‡,*
andYan Yan S. Huang‡, ),*
†School of Mechanical Engineering, Southeast University, Nanjing 210096, China, ‡Cavendish Laboratory, University of Cambridge, Cambridge CB3 0HE,
United Kingdom, §Cambridge Graphene Centre, University of Cambridge, Cambridge CB3 0FA, United Kingdom, ^CNR-IPCF, Istituto per i Processi Chimico-Fisici,
Messina 98158, Italy, and )Department of Chemical Engineering and Institute of Biotechnology, University of Cambridge, Cambridge CB2 1QT, United Kingdom
T
he molecular combination of organic
and inorganic nanomaterials has led to
developmentsof functionalhybrids.1À7
These have applications in solar cells,1 super-
conductors,2 bioelectronics,3,4,8 and medical
diagnostics,5À7,9 just to namea few examples.
In particular, systems based on the combina-
tion of water-soluble biomolecules and colloi-
dal nanomaterials have been intensively
investigated, such that versatile functional-
ities can be tailor-designed by tuning the
surface chemistry of the two components
for integration with biology.10À12 In some
cases, strong interaction affinity is already
present between the pristine forms of thetwo constituents, thus facilitating highly
stable hybrids. For example, it is possible to
assemble macromolecular hybrids based on
single-wall carbon nanotubes (SWNTs) and a
variety of biomolecules, such as viruses,1
deoxyribonucleic acid (DNA),13 lipids,14 and
proteins.9,15 Studies also reported sponta-
neous unfolding and attachment of biomo-
lecules onto SWNTs.16À19
The architecture of individual hybrids, as
well as their intermolecular aggregation,
plays a crucial role in device performance.1
To develop devices with novel functions, it
is therefore necessary to access their mo-
lecular structure on a single-molecule level.
Current technique facilitating direct struc-
tural characterization often relies on visua-
lization of the hybrids using high-resolution
microscopic techniques.16,20,21 This requires
deposition and fixing of the hybrids on a
surface. However, such a methodology di-
minishes many important attributes of hybrid
complexesin solution.Theseattributes, which
include theformationof electricdouble layers22
and the dynamic aggregation behavior,19 are
key to many potential applications of thesefunctional hybrids.5,6,10,23
Advances in solid-state nanopore tech-
nology24 have significantly progressed the
field of single-molecule sizing in solution.24À26
Information on the conformation of individual
molecules during translocation can be extra-
polated through a resistive pulse “read-out” of
the ionic current throughthe nanopore.27 This
technique was employed to study DNA fold-
ing28 and to analyze the translocation of a
wide range of biomolecules.29 However, most,
* Address correspondence to
Received for review June 29, 2013
and accepted September 25, 2013.
Published online
10.1021/nn403323k
ABSTRACT We use a resistive-pulse technique to analyze
molecular hybrids of single-wall carbon nanotubes (SWNTs) wrapped
in either single-stranded DNA or protein. Electric fields confined in a
glass capillary nanopore allow us to probe the physical size and
surface properties of molecular hybrids at the single-molecule level.
We find that the translocation duration of a macromolecular hybrid
is determined by its hydrodynamic size and solution mobility. The
event current reveals the eff ects of ion exclusion by the rod-shaped
hybrids and possible eff ects due to temporary polarization of the
SWNT core. Our results pave the way to direct sensing of small DNA or protein molecules in a large unmodified solid-state nanopore by using nanofilaments
as carriers.
KEYWORDS: nanotubes . DNA . proteins . nanopore . hybrids . sensors
A R T I C L E

7/27/2019 Nanotubes Complexed With DNA And
http://slidepdf.com/reader/full/nanotubes-complexed-with-dna-and 2/13
SH A ET AL. VOL. XXX ’ NO. XX ’ 00 0–00 0 ’ XXXX
www.acsnano.org
B
but not all,24À26,30 have been organic and monolithic
molecules.31 Reference 32 has shown thetranslocation
of SWNTs wrapped with (AC)15 (i.e., single-strand DNA
oligomers of 15 repeated units of adenine and cytosine)
through silicon nitride nanopores. This suggests the use
of solid-state nanopores as a structural characterization
tool for organicÀinorganic colloidal hybrids.
To explore the potential of using the versatile capil-
lary-based nanopores33 for molecular hybrid sensing,
we investigate the translocation characteristics of
SWNT Àbiomolecule hybrids, with diff erent sizes and
surface properties. SWNT Àbiomolecule hybrids are pre-
pared using (6,5)-enriched CoMoCAT SWNTs (diameters
of ∼0.8 nm) and arc-discharge SWNTs (diameter of
∼1.5 nm). These two commercially available SWNTs with
distinct diameter ranges were chosen to ensure that the
results are not specific to a particular SWNT choice. We
design four hybrids by noncovalent functionalization
between SWNTs and biomolecules. For the surface bind-
ing, DNA oligomer (AC)15 is chosen because it represents
a large group of short single-stranded DNA (ssDNA) that
cannot be detected in largeconventional, baresolid-state
nanopores.34 Detection would only be made feasible by
reducing the nanopore membrane thickness to below
10 nm, for example, as demonstrated by the technical
advance by ref 35. It is thus of interest to evaluate
whether using SWNTs as “carriers” of multiple, well-
organized oligomers can amplify the detection signals
in nanocapillaries,33which canbe fabricated using widely
available glass capillaries withshort processingtimes and
a high degree of controllability. We also consider SWNT
and bovine serum albumin (BSA) hybrids (SWNT ÀBSA)
because BSA is a common and well-characterized modelblood serum protein,36,37 and the hybrids have good
biocompatibility,9,38 demonstrating potential uses for
biotechnology.38À40 Following the characterization of
the hybrids usingconventional microscopy and spectros-
copy techniques, we perform our translocation experi-
ments using a nanocapillary setup. Our results show
that the ionic current characteristics of translocation
can reflectthe cross-section thickness of thehybrids with
subnanometer resolution.
RESULTS
Four SWNT Àbiomolecular hybrids with diff erent
combination of geometries and surface propertiesare produced. For the convenience of notation, the
SWNTs will be represented using their mean diameters.
We therefore label the samples as 1.5d-AC, 1.5d-AC-
6hr, 0.8d-AC, 0.8d-BSA. The prefix indicates the modal
diameter of the SWNT core, where P2 has a modal
diameter of 1.5 nm and CoMoCAT has a modal di-
ameter of 0.8 nm as confirmed by the results below.
The second part of the label indicates the biomolecule
coating. The third part, if present, indicates the dura-
tion of the sonication which diff ers from our standard
preparation period of 2 h.
We believe that detailed characterization of the
SWNT hybrids is necessary for the interpretation of
the results generated by nanocapillary detection. At-
tributes such as the geometry, charge, and zeta-
potential34 of a translocating object are the well-re-
cognized general considerations, which determine the
resistive pulse read-out. We therefore employ atomic
force microscopy (AFM) and zeta-potential measure-
ments to determine these attributes. For the SWNT-
based hybrids, specifically, we adopt Raman spectros-
copy to measure the diameter distribution and the
conduction characteristics of the SWNT cores. The
dispersion qualities of the hybrids are further validated
by photoluminescence spectroscopy (PLE). In-depth
analysis of Raman and photoluminescence spectral
signals reveal significant doping of the SWNTs by the
biomolecules, which underlies the strong binding
essential for utilizing SWNTs as a molecular carrier.
Following the characterization process, our result anal-
ysis is dedicated to the translocation of SWNT hybrids
through a nanocapillary. We focus on understanding
how the event durations and currents of translocation
can reflect the physical characteristics of the hybrids in
an aqueous solution.
Solution Characteristics of BiomoleculeÀSWNT Hybrids. Ra-
man Spectroscopy. Raman spectroscopy is a fast,
powerful, and nondestructive method for characteri-
zation of carbon materials.41,42 A number of important
parameters, such as diameter, chirality, conduction
character, orientation, doping, etc., can be obtained
from Raman characterization of SWNTs. Hence, Raman
spectroscopy was employed to measure both the raw
SWNT powders andthe deposited SWNT Àbiomoleculehybrids, shown in Figure 1.
First, in the low-frequency region of the Raman
spectra of SWNTs, radial breathing modes (RBMs)43
are observed (Figure 1a,c,e,g). Their position, Pos(RBM),
is inverselyrelated to theSWNTdiameter, d ,44À46as given
by the following: Pos(RBM) = (C 1 / d ) þ C 2.44 A variety of
C 1 and C 2 were proposed for this relation.43À45,47 Here
we use C 1 = 214.4 cmÀ1 nm and C 2 = 18.7 cmÀ1 from ref
44 because these were derived by plotting the SWNT
resonance energies as a function of inverse RBM fre-
quency, without any additional assumptions. Matching
the diameter given by Pos(RBM) with excitation wave-
length in the “Kataura plot”48 also gives information on
the semiconducting (s-SWNTs) or metallic (m-SWNTs)
character. The Gþ and GÀ bands are typically located in
the 1500À1600 cmÀ1 region.49,50 In s-SWNTs, they origi-
nate from the longitudinal (LO) and tangential (TO)
modes, respectively, derived from the splitting of the
E2g phonon of graphene.49,51 In m-SWNTs, the assign-
ment of the Gþ and GÀ bands is the opposite, and the
fwhm of the GÀ peak, fwhm(GÀ), is larger, and Pos(GÀ)
down-shifted with respect to the semiconducting co-
unterpart.49,51 Doping could also modify the positions
and fwhm values.52,53 In m-SWNTs, a Pos(GÀ) blue shift,
A R T I C L E
7/27/2019 Nanotubes Complexed With DNA And
http://slidepdf.com/reader/full/nanotubes-complexed-with-dna-and 3/13
SH A ET AL. VOL. XXX ’ NO. XX ’ 00 0–00 0 ’ XXXX
www.acsnano.org
C
accompanied by a fwhm(GÀ) decrease, is observed with
electron or hole doping.52,53 In s-SWNTs, doping up-shifts
Pos(Gþ) but does not aff ect fwhm(Gþ).52,53 Raman
spectroscopy also probes possible damage via the Dpeak.42,54,55 In the following, the RBM, G and D band
features of the hybrids are discussed, first on the
P2(1.5d) group and then on the CoMoCAT(0.8d) group.
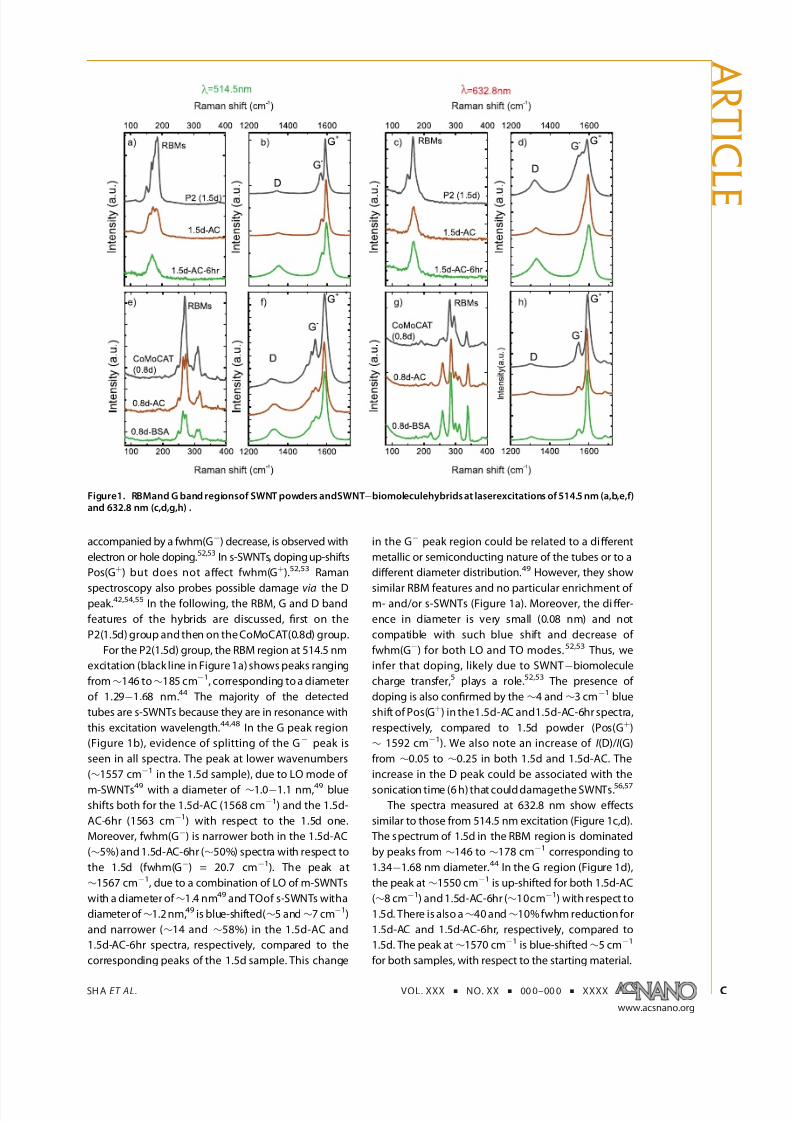
For the P2(1.5d) group, the RBM region at 514.5 nm
excitation (black line in Figure 1a) shows peaks ranging
from∼146 to∼185 cmÀ1, corresponding to a diameter
of 1.29À1.68 nm.44 The majority of the detected
tubes are s-SWNTs because they are in resonance with
this excitation wavelength.44,48 In the G peak region
(Figure 1b), evidence of splitting of the GÀ peak is
seen in all spectra. The peak at lower wavenumbers
(∼1557 cmÀ1 in the 1.5d sample), due to LO mode of
m-SWNTs49 with a diameter of ∼1.0À1.1 nm,49 blue
shifts both for the 1.5d-AC (1568 cmÀ1) and the 1.5d-
AC-6hr (1563 cmÀ1) with respect to the 1.5d one.
Moreover, fwhm(GÀ) is narrower both in the 1.5d-AC
(∼5%) and 1.5d-AC-6hr (∼50%) spectra with respect to
the 1.5d (fwhm(GÀ) = 20.7 cmÀ1). The peak at
∼1567 cmÀ1, due to a combination of LO of m-SWNTs
with a diameter of ∼1.4 nm49 and TOof s-SWNTs witha
diameter of ∼1.2 nm,49 is blue-shifted(∼5 and∼7 cmÀ1)
and narrower (∼14 and ∼58%) in the 1.5d-AC and
1.5d-AC-6hr spectra, respectively, compared to the
corresponding peaks of the 1.5d sample. This change
in the GÀ peak region could be related to a diff erent
metallic or semiconducting nature of the tubes or to a
diff erent diameter distribution.49 However, they show
similar RBM features and no particular enrichment of m- and/or s-SWNTs (Figure 1a). Moreover, the diff er-
ence in diameter is very small (0.08 nm) and not
compatible with such blue shift and decrease of
fwhm(GÀ) for both LO and TO modes.52,53 Thus, we
infer that doping, likely due to SWNT Àbiomolecule
charge transfer,5 plays a role.52,53 The presence of
doping is also confirmed by the∼4 and∼3 cmÀ1 blue
shift of Pos(Gþ) in the1.5d-AC and1.5d-AC-6hr spectra,
respectively, compared to 1.5d powder (Pos(Gþ)
∼ 1592 cmÀ1). We also note an increase of I (D)/ I (G)
from ∼0.05 to ∼0.25 in both 1.5d and 1.5d-AC. The
increase in the D peak could be associated with the
sonication time (6 h) that could damagethe SWNTs.56,57
The spectra measured at 632.8 nm show eff ects
similar to those from 514.5 nm excitation (Figure 1c,d).
The spectrum of 1.5d in the RBM region is dominated
by peaks from ∼146 to ∼178 cmÀ1 corresponding to
1.34À1.68 nm diameter.44 In the G region (Figure 1d),
the peak at∼1550 cmÀ1 is up-shifted for both 1.5d-AC
(∼8 cmÀ1) and 1.5d-AC-6hr (∼10cmÀ1) with respect to
1.5d. There is also a∼40 and∼10% fwhm reduction for
1.5d-AC and 1.5d-AC-6hr, respectively, compared to
1.5d. The peak at∼1570 cmÀ1 is blue-shifted∼5 cmÀ1
for both samples, with respect to the starting material.
Figure1. RBMand G band regionsof SWNT powders andSWNTÀbiomoleculehybrids at laserexcitations of 514.5 nm (a,b,e,f)and 632.8 nm (c,d,g,h) .
A R T I C L E

7/27/2019 Nanotubes Complexed With DNA And
http://slidepdf.com/reader/full/nanotubes-complexed-with-dna-and 4/13
SH A ET AL. VOL. XXX ’ NO. XX ’ 00 0–00 0 ’ XXXX
www.acsnano.org
D
Finally, Pos(Gþ) of 1.5d-AC and1.5d-AC-6hr is also blue-
shifted ∼2 and ∼4 cmÀ1, respectively. These confirm
the presence of doping50,58 due to the wrapping of
AC and that this eff ect increases slightly with the
sonication time. Also, we note an increase of I (D)/ I (G)
in 1.5d-AC-6hr with respect to both 1.5d and 1.5d-AC,
from ∼0.33 to ∼0.5.
We then turn our focus to the CoMoCAT (0.8d)
group. The RBM region at 514.5 nm excitation for
the CoMoCAT (0.8d) starting material (black line in
Figure 1e) has peaks from ∼207 to ∼370 cmÀ1, corre-
sponding to a diameter range of 0.61À1.14 nm.44 The
majority of the detected tubes are m-SWNTs, with the
ones havingRBMs above 300cmÀ1 being s-SWNTs.44,48
Although a blue shift of Pos(GÀ) and Pos(Gþ) is de-
tected in the Raman spectra of 0.8d-AC and 0.8d-BSA
with respect to the starting material, fwhm(GÀ) in-
creases, while fwhm(Gþ) decreases. This could be
connectedwith thepresence of m-SWNTs.49 Moreover,
I (Gþ)/ I (GÀ) increases in 0.8d-AC and 0.8d-BSA, with
respect to the starting material, another evidence of
doping.52
The RBM region at 632.8 nm for the 0.8d indicates
the presence of s-SWNTs since this wavelength is
expected to be in resonance mostly with the second
excitonic transition of 0.8d (CoMoCAT) s-SWNTs.59 In
the starting material (black line in Figure 1g), we detect
peaks rangingfrom∼174to∼385 cmÀ1 with a diameter
distribution in the 0.58À1.38 nm range.44,48 However,
the peaks at ∼282 and ∼295 cmÀ1 corresponding to
(7,5) and (8,3), respectively, are the most intense.
s-SWNTs are also mainly detected in 0.8d-AC (red line
in Figure 1g) and 0.8d-BSA (green line in Figure 1g).In the G peak region (Figure 1h), evidence of
splitting of the ∼1550 cmÀ1 peak, due to LO of
m-SWNTs and TO of s-SWNTs,49 is seen. We fit the G
peak with four Lorentzians (LOand TO of m-SWNTs and
s-SWNTs). Small diameter (<0.6 nm) m-SWNTs contri-
bute to the LO ∼1515 cmÀ1 of the starting material.49
For both 0.8d-AC and 0.8d-BSA (red line and green
lines, respectively, in Figure 1h), there is a frequency
increase (∼10À12 cmÀ1) with respect to the 0.8d
sample. Moreover, I (Gþ)/ I (GÀ) increases in 0.8d-AC
and 0.8d-BSA, with respect to the starting material,
which we take as evidence of doping.52,53
Based on the above analysis, Raman measurementsindicate doping52,53 in 1.5d-AC, 1.5d-AC-6hr, 0.8d-AC,
and 0.8d-BSA. They also show a diameter distribution
ranging from 1.29 to 1.68 nm for 1.5d and from 0.58 to
1.38 nm for 0.8d. Thus, the 0.8d samples have a larger
diameter distribution with respect to 1.5d.
Photoluminescence Spectroscopy. s-SWNTs have a
direct band gap. Therefore, photoluminescence (PL)
from the isolated s-SWNTs due to exciton recombina-
tion is expected.60 Photoluminescence excitation spec-
troscopy (PLE) is now one of the most common
techniques to monitor SWNT dispersions.59,61À66 In
PLE, the (ehii , eh11) resonances (where i = 1,2, ..., etc.)
from different SWNTs appear as sharp features at
( λex, λem), where λex and λem are the excitation and
emission wavelengths, respectively. Other peaks can
alsobe observed in PLE, eitherdue to excitonicphonon
sidebands,67À69exciton energy transfer (EET),59,61,62,70À72
or bright phonon sidebands (BS) of dark K-momentum
excitons.73 In particular, EET occurs via Förster resonance
energy transfer between SWNTs in close proximity,61,62
such as in bundles when ehii excitation of large band gap
donor nanotubes induces emission from eh11of a smaller
band gap acceptor.61,62 EET can thus identify the pre-
sence of small bundles.59,63À66 The presence of m-SWNTs
in large bundles can strongly quench the luminescence
from s-SWNTs.74 Therefore, PL is not observed in large
SWNT bundles.74 We thus use PLE to detect isolated
tubes and small bundles in SWNT Àbiomolecule disper-
sions. This is crucial for the biomolecule translocation
study through nanopores, as individualization of SWNTs
increases the charge to mass ratio of the hybrids, hence,
increasing their drivingforce. Thisconsequently increases
the probability of translocation.
Note that uncoated SWNTs, with their hydrophobic
surface, form bundles and may still be present in the
dispersions due to the 15000g centrifugation we
use here (which indeed were confirmed by AFM
analysis shown later). Such level of centrifugal force
ensures the presence of sufficient SWNTs to enable
the observation of translocation events. However,
the presence of m-SWNTs in these bundles will
strongly quench the luminescence from s-SWNTs.74
Therefore, PL will only be observed from isolated tubes
or small bundles wrapped and stabilized by the bio-molecules. Emission from large diameter (∼1.5 nm) P2
SWNTs (present in the 1.5d-AC and 1.5d-AC-6hr hybrids),
withlowest excitonictransition energy eh11> 1600nm,75,76
is not observed due to strong absorption from water77
and low sensitivity of our detector in this wavelength
region.59 In contrast, strong emission is seen from the
(6,5)-enriched CoMoCAT SWNT hybrids (0.8d-AC and
0.8d-BSA) dueto their smallerdiameter, with anassociated
emission range of 900À1100 nm.75,76 The corresponding
PLE maps are shown in Figure 2a,b, where the SWNT
chiralities giving rise to the high intensity emissions from
(eh22, eh11) resonancesare alsoindicated.60,75,76 Thestrong
(eh22, eh11) emission (571 nm, 993nm) from (6,5) and theirphonon sideband at (516 nm, 993 nm) is a signature of
isolated small diameter SWNTs that are coated with
biomolecules.61,62 Other weaker (eh22, eh11) features pre-
sent are due to isolated (6,4), (8,3), and (7,5) in 0.8d-BSA
and (8,3),(7,5), (7,6), and (8,4) in 0.8d-AC. In addition to the
key features assigned to the isolated SWNTs, one also
observes EET features due to small SWNT bundles. Forthe
0.8d-AC in Figure 2a, the bands (571 nm, 1042 nm),
(571 nm, 1124 nm), (993, 671) are assigned to EET 61,62
from (6,5) to (7,5), (6,5) to (8,4), and (8,3) to (6,5). For the
0.8d-BSA in Figure 2b, the bandat (669 nm, 993 nm) is due
A R T I C L E

7/27/2019 Nanotubes Complexed With DNA And
http://slidepdf.com/reader/full/nanotubes-complexed-with-dna-and 5/13
SH A ET AL. VOL. XXX ’ NO. XX ’ 00 0–00 0 ’ XXXX
www.acsnano.org
E
to EET from (8,3) to (6,5). We also observe EET from
sidebands of (6,5) to (7,5) and (8,4) in 0.8d-AC.
Further, we also compare the PL emission from
nanotubes in the SWNT Àbiomolecule dispersions
with a 0.8d control sample dispersed in water with
SC (sodium cholate surfactant), following the sameprocedure used for the biomolecule conjugation
(Figure.2c). The optical signatures of (6,5) and (8,3) in
0.8d-AC and 0.8d-BSA are red-shifted ∼10 meV with
respect to the SC control sample. On the other hand,
(7,5),(7,6),and (8,4) do notexhibit anynoticeable shifts.
Such large shifts in emission wavelength were also
observed by ref 5 in PLE measurements of virus-
wrapped SWNTs. The shifts are likely due to increased
doping through SWNT Àbiomolecule charge transfer,78
consistent with the Raman analysis above. The larger
shifts in emission wavelength for the smaller diameter
tubes are further enhanced by the change in surround-
ing dielectric environment due to their preferential
wrapping and isolation by the biomolecules. In parti-
cular, BSA shows a strong preference of isolating
smaller diameter SWNTs, as observed by strong emission
from isolated (6,4), (6,5), and (8,3), coupled with weak or
no emission from larger diameter SWNTs. In addition to
doping and preferential isolation of smalldiameter nano-
tubes, PLE thus confirms the presence of isolated SWNTs
and small bundles both of which are ideal candidates for
translocation through the nanopores.
Atomic Force Microscopy. Following the spectro-
scopic methods for determining the nature of the
SWNT core, AFM was performed to measure the
physical sizes of the dried, SWNTs and hybrids depos-
ited on substrates First, the diameters of the bare,
unfunctionalized SWNTs (dispersed in N -methyl-2-
pyrrolidone) are determined by AFM height measure-
ments and found to be ∼0.75À0.95 and∼1.3À1.9 nmfor CoMoCAT and P2 SWNTs, respectively. These com-
pare well with Raman spectroscopy (i.e., 0.6À1.37
and 1.29À1.68 nm for CoMoCAT and P2 SWNTs,
respectively). In all, both spectroscopy and microscopy
measurements confirm that bare CoMoCAT SWNTs
(mean diameter ∼0.8 nm) have negligible overlap in
diameter distribution compared to bare P2 SWNTs
(mean diameter ∼1.5 nm).
We then determine the size of the dehydrated
SWNT Àbiomolecule hybrids in Figure 2dÀg. Typical
AFM images are presented in the Supporting Informa-
tion. It is noted that the structure of the biomolecule-
wrapped SWNTs has previously been evaluated by
computational simulation, for example, for BSA-
wrapped SWNTs79 and DNA-wrapped SWNTs.80 These
studies both demonstrated the wrapping of SWNTs in
the hydrophobic core of the biomolecules. 0.8d-AC is
measured to have a mean diameter of 1.3nm (standard
deviation = 0.2 nm), implying an (AC)15 coating thickness
of ∼0.25 nm,assuminga homogeneous layer.This (AC)15layer thickness is similar to that previously reported in ref
20 for the same hybrid. The measured mean diameter of
∼2 nm for 1.5d-AC (standard deviation = 0.4 nm) and
1.5d-AC-6hr (standard deviation = 0.6 nm) is consistent
Figure 2. Photoluminescence maps of (a) 0.8d-AC, (b) 0.8d-BSA hybrids. (c) Comparison of the PLE contour of 0.8d-AC and0.8d-BSA hybrids to the 0.8d dispersed using SC. Each (eh22,eh11) resonance is labeled with the chiral index of thecorresponding SWNT and is denoted by open ). The open 0, solid þ and  represent phonon sidebands, EET, and EETbetween sidebands of donors and excitons of acceptor nanotubes in small bundles, respectively. In (c), the yellow, blue, andred symbols denote positions of optical signatures from SC, AC, and BSA dispersed nanotubes, respectively. Histograms of lengths of the SWNTÀbiomolecule hybrids measured by AFM for (d) 1.5d-AC-6hr, (e) 1.5d-AC, (f) 0.8d-AC, and (g) 0.8d-BSA;the average height Dcnt of each hybrid is also indicated.
A R T I C L E
7/27/2019 Nanotubes Complexed With DNA And
http://slidepdf.com/reader/full/nanotubes-complexed-with-dna-and 6/13
SH A ET AL. VOL. XXX ’ NO. XX ’ 00 0–00 0 ’ XXXX
www.acsnano.org
F
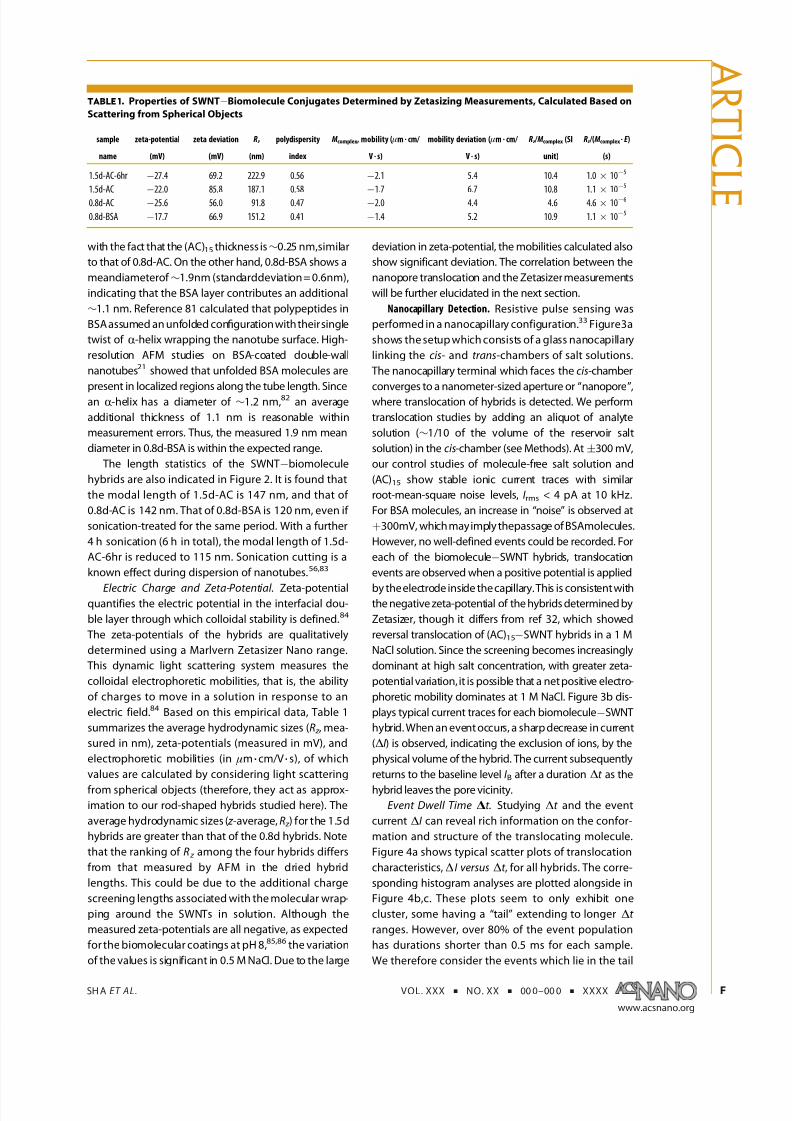
with the fact that the (AC)15 thickness is∼0.25 nm,similar
to that of 0.8d-AC. On the other hand, 0.8d-BSA shows a
meandiameterof ∼1.9nm (standarddeviation = 0.6nm),
indicating that the BSA layer contributes an additional
∼1.1 nm. Reference 81 calculated that polypeptides in
BSA assumed an unfolded configuration with their single
twist of R-helix wrapping the nanotube surface. High-
resolution AFM studies on BSA-coated double-wall
nanotubes21 showed that unfolded BSA molecules are
present in localized regions along the tube length. Since
an R-helix has a diameter of ∼1.2 nm,82 an average
additional thickness of 1.1 nm is reasonable within
measurement errors. Thus, the measured 1.9 nm mean
diameter in 0.8d-BSA is within the expected range.
The length statistics of the SWNT Àbiomolecule
hybrids are also indicated in Figure 2. It is found that
the modal length of 1.5d-AC is 147 nm, and that of
0.8d-AC is 142 nm. That of 0.8d-BSA is 120 nm, even if
sonication-treated for the same period. With a further
4 h sonication (6 h in total), the modal length of 1.5d-
AC-6hr is reduced to 115 nm. Sonication cutting is a
known eff ect during dispersion of nanotubes.56,83
Electric Charge and Zeta-Potential. Zeta-potentialquantifies the electric potential in the interfacial dou-
ble layer through which colloidal stability is defined.84
The zeta-potentials of the hybrids are qualitatively
determined using a Marlvern Zetasizer Nano range.
This dynamic light scattering system measures the
colloidal electrophoretic mobilities, that is, the ability
of charges to move in a solution in response to an
electric field.84 Based on this empirical data, Table 1
summarizes the average hydrodynamic sizes (R z , mea-
sured in nm), zeta-potentials (measured in mV), and
electrophoretic mobilities (in μm 3 cm/V 3 s), of which
values are calculated by considering light scattering
from spherical objects (therefore, they act as approx-
imation to our rod-shaped hybrids studied here). The
average hydrodynamic sizes ( z -average, R z ) for the 1.5d
hybrids are greater than that of the 0.8d hybrids. Note
that the ranking of R z among the four hybrids differs
from that measured by AFM in the dried hybrid
lengths. This could be due to the additional charge
screening lengths associated with the molecular wrap-
ping around the SWNTs in solution. Although the
measured zeta-potentials are all negative, as expected
for the biomolecular coatings at pH 8,85,86 the variation
of the values is significant in 0.5 M NaCl. Due to the large
deviation in zeta-potential, the mobilities calculated also
show significant deviation. The correlation between the
nanopore translocation and the Zetasizer measurements
will be further elucidated in the next section.
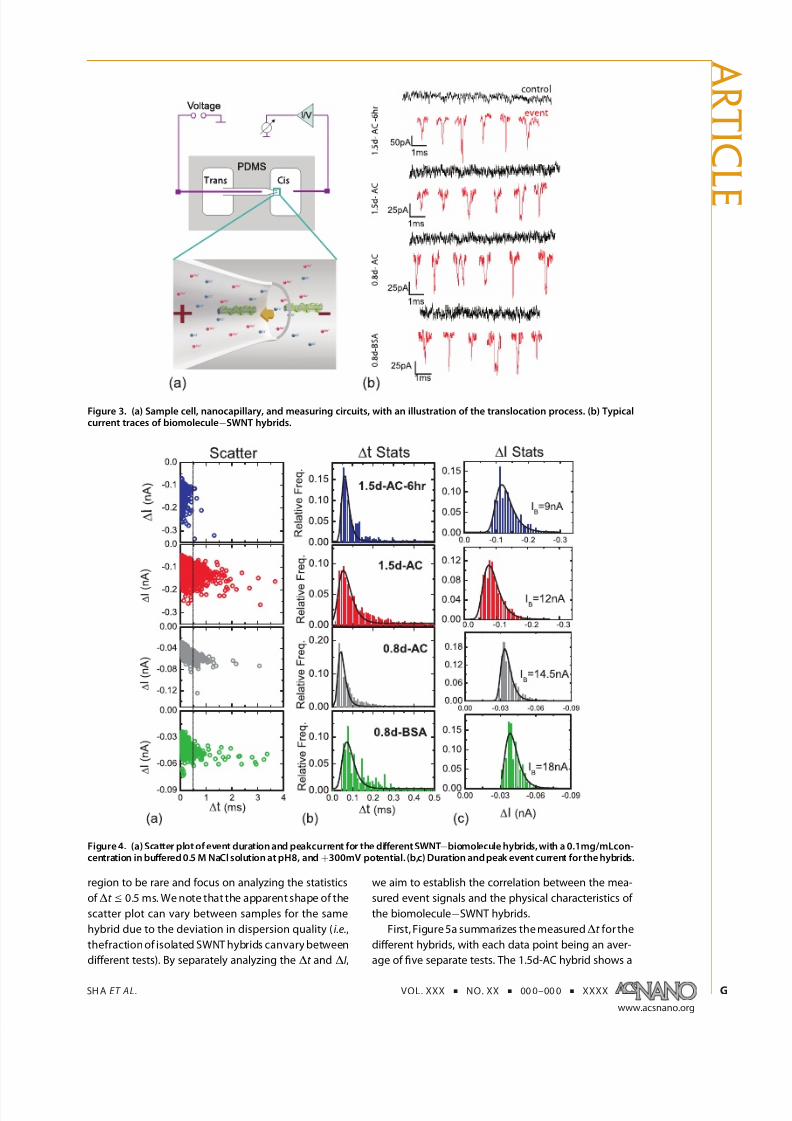
Nanocapillary Detection. Resistive pulse sensing was
performed in a nanocapillary configuration.33 Figure3a
shows the setup which consists of a glass nanocapillary
linking the cis- and trans-chambers of salt solutions.
The nanocapillary terminal which faces the cis-chamber
converges to a nanometer-sized aperture or “nanopore”,
where translocation of hybrids is detected. We perform
translocation studies by adding an aliquot of analyte
solution (∼1/10 of the volume of the reservoir salt
solution) in the cis-chamber (see Methods). At (300 mV,
our control studies of molecule-free salt solution and
(AC)15 show stable ionic current traces with similar
root-mean-square noise levels, I rms < 4 pA at 10 kHz.
For BSA molecules, an increase in “noise” is observed at
þ300mV, which mayimply thepassage of BSAmolecules.
However, no well-defined events could be recorded. For
each of the biomoleculeÀSWNT hybrids, translocation
events are observed when a positive potential is applied
by theelectrode inside the capillary. This is consistent withthe negative zeta-potential of the hybrids determined by
Zetasizer, though it differs from ref 32, which showed
reversal translocation of (AC)15ÀSWNT hybrids in a 1 M
NaCl solution. Since the screening becomes increasingly
dominant at high salt concentration, with greater zeta-
potential variation, it is possible that a net positive electro-
phoretic mobility dominates at 1 M NaCl. Figure 3b dis-
plays typical current traces for each biomoleculeÀSWNT
hybrid. When an event occurs, a sharp decrease in current
(ΔI ) is observed, indicating the exclusion of ions, by the
physical volume of the hybrid. The current subsequently
returns to the baseline level I B after a duration Δt as the
hybrid leaves the pore vicinity.
Event Dwell Time Δt. Studying Δt and the event
current ΔI can reveal rich information on the confor-
mation and structure of the translocating molecule.
Figure 4a shows typical scatter plots of translocation
characteristics, ΔI versus Δt , for all hybrids. The corre-
sponding histogram analyses are plotted alongside in
Figure 4b,c. These plots seem to only exhibit one
cluster, some having a “tail” extending to longer Δt
ranges. However, over 80% of the event population
has durations shorter than 0.5 ms for each sample.
We therefore consider the events which lie in the tail
TABLE 1. Properties of SWNTÀBiomolecule Conjugates Determined by Zetasizing Measurements, Calculated Based on
Scattering from Spherical Objects
sample
name
zeta-potential
(mV)
zeta deviation
(mV)
R z
(nm)
polydispersity
index
M complex, mobility ( μm 3 cm/
V 3 s)
mobility deviation ( μm 3 cm/
V 3 s)
R z / M complex (SI
unit)
R z /( M complex 3 E )
(s)
1.5d-AC-6hr À27.4 69.2 222.9 0.56 À2.1 5.4 10.4 1.0 Â 10À5
1.5d-AC À22.0 85.8 187.1 0.58 À1.7 6.7 10.8 1.1 Â 10À5
0.8d-AC À25.6 56.0 91.8 0.47 À2.0 4.4 4.6 4.6 Â 10À6
0.8d-BSA À17.7 66.9 151.2 0.41 À1.4 5.2 10.9 1.1 Â 10À5
A R T I C L E
7/27/2019 Nanotubes Complexed With DNA And
http://slidepdf.com/reader/full/nanotubes-complexed-with-dna-and 7/13
SH A ET AL. VOL. XXX ’ NO. XX ’ 00 0–00 0 ’ XXXX
www.acsnano.org
G
region to be rare and focus on analyzing the statistics
of Δt e 0.5 ms. We note that the apparent shape of the
scatter plot can vary between samples for the same
hybrid due to the deviation in dispersion quality (i.e.,
thefraction of isolated SWNT hybrids canvary between
different tests). By separately analyzing the Δt and ΔI ,
we aim to establish the correlation between the mea-
sured event signals and the physical characteristics of
the biomoleculeÀSWNT hybrids.
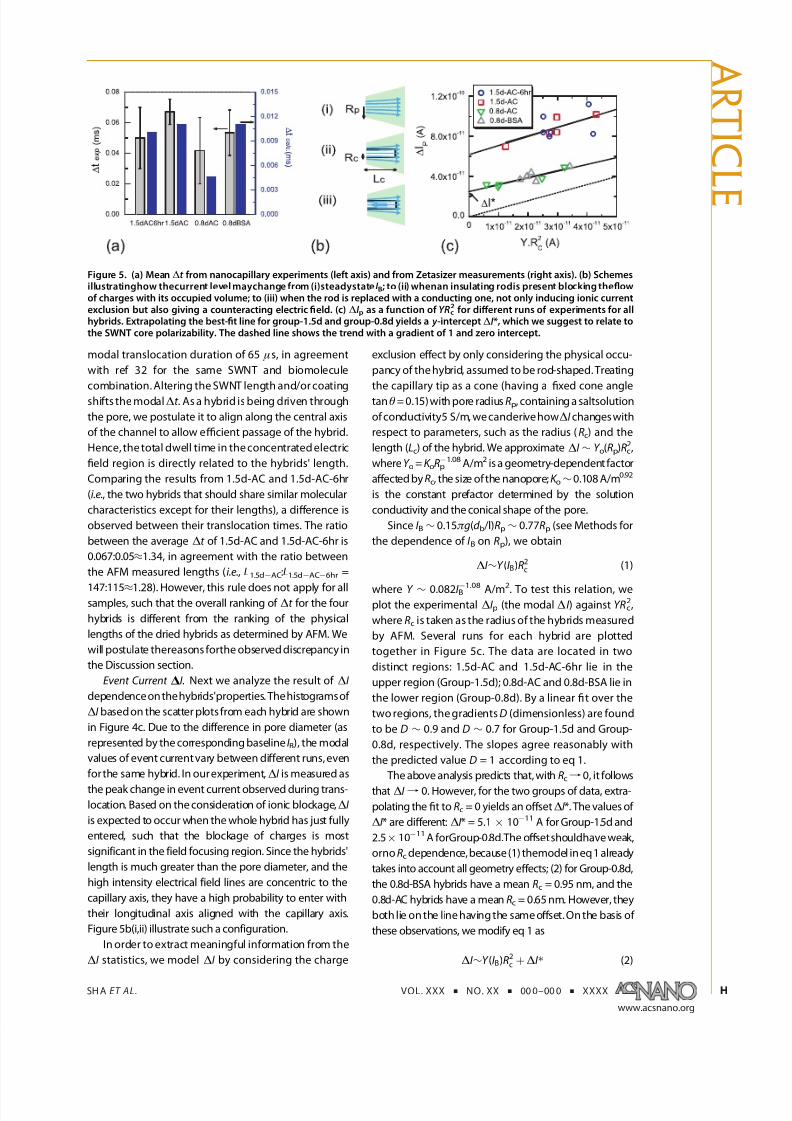
First, Figure 5a summarizes the measuredΔt for the
diff erent hybrids, with each data point being an aver-
age of five separate tests. The 1.5d-AC hybrid shows a
Figure 3. (a) Sample cell, nanocapillary, and measuring circuits, with an illustration of the translocation process. (b) Typicalcurrent traces of biomoleculeÀSWNT hybrids.
Figure 4. (a) Scatter plot of event duration and peakcurrent for the diff erent SWNTÀbiomolecule hybrids, with a 0.1mg/mLcon-centration in buff ered 0.5 M NaCl solution at pH8, andþ300mV potential. (b,c) Duration and peak event current for the hybrids.
A R T I C L E
7/27/2019 Nanotubes Complexed With DNA And
http://slidepdf.com/reader/full/nanotubes-complexed-with-dna-and 8/13
SH A ET AL. VOL. XXX ’ NO. XX ’ 00 0–00 0 ’ XXXX
www.acsnano.org
H
modal translocation duration of 65 μs, in agreement
with ref 32 for the same SWNT and biomolecule
combination. Altering the SWNT length and/or coating
shifts the modalΔt . As a hybrid is being driven through
the pore, we postulate it to align along the central axis
of the channel to allow efficient passage of the hybrid.
Hence, the total dwell time in the concentrated electric
field region is directly related to the hybrids' length.
Comparing the results from 1.5d-AC and 1.5d-AC-6hr
(i.e., the two hybrids that should share similar molecular
characteristics except for their lengths), a diff erence is
observed between their translocation times. The ratio
between the average Δt of 1.5d-AC and 1.5d-AC-6hr is
0.067:0.05≈1.34, in agreement with the ratio between
the AFM measured lengths (i.e., L1.5dÀAC:L1.5dÀACÀ6hr =
147:115≈1.28). However, this rule does not apply for allsamples, such that the overall ranking of Δt for the four
hybrids is diff erent from the ranking of the physical
lengths of the dried hybrids as determined by AFM. We
will postulate thereasons forthe observed discrepancy in
the Discussion section.
Event Current ΔI. Next we analyze the result of ΔI
dependence on thehybrids'properties. Thehistogramsof
ΔI based on the scatter plots from each hybrid are shown
in Figure 4c. Due to the difference in pore diameter (as
represented by the corresponding baseline I B), the modal
values of event current vary between different runs, even
for the same hybrid. In our experiment,ΔI is measured as
the peak change in event current observed during trans-location. Based on the consideration of ionic blockage,ΔI
is expected to occur when the whole hybrid has just fully
entered, such that the blockage of charges is most
significant in the field focusing region. Since the hybrids'
length is much greater than the pore diameter, and the
high intensity electrical field lines are concentric to the
capillary axis, they have a high probability to enter with
their longitudinal axis aligned with the capillary axis.
Figure 5b(i,ii) illustrate such a configuration.
In order to extract meaningful information from the
ΔI statistics, we model ΔI by considering the charge
exclusion eff ect by only considering the physical occu-
pancy of the hybrid, assumed to be rod-shaped. Treating
the capillary tip as a cone (having a fixed cone angle
tanθ= 0.15) with pore radius Rp, containing a saltsolution
of conductivity5 S/m, we canderive howΔI changes with
respect to parameters, such as the radius (Rc) and the
length (Lc) of the hybrid. We approximate ΔI ∼ Y o(Rp)Rc2,
where Y o = K oRpÀ1.08 A/m2 is a geometry-dependent factor
aff ected by Rc, the size of the nanopore; K o∼0.108 A/m0.92
is the constant prefactor determined by the solution
conductivity and the conical shape of the pore.
Since I B∼ 0.15π g(d b /l)Rp∼ 0.77Rp (see Methods for
the dependence of I B on Rp), we obtain
ΔI ∼Y (I B)R2c (1)
where Y ∼ 0.082I BÀ1.08
A/m2
. To test this relation, weplot the experimental ΔI p (the modal ΔI ) against YRc
2,
where Rc is taken as the radius of the hybrids measured
by AFM. Several runs for each hybrid are plotted
together in Figure 5c. The data are located in two
distinct regions: 1.5d-AC and 1.5d-AC-6hr lie in the
upper region (Group-1.5d); 0.8d-AC and 0.8d-BSA lie in
the lower region (Group-0.8d). By a linear fit over the
two regions, the gradients D (dimensionless) are found
to be D ∼ 0.9 and D ∼ 0.7 for Group-1.5d and Group-
0.8d, respectively. The slopes agree reasonably with
the predicted value D = 1 according to eq 1.
The above analysis predicts that, with Rcf 0, it follows
that ΔI f 0. However, for the two groups of data, extra-
polating the fit to Rc = 0 yields an off setΔI *. The values of
ΔI * are diff erent: ΔI * = 5.1 Â 10À11 A for Group-1.5d and
2.5Â 10À11A forGroup-0.8d.The off set shouldhave weak,
orno Rc dependence, because (1) themodel ineq 1 already
takes into account all geometry eff ects; (2) for Group-0.8d,
the 0.8d-BSA hybrids have a mean Rc = 0.95 nm, and the
0.8d-AC hybrids have a mean Rc = 0.65 nm. However, they
both lie on the line having the same off set. On the basis of
these observations, we modify eq 1 as
ΔI ∼Y (I B)R2c þΔI Ã (2)
Figure 5. (a) Mean Δt from nanocapillary experiments (left axis) and from Zetasizer measurements (right axis). (b) Schemesillustratinghow thecurrent level maychange from (i)steadystate I B; to (ii) whenan insulating rodis present blocking theflowof charges with its occupied volume; to (iii) when the rod is replaced with a conducting one, not only inducing ionic currentexclusion but also giving a counteracting electric field. (c) ΔI p as a function of YRc
2 for diff erent runs of experiments for allhybrids. Extrapolating the best-fit line for group-1.5d and group-0.8d yields a y -interceptΔI *, which we suggest to relate tothe SWNT core polarizability. The dashed line shows the trend with a gradient of 1 and zero intercept.
A R T I C L E

7/27/2019 Nanotubes Complexed With DNA And
http://slidepdf.com/reader/full/nanotubes-complexed-with-dna-and 9/13
SH A ET AL. VOL. XXX ’ NO. XX ’ 00 0–00 0 ’ XXXX
www.acsnano.org
I
It is the presence of ΔI * which separates the two hybrid
groups in the plot of ΔI p against YRc2 in Figure 5c. We will
further discuss the significance of this off set ΔI * in the
Discussion section.
DISCUSSION
As shown by the Results section, the event dwell
timeΔt and event currentΔI combination is specific to
a particular SWNT hybrid. However, the correlation is
not straightforward and requires further elaboration.
First, Δt is clearly a function of other factors in
addition to the length of the hybrids. Since the hybrids
are present in a solution, it may be that the hydro-
dynamic interaction or unspecific binding manifests a
more dominatingeff ectthan thelengths of thehybrids
when concerning the values of Δt . An alternative
explanation accounting for the ranking observed in
Figure 5a can be given by considering the hydrody-
namic size R z and the mobilities Mcomplex of the hybrids
in solution (shown in Table 1). Taking a simple picture
of a hybridmovingunderan appliedelectricfield E ,the
drift velocity V drift is determined by V drift = McomplexE .
Thus, the time for each hybrid to travel through a
distance R z is T R = R z /(McomplexE ). Using the R z and
Mcomplex values determined by our Zetasizer measure-
ments (shown in Table 1), we find the ranking of
R z /(ME ) to resemble that of the Δt measured by
resistive pulse sensing with the nanocapillaries. More-
over, taking E = 106 V/m (i.e., an electric field similar to
that used in our experiments), we find T R ∼ 5À10 μs,
which presents a lower limit for Δt . This is because
Mcomplex is measured as the free-hybrid mobility; con-
finement imposed by the nanopore and the possiblepolarization of the charged DNA87 would result in
greater hindrance, thus lowering the translocation
speed.34 On the other hand, Δt has similar magnitude
to T R. For translocation of flexible or semiflexible long
chain molecules studied in nanopores with diameters
above 10 nm,88 Δt is dependent on the rate of uncoil-
ing of polymer chains.88 The rigid structure of the
hybrid means that once the hybrid has the correct
orientation to enter, it traverses the pore channel
readily with small hindrance. We thus suggest that Δt
for a rigid SWNT Àbiomolecule hybrid reflects the ratio
between hydrated molecular size and mobility, where
Mcomplex includes factors due to the zeta-potential and
the shape-dependent drag coefficient of the molecule.
For the analysis of the event current,the originof the
detected off set current, ΔI * in eq 2, also requires
further discussion. One possible explanation for ΔI *
comes from the intrinsic conduction characteristics of
the SWNTs. As a conducting element is placed inside a
uniform electric field, an opposing electric field is
generated within the element, which reduces or even
cancels outthe overall fieldeff ects inthe vicinity due to
induced polarization.89 This eff ect is schematically
illustrated in Figure 5b(iii). Such an electric field
shielding may introduce a further component which
reduces the current level; that is, it increases the
apparent current blockage ΔI . The large diameter
1.5d SWNT cores are of either semiconducting with a
small band gap or of metallic characteristics; this is
because the fundamental band gap, associated with
the eh11 transition is inversely proportional to the
radius of a SWNT (i.e., E g ∼ 1/ R)48,75 and the fact that
we did not observe emission in PLE for λem < 1600 nm.
All the above results indicate the isolated s-SWNTs
present in the P2 hybrids have E g < 0.77 eV. On the
other hand, the 0.8d SWNTs are enriched with (6,5)
(E g ∼ 2.15 eV) and other chiralities with E g > 1 eV (see
resultsof Ramanand photoluminescence spectroscopies).
Finally, computational simulation by ref 90 has shown
that the polarizability of SWNTs is proportional to the
square of their radius. All of the above analysis seems to
support that the temporary polarization of the SWNT core
may contribute to a value ΔI * larger for Group-1.5d than
for Group-0.8d.
Another key feature of eq 2 is the gradient for each
data group, where ΔI is plotted against Y (I B)Rc2. Agree-
ment between the experimental and predicted gradi-
ents indicates that the net blockage current ΔI ÀΔI * is
proportional to the cross-sectional area of the hybrid
(i.e., ΔI ÀΔI * µ Rc2). The net blockage current results
from the entry of a single molecular hybrid into a pore.
Since the experimental gradients are between 0.9 and
0.7 compared to the theoretical gradient of 1, the
estimation for the radius will have a deviation of
(0.9/1)1/2 or (0.7/1)1/2, according to eq 2. This yields a
∼15% error for Rc∼ 1 nm. Therefore, eq 2 can be seen
as a form of “calibration curve
”. Once the correlation
between ΔI and Rc2 is established, rod-like hybrids of
other sizes can be directly measured even for nano-
capillaries of different pore sizes. In other words, using a
fixed SWNT core, provided the interaction between the
SWNTs and the molecules is sufficiently strong, we may
use SWNTs as carriers to detect short DNA oligomer or
polypeptides.
In summary, spectroscopic measurements reveal
doping of the SWNTs by the surface-bound biomole-
cules. Thestrong interaction associated with SWNT and
DNA or protein molecules underpins the feasibility of
translocating stable hybrids through a nanocapillary
for resistive pulse sensing. The signals resulting from ananocapillary detection can then be used to character-
ize the structure of hybrids. The event dwell time
reveals the ratio between hydrodynamic size and
mobility. For the event current, the rigid structure of
the hybrids also allowed us to correlate the peak event
current to thepredicted current changeinduced by the
ionic blockage of a rod. We detect an additional off set
in the event current, assigned to the induced polariza-
tion of the SWNT core. We can thus estimate the cross-
sectional thickness of SWNT Àbiomolecule hybrids,
even for measurements in nanocapillaries of diff erent
A R T I C L E

7/27/2019 Nanotubes Complexed With DNA And
http://slidepdf.com/reader/full/nanotubes-complexed-with-dna-and 10/13
SH A ET AL. VOL. XXX ’ NO. XX ’ 00 0–00 0 ’ XXXX
www.acsnano.org
J
sizes. This could allow one to compare the resistive
pulse results from diff erent experiments and deter-
mine the nature of the biomolecular binding layer by
adapting a standard SWNT “carrier”. Thus, small DNA
oligomers and polypeptides might be directly analyzed
in a large conventional unmodified solid-state nano-
pore, paving the way to the understanding of generic
inorganicÀorganic hybrid transport through nanopores
and allowing for analysis of a wide range of molecules
that can be bound with SWNTs.
METHODS
Preparation of SWNTÀBiomolecule Hybrids. For carbon nano-tubes, CoMoCAT (6,5)-enriched SWNTs and P2 arc-dischargedSWNTs were purchased from Sigma-Aldrich and Carbon Solu-tions, respectively. (AC)15 oligomers (Invitrogen) and BSA pro-tein (Sigma-Aldrich) were wrapped around SWNTs through thefollowing steps which involve a two-stage sonication. First, a1 mg/mL SWNT in 0.1 M sodium chloride (NaCl) solution(Trisethylenediaminetetraacetic acid, or Tris-EDTA buffer, pH8) was prepared by tip sonication for 2 h (or 6 h) as for refs 13and 56. Subsequently, this dispersion was mixed with thebiomolecule dispersion (1 mg/mL biomolecule in 0.1 M NaCl,
Tris-EDTA buffer, pH 8) at a 1:1 volume ratio, resulting in a finalconcentrationof SWNTs inBSA solution of0.5 mg/mL.For (AC)15wrapping, the mixture was left to incubate for 48 h, followed bysonication in an ice-cooled bath for an additional 2 h. The BSAwas found to achieve optimal coating without incubation(determined by comparing the absorption spectrum of thedispersion after incubation for different times). After sonication,the SWNT Àbiomolecule hybrids were subjected to centrifuga-tion (15000g, 30 min) to remove both unstable SWNTs andhybrids.38
Atomic Force Microscopy. The diameter of pristine SWNTs wasinvestigatedby AFMstudies. ThepristineSWNTs were preparedas follows: 0.5 mg of starting material (CoMoCAT (6,5)-enrichedSWNTs and P2 arc-discharged SWNTs, respectively) was dis-persed in 30 mL of N -methyl-2-pyrrolidone (NMP) at 15 °C in a180 W horn sonicator (Branson sonifier, S-450A) for 2 h. Thedispersionswere thenultracentrifuged usinga TH-641swingingbucket rotor in a Sorvall WX-100 ultracentrifuge at 40000 rpmfor another 2 h. For each material, a 1:100 dilution in NMP was
drop-casted on cleanstandard Si/SiO2 substrates and thendriedfirst at room temperature for 12 h and finally in oven at 70 °Cfor 3 h.
AFM of SWNT Àbiomolecule hybrids was prepared as fol-lows. The centrifuged conjugate solutions (see proceduresabove) were filtered through a 100 kDa filter (Amicon UltraMillipore) under 14 000g for 7 min to remove the free (AC)15 orBSA in solution. The remaining concentrated filtrate was redis-persed and deposited onto cleaved mica surface (0.5 M MgCl2treated). Allthe atomic force microscopic imageswereobtainedunder the tapping mode. The obtained images were thenanalyzed with Gwyddion.
Raman Spectroscopy. As-received SWNT powders were depos-ited on a SiO2 /Si substra te. The hybrids were also drop -cast on300 nm SiO2 /Si substrates and left to evaporate at roomtemperatures. Raman spectra were acquired at 514.5 and632.8 nm using a Renishaw InVia micro-Raman spectrometer.
The power on the samples was kept <1 mW in order to avoidpossible heating effects. We used Renishaw Holographic NotchFilters having∼50 cmÀ1 cut off frequency at 514.5 and 632.8 nm.
Photoluminescence. PLE of the dispersions was carried outusing a Horiba Jobin-Yvon excitationÀemission spectrofluo-rometer (Fluorolog 3). We used a 14.7 nm slit for the doublegrating excitation monochromator and 60 nm for the singlegrating emission monocromator blazed at 1200 nm. The scanstep was 5 nmfor400À680nm excitation, covering theeh22 rangeof our nanotubes.75,76 The PL data were corrected by backgroundsubtraction and normalized according to the lamp intensity profileusing the same excitation slit. The optical absorbance of theSWNT Àbiomolecule hybrid samples in water was adjusted bydilution using water to ∼0.1À0.2 to avoid reabsorption effects.
Translocation Experiment. All nanocapillaries were producedby Pipette Puller P-2000 using quartz glass with an outer
diameter of 0.5 mm and a wall thickness of 0.1 mm. Pullingparameters were optimized to obtain nanopore openings be-tween 13 and 60 nm. The capillaryÀPDMS fluid cell was con-structed as shown in Figure3a. Electricalpotentials were deliveredby Ag/AgCl electrodes placed separately at the cis- and trans-chamber. Thefully constructedcell was thencleaned using oxygenplasma and then filled with salt solution using a desiccator.
For all ionic current measurements, we used an Axopatch200B (Axon Instruments, USA) amplifier in voltage-clamp modewith the internal four-pole Bessel filter at 10 kHz bandwidth.Real-time current/voltage traceswere recorded usingPClamp10.0.
These currentÀtime traces were then analyzed in Clampfit todetermine the event current and event dwell time. For blank saltsolutions, Figure SI1a shows a slightly asymmetrical I ÀV curvecharacteristic to the conical pore configuration.
The inner diameter, d i, of the nanopore can be estimatedthrough a simplified equation for conical nanocapillaries:30 d i =4Gcapl / π gd b. Here, l isthe length(in unit of meters) ofthe conicalpart, d b the diameter (in meters) of the capillary before startingto converge, g the specific conductance (in S/m) of the saltsolution, and Gcap the nanocapillary conductance (in S). In ourcase, l = 0.001 m and d b = 3 Â 10À4 m. Measurements wereperformed in 0.5 M NaCl salt solutions (Tris-EDTA buff er, pH 8),thus g = 5 S/m (measured by Mettler Toledo pH/ion meterSevenMultiS80). Gcap is theratio betweenthe openpore baselinecurrent (I B) to the voltage (300 mV), that is, Gcap = I B /0.3 S. Thetranslocation events were detectable when I B ∼ 5À24 nA,equivalent to pore diameters in the 13À60 nm range. Fortranslocation experiments, the number of events in each runranged between 400 and 3000.
Conflict of Interest: The authors declare no competingfinancial interest.
Acknowledgment. The authors thank A. Hall for helpfuladvice, and H. Beeson for characterization work. Y.Y.S.H. thanks
financial support from the Oppenheimer Fellowship and aHomerton College Fellowship. T.H. acknowledges support fromthe RoyalAcademyof Engineering, ChurchillCollege, Cambridgeand National Natural Science Foundation of China (Grant No.61150110487). F.B. acknowledges funding from the Newton
Trust and t he Newton International Fellowship. A.C.F. a cknowl-edgesthe ERCGrantNANOPOTS, a Royal SocietyWolfsonResearchMerit Award, EPSRC Grants EP/K01711X/1, EP/K017144/1, andEP/G042357/1. U.F.K. acknowledges funding by the EmmyNoether Program of the Deutsche Forshungsgesellschaft. Thiswork is supported by The National Basic Research Program of China (2011CB707605) and National Natural Science Foundationof China (51005048).
Supporting Information Available: Nanocapillary IV and real-time event traces of nanocapillary; translocation characteristicsassociated with hybrid bundling. This material is available freeof charge via the Internet at http://pubs.acs.org.
REFERENCES AND NOTES
1. Dang, X.; Yi, H.; Ham, M. H.; Qi, J.; Yun, D. S.; Ladewski, R.;Strano, M. S.; Hammond, P. T.; Belcher, A. M. Virus-Tem-plated Self-Assembled Single-Walled Carbon Nanotubesfor Highly Efficient Electron Collection in PhotovoltaicDevices. Nat. Nanotechnol. 2011, 6, 377–384.
2. Shi,Y.; Hasan, T.; Babu, N.H.; Torrisi, F.; Milana, S.;Ferrari, A.C.;Cardwell, D. A. Synthesis of YBa2Cu3O7Àd and Y 2BaCuO5
Nanocrystalline Powders for YBCO Superconductors UsingCarbonNanotube Templates. ACS Nano2012, 6, 5395–5403.
A R T I C L E
7/27/2019 Nanotubes Complexed With DNA And
http://slidepdf.com/reader/full/nanotubes-complexed-with-dna-and 11/13
SH A ET AL. VOL. XXX ’ NO. XX ’ 00 0–00 0 ’ XXXX
www.acsnano.org
K
3. Keren, K.; Berman, R. S.; Buchstab, E.; Sivan, U.; Braun, E.DNA-Templated Carbon Nanotube Field-Eff ect Transistor.
Science 2003, 302, 1380–1382.4. Wei, A.; Sun, X. W.; Wang, J. X.; Lei, Y.; Cai, X. P.; Li, C. M.;
Dong, Z. L.; Huang, W. Enzymatic Glucose Biosensor Basedon ZnO Nanorod Array Grown by Hydrothermal Decom-position. Appl. Phys. Lett. 2006, 89, 123902-3.
5. Yi, H.; Ghosh, D.; Ham, M.-H.; Qi, J.; Barone, P. W.; Strano,M. S.; Belcher, A. M. M13 Phage-Functionalized Single-
Walled Carbon Nanotubes as Nanoprobes for SecondNear-Infrared Window Fluorescence Imaging of Targeted
Tumors. Nano Lett. 2012, 12, 1176–1183.6. Heller, D. A.; Jin, H.; Martinez, B. M.; Patel, D.; Miller, B. M.;
Yeung, T.-K.; Jena, P. V.; Hobartner, C.; Ha, T.; Silverman,S. K.; et al. Multimodal Optical Sensing and AnalyteSpecificity Using Single-Walled Carbon Nanotubes. Nat.Nanotechnol. 2009, 4, 114–120.
7. Aili, D.; Gryko, P.; Sepulveda, B.; Dick, J. A. G.; Kirby, N.;Heenan, R.; Baltzer, L.; Liedberg, B.; Ryan, M. P.; Stevens,M. M. PolypeptideFolding-MediatedTuning of theOpticaland Structural Properties of Gold Nanoparticle Assem-blies. Nano Lett. 2011, 11, 5564–5573.
8. Huang,Y. Y.S.; Terentjev, E. M.;Oppenheim, T.;Lacour, S. P.;Welland, M. E. Fabrication and Electromechanical Charac-terization of Near-Field Electrospun Composite Fibers.
Nanotechnology 2012, 23, 105305.
9. Bertulli, C.; Beeson, H.; Hasan, T.; Huang, Y. Y. S. Spectro-scopic Characterization of Protein-Wrapped Single-WallCarbon Nanotubes and Quantification of Their CellularUptake in Multiple Cell Generations. Nanotechnology 2013, 24, 265102.
10. Liu, Z.; Tabakman, S. M.; Chen, Z.; Dai, H. Preparation of Carbon Nanotube Bioconjugates for Biomedical Applica-tions. Nat. Protoc. 2009, 4, 1372–1381.
11. Grigoryan, G.; Kim, Y. H.; Acharya, R.; Axelrod, K.; Jain, R. M.;Willis, L.; Drndic, M.; Kikkawa, J. M.; DeGrado, W. F. Com-putational Design of Virus-like Protein Assemblies onCarbonNanotube Surfaces. Science 2011, 332, 1071–1076.
12. Boghossian, A.A.; Zhang,J.; Barone,P. W.; Reuel, N. F.; Kim,J.-H.; Heller, D. A.;Ahn, J. H.; Hilmer, A. J.; Rwei, A.;Arkalgud,J. R.; et al. Near-Infrared Fluorescent Sensors Based onSingle-Walled Carbon Nanotubes for Life Sciences Appli-cations. ChemSusChem 2011, 4, 848–863.
13. Zheng,M.; Jagota, A.; Strano, M.S.; Santos, A.P.; Barone, P.;Chou, S. G.; Diner, B. A.; Dresselhaus, M. S.; Mclean, R. S.;Onoa, G. B.; et al. Structure-Based Carbon NanotubeSorting by Sequence-Dependent DNA Assembly. Science2003, 302, 1545–1548.
14. Kam, N. W. S.; O'Connell, M.; Wisdom, J. A.; Dai, H. CarbonNanotubes as Multifunctional Biological Transporters andNear-InfraredAgents for Selective Cancer Cell Destruction.
Proc. Natl. Acad. Sci. U.S.A. 2005, 102, 11600–11605.15. Karajanagi, S. S.; Vertegel, A. A.; Kane, R. S.; Dordick, J. S.
Structure andFunction of Enzymes Adsorbed onto Single-Walled Carbon Nanotubes. Langmuir 2004, 20, 11594–11599.
16. Gigliotti, B.; Sakizzie, B.; Bethune, D. S.; Shelby, R. M.; Cha,J. N. Sequence-Independend Helical Wrapping of Single-Walled Carbon Nanotubes by Long Genomic DNA. Nano
Lett. 2006, 6, 159–
164.17. Zhao, X.; Johnson, J. K. Simulation of Adsorption of DNA on
CarbonNanotubes. J. Am.Chem.Soc.2007, 129, 10438–10445.18. Balamurugan, K.; Gopalakrishnan, R.; Raman, S. S.; Sub-
ramanian, V. Exploring the Changes in the Structure of R-Helical Peptides Adsorbed onto a Single Walled CarbonNanotube UsingClassical Molecular Dynamics Simulation.
J. Phys. Chem. B 2010, 114, 14048–14058.
19. Cathcart, H.; Nicolosi, V.; Hughes, J. M.; Blau, W. J.; Kelly,J. M.; Quinn, S. J.; Coleman, J. N. Ordered DNA WrappingSwitches on Luminescence in Single-Walled NanotubeDispersions. J. Am. Chem. Soc. 2008, 130, 12734–12744.
20. Campbell, J. F.; Tessmer, I.; Thorp, H. H.; Erie, D. A. AtomicForce Microscopy Studies of DNA-Wrapped Carbon Nano-tubeStructureand Binding to QuantumDots. J. Am. Chem.Soc. 2008, 130, 10648–10655.
21. Lamprecht, C.; Danzberger, J.; Lukanov, P.; Tilmaciu,C. M.; Galibert, A. M.; Soula, B.; Flahaut, E.; Gruber, H. J.;Hinterdorfer, P.; Ebner, A.; et al. AFM Imaging of Functio-nalized Double-Walled Carbon Nanotubes. Ultramicro-scopy 2009, 109, 899–906.
22. Helmholtz, H. V. Ueber einige Gesetze der Vertheilungelektrischer Ströme in körperlichen Leitern, mit Anwen-dung auf die thierisch-elektrischen Versuche (Anfang).
Ann. Phys. Chem. 1853, 89, 211–233.
23. Huang, Y. Y.; Terentjev, E. M. Transparent Electrode with aNanostructured Coating. ACS Nano 2011, 5, 2082–2089.
24. Dekker, C. Solid-StateNanopores. Nat. Nanotechnol. 2007,
2, 209–215.25. Venkatesan, B. M.; Bashir, R. Nanopore Sensors for Nucleic
Acid Analysis. Nat. Nanotechnol. 2011, 6, 615–624.26. Schneider, G. G. F.; Kowalczyk, S. W.; Calado, V. E.;
Pandraud, G.; Zandbergen, H. W.; Vandersypen, L. M. K.;Dekker, C. DNA Translocation through Graphene Nano-pores. Nano Lett. 2010, 10, 3163–3167.
27. Wanunu, M. Nanopores: A Journey towards DNA Sequen-cing. Phys. Life Rev. 2012, 9, 125–158.
28. Li, J.; Gershow, M.; Stein, D.; Brandin, E.; Golovchenko, J. A.DNA Molecules and Configurations in a Solid-State Nano-pore Microscope. Nat. Mater. 2003, 2, 611–615.
29. Keyser, U. F. Controlling Molecular Transport throughNanopores. J. R. Soc. Interface 2011, 8, 1369–1378.
30. Storm, A. J.; Chen, J. H.; Zandbergen, H. W.; Dekker, C. Translocation of Double-Strand DNA through a SiliconOxide Nanopore. Phys. Rev. E 2005, 71, 051903.
31. Howorka, S.;Siwy,Z. Nanopore Analytics:Sensingof SingleMolecules. Chem. Soc. Rev. 2009, 38, 2360–2384.
32. Hall, A. R.; Keegstra, J. M.; Duch, M. C.; Hersam, M. C.;Dekker, C. Translocation of Single-Wall Carbon Nanotubesthrough Solid-State Nanopores. Nano Lett. 2011, 11,2446–2450.
33. Steinbock, L. J.; Otto, O.; Chimerel, C.; Gornall, J.; Keyser,U. F. Detecting DNA Folding with Nanocapillaries. NanoLett. 2010, 10, 2493–2497.
34. Keyser, U. F.; van Dorp, S.; Lemay, S. G. Tether Forces inDNA Electrophoresis. Chem. Soc. Rev. 2010, 39, 939–947.
35. Wanunu, M.; Dadosh, T.; Ray, V.; Jin, J.; McReynolds, L.;Drndic, M. Rapid Electronic Detection of Probe-SpecificMicroRNAs Using Thin Nanopore Sensors. Nat. Nanotech-
nol. 2010, 5, 807–814.36. Hirayama, K.; Akashi, S.; Furuya, M.; Fukuhara, K. Rapid
Confirmation and Revision of the Primary Structure of Bovine Serum Albumin by ESIMS and Frit-FAB LC/MS.
Biochem. Biophys. Res. Commun. 1990, 173, 639–646.37. Bendedouch, D.; Chen, S. H. Structure and Interparticle
Interactions of Bovine Serum Albumin in Solution Studiedby Small-Angle Neutron Scattering. J. Phys. Chem. 1983,
87 , 1473–1477.
38. Holt, B. D.; Dahl, K. N.; Islam, M. F. Quantification of Uptakeand Localization of Bovine Serum Albumin-StabilizedSingle-Wall Carbon Nanotubes in Diff erent Human Cell
Types. Small 2011, 7 , 2348–2355.39. Hu,P.; Zhang,C.; Fasoli,A.; Scardaci, V.;Pisana, S.;Hasan,T.;
Robertson, J.; Milne, W. I.; Ferrari, A. C. Hysteresis Suppres-sion in Self-Assembled Single-Wall Nanotube Field Eff ect
Transistors. Physica E 2008, 40, 2278–2282.
40. Hu, P.; Fasoli, A.; Park, J.; Choi, Y.; Estrela, P.; Maeng, S. L.;Milne, W. I.; Ferrari, A. C. Self-Assembled Nanotube Field-Eff ect Transistors for Label-Free ProteinBiosensors. J. Appl.Phys. 2008, 104, 074310-5.
41. Ferrari, A. C.; Robertson, J. Raman Spectroscopy of Amor-phous, Nanostructured, Diamond-like Carbon, and Nano-diamond. Philos. Trans. R. Soc. A 2004, 362, 2477.
42. Ferrari, A. C.; Basko, D. M. Raman Spectroscopy as aVersatile Tool for Studying the Properties of Graphene.
Nat. Nanotechnol. 2013, 8, 253.
43. Rao, A. M.; Richter, E.; Bandow, S.; Chase, B.; Eklund, P. C.;Williams, K. A.; Fang, S.; Subbaswamy, K. R.; Menon, M.;
Thess, A.; et al. Diameter-Selective Raman Scattering fromVibrational Modes in Carbon Nanotubes. Science 1997,
275, 187–191.
A R T I C L E

7/27/2019 Nanotubes Complexed With DNA And
http://slidepdf.com/reader/full/nanotubes-complexed-with-dna-and 12/13
SH A ET AL. VOL. XXX ’ NO. XX ’ 00 0–00 0 ’ XXXX
www.acsnano.org
L
44. Telg, H.; Maultzsch, J.; Reich, S.; Hennrich, F.; Thomsen, C.Chirality Distribution and Transition Energies of CarbonNanotubes. Phys. Rev. Lett. 2004, 93, 177401.
45. Meyer, J. C.; Paillet, M.; Michel, T.; Moreac, A.; Neumann, A.;Duesberg, G. S.; Roth, S.; Sauvajol, J. L. Raman-Modes of Index-Identified Free-Standing Single-Walled Carbon Nano-tubes. Phys. Rev. Lett. 2005, 95, 217401.
46. Fantini, C.; Jorio, A.; Souza, M.; Strano, M. S.; Dresselhaus,M. S.;Pimenta, M. A. OpticalTransition Energies forCarbon
Nanotubes from Resonant Raman Spectroscopy: Environ-ment and Temperature Eff ects. Phys. Rev. Lett. 2004, 93,147406.
47. Araujo, P. T.; Doorn, S. K.; Kilina, S.; Tretiak, S.; Einarsson, E.;Maruyama, S.; Chacham, H.; Pimenta, M. A.; Jorio, A. Thirdand Fourth Optical Transitions in Semiconducting CarbonNanotubes. Phys. Rev. Lett. 2007, 98, 067401.
48. Kataura,H.; Kumazawa, Y.; Maniwa,Y.; Umezu, I.; Suzuki,S.;Ohtsuka, Y.; Achiba, Y. Optical Properties of Single-WallCarbon Nanotubes. Synth. Met. 1999, 103, 2555–2558.
49. Piscanec,S.; Lazzeri, M.;Robertson, J.;Ferrari, A. C.;Mauri,F.Optical Phonons in Carbon Nanotubes: Kohn Anomalies,PeierlsDistortions,and DynamicEff ects. Phys. Rev. B 2007,75, 035427.
50. Jorio, A.; Souza, A. G.; Dresselhaus, G.; Dresselhaus, M. S.;Swan, A. K.; Unlu, M. S.; Goldberg, B. B.; Pimenta, M. A.;Hafner, J. H.; Lieber, C. M.; et al. G-Band Resonant Raman
Study of 62 Isolated Single-Wall Carbon Nanotubes. Phys.Rev. B 2002, 65, 155412.
51. Lazzeri,M.; Piscanec,S.; Mauri, F.;Ferrari, A. C.;Robertson, J.Phonon Linewidths and ElectronÀPhonon Coupling inGraphite and Nanotubes. Phys. Rev. B 2006, 73, 155426.
52. Das, A.; Sood, A. K.; Govindaraj, A.; Saitta, A. M.; Lazzeri, M.;Mauri, F.;Rao, C. N. R. Dopingin CarbonNanotubesProbedby Raman and Transport Measurements. Phys. Rev. Lett.2007, 99, 136803.
53. Tsang, J. C.; Freitag, M.; Perebeinos, V.; Liu, J.; Avouris, P.Doping and Phonon Renormalization in Carbon Nano-tubes. Nat. Nanotechnol. 2007, 2, 725–730.
54. Ferrari,A. C.; Robertson, J. Interpretation of Raman Spectraof Disordered and Amorphous Carbon. Phys. Rev. B 2000,
61, 14095.55. Ferrari, A. C. Raman Spectroscopy of Graphene and
Graphite: Disorder, ElectronÀPhonon Coupling, Doping
and Nonadiabatic Eff ects. Solid State Commun. 2007, 143,47–57.
56. Huang, Y. Y.; Knowles, T. W.; Terentjev, E. M. Strength of Nanotubes, Filaments, and Nanowires from Sonication-Induced Scission. Adv. Mater. 2009, 21, 3945–3948.
57. Huang, Y. Y.; Terentjev, E. M. Dispersion of Carbon Nano-tubes: Mixing, Sonication, Stabilization, and CompositePropertie. Polymers 2012, 4, 275–295.
58. Piscanec,S.; Lazzeri, M.;Mauri,F.; Ferrari, A. C.;Robertson, J.Kohn Anomalies and ElectronÀPhonon Interactions inGraphite. Phys. Rev. Lett. 2004, 93, 185503.
59. Bonaccorso, F.; Hasan,T.; Tan,P. H.;Sciascia,C.; Privitera,G.;Di Marco, G.; Gucciardi, P. G.; Ferrari, A. C. Density GradientUltracentrifugation of Nanotubes: Interplay of Bundlingand Surfactants Encapsulation. J. Phys. Chem. C 2010, 114,17267–17285.
60. Bachilo, S. M.;Strano, M. S.;Kittrell, C.;Hauge,R. H.;Smalley,R. E.; Weisman, R. B. Structure-Assigned Optical Spectra of Single-Walled Carbon Nanotubes. Science 2002, 298,2361–2366.
61. Tan, P. H.; Rozhin,A. G.; Hasan,T.; Hu, P.;Scardaci, V.; Milne,W. I.; Ferrari, A. C. Photoluminescence Spectroscopy of Carbon Nanotube Bundles: Evidence for Exciton Energy
Transfer. Phys. Rev. Lett. 2007, 99, 137402.62. Tan, P. H.; Hasan, T.; Bonaccorso, F.; Scardaci, V.; Rozhin,
A. G.; Milne, W. I.; Ferrari, A. C. The Shear Mode of Multi-Layer Graphene. Physica E 2008, 40, 2352–2359.
63. Hasan, T.; Scardaci, V.; Tan, P. H.; Rozhin, A. G.; Milne, W. I.;Ferrari, A. C. Stabilization and “Debundling” of Single-WallCarbon Nanotube Dispersions in N -Methyl-2-pyrrolidone(NMP) by Polyvinylpyrrolidone (PVP). J. Phys. Chem. C 2007, 111, 12594–12602.
64. Hasan, T.; Tan, P. H.; Bonaccorso, F.; Rozhin, A.; Scardaci, V.;Milne,W.; Ferrari, A. C. Polymer-AssistedIsolationof SingleWall Carbon Nanotubes in Organic Solvents for Optical-Quality Nanotube-Polymer Composites. J. Phys. Chem. C 2008, 112, 20227–20232.
65. McDonald, T. J.;Blackburn, J. L.;Metzger,W. K.;Rumbles, G.;Heben, M. J. Chiral-Selective Protection of Single-WalledCarbon Nanotube Photoluminescence by Surfactant Se-lection. J. Phys. Chem. C 2007, 111, 17894–17900.
66. Niyogi, S.; Boukhalfa, S.; Chikkannanavar, S. B.; McDonald, T. J.; Heben, M. J.; Doorn, S. K. Selective Aggregation of Single-Walled Carbon Nanotubes via Salt Addition. J. Am.Chem. Soc. 2007, 129, 1898.
67. Perebeinos, V.; Tersoff , J.; Avouris, P. Eff ect of ExcitonÀPhonon Coupling in the Calculated Optical Absorption of Carbon Nanotubes. Phys. Rev. Lett. 2005, 94, 027402.
68. Plentz, F.; Ribeiro, H. B.; Jorio, A.; Strano, M. S.; Pimenta,M. A. Direct Experimental Evidence of ExcitonÀPhononBound States in Carbon Nanotubes. Phys. Rev. Lett. 2005,
95, 247401.69. Lefebvre, J.; Finnie, P. Polarized Photoluminescence Ex-
citation Spectroscopy of Single-Walled Carbon Nano-tubes. Phys. Rev. Lett. 2007, 98, 167406.
70. Kato, T.; Hatakeyama, R. Exciton Energy Transfer-AssistedPhotoluminescence Brightening from Freestanding Sin-gle-Walled Carbon Nanotube Bundles. J. Am. Chem. Soc.
2008, 130, 8101–8107.71. Qian, H.; Georgi, C.; Anderson, N.; Green, A. A.; Hersam,
M. C.; Novotny, L.; Hartschuh, A. Exciton Energy Transfer inPairs of Single-WalledCarbon Nanotubes. NanoLett. 2008,
8, 1363–1367.72. Han, J. H.; Paulus, G. L. C.; Maruyama, R.; Heller, D. A.; Kim,
W. J.; Barone, P. W.; Lee, C. Y.; Choi, J. H.; Ham, M. H.; Song,C.; et al. Exciton Antennas and Concentrators from CoreÀShell and Corrugated Carbon Nanotube Filaments of Homogeneous Composition. Nat.Mater. 2010, 9,833–839.
73. Torrens, O. N.; Zheng, M.; Kikkawa, J. M. Energy of K-Mo-mentum Dark Excitons in Carbon Nanotubes by OpticalSpectroscopy. Phys. Rev. Lett. 2008, 101, 157401.
74. O'Connell, M. J.; Bachilo, S. M.; Huff man, C. B.; Moore, V. C.;Strano, M. S.; Haroz, E. H.; Rialon, K. L.; Boul, P. J.; Noon,W. H.; Kittrell, C.; et al. Band Gap Fluorescence fromIndividual Single-Walled Carbon Nanotubes. Science
2002, 297 , 593–596.
75. Weisman, R. B.; Bachilo, S. M. Dependence of Optical Transition Energies on Str ucture for Single-Walled CarbonNanotubes in Aqueous Suspension: An Empirical KatauraPlot. Nano Lett. 2003, 3, 1235.
76. Liu, K.; Deslippe, J.; Xiao, F.; Capaz, R. B.; Hong, X.; Aloni, S.;Zettl, A.; Wang, W.; Bai, X.; Louie, S. G.; et al. An Atlas of Carbon Nanotube Optical Transitions. Nat. Nanotechnol.2012, 7 , 325–329.
77. Bernath, P. F. The Spectroscopy of Water Vapour: Experi-ment, Theory and Applications. Phys. Chem. Chem. Phys.2002, 4, 1501–1509.
78. O'Connell, M. J.; Eibergen, E. E.; Doorn, S. K. Chiral Selec-tivity in the Charge-Transfer Bleaching of SinglewalledCarbon-Nanotube Spectra. Nat. Mater. 2005, 4, 412–418.
79. Ge, C.; Du, J.;Zhao, L.; Wang,L.; Liu, Y.;Li, D.; Yang,Y.; Zhou,
R.; Zhao, Y.; Chai, Z. Binding of Blood Proteins to CarbonNanotubes Reduces Cytotoxicity. Proc. Natl. Acad. Sci. U.S. A. 2011, 108, 16968–16973.
80. Tu, X.; Manohar, S.; Jagota, A.; Zheng, M. DNA SequenceMotifs for Structure-Specific Recognition and Separationof Carbon Nanotubes. Nature 2009, 460, 250–253.
81. Zhao, X.; Liu, R.; Chi, Z.; Teng, Y.; Qin, P. New Insights intothe Behavior of Bovine Serum Albumin Adsorbed ontoCarbon Nanotubes: Comprehensive Spectroscopic Stud-ies. J. Phys. Chem. B 2010, 114, 5625–5631.
82. Hartmann, G. TheStructureand Actionof Proteins. Angew.Chem. 1970, 82, 780.
83. Kerr, J. C.; Huang, Y. Y.; Marshall, J. E.; Terentjev, E. M. Eff ectof Filament Aspect Ratio on the Dielectric Response of Multiwalled Carbon Nanotube Composites. J. Appl. Phys.2011, 109, 094109.
A R T I C L E

7/27/2019 Nanotubes Complexed With DNA And
http://slidepdf.com/reader/full/nanotubes-complexed-with-dna-and 13/13
SH A ET AL. VOL. XXX ’ NO. XX ’ 00 0–00 0 ’ XXXX M
84. Smoluchowski, M. Classe des Sciences Math. et Naturelles.
Bull. Int. Acad. Sci. Cracovie 1903, 182–199.85. Lumpkin, O. J.; Dijardin, P.; Zimm, B. H. Theory of Gel
Electrophoresis of DNA. Biopolymers 1985, 24, 1573–1593.86. Ge, S.; Ken, K.; Atsushi, T.; Tisato, K. Bovine Serum Albumin
Adsorption onto Immobilized Organotrichlorosilane Sur-face: Influence of thePhaseSeparationon ProteinAdsorp-tion Patterns. J. Biomater. Sci., Polym. Ed. 1998, 9,131–150.
87. Allison, S. A.; Wang, H.; Laue, T. M.; Wilson, T. J.; Wooll, J. O.
Visualizing Ion Relaxation in the Transport of Short DNAFragments. Biophys. J. 1999, 76, 2488–2501.
88. Storm, A. J.; Storm, C.; Chen, J.; Zandbergen, H.; Joanny,J.-F.; Dekker, C.;Fast, D. N. A. Translocation througha Solid-State Nanopore. Nano Lett. 2005, 5, 1193–1197.
89. Benedict, L. X.; Louie, S. G.; Cohen, M. L. Static Polarizabil-ities of Single-Wall Carbon Nanotubes. Phys. Rev. B 1995,52, 8541.
90. Brothers, E. N.; Izmaylov, A. F.; Scuseria, G. F.; Kudin, K. N.Analytically Calculated Polarizability of Carbon Nano-tubes: Single Wall, Co-axial, and Bundled Systems. J. Phys.Chem. C 2008, 112, 1396–1400.
A R T I C L E