naosite: nagasaki university's academic output...
TRANSCRIPT

This document is downloaded at: 2018-08-27T23:52:53Z
Title Study on the Effect of Aggregation Structure of Segmented Polyurethaneson their Adhesion Properties
Author(s) Kongpun, Teerin
Citation Nagasaki University (長崎大学), 博士( 工学) (2009-03-19)
Issue Date 2009-03-19
URL http://hdl.handle.net/10069/22086
Right
NAOSITE: Nagasaki University's Academic Output SITE
http://naosite.lb.nagasaki-u.ac.jp

Study on the Effect of Aggregation Structure of Segmented Polyurethanes on their Adhesion
Properties
December 2008
Graduate School of Science and Technology, Nagasaki University
TEERIN KONGPUN

Contents
Chapter 1 Introduction
1.1 Polyurethane adhesives 1
1.2 Reactions of isocyanates 2
1.3 Various types of polyurethanes 5
1.4 Preparation of polyurethane 13
1.5 Preparation of polyurethane adhesives 14
1.6 Theories of adhesion 16
1.7 Conditions of joint formation and testing 22
1.8 Segmented polyurethanes in adhesive field 24
1.9 Literature review of polyurethane adhesives 27
1.10 Purpose of this study 29
References 32
Chapter 2 Effect of Curing Agent Ratio of Diol to Triol on Microaggregation Structure
and Adhesion Properties of Segmented Polyurethanes (Hot Melt Adhesive)
2.1 Introduction 36
2.2 Experimental 37
2.2.1 Materials 37
2.2.2 Polymer synthesis 38
2.2.3 Characterization 39
2.2.3.1 Swelling measurement 39
2.2.3.2 Macroscopic observation 40
2.2.3.3 Thermal analysis 40
2.2.3.4 Surface free energy measurement 40
2.2.3.5 T-peel strength 41
2.2.3.6 T-peel failure behavior 41
2.3 Results and Discussion 41
2.4 Conclusion 51
References 53

Chapter 3 Effect of Polymer Glycols on the Microphase-separated Structure and
Adhesion Properties of Spherulite Size Graded Polyurethane Elastomers
with Corona Treated Polypropylene Film (Reactive Adhesive)
3.1 Effect of Polymer Glycols on the Micro-aggregation Structure 54
and Mechanical Properties of Segmented Polyurethanes
3.1.1 Introduction 54
3.1.2 Experimental 55
3.1.2.1 Materials 55
3.1.2.2 Polymer synthesis 55
3.1.2.3 Characterization 57
3.1.2.3.1 Preparation of thin film using a microtome 57
3.1.2.3.2 Density and swelling measurement 57
3.1.2.3.3 Macroscopic observation 57
3.1.2.3.4 Thermal analysis 58
3.1.2.3.5 Functional group analysis 58
3.1.2.3.6 Pulsed nuclear magnetic resonance measurement of molecular mobility 58
3.1.2.3.7 Hardness analysis 58
3.1.2.3.8 Tensile strength measurement 58
3.1.3 Results and Discussion 59
3.1.4 Conclusion 73
References 75
3.2 Effect of Polymer Glycols on the Micro-aggregation Structure 76
and Adhesion Properties of Segmented Polyurethanes
3.2.1 Introduction 76
3.2.2 Experimental 78
3.2.2.1 Materials 78
3.2.2.2 Polymer Synthesis 79
3.2.2.3 Surface Modification of Polypropylene (PP) 80
3.2.2.4 Characterization 81
3.2.3 Results and Discussion 81
3.2.4 Conclusion 88
References 89

Chapter 4 The Influence of Curing Temperature on Microaggregation Structure and
Adhesion Properties of Segmented Polyurethanes (Reactive Adhesive)
4.1 Introduction 90
4.2 Experimental 91
4.2.1 Materials 91
4.2.2 Polymer synthesis 92
4.2.3 Characterization 93
4.3 Results and Discussion 93
4.4 Conclusion 105
References 106
Chapter 5 Effect of Humidity on Microaggregation Structure and Adhesion Properties
of Segmented Polyurethanes (Reactive Adhesive)
5.1 Introduction 107
5.2 Experimental 108
5.2.1 Materials 108
5.2.2 Polymer synthesis 109
5.2.3 Characterization 110
5.3 Results and Discussion 111
5.4 Conclusion 119
References 121
Chapter 6 Summary 122
Paper lists of thesis 125
Acknowledgement 127

Chapter 1 Introduction
1.1 Polyurethane adhesives (PUAs)
PUAs are commonly prepared from polyurethane elastomers (PUEs). Thus, for clearly
understanding in polyurethane adhesives, the principle of PUEs, method for preparing
polyurethane adhesives and theory of adhesion are explained.
Polyurethane (PU) is a class of polar polymers containing the urethane links (1) in their
backbones. PUs are commonly prepared by polyaddition polymerization. The most widely
used preparation method is the reaction of di- or polyfunctional hydroxyl oligomers, e.g.
hydroxyl-terminated polyethers or polyesters with di- or polyfuncional isocyanates.
The general structure of linear PU derived from dihydroxyl compound, HO-R-OH, and a
diisocyanate, OCN-R’-NCO, can be represented by the following general formula1):
In many cases, as PUs are formed, long chain and short chain diols alternate along the
chain to form segments which are either soft or hard. On a microscope scale, the soft and
hard segments coexist in a domain morphology characteristic of what are known as
segmented polyurethanes (SPUs). The very good impact and fatigue resistance of SPUs are
attributed to this phase-separated microstructure. The particular diol or polyol chosen will
greatly influence the rubbery and impact resistance properties of the SPUs, while the
isocyanate chosen will strongly influence the strength, modulus and hardness of the SPUs.
The domain morphology of SPUs is most pronounced for systems containing no chemical
crosslinking. In contrast to most adhesive systems, low levels of crosslinking tend to degrade
the properties of PUAs because of disruption of the domain morphology.
(1)
HN C
O
OR’NHC
O
OR( )nHN C
O
OR’NHC
O
OR( )n
NH
C OO
NH
C OO
1

PUAs have somewhat poorer thermooxidative and moisture resistance than acrylic and
epoxy structural adhesives. This has historically limited their expansion into certain areas of
use. On the other hand, SPU adhesives have high flexibility, usually strong peel strength, and
generally good impact and fatigue resistance recommended their use when these
characteristics are important. A variety of adhesives have been developed which incorporate
SPUs into acrylic or epoxy structural adhesives2). With the diverse range of high performance
properties, polyurethanes are essential to a multitude of end-use applications. Additionally,
PUAs was used as one application of SPUs. A detailed breakdown of the SPUs industry by
application is shown in figure 1.1. The versatility of SPUs is demonstrated by a summary of
their applications in five important areas that are automotive, furniture, construction, thermal
insulation and footwear. PUAs are widely used in footwear (i.e. shoe and slipper manufacture)
glue, sealant and packaging 2).
Construction35%
Refrigeration15%
Automotive16%
Others15%
Footwear 7%
Packaging 4%
Coatings, adhesives, sealantsand encapsulants 5%
Furniture 3%
Construction35%
Refrigeration15%
Automotive16%
Others15%
Footwear 7%
Packaging 4%
Coatings, adhesives, sealantsand encapsulants 5%
Furniture 3%
Figure. 1.1 World SPU market by industry 2).
2

1.2 Reactions of isocyanates
The isocyanates, containing the highly unsaturated –N=C=O group, are very reactive with
active hydrogen, and may also react with themselves. Of the many reactions surveyed herein,
only a few have been of sufficient importance to justify detailed kinetic studied such as
catalyzed and uncatalyzed reactions. The electronic structure of the isocyanate group
indicates that it should have the following resonance possibilities (2)3):
(2)
The normal reaction ultimately provides addition to the carbon-nitrogen-double bond. In most
reactions, especially with active hydrogen compounds, the aromatic isocyanates are more
reactive than aliphatic isocyanates. In addition, substitution of electronegative groups on the
aromatic ring enhances the reactivity whereas electropositive groups reduce the reactivity of
the isocyanate. For these reasons, isocyanates are often used as intermediate products in the
organic chemistry. For the better understanding of polyurethane chemistry, basic reactions
which are related to the synthesis of polyurethanes4) are represented as shown in figure. 1.2.
R N..
C+
O.... :-
R N..
C O.... R N
..C+
O....
-
..
R N..
C O....
+-
R N..
C+
O.... :-
R N..
C O.... R N
..C+
O....
-
..
R N..
C O....
+-
3

NCO + OH NCOHO
NCO + NH2 NCNHOH
NCO + H2O NHCOOH[ ] NH2 + CO2
NCO + COOH NCHO
+ CO2
NCO + HCl NCClHO
NCO + NCO
+ CO2
C ON H
NCHO
Urethane
Urea
Amine
Amide
Acyl Urea
Carbimyl Chloride
NCO + OH NCOHO
NCO + OH NCOHO
NCO + NH2 NCNHOH
NCO + NH2 NCNHOH
NCO + H2O NHCOOH[ ] NH2 + CO2NCO + H2O NHCOOH[ ] NH2 + CO2
NCO + COOH NCHO
+ CO2NCO + COOH NCHO
+ CO2
NCO + HCl NCClHO
NCO + NCO
+ CO2
C ON H
NCHO
NCO + NCO
+ CO2
C ON H
NCHO
Urethane
Urea
Amine
Amide
Acyl Urea
Carbimyl Chloride
Figure. 1.2. Reaction of isocyanate with active hydrogen compounds.
NCO + NCOHO
NCOO
C ON H
NCO + NCNHO
NCNOH
C ON H
3 OCN C C
N NC
N
O
OO
Allophanate
Biuret
Isocyanurate
H
NCO + NCOHO
NCOO
C ON H
NCO + NCOHO
NCOO
C ON H
NCO + NCNHO
NCNOH
C ON H
3 OCN C C
N NC
N
O
OO3 OCN C C
N NC
N
O
OO
Allophanate
Biuret
Isocyanurate
H
4

1.3 Various types of polyurethanes
PUs are certainly the most versatile class of polymers because of the great variety of
types (i.e. polycarbonate-, polyether- and polyester based PU), molecular weights, curing
agent ratios and so on5). The end products of PUs can be applied to many categories such as
elastomers, foams, plastics, fibers, coatings, films, binders, adhesives and so on.
a. Polyurethane elastomers (PUEs)
PUE is one of block copolymers with an [hard-soft]n-type structure, which consists of a
relatively flexible component called the soft segment and a relatively polar and stiff
component known as the hard segment6). PUEs have excellent mechanical properties
compared with general purpose elastomers. PUEs have attained a special importance in
widely differing industrial applications because of their unique properties, their large
versatility, and their various processing techniques7). The physical properties of typical
elastomers8) can be found in table 1.1. PUEs usually have three-dimensional network
structures which are obtained by permanently linking polymeric chains together as shown in
figure 1.3. The crosslinks may be either chemical bonds (as is illustrated by tri- or
multifunctional polyols as a soft segment, or through the hard segment, using tri- or higher
functional chain extender) or physical aggregation as crystallites in partially crystalline
polymers or glassy domains in a multi-phase block copolymer as shown in figure 1.4. PUEs
presently exist in two basic groups, classified on the basis of their morphological structure as
single phase network PU and multi phase SPU.
5

Figure 1.3 Three-dimensional network structures of polyurethane elastomer9).
Table 1.1 Physical properties of typical elastomers8).
Pure-Gum VulcanizatesCarbon-Black-Reinforced
Vulcanizates
TensileStrength(MPa)
Elongation(%)
TensileStrength(MPa)
Elongation(%)Polymer
Natural rubber (NR)
Styrene-butadienerubber (NR)
Acrylonitrile-butadienerubber (NBR)
Polyacrylates (ABR)
Thiokol (ET)Neoprene (CR)
Butyl rubber (IIR)Polyisoprene (IR)
Polyurethane elastomers(PU)
20.68
2.76
4.14
2.0724.13
20.6820.68
34.47 600
7001,000 20.68 400
31.03 600
41.37 500
800 24.13 700300 8.27 400
17.24 400
600 20.68 550
800 26.20 550
700 31.03 600
6

Single phase network PUs are usually homogeneously amorphous polymeric networks
having only one phase, e.g. one that may be prepared by a reaction of long chain, non-
crystalline, unbranched, OH-functional polyethers or polyesters with stoichiometric amounts
of diisocyanates. They may be formed by chemical crosslinking as perfect networks (without
dangling chain and loops). The chains between two points of linking, called network chains,
exhibit a distribution of molecular weights about an average. The network structures may be
characterized by the average network chain length, junction point functionality and network
chain length distribution, and so forth. Although hardness, strength and thermal stability of
single phase network PUs are comparatively low, they are useful in applications where high
tensile strength and thermal stability are not required. Furthermore, although a perfect
network can never be obtained in reality, they exist as an imaginary ideal model for
researches interested in studying relationships between chemical structure and physical
properties. In recently, some well-defined model networks prepared by endlinking
techniques10-12) rather than conventional crosslinking techniques13, 14), have been used in
investigation.
Figure 1.4. The model of chemical crosslink and physical crosslink in polyurethane elastomer chains.
Physical Crosslink
HS: Diisocyanate+Diol HS: Diisocyanate+Triol
Chemical CrosslinkPhysical Crosslink
HS: Diisocyanate+Diol HS: Diisocyanate+Triol
Chemical Crosslink
7

Multi-phase segmented PUs are a class of polymers which include soft and hard segments,
and exhibit phase separation. The soft segment (flexible long chains) is usually formed from
a polyether or polyester macrodiol15, 16) of molecular weight between 600 and 3,000. The hard
segment (stiff short chains) is formed by extending an aromatic diisocyanate wit low
molecular weight diol (1,4-butanediol is commonly used)17, 18), as shown in figure 1.5.
Typical SPUs such as thermoplastic PU (TPU) usually show a domain structure by virtue of
their physical aggregation of chains as shown in figure 1.6.
Figure 1.5. Block structure of SPUs prepared from diisocyanate ( ), chain extender ( ) and polyol ( )17).
8

Microphase separation begins even during the reaction; this separation continues during
cooling of the polymer (figure 1.6). Phase 1 consists of long chain polyols which may also
have been extended by individual diisocyanate molecules. Phase 2 contains polyurethane
blocks produced from diisocyanate and the chain extender. They form ordered domains
which are held together by intermolecular forces in which hydrogen bonds play an important
role. As a result of interaction between the two microphases which are linked by chemical
bonds, the material assumes its rubber elastic properties. The moving element is formed by
the long and flexible polyol chains with a glass temperature below room temperature. Phase 2
(consisting polyurethane blocks) provides the crosslinking domains which largely prevent the
irreversible flow of the material when under mechanical stress. It has become customary to
refer to the polyol blocks as soft segments and to the urethane blocks as hard segments. Hard
Figure 1.6. Schematic model of domain structure in SPUs; Phase 1: solid lines and Phase 2: circle areas17).
Domain structure of SPUsDomain structure of SPUs
9

segments domains act as physical crosslinks and reinforcement sites, significantly affecting
mechanical properties, particularly modulus hardness and tear strength.
b. Polyurethane foams
Polyurethane foam was created during World War II for the insulation of refrigerators
and airplanes because this polymer was cheaper, easier to shape, man-made and abundant, it
possessed great potential to be used in many practical applications. So these polymers are
used in many areas of our lives including: furniture cushions, shoe soles, insulating materials,
adhesives, flotation devices, cellular scaffolding for bone regeneration, and acoustical
vibration control. They are synthesized by the reaction of a polyester polyol, or polyether
polyol and water with an aromatic or aliphatic isocyanate (figure 1.7).
Polyurethane foam can be flexible or rigid depending on the type of crosslinking that
exists between the molecules.
Figure 1.7. Polyurethane foam reaction18).
2OCN R NCO
+HO R1 OH
OCN R NH O R1 OC
O
C
O
NH R NCO
Diisocyanate
Polyetheror Polyester
Isoyanate-terminated urethane prepolymer
+ H2O
NH R NH O R1 OC
O
C
O
NH R NHC
O
NH C
O
NH
+ CO2
Foam polymer
UrethaneUrea
2OCN R NCO
+HO R1 OH
OCN R NH O R1 OC
O
C
O
NH R NCO
Diisocyanate
Polyetheror Polyester
Isoyanate-terminated urethane prepolymer
+ H2O
NH R NH O R1 OC
O
C
O
NH R NHC
O
NH C
O
NH
+ CO2
Foam polymer
UrethaneUrea
10

Rigid Foam is a highly crosslinked closed celled material of low density, and is widely
used in the construction industry. The polyurethane foam properties can be modified within
wide limits depending on the raw materials used. This is also true for rigid foams. The
density, fluidity, strength, thermal stability and other properties can be adjusted by changing
polyols and isocyanates to suit the unique requirements of an application.
Flexible foams have a limited resistance to an applied load. They have mainly open cells,
formed by gas bubbles that have popped. Air can pass through the foam easily, resulting in a
soft, resilient, flexible material. The material is thus harder and less resilient. Controlling the
proportion of open cells to closed cells during the production process is one of the ways that
the properties of foam can be manipulated, adding to the materials versatility19). The
formation of PU flexible foams depends on two basic reactions, namely urea reaction and
urethane reaction. The urea reaction was formed by the addition of water to isocyanate, while
CO2 is generated. The urethane reaction was occurred by the addition of branched polyols
containing OH-groups to isocyanate.
The simple fabricating techniques and attractive costs of flexible foams are the important
factors which have led to the manifold uses. The major area of application are furniture
cushioning, mattresses, transportation, textiles, packaging, household goods and
miscellaneous applications.
c. Polyurethane adhesives (PUAs)
PUAs are actually coatings between two surfaces. The forces between the adhesive and
the adherend may be small but, as in other intermolecualr attractions related to
macromolecules, those forces are additive. PUAs must be fluid at some stage during the
application and must wet the surfaces of the adherend while in the fluid state. Adhesion is
favored when the solubility parameter of the adhesive has a high numerical value. The
adhesion is enhanced by the presence of polar groups.
PUAs are normally defined as the adhesives that contain a number of urethane groups in
the molecular backbone or are formed during use, regardless of the chemical composition of
the rest of the chain. Thus, a typical urethane adhesive may contain, in addition to urethane
linkages, aliphatic and aromatic hydrocarbons, esters, ethers, amides, urea and allophanate
groups. An isocyanate group reacts with the hydroxyl groups of a polyol to form the
repeating urethane linkage. Isocyanates will react with water to form a urea linkage and
11

carbondioxide as a by-product. Linear thermoplastic PUs may be obtained by using
compounds with two reactive groups such as diisocyanate and diols. Crosslinked PUs can be
occured either when polyols with three or more hydroxyl groups (i.e. a functionality of 3 or
more) are reacted with an isocyanate or when isocyanates with three or more isocyante
groups are reacted with a polyl. The amount of crosslinking affects the stiffness of the
polymer. Contrary to linear polymers, crosslinked polymer will not flow when heated. All
structural adhesives are crosslinked because this eliminates creep, that is, deformation under
constant load. In reaction systems, where there is an excess of isocyanate crosslinking
reactions may occur. These reactions form linkages of allophanate and biuret.
d. Other applications
SPUs also have some potentially useful applications, for instance, plastics, coating, fibers,
films, laminates, sealants and so on. Films is a continuous, homogeneous, dimensionally
stable form of a polymer having a small thickness in relation to area20). The polyurethane
films obtain their performance from their common chemical structure. This is characterized
by hard and soft segments the former provides stiffness and the latter gives
flexibility. During processing the hard parts can soften and thus allow the material to be
shaped. But upon cooling they reform to yield the elastomeric behavior required. In the PU
films, 4,4-diphenylmethane diisocyanate (MDI) is almost used as the hard segment, while the
various polyols such as polyether or polyester polyols are used as the soft segment. PU film
based on polyether polyol exhibited best hydrolysi, heat stability, weather stability and oil
resistance. In addition, PU film based on polyester polyol showed the best tear, chemical
resistance and good mechanical properties21). The third basic component is the chain extender
which controls the molecular weight and chain length of the polymer and therefore the
hardness or flexibility.
Fibers containing at least 85 weight % of SPU are called “Spandex”22). Spandex fibers are
highly elastic and have replaced natural and synthetic rubber fibers for many textile purposes.
Urethane coatings have some outstanding properties, as for superior abrasion resistance,
adhesion force, chemical resistance, flexibility, light and weather stability. PU surface
coatings are applied as sealants to wood, concrete, and machine parts and as linings for tanks
and pipes; moisture-curing PU resin is used as a general purpose waterproof glue. For PU
coating, PU-based polymeric films applied on steels provide a very effective protection
12

against corrosion as a result of the combination of excellent adhesion to metal substrates and
barrier properties23).
1.4 Preparation of polyurethane
PUs can be prepared by various methods such as one-shot method and prepolymer
method. Prepolymer and one-shot methods are commonly used in the preparation of flexible
and rigid foams, cast elastomers, TPU and PUA.
a. One-shot method
The one-shot of PU is schematically represented in figure 1.8. The entire PU formation
may be carried out by simultaneously mixing together polyol, diisocyanate and chain
extender or crosslinker24).
Polyol Diisocyanate Chain extender or Crosslinker
Polyurethane Elastomers
Polyol Diisocyanate Chain extender or Crosslinker
Polyurethane Elastomers
Figure 1.8. Preparation of polyurethane by one-shot method.
13

b. Prepolymer method
The prepolymer technique has two step for synthesized polyurethane. In the first step,
prepolymer is obtained by the reaction of polyol and diisocyanate, and next, the prepolymer
is teated with curing agent which is a potentially active hydrogen compound, and is altered
into the final high molecular weight PU. This step is generally reffered to the chain extender
or crosslinking stage (figure 1.9)25-27).
1.5 Preparation of polyurethane adhesives
The preparation methods of PUAs are depending upon the application of use. There are
many types of adhesives available today, each with unique characteristics. In general,
adhesives can be classified into many types given below.
Figure 1.9. Preparation of polyurethane by prepolymer method.
+Diisocyanate Polyol
OCN ~ ~~ NCOR NH
C
=
O
O~ ~ ~ ~ ~~ ROC=
O
NH
Prepolymer
OCN NCO HO OH
Chain extension with diol
Chain extension with diamine
Polyurethane withurethane linkages
Polyurethane withurea linkages
R R’+Diisocyanate Polyol
OCN ~ ~~ NCOR NH
C
=
O
O~ ~ ~ ~ ~~ ROC=
O
NH
Prepolymer
OCN NCO HO OH
Chain extension with diol
Chain extension with diamine
Polyurethane withurethane linkages
Polyurethane withurea linkages
R R’
14

a. Water borne adhesive
These adhesives are high molecular weight polyurethanes dispersed in water (PUD). The
water carrier is eliminated during use, leaving the precipitated and coalesced polymer to form
the adhesive bond. The PUDs are not a direct plug-in for the solvent-based polyurethanes.
The film forming mechanism of the PUDs is very different from that of the solvent-based
resins. In order to realize their optimum properties, they have to be skillfully formulated. The
composition of the polymer backbone as well as the formulating ingredients will have
significant influence on film formation properties.
PUDs are small and discrete polymer particles ranging from 0.01-5.0 microns in a
continuous water phase. They are free of isocyanate residues and have a zero or a very low
volatile organic content (VOC)28). They are safe to handle and are a good choice for
compliant coatings. PUDs can be made to have 30-65% solid content and a wide range of
film hardness.
One of the drawbacks of PUDs is their relatively higher cost. To compensate for the
higher cost, the PUDs are blended with other low cost dispersions to improve adhesion to
certain substrates. Acrylic emulsions are the most commonly used blending materials due to
the familiarity of the formulators with their properties. Waterborne PUAs are an interesting
alternative to the current solvent-based PUAs used in footwear industry29), automobile, paint,
furniture, and textile industries and also in biomass foam incorporated with renewable raw
materials30).
b. Solvent adhesive
Solvent PUAs consist of high molecular weight hydroxyl terminated PU dissolved in a
solvent. PUs are obtained by reacting of a high molecular weight polyester diol with
diisocyanate and dissolve in solution. The polymer solutions are applied to both surfaces to
be bonded. Some time is allowed for the solvent to evaporate and the surfaces are then
pressed together, at which point interdiffusion of the polymer chains will occur.
Solvent PUAs are suitable for a number of different industrial and construction
applications. Solvent PUAs have good adhesion to rubber, leather, textiles, metal, paper,
wood, and plastics. In addition, solvent PUAs are used for a wide variety of laminating
applications31).
15

c. Hot melt adhesive
These adhesives are consisted of high polar group based SPU. Hot melt adhesives are
most commonly applied as adhesive film in lamination type of applications, aerospace and
aircraft structure assemblies, automotive and packaging industries. These adhesives are
formed the adhesive bond by cooling from the molten state. The difference between hot melt
adhesive and other liquid adhesives is that hot melt adhesive bond simply by cooling rather
than by the evaporation of a solvent or by chemical curing which is done for other adhesives.
Advantages of hot melt adhesives
� Presence of high viscosity allows hot melt adhesive to be used on different non-
porous and porous substrates without sacrificing the strength of bond.
� Since no chemical curing method is used, pollution problem is not created in hot melt
adhesives.
� As it remains as a complete solid system, transportation and storage problems are
reduced in hot melt adhesives.
Disadvantages of hot melt adhesives
� Hot melt cannot be used along with heat sensitive substrates.
� Hot melt adhesive bonds lose strength at high temperature.
1.6 Theories of adhesion
A general theory of adhesion must account for both the bonding process and the
unbonding or fracture process. The theory should take into consideration both the adsorption
and interdiffusion theories of adhesion and should include the aspects of cohesion and
autohesion as a special case. In addition, mechanical adhesion is also important to the
improvement of adhesive strength. The mechanical adhesion should be enhanced by greater
contact with the irregularities or pores of the substrates; the viscosity and certain other
properties of the adhesive will therefore be important on this basis. The term of adhesion
refers to the coherence between two contiguous surfaces of materials of different nature,
while the term autohesion refers to the ability of two contiguous surfaces of the same material
to form a strong bond which prevents their separation at the site of contact. Two types of
adhesion are often distinguished, namely the specific of inherent adhesion which involves the
16

binding force between adhesive and surface, and mechanical adhesion which refers to the
penetration of the adhesive into pores and fissures of the surface, and retention of the
solidified adhesive in these pores owing to mechanical wedging. The specific or inherent
adhesion is accomplished via specific interaction between the adhesive and the substrate
molecules, just as cohesion is regarded as a result of the action of forces of molecular
attraction between similar molecules32).
a. Mechanical interlocking theory
The mechanical interlocking theory of adhesion states that good adhesion occurs only
when an adhesive penetrates into the pores, holes, crevices and other irregularities of the
adhered surface of a substrate, and locks mechanically to the substrate (figure 1.10)33). The
adhesive must not wet the substrate, but also has the right rheological properties to penetrate
pores and openings in a reasonable time. This theory explains a few examples adhesion such
as ultra high modulus polyethylene (UHMPE) fiber and vinylester resin34) and the common
practice to roughen a wood surface with glass paper35). Since good adhesion can occur
between smooth adherend surfaces in many studies suggests that the interlock may help
promote adhesion, but is not really a generally applicable adhesion mechanism.
Pretreatment methods applied on surfaces enhance adhesion. These pretreatments
(especially plastic surface treatments) result in micro-roughness on the adherend surface,
which can improve bond strength and durability by providing mechanical interlocking.
Beyond mechanical interlocking, the enhancement of the adhesive joint strength due to the
Figure 1.10. The schematic model of mechanical interlock.
17

roughing of the adherend surface may also result from other factors such as formation of a
larger surface, improved kinetics of wetting and increased plastic deformation of the adhesive.
b. Adsorption theory
The adhesive macromolecules are adsorbed onto the substrate surface and held there by
various forces of attraction. The adsorption is usually classified into primary forces and
secondary molecular forces, sometimes called “Chemical bonding force” and “Van der Waals
force”, respectively. This theory assumes a definite interface between the adhesive and
adherend. The primary bonds are the strongest energies in the range of 100-1000 kJ/mol as
compared with 20-40 kJ/mol of secondary forces. In case of urethane adhesives bonded to
active hydrogen containing substrates, a primary bond is believed to exist as explained in
figure 1.11.
In addition, this theory is involving interactions between dipoles of various types but they
fall into three groups36):
OH OH OH OH O O O O
Prepolymer
NCO NCO NCO NCO
+
Prepolymer
NH NH NH NH
C=O C=O C=O C=O
Active hydrogen surface Covalent bonding
Substrate Substrate
OH OH OH OH O O O O
Prepolymer
NCO NCO NCO NCO
+
Prepolymer
NH NH NH NH
C=O C=O C=O C=O
Active hydrogen surface Covalent bonding
Substrate Substrate
Figure 1.11. Schematic representations for covalent bonding of urethane adhesive with polar surface37).
18

(i) Dipole/dipole interactions-Keesom forces: This first group arises from the interaction
and attraction of pairs of molecules which both have permanent dipoles.
(ii) Dipole/induced dipole interactions-Debye forces: The second group arises when a
molecule with a permanent dipole approaches a molecule with no dipole and induces
a temporary dipole in the neutral molecule and then an attraction arises.
(iii) Molecule-molecule interactions-London Dispersion forces: The third group is
universal, causing attraction between energy pair of nonpolar particles which
approach each other sufficiently closely, irrespective of any recognizable dipoles.
They arise from the instantaneous quantum mechanical asymmetry of the electron
clouds and hence transitory dipoles which interact.
c. Diffusion theory
The adhesive macromolecules diffuse into the substrate thereby eliminating the interface.
The diffusion of segments and chain ends of polymers was suggested as a mechanism for the
adhesion of similar elastomers above their Tgs38). This is now generally accepted at least as
the adhesion of two pieces of the same materials are contacted; their boning is termed
“autohesion or self-bonding”, although not for the adhesion of different polymers even if they
are reasonably similar. The consideration for quantitative development was derived from
theories of mixing of liquids and being from Fick’s laws of diffusion39).
Fick’s first law relates the quantity of material diffusing (in the x-direction) across a plane
normal to the concentration gradient:
dw = -Df dt dc/dx
where w is the quantity of material, Df the diffusion coefficient, t the time, and dc/dx the
concentration gradient.
For deduced the various functions for the dependence of Df on other factors including
concentration and nature of the diffusing molecule, and derived a theoretical peel energy,
assuming that this depended on the depth of penetration and the number of chains crossing
the phase boundary.
P = k4(2Np/M)2/3 Dd1/2tc
1/4
19

Where P is the peeling energy, M the Avogadro’s number, k4 a constant, Dd is a constant
which characterizes the mobility, of the macromolecules and is related to Df, N the number of
chains crossing the boundary, p the density, and tc the time of contact.
d. Electrostatic theory40-42)
The electrostatic theory describes that an electrical double layer is produced at any
interface and the consequence coulombic attraction largely accounts for adhesion and
resistance to separation. The theory can be viewed as treating the adhesives/substrate system
as a capacitor that is charged due to contact of the two different materials. The Deryaguin’s
theory as shown below can be used to represent the electrostatic theory,
Ac = (hc�d /8�)�(dVc/dhc)2
where Vc is the discharge potential at the discharge gap, hc and �d are the dielectric constant.
A common example often described by the electrostatic theory is the adhesion of a plastic
film on a layer of paper or another film of plastic.
e. Weak boundary layers43-45)
Two real materials, say A and B, that are composed of molecular components ai and bi,
respectively as shown in figure 1.12. These are located in the bulk (aib, bib), at the surface (ais,
bis), and/or with in the near surface region (ain, bin). Upon contacting A and B under ambient
conditions, the interface, defined as the locus of interactions between the two materials,
initially involves the surface species on each and any entrapped air. In general, the interface
will not be continuous at first. Entrapped air and surface rougosity prevent immediate, full
molecular contact, although applied pressure can speed interface formation. With time,
depending on the particular system, the region between the two bulk materials, the so-called
interphase, changes. For example, the interface may thicken by interdiffusion and chemical
reaction may occur. If the interface contains a mechanically weak boundary layer, it may be
the site of fracture when the adhesive joint is loaded. Weak boundary layers (WBLs) may
originate on or near the surface of materials before they are contacted, or they may develop in
situ during the dynamic conditions of contact.
20

The provide a strong joint, the structural components, for instant, those responsible for the
cohesive strengths of A and B, must interact well at the final interface, and a WBL must not
be present. WBLs may be removed prior to bonding or be disrupted by diffusion during
bonding.
After an adhesive contacts a solid substrate, it is normally necessary to convert it to a
hardened state (setting) so that the joint will be capable of supporting stress. However, since
setting severely reduces the molecular mobility required to achieve true contact and good
bond formation, it should not take place too quickly. Many weak adhesive joints can be
traced to rapid setting before sufficient interface formation. Setting of adhesive can occur by
physical or chemical means. In order to minimize internal stresses in a joint, there should not
be large change in volume of the adhesive during solidification, and the thermal expansion
coefficients of the adhesive and adherends should be similar. This is especially important
when the solid adhesive has a high modulus. Furthermore, joints with plane interfaces have
been suggested to be more sensitive to adhesive shrinkage than are joints made with complex,
high surface area adherends. Solvent based adhesive experience the most shrinkage during
setting compared to those which harden by cooling (hot melt) or by chemical reaction
(usually thermosets). The facts that epoxy resins shrink only about 3% upon setting is one
reaction compared to many other condensation polymerizations that is no small molecules
such as water which can interface with bonding, are created during setting. PU reactions are
surface ais
bulk aib
near surface ain
bulk aib
surface ais
near surface ain
ambient air
B
A
contact
bulk aib
Interphase (ain, ais, bis, bin)
bulk aibsurface ais
bulk aib
near surface ain
bulk aib
surface ais
near surface ain
ambient air
B
A
contact
bulk aib
Interphase (ain, ais, bis, bin)
bulk aib
Figure 1.12. Two hypothetical real materials A and B; (a) prior to contact and (b) after contact43).
21

also favorable in this regard. Some inorganic substances adhere exceptionally well because
they expand on freezing. For example, ice will adhere to almost any surface, even those not
wetted well by water. When water freezes in a depression in a solid surface, expansion causes
it to lock against the sides of the depression and form a strong joint.
1.7 Conditions of joint formation and testing
In addition to the condition of the substrate surface, the conditions of joint formation and
testing will affect the strength of an adhesive joint. In forming joint, increasing the
temperature will lower the viscosity of the adhesive and this will generally, within certain
limits, lead to higher bond strengths. Increasing the time at a particular temperature and
increasing the pressure will also lead to improved wetting. The time lapse between forming
and testing an adhesive joint is also important. Testing conditions that may have an important
effect on the bond strength include (1) strain rate46), (2) temperature47), (3) humidity48) and (4)
thickness of the adhesive layer49). In general, the bond strength increases with increasing
strain rate. Increasing the temperature may either increase or decrease the bond strength. If
stress concentrations are reduced, then higher values are achieved and this effect is perhaps
most marked in peeling tests. However, in shear and direct tension tests, if the cohesive
strength of the adhesive is greatly reduced by increased temperature, then large reductions in
bond strength may result. Adhesive joints tend to be adversely affected by conditions of high
humidity. It has frequently been shown, in direct tension and shear tests, that the strength of
an adhesive joint decreases with increasing glue-line thickness. The precise reason for this is
not clear, although one popular view is that thin layers of adhesive tend to minimize stress
concentrations. Peeling tests are more important when flexible substrates such as films are
involved, whereas shear and direct tension tests are more important with rigid substrates,
such as molded plastic parts. To conclude, the strength of an adhesive joint depends on many
factors some of which are associated with the formation and others with the breaking of the
joint. It is clearly desirable that published bond strength should be accompanied by details of
all the experimental conditions50).
The mechanical performance of the adhesive bond can be measured in a variety of
methods. Many common tests are used to measure the mechanical properties of an adhesive
bond such as peel test, wedge test, lap shear test and so on. The peel test is the method to
access the bond energy for such a joint in which one of the adhering test is either much stiffer
than the other or is firmly attached to a rigid support. Figure 1.13 describes the three
22

commonly used peel test configurations, i.e. 90o-peel test51), 180o-peel test51) and T-peel
test52). Usually the peel angle (�) is kept constant during the test.
The use of lap shear test is convenient because the test geometry is simple and
representative of commonly used joint designs in industry. A wide variety of joint
configurations are possible when bonding structures. The single-lap and double-lap
configurations are the most commonly found in practice and are applicable for joining
relatively thin adherents. On the other hand, the more advanced stepped lap and scarf
configurations are used to transfer high loads in joint with thicker adherents. Figure 1.14
represents two commonly used methods of lap shear test that is single lap shear test53) and
double-lap shear test54).
Both tests were used to measure the SPU/aluminum and SPU/polypropylene joint
strength in the present work.
����90o
���� = 180o
(a) 90o Peel (b) 180o Peel (c) T-Peel
����90o
����90o
���� = 180o���� = 180o
(a) 90o Peel (b) 180o Peel (c) T-Peel
Figure 1.13. Several typical peel test configurations: (a) 90o peel test, (b) 180o peel test and (c) T-peel test.
(a) Single lap shear (b) Double lap shear(a) Single lap shear (b) Double lap shear
Figure 1.14. Several typical lap shear test configurations: (a) single lap shear test and (b) double lap shear test.
23

1.8 Segmented polyurethanes in adhesive field
SPUs are linear polymers that have a molecular backbone containing urethane groups.
These groups are produced through a reaction between a diisocyanate and a polyol. SPUs
formulations cover an extremely wide range of stiffness, hardness and densities. Chemically
these products are located between the two prototypes of two-component PUs. From a
polymer physics point of view, however, it is a new class of elastomeric products which are
characterized by segmented structure (block copolymer structure) of the primary chain. The
secondary and tertiary structures, consequently, the morphology of these SPUs are dependent
on the chemical composition and the length of the segment (blocks). The reason for the high
property level of these products is due to the two- or polyphase structure. These polymers are
used in building insulation, surface coating, solid plastic and adhesive. The crosslinked SPUs
are important polymer although the linear SPUs are widely used in many applications
because the crosslinked SPUs have more excellent mechanical properties than that in the
linear one. The crosslinked SPUs have the general structure (A-B), where the soft segment (B)
is usually formed from a polyether or polyester macroglycol. In addition, the hard segment (A)
is formed by extending an aromatic diisocyanate with a low molecular weight diol, for
instance 1,4-butaindiol. The SPUs can be separated into two microphases due to the structural
difference of soft and hard segments. Hard domains play the role of physical crosslinks and
act as a higher modulus filler in the low modulus soft matrix, whereas the soft phase gives
extensibility to the polymer. Moreover, the incorporation of low molecular weight triol
molecules into the SPU structure results in the formation of chemical crosslinks. Thus, the
mechanical properties of SPUs are predominantly the result not only of two-phase
morphology but also of the chemical crosslinker concentration55, 56).
During the last seventy years, the scope of adhesive applications has grown from the
familiar aspects of furniture and container manufacture to include such previously
unexpected problems of producing plywood suitable for aircraft production, bonding rubber
to metal, and preparing metal to metal joints more durable than riveted assemblies. Some of
the major problems which were encountered and which have been only partially solved
include the preparation of uniformly strong, vibration resistant and temperature resistant
rubber to metal, plastic to metal, and metal to metal bonds and the adhesion of both natural
and synthetic rubber to synthetic fibers. The adhesives based on isocyanates have shown
promise for bonding metals, plastic, glass and wood but further development is required to
clearly evaluate their merits for these purposes. One advantage of the isocyanate adhesives is
24

that of curing at room temperature. In a chemical sense the great majority of the isocyanate
adhesive formulation may be divided into three classes: (1) polyisocyanates, which may be
used alone or in mixtures with rubber (2) reaction products (prepolymer) of an excess of a
polyisocyanate with an organic compound containing two or more active hydrogen groups
such as polyesters and glycols (3) polymeric compounds containing active hydrogen groups
which have been modified by reaction with a polyisocyanate. As in most classifications the
line of demarcation between groups is sometimes obscure, but the classification is useful
when considering the chemistry of curing the adhesive57, 58).
a) Polyisocyanate adhesives
The first group of isocyanate adhesives is made up of the polyisocyanates which are used
alone or more often in conjunction with polymers normally considered as unreactive such as
rubber. Adhesives of this group are especially valuable for bonding unvulcanized rubber to
fabrics and metals. In the bonding of rubber to fiber, the reaction of isocyanate groups with
active groups in the fibers is also important, for instance, the common cellulose. The reaction
occurred with water in the cellulose, rather than with the hydroxyl groups. Such a reaction
with water would lead to the formation of polymeric ureas, which might contribute
significantly to the good adhesion because of the mode of application. It is likely that reaction
with atmosphere moisture plays an important part in the curing of adhesives of this group.
The important factor, that is, the period of time might be enough for the solvent to evaporate
and for the isocyanate to absorb moisture. Furthermore, the self life of adhesives is also
affected by moisture. Moisture which is absorbed from the atmosphere will convert the
polyisocyanate to polymeric, insoluble ureas. All isocyanate solutions or adhesives
containing free isocyanate groups exhibit this sensitivity toward water. The self life may also
be influenced by polymerization of the isocyanate by the dimerization of trimerization of
NCO groups.
b.) Prepolymer adhesives
The second group of isocyanate adhesives includes polymers of low to moderate
molecular weight which contain free isocyanate groups. These may prepared by reacting a
polyfunctional active hydrogen compound with more than enough polyisocyanate to react
with all of the active hydrogen groups. The prepolymer, which obtained from the reaction
25

between OH groups of polyol and NCO groups of diisocyanate is a high molecular weight
isocyanate and will undergo reactions typical of isocyanates. It may be further cured by
reaction with atmospheric moisture, as indicated below using more simplified formulas:
Such a reaction with water will lead to chain lengthening if a difunctional active hydrogen
compound was used initially or to chain lengthening and crosslinking if a polyfunctional
active hydrogen compound was used. Crosslinking may also occur by reaction of isocyanate
groups with the active hydrogen of urea and urethane groups in the adhesive itself:
The polyhydroxy compound used in preparing these prepolymers may be a polyether,
polyester, castor oil, a simple glycol, or related materials. Adhesive in this second group may
be applied in one or both of two different techniques. First, in the case of low curing
temperature, a solution of the adhesive is applied to the surface to be bonded. This coating
exposed to the air for 10 to 15 minutes to permit the solvent to evaporate and for atmospheric
moisture to initiate the cure. The surfaces are then joined under moderate pressure and held
unit the cure is complete. The curing time varies from several hours to a day at room
temperature, to a few minutes at 150 to 200 oC., and may be shortened by the proper choice
R NCO + H2O R NH2 + CO2
N RNCO
~~~~~NCO
H H
NNCOH H
~~~~~
R NCO + H2O R NH2 + CO2
N RNCO
~~~~~NCO
H H
NNCOH H
~~~~~
NCOO
R
CNHRO
R NCO + NCOO
RH
R NCO + NCNO
RH H
NCNO
R
CNHRO
CNHRO
NCOO
R
CNHRO
R NCO + NCOO
RH
NCOO
R
CNHRO
NCOO
R
CNHRO
R NCO + NCOO
RH
R NCO + NCNO
RH H
NCNO
R
CNHRO
CNHRO
R NCO + NCNO
RH H
NCNO
R
CNHRO
CNHRO
26

of catalysts59). Curing agents other than water, e.g. diamines60) or glycols61) may also be
mixed into the prepolymer just before applications. The second method of application is
similar, except the adhesive film is first cured to a nontacky stat, which is stable indefinitely.
The surface to be bonded are then joined and heated under pressure and fuse the adhesive
film. One to five minutes may be required at 175 to 200 oC. After cooling, full or nearly full
bond strength is obtained. This method is appropriate for materials which are not sensitive
hydrogen groups. The good results from this second type of curing demonstrate that free
isocyanate groups are not required for adhesion to metal or glass, but that a polymer of
suitable molecular weight, degree of crosslinking and other physical properties, and
containing urea and urethane links are adequate. In contrary, the reaction of isocyanate
groups with the reactive groups of the polymers bonded may play an important role in
establishing adhesion. The shelf life of these adhesives may be affected by polymerization of
the isocyanate or reaction with atmospheric moisture or with active groups in the adhesive.
Catalysts should not be included in the prepolymer during storage if maximum shelf life is
desired.
c) Isocyanate-modified polymers
This group of isocyanate adhesives includes those active hydrogen containing polymers
which are combined with diisocyanates or polyisocyantes. The polymers in this class include
polyesters, polyethers, castor oil, hydroxyl-terminated urethane elastomers, and polyvinyl
alcohol. The isocyanate is normally used in an amount of nearly equivalent to the hydroxyl
groups in the polymer, so that the molecular weight of the polymer is greatly increased and
crosslinking is normally introduced.
In this work, SPU adhesive was prepared by prepolymer technique due to the good
application of this method, namely prepare in the moderate pressure and the adhesive can be
cured in several temperatures.
1.9 Literature review of polyurethane adhesives
During the past 41 years, the use of adhesives has greatly increased as a result of the
availability of improved adhesives based on synthetic polymers. PUs forms a particularly
versatile class of adhesive polymers. It is well known that PUAs are widely used in the field
of footwear, packaging and lamination. Adhesives are not replacing screws, rivets and nails
27

but are becoming a preferred alternative to spot welding, soldering and brazing. Use of
adhesive can produce joints of higher strength, allow the assembly of components without the
need to drill or perforate them, and avoids the heat distortion resulting from high temperature
jointing processes. Surface modification for non-polar substrate is important for adhesive
strength of PUA. In case of polar substrate, the surface modification is not necessary to use in
the adhesive field.
Cui et al.62) prepared isocyanate reactive hot melt adhesive from polyester or polyether
glycols and diisocyanates. They found that the crystal of isocyanate prepolymer consisted in
spherulites and sample with higher crystal content showed better green strength but slower
adhesion development as a result of hindrance to moisture diffusion by the crystalline
structure. Crystalline structure was suppressed by the penetration of crosslinking reactions.
Heat of crystallization and onset crystallization temperature in cooling traces of cured sample
melty was reduced by interruption of crosslinked bonding. Park et al.63) studied the hot melt
adhesive properties of a series of ethylene vinyl acetate copolymer (EVA)/aromatic
hydrocarbon resin blend. The peak of loss modulus increased with increasing softening point
of the aromatic hydrocarbon resin. The melt viscosity of the blends decreased with increasing
temperature. In addition, the melt viscosity increased with increasing softening point, but
decreased with increasing aromatic hydrocarbon resin and vinyl acetate content. In case of
the same blend ratio, the increasing of softening point of the aromatic hydrocarbon resins
increased the crystallinity whereas the addition of aromatic hydrocarbon resin decreased the
crystallinity. Moreover, the lap shear strength increased with increasing softening point of the
aromatic hydrocarbon resin. Somani et al.64) synthesized PU adhesive from various polyols,
obtained by reacting a castor oil derivative and diols (glycols) with diisocyanate adducts,
where different NCO/OH ratios were used to give various compositions. They studied the
effect of NCO/OH ratios, types of isocyanate adducts and chain length of glycols by
determined wood-to-wood adhesion strength. They found that PU adhesives synthesized from
ethylene glycol and aromatic isocyanate adduct show good adhesion strength and chemical
resistance as there is no ether linkages in the networks whereas ether linkages in diethylene
glycol and triethylene glycol is some what responsible for lower adhesion strength value and
chemical resistance. O’Hare et al.65) investigated the physicochemistry of the surface of
untreated and corona discharge treated biaxially oriented polypropylene (BOPP) film using
contact angle analysis, x-ray photoelectron spectroscopy (XPS) and atomic force microscopy
(AFM). The surface energy was increased with increasing energy of corona. The functional
groups incorporated onto the surface have been identified as hydroxyl, peroxy, carbonyl,
28

ester, carboxylic acid and corbonate. These groups are present in varying relative
concentration, depending on the energy of the corona utilized. The morphology of the film
changed after corona discharge treatment. Initially, a fibrillar crystalline structure was
observed. On the other hand, after corona discharge treatment, a globular morphology
became apparent. These globular features were attributed to low molecular weight oxidized
material (LMWOM) created by corona discharge treatment. The roughness of the film was
not found to increase under the corona conditions employed. Formation of LMWOM was
found to be independent of treatment energy. However, two mechanisms have been suggested
for its formation and these mechanisms dependent on the energy of treatment. Xu et al.66)
prepared surface modification of polyester fabric by corona discharge irradiation at different
voltages. The treated fabric showed increased wicking and hydrophilic properties and the
properties can be preserved for a long time. Surface affinity between the treated fabric
surfaces with modified starch sizing was also confirmed to be increased. Dyeing of the
treated fabric showed that dyeing speed and the dye-uptake were improved. All the results are
supposed due to the improved hydrophilic properties produced by the corona discharge
treatment. Kwon et al.67) studied surface characteristics of polypropylene (PP) film treated by
an atmospheric pressure plasma. They measured the contact angle of the surface by using
polar solvent (water) and nonpolar solvent (methylene iodide) after the atmospheric pressure
plasma treatment of PP film surface. And they also calculated surface free energy with
respect to the conditions of atmospheric pressure treatment. The change of surface
morphology and roughness before and after plasma treatment was observed by AFM analysis.
The surface roughness of PP film showed the highest value when the plasma treatment time
was 90 second. Finally, they analyzed the change of chemical compositions on the PP film
surface through XPS. They found that polar functional groups, such as -CO, -C=O and -COO
were introduced on the PP film surface after atmospheric pressure plasma treatment.
1.10 Purpose of this study
SPUs, consisting of soft segments and hard segments, are well known to separate into two
microphases68). Hard domains play a role of physical crosslink and acts as higher modulus
filler in the low modulus soft matrix, whereas the soft phase gives extensibility to the SPU.
SPU is one type of thermoplastics because physical crosslinks disappear above their melting
points and are restored upon cooling69). Their microphase separated structure reveals
excellent mechanical properties in the bulk properties. SPUs are now widely utilized as
29

engineering materials in various industries such as automotive70), medical equipment71),
adhesive products72) and so forth.
The process that allows the adhesive to transfer a load from the adherend to the adhesive
joint is known as the adhesion. In general the adhesive can be intimately interacted either
through chemical or physical forces to the adherend surface. The chemical interactions result
from atomic scale attractions between specific functional groups of the adhesive and the
adherend surface. During the curing process, the viscous adhesive material will flow to
enable contact with the adherend and penetration of the surface asperities. As curing proceeds,
the viscous product becomes rigid solid as the compounds react and cohesively link the
adhesive, often referred to as crosslinking. This process enables strength to be established
between the joined adherends.
Polyurethane adhesives are normally defined as those adhesives that contain a number of
urethane groups in the molecular backbone, regardless of the chemical composition of the
rest of the chain. Thus a typical urethane adhesive may contain urethane linkages, aliphatic
and aromatic hydrocarbons, esters, ethers, amides, ureas and allophanate groups. An
isocyanate group reacts with the hydroxyl groups of polyol to form the repeating urethane
linkage. Isocyanate reacts with water to form a urea linkage and a carbon dioxide as a
byproduct. Urethane adhesive have some advantages due to the following reasons:
1. They readily form hydrogen bonds to the substrates
2. They form covalent bonds with substrates that have active hydrogen
3. They effectively wet the surface of most substrates
4. Small molecular size allows them to permeate porous substrates
One of the primary mechanisms of bonding by urethane adhesive is believe to be through
isocyanate (-NCO) to the active hydrogen containing surfaces and the through polar group
(-NH and C=O). These polar groups are capable of forming strong chemical or physical
interactions with the polar surfaces owning to the functional group having active hydrogen.
Acceptance of polyurethane adhesive in a wide variety of different industrial uses (i.e.
sealant73, 74), automotive75), glue, etc.) can be attributed to the versatility of the urethane
polymer. This enables it to fulfill a number of important functions, such as providing comfort,
safety and structural strength to the various industrial parts as needed.
The purpose of this study is the investigation about the effect of the aggregation structure
of segmented polyurethane on adhesion properties. The segmented polyurethane were
synthesized by a prepolymer method76-78) and the adhesive joint between polyurethane
adhesive and substrate was made by hot melt adhesive79-82) and reactive hot melt adhesive83-85)
30

method. An attempt to control the morphology and adhesion between adhesive and adherend
was done by performing the different chemical crosslink density that is incorporated
trifunctional agent (1,1,1-trimethylol propane) into segmented polyurethane structure through
curing in different temperature, in different environmental (e.g. different relative humidity)
and transferring into different mold temperature. In addition, polyurethane adhesive was
performed with two types of substrates (aluminum and polypropylene) to examine the
adhesive strength and fracture behavior. Moreover, the surface roughness of aluminum and
corona treatment of polypropylene was controlled as follows:
- Aluminum substrate was immersed in 5% w/v hydrochloric acid for 60 min.
- Polypropylene film was treated by AC corona discharge under ambient conditions
for treatment time of 10 sec. The corona treatment using a high frequency corona
treater with an output voltage of about 10 kV. The distance between the grounded
sample and the stationary tip of the corona needle was 1 cm.
Thus, this study hopefully might develop the new application for diisocyanate-terminated
polyurethanes which have good adhesion properties without enormously loosing its
mechanical properties.
31

References 1. Saunders, J.H. and Frisch K.C., “Polyurethanes Chemistry and Technology”, John Wiley
and Sons, New York, 1979, p.1-2.
2. Woods, G., “The ICI Polyurethanes Book”, John Wiley and Sons, New York, 1987, p.6,
197-202.
3.
p. 65-66 (2007)
4. Saunders, J.H. and Frisch K.C., “Polyurethanes Chemistry and Technology”, John Wiley
and Sons, New York, 1979, p.2-3.
5. Yokoyama, K., “Advances in Urethane Science and Technology”, Vol. 6, Technomic
Publishing Co., Inc., USA, 1978, p.30.
6. Kojio, K., Nakamura, S. and Furukawa, M, Polymer, 45, 8147 (2004).
7. Eirich, F.R., “Science and Technology of Rubber”, Academic Press, Inc., 1978, p.1.
8. Seymour, R.B., “Introduction to Polymer Chemistry”, McGraw-Hill Kogakusha, Inc.,
1971, p. 326.
9. Flory, P.J., “Principles of Polymer Chemistry”, Cornell University press, Ithaca, New
York, 1953, p.458.
10. Nicolai, T., Prochazka, F. and Durand, D., Phys Rev Lett, 82, 863 (1999).
11. Proudmore, M., Ding, J.F., Mobbs, R.H., Yeates, S.G. and Colin, C.P., J Appl Polym Sci,
33, 1615 (2003).
12. Labana, S.S. and Dickie, R.A., “Characterization of Highly Cross-linked Polymers”, The
American Chemical Society, Washington, D.C., 1984, p.21-32.
13. Andrady, A.L. and Llorente, M.A., J Appl Polym Sci, 25, 195 (2003).
14. Decurtins, S. and Hourston, D.J., J Appl Polym Sci, 36, 365 (2003).
15. Okazaki, T., Furukawa, M. and Yokoyama, T., Polym J, 29 (7), 617 (1997).
16. Furukawa, M., Recent Res Devel in Macromol Res, 3, 89 (1998).
17. Born, L., Hespe, H., Crone, J. and Wolf, K.H., Colloid & Polymer Sci, 260 (9), 819
(1982).
18. Saunders, J.H. and Frisch K.C., “Polyurethanes Chemistry and Technology”, John Wiley
and Sons, New York, 1979, p.219-232.
19. Wang, L., “Chemical and Engineering News”, Vol. 84 (2), American Chemical Society,
2006, p.48.
32

20. Seymour, R.B., “Introduction to Polymer Chemistry”, McGraw-Hill Kogakusha, Inc.,
1971, p.328.
21. Masubuchi, T., “Study on Structure and Properties of Aliphatic Poly(carbonate) glycols
and their Polyurethane Elastomers”, Doctorate Thesis, Nagasaki University, Nagasaki,
2006, p.7-8.
22. Qian, H.F. and Song, X.Y., Dyes and Pigments, 74, 672 (2007).
23. Gonzalez, G.Y., Gonzalez, S. and Souto, R.M., Corros. Sci., 49, 3526 (2007).
24. Price, G.J., Lenz, E.J. and Ansell, C.W.G., Eur. Polym. J., 38, 1532 (2002).
25. Kojio, K, Fukumaru, T. and Furukawa, M., Macromolecules, 37(9), 3287 (2004).
26. Kwak, Y.S., Kim, E.Y., Yoo, B.H. and Kim, H.D., J Appl Polym Sci, 94, 1744 (2004).
27. Furukawa, M., Mitsui, Y., Fukumaru, T. and Kojio, K., Polymer, 46, 10817 (2005).
28. Wei, Y.Y., Luo, Y.W., Li, B.F. and Li, B.G., J Zhejiang Univ SCI, 5(8), 906 (2004).
29. Perez-Liminana, M.A., Aran-Ais, F., Torro-Palau, A.M., Orgiles-Barcelo, A.C. and
Martin-Martinez, J.M., Int J Adhes Adhes, 25, 507 (2005).
30. Rahman, M.M., Kim, E.Y., Kwon, J.Y., Yoo, H.J. and Kim, H.D., Int J Adhes Adhes, 28,
47 (2007).
31. Corcione, C.E., Prinari, P., Cannoletta, D., Mensitieri, G. and Maffezzoli, A., Int J Adhes
Adhes, 28, 92 (2008).
32. Boening, H.V., “Structure and Properties of Polymers”, Georg Thiene Publisher, Stuttgart,
1973, p.227.
33. Brewis, D.M., “Polymer Science”, North-Holland Publishing Company, 1972, 944.
34. Moon S.I. and Jang J., J Mater Sci, 34, 4219 (1999).
35. Allen K.W., Int J Adhes Adhes, 23, 87 (2003).
36. Allen K.W., Int J Adhes Adhes, 23, 89 (2003).
37. Dennis G.L. and Paul C., “Handbook of Adhesive Technology Pizzi, A”, Mittal K.L. ed.,
Marcel Dekker, New York, 1994, Chapter 24.
38. Krump H., Hudec I. and Luyt A.S., Int J Adhes Adhes, 25, 269 (2005).
39. Allen K.W., Int J Adhes Adhes, 23, 92 (2003).
40. Allen K.W., Int J Adhes Adhes, 23, 91(2003).
41. Krump H., Hudec I. and Luyt A.S., Int J Adhes Adhes, 25, 269 (2005).
42. Brewis, D.M., “Polymer Science”, North-Holland Publishing Company, 1972, 945.
43. Mark H.F., “Encyclopedia of Polymer Science and Technology (Vol. 1), 3rd ed.”, John
Wiley and Sons, Inc., New Jersey, 1976, p.220.
44. Brewis, D.M., “Polymer Science”, North-Holland Publishing Company, 1972, 938.
33

45. Allen K.W., Int J Adhes Adhes, 23, 92 (2003).
46. Okoli O.I., Compos Struct, 54, 299 (2001).
47. Srivastava V.K., Int J Adhes Adhes, 23, 59 (2003).
48. Burrow M.F., Yaniguchi Y., Nikaido T., Satoh M., Inai N., Tagami J. and Takatsu T., J.
Dent., 23 (1), 41 (1995).
49. Wong S.C., Baji A. and Gent A.N., Composites: Part A, 39, 579 (2008).
50. Brewis, D.M., “Polymer Science”, North-Holland Publishing Company, 1972, 942.
51. McGuiggan P.M., Chiche A. and Yarusso D.J., Int J Adhes Adhes, 28, 185 (2008).
52. Rhee K.Y. and Yang J.H., Comp Sci Technol, 63, 33 (2003).
53. Rushforth M.W., Bowen P., McAlpine E., Zhou X. and Thompson G.E., J. Mater.
Process. Technol., 153-154, 359 (2004).
54. Rosenkranz P., Humer K., Weber H.W., Pahr D.H. and Rammerstorfer F.G., Cryogenics,
41, 21 (2001).
55. Kontou, E., Spathis, G., Niaounakis, M. and Kefalas, V., Colloid Polym Sci, 268, 636
(1990).
56. Saunders, J.H. and Frisch K.C., “Polyurethanes Chemistry and Technology”, John Wiley
and Sons, New York, 1979, p.221.
57. Desai S.D., Patel J.V. and Sinha V.K., Int J Adhes Adhes, 23, 393 (2003).
58. Malucelli G., Priola A., Ferrero F., Quaglia A., Frigione M. and Car fagna C., Int J Adhes
Adhes, 25, 87 (2005).
59. Oertel G., “Polyurethane Handbook”, Macmillan Publishing Co., Inc., New York, 1985, p.
90-91, 178.
60. Wang S.C., Chen P.C., Yeh J.T., Chen K.N., Reactive and Functional Polymers, 67, 299
(2007).
61. Yeganeh H., Mehdizadeh M.R., Eur. Polym. J., 40, 1233 (2004).
62. Cui Y., Chen D., Wang X. and Tang X., In. J Adhes Adhes, 22, 317 (2002).
63. Park, Y. J. and Kim, H. J., In. J Adhes Adhes, 23, 383 (2003).
64. Somani, K. P., Kansara, S. S., Patel, N. K. and Rakshit, A. K., In. J Adhes Adhes, 23, 269
(2003).
65. O’Hare, L. A., Leadley, S. and Parbhoo, B., Surf. Interface Anal., 33, 335 (2002).
66. Xu, W. and Liu, X., Euro. Polym. J., 39, 199 (2003).
67. Kwon, O. J., Tang, S., Myung, S. W., Lu, N. and Choi, H. S., Surf. Coat. Technol., 192, 1
(2005).
68. Petrovic, Z.S. and Ferguson, J., Prog Polym Sci, 16, 695 (1991).
34

69. Petrovic, Z.S., Javini, I. and Divjakovic, V., J. Polym Sci, 36, 221 (1998).
70. Behdad, A., Mahmoud, K., Khosrow, K. and Ehsan, R.M., Prog Org Coat, 60, 99 (2007).
71. Sudaryanto, Takashi, N., Seiji, A. and Katsuhiko N., In. J Adhes Adhes, 21, 71 (2001).
72. Katsuhiko, N., Takashi, N., Seiji, A. and Sudaryanto, Int J Adhes Adhes, 16, 233 (1996).
73. Abbott, S.G., Brewis, D.M., Manley, N.E., Mathieson, I. and Oliver, N.E., Int J Adhes
Adhes, 23, 225 (2003).
74. Chew, M.Y.L. and Zhou, X., Polym Testing, 21, 187 (2002).
75. Malucelli, G., Priola, A., Ferrero, F. and Quaglia, A., Int J Adhes Adhes, 25, 87 (2005).
76. Furukawa, M., Hamada Y. and Kojio, K., J Polym Sci, 41, 2356 (2003).
77. Okazaki, T., Furukawa, M. and Yokoyama, T., Polym J, 29 (7), 617 (1997).
78. Albers, K., Jong, H.D. and Katzenmayer, S., “Technical Textiles”, Vol. 46, March 2003,
p. 32-33.
79. Shih, H.-H. and Hamed, G.R., J Appl Polym Sci, 63, 333 (1997).
80. Park, Y.J. and Kim, H.J., Int J Adhes Adhes, 23, 383 (2003).
81. Park, Y.J. Joo, H.S., Kim, H.J. and Lee, Y.K., Int J Adhes Adhes, 26, 571 (2006).
82. Cui, Y., Chen, D., Wang, X. and Tang, X., Int J Adhes Adhes, 22, 317 (2002).
83. Duffy, D.J., Heintz, A.M. Stidham, H.D., Hsu, S.L., Suen, W. and Paul, W.C., Int J Adhes
Adhes, 25, 39 (2005).
84. Comyn, J., Brady, F., Dust, R.A., Braham, M. and Haward, A., Int J Adhes Adhes, 18, 51
(1998).
85. Chattopadhyay, D.K., Prasad, P.S.R., Sreedhar, B. and Raju, K.V.S.N., Prog Org Coat,
54, 296 (2005).
35

Chapter 2 Effect of Curing Agent Ratio of Diol to Triol on Microaggregation Structure
and Adhesion Properties of Segmented Polyurethanes
2.1 Introduction
Segmented polyurethane elastomers (SPUs) are composed of hard segment domain and
soft segment matrix which separate into two microphases1). Hard segment domains play a
role of physical crosslinks in a soft segment matrix. The soft segment phase gives
extensibility to the polyurethane. The microphase-separated structure causes excellent
mechanical properties in bulk of the SPUs. Thus, the SPUs are used in various applications
such as daily life materials, industrial parts, elastomers and adhesives2, 3). In order to attain
excellent properties, many studies have been directed toward understanding the microphase
separation and its effect on the bulk properties 4-8).
The distribution of polar hard segment domains at the surface as well as the microphase-
separated structure is quite important when polyurethane is used as coating materials,
adhesives and so on. Okazaki et. al9) reported the effects of blend ratio of BD/TMP on
friction and abrasion properties of polyurethanes. When the content of BD is increased, phase
separation proceeds and spherulites are observed. SPU with higher BD blend ratio exhibited
lower friction coefficient. If the crosslinking agent such as TMP is incorporated into SPUs, it
would affect the interfacial structure. When polyurethane is used as an adhesive, the degree
of microphase separation and its distribution at the polyurethane adherend interface is more
important because they strongly affect interaction at the interface. Duffy et. al10) reported the
model of polyurethane based reactive hot melt adhesive using a ternary blend of polyether,
polyester and an acrylic. The incorporation of urethane groups tends to improve ternary blend
miscibility when increasing the molecular weight of polyether and polyesters. On the other
hand, an increase in the molecular weight of the prepolymer destabilizes the ternary blends.
However, the relationship between the aggregation of hard segment domains at the interface
and the adhesion properties of SPUs has not been well understood.
In this study, the chemically crosslinked SPUs was produced by different blend ratios of
BD/TMP and investigated the effect of the blend ratio on the microaggregation structure and
adhesion properties of SPUs.
36

2.2 Experimental
2.2.1 Materials
Poly(oxytetramethylene) glycol (PTMG) with the average molecular weight (Mn) of 2018
and 4,4’-diphenylmethane diisocyanate (MDI) were supplied from Nippon Polyurethane
Industry, Co., Ltd, Japan. 1,4-Butanediol (BD) and 1,1,1-trimethylol propane (TMP) (Wako
Chemical, Co., Ltd., Japan) were used as a curing agent. PTMG was dried with dried nitrogen
under reduced pressure. To remove water, BD was distilled prior to use in polymerization.
Toluene (Wako Chemical, Co., Ltd., Japan) was also distilled prior to use in swelling test.
Methylene iodide used in contact angle measurement was supplied from Wako Chemical, Co.,
Ltd., Japan. Ultra pure water for contact angle measurement was prepared with a Millipore
Simpli Lab-UV (Nippon Millipore, Japan). Figure 2.1 shows chemical structure of materials
for synthesis SPUs.
CH2CH2CH2CH2O ����HO ���� nHPoly(oxytetramethylene) glycol (PTMG Mn = 2018)
CH2 NCOOCN
4,4’-Diphenylmethane diisocyanate (MDI)
HO-CH2CH2CH2CH2-OH
1,4-Butanediol(BD)
H3C-CH2-C-CH2-OH
CH2-OH
CH2-OH
1,1,1-Trimethylol propane (TMP)
Curing AgentCuring Agent
DiisocyanateDiisocyanate
PolyolPolyolCH2CH2CH2CH2O ����HO ���� nHCH2CH2CH2CH2O ����HO ���� nH
Poly(oxytetramethylene) glycol (PTMG Mn = 2018)
CH2 NCOOCN CH2 NCOOCN
4,4’-Diphenylmethane diisocyanate (MDI)
HO-CH2CH2CH2CH2-OH
1,4-Butanediol(BD)
H3C-CH2-C-CH2-OH
CH2-OH
CH2-OHH3C-CH2-C-CH2-OH
CH2-OH
CH2-OH
1,1,1-Trimethylol propane (TMP)
Curing AgentCuring Agent
DiisocyanateDiisocyanate
PolyolPolyol
Figure 2.1. Chemical structures of all materials for synthesis SPUs.
37

2.2.2 Polymer synthesis
SPUs were synthesized using a prepolymer method. Synthetic scheme of the SPUs is
shown in Figure 2.2. The prepolymer was prepared from PTMG and MDI with a ratio of
[NCO]/[OH] = 3.30 at 70 oC for 6 h under a nitrogen atmosphere. The curing agents was
added to the prepolymers with NCO INDEX = [NCO]pre/[OH] = 1.05 and stirred for 5 min,
where [NCO]pre is the concentration of NCO groups in a prepolymer. The viscous product
was then poured into a mold constructed by a spacer of 0.5 mm thickness. The two aluminum
plates were heated at 130 oC prior to use. The sample was cured for 24 h at 100 oC under an
air atmosphere. SPUs with various blend ratios of BD/TMP were denoted as SPU-100/0,
SPU-90/10, SPU-75/25 and SPU-50/50.
Cure at 100 oC for 24 h
Segmented polyurethanes (SPUs)
+Diisocyanate Polyol
OCN ~ ~~ NCOR NH
C
=
O
O~ ~ ~ ~ ~~ ROC
=
O
NH
PrepolymerBD:TMP(100:0, 90:10, 75:25 and 50:50 wt%)
K = 3.30 Nitrogen atmosphere70 oC/ 6 h
NCO INDEX = 1.05
Casting
Demolding
Steel moldSteel mold
Cure at 100 oC for 24 h
Segmented polyurethanes (SPUs)
+Diisocyanate Polyol
OCN ~ ~~ NCOR NH
C
=
O
O~ ~ ~ ~ ~~ ROC
=
O
NH
PrepolymerBD:TMP(100:0, 90:10, 75:25 and 50:50 wt%)
K = 3.30 Nitrogen atmosphere70 oC/ 6 h
NCO INDEX = 1.05
Casting
Demolding
Steel moldSteel mold
Figure 2.2. Synthetic scheme of SPUs with different blend ratio of BD/TMP.
38

2.2.3 Characterization
2.2.3.1 Swelling measurement
Gel fraction (g) of the SPU was determined from the original weight and the weight of
dried sample after swollen to the equilibrium state in toluene at 60 oC as follows; g = Wb/W,
where Wb and W are the weight at which a sample is swollen and dried, and the original
weight, respectively. The degree of swelling of the SPUs was determined from the weight
before and after equilibrium swelling with toluene. The degree of swelling (q) was calculated
by equation (1) and (2).
Qq � 1 (1)
�
��
�
���
� �
pb
sba
dWdWW
Q/
/ (2)
where Q, Wa, ds and dp are the volume ratio of solvent in the swollen state to gel in the
unswollen state, the weight of a sample swollen to the equilibrium state, the density of
solvent and the density of a sample, respectively.
Crosslink density and molecular weight between crosslinking points were calculated from
the Flory-Rehner equation11-13).
�c
ppp
ppp
se MVVd
VVV
V1
2
1ln1
31
2
���
�
���
�
�
����
�� �
����
�� (3)
where �e is the crosslink density; Vs is the molar volume of the solvent (toluene: 1.068×10²
cm3/mol); Vp is the volume fraction of polyurethane in the swollen state, which is equal to Vp
= 1/(1+Q)12); � is the solvent interaction parameter (In this case, � = 0.5353); dp is the density
of the polyurethane; and Mc is the molecular weight between crosslinking points.
39

2.2.3.2 Macroscopic observation
Macroscopic structures were observed by polarized optical microscopy (POM;
Optiphotp2-Pol, Nikon Corporation, Japan) at room temperature. A sensitive color plate with
a wavelength of 530 nm was used for birefringence analysis.
2.2.3.3 Thermal analysis
Differential scanning calorimetry (DSC) measurements were performed to investigate the
thermal properties of the SPUs. Thermograms of the SPUs were recorded with DSC
(DSC8230, Rigaku Denki, Co., Ltd., Japan) at a heating rate of 10 oC/min from -140 to 250 oC under a nitrogen atmosphere.
2.2.3.4 Surface free energy measurements
Surface free energy were investigated using contact angle (�) measurements with water
and methylene iodide14, 15). Water and methylene iodide were used as probe liquid because it
did not interact with polyurethane. The contact angle of these liquids on the surface of SPUs
was measured with a Dropmaster 300 (Kyowa Interface Science Co., Ltd., Japan) using a
sessile drop method. The averaged contact angle was determined from at least ten different
locations for each SPUs. The surface free energy of the SPUs was calculated, according to
the extended Fowkes equation16-18). The surface free energy (�S) can be expressed as follows;
pS
dSS ��� � (4)
where �Sd is from the dispersion (nonpolar) component and �S
p represents the polar one.
During the equilibrium contact angle measurements for a liquid drop on an ideally smooth
and homogeneous solid surfaces, Owens and Wendt19), and Wu extended the Young’s
equation using geometric means20), as follow;
��
�
�
��
�
����
�
�
��
�
��
LV
pLp
SLV
dLd
S �
��
�
��� 22cos1 (5)
40

where subscripts L and S are the liquid and solid states, respectively. The superscripts d and p
refer to the dispersion force and polar force components, respectively.
2.2.3.5 T-peel strength
Testing specimens were prepared as follows; the aluminum plates were washed with
acetone and put in 5% w/v hydrochloric acid solution for 90 min at room temperature. They
were then washed with distilled water and dried at 40 oC for 2 hours. The press condition
were selected at 250 oC corresponding above melting temperature of the hard segment
domains under 0.5 MPa for 10 min, followed by slow cooling, and then kept for overnight
with the relative humidity of 40%. The adhesion joint of SPUs and two aluminum plates were
obtained by pressing in the dimension of 114×25 mm2 and the SPUs thickness was 0.5 mm.
T-peel strength of SPUs was measured using a tensile tester (RTE-1210, A&D Co., Ltd.,
Japan). The sample was peeled at a crosshead speed of 20 mm/min at room temperature. The
peel strength was obtained from the mean of three experiments.
2.2.3.6 T-peel failure behavior
To investigate the failure behavior of the SPU adhesive, the surface of the aluminum
plates were observed after T-peel testing with optical microscopy (OPTIPHPT2-POL, Nikon
Corporation, Japan).
2.3 Results and discussion
Table 2.1 shows structural parameter and properties of SPUs. The degree of swelling
increased with decreasing TMP content. Total crosslink density was calculated using Flory-
Rehner’s equation. Chemical crosslink density was determined stoichiometrically. The total
crosslink density and chemical crosslink density increased whereas physical crosslink density
decreased with an increase in TMP content. This result indicates that the formation of
physical crosslinking in SPUs was suppressed by the network structure in SPU chains.
41

Figure 2.3 shows DSC thermograms of the SPUs with various blend ratios of BD/TMP.
Glass transition temperature of the soft segment chains (Tg) elevated from –66.0 to –56.3 oC
with an increase in TMP content. Melting temperature of hard segment domains (Tm,H) of
SPU-100/0 was observed at 188.4 and 209.0 oC. Tms of SPU-90/10 and SPU-75/25 were
observed at 210.8 and 208.0 oC, respectively. It is noteworthy that no Tm was observed for
SPU-50/50. It is well known that increasing Tg of soft segment in SPUs means an increase in
miscibility of two components on account of the molecular interaction between soft and hard
segments. The change of microaggregation structure with different TMP content can be
explained as follows. For the lower TMP content, the hard segment possesses a linear
urethane chain, resulting in high crystallizability. On the other hand, for higher TMP content,
the content of linear hard segment chains was reduced and chemical crsosslinking points
increased. Thus, crystallizability of the hard segment is quite low. Therefore, the degree of
microphase separation of the SPU became weaker with increasing TMP content.
Table 2.1 Structural parameters and properties of SPUs with various blend ratio of BD/TMP.
Sample
Degree of swelling
in Toluene
Totalcrosslink
density(mol/cm3)×10-3
Molecular weight between
crosslinks(g/mol)×103
SPU-100/0 0.372.56 2.67
SPU-90/10 0.412.44 2.44
SPU-50/50 0.712.14 1.40
SPU-75/25 0.482.38 2.09
Chemicalcrosslink
density(mol/cm3)×10-3
0.00
0.10
0.49
0.24
Physicalcrosslink
density(mol/cm3)×10-3
0.37
0.31
0.22
0.24
Tg(oC)
-65.9
-64.1
-49.1
-52.5
Curing agent(wt%)
BD TMP
100 0
90 10
75 2550 50
42

Figure 2.3. DSC thermograms of the various SPUs measured at a heating rate of 10 oC min-1.
End
othe
rm
-100 250200100 1500 50-50Temperature / oC
-66.0oCSPU-100/0
-61.6oCSPU-90/10
-58.3oCSPU-75/25
-56.3oCSPU-50/50
188.4oC 209.0oC
210.8oC
208.0oC
End
othe
rm
-100 250200100 1500 50-50Temperature / oC
-66.0oCSPU-100/0
-61.6oCSPU-90/10
-58.3oCSPU-75/25
-56.3oCSPU-50/50
188.4oC 209.0oC
210.8oC
208.0oC
43

Figure 2.4 shows polarized optical micrographs of SPU with different blend ratios of
BD/TMP. The spherulite size of SPU-100/0, SPU-90/10, SPU-75/25 and SPU-50/50 were
25-35, 20-25, 10-20 and 8-10 �m, respectively. When the TMP blend ratio decreased, the
spherulite size increased. These spherulites are found to be negative spherulites; that is,
polymer chains oriented perpendicular to the radial direction. It is known that the spherulites
were composed of a small soft segment component and a lot of hard segment component9).
SPU with low chemical crosslinking had small negative spherulites with well-defined
Maltese cross. However, the structure of spherulites of SPU with high chemical crosslinking
turn into loose spherulites, so-called sheaf-like4, 21) . Thus, it seems reasonable to consider that
the chemical crosslinking points interrupt the aggregation of hard segments to form
spherulites.
(a) (b)
(c) (d)
35����m
35����m
35����m
35����m
(a) (b)
(c) (d)
(a) (b)
(c) (d)
35����m
35����m
35����m
35����m
Figure 2.4. Polarizing optical microscopic images of SPUs with various blend ratio of BD/TMP; (a) SPU-50/50, (b) SPU-75/25 (c) SPU-90/10 and (d) SPU-100/0.
44

The relationships between contact angle and TMP content is shown in Figure 2.5. The
contact angles of water and methylene iodide of all SPUs was found from 87.8 to 107.7o and
65.9 to 74.1o, respectively. SPU-100/0 had the highest wettability by water, i.e. smallest
contact angle, indicating the highest surface free energy. These results suggest that the
excellent intermolecular interaction between SPUs surface and water that is the high
hydrophilic component (polar component) on the surface of SPUs.
Figure 2.5. Relationships between contact angle and TMP content for SPUs.
TMP Content / wt%
Con
tact
ang
le /
deg
0 10 20 30 40 500
20
120140
40
100
6080
WaterMethylene iodide
TMP Content / wt%
Con
tact
ang
le /
deg
0 10 20 30 40 500
20
120140
40
100
6080
WaterMethylene iodide
45
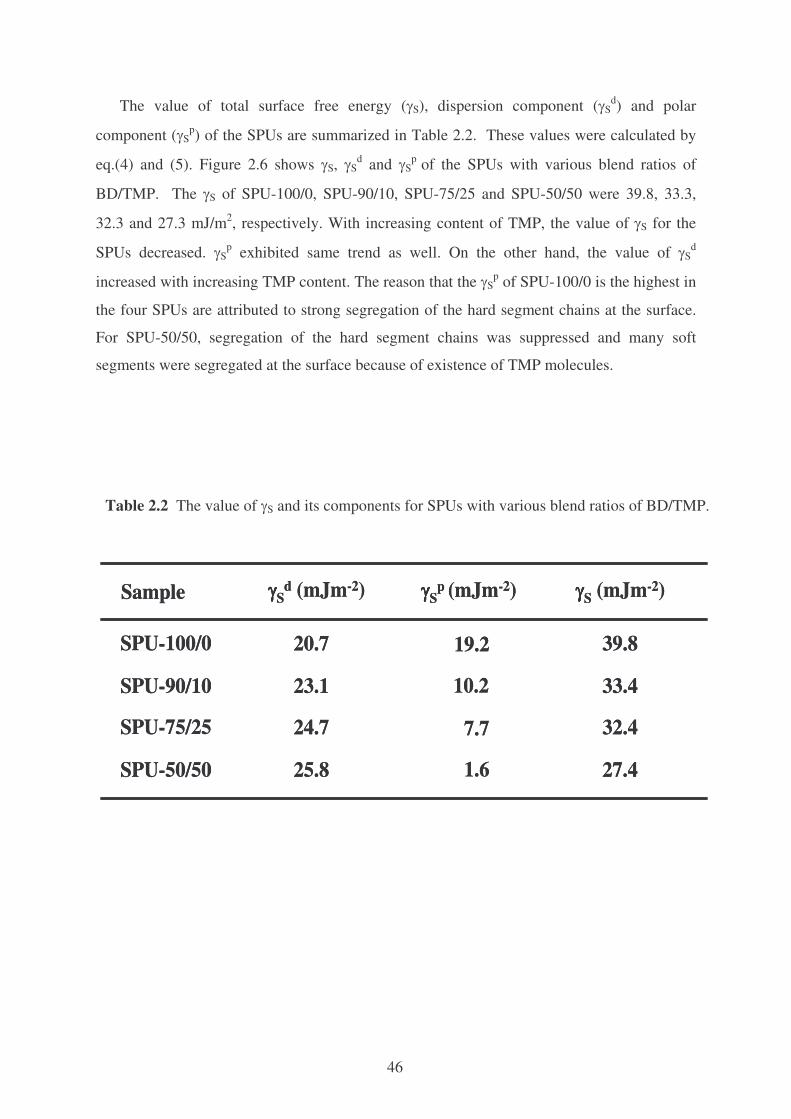
The value of total surface free energy (�S), dispersion component (�Sd) and polar
component (�Sp) of the SPUs are summarized in Table 2.2. These values were calculated by
eq.(4) and (5). Figure 2.6 shows �S, �Sd and �S
p of the SPUs with various blend ratios of
BD/TMP. The �S of SPU-100/0, SPU-90/10, SPU-75/25 and SPU-50/50 were 39.8, 33.3,
32.3 and 27.3 mJ/m2, respectively. With increasing content of TMP, the value of �S for the
SPUs decreased. �Sp exhibited same trend as well. On the other hand, the value of �S
d
increased with increasing TMP content. The reason that the �Sp of SPU-100/0 is the highest in
the four SPUs are attributed to strong segregation of the hard segment chains at the surface.
For SPU-50/50, segregation of the hard segment chains was suppressed and many soft
segments were segregated at the surface because of existence of TMP molecules.
Table 2.2 The value of �S and its components for SPUs with various blend ratios of BD/TMP.
Sample ����Sd (mJm-2) ����S
p (mJm-2) ����S (mJm-2)
SPU-100/0
SPU-90/10
20.7 19.2 39.8
23.1 10.2 33.4
SPU-75/25
SPU-50/50
24.7 7.7 32.4
25.8 1.6 27.4
Sample ����Sd (mJm-2) ����S
p (mJm-2) ����S (mJm-2)
SPU-100/0
SPU-90/10
20.7 19.2 39.8
23.1 10.2 33.4
SPU-75/25
SPU-50/50
24.7 7.7 32.4
25.8 1.6 27.4
46

Figure 2.6. Effect of BD/TMP blend ratio on surface free energy (in mJm-2) of SPUs.
�Sd ; surface free energy of the dispersion component.
�Sp ; surface free energy of the polar component.
100/0 90/10 75/25 50/50Blend ratio of BD/TMP / wt%
0
10
20
30
40
50
�� �� s/ m
Jm-2
����sd
����sp
100/0 90/10 75/25 50/50Blend ratio of BD/TMP / wt%
0
10
20
30
40
50
�� �� s/ m
Jm-2
����sd
����sp
����sd
����sp
47

Figure 2.7 shows T-peel strength of SPUs with different blend ratios of BD/TMP. To
understand the aggregated hard segment affect adhesive strength in SPUs in Figure 2.7, the
schematic model of the aggregated hard segment components at the SPUs/aluminum
interface was drawn in Figure 2.8. T-peel strength of SPUs decreased as the content of TMP
increased, namely decreased from 10.36 MPa of SPU-100/0 to 2.03 MPa of SPU-50/50. In
other words, the adhesive strength decreased with an increase in crosslink density. Since
SPU-100/0 and SPU-90/10 were pressed with aluminum substrates above melting
temperature of hard segment, the SPUs melt was spreaded properly on the surface of
substrates and they can adhere to aluminum surface after cooling. In this cooling process,
high surface free energy component, hard segment chains in a linear molecular structure,
segregates at the adhesive/aluminum interface to minimize the interfacial free energy. Thus,
the strong interaction between SPUs and aluminum surface can be attained. On the other
hand, opposite phenomena happened to SPU-50/50. For SPU-50/50, TMP suppresses the
formation of the well-ordered and crystallized hard segment domains and causes phase
mixing trend between soft and hard segment components. It seems that these phenomena
occurs even at the surface region of SPUs. Furthermore, there is no hard segment domain,
which can be melted by heating. Thus, peel strength of SPU-50/50 was the lowest of the all
SPUs. It seems reasonable to conclude from surface free energy that polar hard segment
component exists at the top surface of SPU with low TMP content, in contrast, both
disordered hard segment chains and soft segment component exist with high TMP content.
Figure 2.7. T-peel strength of SPUs with different blend ratios of BD/TMP.
100/0 90/10 75/25 50/5002
46
810
1214
10.36
7.64
2.60 2.03
T-p
eel s
tren
gth
/ MPa
Blend ratio of BD/TMP / wt%100/0 90/10 75/25 50/50
02
46
810
1214
10.36
7.64
2.60 2.03
T-p
eel s
tren
gth
/ MPa
Blend ratio of BD/TMP / wt%
48

To investigate directly the surface failure of the SPUs, we made optical microscopy
observations for the aluminum plate surface. Figure 2.9 shows optical microscopic images of
aluminum surface after T-peel testing for (a) SPU-100/0, (b) SPU-90/10, (c) SPU-75/25 and
(d) SPU-50/50. Three different failure modes were observed after T-peel test. First, the
cohesive failure was observed for SPU-100/0 and SPU-90/10. The high residue of SPU
adhesive was found in all aluminum surface area as shown in Figure 2.9(a) and (b). These
results clearly implies the strong interaction between SPU and aluminum plate surface, which
is caused from the lower chemical crosslink density and segregation of higher surface free
energy component. Second, the interfacial failure was observed for SPU-50/50. No residue of
SPU adhesive was almost observed on the aluminum substrate as shown in Figure 2.9(d).
These results indicate that the strong network structure in SPU chains was formed by
chemical crosslinking and the SPU does not interact with the aluminum surface due to a
phase mixing trend of soft and hard segment chains. That is, this fracture is attributed to poor
adhesion between SPU-50/50 and aluminum substrate. Finally, the cohesive-interfacial
failure was observed for SPU-75/25. The residue of SPU adhesive was found in almost area
of aluminum substrate and the surface of substrate cannot see clear as shown in Figure 2.9(c).
It can be suggested that the cohesive and interfacial failures were occurred simultaneously
when the moderate crosslink density contained in the SPU structure.
Figure 2.8. Schematic model of the aggregated hard segment components at the SPUs/aluminum interface.
Aluminum
AluminumAluminum
Aluminum
Low chemical crosslink density High chemical crosslink density
Aluminum
AluminumAluminum
Aluminum
Low chemical crosslink density High chemical crosslink density
49

To understand the failure behavior of SPUs in Figure 2.9, the schematic model of T-peel
fracture behavior of SPUs was drawn in Figure 2.10. Cohesive failure is fracture occurring
within the adhesive layer that is when the specimen was peeled, the adhesive was deformed
and the fracture was arisen within the adhesive layer. A typical fracture surface model of
cohesive failure is shown in Figure 2.9(a). Interfacial failure as represented in Figure 2.9(c) is
explained that when a specimen was peeled, the adhesive detached from the substrate and no
residue adhesive or very low residue adhesive on the aluminum substrate. Moreover,
cohesive failure and interfacial failure occurred simultaneously that is when a specimen was
peeled, some adhesive layer was fractured and there was a residue of partial adhesive on the
aluminum substrate. This is called cohesive-interfacial failure (Figure 2.9(b)).
(a) (b)
(c) (d)
AlModerate residue SPU
Al
Low residue SPU
High residue SPU
High residue SPU
400 ����m400 ����m
400 ����m400 ����m
(a) (b)
(c) (d)
AlModerate residue SPU
Al
Low residue SPU
High residue SPU
High residue SPU
400 ����m400 ����m
400 ����m400 ����m
Figure 2.9. Optical microscopic images of aluminium surface after T-peel testing for SPUs; (a) SPU-100/0, (b) SPU-90/10, (c) SPU-75/25 and (d) SPU-50/50.
50

2.4 Conclusion
Four kinds of PTMG-MDI-based SPUs were prepared by different blend ratios of BD/TMP
(BD/TMP = 100/0, 90/10, 75/25 and 50/50). In this study, it can be concluded as followed;
1. The total crosslink density and chemical crosslink density increased whereas the physical
crosslink density decreased with increasing blend ratio of TMP.
2. When increasing TMP blend ratio, the chemical crosslinking point interrupted the
aggregation of hard segments to form spherulites and the degree of microphase separation
of the SPUs became weaker.
3. The surface free energy, the water wettability and T-peel strength of the SPUs decreased
because of the polar hard segment component cannot segregate at the top surface of SPUs
with increasing TMP.
Figure 2.10. Schematic model of T-peel fracture behavior of SPUs; (a) cohesive failure (b) cohesive-interfacial failure (c) interfacial failure.
a) Cohesive failure mode [Fig. 2.9(a, b)]
AlAdhesive
b) Cohesive-Interfacial failure mode [Fig. 2.9c]
Al
c) Interfacial failure mode [Fig. 2.9d]
AlAdhesive
Adhesive
a) Cohesive failure mode [Fig. 2.9(a, b)]
AlAdhesive
b) Cohesive-Interfacial failure mode [Fig. 2.9c]
AlAl
c) Interfacial failure mode [Fig. 2.9d]
AlAlAdhesive
Adhesive
51

4. Three failure modes were observed after T-peel testing. That is, the cohesive failure, the
cohesive-interfacial failure and the interfacial failure observed for the SPU with low,
moderate and high TMP blend ratio, respectively. These were explained by the strong
network structure, which is formed by chemical crosslinking and the SPU does not
interact with aluminum surface due to a phase mixing trend of soft and hard segment
chains, thus this fracture led to the interfacial failure and the strong interaction between
SPU and aluminum plate surface led to the cohesive failure.
52

References
1. Buist J.M., Gudgeon H. “Advance in Polyurethane Technology”, John Wiley and Sons
Inc. Publishers, New York 1968, 104.
2. Petrovic Z. S., Javni I., Divjakovic V., J. Polym. Sci., Part B: Polym. Phys., 36, 221
(1998).
3. Nakamae K., Nishino T., Asaoka S., Sudaryanto., Int. J. Adhes. Adhes., 19, 345 (1999).
4. Furukawa M., Recent Res. Devel. in Macromol Res., 3, 89 (1998).
5. Okazaki T., Furukawa M., Yokoyama T., Polym. J., 29(7), 617 (1997).
6. Furukawa M., Hamada Y., Kojio K., J. Polym. Sci., Part B: Polym. Phys., 41, 2355
(2003).
7. Martin D. J., Meijs G. F., Renwick G. M., Gunatillake P. A., McCarthy S. J., J. Appl.
Polym. Sci., 60, 557 (1996).
8. Martin D. J., Meijs G. F., Gunatillake P. A., McCarthy S. J., Renwick G. M., J. Appl.
Polym. Sci., 64, 803 (1997).
9. Okazaki T., Yokoyama T., Furukawa M., Gomu kyoukaishi (J. Rubber Ind. Soc.,), 68,
417 (1995).
10. Duffy D.J., Heintz A.M., Stidham H.D., Hsu S.L. Suen W., Paul C.W., Int. J. Adhes.
Adhes., 25, 39 (2005).
11. Barlkanl M., Hepburn C., Iranian J. Polym. Sci. Techno., 1, 1 (1992).
12. Mythili C. V., Malar Retna A., Gopalakrishnan S., J. Appl. Polym. Sci., 98, 284 (2005).
13. Yeganeh H., Shamekhi M. A., J. Appl. Polym. Sci., 99, 1222 (2006).
14. Lugscheider E., Bobzin K., Moller M., Thin Solid Films, 355-356, 367 (1999).
15. Lugscheider E., Bobzin K., Surf. Coat Technol., 142-144, 755 (2001).
16. Park S. J., Jin J. S., J. Appl. Polym. Sci., 82, 775 (2001).
17. Takahashi A., Kita R., Kaibara M., J. Mater. Sci. Mater. Med., 13, 259 (2002).
18. Mochizuki A., Senshu K., Seita Y. Yamashita S., Koshizaki N., J. Polym. Sci., Part A:
Polym. Chem., 38, 1045 (2000).
19. Yarbrough J. C., Rolland J. P., DeSimone J. M., Callow M. E., Finlay J. A., Callow J. A.,
Macromolecules, 39(7), 2521 (2006).
20. Owens D. K., Wendt R. C., J. Appl. Polym. Sci., 13, 1741 (1969).
21. Mark H. F. and Gaylord N. G., “Encyclopedia of Polymer Science and Technology (Vol.
9), John Wiley and Sons, Inc., New Jersey, 1968, 243.
53

Chapter 3 Study of the Effect of Polymer Glycols on Mechanical and Adhesion
Properties of Polyurethanes.
3.1 Effect of Polymer Glycols on the Micro-aggregation Structure and Mechanical
Properties of Segmented Polyurethanes
3.1.1 Introduction
Polyurethane elastomers (PUEs) have excellent mechanical properties compared with
general-purpose elastomers. These characteristics are utilized in many kinds of industrial
products such as industrial parts, building materials, sport goods, medical fields and daily life
products. These properties are strongly dependent on chemical structures and super-structures
of PUEs. The super-structures of PUEs are varied with raw materials, recipes, preparation
conditions, molding condition, and so on. Therefore, control of morphology of PUEs is
required to obtain high performance PUEs1-4).
In recent years, investigation of multi-component polymers with graded micro-domain
structures has been conducted. Okinaka et al. 5-6) studied binary polymer mixtures undergoing
phase separation induced by a temperature gradient. Liu et al.7) designed the epoxy resin
(EP)/polyurethane (PU) functionally graded material by microwave irradiation and reported
that the temperature and thermal stress distribution decreased along the graded direction of
these functionally graded materials. Okazaki et al.8-10) designed polyether based PUE with
graded microdomain structures by using of mold with different temperatures. They found that
the mechanical properties were changed continuously with variation of micro-domain
structure at mold temperature of 130 oC. Furukawa et al.11) found that the higher BD content
and molecular weight of polymer glycol exhibited stronger phase separation on the
temperature gradient of FGPUEs. However, structures and mechanical properties of
functionally graded polyurethane elastomers have not been studied in spite of important
research to develop novel functional materials.
In this study, PUEs with graded micro-domain structures were prepared from various
polymer glycols using a mold with temperature gradient. The effect of polyether and
polyester glycols on the micro-aggregation structure and mechanical properties of the PUEs
were studied by DSC, polarizing optical microscopy, pulse NMR, micro-hardness test and
tensile test.
54

3.1.2 Polymer preparation
3.1.2.1 Materials
Poly(oxytetramethylene)glycol (PTMG: Mn = 2000, Nippon Polyurethane Ind., Co., Ltd.,
Japan), poly(ethylene adipate)glycol (PEA: Mn = 2000, Mitsui Takeda Chemical, Co., Ltd.,
Japan), and poly(hexamethylene adipate)glycol (PHA: Mn = 2000, Nippon Polyurethane Ind.,
Co., Ltd., Japan) were used as a polymer glycol. The polymer glycols were dried by bubbling
dried nitrogen gas under reduced pressure at 80 oC before preparing polyurethanes. 4,4-
Diphenylmethane diisocyanate (MDI, Nippon Polyurethane Ind., Co., Ltd., Japan) was used
as received after the determination of isocyanate content. 1,4-Butanediol (BD, Wako
Chemical, Co., Ltd., Japan) and 1,1,1-trimethylol propane (TMP, Wako Pure Chemical, Co.,
Ltd., Japan) as a curing agent were used by purification with vacuum distillation and
recystallization, respectively.
3.1.2.2 Polymer synthesis
The PUEs were prepared from each polymer glycol, MDI and a mixture of BD and TMP
as a curing agent by a prepolymer method. The blend ratio of curing agent (BD/TMP) was
weight ratio of 75/25. Synthetic scheme of the spherulite size graded polyurethane elastomers
is shown in Figure 3.1. The prepolymer was prepared from each polymer glycol and MDI
with a ratio of [NCO]/[OH] = 3.30 at 70 oC for 6 h under a nitrogen atmosphere. The curing
agents were added to the prepolymers with NCO INDEX = [NCO]pre/[OH] = 1.05 and stirred
for 3 min, where [NCO]pre is the concentration of NCO groups in the prepolymer. The
viscous product was then poured into a mold constructed with a spacer 2 mm thick. Two
aluminum plates were heated at 30 and 150 oC prior to use, respectively. When the casting
was initiated, the temperatures of low and high temperature mold plates transformed to 60
and 130 oC, respectively. The sample was cured for 1.5 hours at 130 oC. Then, a sheet of 2
mm thickness was demolded, and the sheet was post-cured at 110 oC for 24 hours under an
air atmosphere. PTMG based PUE, PEA based PUE and PHA based PUE were denoted as
PTMG-PUE, PEA-PUE and PHA-PUE, respectively.
55

K=[NCO]/[OH]=3.30 Nitrogen atmosphere 70 oC / 6 h
Polymer glycol (PTMG, PEA, PHA)
Diisocyanate(MDI)
Curing Agent BD/TMP=75/25 %wtNCO INDEX=1.05
30 oC
150 oC2 mm
CastingCure, 130 oC/ 1.5 h
Post-cure, 110 oC/ 24 h
FGPUEs
Heater
Prepolymer
K=[NCO]/[OH]=3.30 Nitrogen atmosphere 70 oC / 6 h
Polymer glycol (PTMG, PEA, PHA)
Diisocyanate(MDI)
Curing Agent BD/TMP=75/25 %wtNCO INDEX=1.05
30 oC
150 oC2 mm
CastingCure, 130 oC/ 1.5 h
Post-cure, 110 oC/ 24 h
FGPUEs
Heater
Prepolymer
Figure 3.1. Synthetic scheme of polyurethane elastomers with spherulite size
graded structure.
56

3.1.3 Characterization
3.1.3.1 Preparation of thin film using a microtome
The PUEs of 2 mm thickness was sliced up to five pieces (about 0.4 mm thickness) by a
microtome (Yamato Koki Co., Ltd., ROM-380 model, Japan). These obtained sheets are used
for following tests.
3.1.3.2 Density and swelling measurement
Density was measured by the weight of polyurethane in air and the weight of
polyurethane in water.
The gel fraction (g) of the PUEs was determined from the original weight and the weight
of the dried polyurethane after swelling to an equilibrium state in toluene and N,N-dimethyl
acetamide (DMA) at 60oC, using the following formula: g = Wb/W, where Wb is the weight
of the sample that was dried after equilibrium swelling, and W is the original weight. The
degree of swelling of the PUEs was determined from the weights before and after equilibrium
swelling with toluene and DMA. The degree of swelling (q) was calculated by equations (1)
and (2).
q = 1+Q (1)
�
��
�
���
� �
pb
sba
dWdWW
Q/
/ (2)
where Q, Wa, ds and dp are the volume ratio of solvent in the swollen state to gel in the
unswollen state, the weight of a sample swollen to the equilibrium state, the density of the
solvent and the density of sample, respectively.
3.1.3.3 Macroscopic observation
The spherulite structures were observed by polarized optical microscopy (POM,
Optiphotp2-Pol, Nikon, Co., Ltd., Japan). A sensitive color plate with wavelength of 530 nm
was used for birefringence analysis.
57

3.1.3.4 Thermal analysis
Differential scanning calorimetry (DSC) measurement was performed to determine the
thermal behavior of PUEs. Thermograms of PUEs were recorded with DSC (DSC8230HT,
Rigaku Denki, Co., Ltd., Japan) at heating rate of 10oC/min from -140 oC to 250 oC under a
nitrogen atmosphere.
3.1.3.5 Functional group analysis
Fourier transfer infrared (FT-IR) spectra of PUEs were recorded by FI-IR spectrometer
(Bio-Rad FTS 3000, Nippon Bio-Rad Laboratories, Inc., Japan) in the ATR mode at the
wavelength range between 4000 and 500 cm-1. The sensitivity, the resolution and the number
of scanning were 1, 4 cm-1 and 32 times, respectively.
3.1.3.6 Pulsed nuclear magnetic resonance measurement of molecular mobility
Pulsed Nuclear magnetic resonance spectrometer (NMR; JNM-MU25AH model, JEOL,
Co., Ltd., Japan) in the solid echo mode at 25 oC was used to determine the mobility of hard
segment or soft segment chains. Samples were cut into small pieces and densely added into
the sample glass tube.
3.1.3.7 Hardness analysis
The changes of micro-hardness due to the temperature gradient were measured by micro-
hardness test. This test was performed for each 100 µm of cross section from one surface to
the other surface by using micro-durometer (Asker, MD-1 model, Japan) based on JIS K
6253. The micro-hardness was determined as the International Rubber Hardness (IRHD).
3.1.3.8 Tensile strength measurement
Tensile test was performed by means of the Instron type tensile tester (RTE-1210, A&D
Co., Ltd., Japan) at ambient temperature. Specimen size was 60.0 mm × 5.0 mm × 0.4 mm.
The initial length and elongation rate were set to be 30 mm and 10 mm/min, respectively.
58

3.1.4 Results and discussion
Table 3.1 shows the density, gel fraction and degree of swelling for the lower, higher
temperature side and the middle part of PTMG-, PEA- and PHA-PUEs. The samples
obtaining from the lower, middle, and higher temperature sides of all PUEs were abbreviated
as LTS, Middlle and HTS, respectively. Density of each position of PTMG-, PEA- and PHA-
PUEs was quite similar about 1.05×10³ kg/m3, 1.21×10³ kg/m3 and 1.15×10³ kg/m3,
respectively. These results clearly suggest that the density of each series of the PUEs was
dependent on soft segment structure but independent on molding temperature. The gel
fractions in both solvents of all three PUEs were over 97 %. The gel fraction of the all UEs at
low temperature side (LTS) was smaller than that at high temperature side (HTS). The degree
of swelling in toluene and DMA differed with structure of the polymer glycols, and that of all
PUEs slightly increased from LT to HT. The results suggest that the morphology at each
position of each PUEs are different and the morphology of PUEs with the different polymer
glycols are also different
59

Table 3.1 The density, gel fraction and degree of swelling for the lower and higher temperature side and the middle part of PTMG-, PEA- and PHA-PUEs.
PUE
PTMG-PUE
PEA-PUE
PHA-PUE
Position
Middle
LTS
HTS
Middle
LTS
HTS
Middle
LTS
HTS
Density
1.06
1.05
1.05
1.21
1.20
1.21
1.15
1.15
1.15
Gel Fraction (%)
98.5
98.3
98.3
98.0
97.2
98.5
98.1
98.3
98.9
(kg/m3)×103 Toluene DMA
97.9
97.7
98.8
98.9
98.6
99.2
96.2
95.3
97.6
Degree of Swelling
1.62
1.54
1.79
1.31
1.32
1.38
1.81
1.81
1.84
Toluene DMA
2.41
2.39
2.58
5.14
5.02
5.22
4.20
4.18
4.34
60

Figure 3.2 shows polarizing micrographs taken at each part in PTMG-, PEA- and PHA-
PUEs. The PUEs in contact at low temperature mold plate had many small pherulites. On the
other hand, the opposite phenomena occurred with PUEs in contact at high temperature mold
plate. Additionally, the spherulite size of PTMG-PUE was higher than that of PEA- and
PHA-PUEs. These spherulites were the negative spherulites; that is, the molecule oriented
perpendicular to the radial direction. It is known that the spherulites are composed of a small
amount of soft segment component and a lot of hard segment component9). Thus, it can be
suggested that the carbonyl group in polyester polyol interrupt the aggregation of the hard
segments to form spherulites.
Figure 3.2. Polarized optical microscopic images at each part in (a) PTMG-PUE, (b) PEA-PUE and (c) PHA-PUE.
LTS Middle HTS
10 µm 10 µm 10 µm
10 µm 10 µm 10 µm
10 µm 10 µm 10 µm
(a)
(b)
(c)
LTS Middle HTS
10 µm 10 µm 10 µm 10 µm 10 µm 10 µm
10 µm 10 µm 10 µm 10 µm 10 µm 10 µm
10 µm 10 µm 10 µm 10 µm 10 µm 10 µm
(a)
(b)
(c)
61

The effects of molding temperature on the spherulite diameter and the number of
spherulite were shown in Figure 3.3 and 3.4, respectively. All PUEs in contact with lower
temperature mold had large number of spherulites. These spherulites grew to 12.6 � 16.3 µm
diameter in PTMG-PUE, to 8.4 � 15.6 µm diameter in PEA-PUE and to 10.4 � 16.0 µm
diameter in PHA-PUEs from the LTS toward the HTS. The number of spherulites decreased
and the size increased gradually toward the HTS. The spherulite size of PEA- and PHA-based
PUEs (polyester based PUEs) was smaller than those of PTMG based PUE (polyether based
PUE) at each position. The continuous changes of spherulite size depending on the
temperature gradient and type of polymer glycols were explained as follows. The spherulites
grew outwards from the nucleation points but could not grow out radially in all direction
either contacted at low temperature or when the spherulites met each other. Generally, the
growth rate is extremely temperature sensitive and control by the nucleation. The nucleus
growth in the HTS was very slow, resulting in the formation of larger spherulite. The growth
of spherulite in the polyester based PUE was lower than polyether based PUE because the
spherulites of polyester based PUE composed of a lot of hard segment components and a
small amount of soft segment components. Moreover, the effect of carbonyl in ester group of
polyester based PUEs can be induced the hydrogen bonding between hard and hard segments
and also hard and soft segments of other chain. In contrast, the hydrogen bonding of
polyether based PUE are mainly formed between hard and hard segments, but slightly formed
between hard and soft segments. It is conceivable that the polyester chains had higher
molecular interaction than that of in polyether chains. Thus, the hard segments domain
components for spherulite growth in the polyester based PUEs was less than that in polyether
based PUEs.
62

Figure 3.3. Relationship between diameter of spherulite and molding temperature of PTMG-, PEA- and PHA-PUEs. PTMG-PUE, PEA-PUE, PHA-PUE
0
5
10
15
20
60 90 120Mold temperature / oC
Dia
met
er /
µm
0
5
10
15
20
60 90 120Mold temperature / oC
Dia
met
er /
µm
63

60 90 1200
20
40
60
80
100
120
Mold temperature / oC
Num
ber
of sp
heru
lites
/ cm
2
60 90 1200
20
40
60
80
100
120
Mold temperature / oC
Num
ber
of sp
heru
lites
/ cm
2
Figure 3.4. Relationship between number of spherulites and molding temperature of PTMG-, PEA- and PHA-PUEs. PTMG-PUE, PEA-PUE, PHA-PUE
64

Figure 3.5 shows DSC thermograms of each part of PTMG-, PEA- and PHA-PUEs. The
glass transition temperature (Tg) of PTMG-, PHA- and PEA-PUEs increased from -55.3 oC, -
33.8 oC and -19.0 oC at the LTS to -48.6 oC, -32.8 oC and -17.8 oC at the HTS, respectively.
The endothermic peaks due to the melting of hard segment domains (Tm,H) of all samples
were about 169-195 oC. The trend of Tg of all PUEs increased and melting point of hard
domains decreased from the LTS to the HTS. The results can be concluded that the
microphase separation became weaker toward the HTS. In addition, the crystallization due to
the rearrangement and melting of the crystals of soft segments were not observed in these
PUEs. Tg of soft segment of PTMG-PUE was the lowest and those of PEA-PUE was the
highest at the same positions. Tm,H of PTMG-PUE exhibited higher than that of PEA- and
PHA-PUEs at every positions, resulting in high crystallizability in PTMG-PUE. On the other
hand, in PEA- and PHA-PUEs, the intermolecular interaction was very strong. Thus,
crystallizability of the hard segment is quite low. Therefore, the degree of microphase
separation of polyester based PUE was weaker than that of polyether based PUE. In case of
polyester based PUEs, the ester group along the chain of polyester induced force to hold the
chains. Hence, the PHA-PUE with long methylene chain showed the greater microphase
separation than the PEA-PUE with short methylene chain.
65

Figure 3.5. DSC thermograms at each position of (a) PTMG-PUE, (b) PHA-PUE and (c) PEA-PUE.
-100 -50 0 50 100 150 200 250
Temperature / oC
-33.8
-33.7
-32.8
169.8
169.5
170.9
LTS
HTS
Middle
End
othe
rm
(a) (b) (c)
-100 -50 0 50 100 150 200 250
Temperature / oC
End
othe
rm
LTS
HTS
Middle
-55.3
-50.0
-48.6
180.0
193.5
195.0182.3
182.0
-100 -50 0 50 100 150 200 250
Temperature/oC
-19.0
-18.6
-17.8
182.4
181.8
180.1
End
othe
rm
LTS
HTS
Middle
-100 -50 0 50 100 150 200 250
Temperature / oC
-33.8
-33.7
-32.8
169.8
169.5
170.9
LTS
HTS
Middle
End
othe
rm
-100 -50 0 50 100 150 200 250
Temperature / oC
-33.8
-33.7
-32.8
169.8
169.5
170.9
LTS
HTS
Middle
End
othe
rm
(a) (b) (c)
-100 -50 0 50 100 150 200 250
Temperature / oC
End
othe
rm
LTS
HTS
Middle
-55.3
-50.0
-48.6
180.0
193.5
195.0182.3
182.0
-100 -50 0 50 100 150 200 250
Temperature / oC
End
othe
rm
LTS
HTS
Middle
-55.3
-50.0
-48.6
180.0
193.5
195.0182.3
182.0
-100 -50 0 50 100 150 200 250
Temperature / oC
End
othe
rm
LTS
HTS
Middle
-55.3
-50.0
-48.6
180.0
193.5
195.0182.3
182.0
-100 -50 0 50 100 150 200 250
Temperature/oC
-19.0
-18.6
-17.8
182.4
181.8
180.1
End
othe
rm
LTS
HTS
Middle
-100 -50 0 50 100 150 200 250
Temperature/oC
-19.0
-18.6
-17.8
182.4
181.8
180.1
End
othe
rm
LTS
HTS
Middle
-100 -50 0 50 100 150 200 250
Temperature/oC
-19.0
-18.6
-17.8
182.4
181.8
180.1
End
othe
rm
LTS
HTS
Middle
66

Figure 3.6 shows FT-IR spectra at the LTS, HTS and the middle part of PTMG-, PEA-
and PHA-PUEs. In the PTMG-PUE, the peaks of �C=Ofree and �C=Obond of urethane group
occured at 1731 cm-1 and 1703 cm-1, respectively. The peak of �N-Hbond shifted to low wave
number from LTS to HTS. The �C=Obond intensity was higher than that of �C=Ofree at LTS
and the middle part, but the trend of intensity peaks at the HTS was opposite with the LTS.
These results demonstrate that the hydrogen bonding mainly occurred between the NH-group
and carbonyl group of urethane linkages at the LTS and the middle part. This bonding
exhibited strong cohesive force and tended to agglomerate between hard segments in the
structure of PUEs. The microphase mixing was progressed at the HTS of the PUE. In case of
polyester based PUEs, the intensity of �C=Ofree showed at 1730 cm-1 for the PEA-PUE and at
1728 cm-1 for the PHA-PUE. The �C=Obond peak of PEA- and PHA-PUEs showed at 1708
cm-1 and 1704 cm-1, respectively. It seems that the hydrogen bonding is occurred both
between both carbonyl group of urethane and ester groups and NH-groups.
67

Figure 3.6. FT-IR spectra at each part of at each part of (a) PTMG-PUE, (b) PEA-PUE and (c) PHA-PUE.
Wave number / cm-1
3000
Abs
orba
nce
3800 3400
0.01
LTS
����NHbond
HTS
M
1800 16501750 1700
0.01
LTS
����C=Ofree
����C=OH-bond
HTS
M
Wave number / cm-1
Abs
orba
nce
(a)
Wave number / cm-1Wave number / cm-13000
Abs
orba
nce
3800 3400
0.01
LTS����NHbond
HTS
M
1800 16501750 1700
0.01
LTS
����C=Ofree
����C=OH-bond
HTS
M
Abs
orba
nce
(b)
3000
Abs
orba
nce
3800 3400
0.01
LTS����NHbond
HTS
M
Wave number / cm-1
(c)
Wave number / cm-11800 16501750 1700
0.01
LTS
����C=Ofree
����C=OH-bond
HTSM
Abs
orba
nce
Wave number / cm-1
3000
Abs
orba
nce
3800 3400
0.01
LTS
����NHbond
HTS
M
1800 16501750 1700
0.01
LTS
����C=Ofree
����C=OH-bond
HTS
M
Wave number / cm-1
Abs
orba
nce
(a)
Wave number / cm-1
3000
Abs
orba
nce
3800 3400
0.01
LTS
����NHbond
HTS
M
1800 16501750 1700
0.01
LTS
����C=Ofree
����C=OH-bond
HTS
M
Wave number / cm-1
Abs
orba
nce
(a)
Wave number / cm-1Wave number / cm-13000
Abs
orba
nce
3800 3400
0.01
LTS����NHbond
HTS
M
1800 16501750 1700
0.01
LTS
����C=Ofree
����C=OH-bond
HTS
M
Abs
orba
nce
(b)
Wave number / cm-1Wave number / cm-13000
Abs
orba
nce
3800 3400
0.01
LTS����NHbond
HTS
M
1800 16501750 1700
0.01
LTS
����C=Ofree
����C=OH-bond
HTS
M
Abs
orba
nce
(b)
3000
Abs
orba
nce
3800 3400
0.01
LTS����NHbond
HTS
M
Wave number / cm-1
(c)
Wave number / cm-11800 16501750 1700
0.01
LTS
����C=Ofree
����C=OH-bond
HTSM
Abs
orba
nce
3000
Abs
orba
nce
3800 3400
0.01
LTS����NHbond
HTS
M
Wave number / cm-1
(c)
Wave number / cm-11800 16501750 1700
0.01
LTS
����C=Ofree
����C=OH-bond
HTSM
Abs
orba
nce
Wave number / cm-11800 16501750 1700
0.01
LTS
����C=Ofree
����C=OH-bond
HTSM
Abs
orba
nce
68

Stress-strain curves of the PUEs with different positions exhibited similar curves for each
polymer glycols series in Figure 3.7. Table 3.2 shows Young’s modulus, tensile strength and
strain at break of all PUEs. Young’s modulus, tensile strength and strain at break of all PUEs
series at the LTS were higher than that of the HTS. These tendency was rapidly increased in
polyester based PUE. Therefore, the polyester based PUE exhibited almost similar tendency
at every position. This result indicates that the crystallization was occurred in the polyester
series when the strain was increased but not found in the polyether series.
Table 3.2. The Young’s modulus, tensile strength and strain at break of PTMG-, PEA- and PHA-PUEs at the lower temperature side (LTS) and the higher temperature side (HTS).
PUE
PTMG-PUE
PEA-PUE
PHA-PUE
Position
LTS
HTS
LTS
HTS
LTS
HTS
Young’s modulus(MPa)
Tensile Strength(MPa) Strain at Break
1.11
1.03
1.15
1.13
1.28
1.00
8.32
6.89
18.46
17.99
32.03
23.28
2.06
1.74
5.19
3.68
4.04
3.32
PUE
PTMG-PUE
PEA-PUE
PHA-PUE
Position
LTS
HTS
LTS
HTS
LTS
HTS
Young’s modulus(MPa)
Tensile Strength(MPa) Strain at Break
1.11
1.03
1.15
1.13
1.28
1.00
8.32
6.89
18.46
17.99
32.03
23.28
2.06
1.74
5.19
3.68
4.04
3.32
69

Figure 3.7. Stress-strain curves at each part of (a) PTMG-PUE, (b) PEA-PUE and (c) PHA-PUE.
0 2 4 605
1015
20253035
LTSHTS
Strain
Stre
ss /
MPa
(a)
0 2 4 605
101520253035
LTSHTS
StrainSt
ress
/ M
Pa
(b)
0 2 4 605
101520253035
LTSHTS
Stre
ss /
MPa
Strain(c)
0 2 4 605
1015
20253035
LTSHTS
Strain
Stre
ss /
MPa
(a)
0 2 4 605
101520253035
LTSHTS
0 2 4 605
101520253035
LTSHTS
StrainSt
ress
/ M
Pa
(b)
0 2 4 605
101520253035
LTSHTS
0 2 4 605
101520253035
LTSHTS
Stre
ss /
MPa
Strain(c)
70

Microhardness at every 100 µm depth of specimens of 2 mm thick of PTMG-, PEA- and
PHA-PUEs are shown in Figure 3.8. Microhardness of the PTMG-PUE significantly
increased from 74 at the LTS to 94 at the HTS. Interestingly, the microhardness of PEA-PUE
slightly increased from the LTS toward the HTS. In addition, PHA-PUE was also exhibited in
the same trend with PEA-PUE. Difference of microhardness between the LTS and the HTS
was respectively 7 in PEA-PUE and 9 in PHA-PUE. The temperature gradient dependence of
micro-hardness for PHA-PUE had identical tendency as PEA-PUEs. The microhardness of
polyether based PUE and polyester based PUE exhibited dissimilar tendency, that is, the
microhardness of polyether based PUE had a big different between the LTS and the HTS. On
the other hand, polyester based PUEs was slightly different between the LTS and the HTS.
These results can be suggested that the temperature gradient can be strongly affected on the
microhardness of PTMG-PUE because the viscosity in polyether based PUE was very low
compared with PEA- and PHA-PUEs.
0 0.5 1.0 1.5 2.060
70
80
100
90
Depth / mm
Mic
ro-h
ardn
ess /
IRH
D
LTS HTS
0 0.5 1.0 1.5 2.060
70
80
100
90
Depth / mm
Mic
ro-h
ardn
ess /
IRH
D
LTS HTS
Figure 3.8. Temperature gradient dependence of micro-hardness for PTMG-, PEA- and PHA-PUEs from the LTS to the HTS. PTMG-PUE, PHA-PUE, PEA-PUE
71

The spin-spin relaxation times (T2) and fraction of each segment at each positions of
PTMG-, PEA- and PHA-PUEs are shown in Table 3.3. Every spin was slightly different field
due to the same measurement temperature, that is, room temperature. The spin-spin
relaxation times of soft segment matrix (T2L) exhibited from 312 to 314 �S in PTMG-PUE,
from 150 to 156 �S in PEA-PUE and from 157 to 170 �S in PHA-PUE. In addition, the spin-
spin relaxation times of hard segment domains (T2S) of PTMG-, PEA- and PHA-PUEs
exhibited from 36-38��S, 34-36��S and 26-29��S, respectively. T2L and T2S of all three PUEs
similarly decreased with increasing mold temperature. The segment of PUEs in contact low
temperature mold plate showed easy relaxation by the phase separation. In the case of PUEs
in contact high temperature mold plate, the strong intermolecular interaction can be found
resulting in microphase mixing. Thus, the mobility of PUEs chain in contact high
temperature mold plate was more difficult than that of PUEs in contact low temperature mold
plate. These results mean that the relaxation time was dependent on molding temperature.
The spin-spin relaxation time (T2) of PTMG-PUE showed the highest one while T2 of PHA-
and PEA-PUEs were the lower and lowest, respectively. This result indicates that the strong
intermolecular interaction due to the carbonyl group of polyester polyol was suppressed the
chain mobility of polyester based PUEs. Moreover, the chain mobility of PEA-PUE was
more difficult than that of PHA-PUE because the short methylene chain length in PEA can be
induced the strong intermolecular interaction in PUE compared to long methylene chain
length in PHA.
72

3.1.5 Conclusion
Spherulite size graded polyurethane elastomers were successfully prepared by using mold
with different temperature of each plate. In this study, it can be concluded as followed;
1. Microphase separation and the large number of spherulites were observed in the LTS of
spherulite size graded PUEs. The number and diameter of spherulites decreased and
gradually increased toward the HTS. The number of spherulite and the spherulite sizes of
polyester based PUE higher and smaller than that of polyether based PUE.
Table 3.3 The spin-spin relaxation times (T2) and hydrogen fraction of each segment at the lower temperature side (LTS), higher temperature side (HTS) and the middle part of PTMG-, PEA- and PHA-PUEs.
PUE
PTMG-PUE
PEA-PUE
PHA-PUE
Position T2L (µS)*1 T2S (µS)*2
Soft segment Hard segment
Middle
LTS
HTS
Middle
LTS
HTS
Middle
LTS
HTS
313
314
312
156
157
150
164
170
157
33
38
36
35
36
34
29
28
26
*1T2L: Long T2 *2T2S: Short T2
PUE
PTMG-PUE
PEA-PUE
PHA-PUE
Position T2L (µS)*1 T2S (µS)*2
Soft segment Hard segment
Middle
LTS
HTS
Middle
LTS
HTS
Middle
LTS
HTS
313
314
312
156
157
150
164
170
157
33
38
36
35
36
34
29
28
26
*1T2L: Long T2 *2T2S: Short T2
73

2. Polyether based PUE exhibited stronger microphase separation than that of polyester
based PUE. Microphase separation of long methylene chain length polyester based PUE
was stronger than that of short methylene chain length polyester based PUE.
3. The spherulite size graded polyether based PUE had large graded mechanical properties
from LTS to HTS, while the polyester based PUE had slight graded mechanical properties.
4. The important knowledge was found to develop novel functionally graded polyurethane
elastomers in this study.
74

References
1. D. J. Martin, G. F. Meijs, G. M. Renwick, P. A. Gunatillake, and S. J. McCarthy, J. Appl.
Polym. Sci., 60, 557 (1996).
2. Z. S. Petrovic, I. Javni and V. Divjakovic, J. Polym. Sci., 36, 221 (1998).
3. Encyclopedia of Polymer Science and Technology, vol. 11, John Wiley & Sons, Inc.,
New York, 1969.
4. M. Furukawa, Recent Res. Devel. In Macromol. Res., 3, 89 (1998).
5. J. Okinaka and Q. Tran-Cong, Physica D, 84, 23(1995).
6. Q. Tran-Cong, H. Nakano, J. Okinaka, and R. Kawakubo, Polymer, 35, 1242 (1994)
7. X. Q. Liu, Y. S. Wang and J. H. Zhu, J. Appl.. Polym. Sci., 94, 994 (2004).
8. T. Okazaki, M. Furukawa, and T. Yokoyama, Jpn. J. Polym.Sci. Technol., 52, 53, 184
(1996).
9. T. Okazaki, M. Furukawa, and T. Yokoyama, J. Soc. Rubber Ind. Jpn., 68, 417 (1995).
10. T. Okazaki, M. Furukawa, and T. Yokoyama, Polym. J., 29(7), 617 (1997).
11. M. Furukawa, Y. Hamada, and K. Kojio, J. Polym. Sci., Polym. Phys, 41, 2355 (2003).
75

3.2 Effect of Polymer Glycols on the Microphase-separated Structure and Adhesion
Properties of Segmented Polyurethanes with Corona Treated Polypropylene Film.
3.2.1 Introduction
Segmented polyurethanes (SPUs) are widely used in the field of coating and adhesives due
to their high reactivity, high flexibility in formulation and application technologies,
mechanical and adhesion properties. The super-structures of SPUs are varied with raw
materials, recipes, preparation conditions, molding condition, and so on. Therefore, control of
morphology of SPUs is required to obtain high performance SPUs1-4). Moreover, for adhesive
field, the problem owning to the low surface energy of plastic substrates such as
polypropylene (PP) is encountered in industrial applications where adhesion to plastic
substrate is required. Generally, the presence of polar groups and the morphology of the film
surface play a very important role for obtaining a good adhesion5). However, PP substrates
have limitations to their adhesion properties due to their non-polar nature and low surface
tension. One of the techniques used to modify surface is the treatment of corona discharge of
the polymer surface. The corona discharge is an electric discharge between two electrodes
obtained under atmospheric pressure from a high voltage molecule (air) and dissociates some
of them. These charged active species may react with polymer molecules that are also
activated and may occur breaking of molecular bonds on the surface and addition of polar
oxygen atoms. The functional groups incorporated onto the surface have been identified as
hydroxyl [-C-OH], peroxy [-C-O-O-], carbonyl [-C=O], ester [-C(C=O)-O-], carboxylic acid
[-(C=O)-OH] and carbonate [-O(C=O)-O-]6). It is commonly assumed that surface oxidation
during corona treatment is via a free radical process and the following reactions are proposed
to account the PP surface oxidation (scheme 3.1)7). Therefore, the corona discharge is used
frequently to treat polymers prior to adhesive bonding, and is the most widely used method
for pre-treating polypropylene7) and polyethylene substrate8).
76

In recent years, the development of polyurethane adhesive with various substrates has been
conducted. Xu et al.9) improved the hydrophilic properties of polyester fabric by corona
discharge irradiation at different voltages and reported that dye-uptake ratio and dyeing speed
was improved after the treatment. Castell et al.10) improved adhesion and wettability of PP
using photografted method. Different benzophenone-type photoinitiators were photografted
onto PP. They reported that the surface energy of the grafted surfaces of samples increased
depending on the type of acrylate used. Malucelli et al.11) studied the surface properties of
cure PU resin and of the different substrates such as PP, aluminum and blend of
polyphenylene oxide with polyamide 6.
In this study, the effect of polyether- and polyester polyols on microphase-separated
structure and on adhesion properties of SPU pressed with corona treated PP substrate was
evaluated using swelling, differential scanning calorimetry (DSC), polarized optical
microscopy (POM), T-peel testing, single lap shear testing, contact angle measurement and
optical microscopy.
Scheme 3.1 Surface oxidation during corona treatment of polypropylene (PP)7).
CH2 CH
CH3
CH2 C
CH3
�h����
CH2 C
OO�
CH3
O2(fast)
R�
H�
(fast)CH2 C
OOH
CH3
CH2 C
OOR
CH3
CH2 CH
CH3
CH2 C
CH3
�h����
CH2 C
OO�
CH3
O2(fast)
R�
H�
(fast)CH2 C
OOH
CH3
CH2 C
OOR
CH3
77

3.2.2 Experimental
3.2.2.1 Materials
Poly(oxytetramethylene) glycol (PTMG: Mn = 2018) as a polyether polyol and
poly(butylene adipate) glycol (PBA: Mn = 1975) as a polyester polyol and 4,4’-
diphenylmethane diisocyanate (MDI) were supplied from Nippon Polyurethane Industry, Co.,
Ltd, Japan. 1,4-butanediol (BD) (Wako Chemical, Co., Ltd., Japan) was used as a chain
extender. PTMG and PBA were dried with dried nitrogen under reduced pressure. To remove
water, BD was distilled prior to use in polymerization. Toluene (Wako Chemical, Co., Ltd.,
Japan) was also distilled prior to use in swelling test. Methylene iodide used in contact angle
measurement was supplied from Wako Chemical, Co., Ltd., Japan. Ultra pure water for
contact angle measurement was prepared with a Millipore Simpli Lab-UV (Nippon Millipore,
Japan). Figure 3.9 shows chemical structure of materials for SPUs.
HO (CH2)4 O C
O
(CH2)4 CO
O
(CH2)4 O H[ ]n
Polymer glycol
HO (CH2)4 O H]n[
Poly(butylene adipate) glycol (PBA: Mn = 1975)
Poly(oxytetramethylene) glycol (PTMG: Mn = 2018)
4,4’-Diphenylmethane diisocyanate (MDI)
CH2 NCOOCN
Diisocyanate
Chain extender
HO-CH2CH2CH2CH2-OH
1,4-Butanediol (BD)
HO (CH2)4 O C
O
(CH2)4 CO
O
(CH2)4 O H[ ]nHO (CH2)4 O C
O
(CH2)4 CO
O
(CH2)4 O H[ ]n
Polymer glycol
HO (CH2)4 O H]n[HO (CH2)4 O H]n[
Poly(butylene adipate) glycol (PBA: Mn = 1975)
Poly(oxytetramethylene) glycol (PTMG: Mn = 2018)
4,4’-Diphenylmethane diisocyanate (MDI)
CH2 NCOOCN CH2 NCOOCN
Diisocyanate
Chain extender
HO-CH2CH2CH2CH2-OH
1,4-Butanediol (BD)
Figure 3.9. Chemical structure of materials for SPU.
78

3.2.2.2 SPUs synthesis and adhesion of PP
Fig. 3.10 shows the synthetic scheme of segmented polyurethanes (SPUs). The SPUs was
prepared from polymer glycol, 4,4-diphenylmethane diisocyanate (MDI) and 1,4-butanediol
(BD) as a chain extender by a prepolymer method. Polymer glycols used were
poly(oxytetramethylene) glycol (PTMG: Mn = 2018) and poly(butylenes adipate) glycol
(PBA: Mn = 1975). Prepolymer was prepared at 70 oC for 6-8 hours under a nitrogen
atmosphere (K = 3.30). The prepolymer and chain extender were well mixed for 3 min. Then
the viscous product was poured onto treated PP. After that the viscous product was cured at
100 oC for 24 hours under air atmosphere.
Figure 3.10. Synthetic scheme of SPU with various polymer glycols (PTMG and PBA).
Pour onto treated PP substrate
Cure at 100 oC for 24 h
PTMG-SPU, PBA-SPU
Corona treated PP
Corona treated PP
Viscous PU
+ MDI
OCN ~ ~~ NCOR NH
C
=
O
O~ ~ ~ ~ ~~ ROC=
O
NH
Prepolymer
BD
K = 3.30 N2 atmosphere, 70 oC/ 6-8 h
NCO index = 1.05
PTMG or PBA
Pour onto treated PP substrate
Cure at 100 oC for 24 h
PTMG-SPU, PBA-SPU
Corona treated PP
Corona treated PP
Viscous PU
+ MDI
OCN ~ ~~ NCOR NH
C
=
O
O~ ~ ~ ~ ~~ ROC=
O
NH
Prepolymer
BD
K = 3.30 N2 atmosphere, 70 oC/ 6-8 h
NCO index = 1.05
PTMG or PBA
79

3.2.2.3 Surface modification of polypropylene (PP)
In many plastic industries, the problems of low surface free energy of plastic films often
are encountered in industrial applications where adhesion to plastic films is required. Corona
discharge treatment (CDT) is a surface modification technique. CDT is used frequently to
treat polymers prior to adhesive bonding, lamination to other films and other coating
applications. CDT is the most commonly used method for pre-treating PP6-7). It consists of
atmospheric plasma in air, obtained by a dielectric barrier discharge between high voltage
electrodes and the surface of the film to be treated. CDT is based on an electrical discharge
in air which activates nitrogen and oxygen producing electrons, metal stable species, ions,
radicals, photons and ozone. As a result, the film surface is activated by ions and photons to
give carbon radicals. These radicals react with the surrounded gaseous species, leading to the
formation of mainly oxygen based functional groups, such as alcohol, ether, ketone, acid or
ester (figure 3.11). In this result, one can observe the increase of surface energy due to the
grafting of these polar groups and, to some extent, an improvement of the adhesion
characteristics of the treated surface12).
In this study, PP films were treated by corona discharge (Kasuga Denki Co., Ltd., PS-
601c model). The PP samples were cut into 100×25 mm2 and 152×25 mm2 for single lap
shear test and T-peel test, respectively. The samples were exposed to AC corona discharge
under ambient conditions for treatment times of 10 seconds and output voltage of 10kV.
PP film PP film
Corona discharge
OHO O O O
OH
Air
Treated PP filmPP film PP film
Corona discharge
OHO O O O
OH
Air
Treated PP film
Figure 3.11. Corona discharge for polypropylene (PP) film.
80

3.2.2.4 Characterization
Swelling measurement, macroscopic observation, thermal analysis, surface free energy
measurement, T-peel strength and T-peel fracture behavior were used as the same conditions,
equations and methods with chapter 2. Single lap shear strength was performed as below;
The adhesion properties analysis were done using Instron tensile tester (RTE-1210, A&D
Co., Ltd., Japan). The adhesive joint between SPU and two PP sheets were obtained by
pressing in the dimension of 12.5×25 mm2. The sample was tested at a crosshead speed of 5
mm/min at room temperature. The single lap shear strength was obtained from the average of
three experiments.
3.2.3 Results and discussion
Table 3.4 shows properties of PTMG-SPU and PBA-SPU. Density of PTMG- and PBA-
SPUs was 1.07 and 1.18 g/cm3, respectively. These results clearly suggest that density of
SPU was dependent on soft segment structure. Gel fraction in toluene exhibited more than
99% in both SPUs. It seems that polymerization reaction was quantitatively proceeded.
Crosslink density was calculated using Flory-Rehner’s equation and determined
stoichiometrically. In case of PTMG-SPU, the crosslink density was largely low whereas the
degree of swelling was high. On the other hand, the crosslink density and degree of swelling
of PBA-SPU exhibited high and low, respectively. This result indicates that the crosslinking
can be induced by carbonyl group in PBA polyol better than that ether group in PTMG polyol.
81

Figure 3.12 shows DSC thermograms of PBA-SPU and PTMG-SPU. The glass transition
temperature (Tg) of PBA- and PTMG-SPUs exhibited at -39.6 oC and -69.7 oC, respectively.
The melting temperature of soft segment (Tm,S) was observed at 48.1 oC of PBA-SPU and
-3.9 oC of PTMG-SPU. The melting temperature of hard segment (Tm,H) of PBA-SPU and
PTMG-SPU exhibited 191.0 oC and 175.8 oC, respectively. Tg, Tm,S and Tm,H of PBA-SPU
was higher than that of PTMG-SPU. This result indicates that the microphase separation of
the polyether based SPU (PTMG-SPU) was stronger than that of polyester based SPU (PBA-
SPU).
Table 3.4 Properties of PTMG-SPU and PBA-SPU.
Sample
Density dp
(g/cm3)
Degree of swelling
in Toluene
Crosslink density
(mol/cm3)×10-3
Molecular weight between
crosslinks(g/mol)×102
PTMG-SPU 1.07 1.181.89 8.47
PBA-SPU 1.18 5.031.33 1.99
Gelfraction
(%)
99.5
99.1
Sample
Density dp
(g/cm3)
Degree of swelling
in Toluene
Crosslink density
(mol/cm3)×10-3
Molecular weight between
crosslinks(g/mol)×102
PTMG-SPU 1.07 1.181.89 8.47
PBA-SPU 1.18 5.031.33 1.99
Gelfraction
(%)
99.5
99.1
82

-100 -50 0 50 100 150 200 250
Temperature / oC
End
othe
rm
-69.7 oC
-3.9 oC
-39.6oC
175.8oC
191.0oC48.1oC
PTMG-SPU
PBA-SPU
-100 -50 0 50 100 150 200 250
Temperature / oC
End
othe
rm
-69.7 oC
-3.9 oC
-39.6oC
175.8oC
191.0oC48.1oC
PTMG-SPU
PBA-SPU
Figure 3.12. DSC thermograms of various polymer glycols based SPUs.
83

Figure 3.13 shows polarizing micrographs of SPUs. PBA-SPU had many smaller
spherulite than that of PTMG-SPU. The spherulites were composed of a lot of hard segment
components and a small amount of soft segment components. For polyester based SPU
(PBA-SPU), the hydrogen bonding was not only occurred between hard segment components
but also occurred from carbonyl group (C=O) of soft segment components. In case of
polyether based SPU (PTMG-SPU), the hydrogen bond was mostly occurred between hard
segment components (hydrogen bond between N-H group and C=O group of urethane
linkages) and slightly formed from ether groups of soft segment components. These results
indicate that the C=O groups in polyester soft segments was suppressed the hydrogen bond in
urethane linkages. The spherulite growth in PBA-SPU was lower than that of PTMG-SPU.
Thus, the small spherulite was found in PBA-SPU compared with PTMG-SPU.
PTMG-SPU
PBA-SPU
20 µm
20 µm
20 µm
20 µm
PTMG-SPU
PBA-SPU
20 µm20 µm
20 µm20 µm
20 µm20 µm
20 µm20 µm
Figure 3.13. Polarized optical microscopic images of different polymer glycols based SPUs.
84

Figure 3.14 shows the relationships between contact angle and polymer glycols. The
value of total surface free energy (�S) and its components for SPUs with various polymer
glycols, in addition the surface free energy of untreated PP substrate and corona treated PP
substrate were shown in Table 3.5. The contact angle of water exhibited 84 degree in PBA-
SPU and 91.9 degree in PTMG-SPU. The contact angle of water of PBA-SPU was lower than
that of PTMG-SPU, indicates the good wetting was occurred in PBA-SPU compared to
PTMG-SPU. Additionally, the contact angle of methylene iodide exhibited 65 degree in
PBA-SPU and 76.8 degree in PTMG-SPU. It can also be seen that the values for the contact
angle of methylene iodide obtained for interfacial SPU surfaces fall in polyether based SPU,
that is, polyester based SPU (PBA-SPU) > polyether based SPU (PTMG-SPU). These results
can be suggested that in the case of polyester based SPU, the strong intermolecular
interaction between SPUs surface and water, namely the high hydrophilic component on the
surface of SPU. The increasing of hydrophilic component (polar component) in SPU might
be due to the diffusion of hard segment and the carbonyl group in polyester polyol on the
surface of this SPU. In the case of polyether based SPU (PTMG-SPU), the amount of polar
component on the top surface of SPU was decreased. It is noteworthy that the change of
polymer glycols are primarily improved the wettability and adhesion properties of SPU. The
surface free energy was also calculated by using the measured values of contact angles,
according to an extended equation (4) and (5). The �S of PP film showed the extremely high
value when the corona discharge treatment time was used, namely the �S of corona treated PP
and untreated PP exhibited 101.1 and 28.6 mJ/m2, respectively. These results mean that the
corona discharge treatment can be improved the hydrophilic component in PP. The �S of
PBA-SPU and PTMG-SPU has been determined to be in the value of 46.5 and 35.3 mJ/m2.
The value of �S, �Sd and �S
p for PBA-SPU was higher than that of PTMG-SPU. Thus, the polar
component was mostly decreased in PTMG-SPU. These results might be due to the carbonyl
group of PBA has an effected to the polar component on the surface of SPU. Certainly, the �S
was dependent on the aggregation of hard segment in SPU chain and the type of polar
component in polymer glycol.
85

Figure 3.14. Relationships between contact angle and different polymer glycols based SPUs.
Table 3.5 Surface free energy, the dispersion component and the polar component of different polymer glycols based SPUs.
0
20
40
60
80
100
120
Untreated PP
Treated PP
PBA-SPU PTMG-SPU
H2O
CH2I2
Con
tact
ang
le /
deg
0
20
40
60
80
100
120
Untreated PP
Treated PP
PBA-SPU PTMG-SPU
H2O
CH2I2
0
20
40
60
80
100
120
Untreated PP
Treated PP
PBA-SPU PTMG-SPU
H2O
CH2I2
H2O
CH2I2
H2O
CH2I2
Con
tact
ang
le /
deg
Sample ����Sd (mJm-2) ����S
p (mJm-2) ����S (mJm-2)
Untreated PP
Corona treated PP
27.1 1.5 28.6
25.4 75.7 101.1
PBA-SPU
PTMG-SPU
25.8 20.7 46.5
19.3 16.1 35.3
Sample ����Sd (mJm-2) ����S
p (mJm-2) ����S (mJm-2)
Untreated PP
Corona treated PP
27.1 1.5 28.6
25.4 75.7 101.1
PBA-SPU
PTMG-SPU
25.8 20.7 46.5
19.3 16.1 35.3
86

Figure 3.15 shows T-peel strength and single lap shear strength of SPUs with different
polymer glycols. T-peel strength and single lap shear strength of PBA-SPU were higher than
that of PTMG-SPU. T-peel strength of PBA- and PTMG-SPUs exhibited 2.01 and 1.23 MPa,
respectively. In addition, single lap shear strength of SPUs exhibited in same trend of T-peel
strength, namely PBA- and PTMG-SPUs exhibited 12.19 and 7.36 MPa, respectively. In both
cases, PBA-SPU showed higher adhesive strength than PTMG-SPU. These results suggest
that the carbonyl group in polyester polyol (PBA) chain can be induced the strong interaction
between SPU adhesive and corona treated PP substrate compared with the ether group in
polyether polyol (PTMG). Thus, the polymer glycols and corona discharge treatment for non-
polar substrate such as PP strongly affect polyurethane adhesives.
T-peelSingle lap shear
PBA-SPU
PTMG-SPU
0
2
4
6
8
10
12
14
16
Adh
esiv
e st
reng
th /
MPa
2.011.23
12.19
7.36
T-peelSingle lap shear
PBA-SPU
PTMG-SPU
PBA-SPU
PTMG-SPU
0
2
4
6
8
10
12
14
16
Adh
esiv
e st
reng
th /
MPa
2.011.23
12.19
7.36
Figure 3.15. Effect of polymer glycol on T-peel strength and single lap shear strength (in MPa) of SPUs.
87

3.2.4 Conclusion
Two types of SPUs were prepared using two different polymer glycols and non-polar
substrate was treated by corona discharge treatment. This study can be concluded as followed;
1. Crosslinking can be induced by carbonyl group in PBA polyol better than that ether
group in PTMG polyol.
2. The microphase separation of the polyether based SPU was stronger than that of
polyester based SPU due to the strong intermolecular interaction in polyester based
SPU, that is the hydrogen bonding was largely occurred from carbonyl group (C=O)
of polyester based SPU compared with the ether group (-O-) of polyether based SPU.
3. The surface free energy, water wettability, single lap shear strength and T-peel
strength of polyester based SPU exhibited high values because the increasing of
hydrophilic component (polar component) on the SPU surface compared with
polyether based SPU.
88

References
1. Martin D. J., Meijs G. F., Renwick G. M., Gunatillake P. A., and McCarthy S. J., J. Appl.
Polym. Sci., 60, 557 (1996).
2. Petrovic Z. S., Javni I. and Divjakovic V., J. Polym. Sci., 36, 221 (1998).
3. Encyclopedia of Polymer Science and Technology, vol. 11, John Wiley & Sons, Inc.,
New York, 1969.
4. Furukawa M., Recent Res. Devel. In Macromol. Res., 3, 89 (1998).
5. Owens D. K. and Wendt R. C., J. Appl. Polym. Sci., 13, 1741 (1969).
6. O’Hare L. A., Leadley S. and Parbhoo B., Surf. Interface Anal., 33, 335 (2002).
7. Sellin N. and Campos J. S. C., Materials Research, 6(2), 163 (2003).
8. Oosterom R., Ahmed T. J., Poulis J. A. and Bersee H. E. N., Med. Eng, Phys., 28(4), 323
(2005).
9. Xu W. and Liu X., Euro. Polym. J., 39, 199 (2003).
10. Castell P., Wouters M., de With G., Fischer H. and Huijs F., J. Appl. Polym. Sci., 92,
2341 (2004).
11. Malucelli G., Priola A., Ferrero F., Quaglia A., Frigione M. and Carfagna C., Int. J. Adhes.
Adhes., 25, 87 (2005).
12. Villermet A., Cocolios P., Rames-Langlade G., Coeuret F., Gelot J.L., Prinz E. and
Forster F., Surf. Coat. Technol., 174-175, 899 (2003).
89

Chapter 4 The Influence of Curing Temperature on Microaggregation Structure and
Adhesion Properties of Segmented Polyurethanes
4.1 Introduction
Segment polyurethane elastomers (SPUs) is one of block copolymers, which consists of soft
segment formed with polymer glycol and hard segment done with diisocyanate and curing
agent. These SPUs can be separated into two microstructures1). Hard domains play the role of
physical crosslinks and act as filler in the soft matrix, whereas the soft phase gives
extensibility to the polyurethane. The two microphase structure reveals excellent mechanical
properties in the bulk properties of SPU, which brings SPU to be used in various ways such
as daily life materials, elastomers and adhesives2, 3). The amounts of academic studies have
been directed toward understanding the scope of microphase separation and its effect to the
bulk properties4-8). In fact, hard segment domain is not only effects on microphase separation
in bulk, but also on the surface properties owning to the distribution of polar hard segment
domains. The microphase separation is quite important for adhesive and coating materials. In
addition, the amount of crosslinks should lead to a structural change in SPU surface as the
hard segment structure, thus it also changes in the adhesion properties of SPU. Several
methods have also been applied to modify the surface as well as the interfacial properties of
SPU such as additional nanosilicas9), primers10). The arrangement of the SPU chain such as
linear or crosslink is considered to be the most useful method to improve the mechanical and
adhesion properties simultaneously. This method is interesting due to the preparation of these
SPU has the advantage of special additives and devices are not required and their properties
can easily be controlled by changes in the starting materials, preparation condition, and so on.
Thus, it would be interesting to examine the effect of the arrangement of SPU structure on the
surface structure and properties.
In this study, we controlled the SPU using different curing temperature and investigated
the effect of curing temperature on the microaggregation structure and adhesion properties of
SPUs. The crosslink density and the molecular weight between crosslinking pouints were
measured by swelling. The microphase structure of SPUs was examined by the differential
scanning calorimetry (DSC). Contact angle measurement, surface free energy and T-peel
strength measurement were performed to study the adhesion properties of SPU to aluminum.
Finally, the T-peel fracture behavior of SPU surface was observed by optical microscopy.
90

4.2 Experimental
4.2.1 Materials
Poly(oxytetramethylene)glycol (PTMG) with the average molecular weight (Mn) of 2018
and 4,4-diphenylmethane diisocyanate (MDI) were supplied by Nippon Polyurethane
Industry, Japan. 1,4-Butanediol (BD) (Wako Chemicals Co., Ltd., Japan) were used as a
chain extender for segmented polyurethanes. PTMG was dried with dried nitrogen under
reduced pressure and BD was distilled prior to use. Toluene (Wako Chemicals Co., Ltd.,
Japan) was also distilled prior to use in swelling test. Methylene iodide which is used in
contact angle measurement was supplied by Wako Chemicals Co., Ltd., Japan. Figure 4.1
shows the chemical structures of materials for synthesis of PTMG-MDI based segmented
polyurethanes (SPUs).
CH2CH2CH2CH2O ����HO ���� nH
Polyol: Poly(oxytetramethylene) glycol (PTMG Mn = 2018)
CH2 NCOOCN
Diisocyanate: 4,4’-diphenylmethane diisocyanate (MDI)
HO-CH2CH2CH2CH2-OH
Chain extender: 1,4-Butanediol (BD)
CH2CH2CH2CH2O ����HO ���� nHCH2CH2CH2CH2O ����HO ���� nH
Polyol: Poly(oxytetramethylene) glycol (PTMG Mn = 2018)
CH2 NCOOCN CH2 NCOOCN
Diisocyanate: 4,4’-diphenylmethane diisocyanate (MDI)
HO-CH2CH2CH2CH2-OH
Chain extender: 1,4-Butanediol (BD)
Figure 4.1. Chemical structures of used materials for prepare PTMG-MDI based SPUs.
91

4.2.2 Polymer synthesis
SPUs were synthesized using the prepolymer technique. PTMG and MDI with a ratio of
[NCO]/[OH] = 3.30 at 70 oC for 6 hours under a nitrogen atmosphere. The chain extender
(BD) was added to the prepolymers with NCO index = [NCO]pre/[OH] = 1.05 and stirred for
3 min. [NCO]pre is the concentration of NCO groups in a prepolymer. The viscous product
was then poured onto aluminium (Al) substrate and pressed with other Al plate by clip (0.2
mm in thickness). After that, the sample was cured for 24 hours at 50, 75, 100 and 125 oC
under an air atmosphere. Synthetic scheme of the SPUs are shown in Figure 4.2. SPU with
different curing temperatures was denoted as SPU-50, SPU-75, SPU-100 and SPU-125.
Pour onto Al-treated substrate
Cure at 50, 75, 100, 125 oC for 24 h
SPU-50, SPU-75, SPU-100, SPU-125
Aluminum
Aluminum
Viscous PU
+MDI
OCN ~ ~~ NCOR NH
C
=
O
O~ ~ ~ ~ ~~ ROC
=
O
NH
Prepolymer
OCN ~ ~ ~NCO~ ~
BD
K = 3.30 N2 atmosphere70 oC/ 6 h
NCO index = 1.05
PTMGHO~ ~ ~ OH~ ~
Pour onto Al-treated substrate
Cure at 50, 75, 100, 125 oC for 24 h
SPU-50, SPU-75, SPU-100, SPU-125
Aluminum
Aluminum
Viscous PU
+MDI
OCN ~ ~~ NCOR NH
C
=
O
O~ ~ ~ ~ ~~ ROC
=
O
NH
Prepolymer
OCN ~ ~ ~NCO~ ~
BD
K = 3.30 N2 atmosphere70 oC/ 6 h
NCO index = 1.05
PTMGHO~ ~ ~ OH~ ~
Figure 4.2. Synthetic scheme of SPUs with various curing temperature.
92

4.2.3 Characterization
Swelling measurement, macroscopic observation, thermal analysis, surface free energy
measurement, T-peel strength and T-peel fracture behavior were used as the same condition,
equation and method with chapter 2.
4.3 Results and discussion
Table 4.1 shows structural parameters and properties of SPUs at various curing
temperature. The gel fractions in toluene exhibited more than 99% in all prepared SPUs.
These results demonstrate that the polymerization reaction of SPUs was quantitatively
proceeding. The degree of swelling of SPU-50, SPU-75, SPU-100 and SPU-125 with toluene
was 2.40, 2.36, 2.13 and 2.06, respectively. Noteworthy, the degree of swelling of SPU-50
showed the highest value. This result might be suggested that SPU-50 was quite closed to
linear. Crosslink density was calculated using Flory-Rehner’s equation. With increasing
curing temperature, crosslink density increased from 4.74×10⁻⁴ to 8.18×10⁻⁴ mol/cm3. The
tendency of the crosslink density corresponded well to that of the degree of swelling. The
results revealed that the increasing of curing temperature can be induced the crosslinking in
the SPUs structure.
93

Figure 4.3 shows DSC thermograms of SPUs and Figure 4.4 shows the model of SPUs
structure at the lower and higher curing temperature. Glass transition temperature (Tg) of soft
segment chains of all SPUs were observed from -67.3 to -62.0 oC, and slightly shifted to the
higher temperature side when increasing curing temperature. The melting temperature of hard
segment (Tm,H) of SPU-50 and SPU-75 were observed at 143.7 and 153.8 oC, respectively. In
addition, SPU-100 and SPU-125 were observed at the higher temperature side compared to
the others that is observed within 180-210 oC. Moreover, with increasing curing temperature,
the melting temperature of soft segment (Tm,S) was disappeared. It is supposed that the hard
segments was not aggregated, thus the SPU chains were closed to linear chain structure at the
lower curing temperature (Figure 4.4a). On the other hand, at the higher curing temperature,
the hard segments were aggregated to form physical crosslinking. Thus, the strong
intermolecular interaction between hard segments in SPUs chain can be observed as a result
of high crosslinking density (Figure 4.4b).
Table 4.1 Structural parameters and properties of SPUs with various curing temperatures.
Sample
Degree of swelling
in Toluene
Crosslink density
(mol/cm3)×10-4
Molecular weight between crosslinks
(g/mol)×103
SPU-50 4.742.40 2.11
SPU-75 5.002.36 2.00
SPU-125 8.182.06 1.22
SPU-100 7.412.13 1.35
Gelfraction
(%)
100.0
99.5
99.8
99.8
Tg(oC)
-67.3
-66.2
-62.0
-65.7
Tm(oC)
143.7
153.8
180.3, 209.8
189.7, 210.0
94

Figure 4.3. DSC thermograms of various SPUs measured at 10 oC min-1; (1) SPU-50, (2) SPU-75, (3) SPU-100 and (4) SPU-125.
Temperature / oC
End
othe
rm
-100 250200100 1500 50-50
-66.2oC
-65.7oC
-62.0oC
-67.3oC
11.4oC
11.9oC
10.1oC
153.8oC
143.7oC
210.0oC189.7oC
209.8oC180.3oC
(1)
(2)
(3)
(4)
Temperature / oC
End
othe
rm
-100 250200100 1500 50-50
-66.2oC
-65.7oC
-62.0oC
-67.3oC
11.4oC
11.9oC
10.1oC
153.8oC
143.7oC
210.0oC189.7oC
209.8oC180.3oC
(1)
(2)
(3)
(4)
95

Figure 4.5 shows polarized optical micrographs of SPU with different curing temperature.
The spherulite sizes of SPU-100 and SPU-125 were 20-25 �m and 25-30 �m, respectively.
No spherulites were observed for SPU-50 and SPU-75 whereas it was clearly seen for SPU-
100 and SPU-125. The reason that SPU with lower curing temperature was closed to linear
chain, hence the aggregated hard segment are not occurred. These spherulites are found to be
negative spherulites; that is, polymer chains oriented perpendicular to the radial direction. It
is known that the spherulites were composed of a small soft segment components and a lot of
hard segment components11). SPU cured at 100 oC had many small negative spherulites with
well-defined Maltese cross. However, the structure of spherulites of SPU cured at 125 oC turn
into loose spherulites, so-called sheaf-like4, 12). This result indicates that the ordered soft
segment structure hardly changes at low curing temperature. As the curing temperature of
100 and 125 oC, the intermolecular interaction between hard segments to form physical
crosslinking can be occurred. Therefore, the curing temperature above 100 oC (lower than
melting of hard segments) dominantly influences the aggregative morphology of SPUs.
Figure 4.4. The SPUs structure; (a) at low curing temperature and (b) at high cuing temperature.
(a) (b)(a) (b)
96

(a) (b)
(c) (d)
30 ����m30 ����m
30 ����m30 ����m
(a) (b)
(c) (d)
(a) (b)
(c) (d)
30 ����m30 ����m30 ����m30 ����m
30 ����m30 ����m30 ����m30 ����m
Figure 4.5. Polarizing optical microscopic images of SPUs with various curing temperature; (a) SPU-50, (b) SPU-75 (c) SPU-100 and (d) SPU-125.
97

Figure 4.6 shows the relationships of contact angle and curing temperature. The contact
angle of water and methylene iodide of SPUs was found from 66.2 to 99.8 degree and 59.7 to
73.3 degree, respectively. The contact angle of water increases in the order of SPU-50 <
SPU-75 < SPU-100 < SPU-125, indicates the good wetting decreases sequentially from SPU-
50 to SPU-125. It can also be seen that the values for the contact angle of methylene iodide
obtained for interfacial SPU surfaces fall in increasing order of cure temperature, that is,
SPU-50 > SPU-75 > SPU-100 > SPU-125. These results can be suggested that in the case of
lower cure temperature, the strong intermolecular interaction between SPUs surface and
water, namely the high hydrophilic component on the surface of SPUs. The increasing of
hydrophilic component (polar component) in SPUs might be due to the diffusion of hard
segment on the surface of these SPUs. In the case of higher cure temperature (SPU-125), the
physical crosslinking can be formed cause the aggregated hard segments, thereby the amount
of segregated hard segments on the top surface of SPUs was decreased. These results mean
that the numerous of non-polar component (dispersion component, namely the soft segment
components was found at the top surface of SPUs as result of large contact angle of water. It
is noteworthy that the change of curing temperature are primarily improved the wettability
and adhesion properties of SPUs.
98

Figure 4.6. Relationships between contact angle and curing temperature for the various SPUs.
020
406080
100120
Con
tact
ang
le /
deg
50 12575 100Curing temperature / oC
140WaterMethylene iodide
020
406080
100120
Con
tact
ang
le /
deg
50 12575 100Curing temperature / oC
140
020
406080
100120
Con
tact
ang
le /
deg
50 12575 100Curing temperature / oC
140WaterMethylene iodideWaterMethylene iodide
99

Table 4.2 shows the value of total surface free energy (�S) and its components for SPUs
cured at different temperatures. The �S of SPUs was evaluated using contact angle
measurements, according to an extended equation (4) and (5). The relationships of �S, �Sd, �S
p
and cure temperature are shown in Figure 4.7. The �S of SPUs has been determined to be in
the range between 30 and 49 mJ/m2. With increasing cure temperature, the value of �S and �Sp
for SPUs decreased. In contrary, �Sd exhibited differ from �S and �S
p. Furthermore, the polar
component was mostly decreased by curing up to 125 oC. These results might be due to the
segregation of hard segments on the surface of SPUs decreased largely. Certainly, the �S was
dependent upon the aggregation of hard segment in SPUs chain.
Table 4.2 The value of �S and its components for SPUs cured at different temperature.
Sample����S
d
(mJm-2)����S
p
(mJm-2)����S
(mJm-2)
SPU-50
SPU-75
22.0 26.4 48.4
22.9 22.4 45.3
SPU-100
SPU-125
25.6 9.3 34.9
27.1 3.0 30.1
Sample����S
d
(mJm-2)����S
p
(mJm-2)����S
(mJm-2)
SPU-50
SPU-75
22.0 26.4 48.4
22.9 22.4 45.3
SPU-100
SPU-125
25.6 9.3 34.9
27.1 3.0 30.1
100

Figure 4.7. Effect of cure temperature on surface free energy (in mJm-2) of SPUs.
�Sd ; surface free energy of the dispersion component.
�Sp ; surface free energy of the polar component.
50 75 100 1250
20
40
60
80
Curing temperature / oC
�� �� S/ m
Jm-2
����sd
����sp
50 75 100 1250
20
40
60
80
Curing temperature / oC
�� �� S/ m
Jm-2
50 75 100 1250
20
40
60
80
Curing temperature / oC
�� �� S/ m
Jm-2
����sd
����sp
101

Figure 4.8 shows T-peel strength of SPUs with various cure temperature. To understand
the aggregated hard segment affect adhesive strength in SPUs in Figure 4.8, the schematic
model of the aggregated hard segment components at the SPUs/aluminum interface was
drawn in Figure 4.9. T-peel strength of SPUs decreased as the curing temperature increased
that is decreased from 20.87 MPa of SPU-50 to 12.37 MPa of SPU-125. These results can be
attributed to the aggregation of hard segments to formed physical crosslinking was found in
SPUs with higher cure temperature. For SPU-50 and SPU-75, a lot of hard segment
component which is segregated at the top surface of SPUs can greatly adhere to aluminum
surface. Thus, the strong interaction between SPUs and aluminum surface can be attained. On
the other hand, opposite phenomena happened to SPU-100 and SPU-125. The physical
crosslinking in these SPUs induced the formation of non-linear chains and causes phase
mixing trend between soft and hard segment components. It seems that this phenomenon
occurs ever at the surface region of SPUs.
Figure 4.8. Effect of cure temperature on T-peel strength of SPUs.
0
5
10
15
25
T-P
eel s
tren
gth
/ MPa 20
Curing Temperature / oC75 100 12550
20.8718.17
12.73
17.10
0
5
10
15
25
T-P
eel s
tren
gth
/ MPa 20
Curing Temperature / oC75 100 12550
20.8718.17
12.73
17.10
102

Figure 4.10 shows optical microscopic images for (a) SPU-50, (b) SPU-75, (c) SPU-100
and (d) SPU-125. To understand the failure behavior of SPUs in Figure 4.10, the schematic
model of T-peel fracture behavior of SPUs was drawn in Figure 4.11. Only cohesive failure
was observed in SPUs. Cohesive failure is fracture occurring within the adhesive layer that is
when the adhesive was subjected to a peeling force, it is deformed and the fracture was arisen
within the adhesive layer as shown in Figure 4.11(b). This fracture was due to the interaction
between adhesive and substrate as large as the intermolecular interaction in SPUs.
Aluminum
AluminumAluminum
Aluminum
Low curing temperature High curing temperature
Aluminum
AluminumAluminum
Aluminum
Low curing temperature High curing temperature
Figure 4.9. Schematic model of the aggregated hard segment components at the SPUs/aluminum interface.
103

(a) (b)
(c) (d)
(a) (b)
(c) (d)Figure 4.10. Optical microscopic images of aluminum surface after T-peel testing for SPUs; SPU-50, (b) SPU-75, (c) SPU-100 and (d) SPU-125.
Figure 4.11. Schematic model of T-peel fracture behavior of SPUs; (a) original specimen, (b) peeling specimen and (c) peeled specimen.
104

4.4 Conclusion
Four types of PTMG-MDI based SPUs were prepared using four different cure
temperatures.
1. Crosslinking density and the melting temperature of hard segments in SPUs were
increased with increasing cure temperature.
2. When the cure temperature was increased, SPUs were closed to non-linear chain and
the physical crosslinking was greatly formed, hence the hard segments were
aggregated to form spherulites.
3. The surface free energy, water wettability and T-peel strength of SPUs decreased
because the polar hard segment component could not segregate at the top surface of
SPUs when the curing temperature was increased.
4. Only cohesive failure was observed in all SPUs. These were explained by the
interaction between SPUs adhesive and aluminium substrate as large as the
intermolecular interaction in SPUs adhesive layer due to a phase separation trend of
hard and soft segment chains, thus a lot of hard segments can be segregated at the top
surface of SPUs.
105

References
1. Buist J.M., Gudgeon H., “Advances in Polyurethane Technology”, John Wiley and Sons
Inc. Publishers, New York (1968).
2. Petrovic Z. S., Javni I. and Divjakovic V., J. Polym. Sci., 36, 221 (1998).
3. Nakamae K., Nishino T., Asaoka S. and Sudaryanto, Int. J. Adhes. Adhes., 16, 233 (1996).
4. Furukawa M., Recent Res. Devel. In Macromol Res., 3, 89 (1998).
5. Okazaki T., Furukawa M. and Yokoyama T., Polym. J., 29(7), 617 (1997).
6. Furukawa M., Hamada Y. and Kojio K., J. Polym. Phys., 41, 2355 (2003).
7. Martin D. J., Meijs G. F., Gunatillake P. A., McCaethy S. J. and Renwick G. M., J. Appl.
Polym. Sci., 60, 557 (1996).
8. Martin D. J., Meijs G. F., Gunatillake P. A., McCaethy S. J. and Renwick G. M., J. Appl.
Polym. Sci., 64, 803 (1997).
9. Vega-Baudrit J., Sibaja-Ballestero M., Vazquez P., Torregrosa-Macia R. and Martin-
Martinez J.M., Int. J. Adhes. Adhes., 27, 469 (2007).
10. Velez-Pages T. and Martin-Martinez J.M., Int. J. Adhes. Adhes., 25, 320 (2005).
11. Okazaki T., Yokoyama T. and Furukawa M., Gomu kyoukaishi (J. Rubber Ind. Soc.,), 68,
417 (1995).
12. Mark H. F. and Gaylord N. G., “Encyclopedia of Polymer Science and Technology (Vol.
9), John Wiley and Sons, Inc., New Jersey, 1968, 243.
106

Chapter 5 Effect of Humidity on the Micro-aggregation Structure and Adhesion
Properties of Segmented Polyurethanes
5.1 Introduction
Polyurethane is used in various application fields such as sealant production1), coating2)
and adhesive3) because the isocyanate group has a high reactivity and it can react with almost
any compound possessing active hydrogen atom, even at room temperature. Free hydroxyl
group in the polymer react with isocyanates to form urethane linkages. A three dimensional
urethane network is formed when there are two or more reactive sites on each reactant.
However, reactions leading to the formation of urethane linkages are influenced by external
conditions. When water is present, the isocyanate group reacts with water to form an amine,
and the amine reacts with another isocyanate to form urea linkages. The source of water is
typically a high reactive humidity or water absorbed into the system. Amines are more
nucleophilic than alcohols, the formation of urea linkages will dominate the process, and the
polyol will be difficult to crosslink with the isocyanate group properly. In addition,
byproducts of the side reaction between isocyanate and water will affect the properties of the
resulting products in various applications.
Werner et al.4) investigated the effect of the relative humidity of the ambient air on the
dentin bonding efficiency of four self-etching primer adhesives. Eight specimens were
prepared for each of the adhesives and each of the following six conditions prior to
application of the bonding agents and a hybrid-type resin composite material: air dried, wet,
or stored for 1 h at 33%, 50%, 75%, and 100% relative humidity (RH). Shear bond strength
(SBS) was determined after 24 h of storage in water at 37 oC. They found that the self-etching
primer adhesives tested are unaffected by the degree of dentin wetness or ambient air
humidity exposure prior to application. Unless considered necessary for other clinical reasons,
use of rubber-dam is not compulsory. Burrow et al.5) studied the effect of temperature and
relative humidity (RH) on the early tensile bond strength to bovine dentine of two bonding
systems (Liner Bond System and Scotchbond Multi-purpose) of resin composite, and an
experimental system (KB-110) were tested. They found that the different bonding system due
to the different experimental system may be more or less sensitive to changes in RH and
temperature. Moreover, the bond strengths of the systems tested tended to exceed the early
cohesive strengths of the resin composite. Asahara et al.6) studied the effect of humidity
during storage on the crosslinking reactions of isocyanate groups using attenuated total
107

reflectance Fourier transform infrared spectroscopy with pressure-sensitive adhesive (PSA)
composed of poly[ethyl acrylate-co-(2-ethylhexyl acrylate)-co-(2-hydroxyethyl
methacrylate)] as a base resin and polyisocyanate as a crosslinker. They have found that the
isocyanate groups in the PSA films stored under the humid condition were consumed earlier
than the films stored under the dry condition. In addition, more urea linkages were produced
in the PSA films stored under the humid condition than in the films stored under the dry
condition.
The object of this study was to investigate the effect of humidity on the micro-
aggregation structure and adhesion properties of segmented polyurethanes (SPUs).
5.2 Experimental
5.2.1 Materials
Poly(oxytetramethylene)glycol (PTMG) with the average molecular weight (Mn) of 2018
and 4,4-diphenylmethane diisocyanate (MDI) were supplied by Nippon Polyurethane
Industry, Japan. 1,4-butanediol (BD) (Wako Chemicals Co., Ltd., Japan) were used as a chain
extender for segmented polyurethanes. PTMG was dried with dried nitrogen under reduced
pressure and BD was distilled prior to use. Toluene (Wako Chemicals Co., Ltd., Japan) was
also distilled prior to use in swelling test. Methylene iodide which is used in contact angle
measurement was supplied by Wako Chemicals Co., Ltd., Japan. Figure 5.1 shows the
chemical structures of materials for synthesis of PTMG-MDI based segmented polyurethanes
(SPUs).
108

5.2.2 Polymer synthesis
SPUs were synthesized using a prepolymer method. Synthetic scheme of SPUs is shown
in Figure 5.2. The prepolymer was prepared from PTMG and MDI with a ratio of
[NCO]/[OH] = 3.30 at 70 oC for 6 h under a nitrogen atmosphere. The curing agents was
added to the prepolymers with NCO INDEX = [NCO]pre/[OH] = 1.05 and stirred for 5 min,
where [NCO]pre is the concentration of NCO groups in a prepolymer. The viscous product
was then poured into a mold constructed by a spacer of 0.5 mm thickness. The two aluminum
plates were heated at 130 oC prior to use. The sample was cured for 24 h at 100 oC under an
air atmosphere with various relative humidity (RH), 37, 50, and 75%. SPUs under various
humid conditions were denoted as SPU-37, SPU-50 and SPU-75.
CH2CH2CH2CH2O ����HO ���� n HPoly(oxytetramethylene) glycol (PTMG Mn = 2018)
CH2 NCOOCN
4,4’-diphenylmethane diisocyanate (MDI)
HO-CH2CH2CH2CH2-OH1,4-butanediol (BD)
Polyol
Diisocyanate
Chain extender
CH2CH2CH2CH2O ����HO ���� n HCH2CH2CH2CH2O ����HO ���� n HPoly(oxytetramethylene) glycol (PTMG Mn = 2018)
CH2 NCOOCN CH2 NCOOCN
4,4’-diphenylmethane diisocyanate (MDI)
HO-CH2CH2CH2CH2-OH1,4-butanediol (BD)
Polyol
Diisocyanate
Chain extender
Figure 5.1. Chemical structures of all materials for synthesis SPUs.
109

5.2.3 Characterization
Swelling measurement, macroscopic observation, thermal analysis, surface free energy
measurement, T-peel strength and T-peel fracture behavior were used as the same conditions,
equations and methods with chapter 2.
Figure 5.2. Synthetic scheme of SPUs cured under different relative humidity (%RH).
Prepolymer
PTMG MDI
BD
Viscous Product
Pour onto Al-treated substrate
Cure at 100 oC for 24 h (RH: 37%, 50% and 75%)
SPU-37, SPU-50, SPU-75
N2 atmosphere70 oC/ 6 hK = 3.30
NCO index = 1.05
Aluminum
Aluminum
Viscous PU
Prepolymer
PTMG MDI
BD
Viscous Product
Pour onto Al-treated substrate
Cure at 100 oC for 24 h (RH: 37%, 50% and 75%)
SPU-37, SPU-50, SPU-75
N2 atmosphere70 oC/ 6 hK = 3.30
NCO index = 1.05
Aluminum
Aluminum
Viscous PU
110

5.3 Results and Discussion
Table 5.1 shows structural parameter and properties of SPUs. The gel fraction of all three
SPUs showed similar value that is greater than 99%. It is supported that the polymerization of
SPUs progressed enough. The degree of swelling decreased with increasing relative humidity
that is decreased from 2.30 to 1.85. It is noteworthy that the degree of swelling of SPU-75
showed the lowest value. This result suggests that SPU-75 was close to the network structure.
With increasing relative humidity, the crosslink density increased from 5.48×10⁻⁴ to
12.90×10⁻⁴ mol/cm3. On the other hand, the molecular weight between crosslink points and
the degree of swelling decreased with increasing relative humidity. This result indicates that
the relative humidity can be induced the crosslinking into the SPUs structure.
Table 5.1. Structural parameters and properties of SPUs cured under different relative humidity (%RH).
Density(g/cm3)Sample
SPU-37 1.08
SPU-75 1.09
Degree of swellinga)
1.85
Crosslinkdensity
(mol/cm3)×10-4
5.48
12.90
Molecular weightbetween crosslink
(mol-1)×103
1.83
0.78
99.05
99.14
2.30
SPU-50 1.08 2.03 8.93 1.1299.33
Gelfractiona)
(%)
a) in toluene solvent
Density(g/cm3)Sample
SPU-37 1.08
SPU-75 1.09
Degree of swellinga)
1.85
Crosslinkdensity
(mol/cm3)×10-4
5.48
12.90
Molecular weightbetween crosslink
(mol-1)×103
1.83
0.78
99.05
99.14
2.30
SPU-50 1.08 2.03 8.93 1.1299.33
Gelfractiona)
(%)
a) in toluene solvent
111

Figure 5.3 shows DSC thermograms of SPUs cured under various relative humidity
(%RH). Glass transition temperature of the soft segment chains (Tg) elevated from -63.2 to -
51.7 oC with an increase in relative humidity. Melting temperature of hard segment domains
(Tm,H) observed from 171.8 to 189.1 oC. It is well known that increasing Tg of soft segment in
SPUs means an increase in miscibility of two components on account of the molecular
interaction between soft and hard segments. Moreover, the shifted of Tm,H to the higher
temperature side when increased relative humidity can be suggested that the humidity
induced crosslink into SPUs structure. The change of SPUs structure with different relative
humidity can be explained as follows. For the lower relative humidity, the hard segment
possesses a linear urethane chain, resulting in high crystallizability. On the other hand, for
higher relative humidity, the crystalline structure was disturbed by the penetration of
crosslinking reactions. Thus, the degree of the crystalline was reduced. These results indicate
that the degree of microphase separation of the SPU became weaker toward the higher
relative humidity.
112

End
othe
rm
Temperature (oC)-100 250200100 1500 50-50
-63.2oC
-59.4oC
-51.7oC173.6oC
189.1oC
189.0oC
SPU-50
SPU-75
SPU-37
End
othe
rm
Temperature (oC)-100 250200100 1500 50-50
-63.2oC
-59.4oC
-51.7oC173.6oC
189.1oC
189.0oC
SPU-50
SPU-75
SPU-37
Figure 5.3. DSC thermograms of various SPUs measured at 10 oC min-1.
113

Figure 5.4 shows polarized optical micrographs of SPUs cured�under different relative
humidity. The spherulite size of SPU-37, SPU-50 and SPU-75 were 12-20, 10-18 and 8-16
�m, respectively. When the relative humidity increased, the spherulite size decreased. These
spherulites are found to be negative spherulites; that is, polymer chains oriented
perpendicular to the radial direction. It is known that the spherulites were composed of a
small soft segment component and a lot of hard segment component7). These results mean
that the chemical crosslinking which was formed by diisocyanate and water in air interrupt
the aggregation of hard segments to form spherulites. Thus, the small spherulites were
observed in high relative humidity.
Figure 5.4. Polarized optical microscopic images of SPUs; (a) SPU-37, (b) SPU-50 and (c) SPU-75.
20 ����m 20 ����m 20 ����m
(a) (b) (c)20 ����m 20 ����m 20 ����m20 ����m 20 ����m 20 ����m
(a) (b) (c)
114

The relationship between contact angle and relative humidity is shown in Figure 5.5. With
increasing relative humidity, the contact angles of water and methylene iodide of SPUs
increased from 92.7 to 99.0o and decreased from 72.6 to 68.3o, respectively. The contact
angle of water increased in the order of SPU-37 < SPU-50 < SPU-75. In contrast, the contact
angle of methylene iodide decreased with increased relative humidity. SPU-37 had the
highest wettability by water, i.e. smallest contact angle, indicating the highest surface free
energy. These results suggest that the excellent intermolecular interaction between SPUs
surface and water, that is, the high hydrophilic component (polar component) on the surface
of SPUs.
37 50 750
20
40
60
80
100
120
Relative humidity / %
Con
tact
ang
le /
deg
Water
Methylene iodide
140
37 50 750
20
40
60
80
100
120
Relative humidity / %
Con
tact
ang
le /
deg
Water
Methylene iodide
Water
Methylene iodide
140
Figure 5.5. Relationships between contact angle and relative humidity for SPUs.
115

Figure 5.6 shows �S, �Sd and �S
p of the SPUs cured under various relative humidity. The
value of total surface free energy (�S), dispersion component (�Sd) and polar component (�S
p)
of the SPUs are summarized in Table 5.2. These values were calculated by equation (4) and
(5) in chapter 2. The �S of SPU-37, SPU-50 and SPU-75 were 35.9, 33.9 and 32.4 mJm-2,
respectively. The value of �S for the SPUs decreased with increasing relative humidity. �Sp
exhibited same trend as well. In contrary, the value of �Sd increased with increasing relative
humidity. It means that the �Sp of SPU-37 is the highest in the three SPUs due to the large
diffused hard segment components at the top of surface. For SPU-75, the segregation of the
hard segment chains at the top of surface was suppressed by the crosslinking point in SPUs.
Figure 5.6. Effect of relative humidity on surface free energy (in mJm-2) of SPUs.
�Sd ; surface free energy of the dispersion component.
�Sp ; surface free energy of the polar component.
37 50 750
10
20
30
40
50����s
d
����sp
Relative humidity / %
�� �� s/ m
Jm-2
37 50 750
10
20
30
40
50����s
d
����sp
����sd
����sp
Relative humidity / %
�� �� s/ m
Jm-2
116

Figure 5.7 shows T-peel strength of SPUs cured under different relative humidity (%RH).
T-peel strength of SPUs decreased as the relative humidity increased namely decreased from
16.35 MPa of SPU-37 to 12.29 MPa of SPU-75. To understand the adhesive strength in
Figure 5.7, see Figure 2.8 in chapter 2. These results suggest that the moisture vapor readily
causes the curing reaction, that is, the reaction between residual diisocyanates end group and
water result in the formation of urea linkages (scheme 5.1). Thus, the SPU structure at higher
relative humidity was changed from a linear to crosslinked form. As a result, poor T-peel
strength can be obtained. In contrary, SPU with lower relative humidity showed excellent T-
peel strength due to the lower crosslinking density in the SPU structure. These results can be
attributed to the reaction between diisocyante and water was slightly obtained and hard
segment can be segregated at the top of SPU surface. Therefore, the strong interaction
between SPU and substrate was found.
Table 5.2 The value of �S and its components for SPUs cured under various relative humidity.
Sample ����Sd (mJm-2) ����S
p (mJm-2) ����S (mJm-2)
SPU-37 21.6 14.3 35.9
SPU-50
SPU-75
22.7 11.2 33.9
24.2 8.1 32.4
Sample ����Sd (mJm-2) ����S
p (mJm-2) ����S (mJm-2)
SPU-37 21.6 14.3 35.9
SPU-50
SPU-75
22.7 11.2 33.9
24.2 8.1 32.4
117

Figure 5.7. T-peel strength of SPUs cured under different relative humidity.
Scheme 5.1. The hydrogen bonded structure between diisocyanate and moisture in air.
0
5
10
15
20
37 50 75
Relative humidity / %
T-p
eel s
tren
gth
/ MPa
16.3514.35
12.29
0
5
10
15
20
37 50 75
Relative humidity / %
T-p
eel s
tren
gth
/ MPa
16.3514.35
12.29
OCN~~~~~NCO
OCN~~~~~NCO
OCN~~~~~NCO
OCN~~~~~NCO
H2OCuring reaction
N~~~~~N N~~~~~N~~~~N
O O
HH
~~~~~N N~~~~~N~~
NH O
HH H
HHC O=
~~~~~
OCN~~~~~NCO
OCN~~~~~NCO
OCN~~~~~NCO
OCN~~~~~NCO
H2OCuring reaction
N~~~~~N N~~~~~N~~~~N
O O
HH
~~~~~N N~~~~~N~~
NH O
HH H
HHC O=
~~~~~
118

To investigate directly the surface failure of the SPUs, we made optical microscopy
observations for the aluminum plate surface. Figure 5.8 shows optical microscopic images of
aluminum surface after T-peel testing for (a) SPU-37, (b) SPU-50 and (c) SPU-75. Only
cohesive failure was observed after T-peel test. When the adhesive was subjected to a peeling
force, it is deformed and the high residue of SPU adhesive was found on aluminum surface
area and the fracture was occurred within the adhesive layer (figure 4.10 in chapter 4). These
results clearly imply the strong interaction between SPU and aluminum plate surface, which
is caused from the weak network structure in SPU chains and the polar components were
greatly segregated at the surface of SPU.
5.4 Conclusion
Three SPUs were prepared using three different relative humidity.
1. Crosslinking density in SPUs increased whereas the degree of swelling decreased
with increasing relative humidity.
2. When the relative humidity was increased, SPUs were close to network structure and
the crosslinking was greatly formed, hence the crosslinking points suppressed the
aggregation of hard segments to form spherulites. In addition, the degree of
(a) (b) (c)(a) (b) (c)
Figure 5.8. Optical microscopic images of aluminum surface after T-peel testing for SPUs; (a) SPU-37, (b) SPU-50 and (c) SPU-75.
119

microphase separation of the SPUs became weaker towards the higher relative
humidity.
3. The surface free energy, water wettability and T-peel strength of SPUs decreased
because the polar hard segment component cannot segregated at the top surface of
SPUs when the relative humidity increased.
4. Only cohesive failure observed in all SPUs. These were explained by the interaction
between SPUs adhesive and aluminum substrate as large as the intermolecular
interaction in SPUs adhesive layer due to a lot of hard segment components can be
segregated at the top surface of SPUs.
120

References
1. Chew M. Y. L. and Zhou X., Polymer Testing, 21, 187 (2002).
2. Chattopadhyay D. K., Sreedhar B., and Raju K. V. S. N., J. Appl. Polym. Sci., 95, 1509
(2005).
3. Chattopadhyay D. K., Sreedhar B., and Raju K. V. S. N., Polymer, 47, 3814 (2006).
4. Werner J. F. and Tani C., J. Adhes. Dent�, 4(4), 277 (2002).
5. Burrow M. F., Taniguchi Y., Nikaido T., Satoh M., Inai N., J. Tagami and T. Takatsu, J.
Dent., 23(1), 41 (1995).
6. Asahara J., Sano A., Hori N., Takemura A. and Ono H., J. Appl. Polym. Sci., 89, 3039
(2003).
7. Okazaki T., Yokoyama T., Furukawa M., Gomu kyoukaishi (J. Rubber Ind. Soc.,), 68,
417 (1995).
121

Chapter 6 Summary
Polyurethane adhesives (PUAs) are normally defined as those adhesives that contain a
number of urethane groups in the molecular backbone, regardless of the chemical
composition of the rest of the chain. PUAs have some advantages as follows: 1) SPU readily
forms hydrogen bonds to the substrates. 2) SPU forms covalent bonds with substrates that
have active hydrogen. 3) SPU effectively wet the surface of most substrates. 4) SPU with
small molecular size allows them to permeate porous substrates. The primary bonding
mechanisms of urethane adhesives is believed to be through isocyanate (-NCO) and polar
groups (-NH and -C=O) that are capable of forming strong chemical and physical interactions
with surfaces having active hydrogen.
The purpose of this study is investigation of the effect of the aggregation structure of
segmented polyurethanes (SPUs) on their adhesion properties. SPUs were synthesized by a
prepolymer method, and were used as hot melt adhesives and reactive adhesives. An attempt
to control the morphology and adhesion between adhesive and substrate was done by
performing the different conditions. This study might develop the segmented polyurethanes
having good adhesion properties.
Chapter 1 included the general introduction about polyurethane adhesives and precious
researches, the purpose and the outline of this thesis.
In Chapter 2, the effect of curing agent ratio of diol to triol on the micro-aggregation
structure and adhesion properties of SPU were investigated. Four SPUs were prepared by
different blend ratios of 1,4-butanediol/1,1,1-trimethylol propane (BD/TMP) (BD/TMP =
100/0, 90/10, 75/25 and 50/50). With increasing the blend ratio of TMP, the adhesive
strength and wettability decreased because the polar hard segment contents cannot segregate
at the top surface of SPUs. Moreover, three failure modes were observed after T-peel testing.
That is, the cohesive failure, the cohesive-interfacial failure and the interfacial failure which
are observed for the SPU with low, moderate and high TMP blend ratios, respectively. These
were explained by the strong chemical network structure and the SPU did not interact with
aluminum surface due to a phase mixing trend of soft and hard segment chains, thus this
fracture led to the interfacial failure and the strong interaction between SPU and the
aluminum plate surface led to the cohesive failure.
In Chapter 3, the influence of curing temperature on the micro-aggregation structure and
adhesion properties of SPU were studied. Four SPUs were prepared using four different
curing temperatures (50oC, 75oC, 100oC and 125oC). Crosslinking density and the melting
122

temperature of hard segments (Tm,H) in SPUs were increased with increasing curing
temperature. SPUs were closed to crosslink structure, hence the hard segments were
aggregated to form spherulites and the polar hard segment components cannot segregate at
the top surface when the curing temperature was increased. Additionally, Tg of soft segment
increased with increasing curing temperature and Tm,S of soft segment was disappeared at the
high curing temperature. These results indicate that the microphase separation of SPU
became weaker toward the higher curing temperature. The surface free energy, water
wettability and T-peel strength of SPUs decreased because the polar hard segment
component could not segregate at the top surface of SPUs when the curing temperature was
increased. Thus, the adhesion properties decreased at high curing temperature.
In Chapter 4, the effect of humidity on the micro-aggregation structure and adhesion
properties of SPU were investigated. Three SPUs were prepared using three different relative
humidity (37%RH, 50%RH and 75%RH). Crosslinking density in SPUs increased whereas
the degree of swelling decreased with increasing relative humidity. Tg of soft segment
increased with increasing relative humidity. Therefore, it is conceivable that SPUs were
closed to network structure As the result, the crosslinking point suppressed the aggregation
of hard segments to form spherulites. The adhesive strength decreased when relative
humidity increased because the polar hard segment component cannot segregate at the
substrate/adhesive interface. Moreover, only cohesive failure was observed in all SPUs.
In Chapter 5, the effect of polymer glycols on the microaggregation structure, mechanical and
adhesion properties of SPU were studied. For mechanical properties (chapter 5.1), the
spherulite size graded polyurethane elastomers were successfully prepared by using different
temperature of mold plates and different polymer glycols, namely poly(oxytetramethylene)
glycol (PTMG), poly(hexamethylene adipate) glycol (PHA) and poly(ethylene adipate)
glycol (PEA), 4,4-diphenylmethane diisocyanate (MDI) and BD/TMP as a curing agent by a
prepolymer method. Polyether based PUE showed strong microphase separation compared
with polyester based PUE. The polyether based PUE had largely graded mechanical
properties from the lower temperature to the higher temperature, while the polyester based
PUE had slightly graded mechanical properties. The important knowledge was found to
develop novel functionally graded polyurethane elastomers. For adhesive properties (chapter
5.2), the SPUs was prepared from two polymer glycols, namely poly(oxytetramethylene)
glycol (PTMG) and poly (butylene adipate) glycol (PBA), MDI and BD as a chain extender
by a prepolymer method. The corona discharge can lead to increasing the high reactive free
radical oxygen in non-polar polymer (PP surface). Upon the condition of corona discharge
123
treatment, the contact angle and surface free energy showed optimum value and the surface
free energy of PP film showed the extremely high value when the corona discharge treatment
time was used. Moreover, polar functional groups, such as -CO, -C=O, and -COO were
introduced on the PP film surface after corona discharge treatment. Comparative studies of
SPU adhesive containing different polymer glycols indicate that the adhesive strength of
polyesther based SPU (PBA-SPU) was higher than polyether based SPU (PTMG-SPU)
because the carbonyl group of PBA polyol is also segregated at the surface of PBA-SPU.
Thus, the interfacial interaction between PBA-SPU adhesive and substrate was stronger than
that of PTMG-SPU adhesive and substrate.
Finally, the polyurethane adhesives are not only replacing screws, riverts and nails but
are becoming a preferred alternative to spot welding, soldering and brazing. Interestingly, the
use of polyurethane adhesives can produce joints of higher strength and allow the assembly
of components without to need to drill or perforate them. Additionally, polyurethane
adhesives can avoid the heat distortion resulting from high temperature jointing processes.
Thus, the polyurethane adhesive are widely developed and used in many industrial
applications. The development of SPUs having good adhesion properties can be successfully
prepared by changing the condition in the preparation step, for instance, curing agent ratio,
curing temperature, relative humidity, polymer glycol. Moreover, the surface modification
(corona discharge treatment) was also used to improve the nonpolar substrate. In addition,
the nonpolar substrate after modified surface was lead to a very strong adhesive strength
between substrate/adhesive interfaces.
124

Paper lists of thesis
1. Published Papers
1. Teerin Kongpun, Ken Kojio, Suguru Motokucho and Mutsuhisa Furukawa; “Effect of
Polymer Glycols on Micro-aggregation Structure and Mechanical Properties of
Spherulite Size Graded Polyurethane Elastomers”, Journal of Applied Polymer Science
(In press) (Chapter 3)
2. Teerin Kongpun, Ken Kojio, and MutsuhisaFurukawa; “The Influence of Curing
Temperature on Micro-aggregation Structure and Adhesion Properties of Segmented
Polyurethanes”, Journal of The Adhesion Society of Japan, 44 (12), pp.8-15 (2008)
(Chapter 4)
3. Teerin Kongpun, Ken Kojio, Suguru Motokucho and Mutsuhisa Furukawa; “Effect of
the Ratio of Diol to Triol as Curing Agents on the Microaggregation Structure and
Adhesion Properties of Segmented Polyurethanes”, Journal of The Adhesion Society of
Japan, 44 (9), pp.1-8 (2008) (Chapter 2)
4. Teerin Kongpun, Ken Kojio, Suguru Motokucho and Mutsuhisa Furukawa; “Effect of
Curing Agent Ratio of Diol to Triol on Microaggregation Structure and Adhesion
Properties of Segmented Polyurethane”, The 1st Thailand-Japan Rubber Symposium,
pp.129-132 (2007) (Chapter 2)
5. Teerin Kongpun, Ken Kojio, Suguru Motokucho and Mutsuhisa Furukawa; “The
Influence of Curing Agent Ratio of Diol to Triol on Microaggregation Structure and
Adhesion Properties of Segmented Polyurethane”, 2007 Pusan-Gyeongnam/ Kyushu-
Seibu Joint Symposium on High Polymers (13th) and Fibers (11th), pp.117-118 (2007)
(Chapter 2)
6. Teerin Kongpun, Ken Kojio, Suguru Motokucho and Mutsuhisa Furukawa; “Influence
of Curing Temperature on Microphase-separated Structure and Adhesion Properties of
Segmented Polyurethanes”, International Rubber Conference & Exhibition 2008 (IRC
2008) (Chapter 4)
2. Proceeding paper
1. Teerin Kongpun, Ken Kojio, Suguru Motokucho and Mutsuhisa Furukawa; “Effect of
Humidity on Micro-aggregation Structure and Adhesion Properties of Segmented
Polyurethanes”, (Preparing) (Chapter 5)
125

3. Basic paper related to this thesis
1. Teerin Kongpun, Ken Kojio, Suguru Motokucho and Mutsuhisa Furukawa;
“Aggregation Structure of Functionally Graded Polyurethane Elastomers”, Interlab
Meeting on Polyurethanes and Other Polymers, p.11 (2007)
126

ACKNOWLEDGEMENT
I would like to express my gratitude towards my supervisor, Prof. Dr Mutsuhisa
Furukawa for kindly helpful, commendations and suggestions in this thesis. I am very
grateful for my co-supervisor, Prof. Dr. Makoto Egashira, Prof. Dr. Masayuki Hasaka, and
my assistant professor, Dr. Ken Kojio for their valuable reviews and suggestions in this thesis.
I am also obligate to Dr. Suguru Motokucho and Mr. Mitsuru Egasira for their technical
assistance and kindly helpful in this thesis.
I am also very grateful for the Ministry of Education, Culture, Sports, Science and
Technology of Japan for supporting the scholarship in this thesis and doctorate course.
I would like to extend my appreciation to all staffs and friends from the Super-
structural Materials Science Laboratory, Department of Materials Science for their kindly
helpful and pleasant experience for this research.
Finally, I am forever indebted to my parents and my family for their understanding,
endless patience and encouragement when it was most required. I am also grateful to Miss
Naphat Intaravichian for her kindly helpful and cheering up.
127