napa pad metrics & roi
TRANSCRIPT

Important Metrics to show ROI and Program Success
Matt Phillips, MBADirector, Physician Advisor Program
Rochester Regional Health
Kalyana Kanaparthy, MD, FHMMedical Director, Physician Advisor Program
Rochester Regional Health
1
Goals for presenting metrics
As illustrated in the previous presentation you need strong metrics
However strong metrics/data are only part of the equation• Use them to tell a story• Guide your audience through data• Make your case based upon the strength of the metrics

How to monitor performance
Always track by using discrete case level data for:• Individual initiative performance metrics
CMI, Win/Loss rate, Obs rate etc. All correlate to ROI
• Overall program summary dashboards showing:ROI measured in multidimensional means• Supported vs. PAd owned• ROI type: Savings, Operational Risk Mitigation, or Improved Compensation
Keep organized files • Update regularly • Automate where possible

Discrete project tracking at Case Level
Hypothetical numbers for presentation purposes only

Finance vetted PAd Impact
Hypothetical numbers for presentation purposes only
Using data to tell a storyA Level of Care example
Reasons to take over Vendor management and education for LOC• Use compelling metrics to tell the tale• Walk the audience through the situation
Administration and Executive Leadership• Make your case!!!
Revisit the story later it could lead to more opportunities• This led to expediting the insourcing of reviews and denial
management
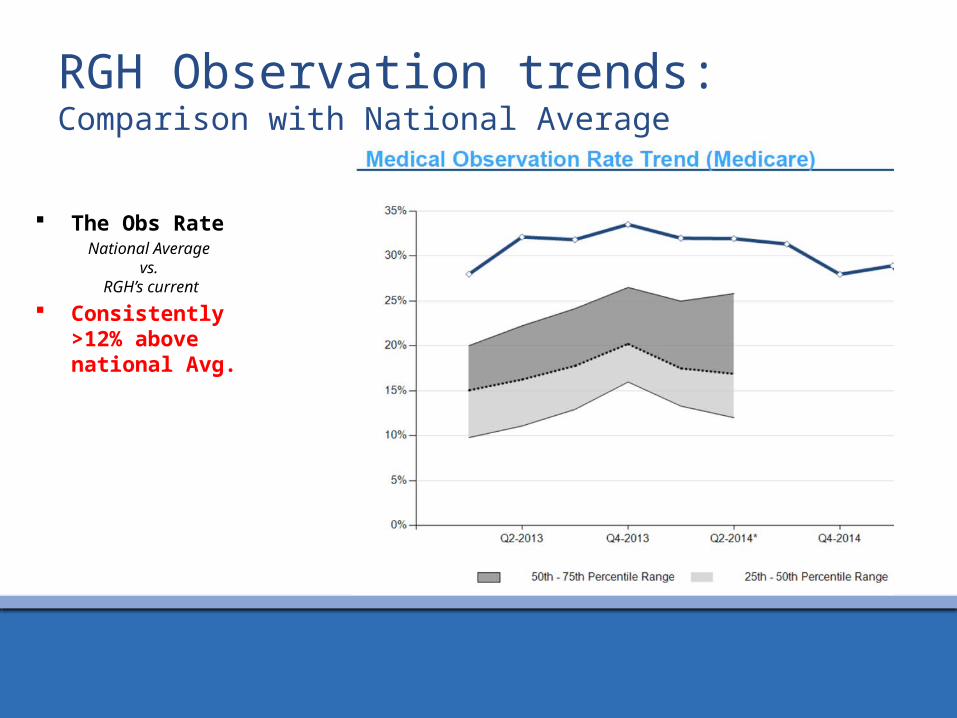
RGH Observation trends: Comparison with National Average
The Obs RateNational Average
vs. RGH’s current
Consistently >12% above national Avg.
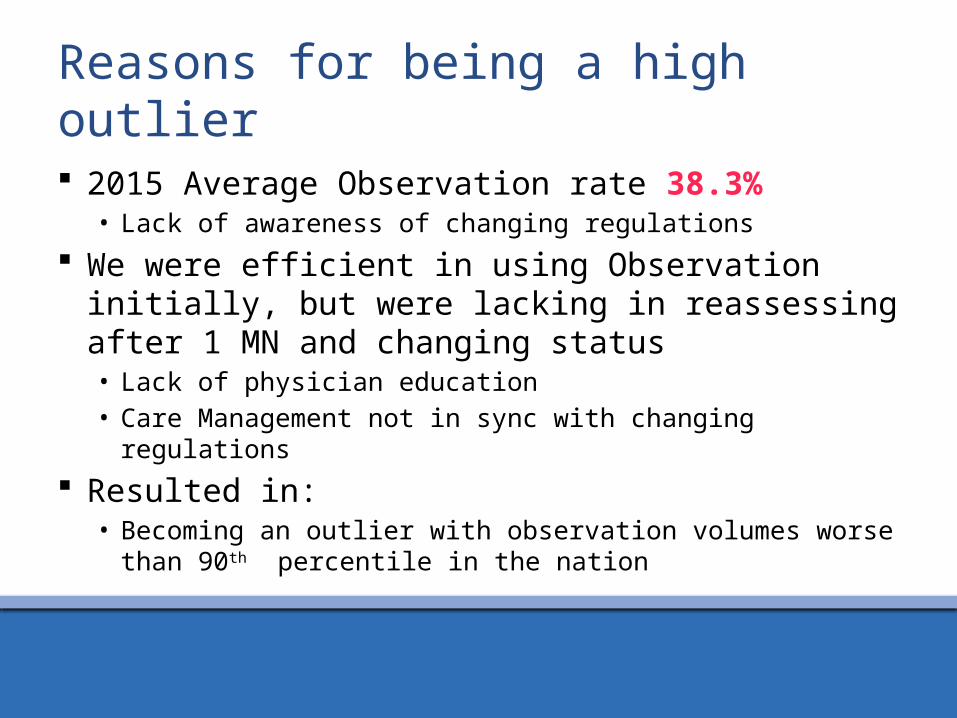
Reasons for being a high outlier
2015 Average Observation rate 38.3%• Lack of awareness of changing regulations
We were efficient in using Observation initially, but were lacking in reassessing after 1 MN and changing status• Lack of physician education• Care Management not in sync with changing regulations
Resulted in:• Becoming an outlier with observation volumes worse than 90th
percentile in the nation

The Reasons to expedite focus on LOC
Observation Rate at discharge prior to PAd program (Using Vendor)
Jan
2012
Mar
201
2M
ay 2
012
Jul 2
012
Sep
2012
Nov
201
2Ja
n 20
13M
ar 2
013
May
201
3Ju
l 201
3Se
p 20
13N
ov 2
013
Jan
2014
Mar
201
4M
ay 2
014
Jul 2
014
Sep
2014
Nov
201
4Ja
n 20
15M
ar 2
015
May
201
5Ju
l 201
5Se
p 20
15N
ov 2
015
Jan
2016
10%
15%
20%
25%
30%
35%
40%
45%
ADT LOC Trends
Historical Trend Pre LOC Expected Trend

PAd educational intervention
Observation Rate after starting the PAd team through November 2015
(Before splitting Care Mgmt)Ja
n 20
12
Mar
201
2
May
201
2
Jul 2
012
Sep
2012
Nov
2012
Jan
2013
Mar
201
3
May
201
3
Jul 2
013
Sep
2013
Nov
2013
Jan
2014
Mar
201
4
May
201
4
Jul 2
014
Sep
2014
Nov
2014
Jan
2015
Mar
201
5
May
201
5
Jul 2
015
Sep
2015
Nov
2015
10%
15%
20%
25%
30%
35%
40%
45%f(x) = 0.00265655632918794 x + 0.310683180703098
ADT LOC Trends
Historical Trend Pre LOC Expected TrendADT LOC Trend Post LOC Trend
2015 RGH Audit
90% Accurate!

Vendor Contract Ownership/Renegotiation
Well below budget in 2015Jan
-13
Mar-13
May-13
Jul-13
Sep-13
Nov-13
Jan-14
Mar-14
May-14
Jul-14
Sep-14
Nov-14
Jan-15
Mar-15
May-15
Jul-15
Sep-15
Nov-15
Jan-16
Mar-16
May-16
Vendor Monthly SpendVendor Charges Budget

Revisit the storyA Level of Care example
Unexpected obstacles present new opportunities• Used a logistical issue on Christmas and turned it into a pilot• Presented pilot data and findings to continue the data story
Illustrated compelling reasons to insource LOC and denial management process

Historic LOC Trends – Jan 2015 onwards
201501 201502201503 201504201505 201506201507 201508201509201510 201511201512 201601201602 201603201604 20160520%
22%
24%
26%
28%
30%
32%
34%
36%
38%
40%
42%
38% 37%39%
36%
39%
41%
39% 39% 38%37%
39%
37%
31% 31%32%
34%
31%
Observation Status at Discharge by MonthObs % 2015 Avg. Before December Split
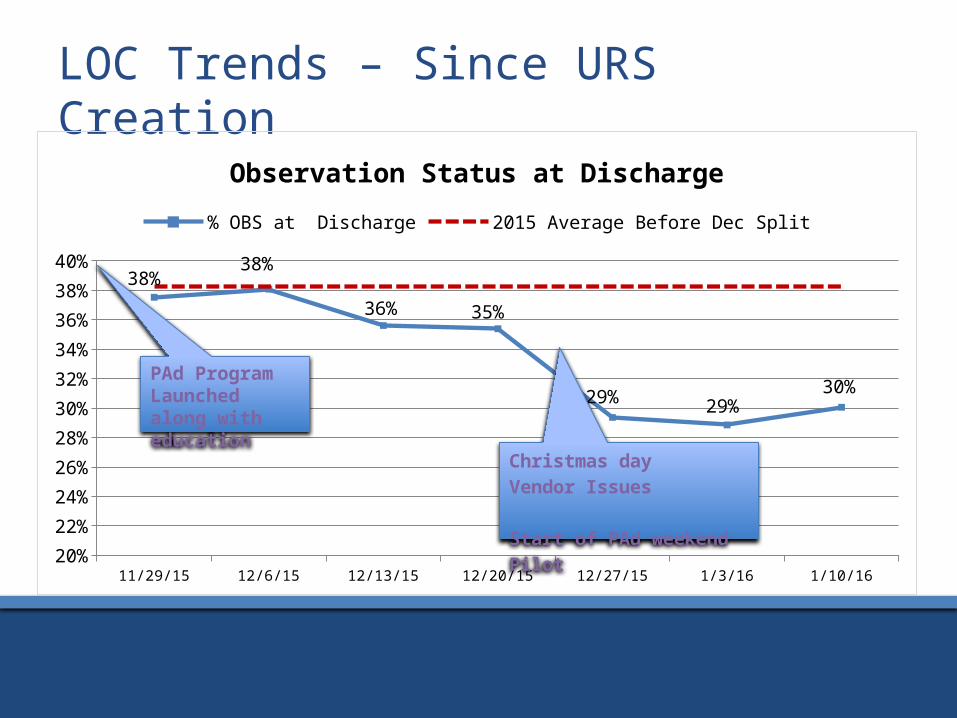
LOC Trends – Since URS Creation
11/29/15 12/6/15 12/13/15 12/20/15 12/27/15 1/3/16 1/10/1620%
22%
24%
26%
28%
30%
32%
34%
36%
38%
40%38%
38%
36% 35%
29% 29%30%
Observation Status at Discharge% OBS at Discharge 2015 Average Before Dec Split
Christmas day Vendor Issues
Start of PAd weekend Pilot
PAd Program Launched along with education

PAd Concurrent LOC Review VolumeJa
nuar
y
Febr
uary
Mar
ch
April
May
June July
Augu
st
Sept
embe
r
Oct
ober
Nove
mbe
r
Dece
mbe
r
Janu
ary
Febr
uary
Mar
ch
April
May
2015 2016
0
50
100
150
200
250
300
350
Referral Trend
OPObsIP

Vendor referral volume + PAd Concurrent LOC Review Volume
201501 201502 201503 201504 201505 201506 201507 201508 201509 201510 201511 201512 201601 201602 201603 201604 2016050
50
100
150
200
250
300
350
Overall Referral TrendPAd Vendor
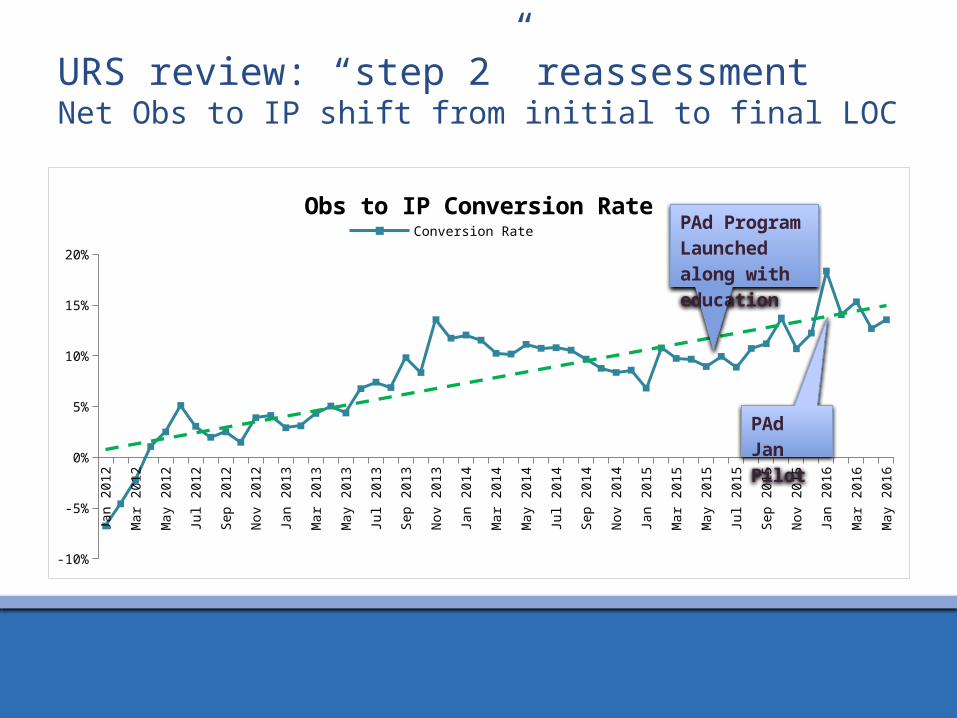
URS review: “step 2” reassessmentNet Obs to IP shift from initial to final LOC
Jan
2012
Feb
2012
Mar
201
2Ap
r 201
2M
ay 2
012
Jun
2012
Jul 2
012
Aug
2012
Sep
2012
Oct
201
2No
v 20
12De
c 201
2Ja
n 20
13Fe
b 20
13M
ar 2
013
Apr 2
013
May
201
3Ju
n 20
13Ju
l 201
3Au
g 20
13Se
p 20
13O
ct 2
013
Nov
2013
Dec 2
013
Jan
2014
Feb
2014
Mar
201
4Ap
r 201
4M
ay 2
014
Jun
2014
Jul 2
014
Aug
2014
Sep
2014
Oct
201
4No
v 20
14De
c 201
4Ja
n 20
15Fe
b 20
15M
ar 2
015
Apr 2
015
May
201
5Ju
n 20
15Ju
l 201
5Au
g 20
15Se
p 20
15O
ct 2
015
Nov
2015
Dec 2
015
Jan
2016
Feb
2016
Mar
201
6Ap
r 201
6M
ay 2
016
-10%
-5%
0%
5%
10%
15%
20%
Obs to IP Conversion RateConversion Rate Linear (Conversion Rate)
PAd Program Launched along with education
PAd Jan Pilot

Trends in LOC at discharge January Pilot
(PAd OBS list review)• patients that needed
step 2 review Significant difference from
baseline P-value =
0.0000397

Revisit the storyUnexpected Benefits
Finding other beneficial operational impacts to our surprise:• Throughput: length of stay example• Quality Metrics: CMI stable despite reduction in LOS

LOC Trends: Observation LOS > 2 MNSuccess in one Hospital illustrating need for a system wide initiative
2015 Q1 2015 Q2 2015 Q3 2015 Q4 2016 Q1 2016 Q2 Annualized0
50
100
150
200
250
300
350
400
450
388403
370
217
9672
RGH Observation Discharges with LOS >2 MDNRGH
Num
ber o
f Disc
harg
es

Impacting throughput
Jan Feb Mar Apr May0
1
2
3
4
5
6
7
LOS Trends (2015 vs 2016)
2015 Operational LOS
2016 Operational LOS
2015 IP LOS
2016 IP LOS
2015 Obs LOS
2016 Obs LOS

Impacting throughput
- 0.10 0.20 0.30 0.40 0.50 0.60 0.70 0.80
Avg Operational LOS Decrease;
0.45
Avg IP LOS Decrease;
0.73
Avg Obs LOS Decrease; 0.43
LOS Change 2016 vs 2015
0% 5% 10% 15% 20% 25% 30%
Avg % Change Operational LOS;
10%
Avg % Change IP LOS; 12%
Avg % Change Obs LOS; 27%
LOS Percent Change

CMI: IP vs. Obs Trend 2016-1st QtrPatient Class Trends (note IP obs switch highlighted)
Discharge Percent
Discharge Count
Row Labels 2015 2016 2015 2016 Difference NWH NEWARK WAYNE HOSPITAL 14.88% 15.21% 7497 1993
Boarder Baby 0.04% 0.00% 3
-0.04% Hospice Inpatient 0.56% 0.60% 42 12 0.04% Inpatient 61.45% 60.36% 4607 1203 -1.09% Newborn 9.55% 8.98% 716 179 -0.57% Observation 22.02% 24.94% 1651 497 2.92% Psych Inpatient 6.36% 5.12% 477 102 -1.24% Surgery Admit 0.01% 0.00% 1
-0.01%
RGH ROCHESTER GENERAL HOSPITAL 85.12% 84.79% 42888 11110 Acute Rehab Inpatient 0.31% 0.00% 133
-0.31%
Hospice Inpatient 0.23% 0.32% 98 36 0.10% Inpatient 63.49% 68.82% 27229 7646 5.33% Newborn 5.40% 4.70% 2315 522 -0.70% Observation 28.35% 24.19% 12158 2688 -4.15% Psych Inpatient 2.15% 1.94% 922 216 -0.21% SNF Inpatient 0.00% 0.00% 1
0.00%
Surgery Admit 0.07% 0.02% 32 2 -0.06%
No significant change for NWCH
Large shift from Obs to IP at RGH

CMI Trends by Hospital
CMI Trends all Discharges excluding Obs PATIENT_CLASS (Multiple Items)
Column Labels Row Labels 2015 2016 NWH NEWARK WAYNE HOSPITAL Discharge Count 5846 1496 Average of
BILL_DRG_WEIGHT 1.0062 1.0745 106.8% RGH ROCHESTER GENERAL HOSPITAL
Discharge Count 30730 8422 Average of
BILL_DRG_WEIGHT 1.5290 1.5513 101.5%

Understanding if more IP has an impact
CMI Trends all Discharges including Obs proxy (.44 CMI) PATIENT_CLASS (Multiple Items)
Column Labels Row Labels 2015 2016 NWH NEWARK WAYNE HOSPITAL Discharge Count 7497 1993 Average of
BILL_DRG_WEIGHT 1.0042 1.0740 106.9% RGH ROCHESTER GENERAL HOSPITAL
Discharge Count 42888 11110 Average of
BILL_DRG_WEIGHT 1.5239 1.5493 101.7%

LOC optimization: Impact on LOS & CMI
IP discharges have increased at RGH through better UR processes and this has resulted in:• Shorter IP LOS• Shorter Obs LOS• No current impact to CMI

Revisit the story: DenialsA Level of Care example
Don’t forget to monitor downstream impacts of work For Concurrent Level of Care this means denials!• Compare performance and trend it!

Vendor vs PAd Concurrent Review Volume and Outcomes (including denials)
PAd Denials
Vendor Denials
0%10%
20%30%
40%50%
60%70%
80%90%
100%
26
23
3
40
3
5
Denials as a result of ReferralOverturned Pending Upheld

Denial Management Instituted Peer to Peer denial discussion with Insurance Medical Directors Created denial escalation process for cases with P2P timeframe for Physician Advisor review

Telling the CDI Data story
One of our first undertakings as new program Used PAd referrals as an escalation for:• Unanswered queries• Queries that were disagreed with that showed a compelling
reason to reconsider Used this data to show the initial value of the PAd
program • ROI: Income generator vs. a cost center

CDI Facilitation
How queries come to PAd and what happens to them.
Average change in CDI rates as a result of PAd. Statistically significant using a contingency test!

Sharing the Results!
Run the stats! Share the work with
the team!

Showing the value of CDI
Used CMI differences to calculate increase in compensation • Find CMI difference• Multiply times base payment rate• Keep track of all your discrete cases and final outcomes!• This all equals ROI!!!

Feedback and Questions?