napa plant site restoration project south unit breach 2010 water quality monitoring
TRANSCRIPT

NAPA PLANT SITE NAPA PLANT SITE RESTORATION PROJECTRESTORATION PROJECT
SOUTH UNIT BREACH 2010SOUTH UNIT BREACH 2010
Water Quality MonitoringWater Quality Monitoring
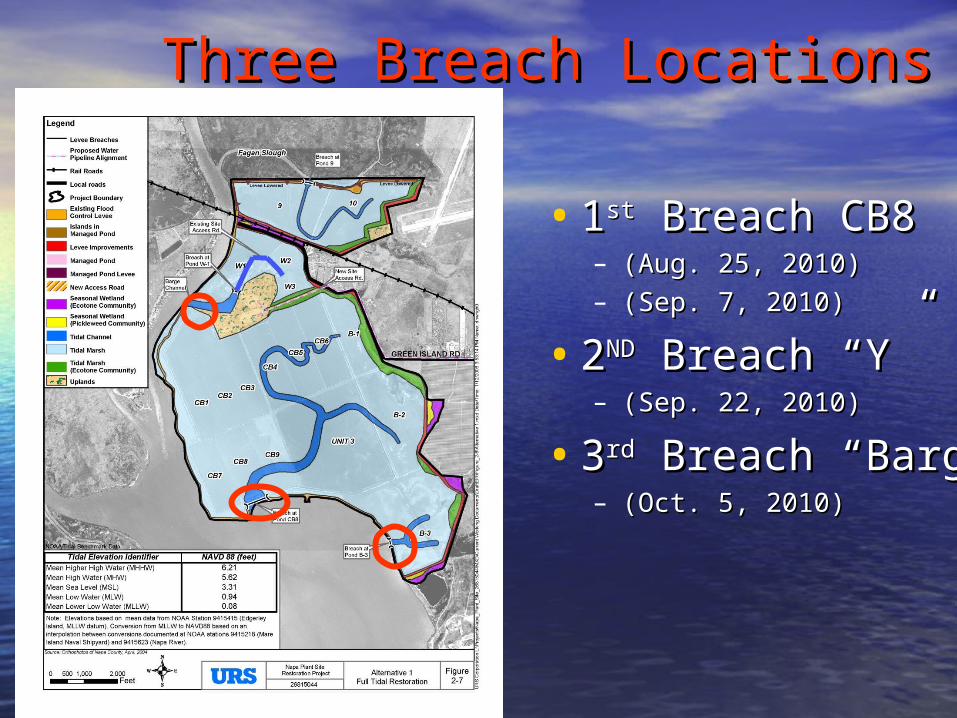
Three Breach LocationsThree Breach Locations
• 11stst Breach CB8 Breach CB8 – (Aug. 25, 2010)(Aug. 25, 2010)– (Sep. 7, 2010)(Sep. 7, 2010)
• 22NDND Breach “Y” Breach “Y” – (Sep. 22, 2010)(Sep. 22, 2010)
• 33rdrd Breach “Barge” Breach “Barge” – (Oct. 5, 2010)(Oct. 5, 2010)

Water Quality Monitoring Water Quality Monitoring South Unit Breach 2010South Unit Breach 2010
Photo BeforePhoto Before Photo AfterPhoto After

Water Quality CollectionWater Quality Collection
• Out going tide, based on adjusted Out going tide, based on adjusted tide schedule of Brazos Bridgetide schedule of Brazos Bridge
• 2 Hach Sondes- one was deployed 2 Hach Sondes- one was deployed to collect hourly readings of to collect hourly readings of salinity.salinity.

Water Quality ParametersWater Quality Parameters
• SalinitySalinity
• TurbidityTurbidity
• pHpH
• Dissolved OxygenDissolved Oxygen
• Specific ConductivitySpecific Conductivity
• TemperatureTemperature

SU-CB8
NR-4
NR-3
NR-2
NR-1NU-B
Desalting Monitoring Locations
CU-B-150U
SU-P4
SU-P2
SU-P3Fisheries Monitoring Locations
Previous Breach Monitoring Locations
Planning Unit
Channel
SU-B3
SU-CB2CU-B-150D
SU-P1
SU-US
SU-C
SU-DS
NU-B-150U
NU-B-150D
CU-B
Desalting Monitoring Locations (Short-Term)
Notes:
1. Sample locations may be adjusted as close as possible to their proposed location based on field conditions and accessibility.
Water Water Quality Quality
Monitoring Monitoring Plan Plan
LocationsLocations

SU-CB8
NR-4
NR-3
NR-2
NR-1NU-B
Desalting Monitoring Locations
CU-B-150U
SU-P4
SU-P2
SU-P3Fisheries Monitoring Locations
Previous Breach Monitoring Locations
Planning Unit
Channel
SU-B3
SU-CB2CU-B-150D
SU-P1
SU-US
SU-C
SU-DS
NU-B-150U
NU-B-150D
CU-B
Desalting Monitoring Locations (Short-Term)
Notes:
1. Sample locations may be adjusted as close as possible to their proposed location based on field conditions and accessibility.
Salinity Salinity ReductioReduction Breachn Breach
CB8CB8

Salinity Reduction Breach at Salinity Reduction Breach at CB8 CB8
August 24, 2010- 1 day prior to breach August 25, 2010- day of breach


Figure C-3. Salinity Napa River and Breach CB8 8-20-10 to 10-7-10
0
5
10
15
20
25
30
35
40
8/20
/201
0
8/23
/201
0
8/24
/201
0
8/25
/201
0
8/26
/201
0
8/27
/201
0
8/28
/201
0
8/29
/201
0
8/30
/201
0
8/31
/201
0
9/1/
2010
9/2/
2010
9/3/
2010
9/4/
2010
9/5/
2010
9/6/
2010
9/7/
2010
9/8/
2010
9/9/
2010
9/15
/201
0
9/22
/201
0
9/23
/201
0
9/27
/201
0
9/30
/201
0
10/4
/201
0
10/5
/201
0
10/6
/201
0
10/7
/201
0
Date
Sal
init
y (p
pt)
SU-CB8 1 ft. NR-4 NR-3
SRB SRB Widening Y Breach Barge Breach

Continuous Sonde at CB8Continuous Sonde at CB8
220-Ft
70-Ft

Figure C-1. Salinity CB8 Continuous Sonde- Hourly Readings (8-27-10 to 9-23-10)
0.00
5.00
10.00
15.00
20.00
25.00
30.00
35.00
40.00
45.008/
27/1
0
8/28
/10
8/29
/10
8/30
/10
8/31
/10
9/1/
10
9/2/
10
9/3/
10
9/4/
10
9/5/
10
9/6/
10
9/7/
10
9/8/
10
9/9/
10
9/10
/10
9/11
/10
9/12
/10
9/13
/10
9/14
/10
9/15
/10
9/16
/10
9/17
/10
9/18
/10
9/19
/10
9/20
/10
9/21
/10
9/22
/10
9/23
/10
Date
Sal
init
y (p
pt)
SRB Widening Y Breach

SU-CB8
NR-4
NR-3
NR-2
NR-1NU-B
Desalting Monitoring Locations
CU-B-150U
SU-P4
SU-P2
SU-P3Fisheries Monitoring Locations
Previous Breach Monitoring Locations
Planning Unit
Channel
SU-B3
SU-CB2CU-B-150D
SU-P1
SU-US
SU-C
SU-DS
NU-B-150U
NU-B-150D
CU-B
Desalting Monitoring Locations (Short-Term)
Notes:
1. Sample locations may be adjusted as close as possible to their proposed location based on field conditions and accessibility.
Water Water Quality Quality
MonitorinMonitoring Internal g Internal
UnitsUnits

Figure C-2. Salinity Internal Sites Compared with Napa River 8-20-10 to 10-7-10
0
10
20
30
40
50
60
70
8/20
/201
0
8/23
/201
0
8/24
/201
0
8/25
/201
0
8/26
/201
0
8/27
/201
0
8/28
/201
0
8/29
/201
0
8/30
/201
0
8/31
/201
0
9/1/
2010
9/2/
2010
9/3/
2010
9/4/
2010
9/5/
2010
9/6/
2010
9/7/
2010
9/8/
2010
9/9/
2010
9/15
/201
0
9/22
/201
0
9/23
/201
0
9/27
/201
0
9/30
/201
0
10/4
/201
0
10/5
/201
0
10/6
/201
0
10/7
/201
0
Date
Sa
lin
ity
(p
pt)
SU-P1 SU-P4 SU-P3 SU-P2 1 ft. NR-4
SRBSRB Widening Y Breach Barge breach
300 (ppt) range

SU-CB8
NR-4
NR-3
NR-2
NR-1NU-B
Desalting Monitoring Locations
CU-B-150U
SU-P4
SU-P2
SU-P3Fisheries Monitoring Locations
Previous Breach Monitoring Locations
Planning Unit
Channel
SU-B3
SU-CB2CU-B-150D
SU-P1
SU-US
SU-C
SU-DS
NU-B-150U
NU-B-150D
CU-B
Desalting Monitoring Locations (Short-Term)
Notes:
1. Sample locations may be adjusted as close as possible to their proposed location based on field conditions and accessibility.
““Y” Y” BreachBreachSU-B3SU-B3


Figure C-5. Salinity "Y" 2nd Breach SU-B3, SU-P3, SU-DS, and NR4
0
5
10
15
20
25
30
35
9/15
/201
0
9/21
/201
0
9/22
/201
0
9/23
/201
0
9/27
/201
0
9/30
/201
0
10/4
/201
0
10/5
/201
0
10/6
/201
0
10/7
/201
0
Date
Sa
linit
y (
pp
t)
SU-P3 SU-DS NR-4 SU-B3
Y Breach

Figure C-4. Salinity SU-P2, CB8, SU-B3, Mudflats, and Napa River 8-20-10 to 10-7-10
0
5
10
15
20
25
30
35
40
8/20
/201
0
8/23
/201
0
8/24
/201
0
8/25
/201
0
8/26
/201
0
8/27
/201
0
8/28
/201
0
8/29
/201
0
8/30
/201
0
8/31
/201
0
9/1/
2010
9/2/
2010
9/3/
2010
9/4/
2010
9/5/
2010
9/6/
2010
9/7/
2010
9/8/
2010
9/9/
2010
9/15
/201
0
9/22
/201
0
9/23
/201
0
9/27
/201
0
9/30
/201
0
10/4
/201
0
10/5
/201
0
10/6
/201
0
10/7
/201
0
Date
Sal
inity
(ppt
)
SU-P2 1 ft. SU-CB8 1 ft. SU-US SU-C SU-DS NR-4 SU-B3
330 SRB SRB Widening Y Breach Barge Breach

SU-CB8
NR-4
NR-3
NR-2
NR-1NU-B
Desalting Monitoring Locations
CU-B-150U
SU-P4
SU-P2
SU-P3Fisheries Monitoring Locations
Previous Breach Monitoring Locations
Planning Unit
Channel
SU-B3
SU-CB2CU-B-150D
SU-P1
SU-US
SU-C
SU-DS
NU-B-150U
NU-B-150D
CU-B
Desalting Monitoring Locations (Short-Term)
Notes:
1. Sample locations may be adjusted as close as possible to their proposed location based on field conditions and accessibility.
““Barge” Barge” BreachBreachSU-CB2SU-CB2


Figure C- 6. Salinity "Barge Channel" 3rd Breach SU-CB2, SU-P1 and Napa River
05
101520253035
9/7
/20
10
9/8
/20
10
9/9
/20
10
9/1
5/2
01
0
9/2
1/2
01
0
9/2
2/2
01
0
9/2
3/2
01
0
9/2
7/2
01
0
9/3
0/2
01
0
10
/4/2
01
0
10
/5/2
01
0
10
/6/2
01
0
10
/7/2
01
0
Date
Sa
lin
ity
(p
pt)
SU-P1 NR-3 NR-2 SU-CB2
Barge BreachSRB Widening Y Breach

• Overall the decrease in salinity Overall the decrease in salinity followed the projected models, followed the projected models, allowing the Napa Plant Site to allowing the Napa Plant Site to gradually transition to ambient gradually transition to ambient conditions (Napa River). This gradual conditions (Napa River). This gradual process made the salinity reduction process made the salinity reduction phase a success. phase a success.

• There is still an existing salt crust There is still an existing salt crust inside the unit that appears to be inside the unit that appears to be slowly dissolving as expected.slowly dissolving as expected.

TurbidityTurbidity
Figure B-5. Turbidity 8-20-10 to 9-4-10
0
10
20
30
40
50
60
70
80
90
100
8/2
0/2
010
8/2
3/2
010
8/2
4/2
010
8/2
5/2
010
8/2
6/2
010
8/2
7/2
010
8/2
8/2
010
8/2
9/2
010
8/3
0/2
010
8/3
1/2
010
9/1
/2010
9/2
/2010
9/3
/2010
9/4
/2010
Date
NT
U
SU-CB8 1 ft. SU-CB8 3 ft. SU-US SU-C SU-DS NR-4 NR-3
SRB
177 NTU
Figure B-6. Turbidity (continued) 9-5-10 to 10-7-10
0102030405060708090
100
9/5
/2010
9/6
/2010
9/7
/2010
9/8
/2010
9/9
/2010
9/1
5/2
010
9/2
2/2
010
9/2
3/2
010
9/2
7/2
010
9/3
0/2
010
10/4
/2010
10/5
/2010
10/6
/2010
10/7
/2010
Date
NT
U
SU-CB8 1 ft. SU-CB8 3 ft. SU-US SU-C SU-DS NR-4 NR-3 NR-2 CU-B- 150U CU-B-150D SU-CB2 SU-B3
SRB Widening Y Breach Barge Breach
113 & 117 NTU

ChallengesChallenges• Complex monitoring schedule in Complex monitoring schedule in
conjunction with permit regulations conjunction with permit regulations and multiple breachesand multiple breaches
• Tide depth and time of sampling Tide depth and time of sampling versus mudflats and boat access.versus mudflats and boat access.
• Continuous Sonde deployment issuesContinuous Sonde deployment issues

Wildlife ResponseWildlife Response
• ShorebirdsShorebirds
• Salmonids and other fish species Salmonids and other fish species
• Harbor seals Harbor seals
• WaterfowlWaterfowl

Thank you to GAIA, DFG, Cargill and DU for this Thank you to GAIA, DFG, Cargill and DU for this great opportunity.great opportunity.
Questions?Questions?