narrabri coal operations pty ltd - rw corkery€¦ · · 2013-03-13narrabri coal mine stage 2...
TRANSCRIPT
Narrabri Coal Mine Stage 2 Longwall Project
Hydrogeological Assessment
Prepared by:
Aquaterra Consulting Pty Ltd
November 2009
Specialist Consultant Studies Compendium
Volume 1, Part 2
Narrabri Coal Operations Pty Ltd ABN: 15 129 850 139

SPECIALIST CONSULTANT STUDIES 2 - 1 NARRABRI COAL OPERATIONS PTY LTD Part 2 – Hydrogeological Assessment Narrabri Coal Mine – Stage 2 Longwall Project Report No. 674/17
Narrabri Coal Operations Pty Ltd ABN: 15 129 850 139
Narrabri Coal Mine Stage 2 Longwall Project
Hydrogeological Assessment Prepared for: R.W. Corkery & Co. Pty. Limited Level 1, 12 Dangar Road PO Box 239 BROOKLYN NSW 2083 Tel: (02) 9985 8511 Fax: (02) 9985 8208 Email: [email protected] On behalf of: Narrabri Coal Operations Pty Ltd Level 9, 1 York Street PO Box R1113 SYDNEY NSW 1225 Tel: (02) 8507 9700 Fax: (02) 8507 9701 Email: [email protected] Prepared by: Aquaterra Consulting Pty Ltd Suite 9, 1051 Pacific Highway PYMBLE NSW 2073
Tel: (02) 9440 2666 Fax: (02) 9449 3193
Email: [email protected]
November, 2009

NARRABRI COAL OPERATIONS PTY LTD 2 - 2 SPECIALIST CONSULTANT STUDIES Narrabri Coal Mine – Stage 2 Longwall Project Part 2 – Hydrogeological Assessment Report No. 674/17
COPYRIGHT
© Aquaterra Consulting Pty Ltd, 2009
and © Narrabri Coal Operations Pty Ltd, 2009
All intellectual property and copyright reserved.
Apart from any fair dealing for the purpose of private study, research, criticism or review, as permitted under the Copyright Act, 1968, no part of this report may be reproduced, transmitted, stored in a retrieval system or adapted in any form or by any means (electronic, mechanical, photocopying, recording or otherwise) without written permission. Enquiries should be addressed to Aquaterra Consulting Pty Ltd.
SPECIALIST CONSULTANT STUDIES 2 - 3 NARRABRI COAL OPERATIONS PTY LTD Part 2 – Hydrogeological Assessment Narrabri Coal Mine – Stage 2 Longwall Project Report No. 674/17
CONTENTS Page
EXECUTIVE SUMMARY .......................................................................................................2-9
1. INTRODUCTION ........................................................................................................2-15
1.1 Background .......................................................................................................2-15
1.2 Report Objectives ..............................................................................................2-15
1.3 Director General’s Requirements.......................................................................2-16
1.4 Relevant State Policies and Guidelines .............................................................2-16
1.5 Water Licensing.................................................................................................2-17
2. PREVIOUS GROUNDWATER INVESTIGATIONS .....................................................2-17
2.1 Previous Investigations......................................................................................2-17
2.2 Lower Namoi Valley: History of Groundwater Modelling ....................................2-18
2.3 Upper Namoi Valley: History of Groundwater Modelling ....................................2-19
2.4 Summary of Groundwater Investigations Undertaken by GHD...........................2-19
2.4.1 Stage 1 Piezometer / Monitoring Bore Installation................................2-19
2.4.2 Stage 1 Hydraulic Testing ....................................................................2-20
2.4.3 Other Hydraulic Testing .......................................................................2-23
2.5 Groundwater Flow Regime ................................................................................2-23
2.6 Surface Water....................................................................................................2-24
2.7 Groundwater Monitoring Program......................................................................2-24
2.7.1 Groundwater Levels .............................................................................2-24
2.7.2 Groundwater Quality ............................................................................2-24
2.8 Beneficial Use Assessment ...............................................................................2-26
2.9 Census of Groundwater Occurrence and Use....................................................2-26
2.9.1 Registered Bores .................................................................................2-26
2.9.2 Exploration Data ..................................................................................2-27
2.10 Stage 1 Groundwater Modelling.........................................................................2-28
2.10.1 Hydrostratigraphy.................................................................................2-28
2.10.2 Aquifer Parameters ..............................................................................2-28
2.10.3 Results.................................................................................................2-29
3. STAGE 2 GROUNDWATER INVESTIGATIONS ........................................................2-29
3.1 Overview and Purpose of Stage 2 Investigations...............................................2-29
3.2 Site Investigations..............................................................................................2-29
3.2.1 Groundwater Monitoring Bores ............................................................2-29
3.2.2 Census of Groundwater Use ................................................................2-30
3.2.3 Groundwater Levels/Pressures ............................................................2-33
3.2.4 Hydraulic Testing .................................................................................2-33
3.2.5 Groundwater Quality ............................................................................2-35
3.3 Groundwater Modelling......................................................................................2-36
4. DESCRIPTION OF THE EXISTING ENVIRONMENT.................................................2-36
4.1 Topographical Setting........................................................................................2-36
4.2 Climate ..............................................................................................................2-36
4.2.1 Rainfall.................................................................................................2-37
4.2.2 Evaporation..........................................................................................2-37
4.3 Geology .............................................................................................................2-37
4.3.1 Regional Geology ................................................................................2-37
4.3.2 Mine Site Geology................................................................................2-38
NARRABRI COAL OPERATIONS PTY LTD 2 - 4 SPECIALIST CONSULTANT STUDIES Narrabri Coal Mine – Stage 2 Longwall Project Part 2 – Hydrogeological Assessment Report No. 674/17
CONTENTS Page
4.4 Hydrogeology.................................................................................................... 2-40
4.4.1 Groundwater Occurrence .................................................................... 2-40
4.4.2 Groundwater Levels and Flow Patterns............................................... 2-41
4.4.3 Aquifer Parameters – Estimates of Hydraulic Conductivity .................. 2-42
4.5 Groundwater Quality ......................................................................................... 2-43
4.5.1 Salinity ................................................................................................ 2-43
4.5.2 pH ....................................................................................................... 2-44
4.5.3 Dissolved Metals ................................................................................. 2-44
4.5.4 Major Ion Composition......................................................................... 2-44
4.6 Recharge and Discharge................................................................................... 2-45
4.7 Groundwater - Surface Water Interactions ........................................................ 2-46
4.8 Current Groundwater Use ................................................................................. 2-46
5. MINING PROPOSAL ................................................................................................. 2-47
5.1 Longwall Mining Proposal ................................................................................. 2-47
5.2 Mining Schedule ............................................................................................... 2-47
5.3 Subsidence Predictions..................................................................................... 2-47
5.4 Mine Water Management .................................................................................. 2-48
6. GROUNDWATER MODELLING TO ASSESS POTENTIAL IMPACTS ...................... 2-48
6.1 Model Software ................................................................................................. 2-48
6.2 Conceptual Model Design ................................................................................. 2-49
6.2.1 Model Domain and Boundary Conditions............................................. 2-49
6.2.2 Model Layers....................................................................................... 2-50
6.2.3 Baseflow.............................................................................................. 2-51
6.2.4 Recharge............................................................................................. 2-52
6.3 Calibration......................................................................................................... 2-52
6.3.1 Calibration Approach........................................................................... 2-52
6.3.2 Steady State Calibration...................................................................... 2-53
6.3.3 Steady State Baseflow ........................................................................ 2-55
6.3.4 Transient Model Calibration................................................................. 2-56
6.3.5 Calibration Outcomes.......................................................................... 2-57
6.4 Sensitivity Analysis............................................................................................ 2-58
6.5 Predictive Modelling .......................................................................................... 2-62
6.5.1 Time Scale Selection........................................................................... 2-62
6.5.2 Simulation of Mine Inflows................................................................... 2-64
6.5.3 Simulation of Goaf and Subsidence Fracturing.................................... 2-65
6.5.4 Predicted Mine Inflow Rates ................................................................ 2-65
6.5.5 Recovery Simulation............................................................................ 2-66
6.5.6 Predicted Water Level Drawdowns...................................................... 2-67
6.5.7 Predicted Baseflow Impacts ................................................................ 2-67
6.5.8 GAB Intake Beds................................................................................. 2-68
6.5.9 Particle Tracking.................................................................................. 2-68
6.6 Uncertainty Analysis.......................................................................................... 2-69
7. POTENTIAL GROUNDWATER IMPACTS OF THE PROJECT.................................. 2-71
7.1 Potential Impacts of Subsidence Fracturing from Longwall Mining .................... 2-71
7.2 Groundwater Inflows ......................................................................................... 2-72
SPECIALIST CONSULTANT STUDIES 2 - 5 NARRABRI COAL OPERATIONS PTY LTD Part 2 – Hydrogeological Assessment Narrabri Coal Mine – Stage 2 Longwall Project Report No. 674/17
CONTENTS Page
7.3 Groundwater Level Impacts ...............................................................................2-73
7.3.1 Predicted Impacts on Groundwater Levels in the Permian Coal
Measures .............................................................................................2-74
7.3.2 Predicted Impacts on Groundwater Levels in the Triassic and
Jurassic Formations.............................................................................2-74
7.3.3 Potential Impacts on Groundwater Levels in the Quaternary Alluvium
and Colluvium / Regolith ......................................................................2-75
7.4 Quality of Groundwater Inflows..........................................................................2-75
7.5 Potential Impacts on the Namoi River and its Associated Alluvium ....................2-76
7.6 Potential Impacts on Great Artesian Basin Intake Beds .....................................2-77
7.7 Potential Impacts of Brine Re-injection ..............................................................2-77
7.8 Potential Impacts on Existing Groundwater Users .............................................2-78
7.9 Potential Impacts on Groundwater Dependent Ecosystems...............................2-79
7.10 Groundwater Licensing......................................................................................2-79
8. MONITORING AND MANAGEMENT..........................................................................2-80
8.1 Impacts from Groundwater Extraction / Dewatering ...........................................2-80
8.2 Subsidence Impact Monitoring...........................................................................2-81
8.3 Review and Reporting .......................................................................................2-81
9. CONTINGENCY RESPONSE PLANS........................................................................2-82
9.1 Recommendation for Development of Response Plans .....................................2-82
9.2 Water Levels......................................................................................................2-82
9.3 Groundwater Quality..........................................................................................2-83
10. SUMMARY AND CONCLUSIONS..............................................................................2-83
10.1 Existing Hydrogeological Environment...............................................................2-83
10.2 Prediction of Mining Related Impacts.................................................................2-84
10.3 Management and Monitoring of Impacts ............................................................2-87
11. REFERENCES ...........................................................................................................2-87
NARRABRI COAL OPERATIONS PTY LTD 2 - 6 SPECIALIST CONSULTANT STUDIES Narrabri Coal Mine – Stage 2 Longwall Project Part 2 – Hydrogeological Assessment Report No. 674/17
CONTENTS Page
TABLES
Table 1.1: Director General’s Requirements ................................................................... 2-16
Table 2.1: Stage 1 Groundwater Monitoring Bore Construction Details........................... 2-20
Table 2.2: Falling Head Testing Results (GHD, 2006 and RCA, 2007) ........................... 2-21
Table 2.3: Sigra Permeability Test Results ..................................................................... 2-21
Table 2.4: Summary of Permeability Data from Regional Petroleum Wells ..................... 2-23
Table 2.5: Summary of Groundwater pH and Salinity Data ............................................. 2-25
Table 2.6: Summary of Groundwater Intersections during Exploration Drilling ................ 2-27
Table 3.1: Groundwater Monitoring Bores (August 2008) ............................................... 2-31
Table 3.2: Permeability Testing Results (GHD - 2006; RCA – 2007; Aquaterra - 2008) .. 2-34
Table 4.1: Average Monthly Rainfall (mm/day) ............................................................... 2-37
Table 4.2: Average Monthly Potential Evaporation Rates (mm/day) ............................... 2-37
Table 4.3: Hydrogeological Units and Hydraulic Conductivity Values Used in Groundwater Model Development.................................................................. 2-43
Table 6.1: Steady State Calibration Performance of the Longwall Project Model ............ 2-54
Table 6.2: Steady State Model Calibration – Groundwater Level Targets ....................... 2-54
Table 6.3: Groundwater Budget for Narrabri Model Steady-State Calibration ................. 2-55
Table 6.4: River Baseflow - Steady State Calibration...................................................... 2-56
Table 6.5: Transient Calibration Performance of the Groundwater Model ....................... 2-57
Table 6.6: Groundwater Budget for Narrabri Model Transient Calibration ....................... 2-57
Table 6.7: Calibrated Narrabri Model Aquifer Parameters............................................... 2-58
Table 6.8: Parameters, Zones and the Multipliers Tested in the Sensitivity Analysis....... 2-59
Table 6.9: Sensitivity Analysis of Horizontal and Vertical Hydraulic Conductivity Values in the Narrabri Model...................................................................................... 2-60
Table 6.10: Sensitivity Analysis of Recharge .................................................................... 2-61
Table 6.11: Narrabri Model Stress Period Setup............................................................... 2-63
Table 6.12: Predicted Annual Narrabri Pit Inflow Rates (Base Case)................................ 2-66
Table 6.13: Mine Area Hydraulic Conductivity Values for Uncertainty Analysis Simulations (m/d) ........................................................................................... 2-70
Table 8.1: Recommended Laboratory Analysis Suite for Groundwater ........................... 2-80
SPECIALIST CONSULTANT STUDIES 2 - 7 NARRABRI COAL OPERATIONS PTY LTD Part 2 – Hydrogeological Assessment Narrabri Coal Mine – Stage 2 Longwall Project Report No. 674/17
CONTENTS
FIGURES
Figure 1.1: Project Location Plan
Figure 2.1: Piper Diagram - Groundwater Quality Stage 1
Figure 3.1: Locations of Piezometers and Registered Bores
Figure 4.1: Regional Geology Gunnedah Region
Figure 4.2: Geology of Boggabri – Narrabri Area
Figure 4.3: Narrabri Cross Section
Figure 4.4: Groundwater Contours
Figure 4.5: Geophysical Log for NC029
Figure 4.6: Temperature Log for NC109 and NC112
Figure 4.7: Groundwater Quality TDS (mg/L)
Figure 4.8: Groundwater Quality pH
Figure 4.9: Piper Diagram - Groundwater Quality Stage 2
Figure 4.10: Location of Known Groundwater Springs
Figure 5.1: Mine Plan Schedule
Figure 6.1: Groundwater Conceptual Model and Model Domain
Figure 6.2: Scatter Plot for Narrabri Steady State Calibration
Figure 6.3: Year 0 Groundwater Levels in Alluvium / Colluvium (Layer 1)
Figure 6.4: Year 0 Groundwater Levels in Garrawilla Volcanics (Layer 4)
Figure 6.5: Year 0 Groundwater Levels in Napperby Formation (Layer 5)
Figure 6.6: Year 0 Groundwater Levels in Hoskissons Seam (Layer 9)
Figure 6.7: Reach Location Map
Figure 6.8: Sensitivity Analysis
Figure 6.9: Underground Mine Inflow Rate
Figure 6.10: Mass Balance in Digby Formation (Layer 8), Hoskissons Seam (Layer 9 and Arkarula Formation (Layer 10)
Figure 6.11: Year 15 Groundwater Levels in Alluvium / Colluvium (Layer 1)
Figure 6.12: Year 29 Groundwater Levels in Alluvium / Colluvium (Layer 1)
Figure 6.13: Drawdown after 15 Years in Alluvium / Colluvium (Layer 1)
Figure 6.14: Drawdown after 29 Years in Alluvium / Colluvium (Layer 1)
Figure 6.15: Drawdown after 15 Years in Garrawilla Volcanics (Layer 4)
Figure 6.16: Drawdown after 29 Years in Garrawilla Volcanics (Layer4)
Figure 6.17: Drawdown after 15 Years in Napperby Formation (Layer 5)
Figure 6.18: Drawdown after 29 Years in Napperby Formation (Layer 5)
Figure 6.19: Drawdown after 15 Years in Hoskissons Seam (Layer 9)
Figure 6.20: Drawdown after 29 Years in Hoskissons Seam (Layer 9)
Figure 6.21: Drawdown after 130 Year in Alluvium / Colluvium (Layer 1)
Figure 6.22: Drawdown after 130 Year in Pilliga Sandstone (Layer 2)
Figure 6.23: Drawdown after 130 Year in Napperby Formation (Layer 5)
Figure 6.24: Drawdown after 130 Year in Hoskissons Seam (Layer 9)
Figure 6.25: Particle Tracking in Layers 2,3 and 4.
Figure 6.26: Particle Tracking in Layers 5,6,7,8 and 9.

NARRABRI COAL OPERATIONS PTY LTD 2 - 8 SPECIALIST CONSULTANT STUDIES Narrabri Coal Mine – Stage 2 Longwall Project Part 2 – Hydrogeological Assessment Report No. 674/17
CONTENTS
Figure 6.27: Predicted Baseflows Over Mining Period
Figure 6.28: Predicted Baseflows Over Mining and Recovery Period
Figure 6.29: Uncertainty Analysis Mine Inflow Dewatering Rates
Figure 7.1: Predicted Mine Inflow Salinity Concentrations
Figure 7.2: Drawdown after 29 Years in Alluvium / Colluvium (Layer 1) and Location of Local Bores
SPECIALIST CONSULTANT STUDIES 2 - 9 NARRABRI COAL OPERATIONS PTY LTD Part 2 – Hydrogeological Assessment Narrabri Coal Mine – Stage 2 Longwall Project Report No. 674/17
EXECUTIVE SUMMARY
Background
This groundwater assessment report has been prepared by Aquaterra Consulting Pty Ltd
(Aquaterra) for R W Corkery & Co Pty Ltd (Corkery) to support an application by Narrabri Coal
Operations Pty Ltd (NCOPL) for the Stage 2 Longwall Project at the Narrabri Coal Mine (the
Longwall Project).
In March 2007, an Environmental Assessment (EA) was lodged for Stage 1 of the Narrabri
Coal Mine (Corkery, 2007), which related to the proposed development of surface
infrastructure and initial underground mine development, with coal production by first workings
at up to 2.5 Mtpa. Groundwater investigations were undertaken for Stage 1 during 2006 by
GHD. That investigation included aquifer testing, hydrochemical analysis and groundwater
modelling. Stage 1 of the Narrabri Coal Project was granted project approval by the Minister
for Planning on 13 November 2007.
NCOPL is now proposing to develop Stage 2 of the mine, which comprises the development of
longwall mining operations for the extraction of coal at up to 8 Mtpa. This groundwater
assessment report has been prepared to support the Stage 2 Longwall Project application.
The objective of this report is to provide sufficient information on the state of the groundwater
environment within the Mine Site (ML1609) and surrounding areas, and to assess the potential
impacts on groundwater levels and quality from development of the Longwall Project. This has
been done to ensure that any concerns regarding groundwater and surface water resources,
groundwater dependent ecosystems and existing groundwater users are addressed to the
satisfaction of the Minister for Planning and the NSW Office of Water.
Stage 2 groundwater investigations were undertaken between June 2008 and August 2009.
These investigations aimed to verify aquifer parameters by further hydraulic testing of existing
boreholes and installation and testing of new monitoring boreholes, and to update impact
predictions by further groundwater modelling. The monitoring network has been expanded to
26 bores, which were sampled and tested for groundwater levels, aquifer characteristics and
groundwater quality.
Existing Hydrogeological Environment
Based on the findings of the Stage 1 and Stage 2 investigations, the following key conclusions
have been drawn about the hydrogeology of the region about the Longwall Project:
• Two distinct aquifer types have been identified within the Longwall Project area:
- A shallow unconfined aquifer that is found within the regolith layer (weathered
bedrock), including occasional fracturing at the top of the underlying fresh
rock. It occurs as a semi-continuous layer across the sub-cropping Permian-
Jurassic strata. The occurrence of localised fracturing and associated higher
permeability is particularly notable in the upper parts of the Garrawilla
Volcanics.
- A deeper fractured rock aquifer system that occurs throughout the
stratigraphic sequence, with standing water levels generally at depths greater
than 50 m below ground level.

NARRABRI COAL OPERATIONS PTY LTD 2 - 10 SPECIALIST CONSULTANT STUDIES Narrabri Coal Mine – Stage 2 Longwall Project Part 2 – Hydrogeological Assessment Report No. 674/17
• The Pilliga Sandstone, which forms one of the major intake beds for the Great
Artesian Basin (GAB) overlaps the western part of the Mine Site, but is not
saturated within the Mine Site area.
• The alluvium associated with the Namoi River to the east does not occur within
the Mine Site, and the Hoskissons Seam does not sub-crop beneath the Namoi
River alluvium. There is therefore no direct hydrogeological connection between
the proposed mine and the Namoi River alluvium.
• Horizontal hydraulic conductivities determined from testing ranged from 3 x 10⁻⁴
m/d to 2.5 x 10⁻¹ m/d. The highest conductivity in the rock units was recorded
within the Garrawilla Volcanics within the sub-crop zone. The highest
conductivities within the deeper aquifers occur within the Hoskissons Seam and
underlying Arkarula Formation.
• Although higher hydraulic conductivities have been found within the subcrop
zone of the Garrawilla Volcanics, high inflows from this formation have not been
encountered during construction of the mine access drifts. This suggests that
these more conductive zones are localised.
• Groundwater salinity is variable. Deeper groundwater is generally saline, with
measured total dissolved solids (TDS) ranging up to more than 16 800 mg/L.
Localised fresher groundwater zones occur in the shallow aquifers, with
measured salinities as low as 100 mg/L TDS. Salinity of groundwater in the
Hoskissons Seam is variable, ranging from 1350mg/L to 9070mg/L TDS.
• Major ion chemistry within the groundwater samples indicates that there are three
distinct zones of water chemistry within the stratigraphic sequence. These
distinct differences in groundwater quality indicate that, in the pre-mining
condition, there is very little vertical connectivity between the rock strata that
occur beneath the Longwall Project.
Prediction of Mining-Related Impacts
The two main potential impacts of proposed longwall mining on the hydrogeological
environment were considered to be:
• Localised and to a lesser extent regional lowering of groundwater levels within
the Permian-Jurassic strata, due to groundwater inflows to the mine workings,
particularly as a result of enhanced permeability of the rock units within the
subsidence affected zone above the longwall extraction areas. Some lowering of
groundwater levels may also occur as a result of increased rock storativity due to
the stress relief fracturing associated with the underground mining.
• Possible impacts on near-surface groundwater, including the alluvial groundwater
system of the Namoi Valley, and groundwater baseflow contributions to the
Namoi River and other surface drainages.
Subsidence predictions are that maximum subsidence would range from 1.6m in the eastern
part of the longwall mining area where cover depth is around 160m, to 2.4m in the west where
cover depth reaches 380m. Continuous fracturing associated with this subsidence is predicted
to extend from the coal seam to below the base of the Garrawilla Volcanics, but could extend
into the Garrawilla Volcanics if adverse geological conditions are encountered. The predicted
SPECIALIST CONSULTANT STUDIES 2 - 11 NARRABRI COAL OPERATIONS PTY LTD Part 2 – Hydrogeological Assessment Narrabri Coal Mine – Stage 2 Longwall Project Report No. 674/17
height of continuous/connected fracturing therefore varies from around 45m below ground
level (bgl) in the shallowest parts of the mine to around 200m bgl in the deepest parts of the
mine.
The most likely hydrogeological impact is based on the expectation that continuous
subsidence fracturing from the longwall panels will not intersect the more permeable sub-crop
zone of the Garrawilla Volcanics. Should hydraulically continuous fracturing extend into the
Garrawilla Volcanics, it has been assessed that marginally higher inflows could occur.
However, the subsidence prediction is that this is unlikely.
Numerical groundwater modelling has been used to predict mine inflows and impacts on
groundwater levels and baseflows, both locally and regionally. Principal findings of the
modelling include the following:
• The base case predictive modelling simulation predicted that groundwater inflows
to underground workings would gradually increase over the first 20 years of
mining from an initial 80 ML/a (0.22 ML/d) in Year 1 to a peak inflow rate of 1394
ML/a (3.82 ML/d) in Mine Year 20, before declining steadily thereafter to a rate of
365 ML/a (1.0 ML/d) in the final year of the project.
• Large drawdowns are predicted to occur within the Permian coal measures close
to the mine, as a result of groundwater flows into the mine workings. The
drawdown cone is predicted to be relatively steep, and drawdowns exceeding 10
m would be limited to around 6 km to 7 km to the west, north and south, and
around 2 km to the east of the underground workings. The Permian drawdown
impact would extend much less to the east, where it would be limited by the
truncation of the coal seam by an overlying unconformity. The region of greater
than 1 m predicted drawdown in the Hoskissons Seam extends approximately 20
km to the west, 10km from the mined areas to the south and to the north, but not
to the east where the seam is absent.
• Predicted groundwater level impacts in the overlying Triassic Napperby
Formation at the end of mining are much less pronounced. Drawdowns of 1m or
more are predicted to extend a maximum of approximately 10km to the west of
the Mine Site.
• Impacts on Jurassic strata would be extremely small, and there will be effectively
no measurable impact above the Purlawaugh Formation aquitard (ie. in the Great
Artesian Basin beds).
• Predicted drawdowns in the surficial unconsolidated aquifer at the end of mining
are very small, generally less than 1 m except for a small area immediately
overlying the mine workings.
• Predicted impacts on river baseflows are very small. The most impacted river
reach is the closest section of the Namoi River to the east (model reach 11).
Baseflow in this reach is predicted to reduce by a maximum of around 0.22 ML/d,
but this is only 2% of the total calculated baseflow contribution to this reach of
around 10.3 ML/d.
• Post-mining, baseflows in all reaches of the Namoi River are predicted to recover
to levels equal to pre-mining baseflows following 100 years of recovery.
NARRABRI COAL OPERATIONS PTY LTD 2 - 12 SPECIALIST CONSULTANT STUDIES Narrabri Coal Mine – Stage 2 Longwall Project Part 2 – Hydrogeological Assessment Report No. 674/17
• Post-mining potential for offsite migration of re-injected brine is limited to 1 km in
Jurassic Strata and less than 2 km in Triassic-Permian strata after 100 years of
recovery. Particle tracking simulation has shown that no saline water will migrate
up into the Pilliga Formation.
Overall, these results indicate that the following impacts on water resources may occur due to
the Stage 2 Longwall Project:
• There will be negligible impact on groundwater within the Pilliga Sandstone, and
hence a negligible (less than 0.03ML/d) impact on recharge to the GAB.
• Negligible impacts on groundwater levels in the Namoi Valley alluvium are
predicted, and existing groundwater users will not be affected.
• Continuous/connected fracturing induced by longwall mining has the potential to
significantly impact groundwater stored in the fractured rock aquifers above the
mine (up to the base of the Garrawilla Volcanics). The potential for impact on
other local groundwater users is mitigated by NCOPL’s acquisition of several
properties within the anticipated zone of impact. However, a commitment to
mitigate potential impacts on other groundwater users should be included within
the Site Water Management Plan. One bore (WB2) located over LW26 and
screened within the Garrawilla Volcanics is expected to be impacted. This bore
is located on property owned by NCOPL. No other registered bores are expected
to be impacted.
Sensitivity and uncertainly analysis has been carried out to assess the sensitivity of the model
calibration to the assumed input parameters and boundary conditions, and the effect of
uncertainty on predicted rates and impacts.
Sensitivity analysis was carried out on hydraulic conductivity (horizontal and vertical) and
recharge. The model was found to be not highly sensitive to either horizontal or vertical
hydraulic conductivity of the in-situ rock strata. However, model-predicted mine inflows are
very sensitive to the assumed vertical hydraulic conductivities of the subsidence-affected strata
directly above the extracted longwall panels, but is less sensitive to the height of connected/
continuous fracturing assumed in the modelling.
The predicted impacts from the base case model are considered to be best estimates
according to experience and a thorough consideration of the hydrogeological conditions of the
Longwall Project area. However, as there is no prior history of longwall mining in the
Gunnedah Basin, some uncertainty in inflow predictions will remain until mining of the first few
longwall panels has been undertaken, and the pattern of subsidence-fracturing and
permeability changes has been monitored and evaluated. Accordingly, a range of higher than
expected vertical permeabilities has been tested with the groundwater model, to provide an
upper limit or worst case assessment of groundwater inflows and impacts. Monitoring of
groundwater responses to the Stage 1 continuous miner operation will be of limited value, or
there will be no significant subsidence associated with Stage 1. A program of careful
monitoring has been recommended for the first 3 longwall panels, to provide definitive data on
rock behaviour following subsidence. It is recommended also that assessment of potential
mine inflows and re-calibration of the groundwater model should be carried out on a regular
basis, with an initial re-evaluation 6 - 12 months after commencement of longwall extraction.
SPECIALIST CONSULTANT STUDIES 2 - 13 NARRABRI COAL OPERATIONS PTY LTD Part 2 – Hydrogeological Assessment Narrabri Coal Mine – Stage 2 Longwall Project Report No. 674/17
Management and Monitoring of Impacts
Although impacts from the proposed project are generally anticipated to be small, a monitoring
programme and contingency response plan will be required to validate predictions and mitigate
any detrimental impacts that occur during mining. Proposed recommendations for these
programmes are contained within this report, and include:
• Monitoring of mine inflows and water imported into the mine for longwall
operation and other underground uses.
• Monitoring of volumes pumped from any water supply or dewatering bores.
• Monthly manual monitoring, or continuous automated monitoring, of water
levels/pressures from the network of monitoring bores.
• Water quality monitoring of mine inflows and groundwater in monitoring
piezometers.
• Monitoring of Mayfield Spring and other springs located to the south of the mine
site.
• Ongoing subsidence monitoring and monitoring of permeability changes caused
by subsidence.
• Periodic data review by a suitable, experienced hydrogeologist.
• Periodic review and validation of the groundwater model predictions.
Procedures are presented for investigation and response action if data indicate that impacts on
groundwater level or quality are greater than trigger values, or if complaints are received by
other groundwater users.

NARRABRI COAL OPERATIONS PTY LTD 2 - 14 SPECIALIST CONSULTANT STUDIES Narrabri Coal Mine – Stage 2 Longwall Project Part 2 – Hydrogeological Assessment Report No. 674/17
This page has intentionally been left blank
SPECIALIST CONSULTANT STUDIES 2 - 15 NARRABRI COAL OPERATIONS PTY LTD Part 2 – Hydrogeological Assessment Narrabri Coal Mine – Stage 2 Longwall Project Report No. 674/17
1. INTRODUCTION
1.1 Background
This groundwater assessment report has been prepared by Aquaterra Consulting Pty Ltd
(Aquaterra) for R W Corkery & Co Pty Ltd (Corkery) to support an application by Narrabri Coal
Operations Pty Ltd (NCOPL) for the Stage 2 Longwall Project at the Narrabri Coal Mine (the
Longwall Project).
The Narrabri Coal Mine is located within Mining Licence (ML) 1609 and is approximately 30 km
southeast of Narrabri (Figure 1.1).
In March 2007, an Environmental Assessment (EA) was lodged for Stage 1 of the Narrabri
Coal Mine (Corkery, 2007), which related to the proposed development of surface
infrastructure and initial underground mine development, with coal production by first workings
using a continuous miner at up to 2.5 Mtpa.
Groundwater investigations were undertaken for Stage 1 during 2006 by GHD. That
investigation included aquifer testing, hydrochemical analysis and groundwater modelling.
Stage 1 of the Narrabri Coal Project was granted project approval by the Minister for Planning
on 13 November 2007.
NCOPL is now proposing to develop Stage 2 of the mine, which comprises the development of
longwall mining operations for the extraction of coal at up to 8 Mtpa.
Stage 2 groundwater investigations have been undertaken between June 2008 and August
2009. These investigations aimed to verify aquifer parameters by further testing of existing
boreholes, obtain additional hydraulic data through the installation and testing of new
monitoring boreholes, and update impact predictions by further groundwater modelling. The
monitoring network has been expanded to 26 bores, which were sampled and tested for
groundwater levels, aquifer characteristics and groundwater quality. The bores continue to be
monitored regularly as part of an ongoing baseline monitoring program.
1.2 Report Objectives
This groundwater assessment report has been prepared in support of NCOPL’s application for
the Longwall Project. The report describes the present state of the groundwater environment
within the Mine Site and immediate surrounds, and assesses the potential impacts on
groundwater levels and quality, and on groundwater baseflows, from the Longwall Project. This
has been done to ensure that any concerns regarding groundwater and surface water
resources, groundwater dependent ecosystems and existing groundwater users are addressed
to the satisfaction of the Minister for Planning.
This report is structured as follows:
• Section 2 contains a summary of previous groundwater investigations undertaken
in the Mine Site, pre- March 2007.
• Section 3 contains the details of the additional groundwater investigations
undertaken, specifically in relation to Stage 2, between March 2007 and August
2009.
NARRABRI COAL OPERATIONS PTY LTD 2 - 16 SPECIALIST CONSULTANT STUDIES Narrabri Coal Mine – Stage 2 Longwall Project Part 2 – Hydrogeological Assessment Report No. 674/17
• Section 4 presents a description of the existing environment in the vicinity of the
project.
• Section 5 outlines the mining proposal and gives a brief summary of the
proposed operations and water supply demands of the project.
• Section 6 describes the groundwater modelling work undertaken to aid in the
assessment of potential groundwater impacts of the proposed project.
• Section 7 contains a detailed outline of the potential impacts of the project on
inflows, groundwater levels, groundwater quality, baseflows to Namoi River and
other streams, the Great Artesian Basin, existing users, and groundwater
dependent ecosystems.
• Section 8 details the monitoring and management recommendations.
• Section 9 presents recommendations for contingency response plans to address
any unforeseen adverse impacts on groundwater and/or surface water.
• Section 10 provides a summary and conclusions from this study.
• Section 11 contains a list of references.
1.3 Director General’s Requirements
In accordance with Section 75F of the EP&A Act, the Department of Planning has issued the
Director General’s requirements for the preparation of the Environmental Assessment for
Stage 2 of the Narrabri Coal Project. The requirements relating to groundwater have been
addressed within this report as detailed in Table 1.1.
Table 1.1: Director General’s Requirements
Director General’s Requirement Relevant Section of Report
A description of the existing environment Section 4
Assessment of the potential impacts of all stages of the project including any cumulative impacts associated with the concurrent operation of the project with any other existing or approved mining operation, taking into consideration any relevant guidelines, policies, plans and statutory provisions - Assessment of the potential impacts on the quantity, quality and long-term integrity of the groundwater resources.
Sections 6 and 7
Description of the measures that would be implemented to avoid, minimize, mitigate, rehabilitate/remediate, monitor and/or offset the potential impacts of the project including detailed contingency plans for managing any significant risks to the environment.
Sections 8 and 9
1.4 Relevant State Policies and Guidelines
This report has also been prepared with due consideration of relevant state policies and
guidelines including:
• National Water Quality Management Strategy Guidelines for Groundwater
Protection in Australia (ARMCANZ / ANZECC).
SPECIALIST CONSULTANT STUDIES 2 - 17 NARRABRI COAL OPERATIONS PTY LTD Part 2 – Hydrogeological Assessment Narrabri Coal Mine – Stage 2 Longwall Project Report No. 674/17
• NSW Groundwater Policy Framework Document (DLWC).
• NSW Groundwater Quality Protection Policy (DLWC).
• NSW Groundwater Quantity Management Policy (DLWC).
• NSW State Groundwater Dependent Ecosystems Policy (DLWC).
• Murray-Darling Basin Groundwater Quality Sampling Guidelines. Technical
Report 3 (MDBC).
• Murray-Darling Basin Commission Groundwater Flow Modelling Guidelines
(MDBC).
• NSW Great Artesian Basin Groundwater Sources Water Sharing Plan (DECCW).
• Upper and Lower Namoi Groundwater Water Sharing Plan (DECCW).
• Guidelines for the Assessment and Management of Groundwater Contamination
(DEC).
1.5 Water Licensing
Groundwater licences under Part 5 of the Water Act 1912 will be required for the following
activities:
• Extraction of water from the underground mine;
• Production bores for water supply or dewatering purposes; and
• Monitoring piezometers for water level and quality monitoring, and test pumping.
It should be noted that Part 5 licences will be required for any extraction of groundwater,
including incidental inflows to the mine. Licensing of activities, water use, water works and
approvals is currently effected under the Water Act (1912). It is anticipated that the Water Act
will be repealed in 2010, and will be replaced by the Water Management Act (2000) (WMA),
and any Part 5 groundwater licences would be transitioned to Access Licences under the
WMA.
Any discharge of surplus mine water to the environment will be managed in accordance with
the site’s Environmental Protection Licence.
2. PREVIOUS GROUNDWATER INVESTIGATIONS
2.1 Previous Investigations
Several previous investigations of groundwater, surface water, geology and geotechnics have
been undertaken on the area within and surrounding the Mine Site. Reports that have been
produced on those studies include:
• Narrabri Coal Project Groundwater Assessment: Prepared by GHD Pty Ltd,
March 2007.
• Bicarbonate Occurrence in Groundwater in the Baan Baa Area, NSW: Prepared
by Water Resources Consulting Services, 1997.
NARRABRI COAL OPERATIONS PTY LTD 2 - 18 SPECIALIST CONSULTANT STUDIES Narrabri Coal Mine – Stage 2 Longwall Project Part 2 – Hydrogeological Assessment Report No. 674/17
• Final Report – Exploration Licence 537: Prepared by ICI Australia Ltd, 1973.
• Narrabri Coal Project Surface Water Assessment: Prepared by WRM Water and
Environment Pty Ltd, March 2007.
• Narrabri Coal Project Geological Assessment: Prepared by Belford Dome
Resource Assessment, March 2007.
• Narrabri Coal Project Subsidence Assessment: Prepared by Mining Geotechnical
Services Pty Ltd, March 2007.
• Narrabri Coal Project Groundwater Management Plan: Prepared by Coffey
Geotechnics Pty Ltd, July 2008.
2.2 Lower Namoi Valley: History of Groundwater Modelling
The Namoi Valley is a palaeochannel, 3 to 10 km in width, and contains a sequence of non-
marine alluvial deposits of Tertiary and Quaternary age, which range in thickness up to 120 m.
The palaeochannel initially trends westerly from the town of Narrabri, and then south-westerly
towards Cryon.
A mature numerical groundwater flow model exists for the saturated alluvial aquifer system of
the lower Namoi Valley (i.e. the Namoi Valley north of the town of Narrabri). It has undergone a
series of revisions since 1982, with changes in conceptualisation, modelling software and
computer hardware. It was developed with MODFLOW finite difference software, using the
PMWIN Version 5.0 graphic user interface in a Windows environment. Revisions to the
groundwater model have been carried out as follows (dates next to each model refer to the
timespan covered by the model run, and dates in square brackets refer to the date the model
was constructed):
• Narrabri to Merah North, 1969-1981 [1982]
• Narrabri to Cryon, 1969-1982 [1984]
• Narrabri to Cryon, 1981-1986 [1989]
• Narrabri to Cryon, 1987-1994 [1995]
• Narrabri to Cryon, 1980-1994 [1998]
• Narrabri to Cryon, 1980-1998 [1999].
The conceptual model used in historical modelling comprises three aquifers:
• Layer 1: Narrabri Formation;
• Layer 2: Gunnedah Formation; and
• Layer 3: Cubbaroo Formation.
The model has been subjected to post-audit re-calibration on several occasions, and external
peer review.
SPECIALIST CONSULTANT STUDIES 2 - 19 NARRABRI COAL OPERATIONS PTY LTD Part 2 – Hydrogeological Assessment Narrabri Coal Mine – Stage 2 Longwall Project Report No. 674/17
2.3 Upper Namoi Valley: History of Groundwater Modelling
The upper Namoi Valley is that part of the valley upstream (south) of the town of Narrabri. The
Namoi River flows in a generally north-north-westerly direction, and passes some 5 km to the
east of the Narrabri Stage 2 Longwall Project.
Groundwater models based on MODFLOW software also exist for the Upper Namoi Valley.
The valley is flanked by a buried basement ridge on its western side and shallow basement
with colluvial cover on its eastern side. Three models exist for the upper Namoi Valley (dates
next to each model refer to the time span covered by the model run, and dates in square
brackets refer to the date the model was constructed):.
• Upper Namoi, Gunnedah to Narrabri, 1981-1986 [1989]
• Borambil Creek, Zone 1, 1981-1986 [c1997]
• Upper Namoi, Breeza to Gunnedah, Zone 3, 1980-1996 [1999].
2.4 Summary of Groundwater Investigations Undertaken by GHD
GHD were commissioned by R W Corkery & Co Pty Ltd to undertake a groundwater
assessment for Stage 1 of the Narrabri Coal Project.
This investigation included the following work:
• Drilling, installation and hydraulic testing of groundwater monitoring bores
(piezometers) and test production bores.
• Groundwater level and groundwater quality monitoring.
• Collection of data on registered/licensed and other privately-owned groundwater
sources.
• Review of hydrogeological and other relevant reports produced for Narrabri Coal
Pty Ltd.
• Numerical groundwater modelling for predicting potential impacts.
The results of this investigation were presented in GHD (2007). RCA (2007) were also
engaged to conduct separate hydraulic tests on the Stage 1 piezometers.
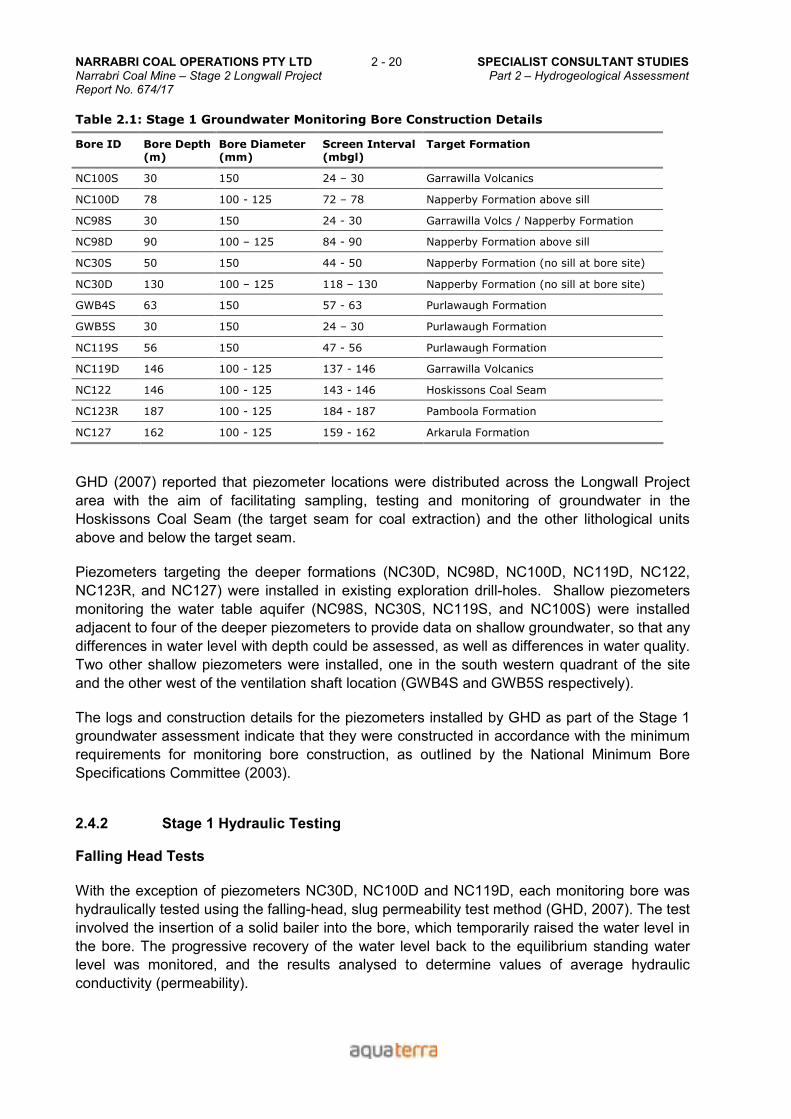
2.4.1 Stage 1 Piezometer / Monitoring Bore Installation
Thirteen monitoring bores were installed at nine locations across EL6243. Construction details
and the geological formations targeted in each monitoring bore are summarised in Table 2.1.
NARRABRI COAL OPERATIONS PTY LTD 2 - 20 SPECIALIST CONSULTANT STUDIES Narrabri Coal Mine – Stage 2 Longwall Project Part 2 – Hydrogeological Assessment Report No. 674/17
Table 2.1: Stage 1 Groundwater Monitoring Bore Construction Details
Bore ID Bore Depth (m)
Bore Diameter (mm)
Screen Interval (mbgl)
Target Formation
NC100S 30 150 24 – 30 Garrawilla Volcanics
NC100D 78 100 - 125 72 – 78 Napperby Formation above sill
NC98S 30 150 24 - 30 Garrawilla Volcs / Napperby Formation
NC98D 90 100 – 125 84 - 90 Napperby Formation above sill
NC30S 50 150 44 - 50 Napperby Formation (no sill at bore site)
NC30D 130 100 – 125 118 – 130 Napperby Formation (no sill at bore site)
GWB4S 63 150 57 - 63 Purlawaugh Formation
GWB5S 30 150 24 – 30 Purlawaugh Formation
NC119S 56 150 47 - 56 Purlawaugh Formation
NC119D 146 100 - 125 137 - 146 Garrawilla Volcanics
NC122 146 100 - 125 143 - 146 Hoskissons Coal Seam
NC123R 187 100 - 125 184 - 187 Pamboola Formation
NC127 162 100 - 125 159 - 162 Arkarula Formation
GHD (2007) reported that piezometer locations were distributed across the Longwall Project
area with the aim of facilitating sampling, testing and monitoring of groundwater in the
Hoskissons Coal Seam (the target seam for coal extraction) and the other lithological units
above and below the target seam.
Piezometers targeting the deeper formations (NC30D, NC98D, NC100D, NC119D, NC122,
NC123R, and NC127) were installed in existing exploration drill-holes. Shallow piezometers
monitoring the water table aquifer (NC98S, NC30S, NC119S, and NC100S) were installed
adjacent to four of the deeper piezometers to provide data on shallow groundwater, so that any
differences in water level with depth could be assessed, as well as differences in water quality.
Two other shallow piezometers were installed, one in the south western quadrant of the site
and the other west of the ventilation shaft location (GWB4S and GWB5S respectively).
The logs and construction details for the piezometers installed by GHD as part of the Stage 1
groundwater assessment indicate that they were constructed in accordance with the minimum
requirements for monitoring bore construction, as outlined by the National Minimum Bore
Specifications Committee (2003).
2.4.2 Stage 1 Hydraulic Testing
Falling Head Tests
With the exception of piezometers NC30D, NC100D and NC119D, each monitoring bore was
hydraulically tested using the falling-head, slug permeability test method (GHD, 2007). The test
involved the insertion of a solid bailer into the bore, which temporarily raised the water level in
the bore. The progressive recovery of the water level back to the equilibrium standing water
level was monitored, and the results analysed to determine values of average hydraulic
conductivity (permeability).

SPECIALIST CONSULTANT STUDIES 2 - 21 NARRABRI COAL OPERATIONS PTY LTD Part 2 – Hydrogeological Assessment Narrabri Coal Mine – Stage 2 Longwall Project Report No. 674/17
Results of the bore hydraulic testing undertaken by GHD and RCA are summarised in
Table 2.2. For reference, the results of all tests are presented in the Stage 1 groundwater
assessment report (GHD, 2007; RCA, 2007).
Table 2.2: Falling Head Testing Results (GHD, 2006 and RCA, 2007)
Hydraulic Conductivity (m/d) Bore ID New Bore ID Screen Interval (m bgl)
GHD – 2006 RCA - 2007
Target Formation
GWB4S - 57 – 63 1.1 x 10⁻³ - Purlawaugh Formation
GWB5S P9 24 – 30 4.1 x 10⁻¹ - Purlawaugh Formation
NC100S P15 24 – 30 4.7 x 10⁻² - Garrawilla Volcanics
NC98S P13 24 – 30 6.8 x 10⁻² - Garrawilla Volcanics / Napperby Formation
NC98D P12 84 – 90 1.6 x 10⁻³ - Napperby Formation above sill
NC30S P11 44 – 50 7.0 x 10⁻⁴ - Napperby Formation (no sill at bore site)
NC122 P18 143 – 146 8.6 x 10⁻³ 8.6 x 10⁻³ Hoskissons Coal Seam
NC127 P20 159 – 162 1.2 x 10⁻² 1.2 x 10⁻² Arkarula Formation
NC123R P19 184 – 187 2.1 x 10⁻³ 2.8 x 10⁻³ Pamboola Formation
Permeability tests undertaken by GHD in March 2006 were evaluated using the Bouwer Rice
Method (Bouwer and Rice, 1976) for both unconfined aquifers in the shallow holes and the
confined aquifers in the deeper holes. Hydraulic testing undertaken by RCA in February 2007
was evaluated using the Hvorslev method (Hvorslev, 1951).
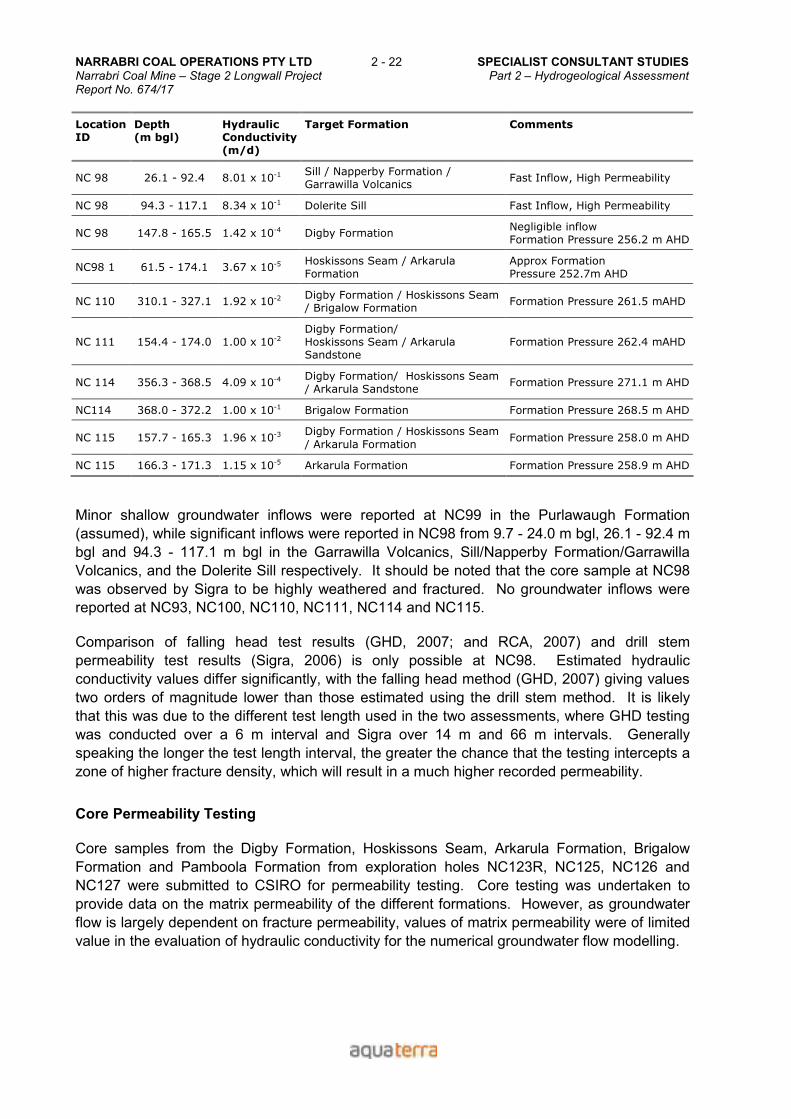
Sigra Permeability Testing
Drill stem testing (DST) or packer testing was undertaken by Sigra at eight locations in 2006.
Table 2.3 provides a summary of the test locations, tested intervals, hydraulic conductivity
results and target formations for the Sigra permeability tests.
Table 2.3: Sigra Permeability Test Results
Location ID
Depth (m bgl)
Hydraulic Conductivity (m/d)
Target Formation Comments
NC93 301.1 - 313.4 4.21 x 10⁻³ Hoskissons Coal Seam / Arkarula Formation
Formation Pressure 252.5 m AHD
NC99 179.8 - 210.3 1.26 x 10⁻² Hoskissons Coal Seam / Arkarula Formation
Formation Pressure 250.2 m AHD
NC100 147.4 - 130.0 9.17 x 10⁻⁵ Dolerite Sill Negligible Inflow Formation Pressure 261.8 m AHD
NC100 147.5 - 177.3 8.34 x 10⁻⁶ Napperby Formation below sill
Negligible Inflow Formation Pressure 248.8 m AHD
NC100 174.6 - 195.0 9.17 x 10⁻⁵ Digby Formation Negligible Inflow Formation Pressure 266.9 m AHD
NC100 197.9 - 212.5 4.00 x 10⁻³ Hoskissons Coal Seam / Arkarula Formation
Formation Pressure 265.8 m AHD
NC 98 9.7 –24.0 Approx 8 Garrawilla Volcanics Fast Recovery, very High permeability
NARRABRI COAL OPERATIONS PTY LTD 2 - 22 SPECIALIST CONSULTANT STUDIES Narrabri Coal Mine – Stage 2 Longwall Project Part 2 – Hydrogeological Assessment Report No. 674/17
Location ID
Depth (m bgl)
Hydraulic Conductivity (m/d)
Target Formation Comments
NC 98 26.1 - 92.4 8.01 x 10⁻¹ Sill / Napperby Formation / Garrawilla Volcanics
Fast Inflow, High Permeability
NC 98 94.3 - 117.1 8.34 x 10⁻¹ Dolerite Sill Fast Inflow, High Permeability
NC 98 147.8 - 165.5 1.42 x 10⁻⁴ Digby Formation Negligible inflow Formation Pressure 256.2 m AHD
NC98 1 61.5 - 174.1 3.67 x 10⁻⁵ Hoskissons Seam / Arkarula Formation
Approx Formation Pressure 252.7m AHD
NC 110 310.1 - 327.1 1.92 x 10⁻² Digby Formation / Hoskissons Seam / Brigalow Formation
Formation Pressure 261.5 mAHD
NC 111 154.4 - 174.0 1.00 x 10⁻² Digby Formation/ Hoskissons Seam / Arkarula Sandstone
Formation Pressure 262.4 mAHD
NC 114 356.3 - 368.5 4.09 x 10⁻⁴ Digby Formation/ Hoskissons Seam / Arkarula Sandstone
Formation Pressure 271.1 m AHD
NC114 368.0 - 372.2 1.00 x 10⁻¹ Brigalow Formation Formation Pressure 268.5 m AHD
NC 115 157.7 - 165.3 1.96 x 10⁻³ Digby Formation / Hoskissons Seam
/ Arkarula Formation Formation Pressure 258.0 m AHD
NC 115 166.3 - 171.3 1.15 x 10⁻⁵ Arkarula Formation Formation Pressure 258.9 m AHD
Minor shallow groundwater inflows were reported at NC99 in the Purlawaugh Formation
(assumed), while significant inflows were reported in NC98 from 9.7 - 24.0 m bgl, 26.1 - 92.4 m
bgl and 94.3 - 117.1 m bgl in the Garrawilla Volcanics, Sill/Napperby Formation/Garrawilla
Volcanics, and the Dolerite Sill respectively. It should be noted that the core sample at NC98
was observed by Sigra to be highly weathered and fractured. No groundwater inflows were
reported at NC93, NC100, NC110, NC111, NC114 and NC115.
Comparison of falling head test results (GHD, 2007; and RCA, 2007) and drill stem
permeability test results (Sigra, 2006) is only possible at NC98. Estimated hydraulic
conductivity values differ significantly, with the falling head method (GHD, 2007) giving values
two orders of magnitude lower than those estimated using the drill stem method. It is likely
that this was due to the different test length used in the two assessments, where GHD testing
was conducted over a 6 m interval and Sigra over 14 m and 66 m intervals. Generally
speaking the longer the test length interval, the greater the chance that the testing intercepts a
zone of higher fracture density, which will result in a much higher recorded permeability.
Core Permeability Testing
Core samples from the Digby Formation, Hoskissons Seam, Arkarula Formation, Brigalow
Formation and Pamboola Formation from exploration holes NC123R, NC125, NC126 and
NC127 were submitted to CSIRO for permeability testing. Core testing was undertaken to
provide data on the matrix permeability of the different formations. However, as groundwater
flow is largely dependent on fracture permeability, values of matrix permeability were of limited
value in the evaluation of hydraulic conductivity for the numerical groundwater flow modelling.
SPECIALIST CONSULTANT STUDIES 2 - 23 NARRABRI COAL OPERATIONS PTY LTD Part 2 – Hydrogeological Assessment Narrabri Coal Mine – Stage 2 Longwall Project Report No. 674/17
2.4.3 Other Hydraulic Testing
Aquifer testing was undertaken by ICI in 1973 at registered bore GW017215 (northeast of the
Mine Site) and indicated a transmissivity of 0.2 m2/d in the Pamboola Formation. Bore
GW038662 intersected flows of stock quality water at 0.75 L/s at 19 m bgl, and 0.13 L/s
sodium bicarbonate water at 128 m bgl (Melville Coal Seam).
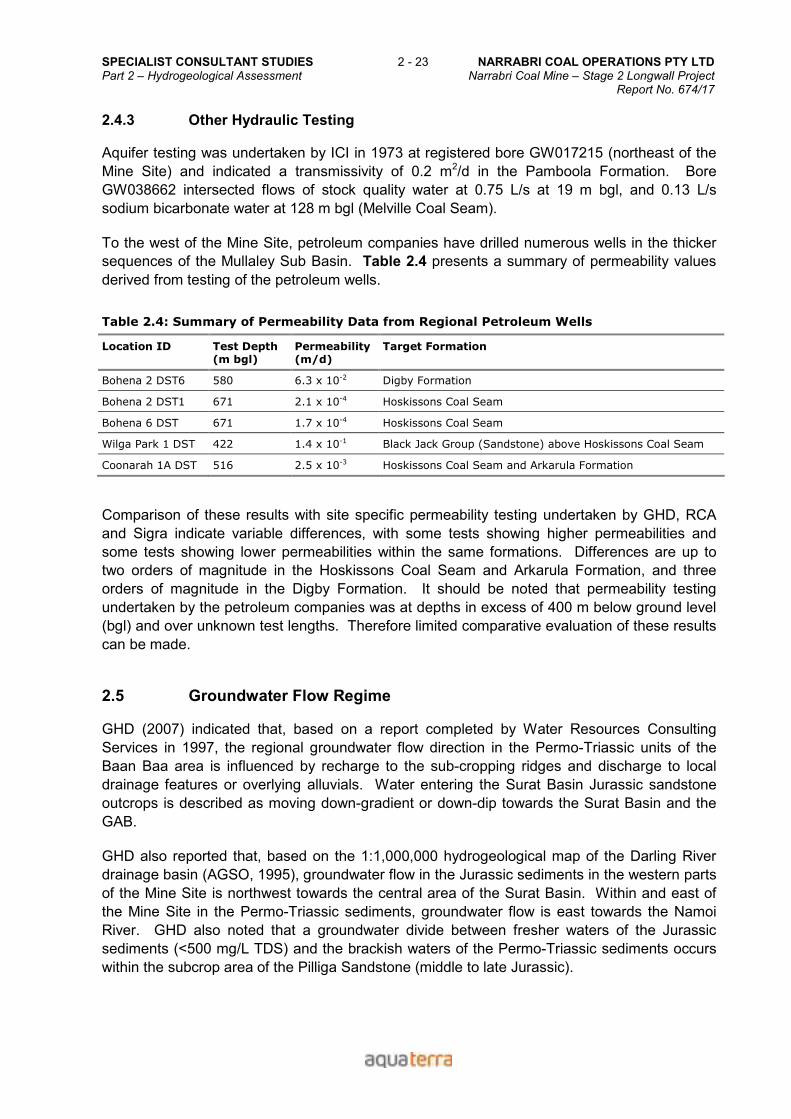
To the west of the Mine Site, petroleum companies have drilled numerous wells in the thicker
sequences of the Mullaley Sub Basin. Table 2.4 presents a summary of permeability values
derived from testing of the petroleum wells.
Table 2.4: Summary of Permeability Data from Regional Petroleum Wells
Location ID Test Depth (m bgl)
Permeability (m/d)
Target Formation
Bohena 2 DST6 580 6.3 x 10⁻² Digby Formation
Bohena 2 DST1 671 2.1 x 10⁻⁴ Hoskissons Coal Seam
Bohena 6 DST 671 1.7 x 10⁻⁴ Hoskissons Coal Seam
Wilga Park 1 DST 422 1.4 x 10⁻¹ Black Jack Group (Sandstone) above Hoskissons Coal Seam
Coonarah 1A DST 516 2.5 x 10⁻³ Hoskissons Coal Seam and Arkarula Formation
Comparison of these results with site specific permeability testing undertaken by GHD, RCA
and Sigra indicate variable differences, with some tests showing higher permeabilities and
some tests showing lower permeabilities within the same formations. Differences are up to
two orders of magnitude in the Hoskissons Coal Seam and Arkarula Formation, and three
orders of magnitude in the Digby Formation. It should be noted that permeability testing
undertaken by the petroleum companies was at depths in excess of 400 m below ground level
(bgl) and over unknown test lengths. Therefore limited comparative evaluation of these results
can be made.
2.5 Groundwater Flow Regime
GHD (2007) indicated that, based on a report completed by Water Resources Consulting
Services in 1997, the regional groundwater flow direction in the Permo-Triassic units of the
Baan Baa area is influenced by recharge to the sub-cropping ridges and discharge to local
drainage features or overlying alluvials. Water entering the Surat Basin Jurassic sandstone
outcrops is described as moving down-gradient or down-dip towards the Surat Basin and the
GAB.
GHD also reported that, based on the 1:1,000,000 hydrogeological map of the Darling River
drainage basin (AGSO, 1995), groundwater flow in the Jurassic sediments in the western parts
of the Mine Site is northwest towards the central area of the Surat Basin. Within and east of
the Mine Site in the Permo-Triassic sediments, groundwater flow is east towards the Namoi
River. GHD also noted that a groundwater divide between fresher waters of the Jurassic
sediments (<500 mg/L TDS) and the brackish waters of the Permo-Triassic sediments occurs
within the subcrop area of the Pilliga Sandstone (middle to late Jurassic).
NARRABRI COAL OPERATIONS PTY LTD 2 - 24 SPECIALIST CONSULTANT STUDIES Narrabri Coal Mine – Stage 2 Longwall Project Part 2 – Hydrogeological Assessment Report No. 674/17
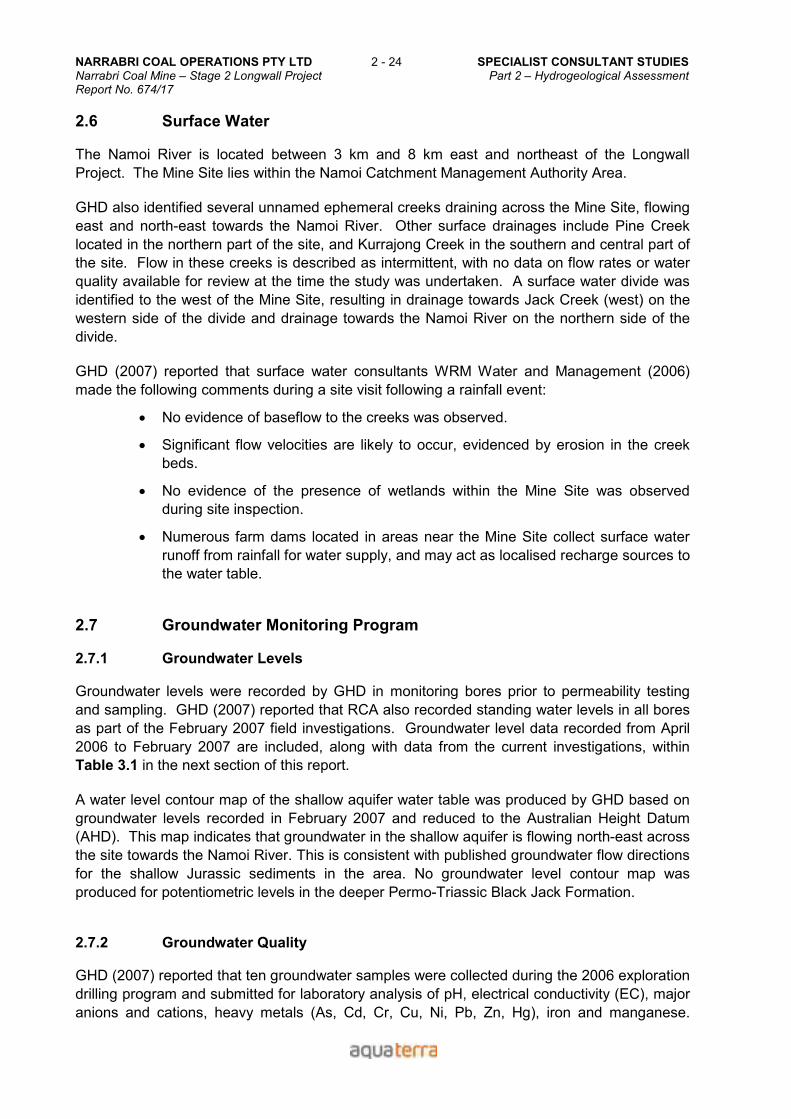
2.6 Surface Water
The Namoi River is located between 3 km and 8 km east and northeast of the Longwall
Project. The Mine Site lies within the Namoi Catchment Management Authority Area.
GHD also identified several unnamed ephemeral creeks draining across the Mine Site, flowing
east and north-east towards the Namoi River. Other surface drainages include Pine Creek
located in the northern part of the site, and Kurrajong Creek in the southern and central part of
the site. Flow in these creeks is described as intermittent, with no data on flow rates or water
quality available for review at the time the study was undertaken. A surface water divide was
identified to the west of the Mine Site, resulting in drainage towards Jack Creek (west) on the
western side of the divide and drainage towards the Namoi River on the northern side of the
divide.
GHD (2007) reported that surface water consultants WRM Water and Management (2006)
made the following comments during a site visit following a rainfall event:
• No evidence of baseflow to the creeks was observed.
• Significant flow velocities are likely to occur, evidenced by erosion in the creek
beds.
• No evidence of the presence of wetlands within the Mine Site was observed
during site inspection.
• Numerous farm dams located in areas near the Mine Site collect surface water
runoff from rainfall for water supply, and may act as localised recharge sources to
the water table.
2.7 Groundwater Monitoring Program
2.7.1 Groundwater Levels
Groundwater levels were recorded by GHD in monitoring bores prior to permeability testing
and sampling. GHD (2007) reported that RCA also recorded standing water levels in all bores
as part of the February 2007 field investigations. Groundwater level data recorded from April
2006 to February 2007 are included, along with data from the current investigations, within
Table 3.1 in the next section of this report.
A water level contour map of the shallow aquifer water table was produced by GHD based on
groundwater levels recorded in February 2007 and reduced to the Australian Height Datum
(AHD). This map indicates that groundwater in the shallow aquifer is flowing north-east across
the site towards the Namoi River. This is consistent with published groundwater flow directions
for the shallow Jurassic sediments in the area. No groundwater level contour map was
produced for potentiometric levels in the deeper Permo-Triassic Black Jack Formation.
2.7.2 Groundwater Quality
GHD (2007) reported that ten groundwater samples were collected during the 2006 exploration
drilling program and submitted for laboratory analysis of pH, electrical conductivity (EC), major
anions and cations, heavy metals (As, Cd, Cr, Cu, Ni, Pb, Zn, Hg), iron and manganese.

SPECIALIST CONSULTANT STUDIES 2 - 25 NARRABRI COAL OPERATIONS PTY LTD Part 2 – Hydrogeological Assessment Narrabri Coal Mine – Stage 2 Longwall Project Report No. 674/17
Groundwater samples were also collected by Water Resources Consulting Services (1997)
from six supply bores within 5 km of the Mine Site in 1997. Eastern Star Gas and Whitehaven
Coal Mining Pty Ltd provided groundwater quality data for bores intersecting the Hoskissons
Coal Seam to the west and approximately 60 km south (Sunnyside Mine) of the Mine Site
respectively. No information on sample collection methodology for these groundwater samples
was detailed in the GHD report.
The GHD evaluation of groundwater data from the vicinity of the Mine Site indicated pH to be
in the neutral to slightly alkaline range (6.0 to 8.7 pH units). Salinity results ranged from fresh
(<1000 mg/L TDS) in the Garrawilla Volcanics and Napperby Formation to saline (>15 000
mg/L TDS) in the Purlawaugh Formation and the Basalt Sill.
Table 2.5 presents a summary of these results.
Table 2.5: Summary of Groundwater pH and Salinity Data
Formation Number of Samples
Groundwater pH Groundwater TDS (mg/L)
Purlawaugh Formation 4 6.25 – 8.0 1 140 – 16 250
Garrawilla Volcanics 6 6.27 – 8.1 684 – 11 400
Napperby Formation 6 6.65 – 7.9 708 – 10 200
Basalt Sill 3 7.4 – 8.7 1 860 – 16 250
Napperby Formation (below Sill) 1 7.8 8 310
Digby Formation 0 - -
Hoskissons Coal Seam 1 8.5 1 350
Arkarula Formation 1 7.05 7 740
Pamboola Formation 1 6.01 7 140
It should be noted that no saturated Pilliga Sandstone was intersected within the Mine Site.
A Piper Trilinear diagram of all groundwater data available within a 5 km radius was plotted for
comparison of groundwater signatures (reproduced as Figure 2.1). GHD identified two
groundwater types based on ionic composition, principally the dominant anions. Eight of the
23 groundwater samples analysed indicated bicarbonate as the dominant anion while the other
15 samples were dominated by chloride. The groundwater samples with bicarbonate
dominance were representative of a range of formations from the Garrawilla Volcanics through
to the Black Jack Group. High bicarbonate groundwater was identified along the outcrop of the
Permo-Triassic sedimentary rocks on the eastern margin of the Bohena Trough, likely sourced
from dawsonite mineralisation in coal seams. Further discussion about the groundwater
geochemistry is provided in Section 4.5 of this report.
An overall evaluation of water quality results indicated that in general, the groundwater is
brackish, with salinity generally ranging from 5 000 to 15 000 mg/L TDS. Localised fresher
zones predominate in areas where the Garrawilla Volcanics subcrop, and groundwater in the
Black Jack Group formations is generally greater than 7 000 mg/L TDS (brackish). In areas
where the Hoskissons Coal Seam is shallow and proximal to the Boggabri Ridge, groundwater
is less saline.

NARRABRI COAL OPERATIONS PTY LTD 2 - 26 SPECIALIST CONSULTANT STUDIES Narrabri Coal Mine – Stage 2 Longwall Project Part 2 – Hydrogeological Assessment Report No. 674/17
2.8 Beneficial Use Assessment
GHD (2007) reported that other potential beneficial uses for groundwater in and around the
Mine Site may include:
• Agricultural – including limited irrigation use and some livestock watering which
would be dependent upon feed type. It is noted that numerous registered stock
bores exist in the region.
• Recreation – groundwater quality results fall within the guidelines for all
recreational uses. No data on groundwater discharge to surface drainages is
available for evaluation, and therefore it is assumed that these guidelines are
applicable.
• Groundwater Dependent Ecosystems (GDE) – no GDEs were identified prior to
the GHD study; however provision for future identification has been made based
on the known presence of deep-rooted vegetation in the area. These guidelines
were therefore deemed applicable.
• Published hydrogeological maps of the area indicate that groundwater present in
the Pilliga Sandstone is fresh (<500 mg/L) and may therefore be suitable for
potable use. Numerous registered domestic and stock bores west and northwest
of the Longwall Project indicate that potable water guidelines are applicable. It
should be noted that site drilling indicated that the Pilliga Sandstone is unlikely to
be saturated within the Mine Site.
2.9 Census of Groundwater Occurrence and Use
As part of the Stage 1 groundwater investigations, information on existing groundwater
occurrence and use was collated by GHD from various sources. These included the NSW
Office of Water (NOW)1 groundwater bore data (information on registered groundwater bores),
on-site exploration holes and monitoring bores, off-site exploration holes and monitoring bores,
published hydrogeological maps and previous regional hydrogeological investigations. This
data was used to identify groundwater supply sources such as bores, wells, soaks and dams,
and any naturally discharging springs and soaks, as well as to aid in characterising local and
regional aquifer formations.
2.9.1 Registered Bores
GHD identified 18 registered groundwater bores within a 5 km radius of the Mine Site. These
bores were grouped into four categories:
• North – Two registered groundwater bores located north of the Longwall Project,
which likely intersect the Gunnedah Basin sediments. Groundwater at these
bores is reported as being ‘very salty’ and low yielding (0.6 L/s).
1 The NSW Office of Water (NOW) was formerly known as Department of Water and Energy (DWE),
and is now incorporated in the Department of Climate Change and Water (DECCW).

SPECIALIST CONSULTANT STUDIES 2 - 27 NARRABRI COAL OPERATIONS PTY LTD Part 2 – Hydrogeological Assessment Narrabri Coal Mine – Stage 2 Longwall Project Report No. 674/17
• South – Five registered groundwater bores intersecting a range of formations
down to the basement volcanics are located south of the site. These bores are
typically low yielding (<0.25 L/s) and are used for stock and domestic purposes.
Standing water levels range between 10 and 40 m bgl.
• West and Northwest – Eleven registered bores, for stock and domestic use.
These bores likely intersect the Pilliga Sandstone and other deeper Jurassic
sediments, and report yields ranging between 0.1 and 0.8 L/s. These bores are
described as producing ‘good’ quality water, with water levels ranging from 30 to
80 m bgl.
Thirteen of the above groundwater bores were registered for domestic and stock purposes
(three of which were found to have been backfilled). Two of the registered bores were drilled
as part of the ICI groundwater exploratory program.
Numerous registered groundwater bores intersecting the Quaternary alluvium of the Namoi
River Valley are present east of the Mine Site. These bores are typically shallow and are used
for stock, domestic and irrigation purposes. Some are deeper (up to 80 m deep) and are used
for irrigation, reported as yielding up to 90 L/s.
2.9.2 Exploration Data
In total, 33 groundwater intersections were noted during drilling, from a total of 98 holes. Airlift
tests using a V-notch weir were undertaken at several holes with significant groundwater
intersections, and measured flows ranged from 0.13 to 0.78 L/s. The highest frequency of
intersections was made between 5 and 45 m bgl (67%), followed by 21% at greater than 100
m bgl, with the remaining 12% between 50 and 75 m bgl. It should be noted that 72% of
significant inflows (>0.14 L/s) were reported at depths greater than 50 m bgl. Groundwater
intersections were generally associated with fractures, with aquifers being generally laterally
discontinuous across the area (Belford Dome, 2006; GHD, 2007).
Table 2.6 presents a summary of groundwater intersection data from exploration drilling
(separation into ‘minor’, ‘moderate’ and ‘significant’ inflows is as reported in GHD (2007)).
Table 2.6: Summary of Groundwater Intersections during Exploration Drilling
Formation No of Groundwater Intersections
Minor (<0.1 L/s)
Moderate (0.1 to 0.14 L/s)
Significant (>0.14 L/s)
Purlawaugh Formation 10 5 1 2
Garrawilla Volcanics 6 1 1 4
Napperby Formation 10 1 - 7
Basalt Sill 4 - - 3
Napperby Formation (below Sill)
3 - - 2
Digby Formation 0 - - -
Hoskissons Coal Seam 0 - - -
Arkarula / Brigalow / Pamboola Formations
0 - - -
- Denotes no recorded inflows.
NARRABRI COAL OPERATIONS PTY LTD 2 - 28 SPECIALIST CONSULTANT STUDIES Narrabri Coal Mine – Stage 2 Longwall Project Part 2 – Hydrogeological Assessment Report No. 674/17
2.10 Stage 1 Groundwater Modelling
A 3-dimensional groundwater flow model was developed by GHD to evaluate impacts from
mine dewatering on local groundwater levels and registered groundwater users. Steady state
modelling was carried out to simulate pre-mining conditions. Groundwater inflows to the
underground workings were simulated using transient modelling. The modelling was carried
out using the finite-difference groundwater flow modelling code MODFLOW 2000 (Harbaugh et
al, 2000).
2.10.1 Hydrostratigraphy
GHD (2007) used an 11 layer model to simulate the groundwater flow regime for the Stage 1
Project.
Layers 1 to 4 represented the Jurassic Surat Basin formations which comprise the GAB intake
beds. Layers 5 to 11 simulated the deeper Permo-Triassic Gunnedah Basin sequence.
Layer 9, representing the Hoskissons Coal Seam, was assigned a uniform thickness across
the model. All layers were allowed to vary between confined and unconfined conditions
depending on groundwater levels.
Definition of the model layers was based on:
• Stratigraphic logs from the Narrabri Coal NC series drilling
• Summary logs of the DME Narrabri DDH drilling undertaken in the 1980s
• Stratigraphic interpretations from four petroleum wells within the model domain
• Structure contours from the Consolidated Petroleum 1983 report.
2.10.2 Aquifer Parameters
Hydraulic conductivity values used by GHD for model layers were based on the geometric
mean of field permeability test results from each formation. Where no site test data was
available, GHD adopted regional data or assumed values based on lithology. With the
exception of Layer 6, where vertical and horizontal hydraulic conductivities were assigned the
same value in order to represent the vertical fracturing observed in the Basalt Sill, vertical
hydraulic conductivity values were set at one order of magnitude lower than the horizontal
hydraulic conductivity values across the model domain.
Layer 10, representing the Brigalow and Arkarula Formations, the Hoskissons Coal Seam and
the Pamboola Formation was divided into 3 north-south bands to reflect the lateral distribution
of each of these formations across the Longwall Project area.
The adopted hydraulic conductivity values were used for the steady state model calibration
run, and were increased by one order of magnitude in selected model layers for model
sensitivity evaluation and potential inflow estimation.
SPECIALIST CONSULTANT STUDIES 2 - 29 NARRABRI COAL OPERATIONS PTY LTD Part 2 – Hydrogeological Assessment Narrabri Coal Mine – Stage 2 Longwall Project Report No. 674/17
2.10.3 Results
Groundwater inflows into the mine were predicted by GHD to gradually increase to 1.3 ML/d
over the first 22 years, reach a maximum of 2.2 ML/d at Year 24 and then decline and stabilise
at around 1.9 ML/d to Year 50.
If the hydraulic conductivity of the Hoskissons Coal Seam were increased by an order of
magnitude to 0.02 m/d (ie. 1000% increase), predicted inflows increased by only around 30%.
Initial inflows of 0.1 ML/d were predicted to increase to a peak rate of approximately 2.9 ML/d
at year 25 and then to decrease to 2.2 ML/d by the end of mining (Year 50). Other sensitivity
studies undertaken by GHD demonstrated that an increase in the hydraulic conductivity of the
Arkarula Formation by an order of magnitude to 0.03 m/d resulted in predicted inflows
increasing by only 7%.
The greatest impact from the Stage 1 development was predicted to be in the Gunnedah Basin
formations. Groundwater drawdowns in the Hoskissons Coal Seam were predicted to be
greater than 100 m within 1 km to 2 km of the underground workings after 50 years. Predicted
drawdown rapidly decreased to less than 10 m around 6 km to 7 km to the west, north and
south of the underground workings. The drawdown extent to the east was significantly less
and was limited by the subcrop of the coal seam. The area of greater than 1m drawdown in the
Hoskissons Coal Seam was predicted to extend approximately 10 km to the west and south,
and 8 km to the north, after 50 years.
3. STAGE 2 GROUNDWATER INVESTIGATIONS
3.1 Overview and Purpose of Stage 2 Investigations
The Stage 1 investigations assessed impacts from coal recovery by continuous miner, with an
annual production rate of up to 2.5 Mtpa. The Stage 2 investigations presented within this
report focus on the assessment of impacts resulting from conversion of the approved Narrabri
Coal Mine to a longwall mining operation with a maximum production rate of 8 Mtpa.
3.2 Site Investigations
3.2.1 Groundwater Monitoring Bores
Additional monitoring bores have been installed within the Longwall Project area since the
completion of the Stage 1 groundwater assessment, increasing the monitoring bore network to
28. Of these, two (NC175 and NC179) are multi level vibrating wire monitoring bores. In
addition, eleven registered water supply bores have been identified for inclusion in the
monitoring network, subject to access and landholder approval. Details are listed in Table 3.1.
The monitoring bores target all the principal hydrogeological units, as well as providing a broad
geographical network across the Longwall Project area. The locations of all piezometers and
registered bores in the monitoring network are shown on Figure 3.1.
Twenty-one monitoring bores have been completed as stand-pipe piezometers, from which
both groundwater level and groundwater quality data can be collected as part of NCOPL’s
ongoing environmental monitoring program. Seven coal exploration holes located close to the
entry drift of the initial longwall panels have been installed with vibrating wire (VW)
NARRABRI COAL OPERATIONS PTY LTD 2 - 30 SPECIALIST CONSULTANT STUDIES Narrabri Coal Mine – Stage 2 Longwall Project Part 2 – Hydrogeological Assessment Report No. 674/17
piezometers before being grouted up. Five bores have a single VW piezometer, and two are
multi-level bores with four or more VW piezometers at different levels. The VW piezometer
bores are monitored for groundwater level/pressure only.
All standpipe piezometers were installed in existing coal exploration holes drilled at diameters
of 100 mm or 125 mm. Each bore was cased with 50mm diameter PVC casing with a screen
adjacent to the desired monitoring interval. The bore annulus was gravel packed over the
target monitoring interval, and a bentonite seal set above and below the screened zone to
ensure that the screened section was isolated. The remainder of the annulus above the
bentonite seal was then backfilled with cement grout. All piezometers were completed at
surface with a concrete block, to prevent ingress of surface runoff or contamination, and
secured within a padlocked steel monument.
The assessment of which formations are screened by the monitoring bores has been based on
geological logs provided by Earth Data and information provided by NCOPL.
Monitoring includes groundwater level and field quality measurements on a monthly to annual
basis, and groundwater quality sampling for laboratory analysis on a quarterly to annual basis.
No regulatory guidance for monitoring of groundwater impacts from coal mining within the
Gunnedah Basin currently exists. However, it is likely that the principles similar to those set
out within the NOW’s draft groundwater monitoring guidelines for the Hunter Region (DIPNR,
2004) will be required by NOW. The number of observation points available for monitoring at
the Stage 2 Longwall Project marginally exceeds the minimum requirement within the Hunter
Region guidelines.
3.2.2 Census of Groundwater Use
An updated search of the NOW database of registered bores close to the project has been
conducted, and revealed that many of the registered bores either were non-existent or could
not be found. The age of installation in some cases indicates that they are likely to have been
abandoned for some time. Visual surveys have also revealed a number of existing bores,
some with active windmills, which are unregistered or missing from the DECCW database.
Although unregistered, potential impacts on these groundwater bores needs to be included in
the impact assessment.
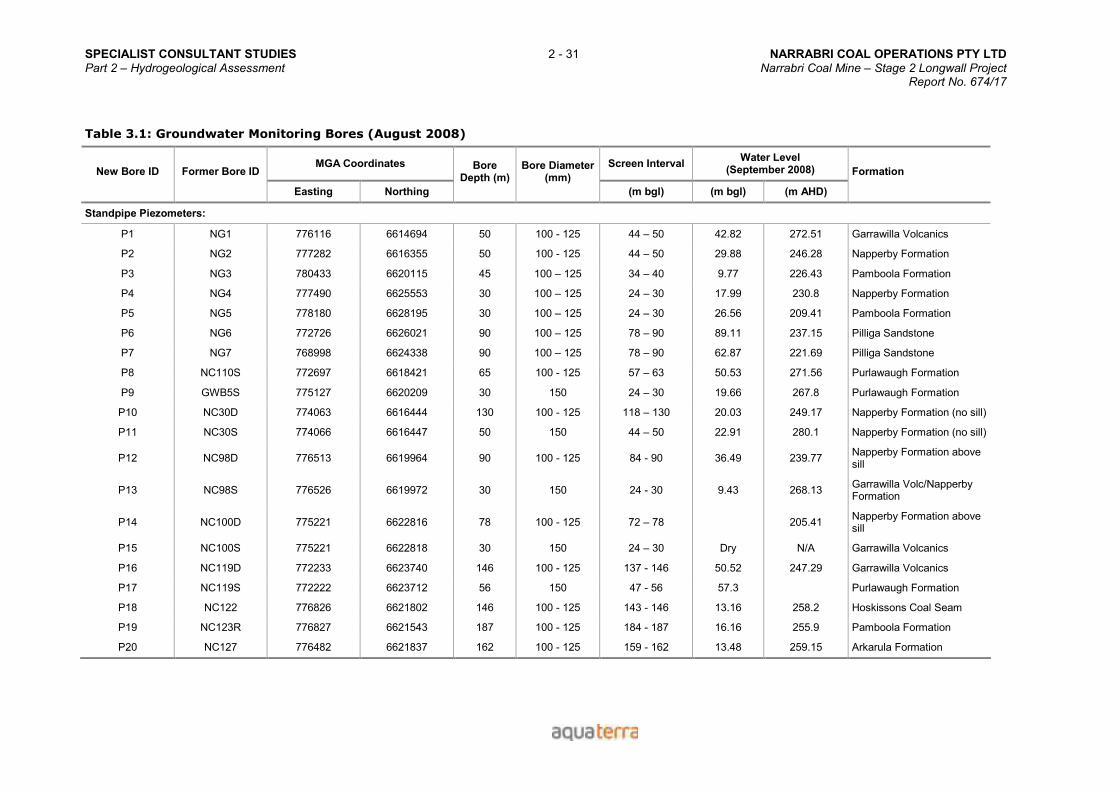
SPECIALIST CONSULTANT STUDIES 2 - 31 NARRABRI COAL OPERATIONS PTY LTD Part 2 – Hydrogeological Assessment Narrabri Coal Mine – Stage 2 Longwall Project Report No. 674/17
Table 3.1: Groundwater Monitoring Bores (August 2008)
MGA Coordinates Screen Interval Water Level
(September 2008) New Bore ID Former Bore ID
Easting Northing
Bore Depth (m)
Bore Diameter (mm)
(m bgl) (m bgl) (m AHD)
Formation
Standpipe Piezometers:
P1 NG1 776116 6614694 50 100 - 125 44 – 50 42.82 272.51 Garrawilla Volcanics
P2 NG2 777282 6616355 50 100 - 125 44 – 50 29.88 246.28 Napperby Formation
P3 NG3 780433 6620115 45 100 – 125 34 – 40 9.77 226.43 Pamboola Formation
P4 NG4 777490 6625553 30 100 – 125 24 – 30 17.99 230.8 Napperby Formation
P5 NG5 778180 6628195 30 100 – 125 24 – 30 26.56 209.41 Pamboola Formation
P6 NG6 772726 6626021 90 100 – 125 78 – 90 89.11 237.15 Pilliga Sandstone
P7 NG7 768998 6624338 90 100 – 125 78 – 90 62.87 221.69 Pilliga Sandstone
P8 NC110S 772697 6618421 65 100 - 125 57 – 63 50.53 271.56 Purlawaugh Formation
P9 GWB5S 775127 6620209 30 150 24 – 30 19.66 267.8 Purlawaugh Formation
P10 NC30D 774063 6616444 130 100 - 125 118 – 130 20.03 249.17 Napperby Formation (no sill)
P11 NC30S 774066 6616447 50 150 44 – 50 22.91 280.1 Napperby Formation (no sill)
P12 NC98D 776513 6619964 90 100 - 125 84 - 90 36.49 239.77 Napperby Formation above sill
P13 NC98S 776526 6619972 30 150 24 - 30 9.43 268.13 Garrawilla Volc/Napperby Formation
P14 NC100D 775221 6622816 78 100 - 125 72 – 78 205.41 Napperby Formation above sill
P15 NC100S 775221 6622818 30 150 24 – 30 Dry N/A Garrawilla Volcanics
P16 NC119D 772233 6623740 146 100 - 125 137 - 146 50.52 247.29 Garrawilla Volcanics
P17 NC119S 772222 6623712 56 150 47 - 56 57.3 Purlawaugh Formation
P18 NC122 776826 6621802 146 100 - 125 143 - 146 13.16 258.2 Hoskissons Coal Seam
P19 NC123R 776827 6621543 187 100 - 125 184 - 187 16.16 255.9 Pamboola Formation
P20 NC127 776482 6621837 162 100 - 125 159 - 162 13.48 259.15 Arkarula Formation
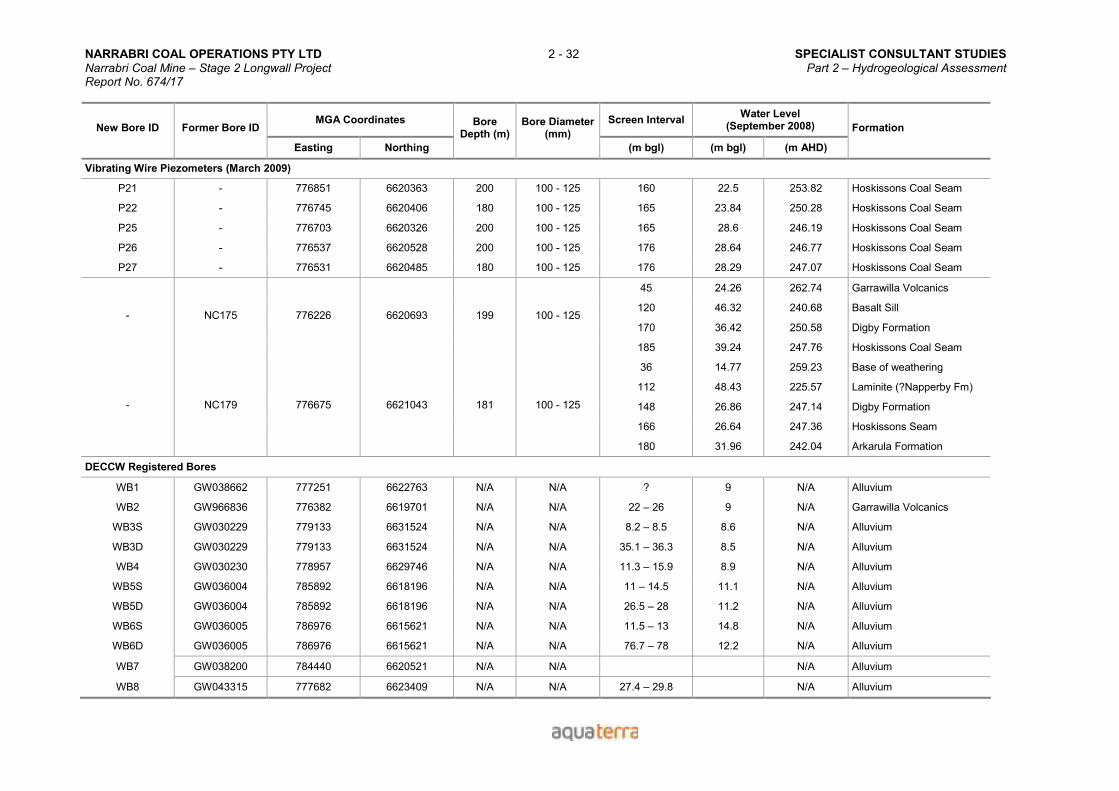
NARRABRI COAL OPERATIONS PTY LTD 2 - 32 SPECIALIST CONSULTANT STUDIES Narrabri Coal Mine – Stage 2 Longwall Project Part 2 – Hydrogeological Assessment Report No. 674/17
MGA Coordinates Screen Interval Water Level
(September 2008) New Bore ID Former Bore ID
Easting Northing
Bore Depth (m)
Bore Diameter (mm)
(m bgl) (m bgl) (m AHD)
Formation
Vibrating Wire Piezometers (March 2009)
P21 - 776851 6620363 200 100 - 125 160 22.5 253.82 Hoskissons Coal Seam
P22 - 776745 6620406 180 100 - 125 165 23.84 250.28 Hoskissons Coal Seam
P25 - 776703 6620326 200 100 - 125 165 28.6 246.19 Hoskissons Coal Seam
P26 - 776537 6620528 200 100 - 125 176 28.64 246.77 Hoskissons Coal Seam
P27 - 776531 6620485 180 100 - 125 176 28.29 247.07 Hoskissons Coal Seam
45 24.26 262.74 Garrawilla Volcanics
120 46.32 240.68 Basalt Sill
170 36.42 250.58 Digby Formation - NC175 776226 6620693 199 100 - 125
185 39.24 247.76 Hoskissons Coal Seam
36 14.77 259.23 Base of weathering
112 48.43 225.57 Laminite (?Napperby Fm)
148 26.86 247.14 Digby Formation
166 26.64 247.36 Hoskissons Seam
- NC179 776675 6621043 181 100 - 125
180 31.96 242.04 Arkarula Formation
DECCW Registered Bores
WB1 GW038662 777251 6622763 N/A N/A ? 9 N/A Alluvium
WB2 GW966836 776382 6619701 N/A N/A 22 – 26 9 N/A Garrawilla Volcanics
WB3S GW030229 779133 6631524 N/A N/A 8.2 – 8.5 8.6 N/A Alluvium
WB3D GW030229 779133 6631524 N/A N/A 35.1 – 36.3 8.5 N/A Alluvium
WB4 GW030230 778957 6629746 N/A N/A 11.3 – 15.9 8.9 N/A Alluvium
WB5S GW036004 785892 6618196 N/A N/A 11 – 14.5 11.1 N/A Alluvium
WB5D GW036004 785892 6618196 N/A N/A 26.5 – 28 11.2 N/A Alluvium
WB6S GW036005 786976 6615621 N/A N/A 11.5 – 13 14.8 N/A Alluvium
WB6D GW036005 786976 6615621 N/A N/A 76.7 – 78 12.2 N/A Alluvium
WB7 GW038200 784440 6620521 N/A N/A N/A Alluvium
WB8 GW043315 777682 6623409 N/A N/A 27.4 – 29.8 N/A Alluvium
SPECIALIST CONSULTANT STUDIES 2 - 33 NARRABRI COAL OPERATIONS PTY LTD Part 2 – Hydrogeological Assessment Narrabri Coal Mine – Stage 2 Longwall Project Report No. 674/17
3.2.3 Groundwater Levels/Pressures
Monitoring of groundwater levels has been undertaken by NCOPL in accordance with its
Groundwater Monitoring Plan. Groundwater levels have been monitored in all 21 standpipe
bores, 7 vibrating wire piezometer bores and 11 registered bores (WB1 to WB12).
Groundwater levels in most bores have generally been very stable, with little influence from
direct rainfall recharge. Bores that have been monitored, and the relevant formation monitored
in each case, are listed in Table 3.1. Hydrographs of groundwater levels are included in
Appendix A.
A number of vibrating wire piezometers located near the mine entry drift have shown a marked
drawdown response in the Hoskissons Seam and Digby Formation to pumping from gas
drainage test bores between April and July 2009. Drawdowns of up to 40 m have been
observed. Hydrographs of groundwater level responses to the gas drainage testing are
included in Appendix K.
3.2.4 Hydraulic Testing
Testing of aquifer characteristics was undertaken by Aquaterra in August 2008. Tests were
conducted on the new monitoring bores constructed during the Stage 2 studies, and some of
the Stage 1 monitoring bores were re-tested to verify results recorded during the earlier
investigation.
Falling head slug tests were carried out in most instances, involving the introduction of a slug
of water, and monitoring the falling heads with a digital data logger. The slug test data were
analysed using the Bouwer-Rice method (Bouwer and Rice, 1976) for tests on unconsolidated
sediments (alluvium and colluvium), and the Hvorslev Method (Hvorslev, 1951) for tests on the
hard rock units. These methods of analysis assume that the entire length of the screened
interval in the test well is saturated; however in many cases this condition was not met. In
such cases, an adaptation of the Bouwer and Rice method was applied, which accounts for
conditions in which the bore is screened across the water table (i.e. where the test interval
includes saturated and unsaturated components).
A constant rate test was carried out on bore P13, using a low capacity pump. A successful
pumping test was also carried out on one of the station bores on the “Claremont” property.
The results are summarised in Table 3.2 and the bore test analysis shown in Appendix B.
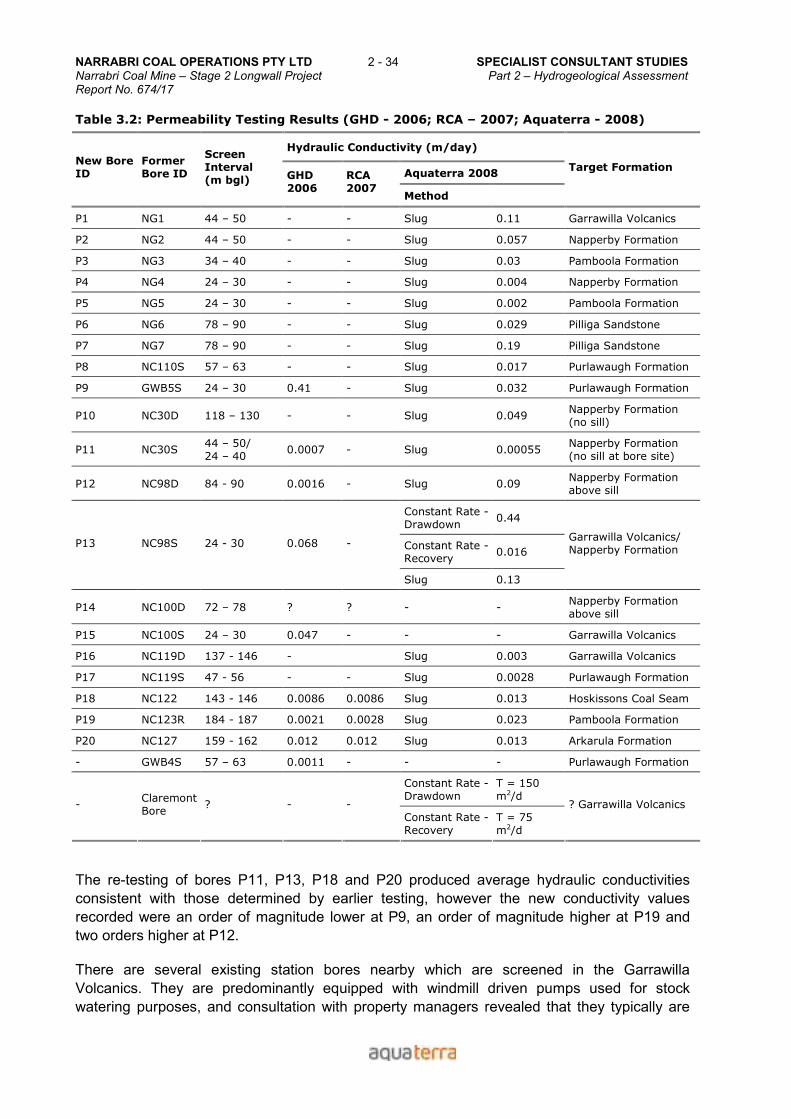
NARRABRI COAL OPERATIONS PTY LTD 2 - 34 SPECIALIST CONSULTANT STUDIES Narrabri Coal Mine – Stage 2 Longwall Project Part 2 – Hydrogeological Assessment Report No. 674/17
Table 3.2: Permeability Testing Results (GHD - 2006; RCA – 2007; Aquaterra - 2008)
Hydraulic Conductivity (m/day)
Aquaterra 2008 New Bore ID
Former Bore ID
Screen Interval (m bgl) GHD
2006 RCA 2007
Method
Target Formation
P1 NG1 44 – 50 - - Slug 0.11 Garrawilla Volcanics
P2 NG2 44 – 50 - - Slug 0.057 Napperby Formation
P3 NG3 34 – 40 - - Slug 0.03 Pamboola Formation
P4 NG4 24 – 30 - - Slug 0.004 Napperby Formation
P5 NG5 24 – 30 - - Slug 0.002 Pamboola Formation
P6 NG6 78 – 90 - - Slug 0.029 Pilliga Sandstone
P7 NG7 78 – 90 - - Slug 0.19 Pilliga Sandstone
P8 NC110S 57 – 63 - - Slug 0.017 Purlawaugh Formation
P9 GWB5S 24 – 30 0.41 - Slug 0.032 Purlawaugh Formation
P10 NC30D 118 – 130 - - Slug 0.049 Napperby Formation (no sill)
P11 NC30S 44 – 50/ 24 – 40
0.0007 - Slug 0.00055 Napperby Formation (no sill at bore site)
P12 NC98D 84 - 90 0.0016 - Slug 0.09 Napperby Formation above sill
Constant Rate - Drawdown
0.44
Constant Rate -Recovery
0.016 P13 NC98S 24 - 30 0.068 -
Slug 0.13
Garrawilla Volcanics/ Napperby Formation
P14 NC100D 72 – 78 ? ? - - Napperby Formation above sill
P15 NC100S 24 – 30 0.047 - - - Garrawilla Volcanics
P16 NC119D 137 - 146 - Slug 0.003 Garrawilla Volcanics
P17 NC119S 47 - 56 - - Slug 0.0028 Purlawaugh Formation
P18 NC122 143 - 146 0.0086 0.0086 Slug 0.013 Hoskissons Coal Seam
P19 NC123R 184 - 187 0.0021 0.0028 Slug 0.023 Pamboola Formation
P20 NC127 159 - 162 0.012 0.012 Slug 0.013 Arkarula Formation
- GWB4S 57 – 63 0.0011 - - - Purlawaugh Formation
Constant Rate - Drawdown
T = 150 m2/d
- Claremont Bore
? - - Constant Rate -Recovery
T = 75 m2/d
? Garrawilla Volcanics
The re-testing of bores P11, P13, P18 and P20 produced average hydraulic conductivities
consistent with those determined by earlier testing, however the new conductivity values
recorded were an order of magnitude lower at P9, an order of magnitude higher at P19 and
two orders higher at P12.
There are several existing station bores nearby which are screened in the Garrawilla
Volcanics. They are predominantly equipped with windmill driven pumps used for stock
watering purposes, and consultation with property managers revealed that they typically are
SPECIALIST CONSULTANT STUDIES 2 - 35 NARRABRI COAL OPERATIONS PTY LTD Part 2 – Hydrogeological Assessment Narrabri Coal Mine – Stage 2 Longwall Project Report No. 674/17
low-yielding, but are adequate for stock watering purposes. Even though some of these bores
are close to exploration holes in which high yields were observed, the stock bores do not
appear to have intersected the same high yielding fractures encountered in the exploration
drilling.
A pumping test attempted on one of these shallow bores had to be terminated because of the
very low yield. However, a second bore located on the Claremont Property was successfully
tested. This bore is used to supply water to a dam and is reported to be able to produce a
reasonable water supply. It is located approximately 100m from monitoring bore P13 which is
screened within the Garrawilla Volcanics. The Claremont bore’s construction details and pump
setting are unknown, although it is understood that the bore is screened at 30m and the pump
set 20m below ground level (mbgl). It is probably also screened in the Garrawilla Volcanics.
The pump is powered at the surface by a small diesel engine and is capable of yielding
approximately 1 L/s.
The Claremont bore was pumped for 4 hours at 0.95 L/s. The aquifer was not highly stressed
during the short test, with only 1.6m drawdown observed in the bore itself and no drawdown at
bore P13 100m away.
The calculated average hydraulic conductivity was assessed to be approximately 2 m/d based
on a measured transmissivity of 75 m2/d and an assumed aquifer thickness of 37 m. This result
indicates a higher permeability for the volcanic unit than normally encountered and is probably
related to localised fracturing.
Details of the pumping test are contained within Aquaterra Report S28_B5_042 Claremont
Pump Test, which is reproduced in Appendix I.
3.2.5 Groundwater Quality
Groundwater quality monitoring has been conducted on behalf of NCOPL by EA Systems, with
samples from all available bores in the monitoring network submitted for laboratory analysis of
pH, electrical conductivity (EC), Total dissolved solids (TDS) major anions, major cations and
selected heavy metals (As, Cd, Cr, Cu, Ni, Pb, Zn, Hg, V, Mn).
The laboratory analysis results indicated pH to be in the neutral to slightly alkaline range of 6.7
to 8.2 (Stage 1 investigations showed a similar range of 6.0 to 8.7 pH units). Salinity ranged
from fresh (<500 mg/L TDS) within the Purlawaugh formations located to the west of the Mine
Site (P7 and P8), to slightly brackish (1040 mg/L TDS) in the Garrawilla Volcanics, to strongly
saline (up to 16 800 mg/L TDS) within the Napperby Formation. Salinity within the Hoskissons
coal seam ranges from as low as 1350 mg/L measured in P18 during Stage 1 hydrogeological
assessment to 9030 mg/L TDS measured in recent in seam drilling.
It is noted that field and laboratory measurements of electrical conductivity do not correlate
well. It is assumed that the field meter was either faulty or not well calibrated during this
sampling campaign.
A summary of the groundwater quality results is presented in Appendix C.
NARRABRI COAL OPERATIONS PTY LTD 2 - 36 SPECIALIST CONSULTANT STUDIES Narrabri Coal Mine – Stage 2 Longwall Project Part 2 – Hydrogeological Assessment Report No. 674/17
3.3 Groundwater Modelling
Groundwater modelling was undertaken to assess the potential impacts of mining activities.
The groundwater model utilised for the Stage 2 Longwall Project is based on the model
constructed by GHD for Stage 1. Several modifications have been made to the model structure
and parameters to improve the representation of the groundwater and geological environment.
The most significant change was an extension of the model domain to the north-east to include
the Namoi Valley and the alluvial sediments associated with the Namoi River, so that potential
impacts on the Namoi Valley alluvial aquifer could be assessed, as well as potential baseflow
impacts on the Namoi River. The Namoi Valley portion of the Stage 2 model was obtained
directly from the NOW Namoi Valley model (NOW, 2009).
Other changes to the groundwater model included:
• Refinement of the subcrop geology, incorporating improvements in the geological
and geotechnical block models that occurred as a result of additional coal
delineation drilling.
• Changes to the specific yield values for the deeper model layers. The specific
yield values used by GHD in the Stage 1 modelling were too high for the deeper
layers. While this would not cause major impacts where confined aquifers remain
saturated, it was considered this error could lead to erroneous predictions of
inflow rates where dewatering occurs due to subsidence fracturing above the
extracted longwall panels.
A full account of the modelling carried out for the Stage 2 Longwall Project is presented in
Section 6.
4. DESCRIPTION OF THE EXISTING ENVIRONMENT
4.1 Topographical Setting
The Narrabri Project is located approximately 30 km south-southeast of Narrabri and 10 km
north-northwest of Baan Baa. The Mine Site occupies ML 1609, and covers an area of
5 210 ha.
The Mine Site generally slopes gently to the east and northeast, with elevations ranging from
over 300 m AHD in the southwest to 270 m AHD in the east. A number of ephemeral surface
drainages cross the site in a north-easterly direction.
4.2 Climate
The climate of the region is cool to temperate, with hot summers and cool winters. The
average daily maximum temperature ranges from 35.3 ºC in January to 17.0 ºC in July.
SPECIALIST CONSULTANT STUDIES 2 - 37 NARRABRI COAL OPERATIONS PTY LTD Part 2 – Hydrogeological Assessment Narrabri Coal Mine – Stage 2 Longwall Project Report No. 674/17
4.2.1 Rainfall
Rainfall data is available from Narrabri Airport (Station 54038). Average daily rainfalls are
listed in Table 4.1.
Table 4.1: Average Monthly Rainfall (mm/day)
Jan Feb Mar Apr May Jun Jul Aug Sep Oct Nov Dec Average
2.18 2.52 1.05 0.91 0.56 2.41 0.92 0.83 0.99 1.23 2.18 3.46 1.60
Source: Bureau of Meteorology (2008)
4.2.2 Evaporation
The nearest meteorological station with long term evaporation data is Tamworth Airport
(Station 55054). Average daily evaporation rates are listed in Table 4.2.
Table 4.2: Average Monthly Potential Evaporation Rates (mm/day)
Jan Feb Mar Apr May Jun Jul Aug Sep Oct Nov Dec Average
8.6 8.1 6.9 4.6 2.9 2.0 2.1 3.0 4.4 6.0 7.6 8.7 5.4
Source: Bureau of Meteorology (2008)
4.3 Geology
The geology has previously been described in GHD (2007) and the Narrabri Coal Project
Geological Assessment (Belford Dome Resource Assessment, 2007). The summary
descriptions below are based on these reports.
4.3.1 Regional Geology
The Longwall Project is located within the Permo-Triassic Gunnedah Basin, which forms the
central part of the north-south elongate Sydney-Gunnedah-Bowen Basin system. The Narrabri
Coal Mine is located near the northern and western boundaries of the Gunnedah Basin and
the eastern margin of the Surat Basin, a sub-basin of the larger Great Artesian Basin. Hence,
the rocks and sediments beneath and surrounding the Longwall Project can be grouped into:
• Undifferentiated Quaternary sediments;
• Jurassic Surat Basin sequence; and
• The Permo-Triassic Gunnedah Basin sequence.
The Boggabri Ridge, comprising Early Permian volcanic rocks, forms the basement of the
Gunnedah Basin. It divides the basin into two parts, the Maules Creek Sub-basin to the east,
and the Mullaley Sub-basin to the west.
The Narrabri Coal Project is located within the Mullaley Sub-basin (Figure 4.1), which has
been described as a series of troughs separated by west-southwest trending structural highs
(Tadros, 1988).

NARRABRI COAL OPERATIONS PTY LTD 2 - 38 SPECIALIST CONSULTANT STUDIES Narrabri Coal Mine – Stage 2 Longwall Project Part 2 – Hydrogeological Assessment Report No. 674/17
In the western part of the Mullaley Sub-basin, the Gunnedah Basin sequence is unconformably
overlain by the Jurassic age Surat Basin sequence. The Surat Basin is a sub-basin of the
Great Artesian Basin, and contains Jurassic to Cretaceous fluvial, lacustrine and marine
sediments (GHD, 2007). Geological units interpreted to be part of the Surat Basin sequence
include the Pilliga Sandstone, the Purlawaugh Formation and the Garrawilla Volcanics.
4.3.2 Mine Site Geology
Most of the Mine Site lies within the Mullaley Sub-basin, which contains Permian and Triassic
sedimentary and volcanic rocks (Figure 4.2). The rocks strike approximately north-south and
dip to the west at an angle of less than 10°. Minor variations to the north-south strike may be
the result of variable thickness and compaction of the sedimentary units being draped over the
faulted and uneven surface on the underlying Boggabri Volcanics. To the east of the Mine Site,
the Boggabri Volcanics have been uplifted and faulted along a north-south trending anticlinal
structure, the Boggabri Ridge. The Boggabri Ridge is a major control on the outcrop and
structure of the local geology (NCOPL, 2009).
Within the Mine Site, there is a low angle unconformity between the Late Permian Black Jack
Group and the overlying Triassic Digby Formation.
Figure 4.3 presents an east-west cross-section through the Mine Site, based on delineation
drilling undertaken by Narrabri Coal and the 1:100 000 Gunnedah Basin Northern Sheet map.
This illustrates the stratigraphic sequence which is intersected within the Longwall Project, as
well as the unconformity beneath the Digby Formation, which truncates the underlying late
Permian Black Jack Group, including the Hoskissons Seam. Because of this unconformity,
neither the Hoskissons Seam nor the remainder of the Black Jack Group are directly in contact
with Namoi Valley alluvium in the project vicinity. The regional groundwater level for the
Jurassic sediments is shown on Figure 4.3 for reference.
Each unit in the sequence is described in the following text.
Quaternary Sediments
Undifferentiated Quaternary alluvial gravel, sand, silt and clay overlies the Jurassic and
Triassic Sediments. The most significant alluvium occurs in association with the Namoi River,
to the east and northeast of the Mine Site. Minor localised and discontinuous alluvium occurs
in association with the local ephemeral drainages crossing the Mine Site.
Surat Basin (Great Artesian Basin) Sequence (Jurassic)
The Pilliga Sandstone outcrops along the western margin of the Mine Site. It is up to 60m
thick, and consists of medium-bedded, cross-bedded, well sorted fine to coarse grained quartz
sandstone.
Beneath the Pilliga Sandstone is the Purlawaugh Formation, which is up to 140m thick and
subcrops beneath the central part of the Mine Site. It consists of thinly-bedded, generally fine
grained, silty lithic sandstone, siltstone and minor claystone. Thin stony coal seams are
present in the lower part of the unit.

SPECIALIST CONSULTANT STUDIES 2 - 39 NARRABRI COAL OPERATIONS PTY LTD Part 2 – Hydrogeological Assessment Narrabri Coal Mine – Stage 2 Longwall Project Report No. 674/17
Beneath the Purlawaugh Formation is the Garrawilla Volcanics, which consist mainly of alkali
basalt flows with very minor intervening mudstone and clastic rocks. The Garrawilla Volcanics
are up to 40m thick, and unconformably overlie the Triassic Napperby Formation of the
Gunnedah Basin sequence.
Gunnedah Basin Sequence (Permian to Triassic)
The uppermost unit, the Napperby Formation, is up to 140m thick. It consists of a coarsening-
up sequence of siltstone-sandstone-siltstone laminate, and fine to medium grained quartz-lithic
sandstone.
An intrusive Basalt Sill is present in the lower part of the Napperby Formation in ML 1609. It
varies in thickness from 0m to 30m, but is typically 15m to 20m thick, and sits approximately
30m to 35m above the base of the Napperby Formation. It is a dark green alkali basalt and is
almost certainly related to the Garrawilla Volcanics. The basalt typically has strongly
developed sub-vertical fractures infilled with secondary chlorite and zeolite minerals. The
fractures do not continue into the enclosing rocks and may be related to cooling shrinkage.
The underlying Digby Formation is divided into two units, the lower Digby Conglomerate and
the upper Ulinda Sandstone. The Ulinda Sandstone is either not present in ML 1609 or the
boundary between these units is not clear, with interbedded conglomerate and sandstone
common in the top of the conglomerate. Consequently, the whole unit is referred to as the
Digby Conglomerate in this area.
The unit consists mainly of thickly bedded, polymictic, lithic, pebble conglomerate with clasts of
volcanics, meta-sediments and jasper in a lithic rich matrix. Minor finely to medium bedded,
lithic sandstone beds are present towards the top of the unit. The Digby Formation is typically
15m to 20m thick in the Mine Site area.
The boundary with the underlying Black Jack Group is an angular unconformity. In the eastern
part of the Mine Site, the unconformity truncates the Hoskissons Seam at a depth of
approximately 130m to 160m. In the west, there is up to 20m of Black Jack Group above the
Hoskissons Seam (Figure 4.3).
The Black Jack Group consists of lithic sandstone, siltstone, claystone and coal with minor tuff.
It is up to 70m thick in the western part of the Mine Site but is less than 40m thick in the east
due to the low angle unconformity with the overlying Digby Formation. The Hoskissons Seam
and the Melville Seam are present beneath the Mine Site. Thickness and quality
characteristics are such that only the Hoskissons Seam is currently considered to contain coal
resources with mining potential.
Throughout the Mine Site, the Black Jack Group includes the following strata.
• Benelabri Formation – lithic sandstone and siltstone with minor coal. Increases in
thickness towards the west due to the unconformity.
• Hoskissons Seam – Dull lustrous coal. Coal consists of a low ash working section
(basal 4.2 m) and an upper high ash coal with claystone bands.
• Arkarula Formation – quartzose sandstone and siltstone. Typically forms the
upper 10m of the Black Jack Group over the Mine Site.
NARRABRI COAL OPERATIONS PTY LTD 2 - 40 SPECIALIST CONSULTANT STUDIES Narrabri Coal Mine – Stage 2 Longwall Project Part 2 – Hydrogeological Assessment Report No. 674/17
• Brigalow Formation – coarse sandstone and conglomerate interbedded with the
coal seam, which grades laterally into the Arkarula Formation, thickening to the
west across the mine site from 2m to 19m.
• Pamboola Formation – lithic sandstone, siltstone, claystone and coal. Continuous
over the Mine Site below the Arkarula Formation and Brigalow Formation, with a
thickness of between 55m and 75m.
4.4 Hydrogeology
4.4.1 Groundwater Occurrence
Groundwater can occur in all geological units, but most of the hard rock units generally have
low hydraulic conductivity.
Quaternary Alluvium
Groundwater monitoring within alluvial sediments associated with the Namoi River, which is
located 2-7 km east/north-east of the Mine Site, has a lengthy history, as the alluvial aquifer
supports irrigated agriculture within the region. The aquifer is considered to be stressed due to
large over-allocations of groundwater extraction. The alluvium associated with the Namoi River
valley can exist to depths in excess of 100 m, as is seen in the paleochannel to the north of
Narrabri.
Away from the Namoi River floodplain, alluvial/colluvial sediments have a limited occurrence,
and form localised surface cover over the sub-cropping Permian-Jurassic stratigraphy, with a
thickness that locally can extend to several tens of metres.
Regolith
No groundwater had previously been recorded from the regolith within the Mine Site. However,
during construction of the box cut for the portal to the underground mine, groundwater
seepage was observed emanating from the base of the weathering profile around most of the
box cut perimeter. Groundwater appears to be restricted in the vicinity of the box-cut to small
localised ponding on top of the fresh rock at the base of the weathered zone. Seepage rates
are low. Similar occurrences may exist elsewhere around the Mine Site area.
The Mine Site is located on land that is topographically higher than the Namoi River floodplain
(Figure 4.3), and the discontinuous regolith groundwater on the Mine Site is not hydraulically
connected with alluvial groundwater associated with the Namoi River.
Permian to Jurassic Hard Rock Units
The Surat Basin Jurassic sediments in the study area form part of the regional Great Artesian
Basin (GAB) and correspond to the intake beds (GWMA 601) of the GAB (Ife and Skelt, 2004).
Underlying the Surat Basin sediments are units from the Gunnedah Basin sediments. Both the
Surat Basin and Gunnedah Basin units contain local groundwater flow systems in fractured
rock.

SPECIALIST CONSULTANT STUDIES 2 - 41 NARRABRI COAL OPERATIONS PTY LTD Part 2 – Hydrogeological Assessment Narrabri Coal Mine – Stage 2 Longwall Project Report No. 674/17
The Pilliga Formation is unsaturated within the Mine Site area.
4.4.2 Groundwater Levels and Flow Patterns
Three groundwater flow systems occur within the Mine Site area. A shallow aquifer system
occurs within alluvium associated with the Namoi River, and locally in the alluvium/colluvium
and weathered rock (regolith) above fresh rock. Two separate fresh rock groundwater flow
systems occur predominantly in open fractures in the underlying fresh rock.
Within the Longwall Project Site, groundwater levels in the shallow alluvium/colluvium/regolith
aquifer are generally about 10-20m or more below ground level. Groundwater in this aquifer is
localised and discontinuous and is influenced primarily by topography and local surface
drainage.
The groundwater flow direction in the shallow groundwater system is therefore similar to the
surface topography, ie. east to northeast towards the Namoi River valley. Recharge to the
shallow aquifer system is believed to occur by infiltration of rainfall through the surficial
alluvium and regolith, with discharge occurring locally to the surface drainages.
Within the deeper hard rock aquifers, groundwater levels are generally in the range 25-50m
below surface. The shallower of the two hard rock groundwater systems occurs within the
Jurassic sediments, which subcrop beneath the Longwall Project area. The westerly dip on the
strata exposes progressively younger units from east to west across the site. A deeper
groundwater flow system occurs within the Permian-Triassic sediments which also dip in a
westerly direction.
Contours of groundwater levels / pressures have been prepared based on the measured water
levels in the monitoring piezometers. With the limited number of water levels from each
hydrogeologic unit, contouring has only been possible by consolidating all bores from the
Permian-Triassic formations into one group, and the Jurassic formations into another, and
contouring each group to produce a representative potentiometric surface for the Permian-
Triassic units and water table contours for the Jurassic units. Contours for the two groups are
shown on Figure 4.4.
The contours on Figure 4.4 show that the groundwater in the Permian-Triassic units has a
hydraulic gradient generally dipping to the north-west. The Jurassic groundwater flows are also
to the north-west but are elevated above the lower Permian-Triassic aquifer levels by
20 - 25 m.
The fracture rock aquifer systems are influenced by regional features such as basin structure
and regional recharge and discharge processes, and groundwater flow occurs primarily in
fractures. Visual inspection of drill core suggests that the stratigraphic units are
heterogeneous, with bulk aquifer properties varying depending on the nature and continuity of
fractures and joints. The limited number of formation-specific monitoring points over the
Longwall Project area makes it difficult to evaluate groundwater flow patterns, but it is
expected that flow is more regional in nature than the water table in the shallow flow system.
Recharge to the deeper Permian-Triassic and Jurassic units is believed to occur through
downward percolation of rainfall through the surficial regolith layer and/or alluvium into the
underlying bedrock units where they subcrop. The groundwater levels then tend to reflect the
NARRABRI COAL OPERATIONS PTY LTD 2 - 42 SPECIALIST CONSULTANT STUDIES Narrabri Coal Mine – Stage 2 Longwall Project Part 2 – Hydrogeological Assessment Report No. 674/17
elevations of these recharge zones, and the discharge areas which may be some distance
away, leading to a regional rather than local flow pattern. The head difference between the
two fractured rock systems suggests a hydrogeological disconnection between them.
Geophysical logging of resource drill holes revealed temperature variations which can be
correlated to specific stratigraphic intervals in the majority of holes. Temperature generally
increases steadily with depth, which can be attributed to normal heat flux. However, a
relatively steeper increase in temperature was observed in bores NCOPL29, NC0108 and
NC0112 (typified by the log of NCOPL29 shown in Figure 4.5) at depths which correspond to
the Hoskissons Seam, and zones immediately above (base of the Digby Formation) and below
(Arkarula Formation). This has been interpreted to correspond to a higher rate of groundwater
flow within the coal seam.
Figure 4.6 illustrates temperature logs for NC109 and NC112 which show sharp increases in
temperature at depths which correspond to the base of the Digby Formation and within the
Hoskissons Coal Seam.
4.4.3 Aquifer Parameters – Estimates of Hydraulic Conductivity
The hydraulic conductivity results shown in Table 3.2 indicated several zones of elevated
hydraulic conductivity in various formations. Relatively high hydraulic conductivities ranging up
to 0.4 m/d are found in the Garrawilla Volcanics and the Pilliga Formation. Moderately high
conductivity was also found in the Napperby Formation above the sill.
All other units show a wide range of conductivities, but generally quite low, ranging from
0.0005 to 0.03 m/d, with the higher conductivities generally in sub-crop areas. This is
consistent with reports of significant inflows and more intense fracturing in some holes at
shallower depths.
The mean hydraulic conductivity of the Purlawaugh Formation and Basalt Sill is an order of
magnitude lower than the Pilliga and Garrawilla Formations, at 0.01 to 0.02 m/d.
The geological units underlying the Basalt Sill are characterised by low inherent permeability.
The hydraulic conductivity of the Napperby Formation (below the sill) and the Digby Formation
range from 1 x 10⁻⁴ m/d to 8 x 10⁻⁵ m/d. These units are typically fine-grained, laminated and
cemented with a clayey matrix. Limited groundwater intersections were noted during drilling.
These low permeability units separate the overlying permeable Jurassic strata from the
underlying Permian Black Jack Formation.
The hydraulic conductivity of the Black Jack Group, comprising the Hoskissons Coal Seam,
Arkarula Formation/Brigalow Formation and the Pamboola Formation, ranged from 2 x 10⁻³ to
3 x 10⁻² m/d. Relatively high groundwater pressures were observed in the Black Jack Group
indicating that these formations are confined by the overlying Digby Formation and Napperby
Formation aquitards.
Table 4.3 shows the values of hydraulic conductivity that were used for each formation in the
original GHD model, and initial values in the Aquaterra groundwater model that was developed
for the Stage 2 impact assessment.
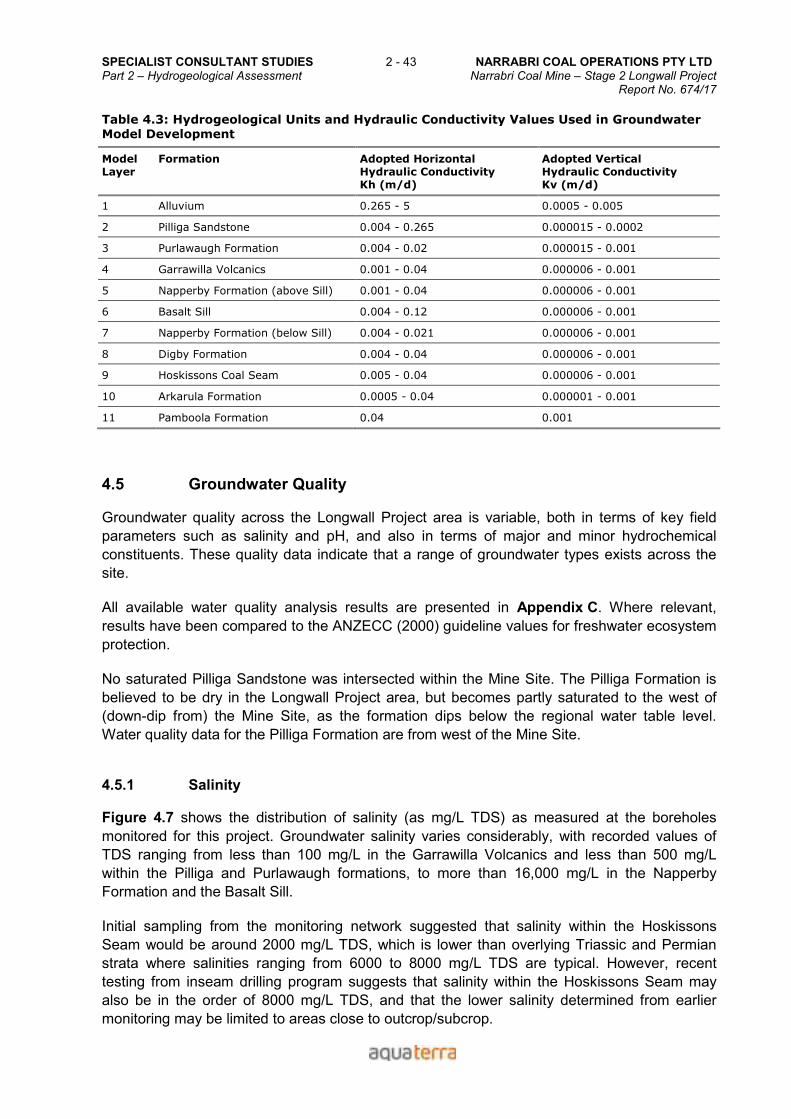
SPECIALIST CONSULTANT STUDIES 2 - 43 NARRABRI COAL OPERATIONS PTY LTD Part 2 – Hydrogeological Assessment Narrabri Coal Mine – Stage 2 Longwall Project Report No. 674/17
Table 4.3: Hydrogeological Units and Hydraulic Conductivity Values Used in Groundwater
Model Development
Model Layer
Formation Adopted Horizontal Hydraulic Conductivity Kh (m/d)
Adopted Vertical Hydraulic Conductivity Kv (m/d)
1 Alluvium 0.265 - 5 0.0005 - 0.005
2 Pilliga Sandstone 0.004 - 0.265 0.000015 - 0.0002
3 Purlawaugh Formation 0.004 - 0.02 0.000015 - 0.001
4 Garrawilla Volcanics 0.001 - 0.04 0.000006 - 0.001
5 Napperby Formation (above Sill) 0.001 - 0.04 0.000006 - 0.001
6 Basalt Sill 0.004 - 0.12 0.000006 - 0.001
7 Napperby Formation (below Sill) 0.004 - 0.021 0.000006 - 0.001
8 Digby Formation 0.004 - 0.04 0.000006 - 0.001
9 Hoskissons Coal Seam 0.005 - 0.04 0.000006 - 0.001
10 Arkarula Formation 0.0005 - 0.04 0.000001 - 0.001
11 Pamboola Formation 0.04 0.001
4.5 Groundwater Quality
Groundwater quality across the Longwall Project area is variable, both in terms of key field
parameters such as salinity and pH, and also in terms of major and minor hydrochemical
constituents. These quality data indicate that a range of groundwater types exists across the
site.
All available water quality analysis results are presented in Appendix C. Where relevant,
results have been compared to the ANZECC (2000) guideline values for freshwater ecosystem
protection.
No saturated Pilliga Sandstone was intersected within the Mine Site. The Pilliga Formation is
believed to be dry in the Longwall Project area, but becomes partly saturated to the west of
(down-dip from) the Mine Site, as the formation dips below the regional water table level.
Water quality data for the Pilliga Formation are from west of the Mine Site.
4.5.1 Salinity
Figure 4.7 shows the distribution of salinity (as mg/L TDS) as measured at the boreholes
monitored for this project. Groundwater salinity varies considerably, with recorded values of
TDS ranging from less than 100 mg/L in the Garrawilla Volcanics and less than 500 mg/L
within the Pilliga and Purlawaugh formations, to more than 16,000 mg/L in the Napperby
Formation and the Basalt Sill.
Initial sampling from the monitoring network suggested that salinity within the Hoskissons
Seam would be around 2000 mg/L TDS, which is lower than overlying Triassic and Permian
strata where salinities ranging from 6000 to 8000 mg/L TDS are typical. However, recent
testing from inseam drilling program suggests that salinity within the Hoskissons Seam may
also be in the order of 8000 mg/L TDS, and that the lower salinity determined from earlier
monitoring may be limited to areas close to outcrop/subcrop.
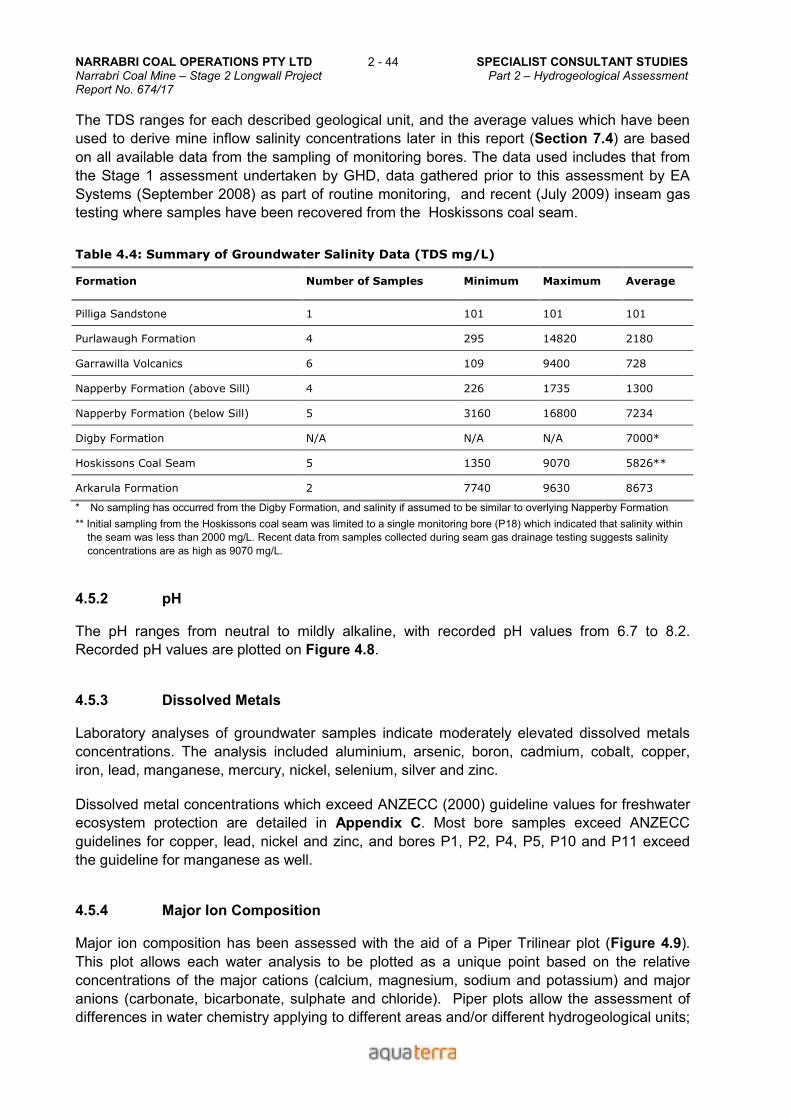
NARRABRI COAL OPERATIONS PTY LTD 2 - 44 SPECIALIST CONSULTANT STUDIES Narrabri Coal Mine – Stage 2 Longwall Project Part 2 – Hydrogeological Assessment Report No. 674/17
The TDS ranges for each described geological unit, and the average values which have been
used to derive mine inflow salinity concentrations later in this report (Section 7.4) are based
on all available data from the sampling of monitoring bores. The data used includes that from
the Stage 1 assessment undertaken by GHD, data gathered prior to this assessment by EA
Systems (September 2008) as part of routine monitoring, and recent (July 2009) inseam gas
testing where samples have been recovered from the Hoskissons coal seam.
Table 4.4: Summary of Groundwater Salinity Data (TDS mg/L)
Formation Number of Samples Minimum Maximum Average
Pilliga Sandstone 1 101 101 101
Purlawaugh Formation 4 295 14820 2180
Garrawilla Volcanics 6 109 9400 728
Napperby Formation (above Sill) 4 226 1735 1300
Napperby Formation (below Sill) 5 3160 16800 7234
Digby Formation N/A N/A N/A 7000*
Hoskissons Coal Seam 5 1350 9070 5826**
Arkarula Formation 2 7740 9630 8673
* No sampling has occurred from the Digby Formation, and salinity if assumed to be similar to overlying Napperby Formation
** Initial sampling from the Hoskissons coal seam was limited to a single monitoring bore (P18) which indicated that salinity within
the seam was less than 2000 mg/L. Recent data from samples collected during seam gas drainage testing suggests salinity
concentrations are as high as 9070 mg/L.
4.5.2 pH
The pH ranges from neutral to mildly alkaline, with recorded pH values from 6.7 to 8.2.
Recorded pH values are plotted on Figure 4.8.
4.5.3 Dissolved Metals
Laboratory analyses of groundwater samples indicate moderately elevated dissolved metals
concentrations. The analysis included aluminium, arsenic, boron, cadmium, cobalt, copper,
iron, lead, manganese, mercury, nickel, selenium, silver and zinc.
Dissolved metal concentrations which exceed ANZECC (2000) guideline values for freshwater
ecosystem protection are detailed in Appendix C. Most bore samples exceed ANZECC
guidelines for copper, lead, nickel and zinc, and bores P1, P2, P4, P5, P10 and P11 exceed
the guideline for manganese as well.
4.5.4 Major Ion Composition
Major ion composition has been assessed with the aid of a Piper Trilinear plot (Figure 4.9).
This plot allows each water analysis to be plotted as a unique point based on the relative
concentrations of the major cations (calcium, magnesium, sodium and potassium) and major
anions (carbonate, bicarbonate, sulphate and chloride). Piper plots allow the assessment of
differences in water chemistry applying to different areas and/or different hydrogeological units;
SPECIALIST CONSULTANT STUDIES 2 - 45 NARRABRI COAL OPERATIONS PTY LTD Part 2 – Hydrogeological Assessment Narrabri Coal Mine – Stage 2 Longwall Project Report No. 674/17
and the relative components of groundwater derived as mixtures of waters from one or more
different sources. Interpretation can also be made as to the influence of recharge and
discharge processes.
In addition to displaying the relative ionic composition, the Piper plot on Figure 4.9 has also
been prepared to provide a broad indication of groundwater salinity, with the plotted symbols
sized according to representative salinity ranges.
Groundwater sampled from the Longwall Project area show variable chemical signatures
which are related to the geology.
All waters are low in sulphate, but there is a broad distribution from bicarbonate to chloride
dominance among the other anions. Chloride dominance occurs in the higher salinity waters
from deeper intersections, particularly in the Pamboola Formation and the Napperby
Formation. Bicarbonate dominance is normally associated with low salinity, and is typically an
indicator of recent recharge or proximity to recharge in the flow system. The bicarbonate-
dominant samples are generally from relatively shallow depths in a range of formations.
However, the waters from the Hoskissons Seam and Arkarula Formation have bicarbonate
dominance combined with relatively high salinity. In this case the high bicarbonate is believed
to be derived from some mineralisation source in the Permian sequence. Note that the
bicarbonate dominance applies to the upper members of the Black Jack Group (i.e.
Hoskissons Seam and Arkarula Formation), but not to the deeper Pamboola Formation.
4.6 Recharge and Discharge
The main recharge mechanism for the groundwater within the Longwall Project area is local
infiltration of rainfall. Recharge rates are a function of rainfall intensity, evaporation, vegetation
coverage and density, topography and the degree of fracturing in the upper surface of the hard
rocks, either at ground surface or at the base of the weathered zone.
Recharge occurs by direct infiltration of rainfall and local runoff into the unconsolidated surficial
material, comprising the weathered zone of the bedrock (regolith layer) as well as
discontinuous occurrence of alluvium/colluvium in low-lying areas. Water percolates
downwards until reaching a zone of reduced permeability (top of fresh bedrock beneath the
alluvium/colluvium, or the base of weathering), and then flows laterally above this less
permeable aquitard layer.
A water-table aquifer may form as either a localised perched aquifer, or more extensive
unconfined aquifer, within the surficial unconsolidated materials.
The Jurassic, Triassic and Permian aquifers of the Longwall Project area are also recharged at
outcrop or subcrop beneath the alluvium or regolith layer. Where permeable parts of these
hard rock units subcrop beneath alluvium, colluvium or highly weathered bedrock, recharge
can occur to these hard rock formations by downward percolation from the unconsolidated
material.
Natural groundwater discharge occurs through evapotranspiration, seepage and spring flow
where the water-table intersects the ground surface, and through baseflow contributions to
creeks and rivers, including possible discharge to the alluvium in some locations. Local spring
NARRABRI COAL OPERATIONS PTY LTD 2 - 46 SPECIALIST CONSULTANT STUDIES Narrabri Coal Mine – Stage 2 Longwall Project Part 2 – Hydrogeological Assessment Report No. 674/17
or seepage discharges may also occur wherever a permeable fractured zone within a hard
rock unit crops out, such as on hillsides or the flanks of creeks and gullies, if the water level in
that unit is higher than the ground surface.
4.7 Groundwater - Surface Water Interactions
There is a very low likelihood for groundwater discharge to surface water systems within the
Longwall Project area, with the possible exception of the area proximal to NC98S, where the
standing water level is shallow (around 5 m below the ground surface). NC98S (P13) is located
on the Claremont property within the sub crop zone of the Garrawilla Volcanics and in a low
lying area adjacent to a local drainage channel. Elsewhere, the groundwater is too deep to
permit discharge to the surface.
NCOPL has identified a spring discharging to surface the south of the Mine Site (Mayfield
Spring) which is utilised for stock watering (Figure 4.10). It is believed to be derived from the
Purlawaugh Formation. Flow rate is difficult to gauge but appears to be very low (<0.1 L/s).
The spring emanates within a low-lying area in a valley. A combination of spring discharge and
streamflow from the catchment upstream supports a small wetland area which has been
formed by a dam constructed across the drainage channel. Land-owners report that the spring-
fed dam is able to maintain permanent water through most extended dry periods due to the
groundwater seepage.
Figure 4.10 shows additional springs located well to the south of the Mine Site (Hardys and
Eather Springs). Details of these springs are not known and the locations were provided by
NOW. Elsewhere there is no evidence of other spring discharges within the Longwall Project
area.
More regionally, it is believed that there may be some slow natural discharge from the Triassic-
Permian formations to the Namoi Valley alluvium to the east of the Longwall Project, but at low
rates relative to the recharge from rainfall, as the alluvium groundwater salinity is much lower
than the salinity of the Triassic-Permian groundwater.
The Jurassic groundwater discharges regionally to the west within the GAB.
4.8 Current Groundwater Use
Details of NOW registered bores in the area were provided in Section 2.9 of this report.
Groundwater use in the vicinity of the Mine Site is restricted to a number of low yielding
groundwater bores used for stock and domestic purposes. There are 18 registered
groundwater bores within 5 km of the Mine Site, all located outside of the Mine Site. All of
these are low yielding stock or domestic bores.
Some higher yielding bores do exist within the Namoi Valley alluvium further afield to the east
of the project.
SPECIALIST CONSULTANT STUDIES 2 - 47 NARRABRI COAL OPERATIONS PTY LTD Part 2 – Hydrogeological Assessment Narrabri Coal Mine – Stage 2 Longwall Project Report No. 674/17
5. MINING PROPOSAL
5.1 Longwall Mining Proposal
NCOPL proposes to construct a longwall mining operation with a maximum annual production
rate of 8 Mtpa.
Mining would involve the sequential development of north-south longwall panels, with nominal
305m panel widths, extending north and south from the central main development gateroads
known as the West Mains. Development headings for the longwalls consist of double-entry
gateroads, with a nominal chain pillar width of 37.5m. Longwall panels will extend up to 4.2 km
north and 3.8 km south from the West Mains. Coal will be conveyed to the Pit Bottom Area for
transfer to the surface via the conveyor drift. The proposed mine layout is illustrated in
Figure 5.1.
It is envisaged that coal production would be achieved through the combination of a single
longwall unit and two or three continuous miners developing roadways. It is envisaged that
extraction of each longwall panel would take approximately 12 months.
5.2 Mining Schedule
Figure 5.1 shows the proposed mining sequence for the projected 29 year life of the Narrabri
Coal Mine.
A total of 26 longwall panels is included in the proposed mine plan, 13 to the north and 13 to
the south of the West Mains. Panels on the northern side (LW1 to LW13) will vary in length
from 1450m to 4,150m. Panels on the southern side (LW14 to LW26) will vary in length from
1500m to 3,850m.
Extraction will commence on the northern side of the West Mains, starting at LW1 (eastern
updip end) and proceeding westwards to LW13, before commencing the panels south of the
West Mains, proceeding from LW14 (western downdip end) updip to LW26.
5.3 Subsidence Predictions
The subsidence assessment was undertaken by Ditton Geotechnical Services Pty Ltd (DGS).
It was based on 305m wide longwall panels with a 4.2 m mining height, and cover depths
ranging from 160m to 380m. The chain pillars are assumed to be up to 37.5m wide, and
gateroad height 3.5m.
DGS (2009) predicted that subsidence impacts affecting formation permeability would extend
at least to the base of the Garrawilla Volcanics, and could possibly extend up into that unit as
well.
DGS reported that “+ direct surface to seam fracturing is ‘unlikely’ for cover depths greater
than 100m and ‘possible’ up to 120m if an adverse geological condition, such as fault
interaction occurs. Indirect or discontinuous sub-surface fracturing could interact with surface
cracks where cover depths are < 215 m.
NARRABRI COAL OPERATIONS PTY LTD 2 - 48 SPECIALIST CONSULTANT STUDIES Narrabri Coal Mine – Stage 2 Longwall Project Part 2 – Hydrogeological Assessment Report No. 674/17
“The modelling outcomes also indicate that the continuous fracture heights for the mining
layout proposed could extend into the Garrawilla Volcanics, if the unit fails, or be truncated at
or near the base of this potentially spanning unit.
“Subsequent groundwater impact studies should consider the above uncertainties in regards to
surface and groundwater impacts.”
5.4 Mine Water Management
Groundwater entering the underground workings will be allowed to flow to sump areas where it
will be pumped to the surface, either for operational use or disposal.
The modelling described in Section 6 indicates that the inflows are predicted to peak in Years
17 – 18 during mining of LW14 to LW16. As mining proceeds back up dip, water will be able to
recover in the goaf areas downdip of the active longwall panel. Hence, net inflow rates are
predicted to start declining from Year 20.
Net inflows are predicted to be initially less than the water demand, but from Year 8 excess
water will be generated from underground inflows, and a disposal plan will need to be
implemented for the excess water.
The base case model using the hydraulic parameters considered to best represent the
hydrogeological units both pre-mining and following subsidence indicates that groundwater
inflows will peak at around 3.8 ML/d (1400 ML/annum). Uncertainty analysis modelling
(described in Section 6.6) shows that peak groundwater inflows to the underground mine
could be as high as 5.2 ML/day (1900 ML/annum) or as low as 3.2 ML/d (1200 ML/annum).
Water management, including management of inflows in excess of project water demands, are
addressed by others.
6. GROUNDWATER MODELLING TO ASSESS POTENTIAL IMPACTS
Groundwater impacts have been assessed with the assistance of a numerical groundwater
model which is described in the following sections.
6.1 Model Software
The MODFLOW numerical groundwater flow modelling package (Harbaugh, et al, 2000) has
been used for this study, in conjunction with the SURFACT module (SURFACT Version 3,
HydroGeoLogic, 2006), operating under the Groundwater Vistas Version 5 graphic interface
software package (ESI, 2005).
The MODFLOW package is the industry-leading groundwater modelling software, and has
advanced modules for simulating surface water and groundwater interaction which allows for
the assessment of impacts on creeks and rivers. However, standard MODFLOW has two
limitations when simulating longwall mining. Firstly, the package does not allow aquifer
properties to change with time as mining progresses. This is important, as longwall mining
SPECIALIST CONSULTANT STUDIES 2 - 49 NARRABRI COAL OPERATIONS PTY LTD Part 2 – Hydrogeological Assessment Narrabri Coal Mine – Stage 2 Longwall Project Report No. 674/17
causes changes in strata hydraulic properties due to fracturing and deformation above the
longwall panels. Secondly, standard MODFLOW cannot routinely simulate free draining
conditions in strata above a longwall panel.
To overcome the first constraint, the model simulation has been run in a series of consecutive
time slice models, with model hydraulic parameters changed from one time slice to the next to
reflect the mining advance and associated subsidence. The second constraint has been
addressed by using the MODFLOW-SURFACT module. SURFACT enables simulation of
saturated and unsaturated flow conditions and provides for more stable drying and re-wetting
of cells in thin model layers (such as coal seams and thin aquitards). The model simulations
have used the variably-saturated flow conditions of the pseudo-soil function provided by the
MODFLOW SURFACT BCF4 package.
Hence, the MODFLOW-SURFACT numerical code, used in conjunction with time slice
modelling, was adopted for this study.
The hydrogeological investigations (including the modelling) were undertaken with reference to
the ‘Guidelines for Management of Stream/Aquifer Systems in Coal Mining Developments –
Hunter Region’ (DIPNR, 2005), and the modelling was undertaken in accordance with the best
practice guideline on groundwater flow modelling (MDBC, 2001). In accordance with this
guideline, it was deemed that the degree of model complexity required to accomplish the study
objectives in this case was a medium complexity model.
6.2 Conceptual Model Design
6.2.1 Model Domain and Boundary Conditions
The model used for this project is based on the model constructed by GHD for the Stage 1 EIS
assessment, but with extensive modifications. It covers an area which includes the Boggabri
Ridge extending west of the Mullaley Sub basin and parts of the Gunnedah, Upper Namoi and
GAB intake bed GWMAs. The model domain was extended to include the Namoi River alluvial
aquifer system. Topographical and geological information in the Namoi area was provided by
DECCW (2007). The model grid is aligned with the MGA grid.
The model domain covers an area of 75km x 52km (3900km2), with a variable grid size ranging
from 50m x 50m in the Mine Site, and increasing gradually up to 500m x 500m near the model
boundaries. This gave a grid mesh of 269 rows and 270 columns, or a total of 606,783 active
cells for the full 11-layer model. The active model area is 1950km2.
The non-uniform grid size in the model was selected to optimise the model run time and
improve the model efficiency. Maintaining the 50m x 50m grid in the proposed mining area
allowed modelling of stream-aquifer interaction processes. The finer grid also allowed better
resolution of the dipping layer geometry, and the potentially steep water level gradients close
to the mine.
The conceptual hydrogeological model is illustrated in Figure 6.1, and which also shows the
domain boundaries adopted in the model. Details of model layers and boundary conditions are
presented on plans in Appendix D.
NARRABRI COAL OPERATIONS PTY LTD 2 - 50 SPECIALIST CONSULTANT STUDIES Narrabri Coal Mine – Stage 2 Longwall Project Part 2 – Hydrogeological Assessment Report No. 674/17
Boundary conditions have been assigned to represent the regional groundwater flow system in
a realistic manner, taking into account stratigraphic and topographic controls. Boundary
conditions have on the whole been maintained from the GHD model, although some
refinement has been made.
No Flow boundaries have been applied along regional flow lines and the basement outcrop of
the Boggabri Ridge.
Bed levels and stage heights for the river boundaries along the Namoi River have been refined
based on the inclusion of the NOW Namoi Valley model, referred to in Section 6.1.
A General Head (or head-dependent flow) boundary was specified at the north-western
defined edge of the model for Layers 1 to 4, which contain the alluvium / regolith layer and the
Jurassic strata associated with the GAB intake beds. This allowed heads to be specified
based on interpreted groundwater levels ranging from 210 to 220m AHD in Layers 1 to 4. This
allows the potential for inflow or outflow to/from the interpreted Great Australian Basin intake
beds.
Layer 5 and below are assessed to be part of the Gunnedah basin, and no General Head or
Constant Head boundaries have been applied to these layers.
6.2.2 Model Layers
The groundwater model contains 11 active layers, as listed in Table 4.3. They represent the
major hydrogeological units within the Longwall Project area.
The topographical upper surface of the model corresponds to the ground surface information
downloaded from the Geosciences Australia website, with a 25m grid node size. The base of
each layer has been taken from geological block modelling within the Longwall Project area
(supplied by NCOPL) and interpolated outside this area from stratigraphic elevations
interpreted from bore logs published in notes accompanying the Narrabri 1:250 000 Geological
Map (DMR, 1971).
The Hoskissons Coal Seam (Layer 9) top and base elevations were interpolated from project
specific bore-logs and extended regionally using information from the regional geological
maps. The regional structure of the Hoskissons Coal Seam was also based on spot level and
general dip information provided with the 1:100,000 geological map (Watkins, et al, 1999).
Model layers have been maintained across the model area to facilitate model output data for
each individual hydrogeologic unit. In areas where a particular hydrogeological unit has been
eroded away or does not exist, the layer representing that unit has been reduced in thickness
to 0.1m and assigned hydraulic properties from the nearest underlying active layer.
A significant change from the GHD model was the direct physical disconnection of lower layers
(i.e. Digby Formation and Blackjack Formation) from any direct connection with shallow alluvial
sediments associated with the Namoi River. This is in keeping with the geology model for the
local stratigraphy, and the recognition that the Digby Formation and the Black Jack Formation
have been partly truncated by the overlying Napperby Formation. The Hoskissons Seam has
been totally eroded away in areas updip from the Mine Site.
SPECIALIST CONSULTANT STUDIES 2 - 51 NARRABRI COAL OPERATIONS PTY LTD Part 2 – Hydrogeological Assessment Narrabri Coal Mine – Stage 2 Longwall Project Report No. 674/17
Layer surface elevation data are presented as plots in Appendix E.
All layers are defined in the model as MODFLOW-SURFACT Type 3 (equivalent to semi-
confined aquifers with variable transmissivity).
The selection of appropriate host permeability values was based on the results of hydraulic
testing combined with model calibration to achieve an adequate match to observed
groundwater levels.
6.2.3 Baseflow
The numerical model design incorporates river/aquifer interaction features to enable
representation of both baseflow discharges from groundwater and recharge from the streams
to the groundwater, as well as quantification of the impacts of groundwater pumping on surface
water features.
Baseflow contribution to rivers and streams represents one of the primary natural groundwater
discharge processes (the other main discharge process applicable to this area being
evapotranspiration). In areas where the groundwater levels may be lower than the creek
system, the creeks may be “losing” streams, i.e. they may lose water by seepage to adjacent
or underlying aquifers. It is possible for larger river / creek systems to provide some recharge
to the aquifer at least periodically, when river or creek levels may be temporarily higher than
groundwater levels following heavy rainfall events. The model is designed to allow both
processes (i.e. baseflow discharge and groundwater recharge) to occur.
The Namoi River is the most significant surface water feature in the area, and it is generally
“gaining”, i.e. it receives baseflow discharges from the groundwater system over most of its
catchment. The Maules Creek component of the alluvial aquifer system in the far eastern part
of the model area (east of the Namoi River) appears to be overall losing water to the alluvial
sediments.
Ephemeral creek characteristics are apparent in most of the tributary drainages where the
baseflow is insufficient to maintain permanent creek flow, and extensive periods of no-flow
occur naturally. Although baseflow within the ephemeral creek systems is considered to be
insignificant, alluvium/colluvium associated with these creeks has been included as a veneer
within Layer 1 of the groundwater model. This has been included primarily because it plays a
key role in local recharge.
The drainages have been represented in the model using the MODFLOW River (RIV)
package.
The river stage elevations in the Namoi River were set to 1m below the river bank elevation,
and river bed levels set to 0.2m below the stage in the main rivers, while the river stage
elevations of the tributary streams have been set to the same level as the stream bed (1m
below the river bank elevation). With this arrangement, the minor tributary streams, which are
ephemeral, act only as baseflow-fed groundwater discharge features in the model, not
potential recharge features; whereas the main rivers/streams can act as either groundwater
discharge or recharge features, depending upon whether the simulated groundwater level is
above or below the specified stream stage level.
NARRABRI COAL OPERATIONS PTY LTD 2 - 52 SPECIALIST CONSULTANT STUDIES Narrabri Coal Mine – Stage 2 Longwall Project Part 2 – Hydrogeological Assessment Report No. 674/17
The river bed conductance parameter was set to a high value of 1000 m2/day, so as not to
constrain flow between the streams and the groundwater.
6.2.4 Recharge
Recharge in the Longwall Project area was discussed in Section 4.6. The percentages of
rainfall that are assumed in the model to recharge the water-table vary depending broadly on
the type and extent of surficial outcrop, and local topography. Six rainfall recharge zones were
defined in the model.
For the steady-state (long-term average) calibration modelling, the annual average recharge
rate has been modelled by applying a spatially-variable effective rainfall percentage to different
zones defined on the basis of sub-crop geology and topography.
The same zone percentage recharge rates have been carried forward to the transient (time-
varying) calibration model, but they were applied to actual monthly rainfalls recorded at the
Narrabri Airport gauge during the 1-year calibration period to September 2008, rather than
average annual rainfalls.
For the forward predictions of mine dewatering, the adopted recharge rates have again been
applied to the average annual rainfall as a constant value with time in each zone.
6.3 Calibration
6.3.1 Calibration Approach
Model calibration involves comparing predicted (modelled) and observed data and making
modifications to model input parameters where required (within reasonable limits defined by
available data and sound hydrogeological judgment) to achieve the best possible match.
In the calibration process, independent variables of the model (parameters and boundary
conditions) are adjusted, within realistic limits, to produce the best match between simulated
and measured data. The realistic limits on parameter values are constrained by the range of
measured values from pumping tests and other hydrogeological investigations.
Model calibration performance is evaluated in both quantitative (head value matching) and
qualitative (pattern-matching) terms, by:
• Scatter plots of modelled versus measured head, and the associated statistical
measure of the scaled root mean square (SRMS) value.
• Hydrographs of modelled versus observed bore water levels.
• Contour plans of modelled head, with posted spot heights of measured head.
• Water balance comparisons.
The SRMS value is the root mean square (RMS) error term divided by the range of heads
across the site, and it is the main quantitative calibration performance indicator. An SRMS
value below 10% is considered to be an appropriate target for this model, consistent with the
groundwater modelling guideline (MDBC, 2001).
SPECIALIST CONSULTANT STUDIES 2 - 53 NARRABRI COAL OPERATIONS PTY LTD Part 2 – Hydrogeological Assessment Narrabri Coal Mine – Stage 2 Longwall Project Report No. 674/17
Calibration has been carried out by both steady-state (i.e. calibration to assumed long-term
equilibrium conditions) and transient (i.e. calibration to the impacts of time-dependent stresses
such as pumping and/or climatic variation) approaches.
6.3.2 Steady State Calibration
Model calibration was achieved using a combination of manual and automated parameter
techniques.
Initially, the groundwater model was set up and run in steady-state mode, to represent long
term average aquifer conditions. The objective was to derive a comprehensive simulation of
pre-development steady-state conditions, for use as initial conditions in the transient model
calibration run and subsequent transient prediction modelling.
The steady state calibration was achieved through an iterative process by making small
manual adjustments to the horizontal and vertical hydraulic conductivity and recharge values
until the best fit between the simulated water levels and interpreted actual long-term average
water levels was obtained.
However, manual calibration was not able to achieve the head difference seen between
Jurassic sediments and underlying strata. Further calibration of the groundwater model was
then undertaken with the use of the automated Parameter Estimation or calibration software
PEST (Watermark Numerical Computing, 2004) and an improved calibration was achieved.
The hydraulic conductivity parameters values were optimised using this program.
Calibration was demonstrated in quantitative and qualitative terms by the following measures:
• Figure 6.2 shows the scatter plot for Narrabri steady state calibration. This plot
shows a normal agreement between the observed and computed heads across
most model layers, with a scaled root mean square (SRMS) error of 11.85%,
slightly above the target value, and coefficient of determination of 0.98
(Table 6.1).
• Figure 6.2 also shows the steady state head profile comparison for the multiple
vibrating wire monitoring bore NC175 against the head profile for the calibrated
groundwater model at the same location for the same stratigraphic horizons
which are monitored in NC175. It shows a reasonable calibration between
observed and simulated model results at this location. The groundwater model
demonstrates an elevated head within Jurassic strata in comparison to Permian
strata although not as significant a head difference between the observed head in
the Garrawilla Volcanics and the Napperby Formation.
• A comparison between observed and modelled heads at each of the 22 target
bores is presented in Table 6.2. Bores screened across more than one aquifer
are listed separately for each model layer in the table. These show generally
good agreement at most sites.
• Contour plans of modelled steady state heads for selected layers are shown in
Figure 6.3 to 6.6.
• A small water balance residual of 0.05% was obtained (Table 6.3).
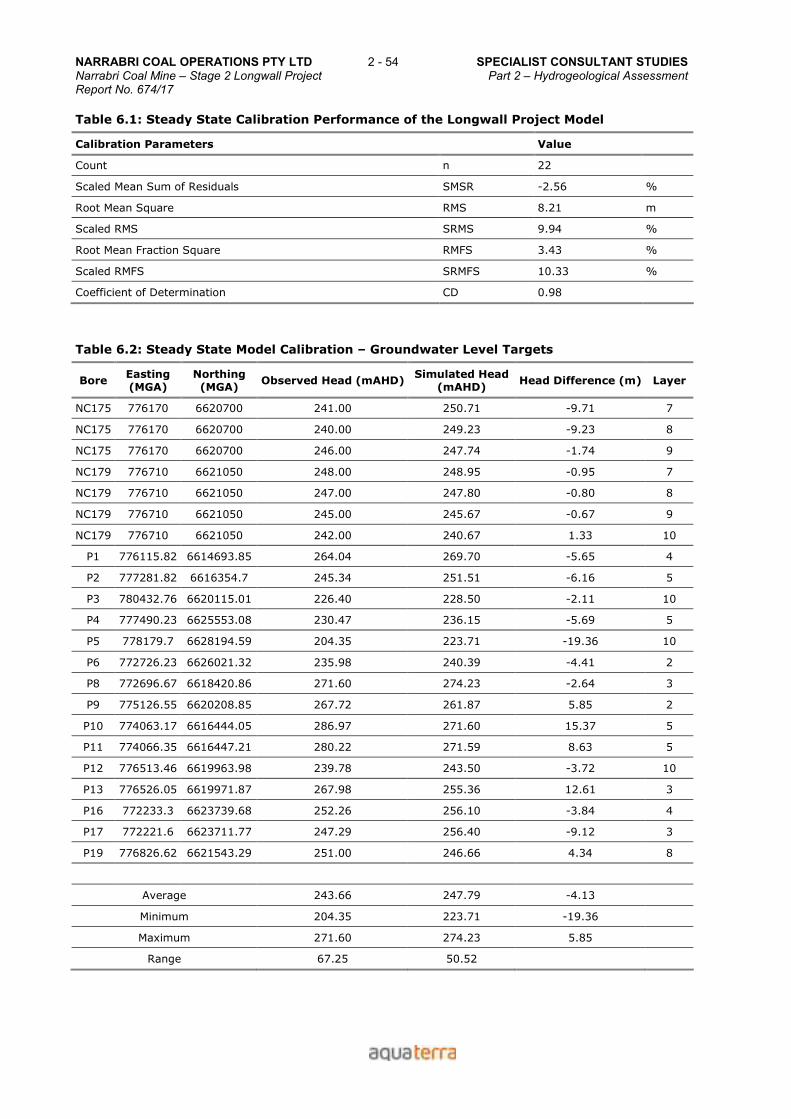
NARRABRI COAL OPERATIONS PTY LTD 2 - 54 SPECIALIST CONSULTANT STUDIES Narrabri Coal Mine – Stage 2 Longwall Project Part 2 – Hydrogeological Assessment Report No. 674/17
Table 6.1: Steady State Calibration Performance of the Longwall Project Model
Calibration Parameters Value
Count n 22
Scaled Mean Sum of Residuals SMSR -2.56 %
Root Mean Square RMS 8.21 m
Scaled RMS SRMS 9.94 %
Root Mean Fraction Square RMFS 3.43 %
Scaled RMFS SRMFS 10.33 %
Coefficient of Determination CD 0.98
Table 6.2: Steady State Model Calibration – Groundwater Level Targets
Bore Easting (MGA)
Northing (MGA)
Observed Head (mAHD) Simulated Head
(mAHD) Head Difference (m) Layer
NC175 776170 6620700 241.00 250.71 -9.71 7
NC175 776170 6620700 240.00 249.23 -9.23 8
NC175 776170 6620700 246.00 247.74 -1.74 9
NC179 776710 6621050 248.00 248.95 -0.95 7
NC179 776710 6621050 247.00 247.80 -0.80 8
NC179 776710 6621050 245.00 245.67 -0.67 9
NC179 776710 6621050 242.00 240.67 1.33 10
P1 776115.82 6614693.85 264.04 269.70 -5.65 4
P2 777281.82 6616354.7 245.34 251.51 -6.16 5
P3 780432.76 6620115.01 226.40 228.50 -2.11 10
P4 777490.23 6625553.08 230.47 236.15 -5.69 5
P5 778179.7 6628194.59 204.35 223.71 -19.36 10
P6 772726.23 6626021.32 235.98 240.39 -4.41 2
P8 772696.67 6618420.86 271.60 274.23 -2.64 3
P9 775126.55 6620208.85 267.72 261.87 5.85 2
P10 774063.17 6616444.05 286.97 271.60 15.37 5
P11 774066.35 6616447.21 280.22 271.59 8.63 5
P12 776513.46 6619963.98 239.78 243.50 -3.72 10
P13 776526.05 6619971.87 267.98 255.36 12.61 3
P16 772233.3 6623739.68 252.26 256.10 -3.84 4
P17 772221.6 6623711.77 247.29 256.40 -9.12 3
P19 776826.62 6621543.29 251.00 246.66 4.34 8
Average 243.66 247.79 -4.13
Minimum 204.35 223.71 -19.36
Maximum 271.60 274.23 5.85
Range 67.25 50.52
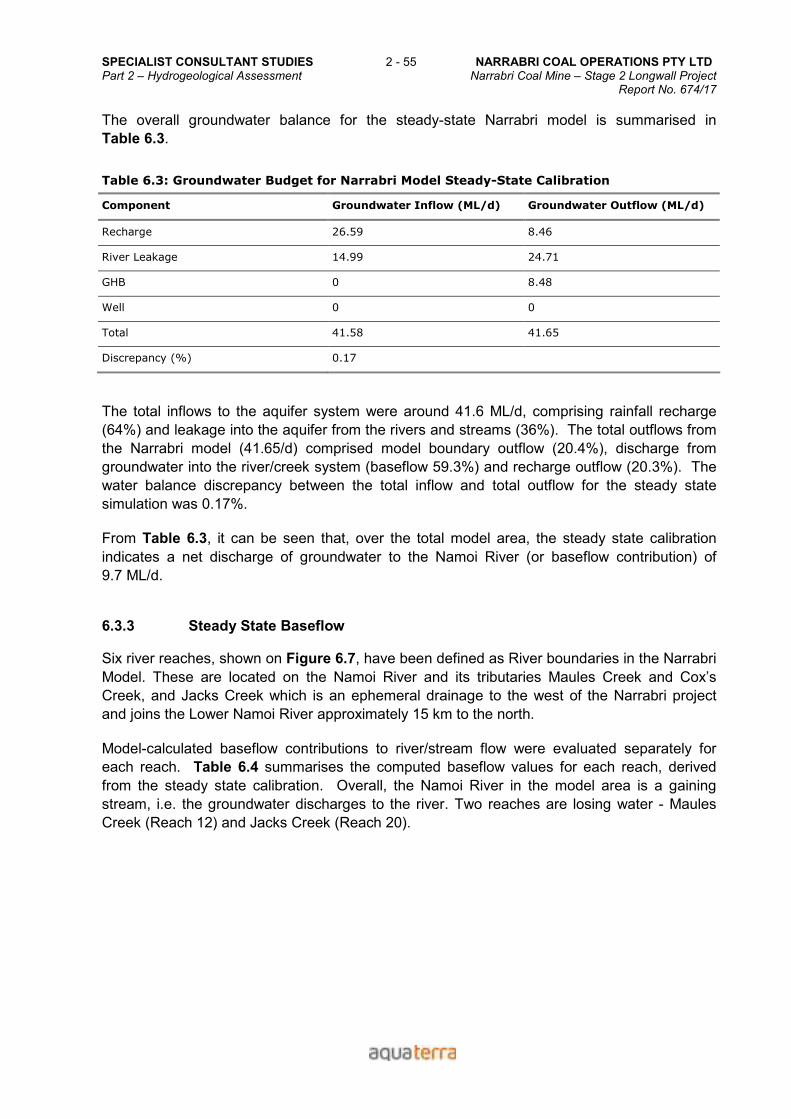
SPECIALIST CONSULTANT STUDIES 2 - 55 NARRABRI COAL OPERATIONS PTY LTD Part 2 – Hydrogeological Assessment Narrabri Coal Mine – Stage 2 Longwall Project Report No. 674/17
The overall groundwater balance for the steady-state Narrabri model is summarised in
Table 6.3.
Table 6.3: Groundwater Budget for Narrabri Model Steady-State Calibration
Component Groundwater Inflow (ML/d) Groundwater Outflow (ML/d)
Recharge 26.59 8.46
River Leakage 14.99 24.71
GHB 0 8.48
Well 0 0
Total 41.58 41.65
Discrepancy (%) 0.17
The total inflows to the aquifer system were around 41.6 ML/d, comprising rainfall recharge
(64%) and leakage into the aquifer from the rivers and streams (36%). The total outflows from
the Narrabri model (41.65/d) comprised model boundary outflow (20.4%), discharge from
groundwater into the river/creek system (baseflow 59.3%) and recharge outflow (20.3%). The
water balance discrepancy between the total inflow and total outflow for the steady state
simulation was 0.17%.
From Table 6.3, it can be seen that, over the total model area, the steady state calibration
indicates a net discharge of groundwater to the Namoi River (or baseflow contribution) of
9.7 ML/d.
6.3.3 Steady State Baseflow
Six river reaches, shown on Figure 6.7, have been defined as River boundaries in the Narrabri
Model. These are located on the Namoi River and its tributaries Maules Creek and Cox’s
Creek, and Jacks Creek which is an ephemeral drainage to the west of the Narrabri project
and joins the Lower Namoi River approximately 15 km to the north.
Model-calculated baseflow contributions to river/stream flow were evaluated separately for
each reach. Table 6.4 summarises the computed baseflow values for each reach, derived
from the steady state calibration. Overall, the Namoi River in the model area is a gaining
stream, i.e. the groundwater discharges to the river. Two reaches are losing water - Maules
Creek (Reach 12) and Jacks Creek (Reach 20).
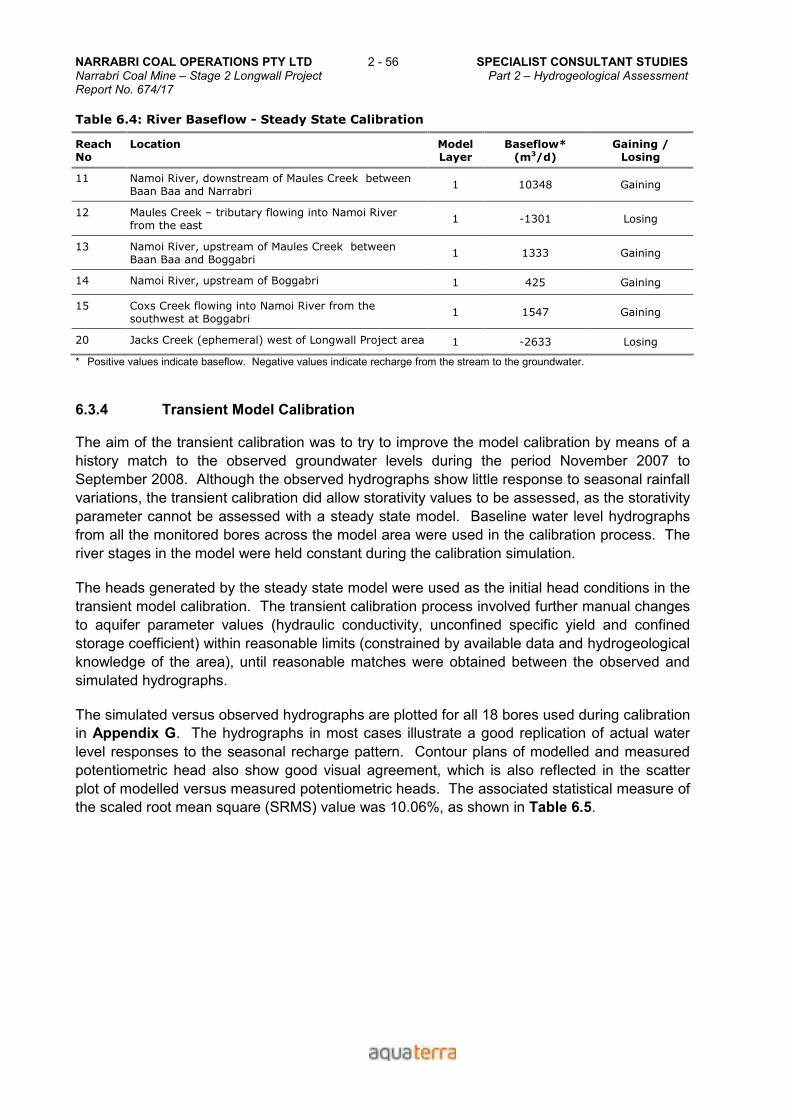
NARRABRI COAL OPERATIONS PTY LTD 2 - 56 SPECIALIST CONSULTANT STUDIES Narrabri Coal Mine – Stage 2 Longwall Project Part 2 – Hydrogeological Assessment Report No. 674/17
Table 6.4: River Baseflow - Steady State Calibration
Reach No
Location Model Layer
Baseflow* (m3/d)
Gaining / Losing
11 Namoi River, downstream of Maules Creek between Baan Baa and Narrabri
1 10348 Gaining
12 Maules Creek – tributary flowing into Namoi River from the east
1 -1301 Losing
13 Namoi River, upstream of Maules Creek between Baan Baa and Boggabri
1 1333 Gaining
14 Namoi River, upstream of Boggabri 1 425 Gaining
15 Coxs Creek flowing into Namoi River from the southwest at Boggabri
1 1547 Gaining
20 Jacks Creek (ephemeral) west of Longwall Project area 1 -2633 Losing
* Positive values indicate baseflow. Negative values indicate recharge from the stream to the groundwater.
6.3.4 Transient Model Calibration
The aim of the transient calibration was to try to improve the model calibration by means of a
history match to the observed groundwater levels during the period November 2007 to
September 2008. Although the observed hydrographs show little response to seasonal rainfall
variations, the transient calibration did allow storativity values to be assessed, as the storativity
parameter cannot be assessed with a steady state model. Baseline water level hydrographs
from all the monitored bores across the model area were used in the calibration process. The
river stages in the model were held constant during the calibration simulation.
The heads generated by the steady state model were used as the initial head conditions in the
transient model calibration. The transient calibration process involved further manual changes
to aquifer parameter values (hydraulic conductivity, unconfined specific yield and confined
storage coefficient) within reasonable limits (constrained by available data and hydrogeological
knowledge of the area), until reasonable matches were obtained between the observed and
simulated hydrographs.
The simulated versus observed hydrographs are plotted for all 18 bores used during calibration
in Appendix G. The hydrographs in most cases illustrate a good replication of actual water
level responses to the seasonal recharge pattern. Contour plans of modelled and measured
potentiometric head also show good visual agreement, which is also reflected in the scatter
plot of modelled versus measured potentiometric heads. The associated statistical measure of
the scaled root mean square (SRMS) value was 10.06%, as shown in Table 6.5.
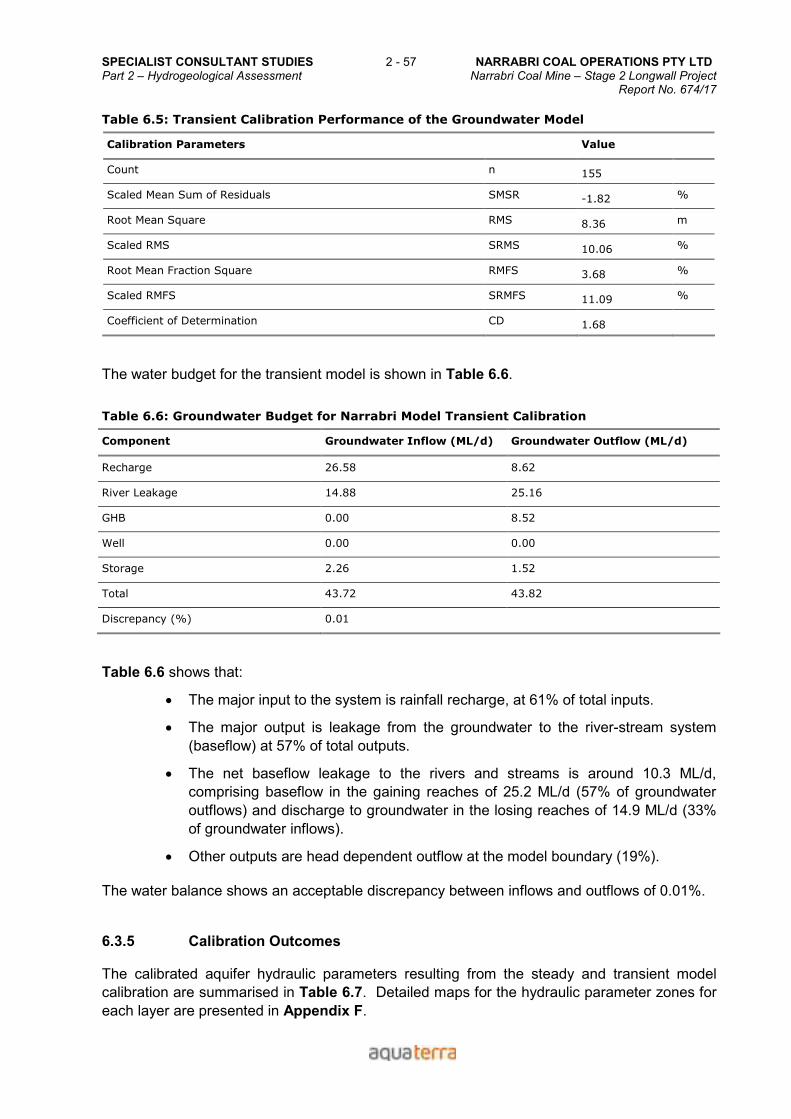
SPECIALIST CONSULTANT STUDIES 2 - 57 NARRABRI COAL OPERATIONS PTY LTD Part 2 – Hydrogeological Assessment Narrabri Coal Mine – Stage 2 Longwall Project Report No. 674/17
Table 6.5: Transient Calibration Performance of the Groundwater Model
Calibration Parameters Value
Count n 155
Scaled Mean Sum of Residuals SMSR -1.82 %
Root Mean Square RMS 8.36 m
Scaled RMS SRMS 10.06 %
Root Mean Fraction Square RMFS 3.68 %
Scaled RMFS SRMFS 11.09 %
Coefficient of Determination CD 1.68
The water budget for the transient model is shown in Table 6.6.
Table 6.6: Groundwater Budget for Narrabri Model Transient Calibration
Component Groundwater Inflow (ML/d) Groundwater Outflow (ML/d)
Recharge 26.58 8.62
River Leakage 14.88 25.16
GHB 0.00 8.52
Well 0.00 0.00
Storage 2.26 1.52
Total 43.72 43.82
Discrepancy (%) 0.01
Table 6.6 shows that:
• The major input to the system is rainfall recharge, at 61% of total inputs.
• The major output is leakage from the groundwater to the river-stream system
(baseflow) at 57% of total outputs.
• The net baseflow leakage to the rivers and streams is around 10.3 ML/d,
comprising baseflow in the gaining reaches of 25.2 ML/d (57% of groundwater
outflows) and discharge to groundwater in the losing reaches of 14.9 ML/d (33%
of groundwater inflows).
• Other outputs are head dependent outflow at the model boundary (19%).
The water balance shows an acceptable discrepancy between inflows and outflows of 0.01%.
6.3.5 Calibration Outcomes
The calibrated aquifer hydraulic parameters resulting from the steady and transient model
calibration are summarised in Table 6.7. Detailed maps for the hydraulic parameter zones for
each layer are presented in Appendix F.
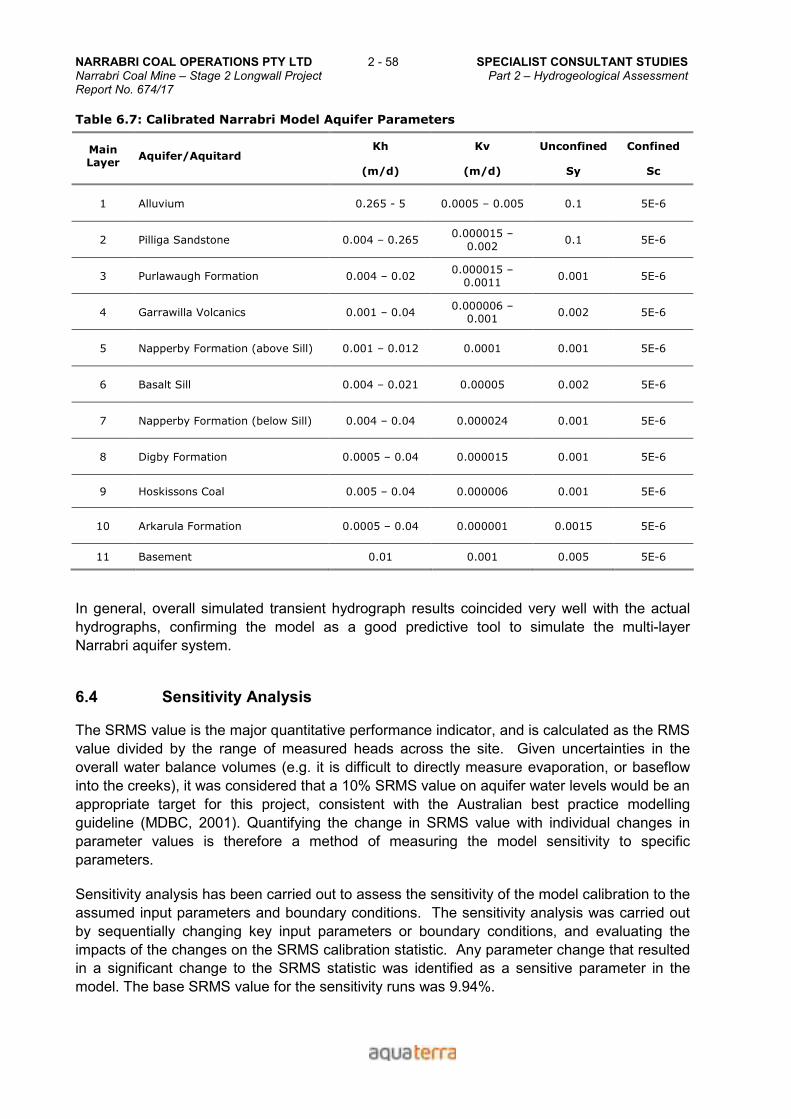
NARRABRI COAL OPERATIONS PTY LTD 2 - 58 SPECIALIST CONSULTANT STUDIES Narrabri Coal Mine – Stage 2 Longwall Project Part 2 – Hydrogeological Assessment Report No. 674/17
Table 6.7: Calibrated Narrabri Model Aquifer Parameters
Kh Kv Unconfined Confined Main Layer
Aquifer/Aquitard
(m/d) (m/d) Sy Sc
1 Alluvium 0.265 - 5 0.0005 – 0.005 0.1 5E-6
2 Pilliga Sandstone 0.004 – 0.265 0.000015 –
0.002 0.1 5E-6
3 Purlawaugh Formation 0.004 – 0.02 0.000015 – 0.0011
0.001 5E-6
4 Garrawilla Volcanics 0.001 – 0.04 0.000006 – 0.001
0.002 5E-6
5 Napperby Formation (above Sill) 0.001 – 0.012 0.0001 0.001 5E-6
6 Basalt Sill 0.004 – 0.021 0.00005 0.002 5E-6
7 Napperby Formation (below Sill) 0.004 – 0.04 0.000024 0.001 5E-6
8 Digby Formation 0.0005 – 0.04 0.000015 0.001 5E-6
9 Hoskissons Coal 0.005 – 0.04 0.000006 0.001 5E-6
10 Arkarula Formation 0.0005 – 0.04 0.000001 0.0015 5E-6
11 Basement 0.01 0.001 0.005 5E-6
In general, overall simulated transient hydrograph results coincided very well with the actual
hydrographs, confirming the model as a good predictive tool to simulate the multi-layer
Narrabri aquifer system.
6.4 Sensitivity Analysis
The SRMS value is the major quantitative performance indicator, and is calculated as the RMS
value divided by the range of measured heads across the site. Given uncertainties in the
overall water balance volumes (e.g. it is difficult to directly measure evaporation, or baseflow
into the creeks), it was considered that a 10% SRMS value on aquifer water levels would be an
appropriate target for this project, consistent with the Australian best practice modelling
guideline (MDBC, 2001). Quantifying the change in SRMS value with individual changes in
parameter values is therefore a method of measuring the model sensitivity to specific
parameters.
Sensitivity analysis has been carried out to assess the sensitivity of the model calibration to the
assumed input parameters and boundary conditions. The sensitivity analysis was carried out
by sequentially changing key input parameters or boundary conditions, and evaluating the
impacts of the changes on the SRMS calibration statistic. Any parameter change that resulted
in a significant change to the SRMS statistic was identified as a sensitive parameter in the
model. The base SRMS value for the sensitivity runs was 9.94%.
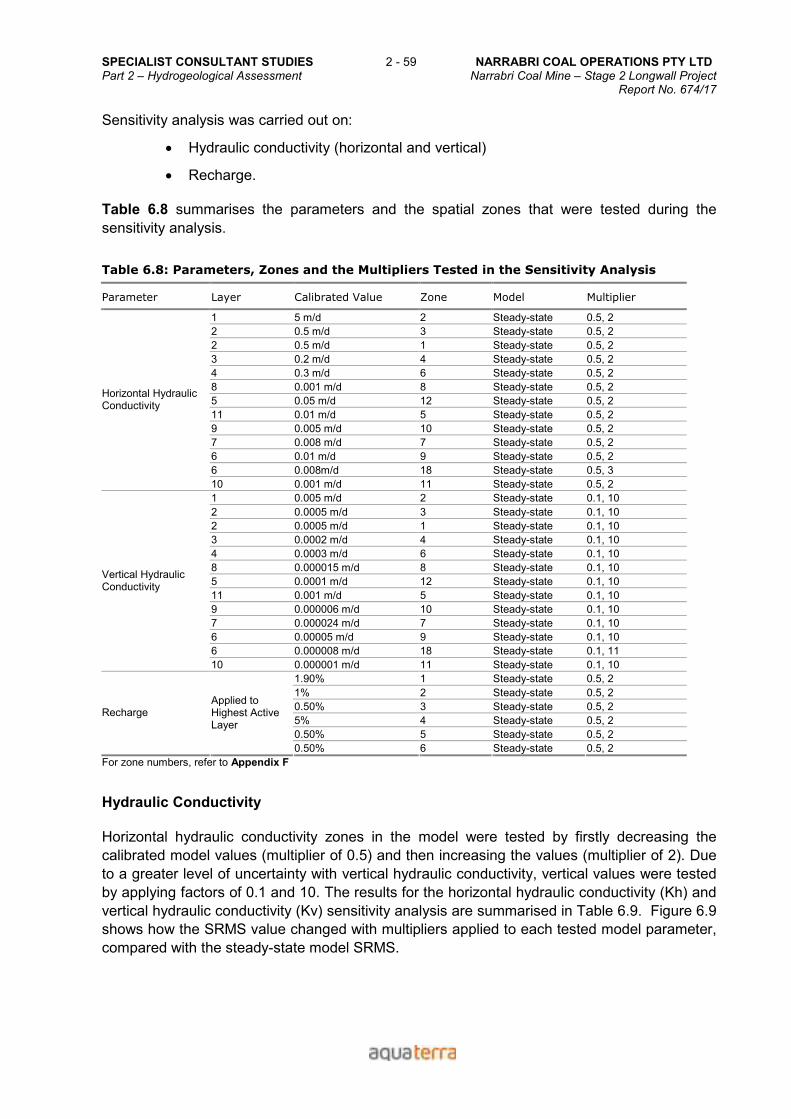
SPECIALIST CONSULTANT STUDIES 2 - 59 NARRABRI COAL OPERATIONS PTY LTD Part 2 – Hydrogeological Assessment Narrabri Coal Mine – Stage 2 Longwall Project Report No. 674/17
Sensitivity analysis was carried out on:
• Hydraulic conductivity (horizontal and vertical)
• Recharge.
Table 6.8 summarises the parameters and the spatial zones that were tested during the
sensitivity analysis.
Table 6.8: Parameters, Zones and the Multipliers Tested in the Sensitivity Analysis
Parameter Layer Calibrated Value Zone Model Multiplier
1 5 m/d 2 Steady-state 0.5, 2
2 0.5 m/d 3 Steady-state 0.5, 2
2 0.5 m/d 1 Steady-state 0.5, 2
3 0.2 m/d 4 Steady-state 0.5, 2
4 0.3 m/d 6 Steady-state 0.5, 2
8 0.001 m/d 8 Steady-state 0.5, 2
5 0.05 m/d 12 Steady-state 0.5, 2
11 0.01 m/d 5 Steady-state 0.5, 2
9 0.005 m/d 10 Steady-state 0.5, 2
7 0.008 m/d 7 Steady-state 0.5, 2
6 0.01 m/d 9 Steady-state 0.5, 2
6 0.008m/d 18 Steady-state 0.5, 3
Horizontal Hydraulic Conductivity
10 0.001 m/d 11 Steady-state 0.5, 2
1 0.005 m/d 2 Steady-state 0.1, 10
2 0.0005 m/d 3 Steady-state 0.1, 10
2 0.0005 m/d 1 Steady-state 0.1, 10
3 0.0002 m/d 4 Steady-state 0.1, 10
4 0.0003 m/d 6 Steady-state 0.1, 10
8 0.000015 m/d 8 Steady-state 0.1, 10
5 0.0001 m/d 12 Steady-state 0.1, 10
11 0.001 m/d 5 Steady-state 0.1, 10
9 0.000006 m/d 10 Steady-state 0.1, 10
7 0.000024 m/d 7 Steady-state 0.1, 10
6 0.00005 m/d 9 Steady-state 0.1, 10
6 0.000008 m/d 18 Steady-state 0.1, 11
Vertical Hydraulic Conductivity
10 0.000001 m/d 11 Steady-state 0.1, 10
1.90% 1 Steady-state 0.5, 2
1% 2 Steady-state 0.5, 2
0.50% 3 Steady-state 0.5, 2
5% 4 Steady-state 0.5, 2
0.50% 5 Steady-state 0.5, 2
Recharge Applied to Highest Active Layer
0.50% 6 Steady-state 0.5, 2
For zone numbers, refer to Appendix F
Hydraulic Conductivity
Horizontal hydraulic conductivity zones in the model were tested by firstly decreasing the
calibrated model values (multiplier of 0.5) and then increasing the values (multiplier of 2). Due
to a greater level of uncertainty with vertical hydraulic conductivity, vertical values were tested
by applying factors of 0.1 and 10. The results for the horizontal hydraulic conductivity (Kh) and
vertical hydraulic conductivity (Kv) sensitivity analysis are summarised in Table 6.9. Figure 6.9
shows how the SRMS value changed with multipliers applied to each tested model parameter,
compared with the steady-state model SRMS.
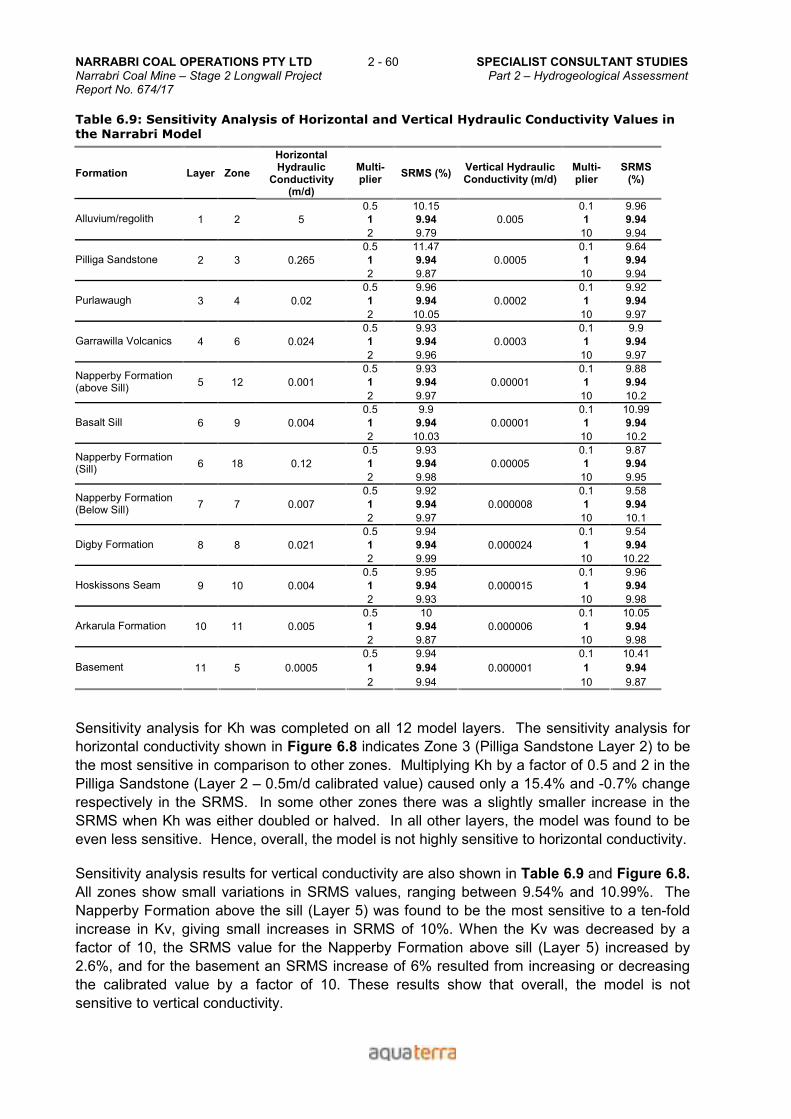
NARRABRI COAL OPERATIONS PTY LTD 2 - 60 SPECIALIST CONSULTANT STUDIES Narrabri Coal Mine – Stage 2 Longwall Project Part 2 – Hydrogeological Assessment Report No. 674/17
Table 6.9: Sensitivity Analysis of Horizontal and Vertical Hydraulic Conductivity Values in
the Narrabri Model
Formation Layer Zone
Horizontal Hydraulic
Conductivity (m/d)
Multi-plier
SRMS (%) Vertical Hydraulic Conductivity (m/d)
Multi-plier
SRMS (%)
0.5 10.15 0.1 9.96
1 2 5 1 9.94 0.005 1 9.94 Alluvium/regolith
2 9.79 10 9.94
0.5 11.47 0.1 9.64
2 3 0.265 1 9.94 0.0005 1 9.94 Pilliga Sandstone
2 9.87 10 9.94
0.5 9.96 0.1 9.92
3 4 0.02 1 9.94 0.0002 1 9.94 Purlawaugh
2 10.05 10 9.97
0.5 9.93 0.1 9.9
4 6 0.024 1 9.94 0.0003 1 9.94 Garrawilla Volcanics
2 9.96 10 9.97
0.5 9.93 0.1 9.88
5 12 0.001 1 9.94 0.00001 1 9.94 Napperby Formation (above Sill)
2 9.97 10 10.2
0.5 9.9 0.1 10.99
6 9 0.004 1 9.94 0.00001 1 9.94 Basalt Sill
2 10.03 10 10.2
0.5 9.93 0.1 9.87
6 18 0.12 1 9.94 0.00005 1 9.94 Napperby Formation (Sill)
2 9.98 10 9.95
0.5 9.92 0.1 9.58
7 7 0.007 1 9.94 0.000008 1 9.94 Napperby Formation (Below Sill)
2 9.97 10 10.1
0.5 9.94 0.1 9.54
8 8 0.021 1 9.94 0.000024 1 9.94 Digby Formation
2 9.99 10 10.22
0.5 9.95 0.1 9.96
9 10 0.004 1 9.94 0.000015 1 9.94 Hoskissons Seam
2 9.93 10 9.98
0.5 10 0.1 10.05
10 11 0.005 1 9.94 0.000006 1 9.94 Arkarula Formation
2 9.87 10 9.98
0.5 9.94 0.1 10.41
11 5 0.0005 1 9.94 0.000001 1 9.94 Basement
2 9.94 10 9.87
Sensitivity analysis for Kh was completed on all 12 model layers. The sensitivity analysis for
horizontal conductivity shown in Figure 6.8 indicates Zone 3 (Pilliga Sandstone Layer 2) to be
the most sensitive in comparison to other zones. Multiplying Kh by a factor of 0.5 and 2 in the
Pilliga Sandstone (Layer 2 – 0.5m/d calibrated value) caused only a 15.4% and -0.7% change
respectively in the SRMS. In some other zones there was a slightly smaller increase in the
SRMS when Kh was either doubled or halved. In all other layers, the model was found to be
even less sensitive. Hence, overall, the model is not highly sensitive to horizontal conductivity.
Sensitivity analysis results for vertical conductivity are also shown in Table 6.9 and Figure 6.8.
All zones show small variations in SRMS values, ranging between 9.54% and 10.99%. The
Napperby Formation above the sill (Layer 5) was found to be the most sensitive to a ten-fold
increase in Kv, giving small increases in SRMS of 10%. When the Kv was decreased by a
factor of 10, the SRMS value for the Napperby Formation above sill (Layer 5) increased by
2.6%, and for the basement an SRMS increase of 6% resulted from increasing or decreasing
the calibrated value by a factor of 10. These results show that overall, the model is not
sensitive to vertical conductivity.
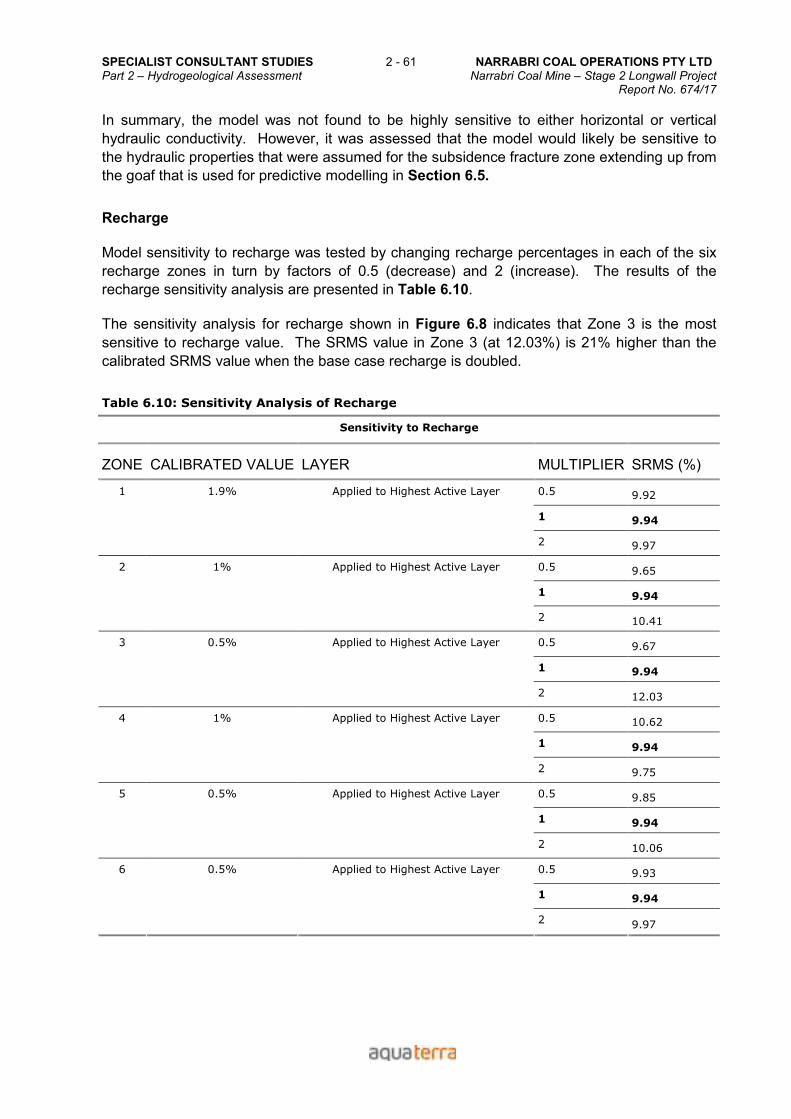
SPECIALIST CONSULTANT STUDIES 2 - 61 NARRABRI COAL OPERATIONS PTY LTD Part 2 – Hydrogeological Assessment Narrabri Coal Mine – Stage 2 Longwall Project Report No. 674/17
In summary, the model was not found to be highly sensitive to either horizontal or vertical
hydraulic conductivity. However, it was assessed that the model would likely be sensitive to
the hydraulic properties that were assumed for the subsidence fracture zone extending up from
the goaf that is used for predictive modelling in Section 6.5.
Recharge
Model sensitivity to recharge was tested by changing recharge percentages in each of the six
recharge zones in turn by factors of 0.5 (decrease) and 2 (increase). The results of the
recharge sensitivity analysis are presented in Table 6.10.
The sensitivity analysis for recharge shown in Figure 6.8 indicates that Zone 3 is the most
sensitive to recharge value. The SRMS value in Zone 3 (at 12.03%) is 21% higher than the
calibrated SRMS value when the base case recharge is doubled.
Table 6.10: Sensitivity Analysis of Recharge
Sensitivity to Recharge
ZONE CALIBRATED VALUE LAYER MULTIPLIER SRMS (%)
0.5 9.92
1 9.94
1 1.9% Applied to Highest Active Layer
2 9.97
0.5 9.65
1 9.94
2 1% Applied to Highest Active Layer
2 10.41
0.5 9.67
1 9.94
3 0.5% Applied to Highest Active Layer
2 12.03
0.5 10.62
1 9.94
4 1% Applied to Highest Active Layer
2 9.75
0.5 9.85
1 9.94
5 0.5% Applied to Highest Active Layer
2 10.06
0.5 9.93
1 9.94
6 0.5% Applied to Highest Active Layer
2 9.97
NARRABRI COAL OPERATIONS PTY LTD 2 - 62 SPECIALIST CONSULTANT STUDIES Narrabri Coal Mine – Stage 2 Longwall Project Part 2 – Hydrogeological Assessment Report No. 674/17
6.5 Predictive Modelling
The overall objective of the predictive modelling was to assess the potential impacts of the
Longwall Project on the groundwater environment, specifically with regard to:
• Predicted mine inflow rates;
• Regional changes in groundwater levels, both during mining and after mine
closure;
• Changes in baseflow contributions to surface watercourses, particularly the
Namoi River system.
Predictions for the Narrabri Model have been carried out in accordance with the proposed
mining schedule outlined in Figure 5.1. Predictions have also been made for a 100 year
period of post-mining recovery.
The “Base Case” simulation of potential mining impacts involved a simulation comprising 14
time slices, with the first time slice representing 3 years and each of the others representing 2
years, for a 29 year total mine life. The calibrated set of boundary conditions and hydraulic
properties (Table 6.7) was adopted for the Base Case, except that the hydraulic properties of
the model cells within the region above the longwall goafs are changed progressively to reflect
progressive effects of subsidence fracturing. The approach followed in changing the fracture
zone properties is described in Section 6.5.3.
Uncertainty in the predicted outcomes has been assessed by re-running the base case model
with a range of different assumed values for selected sensitive hydraulic parameters in the
subsidence affected zone above mined longwall panels, as described in Section 6.6.
6.5.1 Time Scale Selection
In order to simulate the change in hydraulic properties that occurs above extracted longwall
panels during mining, it is necessary to be able to change the hydraulic properties of selected
model cells during the predictive simulation. Specifically, models cells for the Hoskissons
Seam (Layer 9) initially have coal seam properties, then progressively goaf properties as
mining develops. Likewise, the overburden in Layers 5 to 8 overlying the coal seam initially has
in-situ rock properties, but these change following coal extraction, as fracturing occurs within
the overlying subsidence zone.
As indicated in Section 6.1, MODFLOW-SURFACT does not allow changing of hydraulic
conductivity parameters with time during a single simulation. Hence, successive ‘time slice’
models of short duration (generally 2 years) have been used, to allow parameters to be
changed for each time slice in specific areas to represent the underground mining advance
and the progressive expansion of the subsidence failure zone.
Two year time slices with 1 year stress periods were used, matched to the mine schedule
shown on Figure 5.1. The output heads from each time slice model were used as starting
heads for the next successive time slice, and hydraulic conductivities changed to reflect
subsided strata above the extraction area for that time slice. This process was repeated until
the entire mine plan had been simulated.
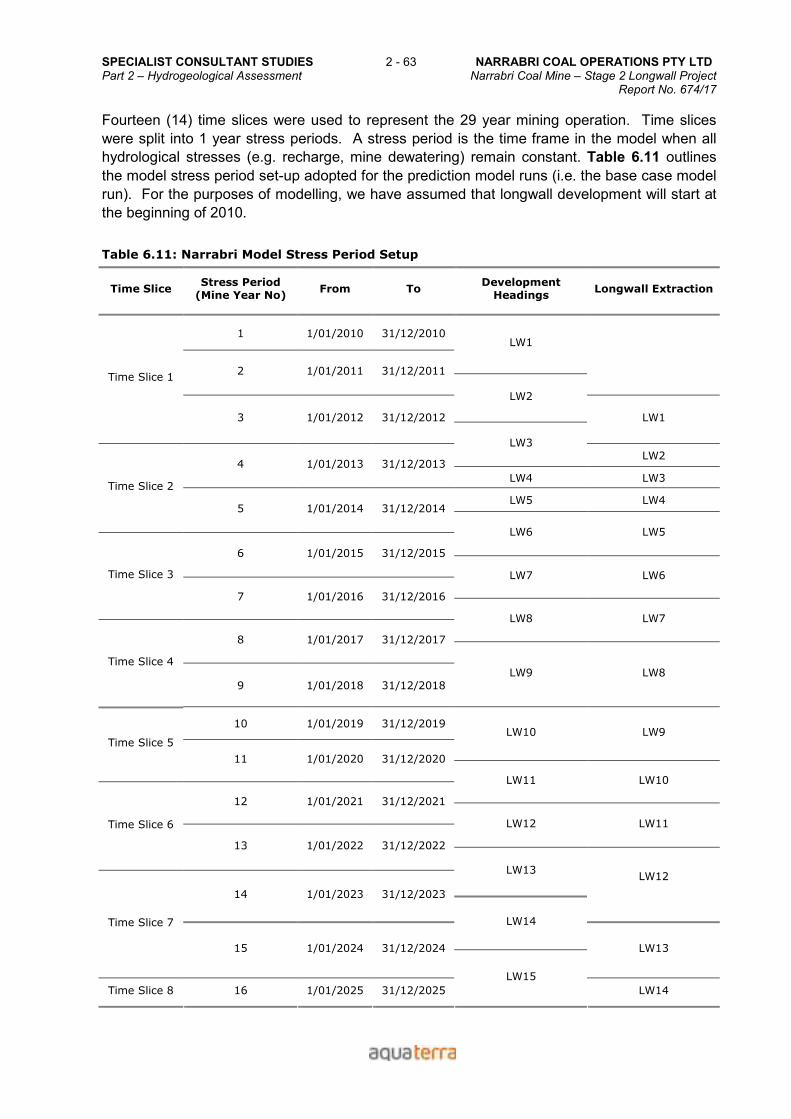
SPECIALIST CONSULTANT STUDIES 2 - 63 NARRABRI COAL OPERATIONS PTY LTD Part 2 – Hydrogeological Assessment Narrabri Coal Mine – Stage 2 Longwall Project Report No. 674/17
Fourteen (14) time slices were used to represent the 29 year mining operation. Time slices
were split into 1 year stress periods. A stress period is the time frame in the model when all
hydrological stresses (e.g. recharge, mine dewatering) remain constant. Table 6.11 outlines
the model stress period set-up adopted for the prediction model runs (i.e. the base case model
run). For the purposes of modelling, we have assumed that longwall development will start at
the beginning of 2010.
Table 6.11: Narrabri Model Stress Period Setup
Time Slice Stress Period (Mine Year No)
From To Development
Headings Longwall Extraction
1 1/01/2010 31/12/2010 LW1
2 1/01/2011 31/12/2011
LW2
Time Slice 1
3 1/01/2012 31/12/2012 LW1
LW3 LW2
4 1/01/2013 31/12/2013
LW4 LW3
LW5 LW4
Time Slice 2
5 1/01/2014 31/12/2014
LW6 LW5
6 1/01/2015 31/12/2015
LW7 LW6 Time Slice 3
7 1/01/2016 31/12/2016
LW8 LW7
8 1/01/2017 31/12/2017
Time Slice 4
9 1/01/2018 31/12/2018 LW9 LW8
10 1/01/2019 31/12/2019 LW10 LW9
Time Slice 5
11 1/01/2020 31/12/2020
LW11 LW10
12 1/01/2021 31/12/2021
LW12 LW11 Time Slice 6
13 1/01/2022 31/12/2022
LW13
14 1/01/2023 31/12/2023
LW12
LW14 Time Slice 7
15 1/01/2024 31/12/2024 LW13
Time Slice 8 16 1/01/2025 31/12/2025
LW15
LW14
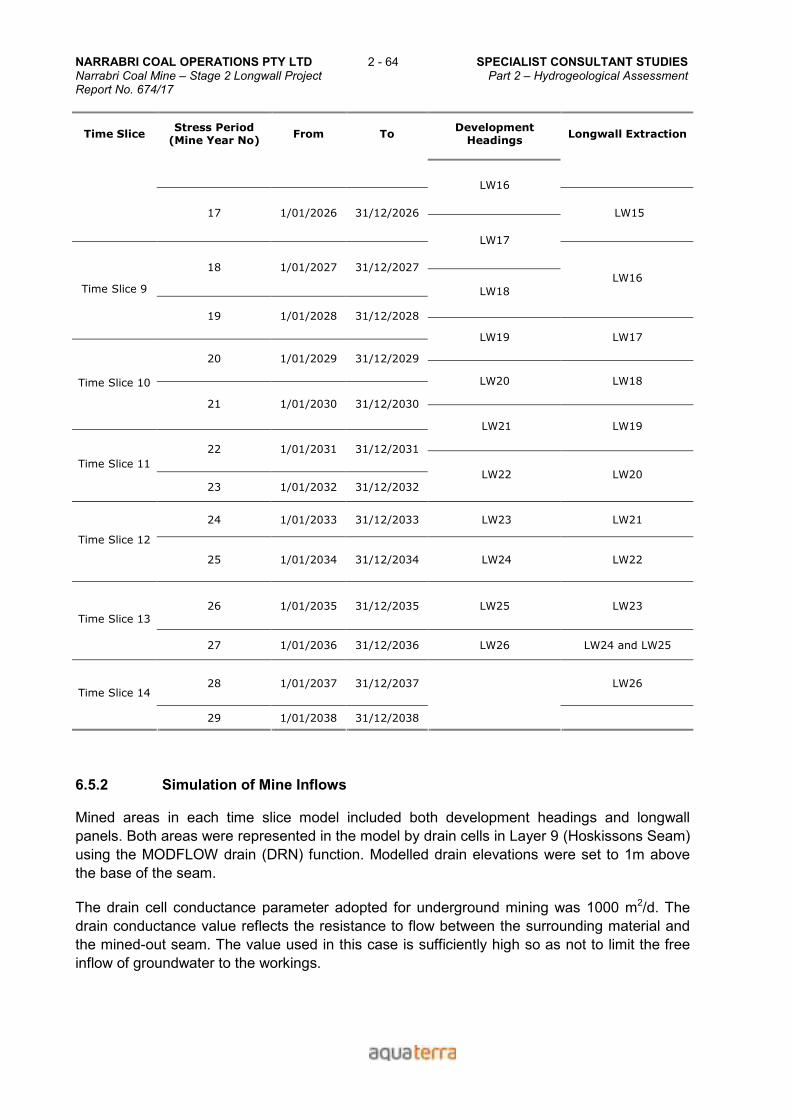
NARRABRI COAL OPERATIONS PTY LTD 2 - 64 SPECIALIST CONSULTANT STUDIES Narrabri Coal Mine – Stage 2 Longwall Project Part 2 – Hydrogeological Assessment Report No. 674/17
Time Slice Stress Period (Mine Year No)
From To Development
Headings Longwall Extraction
LW16
17 1/01/2026 31/12/2026 LW15
LW17
18 1/01/2027 31/12/2027
LW18
LW16 Time Slice 9
19 1/01/2028 31/12/2028
LW19 LW17
20 1/01/2029 31/12/2029
LW20 LW18 Time Slice 10
21 1/01/2030 31/12/2030
LW21 LW19
22 1/01/2031 31/12/2031
Time Slice 11
23 1/01/2032 31/12/2032 LW22 LW20
24 1/01/2033 31/12/2033 LW23 LW21
Time Slice 12
25 1/01/2034 31/12/2034 LW24 LW22
26 1/01/2035 31/12/2035 LW25 LW23 Time Slice 13
27 1/01/2036 31/12/2036 LW26 LW24 and LW25
28 1/01/2037 31/12/2037 LW26 Time Slice 14
29 1/01/2038 31/12/2038
6.5.2 Simulation of Mine Inflows
Mined areas in each time slice model included both development headings and longwall
panels. Both areas were represented in the model by drain cells in Layer 9 (Hoskissons Seam)
using the MODFLOW drain (DRN) function. Modelled drain elevations were set to 1m above
the base of the seam.
The drain cell conductance parameter adopted for underground mining was 1000 m2/d. The
drain conductance value reflects the resistance to flow between the surrounding material and
the mined-out seam. The value used in this case is sufficiently high so as not to limit the free
inflow of groundwater to the workings.

SPECIALIST CONSULTANT STUDIES 2 - 65 NARRABRI COAL OPERATIONS PTY LTD Part 2 – Hydrogeological Assessment Narrabri Coal Mine – Stage 2 Longwall Project Report No. 674/17
6.5.3 Simulation of Goaf and Subsidence Fracturing
The development headings were represented only by drains in the seam (Layer 9), whereas
the longwall panels were represented by drains in Layer 9 as well as by changed hydraulic
parameters in both the seam (Layer 9) and in some of the overlying layers (Layers 5 to 8) in
accordance with the panel progression and the predicted heights of subsidence impacts.
Drains were activated in both development headings and extraction panels in advance (i.e. at
the start of the simulation for all cells to be mined in that period), whereas changes to hydraulic
properties above the panels were delayed until the next time slice (i.e. until after the relevant
panel area has been mined).
6.5.4 Predicted Mine Inflow Rates
Mine inflow rates in the Narrabri Model were calculated by the weighted average method, in
which the model-calculated inflow rate at the end of each time step is multiplied by the duration
of the time step, and the volumes are then summed for all time steps in each stress period,
and divided by the stress period time (i.e. essentially a step-wise integration of the area under
the inflow curve).
Table 6.13 and Figure 6.9 show the predicted Narrabri mine inflow rates from the base case
model simulation during the 29 years of operational mining. Total predicted mine inflows at
Narrabri range from 78 ML/a in Mine Year 1 up to a maximum of 1419 ML/a in Mine Year 18
(i.e. 0.21 ML/d to 3.89 ML/d). It is seen that inflows peak in Years 18 - 20 (2027-2029), during
the mining of LW15 - LW17. Thereafter, inflow rates steadily decline, as mining retreats further
up-dip to the east and groundwater is allowed to flow back into the down-dip goaf areas.
Figure 6.10 shows the mass balance for the Digby Formation (Layer 8), Hoskissons Seam
(Layer 9) and Arkarula Formation (Layer 10) for the area occupied by the mine footprint in the
final time slice of the modelled mine schedule (Years 27 – 29). It shows that in the Digby
Formation and the Hoskissons Seam, groundwater flow is dominated by migration from above
through the fractured zone. There is a relatively small proportion of lateral flow except for early
in the time step as the model settles down. Also apparent is the relatively small upward
transfer of groundwater from the Arkarula Formation (Layer 10) below the coal seam.
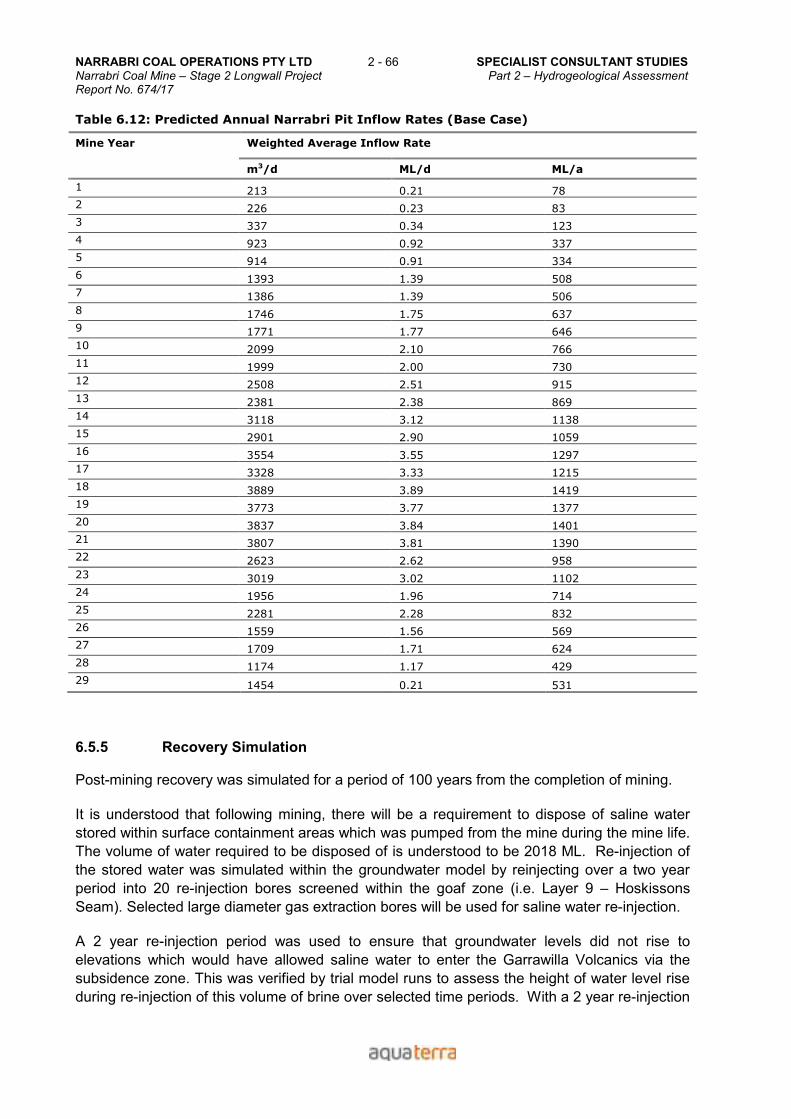
NARRABRI COAL OPERATIONS PTY LTD 2 - 66 SPECIALIST CONSULTANT STUDIES Narrabri Coal Mine – Stage 2 Longwall Project Part 2 – Hydrogeological Assessment Report No. 674/17
Table 6.12: Predicted Annual Narrabri Pit Inflow Rates (Base Case)
Weighted Average Inflow Rate Mine Year
m3/d ML/d ML/a
1 213 0.21 78
2 226 0.23 83
3 337 0.34 123
4 923 0.92 337
5 914 0.91 334
6 1393 1.39 508
7 1386 1.39 506
8 1746 1.75 637
9 1771 1.77 646
10 2099 2.10 766
11 1999 2.00 730
12 2508 2.51 915
13 2381 2.38 869
14 3118 3.12 1138
15 2901 2.90 1059
16 3554 3.55 1297
17 3328 3.33 1215
18 3889 3.89 1419
19 3773 3.77 1377
20 3837 3.84 1401
21 3807 3.81 1390
22 2623 2.62 958
23 3019 3.02 1102
24 1956 1.96 714
25 2281 2.28 832
26 1559 1.56 569
27 1709 1.71 624
28 1174 1.17 429
29 1454 0.21 531
6.5.5 Recovery Simulation
Post-mining recovery was simulated for a period of 100 years from the completion of mining.
It is understood that following mining, there will be a requirement to dispose of saline water
stored within surface containment areas which was pumped from the mine during the mine life.
The volume of water required to be disposed of is understood to be 2018 ML. Re-injection of
the stored water was simulated within the groundwater model by reinjecting over a two year
period into 20 re-injection bores screened within the goaf zone (i.e. Layer 9 – Hoskissons
Seam). Selected large diameter gas extraction bores will be used for saline water re-injection.
A 2 year re-injection period was used to ensure that groundwater levels did not rise to
elevations which would have allowed saline water to enter the Garrawilla Volcanics via the
subsidence zone. This was verified by trial model runs to assess the height of water level rise
during re-injection of this volume of brine over selected time periods. With a 2 year re-injection
SPECIALIST CONSULTANT STUDIES 2 - 67 NARRABRI COAL OPERATIONS PTY LTD Part 2 – Hydrogeological Assessment Narrabri Coal Mine – Stage 2 Longwall Project Report No. 674/17
period, it was found that water levels in the goaf area do not rise above the top of the
Napperby Formation during the re-injection period.
Hence the first 2 years of the post-mining recovery period involved the re-injection of the brine.
The predicted water levels at the end of re-injection (Year 31) were used as the initial
conditions for modelling the remaining 98 years of the recovery period.
Goaf and fracture zone parameters were retained in the cells within the longwall panels and
the overlying fracture zone throughout the recovery period. All drains had been deactivated
prior to commencement of saline water re-injection.
6.5.6 Predicted Water Level Drawdowns
Figures 6.11 and 6.12 show predicted groundwater levels in Model Layer 1 (Alluvium) at the
midpoint of the mine life (Year 15) and at end of mining (Year 29).
Figures 6.13 to 6.20 show predicted drawdowns in Model Layer 1 (Alluvium), Layer 4
(Garrawilla Volcanics), Layer 5 (Napperby Formation above the sill) and Layer 9 (Hoskissons
Coal Seam) at Year 15 and at completion of mining (Year 29).
Figures 6.21 to 6.24 show predicted residual drawdowns in Model Layer 1 (Alluvium), Layer 4
(Garrawilla Volcanics), Layer 5 (Napperby Formation above Sill) and Layer 9 (Hoskissons Coal
Seam) at the end of the recovery period (Year 129).
Hydrographs of predicted water level drawdown and recovery at key Narrabri monitoring bore
locations, and two selected locations in the Namoi Valley alluvium between the mine and the
valley, set in the alluvium/colluvium/regolith (Layer 1) and the basement layer (Layer 11), are
presented in Appendix H. In summary, the drawdown plots and hydrographs show the
following:
• Drawdowns in the Namoi Valley alluvium (Layer 1) are predicted to be less than
0.1m.
• Drawdowns in the water table within the regolith (Layer 1) at the end of mining
are predicted to be less than 1 m outside the mine footprint area and limited to
areas close to the mine. Within the mine footprint area, drawdown is limited to
less than a maximum of 5 m.
• Within the Napperby Formation above the sill (Layer 5), drawdowns of up to 5m
are predicted adjacent to the mine at the end of mining. Predicted drawdowns of
1m or more are limited to the area within 0.5 km of the mine.
• At the end of the 100 year recovery period, water levels in all hydrogeological
units are predicted to have recovered to close to pre-mining levels.
6.5.7 Predicted Baseflow Impacts
The impact of mining on groundwater baseflow discharges to Namoi River, Maules Creek and
Jacks Creek has been assessed from the results of the Base Case predictive model run.
Baseflows were examined separately for each of the six river reaches designated on
Figure 6.7.
NARRABRI COAL OPERATIONS PTY LTD 2 - 68 SPECIALIST CONSULTANT STUDIES Narrabri Coal Mine – Stage 2 Longwall Project Part 2 – Hydrogeological Assessment Report No. 674/17
Baseflow impacts have been assessed through the 29 year mining period and the subsequent
100 year recovery period.
Figure 6.27 shows the predicted baseflows and baseflow changes for the six river reaches
over the 29 year mining period, and Figure 6.28 shows the baseflows and baseflow impacts,
from the commencement of mining (Year 0) to the end of the 100 year recovery period (Year
129).
Most of the river reach baseflows are stable during the mining period. A small reduction in
groundwater baseflow to the closest reach of Namoi River (Reach 11) is predicted, starting in
Year 4, and steadily increasing as mining proceeds to a maximum of 0.22 ML/d during mine
years 23-24, as shown on Figure 6.27. The maximum predicted baseflow impact during
mining represents about a 2% reduction in the pre-mining baseflow in Reach 11, but an
insignificant percentage of total streamflow in the Namoi River.
It should be noted that Reach 20 (Jacks Creek) is not in the Namoi River valley but is part of
an ephemeral drainage system in the western part of the model domain which drains to the
Namoi River to the north, outside of the model domain.
6.5.8 GAB Intake Beds
The impact of mining on groundwater outflow to the GAB intake beds has been assessed by
means of the outflows from the General Head Boundary cells along the north-western
boundary of the model.
The results of the Base Case predictive model run have shown that the project has a very low
impact on this flux. Groundwater flux across the general head boundaries in Layers 2 to 4
(Pilliga Sandstone to Garrawilla Volcanics, which constitute the intake beds to the GAB)
changes by less than 0.03 ML/d (less than 0.4%) as a result of mining operations. That is, the
flux changes from 8.48 ML/d at the start of mining operations to 8.45 ML/d at Year 29.
6.5.9 Particle Tracking
Particle tracking was undertaken on the recovery model to assess the potential for re-injected
brine to migrate from the goaf to hydrogeological units of the Gunnedah Basin, Great Artesian
Basin and/or Namoi Alluvium Ground Water Management Areas.
For the particle tracking, particles were inserted into each corner of the mine plan in each
model layer from Layer 2 to Layer 9, and to a number of other points outside the mine footprint
area, to establish the groundwater flow patterns and direction during the 100 year post-mining
recovery period. This was done to assess the potential for offsite migration of the injected
brine. Figures 6.25 and 6.26 show particle tracking vectors for the 100 year recovery model
for the Jurassic strata (Layers 2, 3 and 4) and Permian – Triassic strata (Layers 5, 6, 7, 8 and
9) respectively.
When mining is completed and dewatering ceases, groundwater will start to flow back into the
drawdown zone created by the 29 years of dewatering. Hence, groundwater will flow radially
towards the mine area from the outer edges of the drawdown “cone”. However, as the
groundwater levels will become elevated within the goaf area during the 2 year brine re-
SPECIALIST CONSULTANT STUDIES 2 - 69 NARRABRI COAL OPERATIONS PTY LTD Part 2 – Hydrogeological Assessment Narrabri Coal Mine – Stage 2 Longwall Project Report No. 674/17
injection period, there will also be an inner region where groundwater will have the potential to
initially flow outwards from the goaf area into the drawdown zone. We have therefore
concentrated on this inner region, looking at the distances travelled by particles, and also
whether there is any upward migration to higher model layers.
Figure 6.25 shows the paths of particles starting at the edges of the goaf, and shows that
groundwater flow directions within the Jurassic strata will trend away from the mine footprint
except at the northern end of LW1, where initial flow direction is towards the centre of the mine
footprint. The distance predicted to be travelled by particles in the simulated 100 year recovery
period is limited to less than 1km from the mine area in all directions.
Figure 6.26 shows similar groundwater flow directions within the Permian – Triassic strata,
initially trending away from the goaf area. The potential for injected brine to migrate offsite in
the 100 year recovery period within the Permian – Triassic strata is limited to less than 2km
from the mine footprint area to the north and generally less than 1 km elsewhere. The larger
vector from the northern end of LW14 occurs in the highly fractured goaf zone within the coal
seam layer (Layer 9) where hydraulic conductivity is highest.
In most cases, the particle tracking shows that particles stay within the layer from which they
started. Where interchange between geological units does occur, the movement is downward
to the underlying layer. No upward migration to a higher layer occurs.
In summary, the particle tracking has shown that any migration of saline water from brine re-
injection will have moved less than 2km maximum, and in most cases less than 1km from the
mine, in 100 years after cessation of mining. Importantly, there will be no upward migration to
the GAB formations.
6.6 Uncertainty Analysis
Uncertainty analysis is an assessment of the impact that uncertainty in the assumed values of
the input hydraulic parameters has on model predictions and model reliability.
The sensitivity analysis (Section 6.4) showed that there were no hydraulic parameter values
that had a significant impact on the model calibration.
The subsidence prediction (DGS, 2009) included the possibility that continuous fracturing
could extend into the Garrawilla Volcanics, although this was considered to be a low probability
outcome. Nevertheless, it was considered prudent to assess the impact of this uncertainty on
inflow predictions.
Secondly, it was assessed that the model would likely be sensitive to the hydraulic properties
assumed for the subsidence fracture zone extending up from the goaf, and in the absence of
prior experience with longwall mining in the Gunnedah Basin, it was considered prudent to also
carry out an uncertainty run with higher and lower vertical hydraulic conductivities for the
portions of Layers 5 to 8 within the longwall footprint.
And finally, it was also assessed that the changed hydraulic parameters assumed within the
fracture zone may reduce slightly with time as settling and/or redistribution of fines occurs. In
this scenario, fracture zone parameters were reduced to midway between the base case
fracturing and the host properties, with a lag factor of approximately 1-2 years.
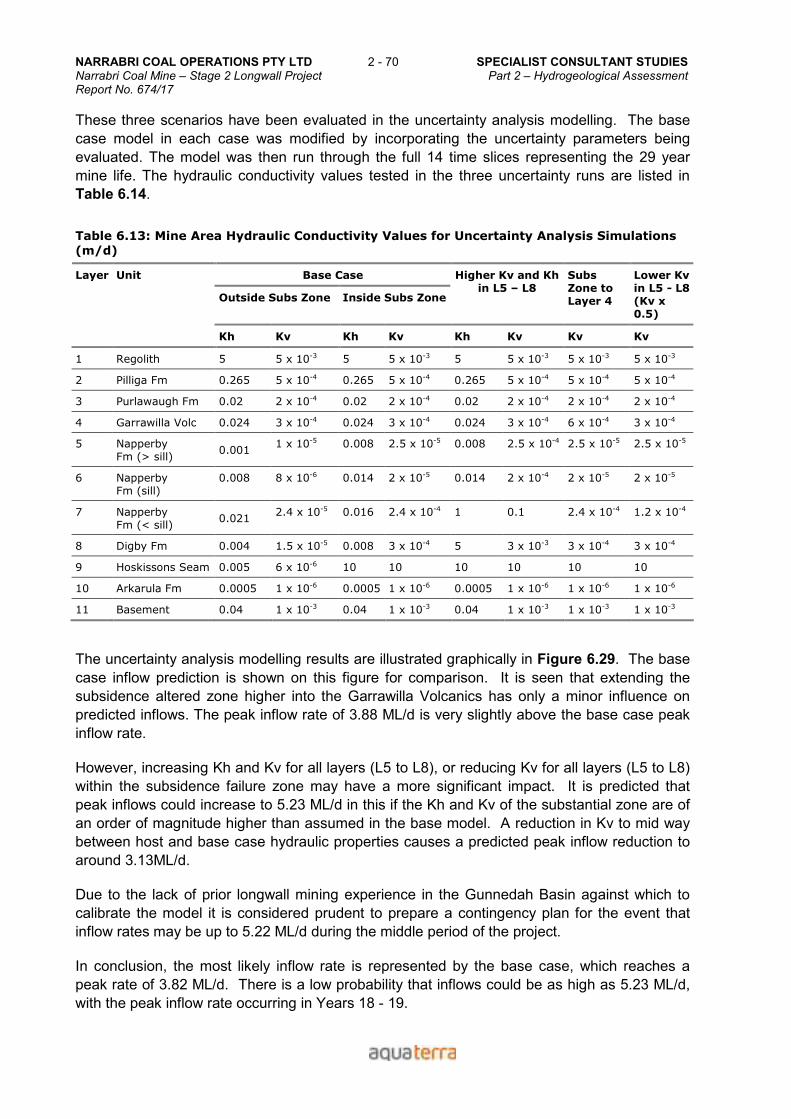
NARRABRI COAL OPERATIONS PTY LTD 2 - 70 SPECIALIST CONSULTANT STUDIES Narrabri Coal Mine – Stage 2 Longwall Project Part 2 – Hydrogeological Assessment Report No. 674/17
These three scenarios have been evaluated in the uncertainty analysis modelling. The base
case model in each case was modified by incorporating the uncertainty parameters being
evaluated. The model was then run through the full 14 time slices representing the 29 year
mine life. The hydraulic conductivity values tested in the three uncertainty runs are listed in
Table 6.14.
Table 6.13: Mine Area Hydraulic Conductivity Values for Uncertainty Analysis Simulations
(m/d)
Base Case
Outside Subs Zone Inside Subs Zone
Higher Kv and Kh in L5 – L8
Subs Zone to Layer 4
Lower Kv in L5 - L8 (Kv x 0.5)
Layer Unit
Kh Kv Kh Kv Kh Kv Kv Kv
1 Regolith 5 5 x 10⁻³ 5 5 x 10⁻³ 5 5 x 10⁻³ 5 x 10⁻³ 5 x 10⁻³
2 Pilliga Fm 0.265 5 x 10⁻⁴ 0.265 5 x 10⁻⁴ 0.265 5 x 10⁻⁴ 5 x 10⁻⁴ 5 x 10⁻⁴
3 Purlawaugh Fm 0.02 2 x 10⁻⁴ 0.02 2 x 10⁻⁴ 0.02 2 x 10⁻⁴ 2 x 10⁻⁴ 2 x 10⁻⁴
4 Garrawilla Volc 0.024 3 x 10⁻⁴ 0.024 3 x 10⁻⁴ 0.024 3 x 10⁻⁴ 6 x 10⁻⁴ 3 x 10⁻⁴
5 Napperby Fm (> sill)
0.001 1 x 10⁻⁵ 0.008 2.5 x 10⁻⁵ 0.008 2.5 x 10⁻⁴ 2.5 x 10⁻⁵ 2.5 x 10⁻⁵
6 Napperby Fm (sill)
0.008 8 x 10⁻⁶ 0.014 2 x 10⁻⁵ 0.014 2 x 10⁻⁴ 2 x 10⁻⁵ 2 x 10⁻⁵
7 Napperby Fm (< sill)
0.021 2.4 x 10⁻⁵ 0.016 2.4 x 10⁻⁴ 1 0.1 2.4 x 10⁻⁴ 1.2 x 10⁻⁴
8 Digby Fm 0.004 1.5 x 10⁻⁵ 0.008 3 x 10⁻⁴ 5 3 x 10⁻³ 3 x 10⁻⁴ 3 x 10⁻⁴
9 Hoskissons Seam 0.005 6 x 10⁻⁶ 10 10 10 10 10 10
10 Arkarula Fm 0.0005 1 x 10⁻⁶ 0.0005 1 x 10⁻⁶ 0.0005 1 x 10⁻⁶ 1 x 10⁻⁶ 1 x 10⁻⁶
11 Basement 0.04 1 x 10⁻³ 0.04 1 x 10⁻³ 0.04 1 x 10⁻³ 1 x 10⁻³ 1 x 10⁻³
The uncertainty analysis modelling results are illustrated graphically in Figure 6.29. The base
case inflow prediction is shown on this figure for comparison. It is seen that extending the
subsidence altered zone higher into the Garrawilla Volcanics has only a minor influence on
predicted inflows. The peak inflow rate of 3.88 ML/d is very slightly above the base case peak
inflow rate.
However, increasing Kh and Kv for all layers (L5 to L8), or reducing Kv for all layers (L5 to L8)
within the subsidence failure zone may have a more significant impact. It is predicted that
peak inflows could increase to 5.23 ML/d in this if the Kh and Kv of the substantial zone are of
an order of magnitude higher than assumed in the base model. A reduction in Kv to mid way
between host and base case hydraulic properties causes a predicted peak inflow reduction to
around 3.13ML/d.
Due to the lack of prior longwall mining experience in the Gunnedah Basin against which to
calibrate the model it is considered prudent to prepare a contingency plan for the event that
inflow rates may be up to 5.22 ML/d during the middle period of the project.
In conclusion, the most likely inflow rate is represented by the base case, which reaches a
peak rate of 3.82 ML/d. There is a low probability that inflows could be as high as 5.23 ML/d,
with the peak inflow rate occurring in Years 18 - 19.
SPECIALIST CONSULTANT STUDIES 2 - 71 NARRABRI COAL OPERATIONS PTY LTD Part 2 – Hydrogeological Assessment Narrabri Coal Mine – Stage 2 Longwall Project Report No. 674/17
7. POTENTIAL GROUNDWATER IMPACTS OF THE PROJECT
The Stage 2 Longwall Project will impact on the groundwater environment on a local and, to a
lesser extent, regional scale. The base-case groundwater model was used to predict the
impacts. Modelling results were presented in Section 6. The Narrabri mine plan and schedule
are as outlined in Section 5.
Potential impacts to the groundwater system may include the following aspects, each of which
is discussed in further detail in the following sections:
• Groundwater inflows (volume and quality)
• Groundwater level impacts (during and post-mining)
• Potential impacts on groundwater and surface water quality
• Potential impacts on baseflow to Namoi River and its tributaries
• Potential impacts of brine re-injection
• Potential impacts on other groundwater users
• Potential impacts on Groundwater Dependent Ecosystems (GDEs).
This section starts with a discussion of the potential impacts of subsidence cracking on the
hydraulic properties of the strata overlying the underground mine.
7.1 Potential Impacts of Subsidence Fracturing from Longwall Mining
Subsidence will occur above the longwall panels, and consequential fracturing of the rock
mass within the subsidence zone will result in changes in permeability. The influence of
subsidence on permeability as a result of the development of “direct connected cracking” or
“discontinuous cracking” has been modelled.
Subsidence modelling undertaken by Ditton Geotechnical Services (DGS, 2009) has predicted
that there is a low probability that continuous subsurface cracking would extend past the base
of the Garrawilla Volcanics, due to the potential bridging effect of the Garrawilla Volcanics.
Continuous fracturing is more likely to be contained within the Gunnedah Basin Permian-
Triassic sediments, extending to the top of the Napperby Formation above the basalt intrusion.
The continuous fracturing induced by longwall mining has the potential to increase
groundwater inflows into the underground workings, and the effects of this have been built into
the groundwater modelling. The Garrawilla Volcanics are reported to have the highest
hydraulic conductivity among the hard rock units above the proposed mine, and the
consequences of continuous fracturing extending up into that unit have been assessed with
the model, and are reported in Section 6.6. Although this is considered unlikely, it is in any
case predicted to have only a small additional impact. The model reviews that are
recommended to be carried out periodically once operational calibration data are available, as
discussed in Section 8, will allow the predictive model to be modified and future impacts
revisited during the early years of mining before the peak inflow period is reached.

NARRABRI COAL OPERATIONS PTY LTD 2 - 72 SPECIALIST CONSULTANT STUDIES Narrabri Coal Mine – Stage 2 Longwall Project Part 2 – Hydrogeological Assessment Report No. 674/17
Shallow surface cracking and discontinuous subsurface cracking may impact on shallow
groundwater such as at the base of the weathered zone within the subsidence zone. It is likely
that long-term these affects will not be extensive or permanent as the surface fractures are
expected to close up or become infilled with fine sediments over time.
7.2 Groundwater Inflows
Groundwater inflow predictions are for a moderate rate of groundwater inflow, commencing at
0.21 ML/d in Year 1, and increasing to a peak rate of 3.82 ML/d in Year 20. Thereafter, inflow
rates are predicted to decline as water is allowed to recover into the goaf areas of completed
longwall panels in areas downdip of the active mining.
Modelling has shown that if connected fracturing extends up into the Garrawilla Volcanics, a
slight increase in the peak inflow rate to 3.85 ML/d may occur.
In the unlikely event that vertical permeabilities are increased by a significantly greater amount
than anticipated in the subsidence zones above the longwall goafs, inflow rates peaking at up
to 5.23 ML/d may occur.
There is a high level of uncertainty in the prediction of groundwater inflows as there is no prior
experience with longwall mining in the Gunnedah Basin. Consequently, a conservative
approach has been taken in the modelling to predict possible inflow rates. Experience from
other areas has assisted with the process of assigning realistic hydraulic properties to the
subsidence zone above the extracted longwall panels. Examination of drill cores and hydraulic
testing results suggests that the hydrogeological properties of the overburden units at Narrabri
will be closer to those applying to the central part of the Hunter Valley Coalfields than either
the Western Coalfields or the Southern Coalfields. Hence, a greater reliance has been placed
on operating experience from that area.
A number of elements of conservatism have been built into the assessment of inflows:
• Firstly, it is possible that representative hydraulic properties assumed for each
model layer may be too high. The values used have been influenced principally
by the results of hydraulic testing, however this does not acknowledge that the
construction of piezometers and the hydraulic testing has been carried out
preferentially on bores that intersected measurable groundwater inflows, whereas
most drillholes drilled dry below the regional water table or potentiometric level.
Hence the dataset is skewed towards the more permeable locations, and ignores
the numerous locations that are essentially impermeable.
• Secondly, all model layers have been assumed to be regionally hydraulically
continuous. It is likely that hydraulic barrier boundaries will be found to exist
within the vicinity of the mine that will at least partly reduce the regional extent or
magnitude of drawdown impact and therefore the groundwater inflows as well.
These hydraulic barriers which may coincide with either major or minor faults and
other geological structures, or with zones of reduced permeability in the rock, are
common in practice but can only be identified under extended pumping or
dewatering conditions. It is likely that some partial hydraulic barriers will be found
to exist in the area of predicted impact that will lead to a reduction in actual inflow
rates.
SPECIALIST CONSULTANT STUDIES 2 - 73 NARRABRI COAL OPERATIONS PTY LTD Part 2 – Hydrogeological Assessment Narrabri Coal Mine – Stage 2 Longwall Project Report No. 674/17
• Thirdly, no allowance has been made in the base case modelling for any
subsequent reduction in permeability of the subsidence-affected strata over time,
or reduction in lateral flows due to the dislocation of fracture flow paths by the
subsidence effects. Some locations in the central Hunter Valley have shown
signs of apparent “healing” or infilling of subsidence fractures reasonably soon
after subsidence occurs, leading to a reduction in ongoing drawdowns and
inflows.
Consequently, groundwater inflows have been based on the available information, but may
prove to have been overestimated. It is essential that the first few longwall panels be closely
monitored, so that operational experience of longwall mining in the Gunnedah Basin conditions
can be gained as quickly as possible. This experience will allow a greater confidence to be
placed on forward predictions of both inflow rates and other impacts.
Limited experience will be gained from the gateroad development once the drift reaches the
seam level, anticipated around the end of 2009. However, as there will be no subsidence
associated with gateroad development, the inflow rates that occur during development will
have only limited bearing on the eventual inflow rates that will apply once subsidence occurs
during longwall panel extraction.
Recent groundwater extractions from the Hoskissons Seam during gas drainage trials have
provided useful information on groundwater level responses in the seam, negating the need to
delay assessment of longwall mining impacts until after a period of coal extraction from the
gateroad development in 2010.
7.3 Groundwater Level Impacts
The most significant impacts on groundwater levels are predicted to occur within the Permian
coal measures, specifically within the Hoskissons Seam. Groundwater inflows will be induced
laterally and from adjacent hydrogeological units, and subsidence fracturing above the longwall
goafs will allow increased drainage from the units above the longwall panels, extending up to
the Napperby Formation, and possibly above into the Garrawilla Volcanics.
Plots of drawdown and recovery in key formations are presented as follows:
• Figures 6.13 to 6.20 show the predicted groundwater levels and drawdowns for
Alluvium / Colluvium / Regolith (Layer 1), the Garrawilla Volcanics (Layer 4), the
Napperby Formation (Layer 5) and the Hoskissons Coal Seam (Layer 9), at Mine
Years 15 and 29.
• Figures 6.21 to 6.24 show the predicted groundwater level recovery for Alluvium
/ Colluvium / Regolith (Layer 1), the Garrawilla Volcanics (Layer 4), the Napperby
Formation (Layer 5) and the Hoskissons Coal Seam (Layer 9), following 100
years of recovery after mining is completed.
• A cone of depression centred on the Narrabri mining operation is evident in the
Hoskissons Seam (Figures 6.19 and 6.20 for Years 15and 29 respectively), a
less pronounced cone of depression in the Triassic (Figures 6.17 and 6.18) and
only very minor localised impacts in the regolith (Figures 6.13 and 6.14). Further
details of impacts on specific formations are provided below.
NARRABRI COAL OPERATIONS PTY LTD 2 - 74 SPECIALIST CONSULTANT STUDIES Narrabri Coal Mine – Stage 2 Longwall Project Part 2 – Hydrogeological Assessment Report No. 674/17
• Residual drawdowns in Layers 1, 4, 5 and 9 are shown on Figures 6.21, 6.22,
6.23, and 6.24 respectively. Groundwater levels are predicted to recover to at
least present day levels in all units. Predicted groundwater levels 100 years after
completion of the mining are shown in Appendix H as prediction hydrographs of
all existing monitoring locations.
Predicted groundwater levels over the 29 years of mining and 100 years of post-mining
recovery are shown as hydrographs for all current monitoring locations in Appendix H.
Contours of predicted drawdowns in each model layer at the end of mining are shown in
Appendix J.
Drawdown impacts are predicted to extend regionally within the Permian Units. Groundwater
features such as springs, wells/bores, dams or soaks, which derive water from the Permian
coal measures within the region of predicted drawdown, may be impacted by the Project.
While there are three NOW Groundwater Management Areas in the vicinity of the Longwall
Project area, the area of the longwall panels is covered by GWMA 601 (Surat Basin). The main
Surat Basin aquifer in this region, the Pilliga Formation, is dry within the Longwall Project area.
Although the mine is not overlain by any significant aquifer, potential impacts on the aquifers
that do exist are as follows.
7.3.1 Predicted Impacts on Groundwater Levels in the Permian Coal Measures
The most significant impacts on groundwater levels are predicted to occur within the Permian
coal measures (Figures 6.19 and 6.20), specifically within the Hoskissons Seam (Layer 9).
Mine dewatering will occur through natural inflows to the underground workings, which will be
collected in sumps and pumped to the surface. The groundwater pumped from the mine will
be used to provide water supply to meet the project’s water demands.
Drawdowns of 5m or more are restricted to a distance of 9 km to the west of mine after 15
years of mining and extending to 15 km at the end of mining. Drawdowns of 1m or more are
predicted to extend to a maximum of approximately 20km from the mine in a south-westerly
direction and by approximately 9 km in a north-westerly direction by 15 years after the start of
mining. After 29 years of mining operations, drawdowns of 1m or more are predicted to extend
to a maximum of 20km from the mined areas to the southwest and northwest and 10km from
the mined areas to the south. Drawdown to the east is limited by the truncation of the
Hoskissons Seam in subcrop.
Recovery of groundwater levels/pressures in the Permian coal measures is predicted to occur
gradually after completion of mining. It is predicted that 100 years after mining, residual
drawdowns of 5m or more is restricted to the southern parts of the mine footprint, with 1m
residual drawdown extending to a distance of 7km to the south and west of the mine.
7.3.2 Predicted Impacts on Groundwater Levels in the Triassic and Jurassic Formations
Predicted drawdowns in the overlying Triassic (typified by Layer 5 – Napperby Formation) at
the completion of the Longwall Project (Mine Year 30 – 2039) are less pronounced in
comparison to the Hoskissons Seam, as shown on Figures 6.17 and 6.18. Drawdowns of 1m
SPECIALIST CONSULTANT STUDIES 2 - 75 NARRABRI COAL OPERATIONS PTY LTD Part 2 – Hydrogeological Assessment Narrabri Coal Mine – Stage 2 Longwall Project Report No. 674/17
or more are predicted to extend to approximately 10km from the mined areas to the South-
west and north-west, but the maximum drawdown in the immediate vicinity of the mine is
limited to around 20m.
Within the Jurassic sediments, drawdowns of greater than 5 m are restricted to the immediate
mine area. No significant regional drawdown impacts are predicted in the Jurassic. Within the
Garrawilla Volcanics, 1 m drawdown is predicted to extend between 5 and 8 km to the west of
mined areas.
Post mining residual drawdown following 100 years recovery of up to 5m are predicted, but
restricted to an area within the mining lease. A predicted residual drawdown of up to 1m
extends south and west of the mine and up to 5km east of the mine.
The Pilliga Formation is dry within the longwall project area, and there is no predicted
drawdown impact in areas downdip to the west.
7.3.3 Potential Impacts on Groundwater Levels in the Quaternary Alluvium and Colluvium / Regolith
Predicted drawdowns in the alluvium, colluvium and regolith (Layer 1) at the completion of
mining (Mine Year 30 – 2039) are shown on Figure 6.14. Maximum drawdowns are limited to
around 5m, and these only occur in the immediate vicinity of the mine workings. Very slight
drawdowns of 0.5m are predicted to extend up to 3km from the mine to the north, but
drawdown impact is generally limited to the mining lease.
Post mining residual drawdown following 100 years recovery is up to 5 m, restricted to an area
within the mining lease. A residual drawdown of up to 1m extends east of the mine footprint to
a distance of 2km, but does not encroach on the Namoi River alluvium.
No measurable drawdown impact is predicted in the Namoi Valley alluvium, either during
mining or after completion.
7.4 Quality of Groundwater Inflows
The average water quality of mine inflows will be a composite blend of the water qualities from
all groundwater sources contributing to inflows. However, it is anticipated that groundwater
quality will initially be dominated by the Hoskissons Seam and the underlying Arkarula
Formation. Over time, as proportionally more groundwater inflows from the higher Permian-
Triassic units and from more distant parts of the area of predicted drawdown impact, the
groundwater quality may change to reflect an increased contribution from those areas.
The indicative water quality for groundwater that may flow into the mine has been determined
as a weighted average of inflow volumes and salinities from each hydrogeological unit, using a
representative salinity for each unit which is an average of all available measurements of
salinity from water quality monitoring results for monitoring bores. Only limited analysis results
are available from some units, including the Hoskissons Seam.
NARRABRI COAL OPERATIONS PTY LTD 2 - 76 SPECIALIST CONSULTANT STUDIES Narrabri Coal Mine – Stage 2 Longwall Project Part 2 – Hydrogeological Assessment Report No. 674/17
The water contribution from each layer was determined by extracting the change in
groundwater storage within each layer for each 1 year time step in the base case model, and
multiplying this volume change by the average salinity for that layer, summing the totals and
dividing by the total mine inflow volume for that time step to determine an average salinity
value. Thus an average inflow salinity has been calculated for each year of mining.
This method gives equal weight to both close and distant changes in storage in the model, and
hence may underestimate the proportional effect of salinity in the Hoskissons Seam and the
other Permian units close to the mine.
To limit uncertainty, and to provide a more conservative prediction, the calculation has been
made by only using the changes in storage in the Permian and Triassic units within the
predicted deformation zone, thus eliminating any influence of the shallower less saline units
from the calculation of bulk salinity.
It is also important to recognise that the shallower Jurassic groundwater salinities are lower
than salinities from the Permian and Triassic strata at depth and any contribution from these
higher units would lower the overall inflow salinity. This approach is expected to be more
representative of inflow salinities in early years, but may overestimate the bulk salinity in later
years when some groundwater from the less saline shallower units and updip areas may start
to reach the mine workings.
The actual average salinity of inflows is therefore likely to be lower than has been calculated
here.
Two separate calculations have been made using the above methodology. The first uses an
average salinity for the Hoskissons Seam of 6000 mg/L TDS, which includes all available
water quality data, including the low salinity site P18 where salinity is around 2000 mg/L TDS.
The second uses a salinity of 8000 mg/L for the Hoskissons Seam which places much more
weight to the results of recent sampling from inseam gas drilling, from which salinities in the
range 8000-9000 mg/L TDS were reported. The actual average salinity of inflows is likely to be
between these two calculations.
Figure 7.1 shows the two alternative predicted mine inflow salinities using average salinity for
the Hoskissons Seam of 6000 mg/L and 8000 mg/L TDS respectively. It is suggested that the
inflow salinity will be somewhere between the upper and lower bound, and we suggest that for
planning purposes the average be used.
Both approaches plotted on Figure 7.1 suggest initial average inflow salinity in the range 7000
to 8000 mg/L TDS, to around 4500 mg/L TDS by the Year 20, then steadily mining again to
around 6000 mg/L TDS by the end of mining.
It is also expected that there will be some variation in inflowing groundwater salinity within
each year due to periodic short-term inflows of higher or lower salinities as longwall mining
progresses. However, day to day inflow concentrations are not expected to vary dramatically.
7.5 Potential Impacts on the Namoi River and its Associated Alluvium
There is a significant barrier of low permeability strata between the Namoi River alluvium and
the proposed mine footprint. Neither the Hoskissons Seam nor the other rocks of the Black
Jack Group are directly in contact with the Namoi Valley alluvium in the project area, as these
SPECIALIST CONSULTANT STUDIES 2 - 77 NARRABRI COAL OPERATIONS PTY LTD Part 2 – Hydrogeological Assessment Narrabri Coal Mine – Stage 2 Longwall Project Report No. 674/17
units have been truncated by an overlying unconformity. There is the potential for indirect
impacts through the intervening low permeability strata. However, predictive modelling showed
the project will have negligible impact on the alluvium in the Namoi River valley.
The Namoi River is a gaining river system which is predicted to continue through the proposed
mining operation. A small impact on base flows is predicted, to occur, but the model contains
a number of conservative features that will tend to overstate the potential baseflow impact, and
negligible impact is likely to occur in reality. As discussed in Section 6.5.7, the predicted
maximum total baseflow impact during mining is approximately 0.22 ML/d, which represents
about 2% reduction in the pre-mining baseflow from reach 11, the closest reach to the project.
The maximum reduction is predicted to occur in Year 23.
Post-mining, baseflows in all affected reaches of the Namoi River and Jack Creek are
predicted to recover to levels equal to pre-mining baseflows, with 80% of recovery to occur
within 40 years of completion of mining.
The surface drainages within the Mine Site are all ephemeral streams in which baseflow is
either absent, or insufficient to maintain permanent creek flow. Baseflows prior to the
commencement of the Narrabri project predicted by the groundwater model were negligible in
all drainages within the Mine Site.
7.6 Potential Impacts on Great Artesian Basin Intake Beds
Groundwater modelling has predicted negligible change (less than 0.03ML/d) to groundwater
flux at the model’s western boundary, representing outflow from the area covered by the
groundwater model to the GAB.
The Pilliga Sandstone, recognised as a major intake bed to the GAB, is dry within the Longwall
Project area, so that even in the highly unlikely event that continuous sub-surface cracking
from longwall mining does extend beyond the floor of the underlying Purlawaugh Formation,
which is recognised as a major regional aquitard, the Pilliga Sandstone will be insulated from
groundwater depressurisation occurring within the underlying Permian coal measures.
7.7 Potential Impacts of Brine Re-injection
Assessment of the potential for re-injected brine to migrate from the mine’s goaf to
hydrogeological units of the Gunnedah Basin, the Great Artesian Basin and/or the Namoi
Alluvium Ground Water Management Areas was assessed by particle tracking analysis, as
described in Section 6.5.7.
The particle tracking indicated that the potential for injected brine to migrate offsite in the 100
year recovery period within the Permian – Triassic strata is limited to less than 2km from the
mine footprint area to the north, and generally less than 1 km elsewhere. The potential for
adverse impacts on the hydrogeological units of the Gunnedah Basin Ground Water
Management Area would be limited to within these distances.
The analysis also showed that there would be no upward migration of saline water into the
Jurassic GAB intake beds, specifically the Pilliga Formation.
NARRABRI COAL OPERATIONS PTY LTD 2 - 78 SPECIALIST CONSULTANT STUDIES Narrabri Coal Mine – Stage 2 Longwall Project Part 2 – Hydrogeological Assessment Report No. 674/17
The particle tracking showed that particle vectors in the alluvium/colluvium/regolith (Model
Layer 1) reflect the natural groundwater flow directions. Although the analysis showed that
there would be no upward migration of saline water into Layer 1, in any case, the particle
tracking indicated that the maximum distance travelled by particles in Layer 1 in the 100 year
post-mining recovery period would be only 500m from the northern end of LW1 and 850m from
the southern end of LW26.
Groundwater salinity within the Gunnedah Basin sediments exceeds 5000 mg/L TDS, and
therefore these units have limited beneficial use value. The residual salinity of groundwater
within the predicted migration zone will be a mixture of the insitu groundwater salinity (>5000
mg/L TDS) and that of the injected brine (likely to be in excess of 20,000 mg/L TDS). The
actual salinity in the goaf is likely to vary over time as the proportions of these two waters
varies. Because of the high initial salinity of the in situ groundwater in the hydrogeological units
likely to be affected by saline water, any escape of salinity will not cause a reduction in
beneficial use value.
7.8 Potential Impacts on Existing Groundwater Users
The Stage 2 Longwall Project has the potential to impact on groundwater in the fractured rock
aquifers above the mine up to the base of the Garrawilla Volcanics, with greatest impacts in
geological units close to the Hoskissons Seam, and less impact on higher units. Yields and
available drawdown may be affected at any existing groundwater bores close to the mine
which are screened in the formations predicted to be affected by groundwater drawdowns.
Augmentation of affected water supplies may be required.
A search of the NOW database revealed a number of registered bores within the predicted
impact zone, but a field inspection showed many to be either non-existent or lost. The
recorded age of some of the lost bores suggests that they may have been long since
abandoned. The field survey also revealed a number of existing bores with active windmills
which are unregistered.
A free-flowing spring has been identified to the south of the Mine Site that is used for water
supply, and although it is not expected to be impacted, it may be at risk if drawdowns in the
Purlawaugh Formation prove to be greater than predicted. Others have been identified at
greater distance to the south. Modelling has shown that predicted drawdown within the upper
geological units is extremely small in the vicinity of the springs, so adverse impacts are not
expected. These springs should be included in the routine monitoring program described in
Section 8.
The potential for impact on other groundwater users is to a large degree being mitigated by
NCOPL’s acquisition of properties within the anticipated zone of impact. However
arrangements to mitigate potential impacts on other groundwater users will be undertaken by
NCOPL. Assessment of potential impacts will be undertaken on a case by case basis which
will require identifying the potential bores or springs impacted and discussing possible
mitigating measures with each affected landholder.
It is predicted that none of the Quaternary alluvium water supply sources will be impacted by
the Stage 2 Longwall Project. Figure 7.2 represents the predicted drawdown in Layer 1
(alluvium/colluvium/regolith) at the end of mining along with known groundwater extraction
bores within the Namoi River alluvium. It shows that all known extraction bores are outside the

SPECIALIST CONSULTANT STUDIES 2 - 79 NARRABRI COAL OPERATIONS PTY LTD Part 2 – Hydrogeological Assessment Narrabri Coal Mine – Stage 2 Longwall Project Report No. 674/17
predicted zone of impact. Figure 7.2 also shows the locations of the three springs discussed
above. Two dummy bores were used to illustrate the potential impact on the Regolith /
Colluvium and alluvium associated with the Namoi River. DB1 located 2 km north of LW1 and
DB2 located in alluvium 5 km east of the mine footprint. Hydrographs are shown in
Appendix H which indicates that there is little discernable impact on alluvium associated with
the Namoi River.
7.9 Potential Impacts on Groundwater Dependent Ecosystems
No groundwater dependent ecosystems have been identified within the Mine Site area
previously, although deep rooted vegetation with tap roots up to 25 m depth have been cited to
occur in the region (GHD, 2006). Groundwater levels range from more than 60 m below
ground level to around 10 m below ground level in topographic low points.
It is anticipated that the Purlawaugh Formation will insulate shallow groundwater from any
mining-induced groundwater depressurisation of the underlying Permian coal measures.
Therefore it is not anticipated that there would be significant impact to groundwater dependent
ecosystems due to the Stage 2 Longwall Project.
It is possible that shallow surface cracking may locally impact shallow groundwater such as the
sporadic perched systems that exist at the base of the weathered zone that may locally be
supporting some vegetation. As suggested above, it is likely that these effects will not be
permanent as the surface cracking will not be continuous to the mine workings, and impacts
will therefore be limited. Any storage that is drained will be rapidly restored by recharge from
rainfall, as the discontinuous fractures close up or become infilled with fine sediment.
7.10 Groundwater Licensing
The Upper Namoi GWMA and GAB Intake Beds GWMA have been identified as high risk
aquifers (DLWC, 1998).
An embargo currently exists in the Great Artesian Basin in New South Wales, which prevents
the issuing of new industrial bore licences, but does not apply to new stock and domestic bore
licences. Any groundwater which derives from the GAB Intake Beds or Upper Namoi GWMA
would require the acquisition of offset licences, although it is considered unlikely that any such
impact will occur.
Mining activities will be undertaken beneath the existing groundwater table in the Permian Coal
Measures. Therefore a groundwater interference licence will be required prior to intersection of
the water table in the drift or development headings.
It is not anticipated that groundwater resources within the Great Artesian Basin intake beds will
be impacted by mining activities, and predictive modelling has shown that there will be a
negligible impact on the alluvium associated with the Namoi River. Purchase of offset licences
is not expected to be necessary for the alluvium. However, the predicted small impact on
Namoi River baseflow would need to be offset by purchase of a surface water licence.
NARRABRI COAL OPERATIONS PTY LTD 2 - 80 SPECIALIST CONSULTANT STUDIES Narrabri Coal Mine – Stage 2 Longwall Project Part 2 – Hydrogeological Assessment Report No. 674/17
8. MONITORING AND MANAGEMENT
8.1 Impacts from Groundwater Extraction / Dewatering
It is recommended that the current baseline monitoring program of groundwater quality and
bore water level measurement be continued, with a modified network of monitoring points
determined prior to commencement of mining.
Data collected will enable NCOPL to establish, and continually assess if mining activities have
any impact on other groundwater users or the groundwater environment. Collection of these
data will also enable review of any observed impacts against those predicted by the numerical
modelling, and will allow further refinement of the groundwater model as the mine develops.
It is recommended that the proposed project monitoring program includes recording of the
following:
• Groundwater extraction volumes – weekly totals from all pumping bores, and
weekly totals from each underground pumping station and box cut sump.
• Volumes of water introduced to the mine for longwall operation and other
requirements.
• Groundwater discharge quality – monthly measurements on site of the EC and
pH of samples collected from each groundwater extraction point for either
dewatering or water supply purposes, including both bores and underground
pumping stations.
• Quarterly sampling from all pumping bores and underground pumping stations for
comprehensive hydro-chemical analysis as detailed in Table 8.1.
• Monthly manual monitoring, or continuous automated monitoring, of water levels
from the network of monitoring bores
• Annual sampling of representative monitoring bores for laboratory analysis.
• Continuous gas monitoring.
• Monitoring of the spring discharges shown on Figure 4.9, carried out at the same
intervals as the groundwater level monitoring above.
Table 8.1: Recommended Laboratory Analysis Suite for Groundwater
Class Parameter
Physical parameters EC, TDS, TSS and pH
Major cations Calcium, magnesium, sodium and potassium
Major anions Carbonate, bicarbonate, sulphate and chloride
Dissolved metals Aluminium, arsenic, boron, cobalt, cadmium, chromium, copper, iron, lead, manganese, mercury, nickel, silver, selenium, zinc
Nutrients Ammonia, nitrate, phosphorus, reactive phosphorus
SPECIALIST CONSULTANT STUDIES 2 - 81 NARRABRI COAL OPERATIONS PTY LTD Part 2 – Hydrogeological Assessment Narrabri Coal Mine – Stage 2 Longwall Project Report No. 674/17
8.2 Subsidence Impact Monitoring
The NCOPL Stage 2 Longwall Project is the first longwall mining operation within the
Gunnedah Basin and therefore there is little precedent against which to compare predictions of
subsidence and associated groundwater impacts.
A comprehensive monitoring program is recommended to investigate the subsidence impacts
as they develop above LW1 to LW3. This monitoring will provide definitive information on the
behaviour of the rock strata from subsidence, and will provide more reliable data on which to
base the changes to hydraulic conductivities resulting from subsidence fracturing. This will
enable the groundwater model to be recalibrated and used to improve the certainty of forward
inflow predictions and resulting impacts, before inflows lead to significant water excess, which
is currently expected to be from about Year 5, during the mining of panels LW2 toLW3.
Some multi-level vibrating wire piezometers are already in place to enable ongoing monitoring.
These have been strategically placed within proposed chain pillars between LW1 and LW 2
and just outside LW1. Additional multi-level vibrating wire piezometers and extensometers will
be installed. Monitoring of these facilities will be conducted in conjunction with the subsidence
monitoring recommended by DGS (2009).
8.3 Review and Reporting
Collated monitoring data should be subjected to an annual review by an approved,
experienced hydrogeologist in order to assess the impacts of the project on the groundwater
environment, and to compare any observed impacts with those predicted from groundwater
modelling.
It is also recommended that, in accordance with industry best-practice (MDBC, 2001), a
modelling post-audit and model verification should be carried out 6-12 months after longwall
extraction starts. Due to the prediction uncertainty and sensitivity to the vertical hydraulic
conductivity of the fracture zone discussed in Section 6, it is recommended that the first
review be carried out after six months from the commencement of longwall extraction.
Following this first review, if necessary, the groundwater model should be re-calibrated and
confirmatory forward impact predictions made. Further post-audits should be carried out at
least five-yearly through the remainder of the project, and at any other time should inflows or
impacts vary significantly from predictions.
Should any review or post-audit indicate a significant variance from the model predictions with
respect to either water quality or groundwater levels, then the implications of such variance
should be assessed, and appropriate response actions implemented in consultation with
DECCW, Department of Primary Industries (DPI) and Department of Environment and Climate
Change (DECC) as appropriate.
NARRABRI COAL OPERATIONS PTY LTD 2 - 82 SPECIALIST CONSULTANT STUDIES Narrabri Coal Mine – Stage 2 Longwall Project Part 2 – Hydrogeological Assessment Report No. 674/17
9. CONTINGENCY RESPONSE PLANS
9.1 Recommendation for Development of Response Plans
It is recommended that a response program be adopted for implementation in the event of
unforeseen adverse impacts on either groundwater or surface water from the Stage 2 Longwall
Project. The response plans would be in accordance with those outlined in the Groundwater
Management Plan developed for the approved Stage 1 project, modified as required to
account for issues relating to Stage 2 operations.
The proposed approach to the management of groundwater levels and water quality are
detailed below, outlining the criteria by which each would be assessed in order to determine
the need to implement mitigation actions as outlined in the response plans. It should be noted
that as groundwater levels and quality will naturally vary over time, the setting of specific
trigger-levels, for either quality parameters or water-levels, is not considered practical. For
example, water levels may vary considerably in response to natural variation or groundwater
use by others, not just to the impacts of mine dewatering associated with the Longwall Project
or other mining projects. Seasonal variations in water levels and quality as a result of varying
rates of recharge may occur. Significant changes in either groundwater levels or quality may
also occur as a result of groundwater extraction and irrigation activities within the Namoi Valley
that are unrelated to mining.
It is recommended that the assessment is made based on the variation of levels and quality
trends from their recorded baseline range or trends, combined with the recorded variation from
predicted impacts (for those bores within the zone of influence of dewatering and borefield
pumping).
Trigger levels (or trend changes) will be set, for selected sites, to be applied during the initial
stage of mine construction and Mining Years 1 to 3, after which time all trigger levels will be
reviewed with reference to the baseline data records available at that time, and revised as
appropriate through consultation with NOW.
9.2 Water Levels
In the event that groundwater level drawdowns in any bore in the alluvium, regolith or the
Garrawilla Volcanics exceed predicted drawdowns by 15% or more for any consecutive three
month period, then the monitoring data should immediately be referred to an approved
hydrogeologist for review. The reviewer should assess the data to establish the nature of the
exceedance and the reasons for it, and should recommend an appropriate response action
plan for implementation in consultation with NOW.
In the event that an existing water supply is adversely affected by any exceedance in
drawdowns, the response action could involve provision of a replacement water supply,
possibly from diversion of part of the dewatering discharge, subject to water quality being
suitable for the purpose.
SPECIALIST CONSULTANT STUDIES 2 - 83 NARRABRI COAL OPERATIONS PTY LTD Part 2 – Hydrogeological Assessment Narrabri Coal Mine – Stage 2 Longwall Project Report No. 674/17
9.3 Groundwater Quality
Should the water quality of the mine inflows or dewatering discharge indicate an inflow salinity
of more than 20% above the averages shown on Figure 7.1, it is recommended that the nature
of the exceedance, and all relevant monitoring data, be provided to an approved experienced
hydrogeologist for review and assessment of the impact of such exceedances on other users
or the environment. If remedial action is recommended by the reviewer on the basis of the
water quality exceedances, the recommended action will be implemented in consultation with
NOW, DPI and DECC as appropriate.
10. SUMMARY AND CONCLUSIONS
This groundwater assessment report has been prepared to support the Narrabri Coal Project
(NCP) Environmental Assessment (EA) seeking approval of the proposed Stage 2 Longwall
Project.
Stage 1 of the NCP was granted approval by the Minister for Planning on 13 November 2007,
for a continuous miner operation. NCOPL is now proposing Stage 2 of the mining plan for
NCP, which comprises the development of longwall mining operations on EL6243 for the
extraction of coal at around 8 Mtpa.
Groundwater investigations were undertaken for Stage 1 during 2006 by GHD. That
investigation included aquifer testing using packer tests on coal resource delineation drill
holes, geochemical analysis and groundwater modelling.
Stage 2 groundwater investigations were undertaken between June 2008 and June 2009.
These investigations aimed to verify aquifer parameters by further testing of existing
boreholes, obtain additional hydraulic data through the installation and testing of new
monitoring bores, and update impact predictions by further groundwater modelling. Ongoing
investigations include baseline monitoring of a network of 28 bores, which are sampled and
tested regularly for groundwater levels, aquifer characteristics and groundwater quality.
This report presents the results of the Stage 2 investigations and details assessment of the
potential impacts of the Stage 2 Longwall Project.
10.1 Existing Hydrogeological Environment
Based on the findings of the Stage 1 and Stage 2 investigations, the following key conclusions
have been drawn about the hydrogeology associated with the Narrabri Coal Mine Stage 2
Longwall Project (“the Longwall Project”):
• Two distinct aquifer types have been identified within the Longwall Project area:
- A shallow unconfined aquifer that is found within the regolith layer (weathered
bedrock), including occasional fracturing at the top of the underlying fresh
rock. It occurs as a semi-continuous layer across the sub-cropping Permian-
Jurassic strata. The occurrence of localised fracturing and associated higher
permeability is particularly notable in the upper parts of the Garrawilla
Volcanics.
NARRABRI COAL OPERATIONS PTY LTD 2 - 84 SPECIALIST CONSULTANT STUDIES Narrabri Coal Mine – Stage 2 Longwall Project Part 2 – Hydrogeological Assessment Report No. 674/17
• A deeper fractured rock aquifer system that occurs throughout the stratigraphic
sequence, with standing water levels generally at depths greater than 50 m below
ground level.
• The Pilliga Sandstone, which forms one of the major intake beds for the Great
Artesian Basin (GAB) overlaps the western part of the Mine Site, but is not
saturated within the Mine Site area. This unit becomes partly saturated to the
west (down-dip) as the strata dip beneath the regional water table level.
• The alluvium associated with the Namoi River does not occur within the Mine
Site, and the Hoskissons Seam does not sub-crop beneath or adjacent to the
Namoi River alluvium. There is therefore no direct hydrogeological connection
between the proposed mine and the Namoi River alluvium.
• Horizontal hydraulic conductivities determined from testing ranged from 3 x 10⁻⁴
m/d to 2.5 x 10⁻¹ m/d. The highest conductivity in the rock units was recorded
within the Garrawilla Volcanics within the sub-crop zone. The highest
conductivities within the deeper aquifers occur within the Hoskissons Seam and
underlying Arkarula Formation.
• Although higher hydraulic conductivities have been found within the subcrop zone
of the Garrawilla Volcanics, high inflows from this formation have not been
encountered during construction of the mine access drifts. This suggests that
these more conductive zones are localised.
• Groundwater salinity is variable. Deeper groundwater is generally saline, with
measured total dissolved solids (TDS) ranging up to more than 16 800 mg/L.
Localised fresher groundwater zones occur in the shallow aquifers, with
measured salinities as low as 100 mg/L TDS. Salinity of groundwater in the
Hoskissons Seam is variable, ranging from 1350mg/L to 9070mg/L TDS.
• Major ion chemistry within the groundwater samples indicates that there are three
distinct zones of water chemistry within the stratigraphic sequence. These
distinct differences in groundwater quality indicate that, in the pre-mining
condition, there is very little vertical connectivity between the rock strata that
occur beneath the Longwall Project.
10.2 Prediction of Mining Related Impacts
The two main potential impacts of proposed longwall mining on the hydrogeological
environment were considered to be:
• Local and regional lowering of groundwater levels within the Permian-Jurassic
strata, due to groundwater inflows to the mine workings, particularly as a result of
enhanced permeability of the rock units within the subsidence affected zone
above the longwall extraction panels. Some lowering of groundwater levels may
also occur as a result of increased rock storativity due to the stress relief
fracturing associated with the underground mining.
• Possible impacts on near-surface groundwater, including the alluvial groundwater
system of the Namoi Valley, and groundwater baseflow contributions to the
Namoi River and other surface drainages.
SPECIALIST CONSULTANT STUDIES 2 - 85 NARRABRI COAL OPERATIONS PTY LTD Part 2 – Hydrogeological Assessment Narrabri Coal Mine – Stage 2 Longwall Project Report No. 674/17
Subsidence predictions are that maximum subsidence would range from 1.6m in the eastern
part of the longwall mining area where cover depth is around 160m, to 2.4m in the west where
cover depth reaches 380m. Continuous fracturing associated with this subsidence is predicted
to extend from the coal seam to below the base of the Garrawilla Volcanics, but could extend
into the Garrawilla Volcanics if adverse geological conditions are encountered. The predicted
height of continuous/connected fracturing therefore varies from around 45m below ground
level (bgl) in the shallowest parts of the mine to around 200m bgl in the deepest parts of the
mine.
The most likely hydrogeological impact is based on the expectation that continuous
subsidence fracturing from the longwall panels will not intersect the more permeable sub-crop
zone of the Garrawilla Volcanics. Should hydraulically continuous fracturing extend into the
Garrawilla Volcanics, it has been assessed that marginally higher inflows could occur.
However, the subsidence prediction is that this is unlikely.
Numerical groundwater modelling has been used to predict mine inflows and impacts on
groundwater levels and baseflows, both locally and regionally. Principal findings of the
modelling include the following:
• The base case predictive modelling simulation predicted that groundwater inflows
to underground workings would gradually increase over the first 20 years of
mining from an initial 80 ML/a (0.22 ML/d) in Year 1 to a peak inflow rate of 1394
ML/a (3.82 ML/d) in Mine Year 20, before declining steadily thereafter to a rate of
365 ML/a (1.0 ML/d) in the final year of the project.
• Large drawdowns are predicted to occur within the Permian coal measures close
to the mine, as a result of groundwater flows into the mine workings. The
drawdown cone is predicted to be relatively steep, and drawdowns exceeding 10
m would be limited to around 6 km to 7 km to the west, north and south, and
around 2 km to the east of the underground workings. The Permian drawdown
impact would extend much less to the east, where it would be limited by the
truncation of the coal seam by an overlying unconformity. The region of greater
than 1 m predicted drawdown in the Hoskissons Seam extends approximately 20
km to the west, 10km from the mined areas to the south and to the north, but not
to the east where the seam is absent.
• Predicted groundwater level impacts in the overlying Triassic Napperby
Formation at the end of mining are much less pronounced. Drawdowns of 1m or
more are predicted to extend a maximum of approximately 10km to the west of
the Mine Site.
• Impacts on Jurassic strata would be extremely small, and there will be effectively
no measurable impact above the Purlawaugh Formation aquitard (i.e. in the
Great Artesian Basin intake beds).
• Predicted drawdowns in the surficial unconsolidated aquifer at the end of mining
are very small, generally less than 1 m except for a small area immediately
overlying the mine workings.
• Predicted impacts on river baseflows are very small. The most impacted river
reach is the closest section of the Namoi River to the east (model reach 11).
Baseflow in this reach is predicted to reduce by a maximum of around 0.22 ML/d,
but this is only 2% of the total calculated baseflow contribution to this reach of
around 10.3 ML/d.

NARRABRI COAL OPERATIONS PTY LTD 2 - 86 SPECIALIST CONSULTANT STUDIES Narrabri Coal Mine – Stage 2 Longwall Project Part 2 – Hydrogeological Assessment Report No. 674/17
• Post-mining, baseflows in all reaches of the Namoi River are predicted to recover
to levels equal to pre-mining baseflows following 100 years of recovery.
• Post-mining potential for offsite migration of re-injected brine is limited to 1 km in
Jurassic Strata sand less than 2 km in Triassic-Permian strata after 100 years of
recovery. No upward migration of saline water to the Pilliga Formation is
predicted to occur.
Overall, these results indicate that the following impacts on water resources may occur due to
the Stage 2 Longwall Project:
• There will be negligible impact on groundwater within the Pilliga Sandstone, and
hence a negligible (less than 0.03ML/d) impact on recharge to the GAB.
• Negligible impacts on groundwater levels in the Namoi Valley alluvium are
predicted, and existing groundwater users will not be affected.
• Continuous/connected fracturing induced by longwall mining has the potential to
significantly impact groundwater stored in the fractured rock aquifers above the
mine (up to the Garrawilla Volcanics). The potential for impact on other local
groundwater users is mitigated by NCOPL’s acquisition of several properties
within the anticipated zone of impact. However, a commitment to mitigate
potential impacts on other groundwater users should be included within the Site
Water Management Plan. One bore (WB2) located over LW26 and screened
within the Garrawilla Volcanics is expected to be impacted. This bore is located
on property owned by NCOPL. No other registered bores are expected to be
impacted.
Sensitivity and uncertainly analysis has been carried out to assess the sensitivity of the model
calibration to the assumed input parameters and boundary conditions, and the effect of
uncertainty on predicted rates and impacts.
Sensitivity analysis was carried out on hydraulic conductivity (horizontal and vertical) and
recharge. The model was found to be not highly sensitive to either horizontal or vertical
hydraulic conductivity of the in-situ rock strata. However, model-predicted mine inflows are
very sensitive to the assumed vertical hydraulic conductivities of the subsidence-affected strata
directly above the extracted longwall panels, but is less sensitive to the height of connected/
continuous fracturing assumed in the modelling.
The predicted impacts from the base case model are considered to be best estimates
according to experience and a thorough consideration of the hydrogeological conditions of the
Longwall Project area. However, as there is no prior history of longwall mining in the
Gunnedah Basin, some uncertainty in inflow predictions will remain until mining of the first few
longwall panels has been undertaken, and the pattern of subsidence-fracturing and
permeability changes has been monitored and evaluated. Accordingly, a range of higher than
expected vertical permeabilities has been tested with the groundwater model, to provide an
upper limit or worst case assessment of groundwater inflows and impacts. Monitoring of
groundwater responses to the Stage 1 continuous miner operation will be of limited value, or
there will be no significant subsidence associated with Stage 1. A program of careful
monitoring has been recommended for the first 3 longwall panels, to provide definitive data on
rock behaviour following subsidence. It is recommended also that assessment of potential
mine inflows and re-calibration of the groundwater model should be carried out on a regular
basis, with an initial re-evaluation 6 - 12 months after commencement of longwall extraction.
SPECIALIST CONSULTANT STUDIES 2 - 87 NARRABRI COAL OPERATIONS PTY LTD Part 2 – Hydrogeological Assessment Narrabri Coal Mine – Stage 2 Longwall Project Report No. 674/17
10.3 Management and Monitoring of Impacts
Although impacts from the proposed project are generally anticipated to be small, a monitoring
programme and contingency response plan will be required to validate predictions and mitigate
any detrimental impacts that occur during mining. Proposed recommendations for these
programmes are contained within this report, and include:
• Monitoring of mine inflows and water imported into the mine for longwall
operation and other underground uses.
• Monitoring of volumes pumped from any water supply or dewatering bores.
• Monthly manual monitoring, or continuous automated monitoring, of water
levels/pressures from the network of monitoring bores.
• Water quality monitoring of mine inflows and groundwater in monitoring
piezometers.
• Monitoring of Mayfield Spring and other springs located to the south of the mine
site.
• Ongoing subsidence monitoring and monitoring of permeability changes caused
by subsidence.
• Periodic data review by a suitable, experienced hydrogeologist.
• Periodic review and validation of the groundwater model predictions.
Procedures are presented for investigation and response action if data indicate that impacts on
groundwater level or quality are greater than trigger values, or if complaints are received by
other groundwater users.
11. REFERENCES
Australian and New Zealand Environment and Conservation Council (ANZECC) / Agriculture
and Resource Management Council of Australia and New Zealand (ARMCANZ), 2000.
Australian and New Zealand Guidelines for Fresh and Marine Water Quality.
Australian Geological Survey Organisation (AGSO), 1995. 1:10,000,000 Hydrogeology of the
Darling River Drainage Basin map.
Bureau of Meteorology website www.bom.gov.au
Belford Dome Resource Assessment, 2006. Narrabri Coal Project Geological Assessment
Bouwer H and Rice R C, 1976. A slug test for determining hydraulic conductivity of unconfined
aquifers with completely or partially penetrating wells. Water Resource. Res., v12(3) p423.
Coffey Geotechnics Pty Ltd, 2008. Narrabri Coal Project Groundwater Management Plan,
dated July 2008.
Consolidated Petroleum, 1983, Quarterly Report to 31st March 1983, Petroleum Exploration
licences 221,238 and 239 Gunnedah/Surat Basin.
NARRABRI COAL OPERATIONS PTY LTD 2 - 88 SPECIALIST CONSULTANT STUDIES Narrabri Coal Mine – Stage 2 Longwall Project Part 2 – Hydrogeological Assessment Report No. 674/17
Department of Water Resources (DWR), 1988. Narrabri Hydrogeological Sheet (1:250,000).
Department of Infrastructure, Planning and Natural Resources (DIPNR), 2003. Groundwater
Monitoring Guidelines for Mine Sites within the Hunter Region. Rept prepared by J Williams,
Sept 2003.
Department of Land and Water Conservation (DLWC), 2002. The NSW State Groundwater
Dependent Ecosystems Policy.
Department of Natural Resources (DNR), 2005. Guidelines for Management of Stream/Aquifer
Systems in Coal Mining Developments – Hunter Region.
Department of Water and Energy (DECCW), 2009. Upper Namoi Groundwater Flow Model
Report.
Ditton Geotechnical Services, 2009. Mine Subsidence Predictions and Impact Assessment for
the Proposed Longwalls (Stage 2) at the Narrabri Coal Mine, Narrabri.
ESI , 2006. Groundwater Vistas. Version 5.16 User’s Manual.
Fetter CW, 1994. Applied Hydrogeology
Geological Survey of New South Wales 1961 Narrabri 1:250 000 Geological Map SH55-12.
GHD Pty Ltd, 2007. Narrabri Coal Project Groundwater Assessment, dated March 2007
Harbaugh A W, Banta E R, Hill M C, and McDonald M G, 2000. MODFLOW-2000 - The
USGS Modular Groundwater Flow Model – User Guide to Modulisation Concepts and the
Groundwater Flow Process: U. S. Geological Survey Open-File Report 00-0092.
Hvorslev, M J, 1951. Time lag and soil permeability in groundwater observations, US Army
Corps of Engrs. Waterways Exper. Sta. Bull. No 36.
Ife D, and Skelt K, 2004, Murray-Darling Basin Groundwater Status 1990-2000 Summary
Report, Murray Darling Basin Commission, Canberra.
Mining Geotechnical Services Pty Ltd, 2006. Narrabri Coal Project Subsidence Assessment.
Mining Geotechnical Services Pty Ltd, 2008. Geotechnical Assessment of the Narrabri Coal
Project.
Murray Darling Basin Commission (MDBC) (2001). Groundwater flow modelling guideline.
Murray-Darling Basin Commission. URL:
www.mdbc.gov.au/nrm/water_management/groundwater/groundwater_guides
National Health and Medical Research Council (NHMRC) / Agriculture and Resource
Management Council of Australia and New Zealand (ARMCANZ), 2000. Australian Drinking
Water Guidelines.
National Minimum Bore Specifications Committee, 2003. Minimum Construction
Requirements for Water Bores in Australia, Edition 2, Revised September 2003.
SPECIALIST CONSULTANT STUDIES 2 - 89 NARRABRI COAL OPERATIONS PTY LTD Part 2 – Hydrogeological Assessment Narrabri Coal Mine – Stage 2 Longwall Project Report No. 674/17
National Water Quality Management Strategy Guidelines for Groundwater Protection in
Australia (ARMCANZ / ANZECC)
NSW State Groundwater Dependent Ecosystem Policy (DLWC) Guidelines for the
Assessment and Management of Groundwater Contamination (DECC) Draft
NSW State Groundwater Policy Framework Document (DLWC)
NSW State Groundwater Quality Protection Policy (DLWC)
NSW State Groundwater Quantity Management Policy (DLWC) Draft
Pratt, W, 1998. Gunnedah Coalfield – Notes to Accompany the Gunnedah Coalfield Regional
Geology (North and South) Maps. NSW DMR Geological Survey Report GS1998/505.
Sigra, 2006. Narrabri Coal DST/Injection Fall-off Test Report, April 2006.
Tadros N Z, 1988. Structural subdivision of the Gunnedah Basin, New South Wales Geological
Survey Quarterly Notes 63.
Tadros N Z, 1993. The Gunnedah Basin New South Wales, Department of Mineral Resources,
Coal and Petroleum Geology Branch, Memoir No 012.
Water Resources Consulting Services, 1997. Bicarbonate Occurrence in Groundwater in the
Baan Baa Area, NSW
Watermark Numerical Computing, 2004, Model-Independent Parameter Estimation User
Manual: 5th Edition.
WRM Water and Environment Pty Ltd, 2009. Narrabri Coal Mine – Stage 2 Longwall Project
Surface Water Assessment

NARRABRI COAL OPERATIONS PTY LTD 2 - 90 SPECIALIST CONSULTANT STUDIES Narrabri Coal Mine – Stage 2 Longwall Project Part 2 – Hydrogeological Assessment Report No. 674/17
This page has intentionally been left blank

SPECIALIST CONSULTANT STUDIES NARRABRI COAL OPERATIONS PTY LTD Part 2 – Hydrogeological Assessment Narrabri Coal Mine – Stage 2 Longwall Project Report No. 674/17
Figures

NARRABRI COAL OPERATIONS PTY LTD SPECIALIST CONSULTANT STUDIES Narrabri Coal Mine – Stage 2 Longwall Project Part 2 – Hydrogeological Assessment Report No. 674/17
This page has intentionally been left blank
SPECIALIST CONSULTANT STUDIES NARRABRI COAL OPERATIONS PTY LTD Part 2 – Hydrogeological Assessment Narrabri Coal Mine – Stage 2 Longwall Project Report No. 674/17
PEER REVIEW
of the
Hydrogeological Assessment
Prepared by
Dr N.P. Merrick
(Note: The attached peer review relates to the assessment report submitted to the Department of Planning for adequacy assessment – August, 2009)

NARRABRI COAL OPERATIONS PTY LTD SPECIALIST CONSULTANT STUDIES Narrabri Coal Mine – Stage 2 Longwall Project Part 2 – Hydrogeological Assessment Report No. 674/17
This page left intentionally left blank
67417_Peer Review_Final for Exhibition HC2009/7
i
HERITAGE COMPUTING REPORT
REVIEW OF THE NARRABRI COAL PROJECT HYDROGEOLOGICAL ASSESSMENT
FOR
WHITEHAVEN COAL LTD
PO Box 600, Gunnedah, NSW 2380
By
Dr N. P. Merrick
Report Number: HC2009/7 Date: August 2009

67417_Peer Review_Final for Exhibition HC2009/7
ii
DOCUMENT REGISTER
REVISION DESCRIPTION DATE AUTHOR
A DRAFT 25 AUGUST 2009 NPM
B FINAL NPM
67417_Peer Review_Final for Exhibition HC2009/7
iii
EXECUTIVE SUMMARY
A groundwater model of continuous longwall mining of the Hoskissons Coal Seam at the Narrabri Coal Project in the Gunnedah Coalfield of New South Wales has been developed by Aquaterra Consulting Pty Ltd for Narrabri Coal Operations Pty Ltd. The purpose of the modelling is to assess potential impacts on local alluvial and hard rock aquifers and surface water bodies, Namoi River in particular, and to provide an indicative assessment of mine dewatering requirements. This report provides a peer review of the model according to Australian modelling guidelines (MDBC, 2001). The review is based on a checklist of 36 questions across nine (9) model categories. The review finds that the model has been developed competently, and is suitable for addressing environmental impacts and for estimating indicative dewatering rates. The model has adopted a few practices that are at the leading edge of best practice. First, development headings are recognised as early causes of depressurisation and are explicitly represented in the model. Second, pillars between mined panels are retained explicitly in the model because depressurisation above the pillars should not be as severe as it will be in the fractured zone above the goaf. Third, the material property values above the goaf are informed by external subsidence modelling and experience gained elsewhere. This study has had the benefit of a substantial groundwater monitoring network of 29 bores spread across the proposed mine site, over a good range of screened lithologies. Most water levels are measured approximately monthly by dipping. When Stage 2 mining commences, consideration should be given to installation of additional dataloggers so that mining effects can be tracked in time. Hydrographs to date show no definitive response to rainfall recharge, although a few bores have indications of time-varying responses that might be related to climate. Two multi-level holes with vibrating wire piezometers are particularly important. They show the natural vertical head profile and will show depressurisation effects when Stage 2 mining commences. Model calibration is limited to steady-state (pre-mining average heads) and a short period of transient observations. As there is no prior mining at the Project area, and no other operating underground mine nearby, there is only weak evidence for anticipated mine inflows. Model predictions will have consequent uncertainty. Several lines of evidence are provided in support of steady-state calibration in the form of a scatter plot, a table of performance statistics, and a list of residuals at each of 23 targets. Steady-state calibration is generally good, with satisfactory performance statistics. As the pressure head profile at a multi-piezometer site is matched very well, this adds confidence to mine inflow estimates which depend substantially on vertical hydraulic gradients.
67417_Peer Review_Final for Exhibition HC2009/7
iv
Absolute water levels are reproduced well at 16 simulated hydrographs for the transient calibration. Quantitative performance statistics are satisfactory. A longer period of record, preferably with more datalogged records, is required for definitive transient calibration of storage parameters. Model predictions have been made for mine inflow, baseflow reduction and regional drawdown. The predicted baseflow reductions at the Namoi River are likely to be minor (0.1 - 0.2 ML/day). Drawdown predictions indicate that the project will not impact significantly on the Namoi alluvium. There is only one registered bore that is close to the 1 metre drawdown contour at the end of mining, and a possible impact at this bore should be investigated Predicted peak mine inflow is expected to be no more than 4 ML/day. However, there is considerable uncertainty in this estimate as it relies on characterisation of a fractured zone that will not occur until Stage 2 mining commences. Sensitivity analysis has been applied to infer the likely uncertainty in mine inflows due to assumptions on the fractured zone permeabilities. This gives an uncertainty in the order of ±1 ML/day.
67417_Peer Review_Final for Exhibition HC2009/7
v
TABLE OF CONTENTS
EXECUTIVE SUMMARY ...................................................................................... III
1.0 INTRODUCTION............................................................................................1
2.0 SCOPE OF WORK..........................................................................................1
3.0 MODELLING GUIDELINES ........................................................................1
4.0 EVIDENTIARY BASIS ..................................................................................2
5.0 PEER REVIEW ...............................................................................................2
6.0 DISCUSSION ...................................................................................................3
6.1 THE REPORT ...................................................................................................3 6.2 DATA ANALYSIS .............................................................................................4 6.3 CONCEPTUALISATION .....................................................................................5 6.4 MODEL DESIGN...............................................................................................5 6.5 CALIBRATION..................................................................................................6 6.6 PREDICTION ....................................................................................................7 6.7 SENSITIVITY ANALYSIS...................................................................................8 6.8 UNCERTAINTY ANALYSIS ...............................................................................9
7.0 CONCLUSION ................................................................................................9
8.0 REFERENCES...............................................................................................10
67417_Peer Review_Final for Exhibition HC2009/7
1
1.0 INTRODUCTION
This report provides a peer review of the hydrogeological assessment of longwall mining of the Hoskissons Coal Seam for Stage 2 of the Narrabri Coal Project, a new mining operation in the Gunnedah Coalfield of New South Wales (NSW). Stage 1, granted approval in November 2007, covered first workings and surface infrastructure. The mine is situated at Baan Baa between Boggabri and Narrabri, about 60 km north-west of Gunnedah. The hydrogeological assessment is based on field investigations and a 3D groundwater model developed by Aquaterra Consulting Pty Ltd. The groundwater modelling forms an important component of the environmental assessment for the project. The purpose of the modelling is to assess potential impacts on local alluvial and hard rock aquifers, as well as possible interactions with the Namoi River. The model also provides an assessment of likely dewatering requirements for the mine as it progresses in time.
2.0 SCOPE OF WORK
This reviewer was charged with the following key tasks:
Review the groundwater model as documented against the guidelines developed for the Murray Darling Basin Commission;
Provide feedback to the modelling team during the course of model development; and
Provide an independent review in the form of a written report.
The model review was conducted progressively. The reviewer has been engaged at several steps of the modelling process, initially at the conceptualisation stage, and subsequently at calibration and revised calibration stages, and during prediction scenarios.
3.0 MODELLING GUIDELINES
The review has been structured according to the checklists in the Australian Flow Modelling Guideline (MDBC, 2001). This guide, sponsored by the Murray-Darling Basin Commission, has become a de facto Australian standard. This reviewer was one of the three authors of the guide, and is the person responsible for creating the peer review checklists. The checklists have been well received nationally, and have been adopted for use in the United Kingdom, California and Germany. The modelling has been assessed according to the 2-page Model Appraisal checklist in MDBC (2001). This checklist has questions on (1) The Report; (2) Data Analysis; (3) Conceptualisation; (4) Model Design; (5) Calibration;
67417_Peer Review_Final for Exhibition HC2009/7
2
(6) Verification; (7) Prediction; (8) Sensitivity Analysis; and (9) Uncertainty Analysis. The effort put into a modelling study is often dependent on timing and budgetary constraints that are generally not known to a reviewer. In this case, however, the reviewer is aware that considerable time and funds were expended on the many revisions of the model, and in no way was model development constrained.
4.0 EVIDENTIARY BASIS
The primary documentation on which this review is based is:
1. Fulton, A., 2009, Narrabri Coal Project - Hydrogeological Assessment. Aquaterra Consulting Report S28/B2/043c [20 August 2009]. Final Report for Narrabri Coal Operations Pty Ltd.
Earlier versions dated 4 June 2009 [S28/B2/043a] and 20 July 2009 [S28/B2/043b] also were reviewed. Two Stage 1 documents were made available to support the review:
2. GHD Pty Ltd, 2007, Narrabri Coal Project Groundwater Assessment. Report 674/05 for Narrabri Coal Pty Ltd. [March 2007];
3. Best, R., 2007, Narrabri Coal Project – Review of GHD Groundwater Assessment. Coffey Geotechnics Letter Report to RW Corkery & Co Pty Ltd. 043c [13 March 2007].
There has been considerable direct communication with the Aquaterra modelling team in the form of emails, telephone conversations, teleconferences and three face-to-face meetings. The reviewer has a long history of investigation and modelling in the Lower and Upper Namoi Valleys through the state water agency (now DECCW) and the Cotton Catchment Communities CRC.
5.0 PEER REVIEW
In terms of the modelling guidelines, the Narrabri coal model is categorised as an Impact Assessment Model of medium complexity, as distinct from an Aquifer Simulator of high complexity. The Australian best practice guide (MDBC, 2001) describes the connection between model application and model complexity as follows:
Impact Assessment model - a moderate complexity model, requiring more data and a better understanding of the groundwater system dynamics, and
67417_Peer Review_Final for Exhibition HC2009/7
3
suitable for predicting the impacts of proposed developments or management policies; and
Aquifer Simulator - a high complexity model, suitable for predicting responses to arbitrary changes in hydrological conditions, and for developing sustainable resource management policies for aquifer systems under stress.
The appraisal checklists are presented in Tables 1 and 2 (at the back of this report). The current review has been based mainly on a written report, but some spreadsheet files were examined during the review. Discussion on each modelling aspect is provided in Section 6.
6.0 DISCUSSION
6.1 THE REPORT
The Model Report (Document #1) is a substantial, high quality document of 67 pages in the main body of the report plus 43 figures and 11 appendices. To an external reader with no prior knowledge of the study area, the report is very good as a standalone document. There is very little assumed knowledge. The objectives of the study are equivalent to the Director General’s Requirements stated in Document #1 as:
1. “A description of the existing environment. 2. Assessment of the potential impacts of all stages of the project including
any cumulative impacts associated with the concurrent operation of the project with any other existing approved mining operation, taking into consideration any relevant guidelines, policies, plans and statutory provisions.
3. Assessment of the potential impacts on the quantity, quality and long-term integrity of the groundwater resources.
4. Description of the measures that would be implemented to avoid, minimize, mitigate, rehabilitate/remediate, monitor and/or offset the potential impacts of the project including detailed contingency plans for managing any significant risks to the environment.”
The report addresses the project objectives satisfactorily. It discusses and presents results in 10 sections: Introduction; Previous Groundwater Investigations; Stage 2 Groundwater Investigations; Description of the Existing Environment; Mining Proposal; Groundwater Modelling to Assess Potential Impacts; Potential Groundwater Impacts of the Project; Monitoring and Management; Contingency Response Plans; and Summary and Conclusions. In the discussion on previous groundwater investigations (Section 2), mention should be made of two additional Upper Namoi Valley modelling studies (Breeza to Narrabri; Breeza to Quirindi).
67417_Peer Review_Final for Exhibition HC2009/7
4
Bore details in Table 2.1 and permeability tests in Table 2.3 appear to be unsorted on any attribute. This lessens the opportunity to perceive patterns in the results. Reference should be made in Sections 2.9, 3.2.2 and 4.8 (Census of Groundwater Use) to the subsequent Figure 7.2 that shows the locations of registered groundwater bores. Geophysical logs in Figure 4.5 should include measurement units. There is comprehensive coverage of the modelling component of the study, with full disclosure in an Appendix of layer elevations, aquifer parameterisation, and assumed boundary conditions. The report has sufficient description of the modelling process and extensive reporting of modelling results. Water balance estimates are reported globally at steady state (Table 6.3) and for the period of transient calibration (Table 6.6). For prediction runs, water balance reporting concentrates on drawdown, baseflow, baseflow reduction and pit inflows, the primary outputs of the modelling study.
6.2 DATA ANALYSIS
Substantial hydraulic testing by slug tests, packer tests and core measurements has been undertaken. Slug tests by GHD and Aquaterra show poor repeatability, with often an order of magnitude difference. This is not unusual, as the formation is stressed only to a small degree at point scale and in the short term only. Hence, the derived values are not of much use in informing the values that should be adopted in a regional model. Hydraulic responses to large stresses are the best way to infer true permeabilities, but this cannot happen until mining commences. This reviewer agrees that core measurements of matrix permeability are “of limited value” at a regional scale where fracture flow is likely to dominate. This study has an extensive network of monitored groundwater levels at 29 sites spread across the proposed mine site, over a good range of screened lithologies. Water level measurements, available from November 2007 usually at monthly intervals, show quiescent conditions in the upper sections. The five exploration holes with vibrating wire (VW) piezometers grouted in the Hoskissons Coal Seam show head variations in the order of 50 m due to in-seam gas drilling. When Stage 2 mining commences, consideration should be given to installation of additional dataloggers so that mining effects can be tracked in time. Of particular importance are two multi-level holes with VW piezometers at four or five depths. They show the natural vertical head profile and will show depressurisation effects when Stage 2 mining commences. They are of particular value for groundwater model calibration. Only the pressure head at one site (NC175) is shown in the report (in Figure 6.2). The potentiometric head profiles are not shown.
67417_Peer Review_Final for Exhibition HC2009/7
5
Groundwater elevation contours are provided in the upper (Jurassic) and lower (Triassic to Permian) sections in Figure 4.4. While these contours suggest a vertical head difference of 20-25 m between upper and lower sections, the general flow direction to the north-west is inconsistent with subsequent conceptualisation (Figure 6.1) and simulation (Figure 6.3). Lower measured groundwater heads to the south-east and east suggest that the north-west trend swings around to the east on the eastward side of the project area, as the simulations show (e.g. Figure 6.3). Although the spatial distribution of measurements is insufficient for definitive inference of groundwater flow directions, the groundwater flow regime described in Section 2.5 is consistent with conceptualisation and simulation. The aquifer system appears to suffer very little stress due to natural processes such as rainfall and stream-aquifer interaction. Most hydrographs show a quiescent response, suggesting a minor role for rainfall infiltration. However, the wide sampling interval (~monthly) precludes a definitive conclusion on the significance of rainfall recharge. Piezometers P10, P16 and P19 show a lowering of water levels in late 2008. This effect should be discussed. Comparison with rainfall residual mass should be made to see if there is a climatic explanation. The lower water levels seem to have been excluded from transient calibration, and the entire P10 hydrograph appears to have been excluded. Quantifying the permeability and storage characteristics of the fractured zone that develops above a mined seam is extremely difficult. This study has been informed by state-of-art subsidence modelling and by experience in other areas.
6.3 CONCEPTUALISATION
The modelling team’s conceptualisation is discussed in detail, in terms of geology and key recharge/discharge processes. An informative perspective view of the conceptual model is given in Figure 6.1. A conceptual model diagram is a simplified 2D or 3D summary picture (without stratigraphic detail) that conveys the essential features of the hydrological system, denoting all recharge/discharge processes that are likely to be significant. The diagram can serve a dual purpose for displaying the magnitudes of the water budget components derived from data sources or from simulation.
6.4 MODEL DESIGN
There is an existing prior model of the mine site developed by GHD [Document #2], but extensive modifications have been made to that model by Aquaterra [Document #1]. The GHD model had very little data for

67417_Peer Review_Final for Exhibition HC2009/7
6
calibration, did not include a fractured zone, and did not document the assumed mine schedule or the post-mining water balance. The model has been built with Groundwater Vistas software and MODFLOW SURFACT, an advanced version of standard MODFLOW which is regarded widely as a standard, particularly by government agencies. This version was selected to reduce numerical issues with dry cells (common in mining and dewatering operations). The pseudo-soil option was used, rather than full simulation of variable saturation. One limitation that all versions of MODFLOW have for coal mining simulations is that they do not permit material properties to vary in time. In this study, a stop-start process across 14 time slices has been adopted to allow progressive incorporation of the fractured zone above goaf areas during the model prediction phase. The fractured zone is assumed to extend from Layer 5 (Naperby Formation) to Layer 8 (Digby Formation) in the model, but a sensitivity run examined the effect of fracturing up to Layer 4 (Garrawilla Volcanics). Discretisation in space is appropriate. Model cells are 50 m square across the mine site, with 500 m at model edges. There are 269 rows and 270 columns. The fine scale has allowed the simulation of development headings as well as discrete pillar widths. The model has been built with 11 layers. The broad model extent of 75 km by 52 km incorporates the Namoi alluvium and the Namoi River and its tributaries. There are no other existing mines to be taken into consideration for cumulative effects. Boundary conditions are sufficiently distant that assumptions as to their head/flux values will not bias predictions. Active mining is represented appropriately by MODFLOW “drain” cells which remain active while mining downdip on the northern side; downgradient panels are deactivated as mining progresses updip on the southern side.
6.5 CALIBRATION
Calibration has been performed for both steady-state and transient conditions. Initial calibration was done by manual trial-and-error, but final calibration was done using automated calibration software (PEST) in order to replicate the observed vertical head gradient. Several lines of evidence are provided in support of steady-state calibration in the form of a scatter plot, a table of performance statistics, and a list of residuals at each of 23 targets. Steady-state calibration is generally good, with satisfactory performance statistics: 10 % SRMS and 8.2 m RMS. The steady-state scatter plot in Figure 6.2a (Document #1) shows a mild bias towards underestimation of heads. Mine inflow estimates depend mostly on
67417_Peer Review_Final for Exhibition HC2009/7
7
replication of the vertical pressure head gradient, which is matched very well (Figure 6.2b). Less substantive lines of evidence are provided for transient calibration. The main performance indicator is qualitative comparison of 16 simulated and observed hydrographs. Absolute water levels are reproduced well, but there appear to be no simulated water level fluctuations even though seasonal rainfall has been imposed. This leads to horizontal strings of data points in the scatter plot offered in Appendix G. Performance statistics are satisfactory: 10 % SRMS and 8.4 m RMS. However, some time-varying data from P10, P16 and P19 seem to be excluded from analysis. Calibrated material properties (Table 6.7) and rain recharge rates (Table 6.10) are generally plausible. Rain recharge rates range from 0.5% to 1.9%, similar in magnitude to values adopted in other Namoi Valley models. There is full disclosure of calibrated property distributions in an Appendix. Horizontal to vertical permeability anisotropy ratios range from 40 (Layer 11) to 1000 (Layer 1).
6.6 PREDICTION
Predictions are based on transient simulation for 29 years of continuous mining followed by 100 years of recovery after the cessation of mining. No natural dynamic stresses from rainfall or river flow are applied during prediction, so that the hydrological effects of mining can be isolated. Separate schedules are followed for development headings and longwall panels. For each 1-year stress period, development headings and longwalls are specified in advance as active drain cells. Enhanced permeability in fractured zone cells is specified in arrears for each new time-slice. There are 14 time slices of two years duration (3 years for the first one). The adopted horizontal permeabilities for fractured formations are listed in Table 6.12 of Document #1. The values are based solely on professional judgement, as there is nothing on which to calibrate, and there are no sufficiently close neighbouring mines to reliably constrain the consequent predicted mine inflows. In the absence of measurement of mining-stressed hydraulic gradients, standard practice is to apply a multiplier to derive a fractured Kh from the host Kh. The multipliers adopted by Aquaterra are 8 (Layer 5) and 2 (Layers 6, 7, 8). These multipliers are reasonable. At a mine in the Southern Coalfield, where mining-stressed hydraulic gradients were available, unconstrained automated calibration gave multipliers of 1.1 to 1.8 for Kh. The base-case vertical permeabilities for fractured formations are derived by applying multipliers to host Kz values. The multipliers adopted by
67417_Peer Review_Final for Exhibition HC2009/7
8
Aquaterra are 2.5 (Layers 5 and 6), 10 (Layer 7) and 20 (Layer 8). These multipliers are reasonable. Again, the values are based on professional judgement and the conceptualisation that the fractured zone is essentially uninhibited and free draining. While the adopted fractured zone Kz values make sense conceptually, there is nothing on which to calibrate these values, other than an expectation of mine inflow magnitude.
There is no standard practice for fractured zone Kz estimates. At a mine in the Southern Coalfield, where mining-stressed vertical hydraulic gradients were available, unconstrained automated calibration gave multipliers ranging from 1.5 at the top of the fractured zone to about 20 above the coal seam, with a median of 6 and an average of 8. The model predicts a peak mine inflow a little less than 4 ML/day. It must be recognised that mine inflow estimates are very sensitive to adopted permeabilities for the fractured zone (as stated in Section 7.2 of Document #1). The model predicts regional drawdowns that do not impact significantly on Namoi alluvium or registered production bores by the end of mining. After 15 years, the 0.5 m drawdown contour is no closer than 4 km from the nearest alluvial boundary (Figure 6.13). At the end of mining (29 years), the 1 m drawdown contour impinges on the alluvial boundary to the immediate north of the mine (Figure 6.14). There is one production bore that requires assessment for possible impact (Figure 7.2). There is an acknowledgement in Section 7.3 that some springs derived from Permian strata might be impacted by depressurisation. The model predicts a minor reduction in Namoi River baseflow in the order of 0.2 ML/d at the end of mining, settling at about 0.1 ML/day reduction 30 years after the cessation of mining. The model has been used also to assess the likely time-varying salinity ranges of mine water, and the potential for reinjection of saline stored water. These scenarios are constructed sensibly. For the recovery simulation, it is not clear what storage parameters have been assumed.
6.7 SENSITIVITY ANALYSIS
The degree of sensitivity analysis that can reasonably be done is limited by the long run-time of each simulation. Accordingly, sensitivity analysis has been done with steady-state analysis rather than transient simulation. Performance has been measured by the SRMS statistic for groundwater heads.
67417_Peer Review_Final for Exhibition HC2009/7
9
There has been an extensive analysis of the effects of varying (in separate runs) the horizontal and vertical hydraulic conductivities in each layer, and the rainfall recharge across six zones. No significant parameters have been omitted from sensitivity analysis. Compared to the 9.94% SRMS statistic for the simulation with the calibrated data set, the best sensitivity runs achieved only minor improvements in performance: 9.79% (higher Kh in Regolith), 9.54% (lower Kz in Digby Formation), 9.65% (lower rain recharge on alluvium). Rainfall infiltration is sensitive in Zone 3 (Pilliga outcrop to the west) and Zone 4 (Garrawilla Volcanics outcrop to the east). Horizontal hydraulic conductivity is sensitive in Layer 2 (Pilliga Sandstone) and Layer 5 (Naperby Formation). Vertical hydraulic conductivity is sensitive when it is reduced in about half of the layers. Instead of the conventional perturbation approach, the sensitivity analysis for transient simulation has been done using alternative models, as discussed in the section on Uncertainty Analysis.
6.8 UNCERTAINTY ANALYSIS
Uncertainty analysis has been performed on transient prediction outputs by the use of alternative models having different values for fractured zone permeabilities, and different heights for the fractured zone. The analysis illustrates the range of uncertainty in baseflow impacts, mine inflow and mine water salinity. Negligible effects resulted from raising the height of the fractured zone. A conservative approach has been adopted wherever uncertain decisions had to be made in the model, as described in Section 7.2 of Document #1. This approach is likely to overestimate mine inflows and environmental impacts indicated by far-field drawdowns and baseflow reductions. To account for re-consolidation with time, experiments were conducted for some permeability reduction in the fractured zone for cells that were enhanced in all but the previous time slice. As the base case does not include this feature, resulting inflow predictions will be conservatively high.
7.0 CONCLUSION
The Narrabri Coal groundwater investigation has been thorough and extensive, and the associated groundwater model has been developed competently. It is a suitable model for addressing likely environmental impacts from longwall mining of the Hoskissons Coal Seam, and for estimating indicative mine inflow rates.
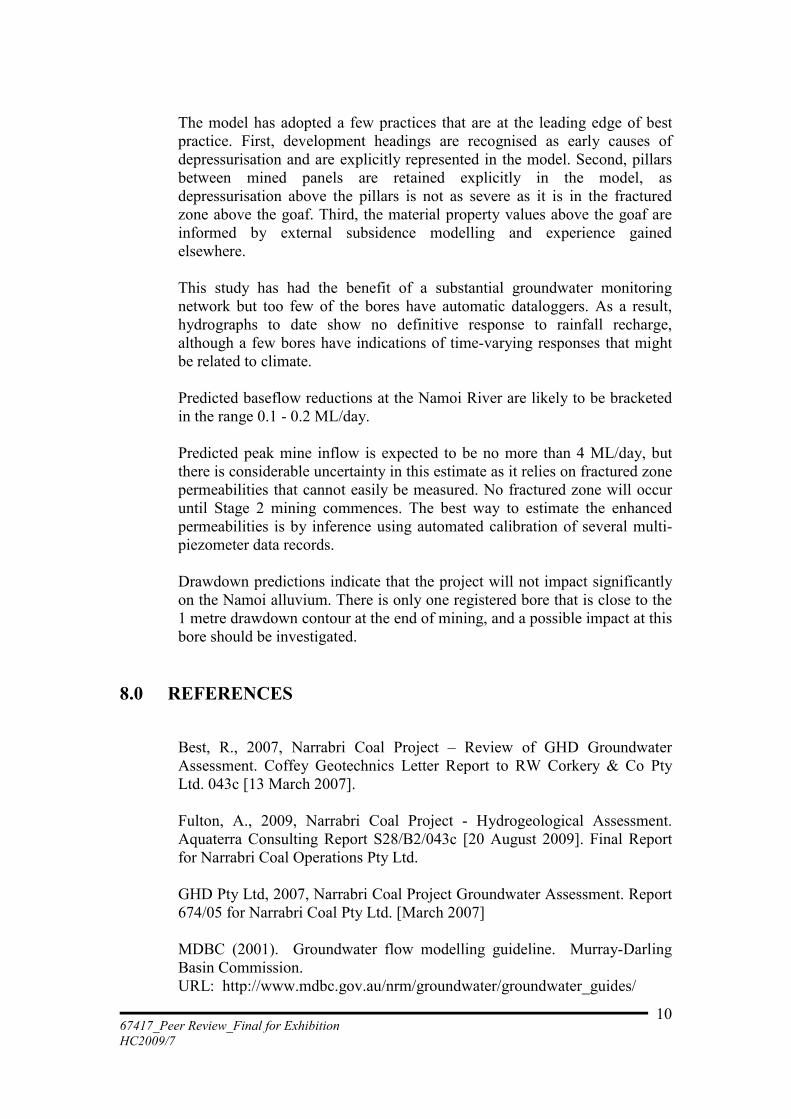
67417_Peer Review_Final for Exhibition HC2009/7
10
The model has adopted a few practices that are at the leading edge of best practice. First, development headings are recognised as early causes of depressurisation and are explicitly represented in the model. Second, pillars between mined panels are retained explicitly in the model, as depressurisation above the pillars is not as severe as it is in the fractured zone above the goaf. Third, the material property values above the goaf are informed by external subsidence modelling and experience gained elsewhere. This study has had the benefit of a substantial groundwater monitoring network but too few of the bores have automatic dataloggers. As a result, hydrographs to date show no definitive response to rainfall recharge, although a few bores have indications of time-varying responses that might be related to climate. Predicted baseflow reductions at the Namoi River are likely to be bracketed in the range 0.1 - 0.2 ML/day. Predicted peak mine inflow is expected to be no more than 4 ML/day, but there is considerable uncertainty in this estimate as it relies on fractured zone permeabilities that cannot easily be measured. No fractured zone will occur until Stage 2 mining commences. The best way to estimate the enhanced permeabilities is by inference using automated calibration of several multi-piezometer data records. Drawdown predictions indicate that the project will not impact significantly on the Namoi alluvium. There is only one registered bore that is close to the 1 metre drawdown contour at the end of mining, and a possible impact at this bore should be investigated.
8.0 REFERENCES
Best, R., 2007, Narrabri Coal Project – Review of GHD Groundwater Assessment. Coffey Geotechnics Letter Report to RW Corkery & Co Pty Ltd. 043c [13 March 2007]. Fulton, A., 2009, Narrabri Coal Project - Hydrogeological Assessment. Aquaterra Consulting Report S28/B2/043c [20 August 2009]. Final Report for Narrabri Coal Operations Pty Ltd. GHD Pty Ltd, 2007, Narrabri Coal Project Groundwater Assessment. Report 674/05 for Narrabri Coal Pty Ltd. [March 2007] MDBC (2001). Groundwater flow modelling guideline. Murray-Darling Basin Commission. URL: http://www.mdbc.gov.au/nrm/groundwater/groundwater_guides/
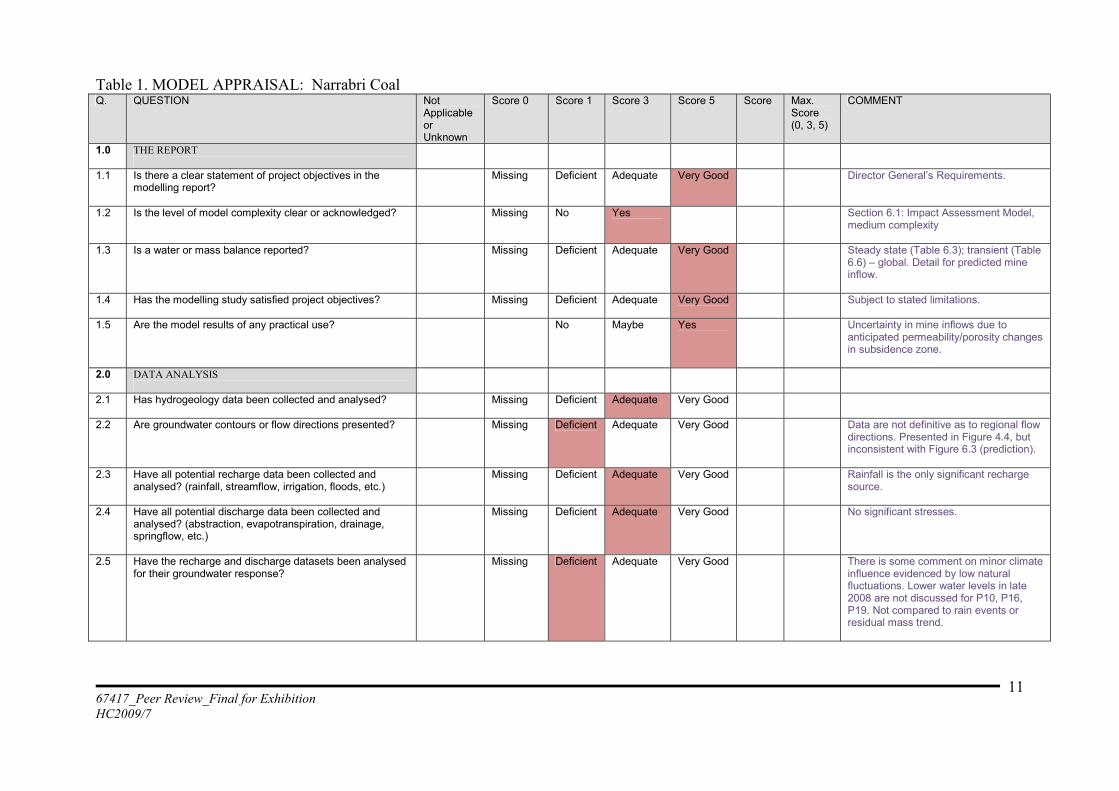
67417_Peer Review_Final for Exhibition HC2009/7
11
Table 1. MODEL APPRAISAL: Narrabri Coal Q. QUESTION Not
Applicable or Unknown
Score 0 Score 1 Score 3 Score 5 Score Max. Score (0, 3, 5)
COMMENT
1.0 THE REPORT
1.1 Is there a clear statement of project objectives in the modelling report?
Missing Deficient Adequate Very Good Director General’s Requirements.
1.2 Is the level of model complexity clear or acknowledged? Missing No Yes Section 6.1: Impact Assessment Model, medium complexity
1.3 Is a water or mass balance reported? Missing Deficient Adequate Very Good Steady state (Table 6.3); transient (Table 6.6) – global. Detail for predicted mine inflow.
1.4 Has the modelling study satisfied project objectives?
Missing Deficient Adequate Very Good Subject to stated limitations.
1.5 Are the model results of any practical use? No Maybe Yes Uncertainty in mine inflows due to anticipated permeability/porosity changes in subsidence zone.
2.0 DATA ANALYSIS
2.1 Has hydrogeology data been collected and analysed?
Missing Deficient Adequate Very Good
2.2 Are groundwater contours or flow directions presented? Missing Deficient Adequate Very Good Data are not definitive as to regional flow directions. Presented in Figure 4.4, but inconsistent with Figure 6.3 (prediction).
2.3 Have all potential recharge data been collected and analysed? (rainfall, streamflow, irrigation, floods, etc.)
Missing Deficient Adequate Very Good Rainfall is the only significant recharge source.
2.4 Have all potential discharge data been collected and analysed? (abstraction, evapotranspiration, drainage, springflow, etc.)
Missing Deficient Adequate Very Good No significant stresses.
2.5 Have the recharge and discharge datasets been analysed for their groundwater response?
N/A Missing Deficient Adequate Very Good There is some comment on minor climate influence evidenced by low natural fluctuations. Lower water levels in late 2008 are not discussed for P10, P16, P19. Not compared to rain events or residual mass trend.
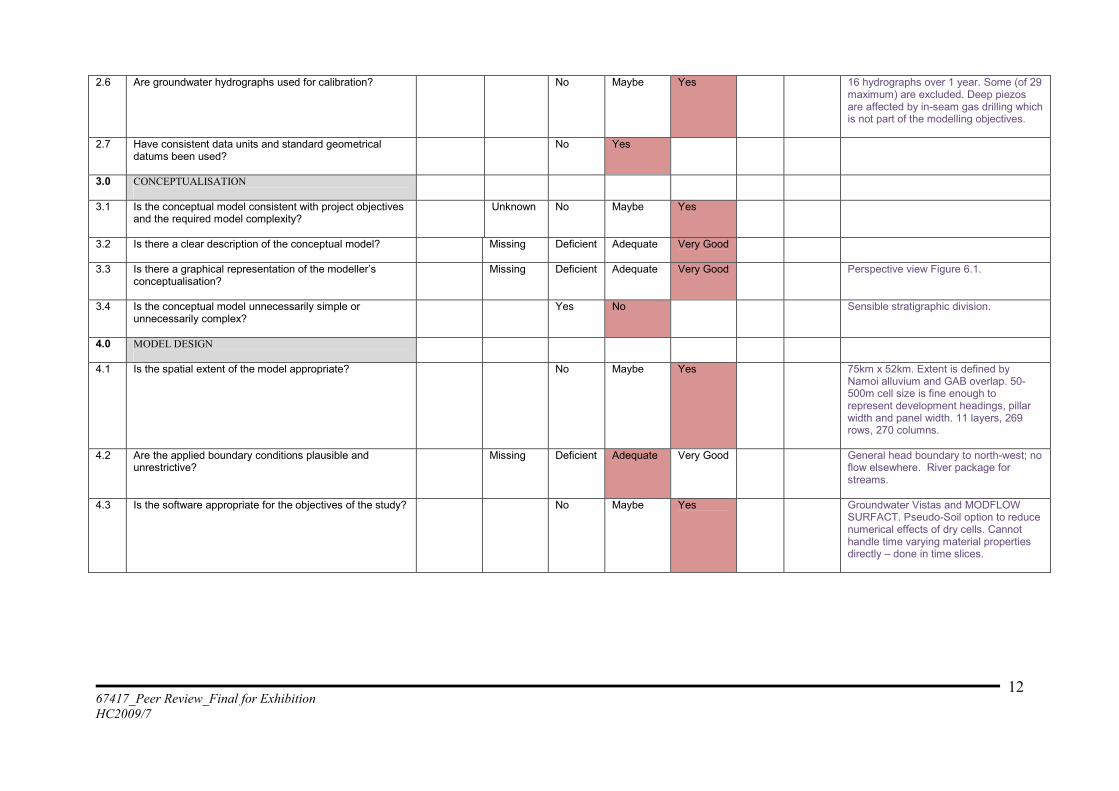
67417_Peer Review_Final for Exhibition HC2009/7
12
2.6 Are groundwater hydrographs used for calibration?
N/A No Maybe Yes 16 hydrographs over 1 year. Some (of 29 maximum) are excluded. Deep piezos are affected by in-seam gas drilling which is not part of the modelling objectives.
2.7 Have consistent data units and standard geometrical datums been used?
No Yes
3.0 CONCEPTUALISATION
3.1 Is the conceptual model consistent with project objectives and the required model complexity?
Unknown No Maybe Yes
3.2 Is there a clear description of the conceptual model?
Missing Deficient Adequate Very Good
3.3 Is there a graphical representation of the modeller’s conceptualisation?
Missing Deficient Adequate Very Good Perspective view Figure 6.1.
3.4 Is the conceptual model unnecessarily simple or unnecessarily complex?
Yes No Sensible stratigraphic division.
4.0 MODEL DESIGN
4.1 Is the spatial extent of the model appropriate? No Maybe Yes 75km x 52km. Extent is defined by Namoi alluvium and GAB overlap. 50-500m cell size is fine enough to represent development headings, pillar width and panel width. 11 layers, 269 rows, 270 columns.
4.2 Are the applied boundary conditions plausible and unrestrictive?
Missing Deficient Adequate Very Good General head boundary to north-west; no flow elsewhere. River package for streams.
4.3 Is the software appropriate for the objectives of the study? No Maybe Yes Groundwater Vistas and MODFLOW SURFACT. Pseudo-Soil option to reduce numerical effects of dry cells. Cannot handle time varying material properties directly – done in time slices.
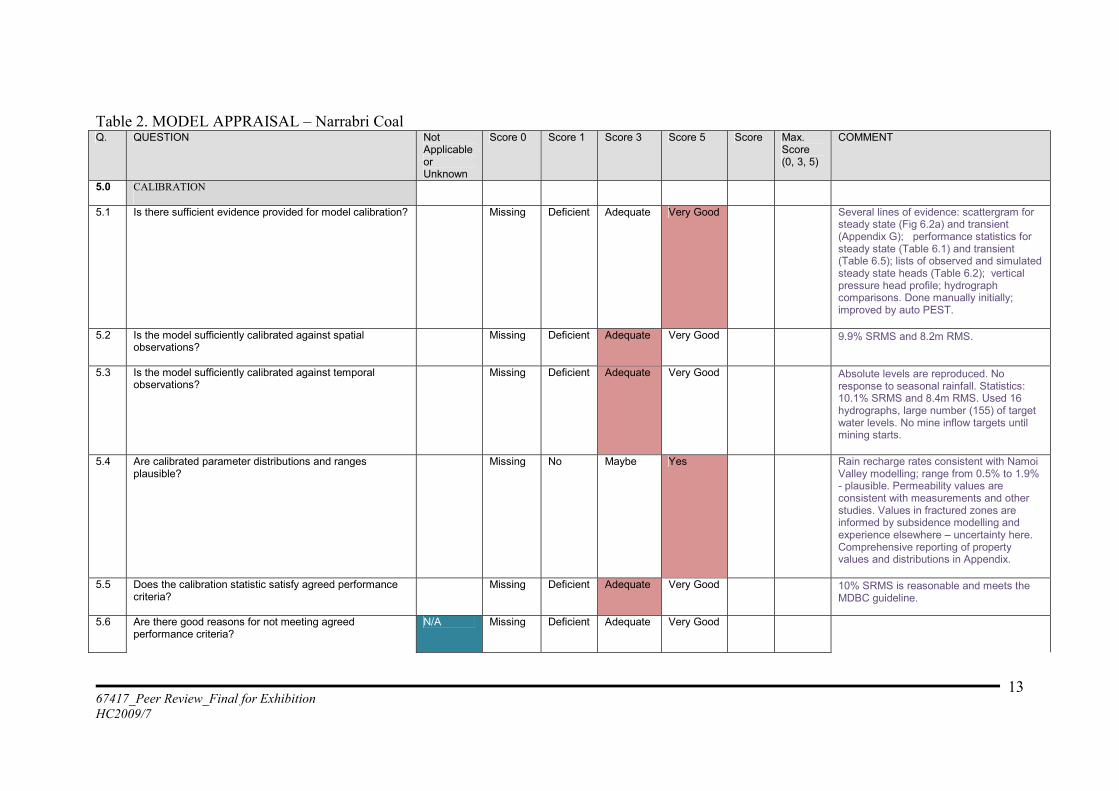
67417_Peer Review_Final for Exhibition HC2009/7
13
Table 2. MODEL APPRAISAL – Narrabri Coal Q. QUESTION Not
Applicable or Unknown
Score 0 Score 1 Score 3 Score 5 Score Max. Score (0, 3, 5)
COMMENT
5.0 CALIBRATION
5.1 Is there sufficient evidence provided for model calibration? Missing Deficient Adequate Very Good Several lines of evidence: scattergram for steady state (Fig 6.2a) and transient (Appendix G); performance statistics for steady state (Table 6.1) and transient (Table 6.5); lists of observed and simulated steady state heads (Table 6.2); vertical pressure head profile; hydrograph comparisons. Done manually initially; improved by auto PEST.
5.2 Is the model sufficiently calibrated against spatial observations?
Missing Deficient Adequate Very Good 9.9% SRMS and 8.2m RMS.
5.3 Is the model sufficiently calibrated against temporal observations?
N/A Missing Deficient Adequate Very Good Absolute levels are reproduced. No response to seasonal rainfall. Statistics: 10.1% SRMS and 8.4m RMS. Used 16 hydrographs, large number (155) of target water levels. No mine inflow targets until mining starts.
5.4 Are calibrated parameter distributions and ranges plausible?
Missing No Maybe Yes Rain recharge rates consistent with Namoi Valley modelling; range from 0.5% to 1.9% - plausible. Permeability values are consistent with measurements and other studies. Values in fractured zones are informed by subsidence modelling and experience elsewhere – uncertainty here. Comprehensive reporting of property values and distributions in Appendix.
5.5 Does the calibration statistic satisfy agreed performance criteria?
Missing Deficient Adequate Very Good 10% SRMS is reasonable and meets the MDBC guideline.
5.6 Are there good reasons for not meeting agreed performance criteria?
N/A Missing Deficient Adequate Very Good
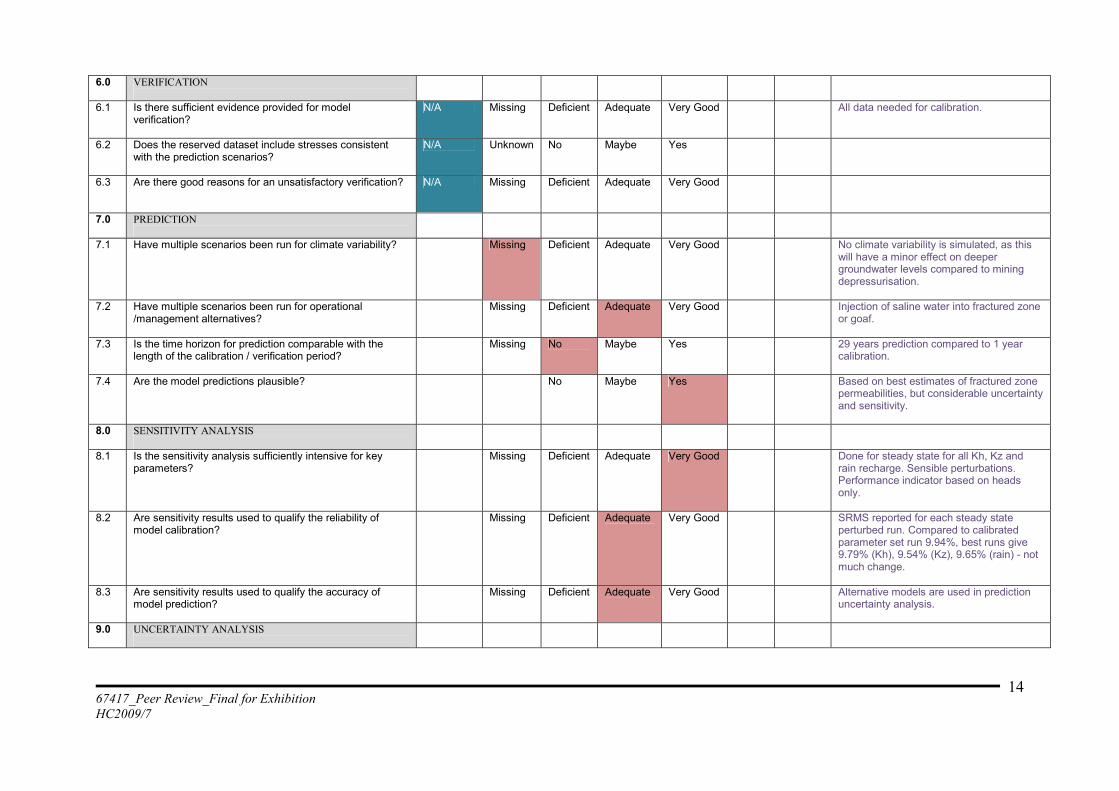
67417_Peer Review_Final for Exhibition HC2009/7
14
6.0 VERIFICATION
6.1 Is there sufficient evidence provided for model verification?
N/A Missing Deficient Adequate Very Good All data needed for calibration.
6.2 Does the reserved dataset include stresses consistent with the prediction scenarios?
N/A Unknown No Maybe Yes
6.3 Are there good reasons for an unsatisfactory verification?
N/A Missing Deficient Adequate Very Good
7.0 PREDICTION
7.1 Have multiple scenarios been run for climate variability? N/A Missing Deficient Adequate Very Good No climate variability is simulated, as this will have a minor effect on deeper groundwater levels compared to mining depressurisation.
7.2 Have multiple scenarios been run for operational /management alternatives?
Missing Deficient Adequate Very Good Injection of saline water into fractured zone or goaf.
7.3 Is the time horizon for prediction comparable with the length of the calibration / verification period?
Missing No Maybe Yes 29 years prediction compared to 1 year calibration.
7.4 Are the model predictions plausible? No Maybe Yes Based on best estimates of fractured zone permeabilities, but considerable uncertainty and sensitivity.
8.0 SENSITIVITY ANALYSIS
8.1 Is the sensitivity analysis sufficiently intensive for key parameters?
Missing Deficient Adequate Very Good Done for steady state for all Kh, Kz and rain recharge. Sensible perturbations. Performance indicator based on heads only.
8.2 Are sensitivity results used to qualify the reliability of model calibration?
Missing Deficient Adequate Very Good SRMS reported for each steady state perturbed run. Compared to calibrated parameter set run 9.94%, best runs give 9.79% (Kh), 9.54% (Kz), 9.65% (rain) - not much change.
8.3 Are sensitivity results used to qualify the accuracy of model prediction?
Missing Deficient Adequate Very Good Alternative models are used in prediction uncertainty analysis.
9.0 UNCERTAINTY ANALYSIS
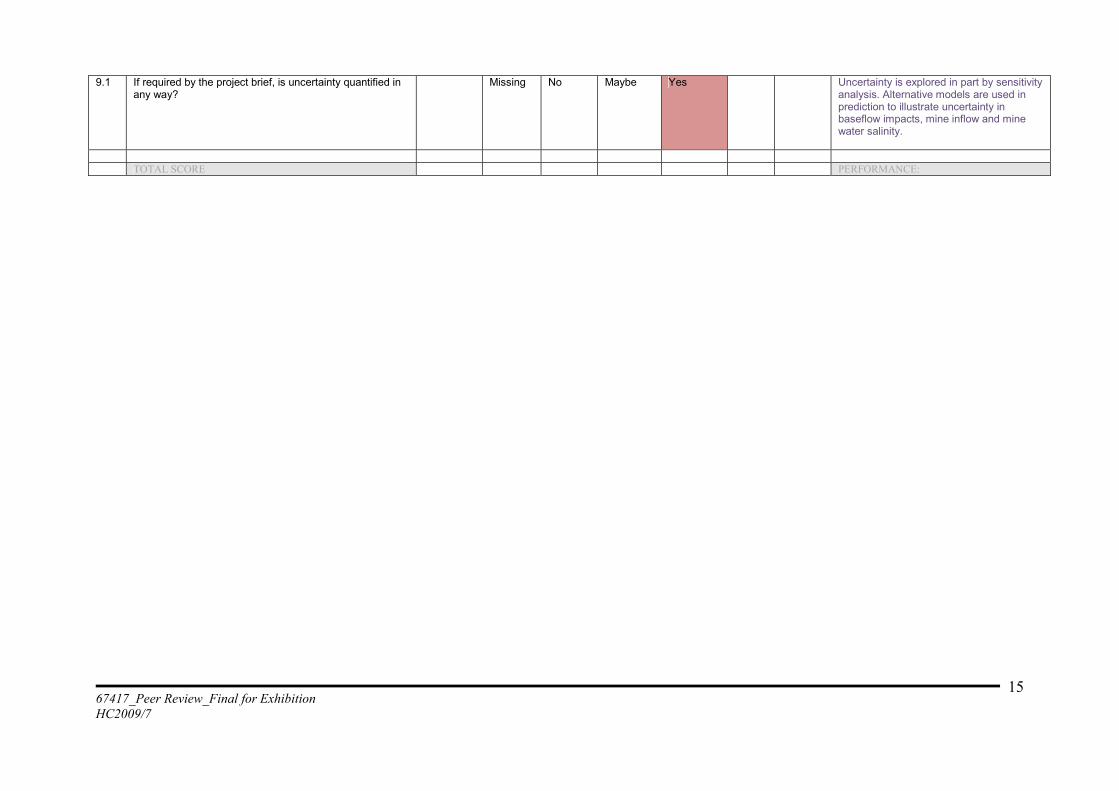
67417_Peer Review_Final for Exhibition HC2009/7
15
9.1 If required by the project brief, is uncertainty quantified in any way?
Missing No Maybe Yes Uncertainty is explored in part by sensitivity analysis. Alternative models are used in prediction to illustrate uncertainty in baseflow impacts, mine inflow and mine water salinity.
TOTAL SCORE PERFORMANCE: