nasa avscom technical memorandum 104154 dtic · nasa avscom technical memorandum 104154 ......
TRANSCRIPT

AD-A243 495 0NASA AVSCOMTechnical Memorandum 104154 Technical Report 91-B-015
DTICELECTEDEC 171991 J
CDETAILED ANALYSIS AND TEST CORRELATIONOF A STIFFENED COMPOSITE WING PANEL
D. Dale Davis, Jr.Aerostructures DirectorateAviation Systems CommandHampton, Virginia
September 1991
NASA 91-17905 .N'ational Aoronautics and flI1UH iMm lll1lli~Space Administration 111111 li lt 111 11 i L ""'i111us ARMY /
Langley Research Center AVIATIONgi SYSTEMS COMMAND
Hampton, Virginia 23665-522. AVIATION R8T ACTIVITY
91 1213 125

DETAILED ANALYSIS AND TEST CORRELATION OF ASTIFFENED COMPOSITE WING PANEL
D.D. Davis, Jr.
Abstract
State-of-the-art nonlinear finite element analysis techniques are evaluated by applying them toa realistic aircraft structural component. A wing panel from the V-22 tiltrotor aircraft (shown inFig. 1) is chosen because it is a typical modern aircraft structural component for which there isexperimental data for comparison of results. From blueprints and drawings supplied by BellHelicopter Textron, Inc., a very detailed finite element model containing 2284 9-node AssumedNatural-Coordinate Strain (ANS) elements was generated. A novel solution strategy whichaccounts for geometric nonlinearity through the use of corotating element reference frames andnonlinear strain-displacement relations is used to analyze this detailed model. Results from linearanalyses using the same finite element model are presented in order to illustrate the advantages andcosts of the nonlinear analysis as compared with the more traditional linear analysis. Strainpredictions from both the linear and nonlinear stress analyses are shown to compare well withexperimental data up through the Design Ultimate Load (DUL) of the panel. However, due to theextreme nonlinear response of the panel, the linear analysis was not accurate at loads above theDUL. The nonlinear analysis more accurately predicted the strain at high values of applied load,and even predicted complicated nonlinear response characteristics, such as load reversals, near theobserved failure load of the test panel. In order to understand the failure mechanism of the panel,buckling and first-ply failure analyses were performed. The predicted buckling load was 17%above the observed failure load while first-ply failure analyses indicated significant materialdamage at and below the observed failure load.
..... ,a.,...t* e r
fS1S!or
Figure itn abnlFoV22 tto.
Figure 1. Wing Panel From V-22 Tiltrotor Aircraft

INTRODUCTION
Complex structural systems which incorporate advanced materials and novel configurationsrequire accurate and dependable structural analysis techniques. The finite element method hasemerged over the years as the leading analytical tool of the engineer. However, the nonlinearresponse of very complex structural components has been difficult to predict. Recent advanceshave made such problems tractable. Advanced finite elements have been developed that are lesssensitive to modeling distortion such as warp, taper, skew, and extreme values of aspect ratio thantraditional element formulations (Refs. 1-3). Nonlinear solution algorithms have been developedthat accurately predict response of highly nonlinear, post-buckled structures (Refs. 4-8). Inaddition, advancements in computer hardware and software make it possible to predict theresponse of large structural components whose finite element models require thousands of degrees-of-freedom (Ref. 9).
A major activity is underway at NASA Langley Research Center in structural analysis methodsresearch to provide better analysis tools and techniques for the aerospace industry. With the needfor advanced structural analysis methods in mind, a computer code has been developed that servesas a framework for structural analysis methods research. This research code, referred to as theCOmputational MEchanics Testbed (COMET), allows new technology to be implemented andcompared with other methods in a common software system (Refs. 10-12). COMET currentlycontains state-of-the-art technology such as improved finite elements, equation solvers,eigensolvers, and solution strategies. There is also ongoing research in constitutive modeling,error detection and control, failure methods, global/local analysis, adaptive mesh refinement, andmultiple methods interfacing techniques.
New analysis techniques are often verified using simple textbook problems that have well-known theoretical solutions (Ref. 13). However, even methods that perform well on simple testcases may not be feasible for analysis of realistic structures. The primary purpose of this paper isto examine the performance of recent developments and new techniques by applying them to acomplex realistic structure. In particular, a novel finite element formulation and a nonlinearsolution algorithm are assessed, and both are described in a later section. A more detailed versionof this paper as well as results from mesh convergence and verification studies are presented inanother publicationT.
APPROACH
In order to demonstrate the analysis techniques in a manner that is meaningful to industry, astructure was chosen that is typical of a modem aircraft structural component. A panel from thelower wing skin of the V-22 tiltrotor aircraft (see Fig. 1) satisfies this requirement. The panel ismade from graphite-epoxy composite material and contains design features such as ply drop-offs,ply interleaves, axial stiffeners, transverse ribs, clips, brackets, and a large central elliptical access
, hole.Design blueprints and working drawings of the panel, as well as experimental data, were
A.U Pfied by Bell Helicopter Textron, Inc. From the blueprints, a very detailed finite element modelof the panel was generated. The entire panel, including the clips, brackets, stiffeners, ribs, andload-introduction fixtures, was modeled with shell finite elements. Offsets were used to model theeccentrIAities caused by the ply drop-offs and interleaves. Boundary conditions were used toi• m~late the test fixtures and the applied loading. The finite element model is discussed briefly in a
tm tr etion and in detail in another publicationf.
tA NASA Technical Paper entitled "Detailed Analysis Of A Stiffened Composite Wing Panel:Finite Element Modeling, Analysis Techniques, and Test Correlation" by W. J. Stroud, D. D.Davis, Jr.,T. Krishnamurthy, and S. L. McCleary which comprehensively describes the analysisproject is currently under preparation.
2
Many simplified models of the panel, as well as different discretizations of the full model,were analyzed in this study. The results of these preliminary models, although not discussed inthis paper, provided great confidence in the element formulation and the nonlinear solutionalgorithm. Based on results of the preliminary models, the benchmark finite element model wasgenerated. Using this finite element model, linear and nonlinear stress analyses were performed.The analytical results are compared to the strain gage data. The linear and nonlinear results are alsocompared with each other to illustrate the costs and benefits of the nonlinear analysis.
PANEL DESCRIPTION
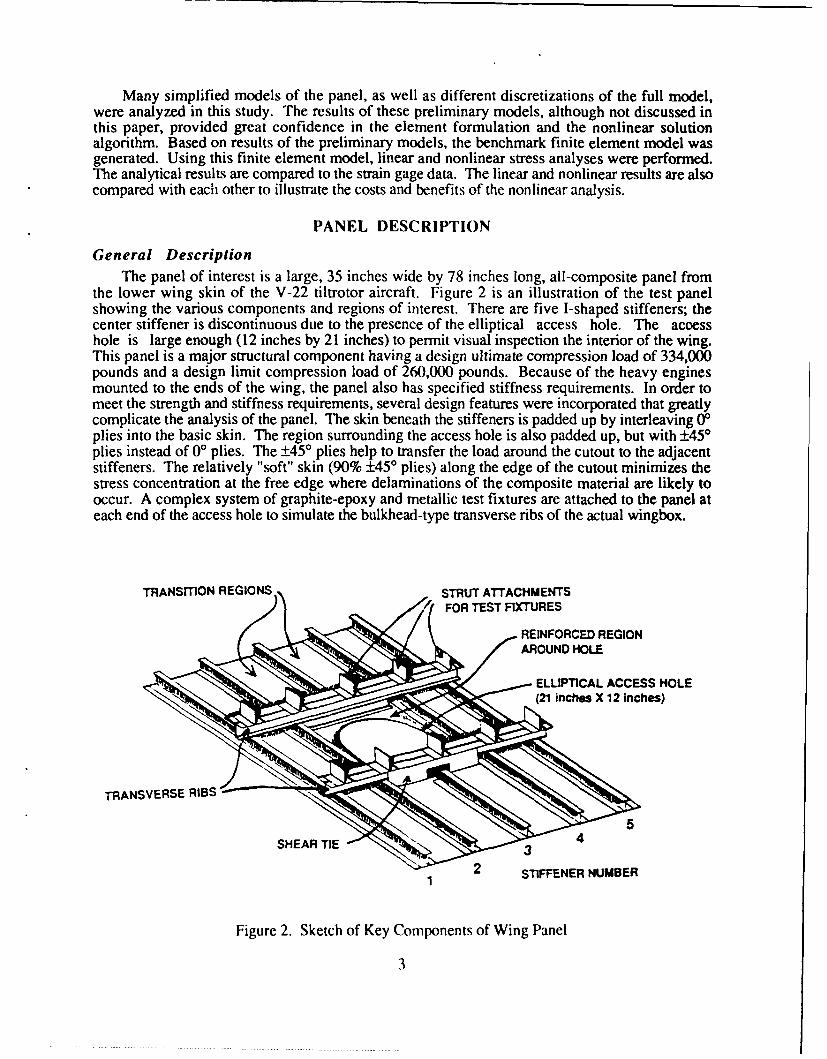
General DescriptionThe panel of interest is a large, 35 inches wide by 78 inches long, all-composite panel from
the lower wing skin of the V-22 tiltrotor aircraft. Figure 2 is an illustration of the test panelshowing the various components and regions of interest. There are five I-shaped stiffeners; thecenter stiffener is discontinuous due to the presence of the elliptical access hole. The accesshole is large enough (12 inches by 21 inches) to permit visual inspection the interior of the wing.This panel is a major structural component having a design ultimate compression load of 334,000pounds and a design limit compression load of 260,000 pounds. Because of the heavy enginesmounted to the ends of the wing, the panel also has specified stiffness requirements. In order tomeet the strength and stiffness requirements, several design features were incorporated that greatlycomplicate the analysis of the panel. The skin beneath the stiffeners is padded up by interleaving 00plies into the basic skin. The region surrounding the access hole is also padded up, but with ±450
plies instead of 0' plies. The ±45' plies help to transfer the load around the cutout to the adjacentstiffeners. The relatively "soft" skin (90% ±45' plies) along the edge of the cutout minimizes thestress concentration at the free edge where delaminations of the composite material are likely tooccur. A complex system of graphite-epoxy and metallic test fixtures are attached to the panel ateach end of the access hole to simulate the bulkhead-type transverse ribs of the actual wingbox.
TRANSITION REGIONS STRUT ATTACHMENTSFOR TEST FIXTURES
REINFORCED REGION= AROUND HOLE
ELLIPTICAL ACCESS HOLE(21 inches X 12 inches)
TRANSVERSE RIBS
2 STIFFENER NUMBER
Figure 2. Sketch of Key Components of Wing Panel
3
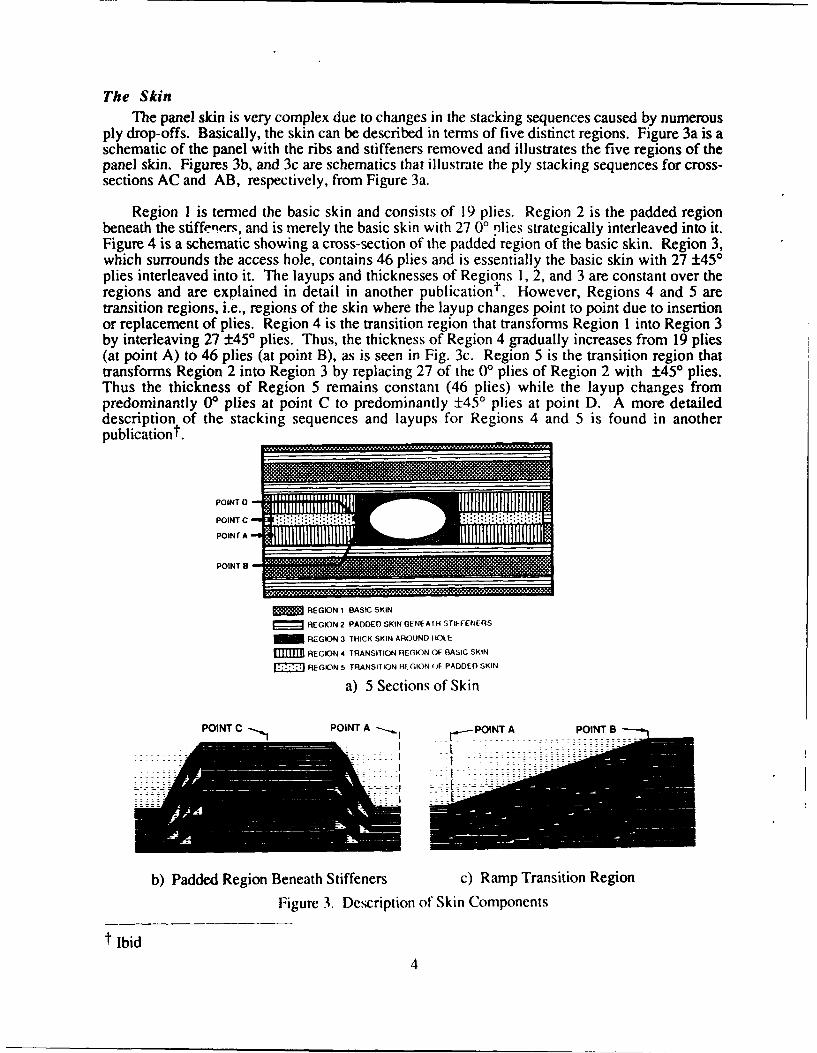
The SkinThe panel skin is very complex due to changes in the stacking sequences caused by numerous
ply drop-offs. Basically, the skin can be described in terms of five distinct regions. Figure 3a is aschematic of the panel with the ribs and stiffeners removed and illustrates the five regions of thepanel skin. Figures 3b, and 3c are schematics that illustrate the ply stacking sequences for cross-sections AC and AB, respectively, from Figure 3a.
Region I is termed the basic skin and consists of 19 plies. Region 2 is the padded regionbeneath the stiffener-, and is merely the basic skin with 27 00 plies strategically interleaved into it.Figure 4 is a schematic showing a cross-section of the paddej region of the basic skin. Region 3,which surrounds the access hole, contains 46 plies and is essentially the basic skin with 27 ±450
plies interleaved into it. The layups and thicknesses of Regions 1, 2, and 3 are constant over theregions and are explained in detail in another publicationt. However, Regions 4 and 5 aretransition regions, i.e., regions of the skin where the layup changes point to point due to insertionor replacement of plies. Region 4 is the transition region that transforms Region I into Region 3by interleaving 27 ±45' plies. Thus, the thickness of Region 4 gradually increases from 19 plies(at point A) to 46 plies (at point B), as is seen in Fig. 3c. Region 5 is the transition region thattransforms Region 2 into Region 3 by replacing 27 of the 0' plies of Region 2 with ±45' plies.Thus the thickness of Region 5 remains constant (46 plies) while the layup changes frompredominantly 0° plies at point C to predominantly ±45' plies at point D. A more detaileddescription of the stacking sequences and layups for Regions 4 and 5 is found in anotherpublicationt.
POINT 0 -
POINT CPOINT C .
POINT A
REGION I BASIC SKIN
______ REGION 2 PADDED SKIN IENEATH STIFENERS
REGION 3 THICK SKIN AROUND HOLE
Iflr TrD REGION 4 TRANSITION REGION OF BASIC SKIN
~.REGION 5 TRANSITION RE GION OF PADDED SKIN
a) 5 Sections of Skin
POINT C POINT A _.-POINT A POINT 8
.._ I- ------] - --- -7 : - --- ----------------- :- --- :7:i
b) Padded Region Beneath Stiffeners c) Ramp Transition Region
Figure 3. Dem-ription of Skin Components
t lbid
4

The Stiffeners and Ribs
The panel contains five identical stiffeners, four of which (Stiffeners 1, 2, 4, and 5 of Fig. 2)extend the full length of the panel. The center stiffener (Stiffener 3 of Fig. 2), interrupted by theelliptical access hole in the center of the panel, is divided into two 20-inch sections. The construc-tion of the stiffeners consists of five graphite/epoxy components: two identical back-to-back C-channels (15 plies thick), a cap (14 plies thick), and two filler strips. The filler strips are merely 00plies rolled up to form a plug for the void areas caused by the radius of the corners at the top andbottom of the junction of the back-to-back C-channels.
The caps of the stiffeners are relatively stiff, with approximately 60% 00 plies. Thedimensions, stacking sequences, and reference directions for all the components of the stiffenersare given in another publicationt. The entire stiffener is cocured and then cobonded to the skinwith a precured strip of cross-ply cloth between the skin and stiffener. Stiffeners 1, 2, 4, and 5 arecobonded to the top of the padded regions of the basic skin, while Stiffener 3 is cobonded to thetop of the transition region (Region 5 of Fig. 3a) along the centerline of the panel.
The bulkhead-type transverse ribs of the actual wing panel are simulated in the test panel by acombination of L-shaped graphite-epoxy channels and metallic test fixtures which are attached tothe panel at each end of the access hole. This system is bolted to the caps of Stiffeners 1, 2, 4, and5, attached to the reinforced skin between Stiffeners 2 and 4 by a graphite-epoxy shear tie, andattached to the end of Stiffener 3 by two L-shaped graphite-epoxy clips. The purpose of thesimulated ribs is to provide out-of-plane support for the panel at each end of the discontinuouscenter stiffener, as do the bulkhead-type ribs of the actual wingbox. Detailed diagrams withdimensions and stacking sequences for the rib system are presented in another publication.
TEST DESCRIPTION
Testing of the panel was performed by the Lockheed Georgia Company. The test panel wasequipped with 84 uni-axial strain gages and 8 rosettes, for a total requirement of 108 dataacquisition channels. The gages were placed in strategic locations over the entire panel, includingboth sides of the skin, the caps of the stiffeners, and along the edge of the access hole. Figure 4 isa photograph of the panel in the testing machine. The strain gages and strain gage wires are seenattached to the exterior side (skin) of the panel. The stiffener (interior) side of the panel wasequipped with a comparable number of strain gages.
The instrumented test panel was aligned in the testing machine, and a compression load wasapplied to the test panel by lowering the upper crosshead. The horizontal struts shown in Fig. 4provided out-of-plane support at each end of the access hole. Pins and metallic angle bracketswere used to attach the struts to the rib systems. The panel was loaded to failure (405 kips), withstrain gage data recorded every 52 kips up to limit load (260 kips), and then every 26 kips untilfailure. Strain gage locations and the resulting test data were provided to the authors in the form ofdiagrams, tables, charts, and graphs.
TilE ANALYSIS TOOLS
The Software FrameworkThe analyses were performed using the COmputational MEchanics Testbed (COMET).
COMET is an advanced structural analysis code developed at NASA Langley Research Center toprovide a framework for structural analysis methods research (Refs. 11-12). This research codecontains modules called processors, which are independent FORTRAN executables that performspecific functions. Equation solvers, eigensolvers, mesh generators, element stiffness matrix
t Ibid
5

processors, system matrix assemblers, and post-processing packages are all examples ofprocessors. COMET also contains a high-level command language (CLAMP) that, along with themodularity of the processors, provides the user with complete control over the analysis, thusenabling analysis methods research. CLAMP contains many FORTRAN-like functions such as
Figure 4. Panel in Testing Machine
logicals, looping, variables, and math functions. By using CLAMP to control the input to and theexecution of the processors, very complicated parametric studies can be performed. Newtechniques can be developed and assessed in the CuMWET environment without developing all ofthe supporting software. For example, new equation solvers or finite element formulations can beput into COMET as processors and assessed while using the remainder of the software system andutilities. This allows researchers to concentrate on their areas of expertise without spending largeamounts of time generating redundant supporting software.
The Finite Element FormulationAlthough there are 10 families of finite elements in COMET, the finite element formulation
used in this study is a 9-node assumed natural-coordinate strain (ANS) shell element, denotedwithin COMET as EX97. The EX97 element has five degrees-of-freedom per node; there is no"drilling" degree-of-freedom. The element is "shear-flexible", i.e., the formulation includestransverse shear stiffness terms. The formulation is based on the assumed strain in the natural(element) coordinate system. A detailed description of the element formulation is given in Refs. 1-3. As compared with other, more traditional formulations, the EX97 proved to be superior,requiring fewer elements for convergence and giving more accurate results when the mesh wasdistortedt. The nonlinear strain-displacement relations of the EX97, when used in conjunctionwith the corotational capabilities (Ref. 10) of COMET, have given very good results, even inanalyses that involved extremely nonlinear, large-rotation, structural response.
t Ibid
6

Solution Strategies
Linear Stress Analysis The results for the linear stress analysis were generated by solving thetraditional linear system of equations, F=KU, where F is the load vector of external appliedforces, K is the assembled linear stiffness matrix of the finite element system, and U is the vectorof unknown displacements. Based on the solution for the unknown displacements, the stressresultants and strains are then calculated at the element Gauss integration, points. The stressresultants and strains are extrapolated to the nodes using the element shape function. In the resultssection of this paper, the strain results are reported at the nodes, since the location of the certainnodes were made to coincide with the placement of strain gages on the test panel.
Geometrically Nonlinear Stress Analysis Although COMET contains many variations of nonlinearsolution techniques, the results from only one such technique are presented herein. The nonlinearsolution strategy of interest is a corotational Newton-Raphson algorithm with linearizedCrisfield/Riks arc-length control (Ref. 8). The linearized equations of motion are solved iterativelyuntil, based on the convergence criterion, the converged solution is found. Since the tangentstiffness matrix is updated only at the beginning of each new load step, the technique is referred toas a modified Newton-Raphson method. An approach associated with continuation methods fornonlinear problems is based on controlling an equilibrium-path-arc-length parameter. Arc-lengthcontrol techniques have been developed primarily by Riks (Refs. 14 and 15), Wempner (Ref. 7),and Crisfield (Refs. 4 and 5). The nonlinear solution strategy, the convergence criterion, and thearc-length control strategy are described in detail in Ref. 8.
Bifurcation Buckling The buckling results reported herein were generated by solving thetraditional linear structural stability problem, Koi + X KGi = 0, i=1,2,..., where K is theassembled linear elastic stiffness matrix of the system. The assembled geometric stiffness matrix,KG, dependent only on the state of stress, can be calculated based on the linear or the nonlineardeformed shape of the structure. The i-th eigenvector, Oi, of the equation/solution is the i-th modeshape of the buckled structure. The i-th eigenvalue, X,, is the i-th buckling load factor, i.e., themultiple of the applied load that would cause bifurcation of the solution.
First-Ply Failure Analysis For the frst-ply failure analyses, a maximum strain failure criterion wasused with the material allowables listed in Table 1. In a first-ply failure analysis, a linear ornonlinear stress analysis is first performed. The state of stress is then calculated for each layer ofevery element. The layerwise strain components are then compared to the material allowables. Ifany of the material allowables, by definition the ply has failed. Thus, a first-ply failure analysis isa "snap-shot" analysis, and is based on the state of stress at a given applied load. When a ply"fails", the loads in the ply are not redistributed to adjacent plies and the stiffness of theply/laminate is not reduced as is done in progressive failure techniques. Because of this, in theliteral sense, first-ply f:filure analysis is only valid tip to the point when the first ply fails (hen,,,c theterm "first-ply failure"). lowever, with an understanding of these limitations, a rough (thoughnonconservative) estimate of the damage to the composite material at a given value of structuralload can be made.
MATERIAL STIFFNESS (MSI) V12 FAILURE STRENGTHS ( gi in/in)Eli E22 G12_ XT Xc YT Y S
T300/5208 21 0 1 35 095 .34 8290 8290 3880 23880 9480
CROSS-PLY 327 3 27 540 .34 3880 23880 3880 23880 9480CLOTH
ALUMINUM 100 100 50 * *
• Failure was not considered for the aluminum fixtures.
Table 1. Material Properties Table
7
FINITE ELEMENT MODEL
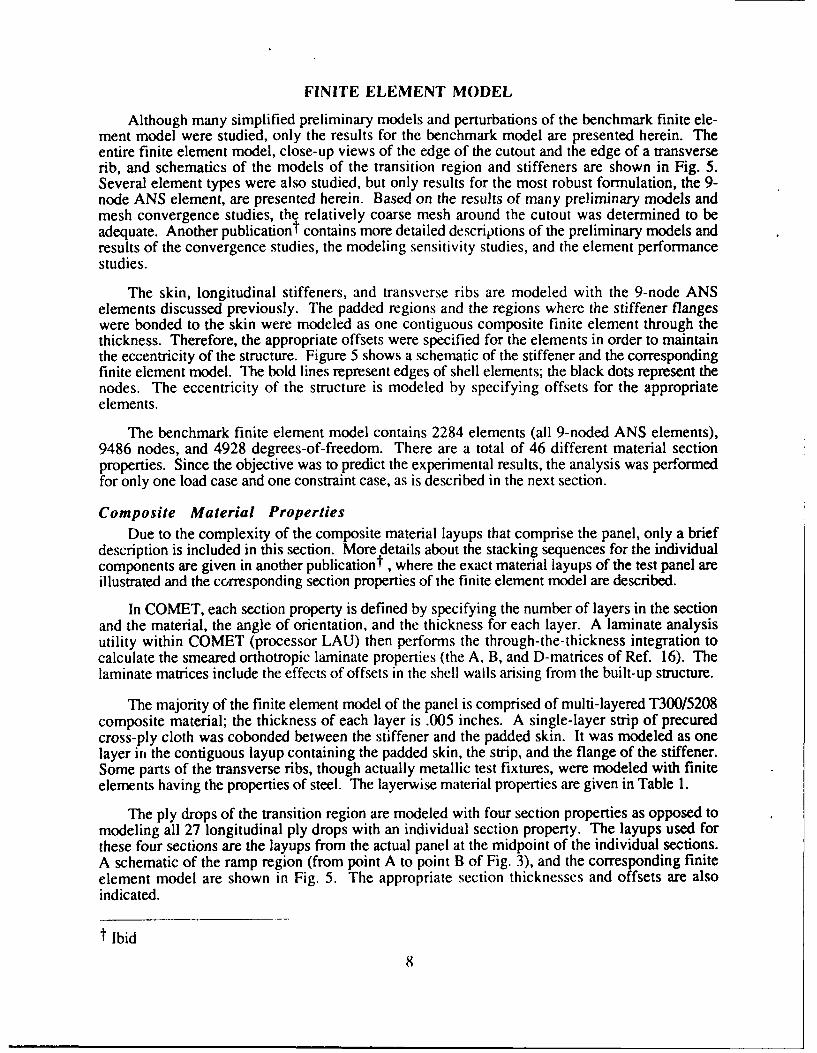
Although many simplified preliminary models and perturbations of the benchmark finite ele-ment model were studied, only the results for the benchmark model are presented herein. Theentire finite element model, close-up views of the edge of the cutout and the edge of a transverserib, and schematics of the models of the transition region and stiffeners are shown in Fig. 5.Several element types were also studied, but only results for the most robust formulation, the 9-node ANS element, are presented herein. Based on the results of many preliminary models andmesh convergence studies, the relatively coarse mesh around the cutout was determined to beadequate. Another publicationt contains more detailed descriptions of the preliminary models andresults of the convergence studies, the modeling sensitivity studies, and the element performancestudies.
The skin, longitudinal stiffeners, and transverse ribs are modeled with the 9-node ANSelements discussed previously. The padded regions and the regions where the stiffener flangeswere bonded to the skin were modeled as one contiguous composite finite element through thethickness. Therefore, the appropriate offsets were specified for the elements in order to maintainthe eccentricity of the structure. Figure 5 shows a schematic of the stiffener and the correspondingfinite element model. The bold lines represent edges of shell elements; the black dots represent thenodes. The eccentricity of the structure is modeled by specifying offsets for the appropriateelements.
The benchmark finite element model contains 2284 elements (all 9-noded ANS elements),9486 nodes, and 4928 degrees-of-freedom. There are a total of 46 different material sectionproperties. Since the objective was to predict the experimental results, the analysis was performedfor only one load case and one constraint case, as is described in the next section.
Composite Material PropertiesDue to the complexity of the composite material layups that comprise the panel, only a brief
description is included in this section. More details about the stacking sequences for the individualcomponents are given in another publication t , where the exact material layups of the test panel areillustrated and the corresponding section properties of the finite element model are described.
In COMET, each section property is defined by specifying the number of layers in the sectionand the material, the angle of orientation, and the thickness for each layer. A laminate analysisutility within COMET (processor LAU) then performs the through-the-thickness integration tocalculate the smeared orthotropic laminate properties (the A, B, and D-matrices of Ref. 16). Thelaminate matrices include the effects of offsets in the shell walls arising from the built-up structure.
The majority of the finite element model of the panel is comprised of multi-layered T300/5208composite material; the thickness of each layer is .005 inches. A single-layer strip of precuredcross-ply cloth was cobonded between the stiffener and the padded skin. It was modeled as onelayer in the contiguous layup containing the padded skin, the strip, and the flange of the stiffener.Some parts of the transverse ribs, though actually metallic test fixtures, were modeled with finiteelements having the properties of steel. The layerwise material properties are given in Table 1.
The ply drops of the transition region are modeled with four section properties as opposed tomodeling all 27 longitudinal ply drops with an individual section property. The layups used forthese four sections are the layups from the actual panel at the midpoint of the individual sections.A schematic of the ramp region (from point A to point B of Fig. 3), and the corresponding finiteelement model are shown in Fig. 5. The appropriate section thicknesses and offsets are alsoindicated.
t Ibid
8

CROSS SECTION OF STIFFENE
CORRESPONING FINITE ELEMENT MOEL
THIS END TOTALLY
Z-DISPLACEMENT CON- CONSTRAINEDSTRAINED AT POINTS INCENTER OF ALL 10 BRACKETS
UNIFORMOUN HOLEORENN
APPLIED AT THIS END CORRESPONDING FINITE ELEMENT MODEL
Figure 5. The Benchmark Finite Element Model
Loads and Boundary ConditionsTo simulate the support struts of the test fixtures, the out-of-plane displacements are
constrained to be zero at the midpoint of the top of the fixture brackets (see Fig. 5). At thesepoints, rotations about the global X-axis are constrained and rotations about the global Y-axis arefree, to simulate the pins that attach the struts to the rib fixtures. Since the test article is potted atboth ends, providing a virtual clamp, all degrees-of-freedom are constrained to be zero at the end(X '-0) of- the panel. To simulate the compressive motion of the testing machine crosshead,uniform end-shortening displacement is specified at X = L, while all other displacements at X = Lare constrained to be zero, as is shown in Fig. 5. The "drilling" degree-of-freedom (the rotationaldegree-of-freedom whose vector is normal to the plane of the element) is constrained for everyappropriate node, since the finite element formulation does not have these "drilling" degrees offreedom.
ANALYSIS RESULTS & TEST CORRELATION
Global ResponseDisplacements The load-shortening curves for the linear and nonlinear analyses, as well as thefailure load of the test panel, are shown in Figure 6. The global end-shortening response, even inthe nonlinear analysis, is very linear through failure. Hence, the panel maintains its stiffness evenwhen heavily-loaded. The nonlinear effects caused by the eccentricity of the discontinuous centerstiffener have negligible effect on the global stiffness of the panel, at least up to the failure load.
9

The deformed geometry plots from the linear and nonlinear analyses are shown in Figs. 7aand 7b, respectively. The deformations are scaled by the same relative amount to allow qualitativecomparisons to be made. Although the linear and nonlinear analyses indicate approximately thesame deformations in the ribs, the out-of-plane deformation at the edge of the cutout is significantlygreater in the nonlinear analysis.
As the compressive forces develop in the panel, the skin attempts to expand in the transversedirection due to the Poisson effect. However, the caps of the stiffeners areattached to the relativelystiff transverse ribs, which prevent this Poisson expansion. The result is a complex state of stressin the region between the two transverse ribs. Due to the eccentricity caused by the discontinuouscenter stiffener, the region around the cutout between the two transverse ribs bends upward,causing an out-of-plane deflection in the positive Z-direction. Because of the complex constructionof the test panel, the deformation pattern between ribs is m=1 (one half-wave in the X-direction)and n=2 (two half-waves in the Y-direction) across the panel. Thus, the two stiffeners along theedge of the panel (Stiffeners 1 and 5) are bending in the opposite direction from the two stiffenersadjacent the access hole (Stiffeners 2 and 4).
-500
FAILURE LOAD OF TEST PANEL-400 . . . . . . . . . . . . . . . . . .
APPLIEDLOAD(kips) -300
-200 NONLINEAR ANALYSIS
-- LINEAR ANALYSIS
-100
0.00.0 0.1 0.2 0.3 0.4
APPLIED COMPRESSIVE DISPLACEMENT (inches)
Figure 6. Load Versus End-Shortening
a) Linear Analysis b) Nonlinear Analysis
Figure 7. Deformed Geometry Plots
10

Local ResponseStrains At Panel Midlength Figure 8 is a plot of the axial strain (Ex) across the panel midlengthfor an applied load of 156 kips. The strain gage data are shown as well as strains on the bottomsurface of the skin and the top surface of the caps of the stiffeners from the linear and nonlinearanalyses. There were 6 strain gages placed along the midlength of the bottom (skin side) of thepanel, one at the centerline below each of the Stiffeners 1, 2, 4, and 5, and one at each edge of thecutout, as is indicated in Fig. 8. Four strain gages were placed along the midlength on the stiffenerside of the panel, one each at the midlength centerline of the top surface of the caps of Stiffeners 1,2, 4, and 5. At this value of applied load, bc' the linear and nonlinear analyses correlated wellwith test data. Notice the high gradients of strain near the edge of the cutout and across the widthof the stiffeners. The high gradients in the stiffeners is an indication of bending in the plane of thepanel, as can be seen pictorally in Fig. 7.
-2500
-2000
AXIAL,STRAIN(gt in/in)
-1000 o BOTTOM OF SKIN, LINEARCAP OF STIFFENER, LINEAR
* BOTTOM OF SKIN, STRAIN GAGE* CAP OF STIFFENER, STRAIN GAGEA BOTTOM OF SKIN, NONLINEARA CAP OF STIFFENER, NONLINEAR
0
-20.0 -10.0 0.0 10.0 20.0CHORDWISE POSITION, Y (inches)
Figure 8. Axial Strain Across Panel Midlength, P=156 kips
Figures 9a and 9b are plots of the axial strain (Ex) across the panel midlength for an appliedload of 396 kips, which is very near the observed failure load of the test panel. Figures 9a and 9bshow values for the bottom surface of the skin and the top surface of the caps of the stiffeners fromthe linear and nonlinear analyses, respectively. At this value of applied load, the linear analysis(Fig. 9a) did not show good correlation with the strain gage data. The linear analysis predicted thatthe strain on the cap of Stiffeners 2 and 4 would be slightly higher than the strain in Stiffeners 1and 5. However, the strain gage data indicate that the strain in Stiffeners 2 and 4 is about half ofthe strain in Stiffeners I and 5 at an applied load of 396 kips. The nonlinear results of Fig. 9bmuch more accurately predict the strain at this load.
II

-8000S 9
-6000 I I
AXIALSTRAIN
(in/in) -4000 SKN TANGGCAP, STRAIN GAGE
0 SKIN, LIN ANALYSIS .
13 CAP, LIN ANALYSIS
-2000 "=.
0-20.0 -10.0 0.0 10.0 20.0
CHORDWISE POSITION, Y (inches)
a) Linear
-8000
-6000
AXIALSTRAIN SA G '(g in/in) -4000 e SKIN, STRAIN GAGE
* CAP, STRAIN GAGE ,A SKIN, NL ANALYSIS
-2000A CAP, NL ANALYSIS-2000
0-20.0 -10.0 0.0 10.0 20.0
CHORDWISE POSITION, Y (inches)
b) Nonlinear
Figure 9. Axial Strain Across Panel Midlength For Top and Bottom Surfaces of Skin
12
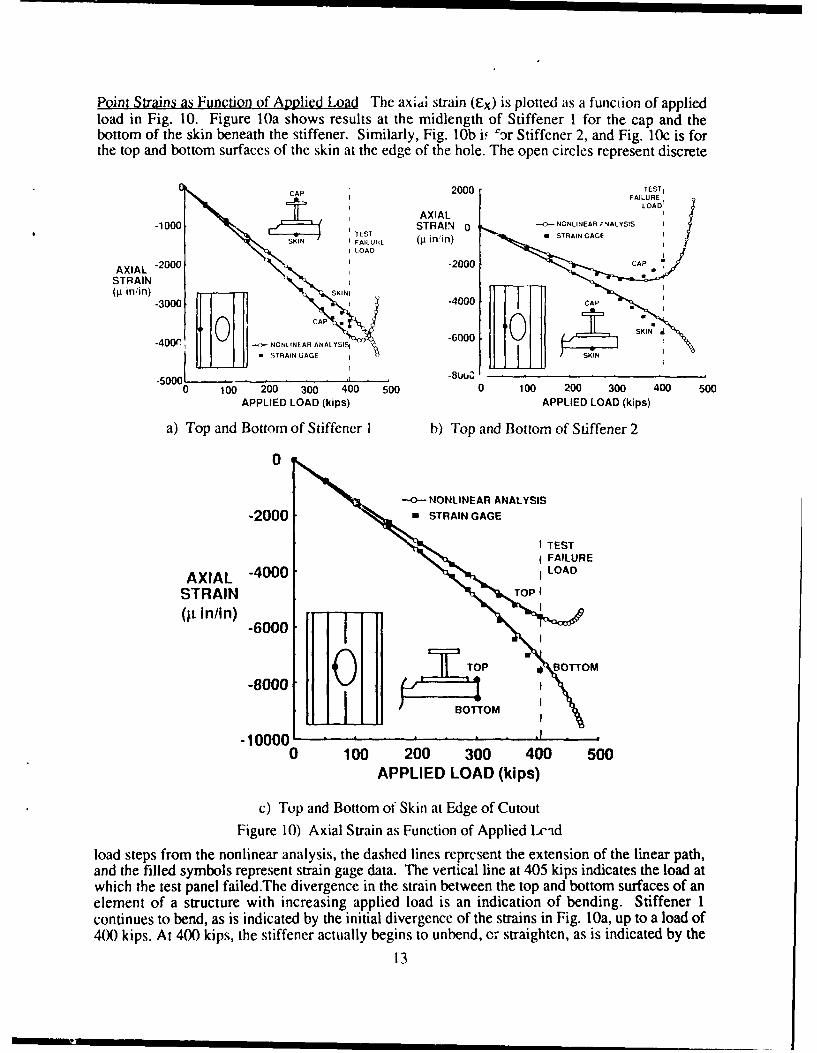
Point Strains as Function of Applied Load The axiai strain (Ex) is plotted as a funci Ion of appliedload in Fig. 10. Figure 10a shows results at the midlength of Stiffener I for the cap and thebottom of the skin beneath the stiffener. Similarly, Fig. 10b i, 'r Stiffener 2, and Fig. 10c is forthe top and bottom surfaces of the skin at the edge of the hole. The open circles represent discrete
CAP 2000 TESTIrI FAILURE
AXIAL STIG'
SK000 STRAIN 0 0 NONLINEAR ANALYSIS
SLOAD
AXIAL -2000 -2000 CAP
STRAIN
N ' '
(i'in/in) SKINM
-3000 CP-4000
CAPI
-400, 0 - NONLINEAR ANALYSIS, 6000 0tSTRAIN GAGE
S8UN
. . . . . ..0 -8uu , ,'
0 100 200 300 400 500 0 100 200 300 400 500APPLIED LOAD (kips) APPLIED LOAD (kips)
a) Top and Bottom of Stiffener 1 b) Top and Bottom of Stiffener 2
0
-0--- NONLINEAR ANALYSIS-2000 a STRAIN GAGE
I TEST
AXIAL -4000 Oa n
STRAIN TOP
(It in/in) 6-6000 ,
ITOP BOTTOM
-8000~BOTTOM
-10000 .1
0 100 200 300 400 500
APPLIED LOAD (kips)
c) Top and Bottom of Skin at Edge of Cutout
Figure 10) Axial Strain as Function of Applied Lcad
load steps from the nonlinear analysis, the dashed lines reprcsent the extension of the linear path,and the filled symbols represent strain gage data. The vertical line at 405 kips indicates the load atwhich the test panel failed.The divergence in the strain between the top and bottom surfaces of anelement of a structure with increasing applied load is an indication of bending. Stiffener Icontinues to bend, as is indicated by the initial divergence of the strains in Fig. 10a, up to a load of4(W kips. At 400 kips, the stiffener actually begins to unbend, or straighten, as is indicated by the
13

converging strains of Fig. 10a. If the panel had not failed at 405 kips, the nonlinear analysispredicts that, at a load of 453 kips, the stiffener actually would have began bending in the oppositedirection. At the same load where Stiffener I begins to straighten (400 kips), the bending ofStiffener 2 becomes severe, as can be seen pictorally in Fig. 7b and numerically in Fig. 10b.Stiffener 2 is adjacent to the cutout and is the primary mechanism by which load is redistributedaround the cutout. Initially Stiffeners 2 and 4 are bending in opposite directions than Stiffeners 1and 5, however when the bending of Stiffeners 2 and 4 becomes severe, it actually begins tostraighten Stiffeners I and 5. The nonlinear analysis predicts that, had the panel not failed at 405kips, by the time the applied load is 453 kips, all four load-carrying stiffeners would be bending inthe same direction. Although the thick skin beneath the stiffeners carry most of the load, the axialstrains at the edge of the cutout are the highest in the panel, as is seen in Fig. loc. These highstrains at the edge of the cutout play an important role in the ultimate failure of the panel.
In general, there is excellent agreement between the strain gage data and the stress analysisresults. The linear analysis accurately predicted the strains through the DUL of the panel. Thenonlinear analysis results slightly under-predict the amount of bending in Stiffeners 1 and 2 at highloads, but the important response characteristics discussed above are correctly identified. Thestrain at the edge of the cutout, the most critical region in the panel, was accurately predicted all theway through failure of the panel. Although the linear analysis correlated well at the lower loads,the nonlinear analysis was necessary to predict the complicated response of the heavily-loadedpanel as it approached the failure load.
EXPLANATION OF FAILURE
Buckling Analysis
As was described previously, linear and nonlinear buckling analyses were performed. Thepredicted linear buckling load is 495 kips, approximately 17% higher than the observed failure loadof the test panel. Contrary to what was expected, the nonlinear buckling load (the buckling loadcalculated by considering the nonlinear deformed geometry in the geometric stiffness matrix KG)was not significantly less than the linear buckling load. The critical buckling mode is shown inFig. 11. Notice that the buckling mode is a simple mode, with all stiffeners bending in the positiveZ-direction.
Figure 1I. Critical Buckling Mode
14

First-Ply Failure AnalysisLinear and nonlinear first-ply failure analyses were performed as was described previously.
In Fig. 12a and 12b, respectively, the elements are shaded according to the percentage of failedplies for the linear and nonlinear analyses for an applied load of 415 kips (the test panel failed at405 kips). Notice that at this load, both the linear and nonlinear results indicate a significantnumber of elements with plies that have strain levels exceeding their allowables. The nonlinearanalysis predicts more elements with damage, but the linear analysis predicts a much higherpercentage of failed plies per element. These differences are attributable to the fact that thenonlinear analysis predicts more bending in the region around the cutout. As the material iscompressed and bends, the axial strain on one surface is intensified by the bending and the strainon the other surface is relieved. Therefore, the nonlinear analysis predicts damage at a lower load,or in this case more widespread damage for a given load, and the linear analysis over-predicts thedamage as the entire thickness of the element is compressed beyond the compression allowables.
10 10l
_ _ _ __. rI+ -
20 20
30 30
40 40
a) Linear Analysis b) Nonlinear AnalysisFigure 12. Percentage of Failed Plies at 415 kips Applied Load
Discussion of Failure Analysis ResultsThe first-ply failure results indicate that failure strain allowables were exceeded in a number of
plies in the region around the cutout at the observed failure load of the test panel. Because of thisand since the linear and nonlinear buckling loads were about 17% above the failure load, it is feltthat the panel failed due to excessive strains in the region around the ctuout. The nonlinear analysispredicted the most significant damage to be at the edge of the cutout, a slight angle off of thevertical. The photograph of Fig. 13 shows that the failure zone passed through the edge of thecutout a slight angle off of the vertical. Due to the catastrophic nature of the failure, it is not knownthat the damage initiated at the edge of the cutout. These conclusions are preliminary at this pointbecause sensitivity studies have not yet been performed to determine the sensitivity of the results tothe material failure strain allowables that were used. It is also unknown at this time how sensitivethe buckling and nonlinear results are to the imperfections of the stiffeners, because the modelassumes that the stiffeners are perfectly straight along the length.
SUMMARY AND CONCLUSIONS
New finite element analysis techniques were evaluated by applying them to a complicatedcomposite wing panel from the V-22 tiltrotor aircraft. A detailed finite element model with arelatively coarse mesh of 9-node elements was generated, and linear and nonlinear stress analyses
15

were performed. At low values of applied load (up to the design ultimate load of the panel), thelinear stress analysis accurately predicted the strains and structural response characteristics of thepanel. However, a nonlinear analysis was required to accurately predict the very complicatednonlinear structural response as the applied load approached the failure load of the panel.Calculated surface strains were very accurate as compared with strain gage data, even in criticalregions of the panel such as the edge of the cutout and the caps of the stiffeners. Since the first-plyfailure analysis indicated damage at the edge of the cutout at the observed failure load of the panelwhile the calculated buckling load was 17% higher than the failure load, it appears that materialdamage caused by excessive strain initiated the failure of the panel.
Figure 13. Photograph of Failed Test Panel in Region Around Cutout
ACKNOWLEDGEMENTS
This paper represents part of the author's contribution to a more comprehensive team projectinvolving the author, W. Jefferson Stroud, T. Krishnamurthy, and Susan L. McClearyt . Theauthors would also like to thank Bell Helicopter Textron, Inc. for supplying photographs,blueprints and experimental data. Their cooperation is greatly appreciated.
REFERENCES
I. Park, K. C., and Stanley, G. M., A Curved C0 Shell Element Based on Assumed Natural-Coordinate Strains, ASME Journal of Applied Mechanics, Vol. 108, pp. 278-290,1986.
2. Stanley, G. M., Continuum-Based Shell Elements, PhD Dissertation, Stanford University,Stanford, CA, 1985.
3. Stanley, G. M., Park, K. C., and Hughes, T. J. R., Continuum-Based Resultant ShellElements, Finite Element Methods for Plate and Shell Structures, Volume 1:
t lbid
16

Element Technology, T. J. R. Hughes and E. Hilton (Editors), Pineridge PressInternational, Swansea, U. K., pp. 1-45, 1986.
4. Crisfield, M. A., An Arc-Length Method Including Line Searches and Acceleration,International Journal for Numerical Methods in Engineering, Vol. 19, pp. 1269-1289, 1982.
5. Crisfield, M. A., A Fast Incremental/Iterative Solution Procedure that I landles Snap-Through,Computers and Structures, Vol. 13, pp. 55-62, 1983.
6. Rankin, C. C., and Brogan, F. A., An Element-Independent Corotational Procedure for theTreatment of Large Rotations, Journal of Pressure Vessel Technology, Vol. 108, pp.165-174, 1986.
7. Wempncr, G. A., Discrete Approximations Related to Nonlinear Theories of Solids,International Journal of Solids and Structures, Vol. 7, pp. 1581-1599, 1971.
8. Stanley, G. M., and Felippa, C. A., Computational Procedures for Postbuckling ofComposite Shells, Proc. of US-Europe Symposium on Finite Element Methodsfor Nonlinear Problems, P. G. Bergan, K. J. Bathe, and W. Wunderlich (Editors),Univ. of Trondheim, Norway, pp. 359-385, 1986.
9. Knight, N. F., Jr., Gillian, R. E., McCleary, S. L., Lotts, C. G., Poole, E. L., Overman, A.L., and Macy, S. C., CSM Testbed Development and Large-Scale Structural Applications,NASA TM-4072, 1989.
10. Knight, N. F., Jr., and Stroud, W. J, Computational Structural Mechanics: A New Activityat the NASA Langley Research Center, NASA TM-87612, 1985.
11. Lotts, C. G., Greene, W. H., McCleary, S. L., Knight, N. F., Jr., Paulson, S. S., andGillian, R. E., Introduction the the Computational Structural Mechanics Testbed, NASATM-89096, 1987.
12. Stewart, C. B. (Compiler), The Computational Structural Mechanics Testbed User's Manual,NASA TM-100644, 1989.
13. MacNeal, R. H., and Harder, R. L., A Proposed Set of Problems to Test Finite ElementAccuracy, Finite Elements in Analysis and Design, Vol. 1, pp. 3-20, 1985.
14. Riks, E., On the Numerical Solution of Snapping Problems in the Theory of Elastic Stability,SUDDAR Report No. 410, Stanford University, Stanford, CA, 1970.
15. Riks, E., Progress in Collapse Analysis, ASME Journal of Pressure VesselTechnology, Vol. 109, pp. 33-41, 1987.
16. Jones, R. M., Mechanics of Composite Materials, Scripta Book Company,Washington, DC, 1975.
17

IW S Report Documentation Page
AS R p 1 N 41 2 Government Accession No 3. Recipient's Catalog No.
NASA TM-104154
AVSCOM TR-91 -B-0154. Title and Subtitle 5 Report Date
Detailed Analysis and Test Correlation of a Stiffened September 1991Composite Wing Panel 6 Performing Organization Code
7 Authorls) 8, Performing Organization Report No.
D. Dale Davis, Jr. 10 Work Unit No
9 Performing Organization Name and Address 505-63-53Acrostructurcs Dircctoratc 11. Contract or Grant No
U.S. Army-Aviation Systems CommandNASA Langley Research CenterHampton, VA 23665-5225 13 Type 4., Report and Period Covered
12 Sponsoring Agency Name and Address Technical MemorandumNational Aeronautics and Space AdministrationWashington, DC 20546-0001 and 14. Sponsoring Agency Code
U.S. Army Aviation Systems CommandSt. Louis, MO 63120-1798
15. Supplementary Notes
This paper is to be presented at the 17th European Rotorcraft Forum in Berlin, Germany,
September 24-26, 1991.
16. Abstract
State-of-the-art nonlinear finite element analysis techniques are evaluated by applying them to a realistic aircraftstructural component. A wing panel from the V-22 tiltrotor aircraft (shown in Fig. 1) is chosen because it is atypical modem aircraft structural component for which there is experimental data for comparison of resurts. Fromblueprints and drawings supplied by the Bell Helicopter Textron Corporation, a very detailed finite elementmodel containing 2284 9-node Assumed Natural-Coordinate Strain (ANS) elements was generated. A novelsolution strategy which accounts for geometric nonlinearity through the use of corotating element referenceframes and nonlinear strain-displacements relations is used to analyze this detailed model. Results from linearanalyses using the same finite element model are presented in order to illustrate the advantages and costs ofthe nonlinear analysis as compared with the more traditional linear analysis. Strain predictions from both thelinear and nonlinear stress analyses are shown to compare well with experimental data up through the DesignUltimate Load (DUL) of the panel. However, due to the extreme nonlinear response of the panel, the linearanalysis was not accurate at loads above the DUL. The nonlinear analysis more accurately predicted the strain athigh values of applied load, and even predicted complicated nonlinear response characteristics, such as loadreversals, at the observed failure load of the test panel. In order to understand the failure mechanism of thepanel, buckling and first-ply failure analyses were performed. The buckling load was 17% above the observedfailure load while first-ply failure analyses indicated significant material damage at and below the observed failureload.
17 Key Words (Suggested by Authorls)) 18 Distribution Statement
Composite Structures Unclassified-UnlimitedNonlinear Analysis Subject Category 39Finite Element Analysis
19. Security Classif (of this reportl J20 Security Chassif. lOt this page) 21 No. of pages 22. Price
Unclassified Unclassified 18 A03
NASA FORM IdS OCT 86