nasa grant nnl06aa21g final report ~j ''''~ i environmental tectonics...
TRANSCRIPT

The National AeroSpace Training and Research Center
A Subsidiary of Environmental Tectonics Corporation (ETC)
September 23, 2009
NASA GRANT NNL06AA21G FINAL REPORT
Scott T Glaser: Director of ight Dynamics Principal Investigator
Richard Leland: President NAST AR Center
National AeroSpace Training And Research (NASTAR) Center
125 James Way, Southampton, PA 18966
www.NASTARcenter.com
Copyright''cJ Environmental Tectonics Corporation 2009. All rights reserved.
https://ntrs.nasa.gov/search.jsp?R=20110008036 2018-07-07T12:24:59+00:00Z

.'. 2 ~J ''''~ I
Environmental Tectonics Corporation
TABLE OF CONTENTS
NASA GRANT NNL06AA21G FINAL REPORT .............................................................................................. 1
1 INTRODUCTION ............................................................................................................................... 6
2 BACKGROUND ................................................................................................................................. 7
3 UPSETS DEFINED .............................................................................................................................. 7
3.1 UpSnCATEGORIZATION .. ....... 7
3 .. 1 .. 1 Unusual Attitude .. . ...... 8 3 .. 1.2 Control State .. . ...... 8 3 .. 1.3 External Drivers .. ....... 8 3.1.4 Categories .. . ...... 9
4 REASONS FOR IMPROPER PILOT RESPONSE IN UPSET CONDITIONS ................................................ 9
4.1.1 4.1.2
Paihological/Phormacol0'licol/Physical .. .................... .
Psychosocial ..
4 . .1.3 Physiological ..
4.1.4 Psychological ..
. ...... 9
.... 10
. .... 11
. .... :l3
5 UPSET ACCIDENT REViEW .............................................................................................................. 13
5.1 UNITED AIHLlNES FLIGHT 232: JULY 19, 1989/\lHcr~MT DAMI\GE/M/\LFUNCTION .. . .... 14 5.2 AIRCRAFT N40AN: jl\NUAHY IO, 2007 [)ILQT [f{ROI~, NOS[ LOW, ENEIK;Y 1-11(;1'1, BANKED; OVEHSPEUJ;
I)[PAHlUHE. . .... 15
5.3 AMEHICAN AmLiNES FLKiHT S87: NOVEMBEH I2, 2001 WAKE TURBULENCE ENCOUNTE[{, AIf{CllMT
DAMAGE/MAIJUNCTION... . .... 15
5.4 AIiKllAFT N9253N: JULY 16,1999 NOSE LOW, HIGH ENEHGY, NO/l.OW 8I\NKANGLE; NOSE LOW, HIGH [NERC;Y,
INVEHTED. . .... 17
5.5 AIRCRAFT N768H: JUNE 24, 2006 NOSE HIGH, HIGH ENI:llGY, UPllIGHT; NOSE LOW, HIGH ENEllGY, UPHIGHT .. 18
5.6 5.6.1 5.6.2
TRAINING CURllENTLY AVAILA13LE ...
Hexapod ....
In Aircraft Training ..
..... 18
. .... 18 ..... ............... 19
6 EXPERIMENTAL SETUP ................................................................................................................... 20
5.1 TEST MANEUVERS .. . .... 20
6.1.1 Upset Pro!iles .. . .... 20 6.1.2 Test Maneuver Execution ... ......................... .... 20
7 TEST DATA SUMMARy ........................................... : ....................................................................... 20
7.1 7.2
7.3
EXPERIMENTAL HYPOTHESIS ..
SIMULATOR - GYROLAB GL-2000
SUBJECT GROUP ................. .
7.4 FAMILIAHIZATION ................. . ................. .
7.4.1 In SO (pitch, rol/, and continuous yaw) Mode ............ .
7.4.2 In TFS (pitch, rol/, yaw, and planetary) Mode ... .
7.5 ANALYSIS TOOL
..... 21
..... 21
..... 23
... 24
. .... 24
. .... 24
..... 25
8 PHYSIOLOGICAL INVESTIGATION ................................................................................................... 27

8.1
8.2 SUBJECT SCHEDULE .
PHYSIOLOGICAL MEASUHEMENT ApPARATUS ..
/'~·~I. \~.
3
Environmental Tectonics Corporation
.. .......................... 27
..... 28
9 NTSB UPSET PROFILES ................................................................................................................... 28
9.1 RESULTS ..................... .
9.1.1 Pnuemogroph
9.1.2 Electro Occulograph (EOG)
9.1.3 Pulse,Oximiter
9.1.4 Skin Temperature .. 9.1.5 Blood Pressure (BP) ..
9.1.6 Chewing Gum
9.1.7 Importance of Order .. 9.1.8 Military VS. Civilian Training Correlation .....
.... 29 ................. 29
..... 30
.... 32
.... 32
.. .. 32 ..... 33 ..33 . .... 33
10 TRAINING INVESTIGATION ........................................................................................................ 34
10.1 THAINING SYLLABUS. .. ... 34 .10 .. 1.1 Academics .. .. ... 34 10.1.2 Subject Schedule .. .. ... 35
11 RESULTS .................................................................................................................................... 35
11.1 EVAl.UATION PHOFll.E5 AND CHITEf{IA o.
11.1.1 EVALl: ..
. 1.1..1.2 EVAII.
11.1.3 [VAL3:.
11.1.4 EVAL4:.
11.1.5 [VAL5: ..
.1..1.1.6 EVA/ii:.
11..1.7 EVAL7:.
11.2 INSTRUCTOH EVALUATIONS ..
11.3 POST FLIGHT ANALYSIS TECI-lNIQUF .
.36
. .... 36
.. ... 37
.. .. 37
.37
.. ... 38
.. ... 38
.. .. 38
.. ... 39
..... 40
12 CONCLUSION ............................................................................................................................. 41
12.1 LESSONS LEAI{NED ..
12.1.1 Taolbox Method ...
12.1.2 Mallon Discomfort ..
.12.1.3 Seeing the Upset Develop Provides Training Toof ...
12.1.4 No Pilot left Behind ..
12.1.5 12.1.6
Temperature Delta Sensing .. BP tesllng ...
. .... 41
. .... 4.1 .. ................ 41
.. .. 41 .. ... 42
.. ... 42
..... 42
13 FUTURE INVESTIGATION5 .......................................................................................................... 42
13.1 OPTIMAL RECOVEHY PATH (ORP) ................. .
13.2 MAN-MACHINE INTERFACE... . ........... .
13.3 GYROLAB VS. HEXAPOD (GvH) EXPERIMENT.
13.3.1 PhVsiologicallnvestigation ......................................................... .
..... 42
..... 43
.. ... 44 .. .. 44
13.3.2 Training Investigation ....................... . .45 13.4 HIGHER LEVEL PHYSIOLOGICAL DATA ANALYSIS .. .............. .. ............................................. 45
14 FINAL SYNOPSIS ........................................................................................................................ 46

4/1 4
Environmental Tectonics Corporation ------------------------
APPENDIX A - TML. ......................•...................................................•..................................................... 46
APPENDIX B - UPSET PROFILES ....•........................................•..•.......................................•....•................ 51
APPENDIX C - OPTIMAL RECOVERY PATH (ORP) CONCEPT .................................................................•.. 53
1 BACKGROUND ...........................................................................•..••............................................... 53
2 EVALUATING UPSET RECOVERIES ...........•..........................................................................•........... 53
2.1 2.2 2.3 2.4
OVERI\LL GRADE ..
HECOVERY QUALITY: OPTIMAL RECOVERY PATH (ORP) ..
DEFINING THE ORP
EMPIRICAL DETEHMINATION OF ORP ..
2.5 ANALYTICAL DETERMINATION OF ORP o.
2.5.1 Stage f·- Deterministic ............................... .. 2.5.2 Stage If·- Numerical Optimization
2.6 lMI)LEMENTATION ..
..... 53 .......... 53
........... 53 ..................................................... 54 . ................................................... 54 .. ................................................. 54
.................................................... 54
. ................................................... 54
3 CONCLUSION ................................................................................................................................. 55
APPENDIX D -INDUSTRY SURVEY: UPSET WARNING, AVOIDANCE AND AUTO·RECOVERY
TECHNOLOGIES ...................................................................................................................................... 56
1 COLLISION AVOIDANCE ..............................................................................................................•.. 56
1.1 1.2
W/\HNING SYSTEMS ..
TnAFFIC COLLISION AVOIDANCE 5VSTl:M (TeAS) . .................................... 57
.................................................... 57 1.3 AUTOMATCO GHOLJND AND TEI~RAIN COLLISION AVOIDANCE SYSTEMS." .............................................. 58
1.3 .. 1 Existing Prototypes .................................................... 58 1.3.2 Problems in Application to Civil and Cornrnercial Aircraft . ................................................... 59 1.3.3 Prognosis .... . ................................................... 59
1.4 GHOUNO PROXIMITY WAI~NING SYSTEMS .. ................................................... 59 1.5 TEHH/\IN AWARENESS AND W/\I{NING SYSTEMS ... . .................................................... 60
1.5.1 Synthetic Vision. . .................................................. 60 1.5.2 Terrain Awareness and Warning Systems (TAWS) .. ............. .... ......................... 60
1.6 VERTICAL NAVIGATION .. .. ................................................... 60 1.6.1 Global Navigation Satellite System (GNSS) .. .60 1.6.2 Traditional Methods . ........................... .. .................... ...... .................... 60
1.7 VISUALAI>PfWACH SYSTEMS. .. .................................................. 61
.1.7 .. 1 Approach Light Systems (AlS) ....................................... ....................... . ..................... 61 1.7.2 Visual Approach Slope Indicator System {VASI} and Precision Approach Path Indicator (PAPI).
................ ..................... . .............. ~ 1.7.3 Precisian Approach Path Indicator (PAPI) .. .. ..................................... 61 1.7.4 Other Lighting and Approach Navigation Systems ............................................................. 61
1.8 AIRCRAfT/COCKPIT DESIGN FEATURES. ................ .............. ................ ............... . ... 62
1.B.l Controls.. ................... ............. . ..................... . .. ................................................. 62 1.B.2 Head·Up Displays (HUDs) .................................................................................. 62
1.9 STAlE WARNING SYSTEMS .............. ............................... .. ............... .
1.10
1.11 EXCESSIVE BANK AND PITCH ANGLE WAHNING CAPABILITY ................................. ..
AUTOMATIC RECOVEHY SYSTEMS ............................................................................. ..
. ................. 62 . ..................... 63
. ......... 63

!~~ I i\e.~;.IJ \"-
Environmental Tectonics Corporation
5
BIBLIOGRAPHY ....................................................................................................................................... 63
FOOTNOTES ....................................................................................................................................•...... 66

/'~ ~ \'\a~1
6
Environmental Tectonics Corporation
1 INTRODUCTION Throughout the history of aviation the inherent shortcomings in the interaction between man and aircraft have frequently led to less than optimal events, Many of these events, unfortunately, have been catastrophic while others have been merely footnotes in time, These events are generally classified as a type of upset For as long as man has been flying he has been searching for a way to reduce, if not end, the occurrence of upsets,
There are a number of upset situations that an aircraft can enter, and an equally large number of factors that can put an aircraft in an upset condition, Many of these factors can be grouped into the following major categories:
• Pilot error
• Adverse weather / turbulence
• Wake turbulence
• Aircraft systems malfunction
• Airframe damage
Regardless of how or why the aircraft entered an upset, a primary cause of resulting aircraft damage and passenger casualties is negative man-machine interaction (MMI) in the recovery attempt The negative MMI can be attributed to many causes which fall well within the pilot's ability to avoid or are far beyond his or her ability to predict
In any case, the pilot's response to a given upset is critical to the outcome, As a result, any successful effort to reduce the number of negative MMIs must examine flOt only the flight dynamics of the upset environment but also the human factors involved, Historically, however, many investigations have focused on faults with the machine alone,
Many of the known human factors that contribute to negative reactions to upsets have been characterized over the years and training programs have been created that attempt to reinforce the positive actions required to successfully recover from upsets, These programs are commonly referred to as Upset Recovery Training (URT), Common URT curricula can range from classroom time, to simulator flights, to actual flight time in light aerobatic aircraft, Due to the extreme nature of upsets, it is not safe to use actual large transport-category aircraft for in-flight training,
While no one has argued the benefit of actual flight time, the flight characteristics of aircraft capable of recreating upsets (i.e., light aerobatic aircraft) are considerably different than large transport-category aircraft. Aerobatic aircraft are far more responsive and easy to maneuver than large transport-category aircraft. There has been considerable conjecture as to the pros and cons of using motion based flight simulation for URT. Motion based flight simulation is a broad topic in and of itself, given the range of simulation technology available. The classic large transport simulators

~~ 1\WJl. i
Environmental Tectonics Corporation
that include an enclosed full cockpit on a large hydraulically-actuated platform provide excellent simulation of the normal Aight environment. However, due to the dynamic nature of upsets these traditional devices are not capable of providing the sustained forces and sustained motion cues that make upset recovery such a daunting task. Simulators with a greater range of motion, degrees of freedom and higher motion performance, such as centrifuge based Spatial Disorientation (SD) trainers, could be better suited for URT.
2 BACKGROUND This study is part of a larger body of research aimed at understanding man-machine interaction in aviation, and its influence on aviation safety. The main experimental efforts of this investigation are contained in TASI(s II and III of the Flight Simulator and Training Human Factors Validation Research Grant Number NNL06AA21G.
The purpose of TASK II of this investigation is the validation of a centrifuge-based simulator, the GYROLAS@ GL-2000, as a research and training tool for replication of pilot-in-the-Ioop control system performance and aircraft response in upset and offnominal flight conditions.
7
The purpose of TASI( III is to identify trends in the physiological and psychological responses of pilots recovering from upset conditions in large transport aircraft. More specifically, the objective is to observe trends between the success of recovery attempts and the physiological and psychological response of the pilots.
3 UPSETS DEFINED
According to the Federal Aviation Administration, a large transport-category aircraft is in an upset condition when it is unintentionally placed in one or more of the following flight conditions:
• Pitch angle> 25° nose up.
• Pitch angle> 10° nose down.
• Bank angle> 45°.
• Airspeed inappropriate to attitude and environment.
3.1 Upset Categorization For the purposes of this investigation, upsets have been organized into ten separate categories. Overall, these categories fall under three general groupings:
• Unusual Attitude
• Control state

. ·11 \ !(I~I
Environmental Tectonics Corporation
• External drivers
An upset of a given category can be the cause of or caused by upsets of other categories. For instance, wake turbulence encounters and malfunctioning equipment sometimes result in one or more unusual attitudes. Despite the possible chronology of upset categories, each separate category definition is unique and as such has specific recovery techniques.
3.1.1 Unusual Attitude
The first and most common upset grouping is unusual attitude. The aircraft attitudes encountered during upsets are generally referred to as unusual attitudes. When
8
referring to upsets, aircraft attitude is defined by the pitch angle, energy state, and bank angle. The energy state of an aircraft is defined for these purposes as a combination of kinetic (airspeed) and potential (altitude) energy. The pitch angle can also be accounted for in total energy state, but is done so separately here.
Upsets can be categorized for the purpose of specifying appropriate recovery techniques for common conditions. However, real world upsets are likely to be a combination of several categories. Upsets can be grouped into general categories based on the following definitions:
• Nose High: pitch angle is at or above the horizon
• Nose Low: pitch angle is below the horizon
• Upright: roll angle is 90° or less (in either direction)-cockpit pOinted toward the sky
• Inverted: roll angle is greater than 90°-cockpit pOinted toward the ground
• High Energy - aircraft dependent
• Low Energy - aircraft dependent
3.1.2 Control State
The second grouping of upsets is control state. Control state upsets comprise upsets not covered by unusual attitudes but are still a result of the level of control or lack thereof that the pilot has over a healthy aircraft. Stalls, spins, overspeeds, underspeeds and departures fall into the control state category.
3.1.3 External Drivers
The final grouping of upsets is external drivers and this grouping represents physical conditions of the aircraft and environment that are outside the realm of normal operating procedures. Examples are wake turbulence encounters and aircraft damage or malfunction.

·.\ 9 '1l~
i((, l~~~!r I <\< ~
Environmental Tectonics Corporation
3.1.4 Categories
All 10 upset categories are described in Table 1. Upset Categories. The first eight upset categories are permutations of unusual attitudes and are referred to by individual attitude characteristics. The final two categories correspond to the other two groupings, control state and external drivers. Each recovery category has an accompanying description and procedure that is thoroughly covered in training in the upset training program presented in this research project.
Table 1. Upset Categories
Category Pitch Energy Bank # Grouping Angle State Angle Common Names or Examples
1 >0 High 0-90 Nose High - Upright - High Energy ..... ---.-~-.-- -.-~- -.---.~-- _.-- -.-, -- ,,- , .......... _ ... _ ... _---------------
2 >0 High 90 - 180 Nose High - Inverted - High Energy U)
._"." ". ___ ••• __ •• u •••• _. __ , ___________ ._._~ •••• _._,_ •• _. ___ • • ____ "
3 GJ >0 Low 0- 90 Nose High - Upright - Low Energy co ::> ---------- ------_. __ . __ .. _----------,--.
4 E >0 Low 90 - 180 Nose High - Inverted - Low Energy « ------- --- -------.------".---,--~ ,,,. - - - - --------,---,-,--,--"
5 - < 0 High 0- 90 Nose Low - Upright - High Energy (\} ::> U)
6 ::> < 0 High 90 - 180 Nose Low - Inverted - High Energy c ::J .-
7 < 0 Low 0-90 Nose Low - Upright - Low Energy .......... - - - ------------.,-.--, .. _-,-._.
8 < 0 Low 90 - 180 Nose Low - Inverted - Low Energy .....
I Stalls, Spins, Overs peed, Underspeed, 9 Control State Not Applicable i and other departures
- - - ---- --.'"-.--.. -.-.. ----~.-.. -- ...• _------- ------------, .. _-,,,,,-,._,-- ... _--------------, ... _ .. " .. ',.-External Wake Turbulence Encounters and
10 Drivers Not Applicable Aircraft Damage/Malfunction
4 REASONS FOR IMPROPER PILOT RESPONSE IN UPSET CONDITIONS
As physiologists are apt to point out, human beings are not naturally equipped for flight. Flying aircraft at high speeds and variable G forces can in many cases overwhelm human sensory, physical and physiological capability, especially if the pilot has not been adequately trained. Although there are several possible reasons for improper pilot behavior in upset conditions, most can be classified into one of the following four classes:
4.1.1 Pathological/Pharmacological/Physical
Pathological, pharmacological and physical reasons for improper pilot response are among the easiest to avoid and are outside the scope of this report. This report relies on the assumption that pilots are healthy and sober when inside the cockpit, an assumption

FI~.~I. .\~'
10
Environmental Tectonics Corporation
that the entire aviation industry, too, depends on. Still, it is worth noting how different forms of incapacitation may affect pilot control and response to upset conditions. Pilots who have contracted some sort of pathogen and are ill as a result are prone to improper and delayed response to upset conditions. Depending on the regions of the body affected by the illness, one or more of the pilot's sensory systems may be degraded. The inner ear is particularly vulnerable to the effects of illnesses, which may garble or completely stop vestibular signals to the pilot, potentially making navigation difficult. A compound effect of illness is the resulting reliance on over-the-counter and/or prescription drugs to counter symptoms.
A pilot's use of drugs, whether they are prescription, over-the-counter, or illicit, can have a significant effect on decision-making capacity in the cockpit. So-called "drug cocktails" are particularly dangerous to pilots, as the interaction of different drugs is not always well understood. The elimination of flying by under-the-influence pilots is a goal that the aviation industry takes seriously. In addition to degraded decision making capability, pilots under the influence of drugs may also suffer from physiological effects such as slowed reflexes, degraded vision and reduced coordination. This condition, of course, does not lend itself to the complicated maneuvering necessary to recover from upsets. In general, individuals who show addictive tendencies or a reliance on drugs to function as a pilot are screened out, further lessening the chance of pilots flying under the influence.
Similarly, a pilot's physical condition can influence their ability to properly control their aircraft, and thus to recover from upset conditions. If a pilot is in poor physical shape, for example, he or she may be unable to exert the force necessary to manipulate controls in an upset condition, particularly on non-fly by wire control systems, or in extreme flight attitudes. Poor physical condition and cardiovascular health may additionally contribute to the flight crews' inability to tolerate G forces and maintain consciousness in maneuvers. Although most unfit pilots are screened out at routine flight physicals, it is possible for a pilot's health to degenerate between physicals, or for the degeneration to go unnoticed.
4.1.2 Psychosocial
Cockpit crews and cabin crewmembers must be effective at interacting with each other in a wide variety of flight and social conditions. Inappropriate actions or lack of good Crew Resource Management (CRM) skills can lead directly to in-flight emergencies and upsets. Crew members who are aware of the psychosocial environment have the capability to recognize when a problem exists within their crew and attempt to address it.
There have been notable accidents where crewmember personality and interaction have played a large role. In the case of China Airlines Flight 676, a government review of the cockpit recordings between the pilot and co-pilot led to the creation of are-training program for all Chinese ex-military commercial pilots, who were seen as less capable of working cooperatively in a flight crew and accepting direction than civilian-trained pilots. In the case of the KLM/Pan Am Tenerife disaster, the failure of a junior first officer to

~~ '''~i
11
Environmental Tectonics Corporation
assertively tell the captain that he was not cleared for take-off resulted in the collision of two large jet aircraft and the deaths of over 500 people. Negative psychosocial interactions led to the worst disaster in aviation history.
4.1.3 Physiological
Physiological factors play an influential role in pilot response to upset conditions. Our sensory organs can easily deceive our brains in to thinking that we are in a flight condition significantly different from reality. This produces a condition called "spatial disorientation." There are four physiological systems that are relevant to flying an aircraft.
4.1.3.1 Human Visual System
Of the senses, the visual system is the most predominant. The human visual system relies on the reception of light by a series of cells in the eye. When an object is seen by the eye, a process called object recognition commences, whereby the brain compares the object with thousands of stored mental images until it recognizes a match'. Unfortunately, this matching is sometimes less accurate than the human brain believes, causing problems for pilots. When viewing the tilted but linear top of an altocumulus cloud, for example, the brain may match that object to a white horizon, leading the pilot to orient the aircraft to the false horizon, which can then result in a severely banked attitude and even a crash. A similar process can occur when a pilot flies an approach to a runway of a different width or length than he is expecting. The resulting optical illusion can lead to the pilot misjudging his altitude and flying an inappropriate glide path.
The human visual system can additionally deceive the brain in gauging the slope of terrain relative to the aircraft's flight path. Since pilots execute most landings and departures on horizontally level runways, they tend to judge their glide path relative to the slope of the runway without concern for its angle, which is in most cases flat. When presented with an angled runway, some pilots still gauge their glide path relative to the runway slope, leading to possibly under- or over-shooting of the runway.
4.1.3.2 Human Aural System
Few incidents of improper response to upset conditions have been attributed to deceptive signals from the aural-hearing-system, as most flight orientation does not directly depend on aural perception. This lack of reliance on aural cues is due in part to the relatively loud environment of the airplane cockpit; the aural system is constantly stimulated and thus less likely to perceive small changes in the aural environment. Aural perception can, however, be a complicating factor in certain situations, for example, when a pilot is already overwhelmed by other sensory input. Often, aural perception actually aids the pilot in responding to an upset by allowing him or her to hear warning signals and sounds that malfunctioning or damaged equipment make.

,
~,~ '''''a I
12
Environmental Tectonics Corporation
4.1.3.3 Human Somatosensory System
Use of our somatosensory system in flight is informally called flying "by the seat of the pants" in reference to the ability to feel pressure in the seat of one's pants with accelerations associated with changes in velocity. The somatosensory system is a series of organs that perceive and process pressure, temperature and pain as they affect the human body. Unfortunately for pilots, the human body and its somatosensory system are configured for life at approximately 1 G, traveling at relatively low speeds on the ground. In flight training, somatosensory cues are among the first that pilots are taught to ignore, recognizing that they are deceptive in many situations. When flying at a routine speed in a wings level, nose up attitude, for example, seat of the pants intuition can make the pilot think that he is accelerating, a misperception that can easily be avoided by reference to flight instruments.
4.1.3.4 Human Vestibular System
The vestibular system comprises the organs of the inner eal': the Semicircular Canals and the Otolith Organs. It enables humans to walk balanced, track stationary objects when moving, and remain stable on changing terraini
'. Like most of the human body, it is unable to reliably communicate the true attitude and speed of an aircraft in flight, being configured for a constant G, two dimensional life on the earth's surface. A general weakness of the system senses acceleration versus velocily. The Semicircular Canals rely on the movement of liquid against stationary hair cells to perceive movement. This only happens when the fluid is accelerating. Once that fluid reaches a constant velocity identical to that of the head, perception of motion stops. Additionally, the threshold for rotation to be perceived by the Semicircular Canals is approximately 1.5° to 20 per second'; when this minimum is not met, the pilot remains unaware that he and his airplane are turning. A similar illusion is produced when the Semicirculal' Canals stop perceiving constant spin or rotation and the Otolith Organs stop perceiving acceleration in a downward direction, allowing a so-called "graveyard spin" or "graveyard spiral" to develop without the pilot being aware. These problems most often occur if there are inadequate visual cues to the contrary.
A second contributing factor to improper pilot response to upsets is the inability of the Otolith Organ to distinguish linear acceleration from head position; again a dangerous tendency that can be overcome by relying on flight instruments.
A final relatively common vestibular illusion which may contribute to improper response to upset conditions is called the colio/is illusion. This illusion sends false signals to the brain when two or more of the three semicircular canals are stimulated simultaneously, resulting in vestibular cross-coupling, as happens when a plane is maneuvering and the pilot looks down to consult the panel while the aircraft is rolling. The coriolis illusion produces a feeling of tumbling and is often associated with nystagmus, a disruption in the pilot's ability to focus on objects (i.e. flight instruments). Since coriolis-inducing flight conditions are not uncommon, it's important for pilots to recognize the illusion and attempt to avoid it.
4.1.4 Psychological
~ "\
//'~I '\
Environmental Tectonics Corporation
13
Two psychological phenomena are particularly influential in negative response to upset flight conditions. The first is entry into a state of panic, defined as a "maladaptive reaction of flight, immobility, or disorganization stemming from intense fearm" Panicking can result in an inability to rationally evaluate the situation and make appropriate decisions, as well as physical reactions such as nausea, clammy hands, and an inability to move. All of these reactions can make upset recovery difficult or even impossible. By the time a pilot recovers from the panic episode, so much time may have elapsed that the opportunity to recover the aircraft has passed.
A second psychological phenomenon relevant to improper pilot response to upsets is the human tendency under new conditions to rely on intuition developed in slightly different, and often more stable, conditions. Sometimes called negative transfer, this condition results from a lack of training, currency or recent experience for the flight conditions the pilot encounters. The pilot will, in this case, revert to "operating the aircraft on preconsciously executed previously learned skills that are not being monitored by the conscious brain."" These skills, while appropriate for the pilot's familiar flight environment (i.e. normal flight environment) are usually not appropriate for the upset flight environment. This psychological tendency often plays a role in unsuccessful upset recovery attempts. An example would be the decision by a relatively inexperienced pilot to pull on the yoke when inverted, resulting in a dive instead of the desired climb.
5 UPSET ACCIDENT REVIEW
As discussed above, many of these incon'ect responses can result from reliance on intuition and previously learned skills gained through extensive experience in a normal, stable flight envelope and can be exacerbated by a panic episode. The application of this intuition to an upset condition rarely corrects the condition, and often results in a more serious flight condition. Other incorrect responses may result from spatial disorientation due to conflicting vestibular data communicated to the pilot by his or her senses', from a lack of visual cues, or inability to focus on and properly interpret the flight instruments to perform a correct recovery. Other accidents and upsets have resulted from an inappropriate reliance on the autopilot in upset conditions, but these incidents are omitted here since they are outside the scope of training pilots to manually recover from upsets.
Data on recoveries and attempted recoveries from upsets is statistically suspect due to the nature of aviation upsets and accidents. If an upset condition results in collision with terrain, it may be impossible to procure information from the flight crew regarding the decisions made in the cockpit. If a pilot aCCidentally allows his aircraft to enter an upset condition and successfully recovers, it is unlikely that information concerning the incident will be voluntarily offered, as it may jeopardize his or her career. In some cases, recovery from an upset may produce noticeable damage to the aircraft, which generally results in an investigation of the pilot's in-flight actions. In instances where the flight crew is unable or unwilling to offer information, navigation information, air traffic control

I~I 14
Environmental Tectonics Corporation
transmissions, and black box recordings often aid in the successful reconstruction of an accident.
Due to the large number of recorded upset incidents, it is useful to compile a sample set representative of the different types of upsets defined in this study. This sample comprises incidents from which there is adequate data available to clearly understand the flight conditions and reproduce the flight crew's actions in response to the upset condition. Some accidents are examples of multiple upset conditions, or show a progression from one condition to another. The following accident synopses familiarize the reader with some typical upset scenarios and aid in the conceptualization of an upset aircraft.
This is not intended to be an exhaustive list of upset occurrences, nor is it intended to be representative of all possible upset scenarios since such a listing is beyond the scope of this research.
S.l United Airlines flight 232: July 19, 1989 aircraft damage/malfunction
This attempted upset recovery is an illustration of proper upset recovery technique. While cruising at approximately 37,000 feet, the first officer and pilot of United Airlines Flight 232, a McDonnell Douglas DC-10, felt a jolt go through the aircraft, received an aural engine failure warning and saw the autopilot disengage. The second engine's N1 fan disk had broken in two, blowing the fan cowling off and pulling out the entire hydraulic system with it. The engine shrapnel had flown in many directions: slicing ten feet off of the tail, cutting the horizontal stabilizers and lodging itself in the remaining tail. The control column had become ineffective in controlling the aircraft, which began oscillating in a phugoid cycle, constantly exchanging airspeed for altitude, and vice versa. The aircraft was in an aka-aft damage/malfunction upset condition.
A DC-10 flight engineer and line check pilot coincidentally on board offered his services to the pilots, and quickly ascertained that the entire hydraulic system was irreparably damaged, rendering most of the aircraft's controls inoperable. Realizing that the only control remaining was the remaining two engines' throttles, the flight crew began making coarse adjustments in their flight path and attitude using differential thrust of the remaining engines, acceleration and deceleration. After being cleared for an emergency landing in Sioux City, Iowa, the flight crew began a rough throttle-controlled descent towards a g,OOO-foot runway by dumping fuel and making a series of turns". An unsuccessful attempt to push hydraulic fluid into the controls by putting down the landing gear was made. The pilots redirected to a parallel and smaller runway when they could not make an accurate approach to the larger one, and a somewhat controlled emergency touchdown was made in a right-banked attitude. The resulting crash broke off the right wing and divided the fuselage into multiple parts. Although 110 people perished in the crash and resulting fire, another 185 survived it due to the proper and timely response of the flight crew"'.

!'~"~I \a. Environmental Tectonics Corporation
15
The flight crew responded quickly and accurately to the aircraft malfunction upset condition, first identifying what had malfunctioned and what damage had been done to the aircraft, then checking which controls were still functioning. Realizing how serious the damage was, they began planning as safe a landing as possible. The use of only throttle to control the airplane is a good example of resourceful use of remaining equipment. Although the recovery was not as successful as desired, this upset incident was an incredible example of proper upset recovery technique.
5.2 Aircraft N40AN: January 10, 2007 pilot error, nose low, energy high, banked; overspeed; departure
During an intentional in-flight maneuver, the pilot of a Learjet 35-A found himself in an unintentional upset condition. At the cruise altitude of approximately 22,000 feet, the pilot initiated an intentional aileron roll, during which he subsequently lost control of the aircraft. Attempting to recover while on full cruise power, the pilot pulled on the yoke while still having a bank angle of approximately 90 degrees, which resulted in a nose low, updght, high energy condition. While descending through 20,000 feet, the airplane began to overspeed in its near wings-level, nose down condition, and the pilot's subsequent sharp pull on the yoke and engagement of the elevator resulted in excessive G-Ioads on the airframe. Returning to a moderate nose up condition through more controlled use of elevator and yoke, the pilot executed a normal landing, but the aircr-aft overstress had caused substantial damage to its left wing and elevator assembly.
This incident is an example of an improper recovery form a nose low inverted upset condition followed by a mixed recovery from a nose low, upright; high energy upset condition, as well as from a departure from controlled flight upset. The pilot's intuitive response to the loss of control, nose low situation was to pull on the yoke, but with the aircraft banked at a greater than 90 degree angle, this action resulted in a near vertical nose down condition with excessive altitude loss and overspeed of the aircr-aft. The pilot's improper reaction to the nose low overspeed condition of abruptly pulling on the yoke resulted in the exposure of the aircr-aft to unsafe levels of G force and airframe damage. The pilot's subsequent slow return to a near Wings-level condition while in a nose down over"speed was correctly executed and the aircraft was returned to level, controlled flight. Had the pilot correctly recovered to a relatively wings-level position early in the upset scenario, the subsequent gradual pull on the yoke would have returned him to a normal flight envelope, instead of resulting in an overspeed and dive. Similarly, a more gradual recovery from the nose-down condition would have spared the airframe from high G exposure and damage, and was still possible at the altitude of approximately 20,000 feet.
5.3 American Airlines Flight 587: November 12, 2001 wake turbulence encounter, aircraft damage/malfunction
The initial upset condition encountered by American Airlines Flight 587-wake turbulence--is relatively common among aircraft flown at airports serving large jets.

''il~ ( 1~£7l' Environmental Tectonics Corporation
16
When large aircraft depart from runways and climb to cruise altitude, large wingtip wake vortices can remain in the air for many minutes after the aircraft has departed. These vortices are particularly hazardous to smaller aircraft, but can also adversely affect larger aircraft. Although a minimum following distance of 5 miles behind a large jet is standard, wake turbulence encounters are still common. In this case, the pilot and copilot of an Airbus A-300 departed approximately five miles behind a larger Boeing 747, which left considerable turbulence in its wake'ii'. After retracting the landing gear at approximately 1,700 feet, the Airbus A-300 pilot acknowledged instructions to turn to the left.
During this turn, the aircraft encountered turbulence left by the preceding Boeing 747 in its climb. The flight recorder indicated that the airframe experienced loads on the order of negative .3 G down and .07 G left. This combined with indicative air data indications is consistent with a wake turbulence encounter. After climbing to 2,300 feet, the aircraft again encountered turbulence; the bank angle became approximately 23 degrees left wing down and the plane oscillated slightly in response to the turbulence.
As the G load shifted slightly, the first officer moved the rudder pedals to essentially full deflection through 3.5 lateral cycles in a 45 second period. Simultaneously, the yoke was moved laterally left and right to full deflection. Approximately three seconds after this series of larger than normal rudder and lateral yoke input, with the ruddel' still deflected about 11" right and the aircraft traveling at an airspeed of approximately 250 knots, the first officer added full power, putting the rudder in opposition to the flight patll and entering a sideslip, resulting in the entire vertical stabilizer separating from the aircraft". At this point, the ail-craft entered an ati"craft damage/malfunction upset condition, and the first officer continued inputting commands to the rudder and elevator for a short period of time, not realizing that the entire vertical stabilizer had separated. The aircraft entered a dive and impacted the ground less than fifteen seconds later.
The National Transportation Safety Board hypothesized that the rapid alternation between near-full left and right deflection of the rudder twice exposed the fin to more than 200% its limit load as listed in the manual, and multiple times to force well over its maximum load (1.5 times the limit load) before the fin was torn from the airuaft'. According to the National Transportation Safety Board, as well as Airbus 300 flight engineers, the crash can be attributed primarily to the aggressive control inputs, which caused airframe overstress and structural failure and not to any inherent flaw in the Airbus 300".
The aircrew had recently graduated from American Airlines Advanced Maneuver Training (AMT). These crew members had been instructed to authoritatively apply inputs to recover from an upset. The crew was further taught that the flight controls were equipped with protection from structural overload, which was not so at this flight condition. Last, it was discovered that the tail was designed for one full deflection input; however, cycling the rudder several times introduced additional dynamics that were not originally designed for.

/'~~I \ 17 \.::.
Environmental Tectonics Corporation -----------------------------
5.4 Aircraft N9253N: July 16, 1999 nose low, high energy, no/low bank angle; nose low, high energy, inverted
A relatively inexperienced recreational pilot departed Essex County Airport in New Jersey in a Piper Saratoga II, a single engine propeller aircraft. Leaving at dusk, he experienced night conditions with deteriorating visibility as the aircraft headed towards its destination of Martha's Vineyard. Although not instrument rated, the pilot had limited experience flying in instrument conditions and was expecting visual flight rules weather as he followed the coast north toward his destination. According to a number of other pilots flying that night, marginal visual flight conditions prevailed, and the horizon was hard to visually discern, even from a low altitude';;.
At an altitude of approximately 5,500 feet and a distance of 34 miles West of Martha's Vineyard, radar showed that the aircraft began a sudden descent, possibly as a result of pilot disorientation or pilot reliance on outside visual and sensory cues rather than flight instruments to gauge altitude. It is hypothesized that the pilot unintentionally moved the yoke while straining to visually discern his location relative to his intended landing airport. After descending for several minutes, the aircraft began a 30 second climb from 2,200 to 2,500 feet before turning left and climbing another 100 feet. Having few visual cues over the ocean in hazy conditions, the pilot likely initiated a series of turns and varied his altitude slightly before finding himself in a nose low, uptight, high energy upset. With the nose deflected approximately 15° downward and the aircraft descending at 900 feet per minute, the pilot initiated a right turn which resulted in a near inverted attitude (a nose low, inverted, high energy upset.) In response to the resulting dive and rapid loss of altitude, the pilot likely panicked and instinctively pulled on the yoke, which due to the inverted attitude, resulted in a spiraling dive toward the ocean. Presumably, the pilot did not consult his flight instruments and was not aware that he was in fact inverted. Upon impact the aircraft was moving at approximately 55 miles per hour in the vertical direction and the pilot and his passengers were killed on impact.
The pilot's decision to continue flight in marginal visual flight rules conditions was a contributing factor to the upset and crash that followed. Regardless, the pilot's response to his upset condition was incorrect. Had he consulted his flight instruments and identified a nose low, upright, high energy upset, the pilot could have reduced power and initiated a slow recovery by pulling back on the yoke, and then adding power to gain altitude. The decision to attempt to turn out of a dive was a poor one that worsened his flight attitude and produced an inverted upset. The pilot either did not, or was incapable of, using the flight instruments to discern his altitude and flight attitude and instead likely relied on intuition that was not relevant to his situation, which led him to plunge his aircraft into the ocean.

Environmental Tectonics Corporation
5.5 Aircraft N768H: June 24, 2006 nose high, high energy, upright; nose low, high energy, upright
18
A private pilot and flight instructor, both experienced pilots, departed from a small airfeld in Big Timber, Montana on the third leg of a training flight to Everett, Washington. The private pilot had purchased a Pilatus PC-12/47 and was receiving instruction in the aircraft, a large, single-engine turboprop aircraft. After transmitting to the Common Traffic Advisory Frequency (CTAF) that they planned to simulate an engine failure and a 1800 turn to return to the airport, the pilots left the runway on a normal flight path.'iii
Approximately one minute after leaving the ground, the aircraft's nose was seen quickly climbing to about 30° nose high, immediately followed by a sharp bank to the right, presumably initiated by the pilots. The plane banked nearly 90° to the right, then the nose dropped to a 45° nose down position with the bank angle still well over 45°''', resulting in a nose low, high energy, upright upset condition. Attempting a high-energy roll out to wings level position with aggressive use of ailerons followed by simultaneous pull up from the terrain, the pilots were unable to gain altitude and began a banked dive towards a ridge adjacent to the airport·"'. Pulling sharply on the yoke, they commenced a recovery to level flight, but the sharp bank angle made recovery difficult, and the right wing tip impacted the terrain; both pilots were killed in the subsequent crash.
This aCCident is an example of improper response to a nose high, high energy, upright upset condition. The initiation of a simulated engine failure so low to the ground limited the pilots' recovery options, and necessitated quick and effective decision making by the pilots. From a high energy, nose high position, an improperly executed aileron application is likely to result in a high-bank, aggressive nose-down condition. By attempting to aggressively roll to wings level and then pitch up, the pilots were unable to gain altitude very quickly. Their final decision to pull sharply on the yoke and away from terrain was unsuccessful due to their high bank angle. Although recovery from the difficult upset condition initiated by their failed engine simulation would have been challenging in any case, their choice to pull to level flight before rolling to wings level made subsequent recovery unlikely.
5.6 Training Currently Available There are several avenues for URT currently available. However, each has shortcomings.
5.6.1 Hexapod
Motion emulation is the ability of a system to accurately create the forces seen during real upsets. The forces that are created by flying in upset conditions are both sustained and much higher than can be generated with current FAA approved motion based simulation technologies. Hence, simulators cannot accurately create the motion environments of an upset.

19 ;~ i}; \'
.\''<ir;[1 .
Environmental Tectonics Corporation
5.6.2 In Aircraft Training
Light aerobatic aircraft can generate the sustained forces encountered during an upset. However, these types of aircraft have very different flying qualities than large transport aircraft. Using aerobatic aircraft for large aircraft upset training would be akin to learning to drive an 18-wheeler using a Corvette. FAA approved hexapod type simulators do an excellent job of recreating large aircraft flying qualities, but as mentioned above, are not capable of accurate motion emulation.
5.6.2.1 Calspan (www.calspan.com)
Calspan is the most popular and well-known URT course available. This is due to their unique capability of a variable in-flight stability Lear Jet. This particular aircraft is equipped with a one-of-a-kind digital flight control system that can be changed in flight to make the aircraft flying qualities mimic other aircraft. As a result you can practice a limited number of upsets in this aircraft as they would occur in a large transport aircraft. The major limitation with this training approach is that this aircraft is not permitted to pel'form aerobatics. Hence, the severity of the upsets is limited. Calspan makes up for this by using an aerobatic Beechcraft Bonanza light ailuaft for more extreme upset examples.
5.6.2..2 EX-Military Aircraft
Ex-military aircraft, which are typically training aircraft or light fighters, have performance characteristics well suited for URT; however, their handling qualities are more towards the Corvette end of the earlier comparison. There are several companies throughout the United States that offer 1 to 3 day URT courses. While the entry speeds and altitudes may be similar to large transport aircraft, ex-military aircraft are much more responsive and capable of higher g loading. This can lead to negative training should a pilot experience an upset in a large transport category aircraft and expect it to react as quickly as the ex-military aircraft they trained in.
5.6.2.3 Light Aerobatic Aircraft
The last category of URT uses light aerobatic aircraft such as an Extra-300. These courses have problems similar to the ex-military aircraft mentioned above but are further removed from realism in that they operate at airspeeds and altitudes far less than transport aircraft.

6 EXPERIMENTAL SETUP
~~ ''iiI
Environmental Tectonics Corporation
20
For the purposes of this investigation, a group of pilots experienced flight upset profiles in the GYROLAB GL-2000 centrifuge-based simulator. The experiment involved two distinct stages that correspond to tasks defined in NASA Grant # NNL06AA21G as follows:
1. Physiological Investigation (PI) Stage (Task III)
2. Upset Recovery Training (URT) Stage (Task II)
6.1 Test Maneuvers The test maneuvers consisted of a set of preset upset profiles based on the upset categories listed above.
6.1.1 Upset Profiles
Fourteen flight upset profiles were extracted from NTSB mishap reports where aircraft entered upset conditions that subsequently resulted in an aircraft accident:. All fourteen of these NTSB based profiles were used for the physiological investigation group. A subset of seven of these fourteen profiles was used fOl' upset training group evaluations. These profiles were given in a randomized order during evaluation and experimentation. Additionally, 66 profiles were generated representing the various classes of upsets. A table detailing each profile is provided in Appendix B.
6.1.2 Test Maneuver Execution
At the beginning of each upset profile the pilot was instructed to set the throttle at 50% and not actuate any flight controls until told to recover. The appropriate profile was then initiated. Once the upset condition was reached, the pilot was instructed to take control of the aircraft and recover from the upset. Each upset scenario was considered complete when the pilot returned the aircraft to controlled level flight or when an accident occurred. After the completion of each upset, the aircraft was returned to a short period (10 - 20 seconds) of straight and level flight, allowing the pilot time to reacclimatize.
Pilots are required to keep their eyes open during the development of the upsets. This is done for two reasons. First and foremost, the lack of visual cues tends to induce motion discomfort. This is true in any case, simulators, airplanes, roller coasters, etc. Secondly, the instructor must be able to see the participant's eyes for safety monitoring at all times. There are advantages to this method which are discussed in the Lessons Learned section.
7 TEST DATA SUMMARY The following data sets were collected for this investigation:
• Pilot Physiology

21
Environmental Tectonics Corporation
• Flight Control Input
• Simulator Motion
• AudiojVisual
A comprehensive list of test measurements is provided in Appendix A: Test Measurement List (TML). Physiological data was collected using the BlOPAC monitoring equipment. Aircraft performance data was drawn directly from the MatLab based aeromodel. Motion performance data and pilot inputs were taken directly from the motion computer. The GYRO LAB GL-2000 is equipped with on board CcrY for recording the pilot's motions and verbal communications.
7.1 Experimental Hypothesis Experimental hypotheses were developed as mentioned previously based on the Tasks.
Task II: Sustained motion simulation is of sufficient fidelity that through a tl'aining program combining classroom and centrifuge-based simulator instruction, pilot reaction to unplanned upsets can be improved.
Task III: There are identifiable psychological and physiological responses that occur 'In pilots when their exposure to an unplanned upset results in a mishap.
7.2. Simulator - GYROlAB Gl-2.000
There is only one technology currently available that satisfies both the need for large aircI'aft flight dynamics as well as sustained motions, ETC's GYRO LAB product line.
Approximately 19 GYROLAB's have been commissioned around the world to date. For purposes of this study, the GYROLAB GL-2000 located at ETC's National AeroSpace Training And Research (NASTAR) Center in Southampton, PA was used. This device was commissioned and was in service for the USAF at Brooks AFB for many years as a research device until being re-purchased by ETC for use at NASTAR Center. The GL-2000 was re-fitted as to replicate the left seat of a large civil transport aircraft cockpit using Boeing 767 cockpit hardware. An aeromodel, provided by NASA was integrated into the GL-2000.
Since commissioning at the NASTAR Center in August of 2008 the GL-2000 has served as a URT research test bed for the FAA, Embry-Riddle Aeronautical University (ERAU) and NASA. It has been used for URT for ab initio and experienced airline pilot training as well. All of the research and training efforts have demonstrated that the GL-2000 is a superior URT device and provides a learning environment unmatched by any other device or training method because of the unique morlon platform.
The GYROLAB GL-2000 is an interactive training system. In the GYRO LAB GL-2000's simulated aircraft flight environment, trainees learn to rely on their flight instruments to maintain control. Interactive learning profiles and closed-loop flight controls allow the trainee to practice control actions. The GYRO LAB GL-2000 can simulate the in-flight

.~~ ... :
:.{ ,>4., I ... \
Environmental Tectonics Corporation
22
stimulation of the visual, vestibular, and proprioceptive systems that can cause pilots to become disoriented while flying. The GYROLAB GL-2000 has the unique capability to provide controlled, sustained G-stimulation with its planetary axis, and ±360 degree rotation in the yaw, pitch and roll axes. These capabilities also make the GYRO LAB GL-2000 a powerful tool for upset recovery training, situational awareness training, research and motion sickness desensitization. The GYROLAB GL-2000 located at ETC's NASTAR Center in Southampton PA was equipped with the left-seat of a large civil transport aircraft cockpit, corresponding flight controls, and aircraft modeling software for this project. A breakdown of the GYROLAB GL-2000's performance is provided in Table 2. GYRO LAB GL-2000 Performance SpeCifications.
Table 2. GYROlAB Gl-2000 Performance Specifications
P.'lOIION !:l!~SE SYSTEM
Figure 1 and Figure 2 below show the GYRO LAB GL-2000 at NASTAR Center and the GYROLAB GL-2000 cockpit as configured for this research project.

/~~ i '~I \-
Environmental Tectonics Corporation
Figure 1. The GYRO LAB GL-2000 at ETC's NASTAR Center.
Figure 2. Cockpit of the GYROLAB GL-2000.
7.3 Subject Group
23
The subjects were chosen using the same criteria for both Tasks. The Airline Pilots Association (ALPA) was kind enough to circulate an announcement in their regular newsletter. The response to this notification was phenomenal and as a result the candidate pool was diverse enough for further selection. Each candidate was required to

"
~,'~ I"'ii I
Environmental Tectonics Corporation
have at least an ATP and current third class medical. No one could have had previous specialized URT. Standard FAA or basic company URT was acceptable.
24
The question was then posed as to whether or not pilots with military training should be used as subjects given the fact that all military aviators go through extensive aerobatic and upset recovery training. However military trained pilots make up a large percentage of the pilot population, excluding them would inaccurately skew the data. The decision was then made to include military trained pilots and attempt to enlist as close to a 50 I 50 ratio between civilian and military trained pilots as the candidate pool and schedule would allow. Due to several scheduling last minute scheduling conflicts, usually due to pilots being called to fly, the resulting spread was 35% military pilots for the entire investigation with 31% and 38% for the physiological and training investigations respectively. This may be more representative as the current percentage of military trained aviators in the industry in on the order of 20%.
Subjects were de-identified for protection of privacy. Each pilot was given an ID number based on 'Initial participation date and a roster number for that day. For instance, the second pilot to come in on March 27, 2009 would be given the identifier 200903272.
:7.4 Familiarization Each pilot was provided with a familiarization program prior to any research flights. Pilots were coached as necessary to complete the assigned tasks with careful consideration not to provide URT type coaching so as not to give an unfair advantage and spoil the data. The familiarization process is as follows:
7.4.1 In SD (pitch roll, and continuous yaw) Mode
• Aircraft is placed 10 miles out on approach on localizer and glide slope. Pilot is instructed to complete the landing.
• Aircraft is placed at 300 kts I 20,000 ft in the clean configuration. The pilot is then instructed to complete two aggressive turns to 60 degrees of bank or greater. These are followed by a wing over maneuver. In the case of several (Ivilian trained pilots, they were reluctant to roll the a'irplane greater than 30-45 degrees of bank. In these cases it was necessary to have these individuals complete a 360 degree aileron roll in order to make them more familiar with extreme maneuvering.
(Note: Pilots were specifically li7formed that the extreme maneuvering flight was for purposes of upset recovery training only and was not to be used during normal flight conditions.)
7.4.2 In TFS (pitch roll, yaw, and planetary) Mode
• The latter exercise in the SD mode portion is repeated with TFS mode turned on to give the pilots a chance to experience how the device generates G forces. This exercise is strictly limited to 5 minutes in duration in order to give the

~t I~I \-
Environmental Tectonics Corporation
subject just enough time to acclimate while minimizing exposure time and chances for motion discomfort
7.5 Analysis Tool Numerical data was supplied by four different sources all working on different time scales:
• MC - Motion Control Computer
• AC - Aeromodel Computer I/O's
• Aeromodel Log Files
• BioPack Hardware
25
A code was generated to synchronize all data for a given upset and store that data in a master .mat file for each upset. A companion code called QuickPlot was generated to read these .mat files and provide data to the research for analysis. An example of the main QuickPlot output screen in shown in Figure 3. QuickPlot Main Output Screen Example. QuickPlot allows the user to select any upset based on date, subject number and upset number. All available data variables are shown in the list on left whkh can then be selected and plotted vs. data from the current upset or other previously plotted upsets. The left and right axes are independent to allow for plotting of variables on different scales. A green vertical line is also shown to indicate where control was relinquished to the pilot and the recovery attempt was commenced.

:9 I~I
Environmental Tectonics Corporation
Figure 3. QuickPlot Main Output Screen Example.
An additional functionality was added to provide for analysis of the major physiological parameters. This functionality is called PhysPlot an Example of which can be seen in Figure 4. PhysPlot Example Output. The code was automated to generate a PhysPlot output for every upset in the Physiological test sequence. As with the main QuickPlot output, a green line denotes the start of the upset.
26

27 4'i~\ I~~r~ \',
'\ ~ Environmental Tectonics Corporation
------------------------------
Date 200~}J:327, F'ilo\. l. UpSet: "1, Bank:;: lC,L, Pitch:: ~:30, /..\,11:;: 5.000 ft lAS:;: 320
4S
S} 8 & I'~,~···'"
G
3f. 40 4S
'-'j
3::1 :10 ,!!',
6 ------ StICk Roil
L 0 ---- f:;':oIIF\)tc m F:':lJldel ,_-I
... I 0 Ie I ~'.:, ::Cl ~~!:-, 30 :::C, ,10 ,I",
L 0
"0 , /~ ~::; , 0 All:tl,Jdt", Ion
0 .L (J)
() u, C I C I :.' 2D ):~-, ?,(j ~!,C' ·w ,1',
Figure 4. PhysPlot Example Output.
8 PHYSIOLOGICAL INVESTIGATION
Each member of the PI group was at NASTAR Center for one day only. The pilots were placed in the GYROLAB GL-2000 for the familiarization flight as defined above. After the familiarization flight, the pilot was tasked with completing a set of upset profiles: NTSB 1-14, which correspond to the 10 upset categories listed in Table 1. Upset Categories.
The profiles included the 7 evaluation profiles from the URT curriculum and 7 other profiles, denoted as Physiological Investigation. In random order, the 14 profiles were administered to each pilot during two flight sessions of approximately twenty minutes in length.
8.1 Subject Schedule 0800 - Informed Consent

I~~ \'''tl'li
Environmental Tectonics Corporation
0900 - Tour of NASTAR Center
0930 - Program Briefing
1000 - Familiarization
1130 - GYROLAB Flight #1
1330 - GYRO LAB Flight #2
1630 - Debrief
1700 - Departure
8.2 Physiological Measurement Apparatus The following measurements were taken on all PI subjects using the methods noted.
• Blood Pressure - Sphygmomanometer
• Eye Movement - Electro Occulograph
• Respiration Rate and Depth - Pnuemograph
• Pulse / Oxygen Saturation - Pulse Oximiter
• Skin Temperature - Thermometer
9 NTSB UPSET PROFILES
The upset profiles used for the physiological investigation were all based on NTSB accident data. A list of the stalting flight conditions for the fourteen profiles used is provided in Table 3. NTSB Based Physiological Investigation Upset Profiles.
Table 3. NTSB Based Physiological Investigation Upset Profiles
Aircraft Bank Pitch Altitude Airspeed
1 Fully functioning 15 left 25 nose down 4,000 ft 165
2 Fully functioning 70 right 25 nose down 15,000 ft Low
3 Fully functioning 120 right 35 nose down 10,000 ft 180
4 Fully functioning 10 left 40 nose up 10,000 ft 170
5 Fully functioning 60 left 40 nose up 15,000 ft Low
6 Fully functioning 180 40 nose up 10,000 ft Low
7 Fully functioning 15 left 30 nose down 5,000 ft 320
8 Fully functioning 75 right 20 nose down 10,000 ft High
9 Fully functioning 110 right 20 nose down 10,000 ft 330
10 Fully functioning 30 right 45 nose up 10,000 ft 310
11 Fully functioning 60 left 45 nose up 10,000 ft High
12 Fully functioning 200 45 nose up 5,000 ft High
13 Fully functioning 5 left 20 nose down 15,000 ft 360
( overspeed)
28

Fully functioningturbulence
9.1 Results
i ~ ~ \ ''''si'
Environmental Tectonics Corporation
20 nose up 3,000 ft Low
29
Arousal is the major factor in characterizing the nature of human reaction to situations such as upsets. As humans vary widely both physiologically and psychologically there are no absolute, quantifiable parameters that can measure arousal for all subjects. Arousal factors are subject dependent. However, there are trends in behavior for each subject and groups of subjects that can be identified to depict arousal in similar situations. Arousal is definitely an identifiable point in time. The experiment depicted the following general characteristics of arousal:
• Arousal was most commonly shown by breathing due to the fact that breathing registers the most instantaneous behavioral change.
• Eye movement was a secondary indication of arousal.
• Pulse can give a second OI'der indication given the proper analysis.
9.1.1 Pnuemograph
A standard pnuemograph was used to measure expansion of both the thorax and abdomen in order to measure respiration rate and depth. Breathing rate and depth were clearly the most descriptive indicators of arousal. All partiCipants displayed changes in either breathing rate or depth immediately upon one of two events
1. Entry into extreme nose low, inverted or high-g flight condition.
2. Being given control of the ailuaft.
Arousal was characterized by a subject either holding their breath or breathing more rapidly and deeply. The most common reaction of the two was to hold a breath for 10-15 seconds. This time span also generally correlated to finding a solution to the upset. Following the arousal period subjects either returned to roughly the pre-arousal breathing or breathed more slowly and deeply.
As mentioned above, there was a correlation between arousal and flight attitude. Inverted upsets and extreme nose low conditions where the field of view was mostly taken up by the ground caused many pilots to show signs of arousal prior to being given control of the aircraft. This was especially true with civilian trained pilots. These pilots would demonstrate signs of arousal, such as holding their breath, normally when given control of the aircraft. However, when the aircraft was extremely nose low or inverted this identical behavior would begin when the aircraft entered the extreme attitude.
Example data can be seen in Figure 5. Pnuemograph Data Example. This shows a lypical upset set up and recovery. The two blue lines are abdominal and thoracic pnuemograph readings. Pitch stick is shown in red as a general measure of recovery activity. The vertical green line denotes the time when control was relinquished to the pilot and

I~i \, 30
Environmental Tectonics Corporation
recovery began. Note that breathing rate and depth were relatively consistent until the point where recovery was begun. At this pOint, depth specifically increased dramatically.
_~J
....... ~,~::.~,::,~., __ .,_ J
_ .':~:,0,'", i """, ,",. "",,,', 1,-.,1 "'c,~'
Figure 5. Pnuemograph Data Example.
As mentioned above given the nature of the testing device, it was also not possible to quantify the deltas between pilots. Varying chest sizes combined with differences in simple changes such as strap tightness resulted in data values that were not directly comparable. Simple differences in reaction types also made quantification impractical.
The thorax pnuemograph reading must also be correlated to roll inputs. Roll yoke inputs use the muscles of the upper body and hence cause an indication on the thorax pnuemograph. If a correlation is not made roll inputs could be interpreted as breathing motion.
9.1.2 Electro Occulograph (EOG)
Each pilot was outfitted with EOG leads to measure vertical eye movement on the right eye and overall horizontal eye movement. An example of a pilot outfitted for a PI flight can be seen in Figure 6. Pilot Outfitted with EOG Leads.

31
Environmental Tectonics Corporation
Figure 6. Pilot Outfitted with EOG Leads.
EOG data was not as effective as pnuemograph readings to display arousal but could be used depending on the pilot. Eye movements were generally quick and small prior to arousal. Once arrived and recovery attempted eye movements become larger but more deliberate. All pilots wel'e actively looking around for both the setup and recovery portions of each upset. There were, however, three distinct visual aiming groups. Group one continually looked out the window of the aircraft. Group two continually looked at the instrument panel. Group three would be looking at both and shifting their scan between the two. The latter group's eye movement increased dramatically upon being given the airplane due the need to rapidly change focus from out the window to the instrument panel. This group was also generally more successful at recovering from upsets than the other two.
Example EOG data is shown in Figure 7. EOG Data Example. As with the pnuemograph data, the green line denotes the beginning of the recovery attempt and the red data is pitch stick. In this case the blue data is both vertical and horizontal EOG data. The data clearly shows that eye movement during the set up was relatively minimal. Immediately upon being given control of the airplane, the pilot's eye movement increases in a scanning motion from between the instrument panel and out the window view.

'bolA.'.:' j Y'~:::::'_' j l.,,·), J """ l~" J
9.1.3 Pulse-Oximiter
'.J}1'. . /v .... ,. I '\' .
Environmental Tectonics Corporation
Figure 7. EOG Data Example.
Pulse could be a good identifier of arousal, however, due to the fact that pulse is measured as a wave, the data is considered second order and hence indication is delayed. Analysis of the pulse wave fell outside the purview of this investigation; however, it is discussed in Section 13.4.
Oxygen saturation displayed normal fluctuations between 97 and 99%. There were a few excursions to 100% and 94%, however these were rare. More importantly there was no discernable correlation between upset recovery and oxygen saturation.
9.1.4 Skin Temperature
The interior temperature of the GL-2000 was relatively high, to the point of pilot complaint. This problem has since been remedied, but unfortunately caused all skin temperature data to simply show a steady climb through out testing. There was no event dependent change in temperature.
9.1.5 Blood Pressure (BP)
32
The sphygmomanometer was a completely independent device from all other equipment. It was turned on for the minimum interval of one minute prior to closing the canopy. The start time was noted manually. BP measurements were taken automatically every minute as long as the machine did not err due to arm movement. Depending on

~~/./. // , I \'\oi£¥ .
Environmental Tectonics Corporation
33
the type of error, the device would power off and/or data for that particular subject would be lost. Upon the start of testing, time was again manually taken for comparison with BP data. Following the end of each flight, BP data was printed manually via an onboard printer.
The results demonstrated that this method is not practically feasible. In most cases the data failed off due to pilot arm movement. This cannot be worked around as the pilot requires the use of his or her arms to recover the airplane. In addition, simply marking start times manually was not efficient either as timing was interrupted several times due to various other unrelated testing events. In the end, less than 50% of the BP data was useable.
9.1.6 Chewing Gum
Subject 200904031 exhibited a behavior that was interesting to this study. This pilot was chewing gum during the evaluation flight, which was observed on the CCTV feed and also registered on the EOG. Prior to being given the upset the pilot was actively chewing. When given control of the airplane and recovery began, chewing ceased. When the pilot felt that the appropriate recovery had been identified and begun, in other words he thought he had it sorted out, chewing resumed. If there was a secondary upset or an expected condition, chewing would cease again until the new situation was solved. While not quantitative data, this demonstrates behavioral evidence of arousal to some level whenevel' the pilot ceased chewing.
9.1.7 Importance of Order
Each pilot was given the upset series in random order. This was done to alleviate biasing due to a repeated order or any post flight discussions between subjects in the same group given later pilots an unfair advantage. However, this then negates the measurement time dependent factors. For instance, familiarity with the simulator and pilot confidence generally increase with the number of upsets. In addition, fatigue or growing motion discomfol't increases in effect with upsets. These issues are potential arousal factors, however, given the random order are not quantifiable.
9.1.8 Military VS. Civilian Training Correlation
Pilots with military training background tended to show less of a delta in a given data set when aroused as opposed to those with civilian training. Military trained pilots also typically demonstrated lower levels arousal than civilian trained pilots especially during the g-onset phases of flight. Civilian trained pilots with aerobatic experience tended to react similarly to military trained pilots.

N~y/AR, t~
10 TRAINING INVESTIGATION
.. ~ .. ~ .. ( .•. ,1 J "";"" I.
\-
34
Environmental Tectonics Corporation
The URT group attended the NASTAR Center for a 2 day URT program. To assess performance upon arrival, each pilot was given a pre-training evaluation of upset recovery performance. The normal URT syllabus includes a post-training evaluation that was used to gauge pilot performance following training which consists of the 7 NTSB profiles that are designated as Eval 1-7.
10.1 Training Syllabus NASTAR Center's URT is designed to train pilots in today's commercial aviation industry to cope with and successfully recover from unexpected upset conditions. This consists of providing pilots with advanced techniques in maneuvering and controlling beyond the standard taught in normal flight training.
NASTAR URT is a two-day program composed of two major components;
1) Classroom instruction
2) Actual hands-on upset experiences in the GYROLAB GL-2000 full motion simulator configured as a GeneriC Large Transport (GLT).
10.1.1 Academics
An outline of the academics covered is as follows:
1. Introduction
2. Expecting the Unexpected
3. Training Goals
4. Aircraft Control
4.1. Lift Vector Control
4.2. Load Factor
5. Energy Management
5.1. 1m proper EM
6. Operation Limitations
7. Upset Specifics
7.1. Upset Causes
7.2. Secondary Upsets - Effects of Dynamic Maneuvering on Flight Crew
8. Recovery
8.1. Recognition
8.2. Analysis

~ ... ~ I~I
Environmental Tectonics Corporation
8.3. Recovery
8.4. Aircraft Specific Considerations
Following instruction, the participant experiences the information reviewed in the classroom environment in the GL-2000. He or she applies this knowledge while flying upset profiles. The profiles are organized to build up to the upset conditions. Each profile has embedded maneuvers within the flight profile that produce many of the conditions discussed in the classroom, thus providing criteria for evaluation.
10 . .l.2 Subject Schedule
Day One:
0800 - Informed Consent
0830 - Tour of NASTAR Center
0900 - Pre-flight Briefing
0930 - Flight 1: Familiarization
1200 - Lunch
1230 -- Flight A: Pre-evaluation
1430 - Academics
1500 - Flight 2: Aircraft Control
Day Two:
0800 - Academics
1000 - Flight 3: Upright Upsets
1200 - Lunch
1300 - Flight 4: Inverted Upsets and LOC
1500 - Flight 5: Evaluation
1630 - Graduation
1700 - Departure
11 RESULTS
35
Much like the physiological investigation, the dynamic and varied nature of recoveries made the generation of quantification criteria difficult. The most useful gauge of success in upset recovery is instructor evaluations of the events. This is due to the fact that judgments on the trainee's actions must be continually updated for both correct and incorrect actions throughout the myriad of flight conditions.

~~ ''1il'
36
Environmental Tectonics Corporation
Attempts have been made in the past to apply single variable dependencies to evaluation of upset recovery. These attempts have met with limited success. This is mainly due to the dynamics and large variability in recovery path possibilities. For example, the idea of minimizing altitude loss and maximizing G application as independent criteria for grading upsets. However, if in a nose low upset, if the pilot can minimize altitude loss with a lower G by slowing the airplane down, then the recovery can be just as successful but the criteria does not hold true.
11.1 Evaluation Profiles and Criteria Seven evaluation profiles were used to measure each pilot student's performance on the basic skills required for upset recovery. The evaluation profiles are a subset of the list provided in Table 3. NTSB Based Physiological Investigation Upset Profiles. The night conditions for the seven evaluation profiles are listed in Table 4. NASTAR Centel' URT Evaluation Profiles. The profiles are referenced with the prefix EVAL and their corresponding number 1 through 7. There is also a corresponding NTSB profile number listed for reference.
Table 4. NASTAR Center URT Evaluation Profiles.
Airspeed I Bank
Identifier Description ............ . ..... Pitch Angle Altitude
KIAS Angle (L or (ft) R)
NTSB·1 / Eval1 Nose Low· Upright· Low Energy 165 25 On 15 4000
NTSB·3/ Eval2 Nose Low· Inverted· Low Energy 180 35 On 120 10000 ----- ------ --,_._---------- ----------------- ------------ ---- ----.. _-,-.-._-- -
NTSB·6/ Eval3 Nose High· Inverted· Low Energy Low 40 Up 180 10000
NTSB· 7 / Eval4 Nose Low· Upright· High Energy 320 30 On 15 5000
NTSB·8 / Eval5 Nose Low· Upright· High Energy High 20 On 75 10000 ............ ..,
NTSB·9 / Eval6 Nose Low· Inverted· High Energy 330 20 On 110 10000 --------------------------- ------- ------ ----- ------- --------------------------------
NTSB·14 / Eval7 External Factors· Wake Encounter Low 20 Up 110 3000
11.1.1 EVAL1:
The 165 kts case is a stall recovery scenario. The airplane is given to the pilot following the stall break and has already started gaining speed. This is as close to a full stall profile as a full stall is not feasible in this type of simulation. A full stall cannot be maintained in a profile set up due to the fact that as soon as control is relinquished to the pilot, since the pilots are not holding the yoke back, the nose immediately falls and the airplane recovers on its own due to natural stability. The airplane is put into a stall during this set up for Eval 1 and the shaker does go off. As mentioned, by the time control is relinquished to the pilot the airplane has begun recovery on its own. The profile trains the pilots to allow the airplane to gain airspeed for an effective recovery
~<i \'~I
37
Environmental Tectonics Corporation -------------------------
and not pull the airplane into a secondary stall similar to what has been alleged to have happened with Colgan Air.
11.1.2 EVAL2:
This profile is an example of an extreme case where the airplane is at low airspeed, nose low and inverted. This could be the case during an incipient spin type situation or wake encounter.
Recovery from this event requires that the pilot demonstrate proficiency in unloading the airplane for roll, proper lift vector control in not loading the airplane until the lift vector is pOinted in the positive direction and proper energy management in adding an appropriate amount of throttle in order to recover from the slow speed condition while not adding too much given the airplane is already nose low and is prone to overspeed.
11.1.3EVAL3:
This profile is a worst case low-energy scenario. The airplane is inverted at a very nose high attitude. This particular profile is an example of what might happen following an instrumentation failure on departure perhaps complicated by tUI-bulence or a wake encounter. The airplane is given to the student inverted, nose high at low airspeed. This is the most difficult evaluation profile as evidenced by the repeated difficully found in effective recovery.
The student must simultaneously unload the airplane, continue the roll towards the quickest hOI-izon and apply full power immediately upon being given the airplane. The pilot must stop the roll rate to demonstrate bank angle for pitch control as the recovery from the nose high attitude.
The most common mistake is to continue to roll to wings level upright and push over the top to recover. Many pilots have done this incorrectly and immediately upon completion of the maneuver recognize their mistake. The program has been updated several times to address this specific area of training. Resolution of the problem was done via breaking up basic concepts as a "tools for the toolbox" concept. This includes streSSing the use of "bank angle for pitch control" in a nose high scenario as a basic tool that is then reinforced several times for varying types of upsets. The final training groups that were presented the material in this way performed markedly better in the Eval 3 profile.
11.1.4EVAL4:
Eval 4 is a potentially insidious event. The airplane is given to the student with a slightly low nose low and mild bank angle, which by themselves are not particularly dangerous. Left unchecked, however, the airplane will quickly transition through airspeed limits. This tests the pilots on the appropriateness of reaction times.

Environmental Tectonics Corporation
11.1.SEVALS:
The conditions of Eval 5 test the pilot on lift vector control during a nose low, high energy event. The airplane is a high but positive bank angle. The pilot must recognize that, although the bank angle is high, the aircraft is not inverted and immediate application of aft stick is necessary in order to alleviate an exacerbated nose low situation. The pilot must also note the excessive airspeed and adjust throttle appropriately.
11.1.6EVAL6:
38
Eval 6 tests the inverse of Eval 5. The airplane is relinquished to the pilot nose low, slightly inverted. The pilot must recognize his or her inverted condition and react by unloading and rolling to the quickest horizon. Once a positive bank angle is achieved, the pilot must transition from forward stick to aft stick and effect a safe recovery. This is counter to Eval 5 where the bank angle is positive from the beginning and the pilot must immediately load the airplane for recovery.
This is the second most difficult recovery in that it precipitates two common errors. The first is that the pilot does not recognize the inverted condition or executes poor lift vector control and immediately pulls. This will quickly worsen the situation. The second mistake is that pilot does not recognize that he or she is only slightly inverted and rolls underneath, which is contrary to rolling to the quickest horizon and again extends recovery time. In the worst cases pilots will make both mistakes by rolling '111 the wrong direction and pulling. This results in a classic graveyard spiral. Most pilots recognize this mistake prior to impacting the ground and though the recovery is very drawn out and exceeds both airspeed and structural limits, the aircraft is brought back to straight and level flight.
In the most extreme case, during training in a similar profile there was one instance where a pilot became totally disoriented and continued rolling and pulling incorrectly until the airplane impacted the ground. This pilot fell victim to a classic graveyard spiral incident. His reply was to question whether the simulator was working properly. It was not until the situation was explained and the profile rerun that he understood the ramifications of his actions. This illustrates the importance of this particular profile.
11.1.7EVAL7:
This profile is a classic example of wake encounter on departure. The airplane is at a departure flight condition at low altitude and is subjected to an uncommanded roll. When control is relinquished to the student the airplane has a roll rate towards inverted and by the time the student has time to react the airplane is almost 180 degrees inverted.
The pOint of this exercise is first to illustrate the effects of a wake encounter, even on a large aircraft. It is then further meant to reinforce the concepts of unloading to keep the airplane's nose from attaining a nose low attitude while continuing the roll in the same direction to affect a safe recovery.

/,~ll \-
39
Environmental Tectonics Corporation
Most students perform relatively well by continuing the roll with not quite enough of an unload. The result is a slightly nose low attitude which is then recovered from normally and safely using techniques taught in class. Students who recover in this fashion receive a score of 4.5 out of 5 as the recovery is effective and safe with little room for improvement. Approximately 95% of students recovered in this fashion. A few exceptionally skilled individuals caught the airplane early and unloaded sufficiently so the airplane simply rolled through nose level resulting in a nose level recovery that required no extra action. In these cases pilots did not even have to touch the throttle. These pilots received a 5/5. The remaining 5% of pilots recovered in this manner.
11.2 Instructor Evaluations All pilots were graded on their gross recovery technique during the pre-evaluation and post-evaluation. This was done specifically to provide a delta in performance between the start of training and completion. Each profile was scored on a scale of 0 - 5 as follows:
0- Total aircraft loss.
1 - Unsuccessful recovery. Improper technique, damaged airplane, injured passengers.
2 - Substandard recovery. Some damage to aircraft and/or passengers' injuries probable. Recovery techniques marginal and put aircraft in unsafe flight condition.
3 - Mediocre recovery. Damage to aircraft or passengers' injuries possible and some flight conditions still considered to be unsafe.
4 - Successful recovery. No damage to aircraft or passengers, however some skills still require improvement.
5 - Perfect Recovery. No comment.
There was an improvement in base score of 42% between program entry and program completion for all profiles. A breakdown of performance based on profile is shown in Table 5. Instruction Evaluation Summary. Red data denotes an average score of less than 3. Yellow is between 3 and 4. Green is 4 and above. There was only one upset that had an average score less than 4, which was the nose h'lgh case. This was due to a deficiency in training that was identified and fixed. This deficiency is discussed in the lessons learned section to follow.
Table 5. Instruction Evaluation Summary.
Profile
EVAL 1
EVAL 2
EVAL 3
Average Scores
Pre Eval Post Eval
Percentage Increase
In Average Score
30%
48%
54%

, ~tl\. , 40 ! 't. " .\,\",\.1/.
Environmental Tectonics Corporation -------
EVAL 4 3.25 Damage / Injuries Possible
EVAL 5 3.00
EVAL 6
EVAL 7
11.3 Post Flight Analysis Technique
54%
50%
56%
18%
Students were evaluated real time on their ability to recover from upsets, however, the availability of post flight data allowed for review of performance long after the students departed the training center. QuickPlot was again used for this purpose. This also allows for an effective means of breaking the recovery up by axis as necessary.
For instance pitch axis inputs can be evaluated separately from roll axis inputs when appropriate or both can be combined and manipulated simultaneously as can be seen in Figure 8. Multi-Axis Data for Dynamic Upset Recovery. This plot shows pilot input and resulting attitude angle for both the pitch and roll axis for a nose high inverted upset. The data shows that the pilot input aft stick while still inverted, which is an improper technique.
I,,;
';,i',~',.,<, "''-'.'"'''' j
'::_~' __ I~~;.~ ""0,._ /." j
Figure 8. Multi-Axis Data for Dynamic Upset Recovery.
"J:
·',i

,~+11 \' ~'J»
41
Environmental Tectonics Corporation
12 CONCLUSION The experiment was successful in both tasks. The physiological investigation clearly demonstrated the physiological effects of upsets on pilots. The increased levels of arousal appeared to correlate with the "startle factor" and the cascading of events which tended to lead toward task saturation and the selection of an inappropriate albeit previously learned skill during the recovery. Each pilot reacts with different specific reactions, general similarities exist that demonstrate how the pilot reacts to the upset.
Further the experiment clearly demonstrated the value added by upset recovery training. The overall scores for pilots following training were demonstrated to be s'lgnificantly higher than those prior to training.
12.1 lessons learned
12.1.1 Toolbox Method
There was a definite lack of retention of nose high, inverted recovery techniques in the early training groups. Despite being successful during training, several pilots reverted to rolling wings level and pushing to recover from nose high, inverted recoveries. To correct this situation, the academic portion of the URT was enhanced to better break down the techniques used for recovery. While changing the training mid-experiment is not preferred, it was decided that providing good training had a higher priority than experimental consistency in this case. The new training was highly successful as recovery scores for the group post improvement were consistent with other upsets.
12.1.2 Motion DiscomfOlt
Some pilots experienced various levels of motion discomfort. While this makes training difficult, it also provides a realistic environment for the individual. The majority of these pilots acknowledged that, while uncomfortable, this was representative of what they would feel in a real upset. This then challenged them to act appropriately under realistic stresses they would not have otherwise experienced.
12.1.3 Seeing the Upset Develop Provides Training Tool
As mentioned in an earlier section, pilots were required to watch the upsets develop. There was concern that this was negative training in that it alleviated the startle factor and allowed the pilot to anticipate the recovery prior to being given control. Neither of these proved to be true.
Startle factor is already greatly reduced simply by the fact that a training event is anticipated. Startle factor is maintained to the extent it can be in training by the fact that upset sets are dynamic and vary in length. The aircraft transitions several flight conditions during which time the pilot does not know when he or she will get control. These circumstances allow for an increase in startle factor.

Environmental Tectonics Corporation ------------------------
Potentially the most useful part of the sequence is during the set up with the aircraft transitioning a myriad of flight conditions. During this time the pilots are constantly adjusting the plan for recovery real time in preparation for being given control. This tasks each subject with quickly drilling on recognizing upset conditions and selecting recovery procedures real time. Several of the pilots corroborated this positive training aspect post flight, independently with no prompting what so ever.
12.1.4 No Pilot Left Behind
42
It is important to note that in no circumstance was a pilot allowed to leave the study after having performed an improper recovery. Following the conclusion of experimental procedures each pilot was given a critique if necessary regarding their performance. This was done to alleviate any pilot leaving the study with negative training.
12.1.5 Temperature De/ta Sensing
Skin temperature sensing has proven valuable on other physiological investigations and could be so in this sense as well. The cabin temperature of the GL-2000 has already been lowered by installation of devices to vent projector heat, which was the main cause of high internal temperatures. Another option to increase fidelity may be to measure cabin temperature and monitor for a difference in rate of change of temperature between subject skin temperature and cabin temperature.
12.1.6BP testing
BP data has also proven to be of great use in past experiments and would be useful here. By the end of testing the team had become more efficient in fitting the BP cuff such that the data would not fail off; however, synchronization and frequency were still problems. Updated hardware could at least partially solve both of these issues by wiring to a data acquisition system and being able to manually start a reading real time.
13 FUTURE INVESTIGATIONS
13.1 Optimal Recovery Path (ORP) There are many schools of thought on what constitutes an optimal upset recovery, including minimum altitude loss, minimum altitude deviation and maximum G performance to name a few. However, these are all single variable solutions. Several factors contribute to recovery flight path including aircraft performance, crew and passenger physiology and external factors.
Little research has been done to date on determining, through the use of hard data, the optimal flight path for upset recovery or how to measure such a flight path. Once developed, these optimal flight paths would be used as the bench mark for training pilots in upset recovery.

I{l~ 1~.1
Environmental Tectonics Corporation
NASTAR Center is uniquely positioned given our one-of-kind simulator technology combined with decades of physiology experience to conduct this research and implement it in a manner that will provide for a higher' level of safety for the airline industry as a whole. An in-depth description of this concept is provided in Appendix C: Optimal Recovery Path Concept.
13.2 Man-Machine Interface
43
An area of man-machine interaction that could greatly benefit from further research is the interaction between automated flight systems and pilots, Many pilots express surprise at what their automated or semi-automated cockpit does in upset conditions, and are unsure why those steps were taken, let alone how to counter the system's actions";. The inclusion of classroom instruction in automated systems, rather than haphazard instruction in the cockpit, would help pilots to understand what their autopilot is doing, and when to override it.
Studies have repeatedly indicated that pilots who fly manually are much more capable of manually recovering from unusual flight attitudes than those who fly using primarily autopilot";'. Further study is needed to determine the effectiveness of ground-based s'rmulator training in avoiding deterioration of manual flight skills in pilots, especially the deterioration of skills necessary to respond to upset conditions, A secondary focus of the study could be to ascertain the relative effectiveness of ground-based simulator tr'aining on experienced pilots, amateur pilots, and student pilots, determining at which stages of a pilot's aviation career simulator training offers the most benefits. Additional research could further examine the use of centrifuge and non-centrifuge flight simulators for effectiveness in training pilots, and again determine if their use is most effective on pilots in training or seasoned aviators.
Technology aimed at decreasing upsets has advanced greatly in the last few decades, and may be on the edge of a breakthrough. Recent advances in the construction of Aircraft Response Models for non-military planes may facilitate the development of automated collision and upset avoidance systems in commercial aviation. Although data has been acquired through wind tunnel studies and accident reconstruction, information on the behavior of commercial aircraft in various stages of malfunction or damage is still lacking. While admittedly a difficult flight regime to gain information about, the continuing occurrence of upsets and accidents due to malfunction and damage call for the development of an appropriate ARM. Advances in terrain awareness technology and global navigation data can also quicken the development of automated recovery systems for commercial planes by allowing aircraft to more accurately and more quickly determine the placement and altitude of surrounding terrain. By improving pilot knowledge of the surrounding terrain, commercial pilots can be enabled to avoid collisions and crashes further in advance and at reduced risk to their aircraft.
The standardization of commercial airlines' pilot training systems is also needed. With fuel and other operating costs rising, many airlines are turning to shorter, "express" training programs that give pilots certification in less time-and for less money- than before. Although certain aspects of training could certainly be streamlined, skimping on

,/,':
/I~~I. " tJ.'
Environmental Tectonics Corporation
44
training is a disadvantageous move in the long run. Pilots without adequate physiological training, classroom instruction in autopilot systems, flight hours, and unusual attitude practice are less likely to succeed in a manual upset recovery. A relatively uniform training program including upset training, unusual attitude, and aircraft malfunction training is necessary to allow only well-trained pilots to fly and thus help reduce aviation upsets and accidents. This program would likely include a ground-based simulator training component, but must also include adequate flight hours and classroom training. Standardization of international flight communication protocol, for example, between ICAO and the FAA may also decrease the chances of misunderstanding between pilots and towers, thus helping to make upsets less common.
13.3 GYROLAB vs. Hexapod (GvH) Experiment While the effectiveness of the GL-2000 as a URT device has been established, there is still the question of a direct comparison with hexapod type simulators. There is little doubt that the GYRO LAB family of trainers provides advantages over hexapod Simulators, however, to what extent has yet to be quantified. A one for one comparison with a Hexapod device is the next logical step in demonstrating and developing the GYRO LAB sel'ies of simulators for URT.
As demonstrated in the experiment described herein, there are two main avenues for investigation with regards to the URT research; physiological and training. The GvH Exper'lment should investigate both of the avenues to highlight the specific details on the physiological nature of pilot reactions and the big picture analysis of learning via LJRT itself.
13.3.1 Physiological Investigation A major factor that differentiates upset recovery from nominal training is the physiological, both mental and physical, stresses placed on the crew. These stresses include G forces, multi-axis accelerations and rotations that are not generally experienced during nominal flight. The human sensory system is bombarded with inputs that it is not familiar with during these events. This bombardment can be measul'ed as levels of arousal within the crew.
An investigation has already been executed that measures levels of arousal (stress) of flight crew in the GL-2000 during upsets. A similar investigation exposing flight crews to similar conditions in both the GL-2000 and a hexapod simulator would demonstrate directly that only GYRO LAB type devices can generate these stresses.
Some basic protocols of the investigation are as follows:
• 40 experienced airline pilots.
• Each pilot will fly upset series in both devices; half will start in the GL -2000 and half will start in a hexapod device.

~j I~I
45
Environmental Tectonics Corporation
• Pilots will not be graded in an effort to reduce external, non-flight representative pressures.
• The upset series will be identical for each device; however, the order will be randomized.
• Physiological measurements will be taken:
o Blood Pressure
o Respiration rate and depth
o Temperature
o Pulse / Sp02
o Eye movement
13.3.2 Training Investigation Next, an investigation into the effectiveness of full up URT will be conducted. A recommended group of 100 pilots will be used for this investigation. All pilots willl'eceive an identical set of academics as provided in the standard NASTAR Center LJRT course. The pilots will be separated into two groups. One group will be trained using a hexapod simulator and the second will be tl'ained using the GL-2000. Each group will go through an evaluation sequence before and after training. The results of the evaluation prior to training will be compared with the results following to illustrate levels of improvement.
Since pilots cannot be tested in actual aircraft, a creative ground based method must be found. Testing in either device solely would provide an advantage to the group tl'ained in that single device. The only other option then is to test every pilot in both devices. Hence, this is the currently recommended procedure. Half of each group will start in the GL-2000 and half in a hexapod to ensure that any advantage to using either device first is mitigated. Each pilot will again go through an identical set of upsets in random order. The results of the comparison of the two groups will illustrate the strengths and weakness of both devices. It may be logistically challenging to execute evaluations in multiple locations; as a result this approach may need to be refined prior to execution. However, at this time the solution described herein is the only viable option.
13.4 Higher Level Physiological Data Analysis It is possible that classical mechanical analysis techniques, such as frequency analysis techniques like power spectral denSity, could be applied to respiration, eye movement and pulse data. This could lead to more quantifiable parameters that could be tied more closely to aircraft performance, especially in the case of aircraft with digital flight control systems. This type of analysis would require a specialized avenue of study in order to be successful.
,(411
46
Environmental Tectonics Corporation
14 FINAL SYNOPSIS URT is clearly a pivotal and essential program in the realm of air safety especially given the fact that a high percentage of aircraft accidents are caused by inappropriate actions during upset conditions. Current URT programs neglect the physiological factors that occur during upsets that must be addressed in order to afford all pilots the knowledge and experience necessary to successfully recover from dangerous upset conditions. Full motion, sustained G technology, as demonstrated by this experiment, is the only method that can comprehensively and simultaneously provide the physiological and flight dynamic environments necessary for effective URT.
Follow on testing should be performed in order to refine the training methods and profiles presented here. The goal would be to more accurately characterize the subject dependent physiological aspects of URT. The experiment conducted for this report clearly demonstrates the validity of this approach and provides evidence that a larger more intense study will be of great value to the development of future URT.
APPENDIX A - TMl

~~. __ \I\e~'
47
Environmental Tectonics Corporation
Description Variable Name Type Units Remarks Elnpsed Tinw Time Continuous seconds Tin18 01i"tpsG(j clurjl~D previous Me 11"i3.lllo Fr,)!l1c>T Continuous SGcOJxls --Time olapsed dWIIlO prevIOUS CC fmme ccFranlO T Continuous seconds
Simulator StZlto Statt'} Disct'<?te Planet my Incromont;}1 Encoder· Ra\'J PtlncEncR,ru Discrete
Planotary Homo Disk PtHomeDisk Discrete
Rollincremenlal EncodOf' . Fla'.'.' RllncEncRaw Discrete
I~oll Homo Disk RIHomeDlsk Disero!G Ann Position Comn13nd aCllldPos Continuolls degrees
Aim De!ayed Comm.:tnd aOelCrndVol Continuolls dGgreos / S0C
Arm Velocity Command aCmdVol Conlin\lous d0grees j sec
Arm Acceieri"ttion Command aCmdAcc Continuous dogreos I sec' 2
Aim Actual Position ai\ctPos Continuous degrc'os
"' AIm Actutll V010city nActVol Continuous def)r00s! soc .£! .D Aim DnvG Cornmnnd aDrvCmd Continuous Volts
.'" Yaw P05111011 Con:mand yClllcJPos Continuous d('grB0s ~
'" > Yaw D£'by(·d COIl1Ill"nd yDelCmdPos ContlllllOlJ$ d(!~.irG0S i sec
2 Yaw V010city Cornnli1nd yCnldVel Continuous d8Qref:S! SGC
C Yaw Accoloration COillnland yCmdf\cc Continuous d0gro0S i soc'? 0
0 Yaw Actual Position yActPos Coniinuous d(c.'~J!ef:s c Yell'.' ActuJI V"iocity yActVel Continuous dG9I0f:'S i sec 0 .-15 YtlW DrivG Comm;lnrl yDrvCmci Continuous Volts 2 Y,l',',' T')cl1ol11ot(,1 yT;lCh Continuous FlPf...1
Pitch Position ComlnJlld oCllldPos Continuous degr~!es
Pitch D()lay0~1 COilllnz;iK! pDolCnx!Pos COflimUQUS d09r88S' SGC
Pitch Vn!ocrty Comrnilnd pCmdV(:,i ContinuOI,ls deSllces ' sec Pitch /\ccelol'alion Command pCmdJ\cc Continuous dGgr8GS,' 58(:"2
Pitch Actual POSition pActPos Contlnuoll:, dG\j10(!S
Pilch f\clLJ.J.1 Volocity pActVGI Continuolls d(?grep.~, ,: soc Pitch Orlve COl11lnlind pDlvCmd Continuous Volts
Pilch T:1chomG[()r pT':lctl ContinUOlls FlPM I~oll Position COl1lln3nd rCrndPos ContinuolJs d(~qr()C's
noll D81aY0d Comrt13nd IDoJCmdPos Continuous de91"0l)S i SDC
f-loll VoIoclty Comnl,lI1d ICn1dVei ContinuOlJs dO~)!80S i soc ~lol1 Accni(:fLl110n Command ICrndAcc Continuous dl'9f0l'S i soc"·2
Roll Actual Position rActPos Continuous dOQf00S
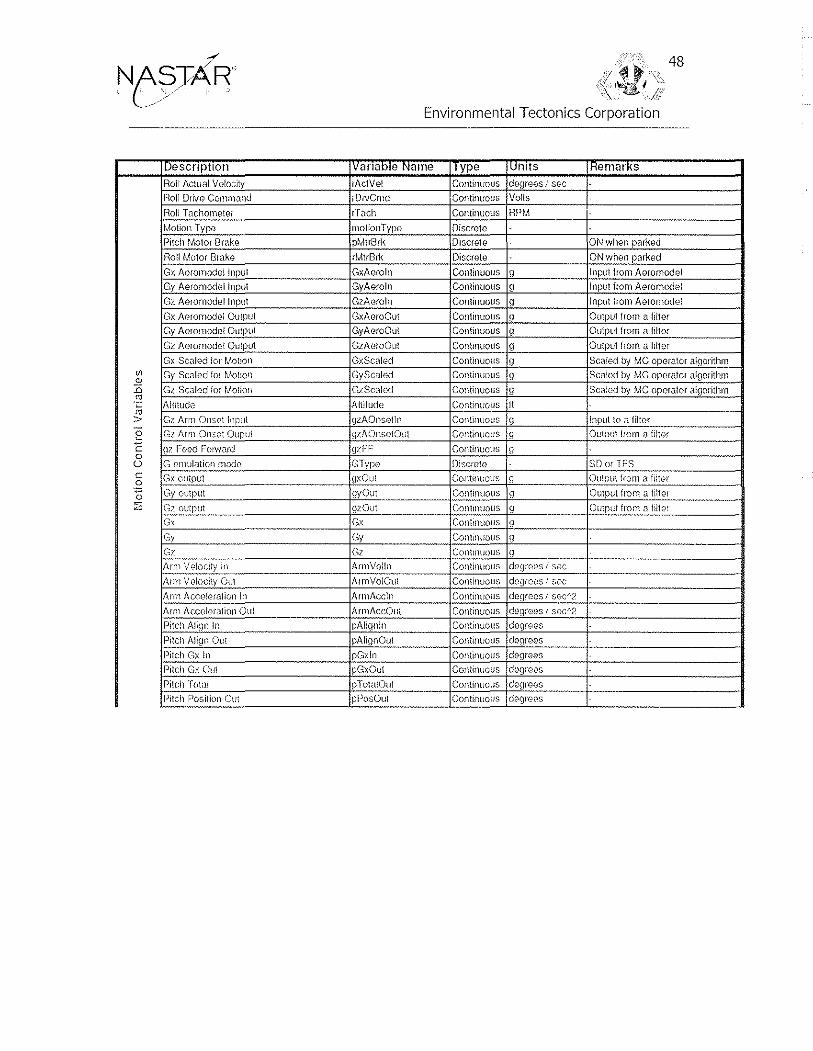
uescnptlon Roll Actual VeioGity 1:1011 Drivo Command
Roll Tachometer
Motion Type
Pitcil f<!iOlor Brake
Roll Motor Brake
Gx Acromodollnput
Gy Aero11looellnput
Gz AeronlOdellnput
Gx Amol1lodel Output
Gy Amoll1odei Output
Gz AGlomodei Output Gx Scaled lor ~Aotioll
<I> Gy Scaled lot MOtiOIl
'" :0 Gz Scalod lor Motion ,,,?
Allilude m > G;:: Arm Onsot Input
'0 Cz Arm Onset Oupul
c \]l F0ed FOIw.'JJd 0 U G 8nlulatiol1 modo c Gx output 0
0 Cyoutput
~ Gz output
Gx (' ,.,y
Cl Aim Vo?locity In
Ann Velocity Out
Arm ACCl~le!ntion In
Arm Acc(~ll'r3tiOIl Ou!
Pitch Aliqn In
Pi!el) Align Out
Pitch ex In
Pitch Gx Olit
PilCh Total
Pitch Po~,ition Out
1l~ ''iiI
48
Environmental Tectonics Corporation
IVanBOIe Name ype IUnlts IRemarKS rActVe! Continllous d8gtoes / sec
DrvCrnd Continuous Volis
rTach Continuous FlPM
mOlionType Oiscrete pMlr8rl, Discrete ON W11'811 par!~ed
rMlrBrk [)iscr(~te ON when parked
GxAeroln Continuous 9 Input from Aoromooei
GyAeroln Continuous 9 Input from Aeromodol
GzANoin Continuolls 9 Input flom Aeromodel
GxAeroClut Continuous ') Output from 3 filter
GyAGroOut Continuous 9 Output from a filler
GzAeroOut Continuous 9 Output from a flltor
GxScClled ContinuOlls 9 Scaled by Me operator algorithm
GyScaled Continuou" 9 Scalod by Me opemtor <1lgorithm
GzScaled Contilluous 9 Scaled by Me opmator algorithm
Altitudo Continuous 11
gzAOnsetll1 Continuous " Input to :]. liltor
~)zAOnsetOlit Continuous 9 Output flOm ;.1 filter
~VFT ContillllOllS 9 GTypo Disc-!0te 3D or TFS
W<Out Continuous ') Output from R hila!'
9yOui ContinUOlis ~J Output from a fiitor
~)zOut Contlnuolls (I OUlput from [l flite:
Gx Contim:olls 0 Gy Continuous 9 Gz ContlrlUOU" 9 ArmVeiln Continuous dewees i S(K
ArntVolOul Continuous deglce",' so(;
Ar'll1Accl1l Continuous dGO!'ccs / ,;(]c"2
ArmAccOul Continuous (jG\lfEleS i SGC"2
pAlignln Continuous dGQr00s
pAII~!nOut Continuous degroes
pGxln Continuous degrcGs
pGxOut Continuous do~)m(,,~;
pTo!alOut Continuous degrG8S
pPosOU! Continuous d09 1'C0S

Descnptlon
'" Pilch Velocity Oul
" :0 PilCh AccelerJtIOn Clut
" .;: Roil Align In
" > Roll Align Out 0 Roll Gy In
" Roll Gy Oul 0 () Holl Total Out c Roll Position Out 0
0 Roll Velocity Out
=" Roll Acceleration Out
Elapsed Time Pitch Anglo
FIoll An910 HE'iJding Angle
Nx Nz Ny
'" AII"speod SI! .Q Aililudo ro .;::
L3ttiludo ro > Lonqitud0 IV
Slick Pilel"1 ;! iii Stick flail E
Huddor
" ~
" Pitch trim up ,;wilcil
0.. Pllc;h him (10)1.'1\ s",',l!\ch
['l Holt jilin loll SWitch
::' Holl trim flOt"l! switcil
qo liuddor tJlm tell switch
F\uddGf trim right switch
pOrCOnl3.QI)
pefc0ntagG
bndmg gIWI- position I:.ommzmd
1811dll1g }]\Xlf position comm31ld
f:!,lp Comm~nd
Speod br ~lkl\ c0nmWild
:~ !Ii l"fll Environmental Tectonics Corporation
Variable Name Ilype I Units KemarKs
pVolOut Continuolls d9gmos/ soc pAceOu! ContmuQlIs deweosf soc"2
I'Alifjnln Continuous degrees
rAlignOu! Continuolls (jegreos
lGyln Continuous degrees
rGyOut Continuous dogreos
rTotalOut Conlinuolw dggle!?s
rPosOut Continuous degrees
rVelOut Continuous deQreesi soc rAccOut Continuous dOW0as i see2
Elapsed Tln10 Continuous seconds
Aircraft Pilell ContinuouS dGgle!?s
Aircralt Floll Continuous degrees
Aircr~ljt I--leading Continuous deqrees
Continuo liS
Continuous
ContinuOlls
AHSp80d ContlnuQus KTAS
Allitucio Continuous II
Lnlt!lucfo ContinUO(l$ dO\lfCr:S
l"on~)ltlldG ContilluouS c!egt"('>{)$
Slick Pitch ContllllJou~; p0rc<~nt
SliCk Holl Continuous pE~rCGnt
Fludc!0r ContinuOlls porconl
Pitch Twn UP DisCf(\19
Pitch Tr:m DO;'.'n Disnetr:
noll Trim Lefl Dlsct"2t1?
lioll Trim flight Discwt0
F\uddor Trim t..r:'ft Discn:%
nuddor".Trilll .. Right Di~'cto/(.?
ThroUlo Loft Continuous
ThrottlE' __ Right Continuous
Landin\) G8"f Loft DIscml0
Landing Goar !~i~Jht Discrote
F!i1ps Discr01e p~\rCQnl
Ail8rakG Continuous percent
49

50 /~~
I, I\<i.~'
Environmental Tectonics Corporation -----------------------------
escnptlon ana e ame nits tiemarKS
5mb Trim ni!;!"ll Ccnilflllc.tl:, ~IS~"c~0dc""'r'~tC,"1"'POscc;,i--CG----------------r----------------jc(o>CC,""c,!i=u=o"u",-r------------t--------------------------I IFL:lp positj·::;n Cc·nlinuc·us dG'gr.?2S slab do~!oc\lor: COnlH1u')u~< dl.'nf·?(!B
~'""u"-·;ctc"-'c"I·?ci'c,,,c:-1ckc;;c! ~ ______________ ' __ ' ______________ -I.;ccccn~li-'m""C~,lc"'-, 1''':j(")(C~f':CC''':S ______ +-----------------,----.. 2ifGiOn c!l:;i!«ci>:::on k .. :1 CNltmUGUS ,jGGW~S
;;jj,;~\!n (j(;fkclkm ri(:,'-.l CGntdlUC'llc: dO\jI')8S
U - bn0:1ucj!\~tI VQiod:)' CUlt;nU(>ll&
-~' - Cont:nue-lls Cc-ntinuous -----------
i::!c<:>d 1';';.:,- iii:) ;1,' d flu'::,,:, IEP:':\li:,O
I,:":.:",:i, ,,-",,,=","'= c!"'-' _________ I.~~.~:~::~.:~., ..

51 1~-11 \~
Environmental Tectonics Corporation ----------------------------------------
APPENDIX B - UPSET PROFILES
Identifier Type Description t.,irsp2 KIAS Pitch Angle
",an" Angle
IL or Rl
Altitude (ft)
NTSB,l i Evall NTS8 Nose Low, Upri(iht, Low Enerqy 165 25 On 15 4000 NTS8,2 NTSB Nose Low, Upright, Low Energy Low 25 On 70 15000 NTS"ij-'"3;' Eva!2 NTSB Nose LO\v-::-fiWerted-::To·\v-E1lGfQY-----180~~·~'· 3KOn --- --- ------, 120 ·,·------10000-NTS8-4 NTS8 Nose HiOll ' Upright - Low Ener9Y 170 40 Up 10 10000 NTS8-5 NTSf) Nose Higll ~Upright, Low Energy Low 40 Up 60 15000 NTSi3::tiTEvai:i N TS8 NoseTIiiiTi-::TriVertec1~ToW-Eiieigy [0\,,-400-,,----- Tao---- " iooOo--NfSj'J:] ! Eval4 NTS8 Nose Low - UpriOht, High Energy 320 30'bn 15 5000 NTSB,8! EV815 NTSB Nose Low - Upright·~ High Energy .... High ·20 On T5~'-1 OOOO~ NTSB-9! [valG NTSll Nose Low - Inverted - I-ligll Energy 330 20 On 110 10000--NTSB~O----- NTsll- NoS0-Rjqii~-ul)ii(jiitHT9l1 Enerr);;-- 31 0'1~;01) 30--WOOO ~J 1 NTSEli'jgse Hiqll - LJpnqht - Hiqh ["orgv . Iliqh __ ~5Jip __ , __ .:..:::::60,~~_=:~ lOOOD NTSB- 1 2 NTSB Nose Hiqh - Invert~(L:.11lUIl..Ener\ly High 45 Up 200 5000 uTSB:n_____ NI".fi .... Nose Down:.ldJ~iglll:Hlgll_E,n()rgy 360· ;2g[)n ______ ~i~- 15()OO NTSB,14! Evali _ NTSB External FaclgL~,:.Wal(e Encounter Low __ 20 lip __ _ __10_ ,_i2.~ NIHJ-HE: 1 ,__" Tralnlng_ Nose 1.'IIQll . .::..lIJ2£Il!llt - Iliqh ["1.0ID1.,., 300 :'0 Up ___ .lh-- __ _ 100o_° __ i'JH,U-HE-.~. ___ Tralrll,il£L No_s-"H'gl_' .. lIpnqllt - Hiqh En8J:ill' __ 30o __ . 20 LIJl...~4"-~-- _ 3600o __ _ UI1:.LJ.H.~ .. 3 .............. Tralll'~g .. !':J.Q""JilgllLJP!1911t 1:ligll[:nergy .. :30.9 ___ 4!jl1Jl ........ 0 36QO~ NfI,U,HE-·j Traininq Nose Hlqh - Upnqht - HiOll Enerqy :300 45Up 4" 36000 NHIHI[~5- lrainlllg NoseTffr)h-::Opr;ght. !Iigh Frhifgy- :330······ 26Ul1 10 ··36000--f\JFTlTTTE':'6~'" -'(r~a-ining N~oso 'T~r~jh~'~Tji)i~i·g}1T~ H-i~ih-E!lGi"gy 339 __ ~-__ ~- ~~~~~.Qi?:::_ __~jL-_.... 36000 NH, U, HE -7---' fri1iiim(J No;ioTiigl1: Upright· Hiql1 -Eneigy- 330 45 Up ! () 36000 ~F:FiE8__Ir2,"1111j) Nose tll()h -Llt~IOlliJQ()iiC~0i:8}-' -- 33i)~ 4'iiJp . __ :ES_ ... : 36Q()(l:-_~_!,:.l.-_l.-.l~}_r::~ 'I __ Traininq Nose _.I li9h ___ " Uprigtl,t, -, L_CJY~ EllBrgy 1 GO 20 Up 0 _5(.~9Q._,_ .... NHU C [2 !r';IIl'I~g Nos" Ilrqh :~CfI)riqi1l:LO\"E [lorgy . 1 GO 26UI1=:4'i____i!iO'OQ. NH-U,LE3 ___ Training NOSoJ:!'gll~lJpliDllt· Low EnorrJY ~22 ____ 45lJ)l___ . _0 ___ ._,_2°00 __ _ NH-IJLE·4 Traininq Nose Higll - Upriqht, LowJ,128rOX, 160 45 Up 45 5000 Nl+U[E~5_ .1I<l11~il£L No",,11r911:lJJlIIgI1t::lo"C_~2GJ(iL 185 ·~iJtJJl----O---- 5000 t:JU:.LJJcE:t3.__ Training Nose Hiqll - Upnqht - LowI'l"rgy 185 _~'-__L4.5_._ .... _.... 5000 NI+U,LE,1 Tralnin9 .. Nose Hlqil ' Upnght - Low Enerqy I+~~_ 45IJp L~5 _____ ;~~~_ .i'J.f±.LJ:1E~8_ T r",llrQ9!':J.Q,;e11lU1l:_Ullnglll:L()viEnergy___ 4 5lJp ...~ ___ _ NH 1J.:lE.c1 ........... TI"'n019_ Nose Iligll:Jrl~Qrt~(jlirgILEn.ergy 3QO_2Q.l!1'-_ .... 90 3609° __ NH-I-HE-2 . Tralnlnq Nose Uigh,:_lnvorind ' High Energy_, 300 20,UJl_ , __ , 120 ___ .~60()0 NIHHE<J Trarnrng Nose Hlgll - Inverted, High Energy 300 45Up 90 36000 Nln~il~:;i lraiiiriig Nose HI(iil:lIiveiied:TilgfiEiier(JY 300 451I1i---- .120 36000 NIHHE-5 Tr~~NOseHlgh:iiivelled ·llIgll [nOigy --330--20111;----- 90 36000 ~'HE:i; Trainino Nose Hlgil -Inverted - I <rnllE-ii-croY 330 20 up-·""-""~120---' 36000 NH,I,HE-7 Tralnln;;- Hose High, Inverted -High Energy 33o"'-··45UIJ 90 36000 NHI:PIil ..- Traiiilng-NoseT1igil:iiivciiedfTIgliEnergy-- 3304STJp '2.20 36000 NH,I-LE,'I 'fr:aTriing Nose Higll··lnv011ed, Low Energy 160 20 Up 90 5000 NH,I-LE-2 ""'[raining Nose Higii-:Tiilierted - Low Enmgy-··- 160 20 Up 120 5000 NH-I-LE:-j----- Training Nose H-igTi""~ Inverled - Low [nerqy 160 ,is· lip 90 - 5000 i'j!rLLE-4--- Trainmrr:NosefIT(iil~inve;tecIl()\"-En(;;q;;- 1 60 .... 45u6--12o 5000-NIHLE-5 Tralninq Nos" Hiqil - Inverted - Low Energy, __ 1Q.S__ 20 Up 90 5000 NH-I-LE-6._ T ralnirJ9_ NoseJirgll,:lny"rt.e_d- Low Energy ____ l85 ____ . ;>'01J1l.._ .. .1_~, ___ @_()!J_,_ NIHL~:L................ TrainillQ. Nos'!Ji19h - Inverled -, Low.IQ()rgY __ 1Q.5 __ 4_~LJJL, ____ (l0___ ... ;;O~_ ~~E'8 __ Trainillf! No"e High -Inverled - Low Enerery 185 45Up 120 5000 f'jL-IJ-HE-1 TraininSL Nose Low - Upricr!lt_:J:liqh Enerqy 300 20 Dn 0 5000 NL,U,HE,2 Training Nose Low - Upright - Higll Energy 300 20 On 45 5000 NL·U,HE,3 Training No;;" Low, Upright- High Energy _ .. 2QQ_ ·45 On 0 5002_

I~~ .I f~""'6r I .\ ... ~ --
Environmental Tectonics Corporation
NUHIE·4m~. Trainill\L Nose Low.:1I2righLJ:ligh.E~~"'ill'. 300 45 Dn 145 5000 NL·U·HE·5 TraininQ Nose Low· Upriqht· High Energy 330··-205;;··· 0 5000 NL·U·HE·6 J:i:<>irliDR Nose Low· Upright· lii911 [n"'flY 330 20 Oil ..... _ ... 42.. 5000
52
NUJ·HE·? Training Nose Low· Upright· High Energy 330 45 Dn 0 5000 NL·U·HE·8· Trainin,) Nose Low: Upright· High E·r:;ergy ·330- 45··0ii~~-·-145~ 5~o+ooc--1 NL·U·LE·1 Training Nose Low· lIpllgllt· Low Energyi60~·-20Dn-··o~--~~~ 5000-i'JlJ:I:!..~·2..... Training~ Nose Low· Upright : .. ~?~v.Energy 160 20 Dn .. ~~ 45 ~~ 5000~ 'NL·U·LE·3··- Training Nose Low· Uprigllt· Low Energy 160 ·'·450"· ·0····· ... ~.~ 500~0--~ NL· U·LE4 Training Nose Low· Uprigllt .. Low Energy 160 45 On 45 5000 NL·U·LE·5·~~trainillg Nose Low· Upright· Low Energy· 185 20 Dn ······0····· . ·5000 _. N[:[HE·6 Training Nose Low· Upflgiij: Low Energy ·-ifis·--;'015n-· 45 ._.- SOOO' NL· U·IJ.:1.~.... TraininQ. ·Nos.". Low· Uprigllt· LowEn.",.m' __ 1I3~:~:= :'15 DD. O .. ~ . .5.09Q_ ... NL-U-LE-8 Training Nose ~~~I:Y:' Upright - Low Enerqy 185 45 On '15 5000 NL·I·J:lE:.L_~~.. Tri'~lir,g Nose Low· Inverted· High Ef1E)rgy .. 3o.O .. u20...Qr,-_.. 90 3.§.Q()O~ ~:.L~f::.L __ Trairlr1'9 i'J.""-" Low.:Jrlvelt"ci:.ijlQh Enerqy :J.OQ....~ £Q.I)1.1.120_ 360.Q(). NL-I-HE-3 Traininq Nos.9 Low - Inverted .. Hiqh EnerQY 300 . .:!.§~PJl_. . DO ._._._~ 36000 .~ .. i'JL+HE·4 ....... Traininq Nose Low· Inv.llLted· Iligi1..£r1(Jrgy ... ~ 300._ 45.Qn.. ........ J.20 .... ]6000 _. NL·I·HE·5 Training. Nose Low·" ln~.erted . Hig11 Energy .. ~3q_~ 20 Drl,._.. 90 36000 NL+HE·6 Training Nose Low· Inverted· Hiqh Energy 330 20 Dn t 20 36000 NL·I·HE·? . ·Training Nose 1..·01'1: Inverted High Enm(iy 330 4(i~Oii- .... -~-~ 36000 -NL·I-HE-8 Trairling Nose Low·- Inverted - Hiqh EnGr~lY 330 ...... 45 On .-~ 12'o~----- j6~()OO
NCT-I[~"r . - -- Training Nos~J~~01verte-a":'To-;;;;~E'r1e-r-g:;; ---~~~:_~QJ.?:~~--- . ___ !~ ~~,"_ .. ~_ 5000 ___ ,._ Nt-! LE·2 Traininq Nosa Low· Inverted - Low [nerDY 160 20 Dn 120 5000 NLTt:E:3 ... TraTiiltiii Nose LoW-:-inverledTo;;iTCileiij\i 1.§l1.1soii .... ················;56 ····················~;666
NC-TiJ~·~'4 '--'--TramTng Noserow.Inve'rf8d~o\0 Energy 160 45 f5ii ,-.. T20----~5000'"~· NL-I·-LE·~) Training NosoT-o\v-lrlvorteci- Low [:"11crgy---·18G----··2cnSr1"· _._.,,_-,1~1() 5000
BI~TTE~6=~= jral~rriiNose Lo,.;i~]l1~e~iiicfLovl~[lie;gy= i~,,-_~ illi[Jri ...... t.120~~_ .. ,,009 .. . NL-I-LE-l Traininq Noselow-Inverted - Lovv [nerqy 185 ,15 Dn 190 §.9.,Q,Q __ _ N L ·1~J.--8-=,~.~:~:_~.-=,~ Iii:~ r~jo~s·e .. 'Lq'\;;":~li~:~r:0&~~l~Q~J:i~q~l.y:.- : .. __ _ L8S __ <1 £.1 r~n -:--.... ______ l~. __ ... -' -' f'OOO __ _ OEp·1 T .. D·t· "t·1I Osclilatrng Oscillalino 36000
taHltng epdf ute 0 d i +20 to -' 40\ .U.Q~45L __ ;-~;~;--.. !Tr~~~;i~19 Departute ------------.. - .. , .. -.... , Spin ---- -~.~~ijt~~I~l-~-;;---· ~~)C~II!\~;lg 36000

.,. 53 4!.~ I~~fr,
.\ ~ ! Environmental Tectonics Corporation
APPENDIX C - OPTIMAL RECOVERY PATH (ORP) CONCEPT
1 BACKGROUND
---
Upset Recovery Training (URT) has been receiving much wider attention in recent years given statistics that suggest that major forms of aircraft accidents have been reduced except for recovery from upsets. Given the expansion of training the question has become how should recoveries from upsets be graded?
2 EVALUATING UPSET RECOVERIES Until now, the classic criteria used have been simple scalar values such as minimum altitude loss, minimum maneuvering and observation of aircraft limitations to name a few. While these criteria provide a good starting pOint, modern methods of data monitoring allow for a more rigorous examination of optimal recovery techniques.
2.1 Overall Grade The old aviation adage that "any landing you can use the airplane after is a great one" also applies to upsets. If a recovery results in return to level flight while maintaining aircraft limits and no casualties that recovery is a successful one. If the recovery results in injuries to passengers and crew or aircraft damage then it is deemed unsuccessful.
2.2 Recovery Quality: Optimal Recovery Path CORP) Once a recovery is deemed successful the question can then be asked, "How successful?" A successful recovery denotes meeting a minimum set of criteria, however, there is an optimum set a criteria that denote a quality of the recovery. This optimum set would define an Optimal Recovery Path (ORP) against which a pilot's recovery performance could be compared and assessed.
As no pilot can be expected to follow an exact path through the sky there is a level of acceptable deviation from the ORP. This deviation is broken into three zones, good, satisfactory and un-satisfactory. Good is defined as maintaining ORP within 10% deviation, satisfactory is 25% and un-satisfactory is greater than 25%.
2.3 Defining the ORP The ORP for each upset will be unique. The ORP is defined as the best flight path vs. time for recovering from upset conSidering the following in order of priority:
1. Injury to passengers and crew 2. Maintenance of aircraft limits 3. Deviation from altitude

Environmental Tectonics Corporation ---------------------------------------
4. Passenger Discomfort
The ORP is then converted to control inputs for coaching the pilot.
There are two methods for determining the actual ORP for each upset:
1. Empirical 2. Analytical
2.4 Empirical Determination of ORP ORPs can be determined empirically by having experienced aviators perform a number of recoveries from a given starting condition. Those recoveries can then be combined with pilot comments and knowledge to create a consensus on the optimal path.
2.5 Analytical Determination of ORP Given a sufficient fidelity aeromodel, the ORP can be determined analytically through implementation of automatic recovery systems and further through optimization methods such as Genetic Algorithms (GAs). This investigation will approach the detel'mination of ORPs through two stages utilizing first a deterministic method and secondly using a numerical optimization method.
2.5.1 Stage I - Deterministic
The deterministic method will use a predetermined set of conditions to determine the appropriate actions to recover from random flight conditions. The basic rules provided to all pilots for recovery w'tll be coded as software and integrated with the aeromodel to generate the ORP. While this method will be effective for implementing known criteria it is limited by the criteria itself.
2.5.2 Stage II - Numerical Optimization
A numerical optimization method, such as a Genetic Algorithm (GA), will allow for a much wider range of potential solutions for each recovery. The challenge will be to properly establish the optimization parameters, methods and functions to provide for an optimum and flyable flight path with a reasonable amount of computing power. This will be done using in-house expertise and experience with numerical optimization.
2.6 Implementation The ORP will be displayed on a graphical representation as shown in Figure 9. ORP Visual Display. This plot will be updated real time to depict the student's flight path and control inputs to provide a comparison to the ORP. This can then be used by the instructor real time to coach the student as well as during de-brief for further instruction.

3 CONCLUSION
/! ~···~I·· .... '''''""".' . '\ ""'"
Environmental Tectonics Corporation
Figure 9. ORP Visual Display.
The aviation industry has been looking for an effective method of grading and instructing upsets. The ORP is a reliable and repeatable method for providing a higher level of standardization and effectiveness to Upset Recovery Training.
55

~
t'l ,f\~JA R, C~
! ~.~' '> I,",~ I >\.,.-
Environmental Tectonics Corporation
APPENDIX D - INDUSTRY SURVEY: UPSET WARNING, AVOIDANCE AND AUTO-RECOVERY TECHNOLOGIES
56
There are several potential technological updates that can assist in reducing losses due to upsets. These include collision avoidance systems, attitude awareness devices, automatic flight control limiters, and automatic recovery systems.
1 COLLISION AVOIDANCE Since the late 1990s, national and international aviation authorities have become increasingly concerned with the quality and prevalence of up-to-date terrain awareness and avoidance systems, and upset warning and automated recovery systems. This renewed attention comes partially in response to the continuing presence of Controlled Flight Into Terrain (CFIT) incidents, avoidable upset incidents, and other avoidable air accidents, although the systems' use in instrument landing and take-off procedures also plays a large role. In 2005, for example, approximately a quarter of fatal mUlti-engine aircraft accidents in the United States were attributed to CFIT, killing one-hundred-andsixty people that year";". A relatively high number of fatal crashes are additionally attributed to pilot loss of control in a mechanically functioning ailuaft. Some of these cr-ashes could have been avoided with proper use of the systems outlined in this section. In the last six to seven years, regulations regarding the installation and use of technology aimed at preventing these "avoidable" accidents have increased both in number and stringency.
The United States Federal Aviation Administration (FAA) has classified examples of such systems into Class A, Class B and Class C types; Class A systems are the most advanced, featuring a visual display with the status of wing flaps and landing gear, radardetermined altitude, a map display, and centralized air data. Class B systems are not required to have a visual display, show the position of landing gear, or determine altitude using radar; however, many include a display and show altitude derived from other data sources. Some types of aviation systems also are available in Class C, the most basic configuration, but many are available only as a Class A or Class B system.
This classification system has been adopted almost universally, and rules regulating the use of these systems have become more and more stringent, a positive development for air safety. The European Aviation Safety Agency-previously the European Joint Aviation Authority-mandated in 1999 that all European registry aircraft with a maximum take-off weight (MTOW) of 12,500 pounds or greater, or more than eight passenger seats, be equipped with a Class A Terrain Awareness and Warning System (TAWS) by October 2001. The Federal Aviation Authority (FAA) ruled that by ~~arch 29, 2005, all turbine aircraft with more than five passenger seats must possess at least a Class B TAWS system, and that all aircraft with more than nine passenger seats operating under Part 135 must have an approved Class A TAWS system. The International Civil Aviation Organization (ICAO) similarly requires all international carrier aircraft with a MTOW of

",I}) ,'till Environmental Tectonics Corporation
57
33,000 pounds or greater and thirty or more passenger seats to be equipped with TAWS. In both North America and Europe, nearly all turbine aircraft manufactured in the last five years have been factory-equipped with TAWS, a trend that is even gaining popularity among general aviation aircraft. There is additional speculation that TAWS will later be required in smaller and/or piston-powered aircraft by the FAA.
Ground Proximity Warning Systems (GPWS) have been similarly mandated. Since 1974, the FAA has required GPWS on large airliners, and even some aircraft operating under Part 135''', although regulations regarding smaller airplanes are only now becoming widespread. Since 1999, ICAO has required GPWS in all international operations where the aircraft MTOW is over 12,500 pounds, or the aircraft possesses more than nine passenger seats". The FAA has required such equipment even in small international operations since 1998, and the European Aviation Safety Agency recently standardized its requirements I'egarding GPWS in European-registered aircraft. Not all such requirements, however, apply to domestic operation aircraft; an exception that many in the flight safely community allege is unjustified and dangerous.
Traffic Collision Avoidance Systems (TCAS) have been required in many aircraft by the FAA since the late 1980s. All aircraft with between 10 and 30 passenger seats are required to have the more basic TCAS I, while larger aircraft with more than 30 passenger seats need the more advanced TCAS II. The European Aviation Safety Agency (EASA) of the European Union, as well as the Australian Civil Aviation Safety Authority (CASA) requires TCAS II or an equivalent system in all aircraft with more than 30 passenger seats. Regulations on older electro-mechanical devices are essentially universal, while regulations on new technology-Ground Collision Avoidance Systems for example-are non-existent. Terrain Collision Avoidance Systems are required by the FAA in commercial operations where the aircraft's MTOW exceeds 33,000 pounds"'.
1.1 Warning Systems Electronic warning systems aimed at avoiding CFIT, traffic collision and upset conditions have a long history. In the 1960s, Canadian engineer C. Donald Bateman created the first Ground Proximity Warning System, and by 1973 they were mandated for all USregistered planes by the FAA. Older warning systems rely on electro-mechanical devices, while newer systems incorporate saved data with more traditional GPWS technology. Traffic collision avoidance systems depend on in-air radio use for its required data.
1.2 Traffic Collision Avoidance System (TCAS) Traffic Collision Avoidance Systems are designed to help avoid mid-air collisions between multiple aircraft, and have been widely available for commercial aircraft since the early 19805. A series of tragic mid-air collisions in the 1970s spurred interest in the system, which works independently of air traffic control, and can thus function when a control tower is down, or the controller has stepped away. These systems rely on radio interrogation of surrounding aircraft at a particular frequency. The involved aircraft communicate their aircraft, bearing and range to one another, allowing their TCAS to

58
Environmental Tectonics Corporation
build a visual image of surrounding aircraft, and warn pilots of potential collisions, recommending actions to avoid them. These systems not only help pilots avoid mid-air collision and aircraft damage, but also allow pilots to safely maneuver away from impending collisions with the maximum possible time to spare, instead of being forced to quickly execute a drastic evasive maneuver and possibly enter an upset condition.
1.3 Automated Ground and Terrain Collision Avoidance Systems
Automated collision and upset avoidance systems 'lntegrate technology from the previously described collision and upset warning systems with electric and electronic aircraft control systems. These advanced systems take over control of the aircraft in the case of an impending collision or serious upset, flying the aircraft back into a safe flight situation before relinquishing control to the flight crew. Originally manufactured for military aircraft to protect pilots suffering from G-induced loss of consciousness (GLOC), these systems generally combine TAWS technology with knowledge of the aircraft's safe flight envelope and a method of aircraft control, such as an autopilot system.
1. 3.1 Existing Prototypes
The most advanced prototype of a GCAS has been built for the United States Air Force's F-16D through an industry and joint Swedish Flygvapnet (Air Force)/USAF effort"". Auto-GCAS system prototypes are also being developed for the F-16, F-22, F-35 (Joint Strike Fighter), and JAS-39 Gripen"i'i. Military fighter operations take place in aircraft with large airspeed and G envelopes, excellent maneuver'ability, and copious amounts of engine power. They also often involve prolonged periods of flight at a mere 100 feet above terrain, exposure to potentially incapacitating G forces, and use of aerobatic maneuvers. These conditions make military flight especially well suited to the use of GCAS. Additionally, there were already well-tested Aircraft Response Models (ARM) developed to predict the behavior of the F-16 in different situations and at different speeds, allowing the GCAS system to easily "know" what the F-16 will do under certain conditions and in response to certain inputs, as many military aircraft are inherently unstable "fly by wire" planes that require continual control inputs from their flight control computers.
The test F-16 was equipped with GPS/inertial navigation inputs, a digital terrain database, radar altimeter, and the AFTI F-16's autopilot with an Aircraft Response Model (ARM) to create a full-envelope, automatic ground collision avoidance system.""i" During recoveries, test pilots were routinely exposed to sustained G-forces of 5-8 G, as wei! as rapid roll maneuvers, sometimes resulting in GLOc.xx" Although the F-16s equipped with the auto-GCAS have been successful in avoiding CFIT and other collisions, the system is not yet slated for large-scale military installation, possibly due to the high cost of the system and the possible risks to pilots. The controvers'ral decis'ron to disallow manual override of the GCAS has upset some pilots and military commanders, making implementation of the system contentious.

~\ 59 .! ~. f#, ';\'~'l/
Environmental Tectonics Corporation
1.3.2 Problems in Application to Civil and Commercial Aircraft
Few civil aircraft share the high structural tolerance, acrobatic capability, or unobstructed pilot view offered by fighter aircraft like the F-16. Hany maneuvers initiated by the auto-GCAS to keep the F-16 from colliding with terrain are unthinkable in a large jet aircraft. While F-16s can sustain 9G, airliners are generally rated for less than half that force. The lack of reliable ARM data for conditions significantly outside the normal flight envelope further complicates the development of GCAS in commercial aircraft. For these reasons, there is no known program to develop an auto-GCAS for large commercial aircraft.
1.3.3 Prognosis
Although a possibility exists for development of auto-GCAS in commercial aircraft, the possibility seems remote at this time. As GPWS and GNSS technology develop, obtaining a reliable virtual picture of distant terrain may become more feasible. This ability could enable a large jet to maneuver around dangerous terrain further in advance, making GCAS a more feasible technology. Avoidance maneuvers could be executed automatically further in advance of a predicted collision, but this function would not only rely on less reliable terrain data; it might also automatically maneuver around terrain that the pilot was aware of and preparing to divert away from in a necessary maneuver. Current research being conducted to build reliable software for commercial jet flight simulators may reveal information required to build an ARM for different commercial aircraft, a necessary step towards the creation of a GCAS. Due to the I'elatively small controllable flight envelope in commercial aircraft, there is little data for situations outside the normal flight envelope, making the construction of an ARM challenging.
1.4 Ground Proximity Warning Systems Using a radar altimeter to measure the distance between the aircraft and terrain below it, Ground Proximity Warning Systems (GPWS) are able to predict gradually changing terrain conditions and warn the cockpit crew of impending collisions with the ground. A common complaint concerning GPWS among crewmembers and air safety officials is the high occurrence of "false warnings" produced by the current generation of systems."" This inaccuracy reduces pilots' trust in the system, and increases the chances of a pilot ignoring legitimate warnings, a problem that is being solved in the next generation of GPWS. Because GPWS have traditionally lacked a terrain database, their usefulness is limited in areas with suddenly changing terrain, such as steep mountain slopes or canyons. These systems are, however, very widespread, being required in almost every commercially operated airplane flown in North America and Europe.

I·~.·~ >'~I
Environmental Tectonics Corporation
1.5 Terrain Awareness and Warning Systems
1.5.1 Synthetic Vision
60
Synthetic or Enhanced Vision Systems (EVS) are a recent innovation in commercial and civilian aircraft. A complex technological system, EVS involves infrared imaging, conventional imaging, and a computer display system. These systems are able to reproduce relatively accurate images of the area in front of an aircraft, even at night, in adverse weather conditions, or in other low-visibility conditions. Still expensive, EVS are found in military aircraft-like some F-16, F-22 and F-35 aircraft-and business jets, to include many of the Gulfstream jets and the Falcon 7X.
1.5.2 Terrain Awareness and Warning Systems (TAWS)
Most TAWS are based on GPWS technology, and are sometimes called EnhancedGround Proximity Warning Systems (EGPWS). These units use a radar altimeter to gauge proximity to terrain, but additionally make use of internally stored terrain data to provide a visual display of the terrain and predict ground-proximity conditions further in advance. These systems are much more effective than GPWS because of the larger distance over which they have predictive power. Currently, an effort is being made to encourage states to standardize and release terrain data of geodetic reference to advance this technology in less frequented flight areas.
1.6 Vertical Navigation
1.6.1 Global Navigation Satellite System (GNSS)
Global Navigation Satellite Systems interface with low earth orbiting satellites in order to procure information about the height of terrain local to the aircraft. Although a universal GNSS network has not yet been established, most commercial aircraft are equipped to receive data from existing satellites about the height of the surrounding terrain. This secondary navigation system can provide crucial back up data to the flight crew and is not expensive to install. Unfortunately, satellite terrain data itself is not universal, nor is the satellite network complete enough to reliably cover many high-traffic areas
1.6.2 Traditional Methods
Many aircraft rely solely on conventional mechanical or electronic systems of gauging aircraft and terrain altitude. Standard pressure altimeters are set to local barometric pressure or standard day pressure (29.92 in Hg) when above 18,000 feet, but they do not give actual height above obstructions. Radar altimeters bounce radio waves from the aircraft to the surface of the earth, then measure the time they take to return, calculating the altitude of the aircraft relative to the terrain.

~~< 61 , 11<,"', I ,"
\ Ii Environmental Tectonics Corporation
1.7 Visual Approach Systems
1. 7.1 Approach Light Systems (ALS)
Approach Light Systems comprise a number of ground-mounted lights marking the approach and departure end of runways at airports. They also delineate the sides of the functional runway area, and help pilots align their aircraft with the centerline of the runway at night. Particularly useful in low-visibility and night conditions, ALS allow pilots to make the transition from instrument to visual flight rules without losing orientation and possibly causing an upset or other undesired incident.
1.7.2 Visual Approach Slope Indicator System (VASI) and Precision Approach Path Indicator (PAPI)
Both the VASI, outlined here, and the PAPI, featured below, are glideslope indicators aimed chiefly at helping pilots make approaches to runways at the proper' angle of descent. This ensures obstacle clearance while allowing for a comfortable descent rate. Most VASI systems consist of two bars of lights on the ground, comprising 2 to 16 lights each. The lights are calibrated to appear red when seen from an angle less than 3°, and white from an angle of greater' than 3°. By aligning his aircraft to see one white bar of lights followed by one red bar of lights, the pilot is assured that his aircraft is descending on the prescribed 30 glideslope. One version of the VASI, the Pulsating Visual Approach Slope Indicator (PVASI) system adds a pulsating light that flashes more slowly as the pilot approaches the ideal approach path. Many smaller airports still use VASI technology, and the rCAO prefers the VASI system over' the PAPI.
.1.7.3 PreciskJn Approach Path indicator (PAPI)
Developed from the more basic VASI system, the PAPI system similarly relies on groundbased lights calibrated to change colors when viewed from different angles. Instead of incor'porating multiple bars of lights, PAPI systems rely on a single bar compr'rsed normally of four lights, all differently calibrated. This system allows for' more nuanced feedback on the angle of approach; the four lights turn red in succession as the angle decreases, allowing the pilot to fly the correct glideslope more preCisely. Similar to the VASI, this system allows pilots to correctly gauge their flight path in low-visibility conditions. This is the preferred glideslope navigation system of the FAA.
.1.7.4 Other Lighting and Approach Navigation Systems
Other, less widespread systems of glideslope navigation include a tri-color VASI light system and the unlighted element alignment system sometimes used at small and private airports. There are also ground lighting systems to guide aircraft through taxi and take off, thus helping flight crews avoid ground collisions.

,~~JI '\ "".
62
Environmental Tectonics Corporation
1.8 Aircraft/Cockpit Design Features
1.8.1 Controls
The placement and design of vital displays and controls can be crucial to pilots in a lossof-control or upset condition. Different designs have been experimented with, and pilots disagree on the best configuration. Recent research has pointed to the advantages of the placement of key controls directly in front of the pilot's line of vision, where red-out or gray-out are least likely to affect his sight. This placement may allow pilots to continue to control their aircraft even when their vision is temporarily impaired.
1.8.2 Head-Up Displays (HUDs)
One relatively low-tech approach to reducing aircraft upsets and accidents is to reengineer the cockpit, moving crucial auto-pilot and navigation displays from waist- to eye-level. This technology has been used for decades in military aircraft. The system projects pertinent information onto a glass "combiner" that sits in the pilot's line of sight. Information such as airspeed, altitude, heading and attitude are superimposed on the real image visible through the glass. Head movement between waist-level control panels and eye-level cockpit windows causes problems in visual and instrument flight conditions and may become impossible in high G Situations, contributing to upset conditions. Eye movement between the horizon and the controls while in a spin or other maneuver can pl'oduce the Coriolis Effect, which is avoided with the use of this system. This eye-level design allows crew members to easily consult displays while still monitoring the aircraft's situation and surroundings through the cockpit window."';1 Despite the negligible cost of assembling a cockpit in this way, the reconfiguration of older cockpits remains, in most cases, prohibitively expensive. To install such a system in an aircraft in the United States, permission in the form of a Supplemental Type Certificate (STC) must be procured. Application for an STC involves extensive testing, time and money, which make the installation of such systems less attractive.
A related possibility for improving cockpit design to help avoid upsets is repositioning the synthetic vision system. By superimposing the image produced by the synthetic vision system on a transparent HUD, a pilot is given simultaneous access to synthetic and real vision. Combiners reflect back the synthetic images projected at them, but allow all other forms of light to pass through, giving the pilot an unobstructed view out of the cockpit, while aiding his sight with infrared and other imagery.
1.9 Stall Warning Systems Most a'lrcraft have stall warning systems to warn the pilot of an impending stall. One example of such a system is called a stick shaker, found on most commercial and military aircraft equipped with yokes. Stick shakers are connected to the yoke, and shake it when a stall is imminent, attracting the pilot's attention. Some systems are equipped with stick pusher capability, which mechanically forces the nose down, lessening the angle of attack to avoid a stall. A variation on the stick shaker is the

/,~r~1 \ ~.
Environmental Tectonics Corporation
63
rudder shaker system, common in aircraft equipped with sticks, which similarly determines when a stall is imminent, and vibrates the rudder pedals, again attracting the pilot's attention. A more basic system of stall warning is the inclusion of a warning light on the cockpit control panel, visually alerting pilots to the impending stall. Aural stall warnings are also found on many aircraft, and are generally triggered by a drop in airspeed to 105% of stall speed, or through mechanically sensing the initial separation of leading edge airflow that produces a stall.
1.10 Excessive Bank and Pitch Angle Warning Capability Some aircraft are equipped with electronic Excessive Bank Angle Warning capability. It is not uncommon for an aircraft to develop an excessive bank angle without the upset situation being detected by the crew""", particularly in Instrument Meteorological Conditions, when a pilot is distracted, or during a rapid change in altitude. Although excessive pitch is hard to incur without the flight crew noticing, it does occasionally take place. Electronic warning systems incorporate maximum bank and pitch data for the particular aircraft, and warn pilots when they approach or' exceed that limit. This warning capability is often integrated into the Electronic Flight Information System. Most systems incorporate an aural warning to facilitate quick response to the upset situation, repeatedly alerting the flight crew with an audible warning message like "bank angle" or "pitch angle" if the predetermined angle is succeeded. An aural warning capability is especially common among tur'boprop and jet aircraft running regional or international routes, but many aircraft possess an electronic gyroscope which visually reveals bank and pitch attitude.
The conventional method of deter'mining bank angle relies on an attitude gyroscope, commonly known as the attitude indicator or a rtific'ra I horizon. Some indicators are colorcoded; when the bank angle exceeds a safe number, the gauge reads yellow or red numbers. Although generally reliable, the attitude gyroscope is not always relied upon by spatially disoriented pilots, a problem that the electronic aural warning system attempts to correct.
1.11 Automatic Recovery Systems Current 5th generation fighter aircraft such as the F-22 and F-35 are equipped with both departure resistance and automatic recovery software integrated as part of the flight control architecture. While modern fly-by-wire commercial aircraft have flight control limiters 'rn an attempt to alleviate upsets, these limiters are not nearly as robust as the active limiters on military aircraft. Furthermore, there is no automatic recovery logic should the aircraft exceed these limiters, While no production aircraft include this software there is a definite potential that departure resistance and automatic recovery logic could be integrated in the near future as evidenced by the success of implementations on fighter aircraft.
BIBLIOGRAPHY

64 , :~ ~ / I~;,[I \ '\ ""'"
Environmental Tectonics Corporation
"Airplane Upset Recovery Training Aid Revision 2." Upset Recovery Industry Team, November 2008. http://www.faa.gov/othervisit/aviationindustry/airlineoperators/training/index.cf m?print=go
"Aircraft Accident Report In-Flight Separation of Vertical Stabilizer American Airlines Flight 587 DCA02MA001." National Transportation Safety Board. http://www.ntsb.gov/publictn/2004/AAR0404.pdf.
"Airplane Upset Recovery: Industry Solutions for Large Swept-wing Turbofan Airplanes Typically Seating more than 100 Passengers." Federal Aviation Administration. 1 August 2004. http://www. faa.gov/about/office org/headq uarters offices/avs/offices/afs/afs200/ branches/afs210/training aids/media/upsetrecove ry. pdf.
Baxter, Gordon, Denis Besnard and Dominic Riley. "Cognitive Mismatches in the Cockpit Will They Ever Be a Thing of the Past?" Applied Ergonomics. 2007. 38(4): 417-23.
"Collective Behaviour." Encyclopcedia Britannica. 2007. Encyclopcedia Britannica Online. 12 July 2007 <jlttp://search.eb.com/eb/article-2531 '2>.
"Electronic Code of Federal Regulations: Federal Aviation Authority Regulations." United States Government. http://ecfr. 9 poaccess. 90v/c9i1t1textltextidx? &c=ecfr& tpl=/eglrbrowselTitle 14/14tab 02.tpl.
"Factual Report Aviation: SEA06FA 126." National Transportation Safety Board. Investigator: James Struhsaker. http://www.ntsb.gov/ntsb/GenPDF.asp?id=SEA06 FA 126&rpt=la.
"Factual Report Aviation: AAR9006." National Transportation Safety Board. http://amelia.db.erau.edu/reports/ntsb/aar/AAR90-06. pdf.
FSF CFIT Task Force: Aircraft Equipment Team. "Final Report." April 1999. http://www . faa. 90V I ed uca tio n resea r<;:h/tra i n i n 9/m ed i al cfit/vo I u me 2/pdfi pa 9 esl pa ge5 11.pQf.
Garvey, William. "The Problem with Air Work." Aviation Week. 16 February 2007. http://www.aviationweek.com/aw/9eneric/story generic.jsp?channel=bca&id=new s/bca021607p3.xml.
Haynes, AI. "Eyewitness Report United Flight 232." AirOisaster.com. http://www.airdisaster.com/eyewitness/ua232.shtml.
Hess, Bernhard. "Vestibular Signals in Self-Orientation and Eye Movement Control." Journal of Physiology. 2001. 16(5): 234.
Leland, Richard A "Spatial Orientation Training for Aircraft Operators: A Pilot's Workbook for Spatial Disorientation Training." September 2005. Environmental Tectonics Corporation.

'~!J I~I
Environmental Tectonics Corporation -----------------------------------
Onken, Reiner and Anton Walsdorf. "Assistant systems for aircraft guidance: cognitive man-machine cooperation." Aerospace Science and Technology. 2001. 5(8). 511.
65
Ranter, Harro. "Airliner Accident Statistics 2005: Statistical summary of fatal multi-engine airliner accidents in 2005." Aviation Safety Network. 1 January 2006. http://aviation-safety . n etlp u bs/.
Scott, William B. "Automatic GCAS: 'You Can't Fly Any Lower'; An Aggressive Multinational Test Program Demonstrated that Advanced Digital Systems can Prevent CFIT." Aviation Week and Space Technology. February 1, 1999. 150(5): 76.
Veilette, Patrick. "Watching and Waning." Aviation Week. 31 January 2006. Reprinted from Business and Commercial Aviation. February 2006. http://www.aviationweek.com/aw/search/autosuggest.jsp?doCid=2753&url=http% 3A%2F%2Fwww.aviationnow.com%2Favnow%2Fnews%;2Fchannel bca story.j sp%3Fview%3Dstory%26id%3Dnews%2Fglass 0206.xml.

I~I Environmental Tectonics Corporation
FOOTNOTES
I Ibid.
11 Bernhard I-less. "Vestibular Signals ill Se1f~Oricntation and Eye Movement ControL" Journal q/ Physiology.
III "Collective Behaviour." Enc)~.h?lliedia liriWnnica. 2007. Encyclopa~dia Britannica Onlinc-.
66
II' Richard A. Leland. "Spatial Orientation Training for Aircraft Operators: A Pilot's Workbook for Spatial Disorientation Training.". Environmental Tec/onics Corporation.
Y Sec: Bernhard Iless. "Vestibular Signals in Sclf'-Oricntation and Eye Movement Control." Journal (~l Physiology. 2001. J 6(5): 234. for an overview
VI Haynes, AI. "Eyewitness Report: United Flight 232." AirDisasfer.com.
l.11!J?;.!~\\~.\Y\Y, {l.iLQigl;::;1Gr,_<;9mL~~y~\yi1.JJG_0li(Jl<l2J2.,.0J)JJ))I.
\'11 "Factual Rcport Aviation: AAR9006." .Nationa/ Tral1.'>j}()J'/alioll c)'{(!ety Hoard
hHl~_~/l-'-lJ.m~Jj __ (ul12_:Qgm,_<;~~L~!J~r~1~9}:.t,dn..t0b!'!m/A!1E.2D_~_Q0,:m.If.
VIII "Aircraft Accidcnt Report: In-Flight Separation of Vertical Stabilizer American /\irlincs Flight 587
I)C A02 M;\ 00 1 ." lVCl / JOJ7{I/ Tnl17.\j]O/·/ a f ion ,,,'( !fefy BO{II'C/' .ll_!Jp:./hy\v\Y_,nJ.8:LgQ,Y1J2JI.b._U_\J.n,/2QQAib_6B{H_DAJ2.cJf. L\ Ibid.
~ Ibid.
X'Ibid .
. \11 "Factual Reporl/\ vialiol1: NY C99lV1/\ 17R." Nal iOrla/ Transportalio}} S'qfd,Y Board
,1_LUpj/nL~Q-O lloY/nt012iSiGJ)rJ!:I~_n_mLU~I-'" r:iY_C9_2Ml\1..z3~<gJ2LJ.l!·
XIII "Factual Report A viatioIl: SEA06FA 126." Na/iolla/ Jlw7.'>jJorfo/iol1 ,\"{(!()Iy Board.
.IHJ12.:/!."--\'lY~Y~D.l0h,gQ..\dDJ0,h{GQ)J~1) r:.,.{!.!mli~L:::.~_r:,bQ.0LA 12.0.0;IJ2L::J..il.
XII' Garvey, William. "The Problem with Air \Vork." AFia/ion TYeek. 16 February 2007.
hL!lr!L~y'~YW.,~njilJ..(Q}.lWQgJ~· cOl1lli~ylg~JlC:J:ig!.~t,m:y_gQJJ.Q.r.i.c:...jlli?]s~hm~_n~_L:::h91S~~L~.nc:.w_tj!h.g,UD_2_L(?'£21p.}._xn.1J.
~v "Factual Report Aviation: SEA06FA 126." Nationa/ TromjJor/atioJ1 S(di?/y Board. h!,!p.:.ihy.\',,-\,,-,:_!}-'-~.b..,_gQ_wJ.~B2LGQnrDI,:,~I.~p:U~t-, S 1::AQ{iL6J20_Q;Xpt:'.ill.
xv Richard A. Leland. "Spatial Orientation Training 1'01' Aircraft Operators: A Pilot's Workbook for Spatial Disorientation Training." Hnvironmental Tectonics Corpol"{Jlion.
XVI Onken, Reiner and Anton Walsdorf "Assistant systems for aircraft guidance: cognitive man-machine cooperation." Aerospace Science and Technology. 200 J. 5 J 3.
X\'II Patrick VeiJctte. "\Vatching and Waning." Avialion \Vcek. 31 January 2006.
xviii lIarro Ranter "Airliner Accident Statistics 2005: Statistical summary of fatal multi-engine (1iriincr accidents in 2005." II pia/ion SafelY Network. 1 Janumy 2006. 15.
XIX "Electronic Code of Federal Regulations." Federal Aviation Administration. h!J.p_:lLC:_<2!l~,gPQItCCC~t>",g9V/ cg,iL!L1Q..~..t[t~_~J idx? &G.:::..~.1l"~!j;>_L::!~~sJrbroW:'i~IilLQ.J 4/J1H1_Q_Q~UnJ·
xx FSF CFIT Task Force: Aircraft Equipmcnt Tcam. "Final Rcport." 10.

~ ... ~ // ~', w (\'~I
Environmental Tectonics Corporation
XXI "Electronic Code of Federal Regulations." Federal Aviation Administration. lm.p":!lg£[LgQ.QiKS-:_~~"LgQ.y'~gj!J!.tQ,0J[LQ;'SJidx? &c~~~~jL&.Jnl~L~~frbrs2~1{,'i9L[i .. H_g.L4!J_4J_lib 02. H2.\.
XXII William 13 Scott. "AUt0l118tic GCAS: 'You Can't Fly Any Lovi'cr'; An Aggressive Multinational Test Program Demonstrated that Advanced Digital Systems can Prevent CFTT.') Aviation Wee/( and Space Technology. 76 .
. \);111 Ibid. 77.
XXII' Ibid. 77.
)...W Ibid. 78.
XXVI Ibid. 10.
67
X:<.VlI Gordon l3axter, Denis 13csnard and Dominic Riley. "Cognitive Mismatches in the Cockpit: \Vill They Ever Be a Thing of the Past?" 418 .
. XXVIII Ibid. 25.