nasa land atmosphere near real-time capability for eos 2014 customer satisfaction results january...
TRANSCRIPT

NASA Land Atmosphere Near real-time Capability for EOS
2014 Customer Satisfaction ResultsJanuary 2015

2 © 2014 CFI Group. All rights reserved.
Today’s Discussion
Background Objectives
Data Collection
Respondent Information
Overview of Key Results
Detailed Analysis
Summary
Background
4 © 2014 CFI Group. All rights reserved.
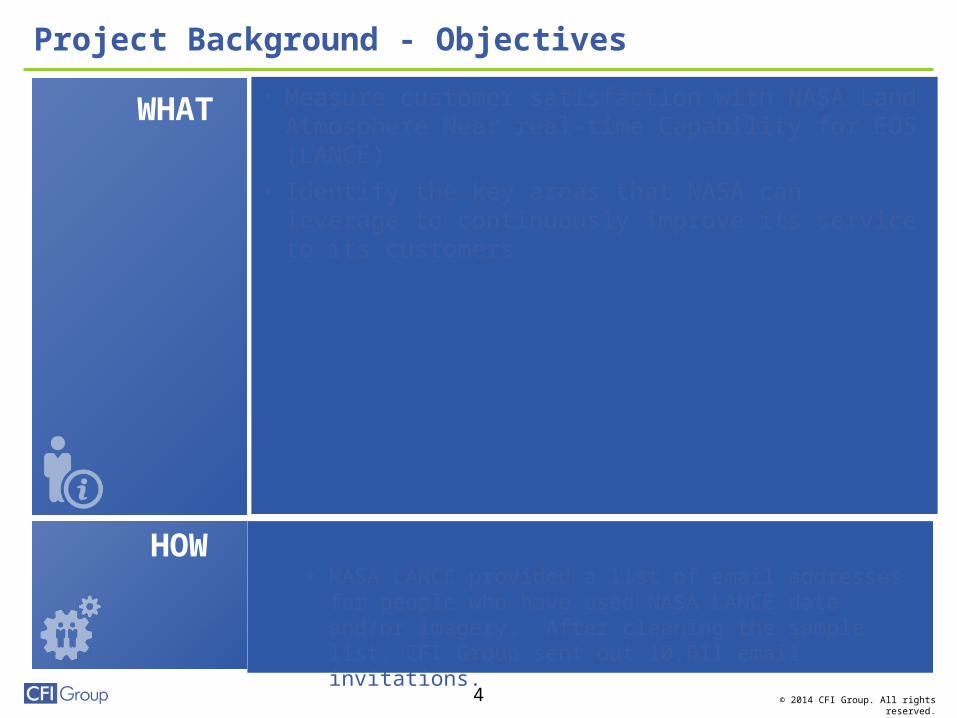
• Data collection via e-mail invitation• NASA LANCE provided a list of email addresses for people
who have used NASA LANCE data and/or imagery. After cleaning the sample list, CFI Group sent out 10,611 email invitations.
Project Background - Objectives
• Measure customer satisfaction with NASA Land Atmosphere Near real-time Capability for EOS (LANCE)
• Identify the key areas that NASA can leverage to continuously improve its service to its customers
• Assess the trends in satisfaction with NASA EOSDIS specifically in the following areas:
• Usage
• Delivery
• Customer Support
• Search & Download Data
• Search & Download Visualization
WHAT
HOW

5 © 2014 CFI Group. All rights reserved.
• Finalized questionnaire: October 2014
• Data collection: October 21 – November 17, 2014
• Topline Results: December 2014
• Results Briefing: January 2015
• Of the 10,611 invitations sent, 749 individuals completed the survey resulting in a response rate of 7%.
Project Background – Data Collection
MEASUREMENT TIMETABLE
SAMPLE SIZE

6 © 2014 CFI Group. All rights reserved.
Questionnaire Design – New in 2014
Respondents asked to focus on one of five major LANCE
service areas:> Data download> FIRMS (Fire Information for Resource Management System)> Rapid Response image subsets, gallery or swath images> Worldview> GIBS (Global Imagery Browse Services) e.g., Web Map Tile
Services (WMTS), KML (Keyhole Markup Language)

7 © 2014 CFI Group. All rights reserved.
Data Download (58%) and FIRMS (51%) were the most cited LANCE NRT services used.
22% of respondents were from the US.
Fires (60%), vegetation (40%) and weather (39%) are the most cited areas of need for NRT products.
Data Download and FIRMS most used; Fire area of most need
Respondent Information
~ Total percentage may exceed 100 due to multiple responses
Percent Frequency CSI Percent Frequency CSILANCE NRT services used~Data download 46% 237 79 58% 429 79FIRMS 57% 292 76 51% 377 76Rapid Response image subsets 52% 264 79 40% 298 78Worldview 0% 0 -- 29% 218 79Global Imagery Browse Services 17% 87 76 19% 137 77Number of Respondents
Service surveyedData download 0% 0 -- 34% 250 78FIRMS 0% 0 -- 36% 263 76Rapid Response image subsets 0% 0 -- 17% 128 78Worldview 0% 0 -- 10% 73 80Global Imagery Browse Services 0% 0 -- 4% 26 79Number of Respondents
Location - GroupedUnited States 22% 113 80 22% 162 80All other locations 78% 411 77 78% 578 77Number of Respondents
Area that needs NRT products~Agriculture 28% 144 78 27% 200 76Air quality 24% 126 79 26% 193 79Ash plumes 13% 67 78 14% 101 81Drought 23% 117 78 21% 158 80Dust storms 14% 73 79 14% 106 81Fires 65% 338 77 60% 444 77Floods 30% 155 80 25% 187 80Severe storms 25% 129 81 24% 175 79Snow cover / sea ice 0% 0 -- 17% 129 80Smoke plumes 24% 126 77 24% 181 79Vegetation 41% 212 79 40% 295 77Volcanoes 0% 0 -- 13% 96 78Weather 0% 0 -- 39% 291 79Other - Area need NRT products 26% 136 80 13% 99 76Number of Respondents
524 740
520 740
November 2013 November 2014
510 740
0 740

8 © 2014 CFI Group. All rights reserved.
NRT data was accessed by users in 112 different countries. The countries with at least 1% response are listed here and on the next slide.
User Country of Origin Breakout
Respondent Information
Percent Frequency Percent Frequency
Location
Argentina 3% 18 4% 31Australia 3% 18 3% 19Bolivia, Plurinational State of 0% 2 1% 7Botswana 1% 5 1% 5Brazil 0% 2 1% 10Canada 3% 18 4% 31Chile 1% 6 1% 6China 4% 21 2% 17Colombia 1% 5 2% 12Ethiopia 0% 1 1% 4France 1% 3 1% 6Germany 2% 8 1% 10Greece 3% 15 2% 18Guatemala 1% 5 1% 8India 4% 19 3% 22Indonesia 3% 14 4% 30Iran, Islamic Republic of 1% 7 1% 9Italy 3% 17 3% 23Japan 2% 8 1% 7Number of Respondents
November 2013 November 2014
524 740

9 © 2014 CFI Group. All rights reserved.
The most common non-US countries are: Spain-6%Argentina-4%Canada-4%Indonesia-4% Australia- 3% India-3 % Italy-3% Mexico-3%
which account for 30% of all users
User Country of Origin Breakout (cont)
Respondent Information
Percent Frequency Percent Frequency
Location
Madagascar 1% 3 1% 5Mexico 3% 17 3% 19Mozambique 1% 6 1% 4Namibia 0% 2 1% 4Netherlands 1% 6 1% 7New Zealand 1% 4 1% 5Peru 0% 2 2% 14Portugal 2% 11 1% 11Romania 1% 3 1% 5Russian Federation 3% 16 2% 16Singapore 0% 1 1% 4South Africa 1% 6 2% 13Spain 5% 26 6% 42Switzerland 0% 2 1% 4Thailand 2% 10 2% 18United Kingdom 2% 9 2% 15United States 22% 113 22% 162Vietnam 0% 2 1% 7Zimbabwe 0% 2 1% 5Number of Respondents 524 740
November 2013 November 2014

10 © 2014 CFI Group. All rights reserved.
Conservation (31%) and Answering Science Questions (25%) are areas with most interest.
Nearly half (48%) find the timeframe of less than 3 hours within spacecraft acquisition most useful.
Most Interested in Natural Resource Mgmt/Answering Science Questions; 48% Want Data Within 3 Hours
Respondent Information
~ Total percentage may exceed 100 due to multiple responses
Percent Frequency Percent Frequency
Best describes interest
Science questions including modeling/forecasting 15% 78 25% 185Conservation/natural resource management 32% 166 31% 230Humanitarian/managing hazards or disasters 20% 103 13% 95Media - press/news/blogs/social media 4% 20 4% 27Monitoring air quality 9% 48 7% 55Preview for data/science products selection 8% 41 6% 48Other 13% 68 14% 100Number of Respondents
NRT products useful timeframe
Less than 3 hours 48% 249 48% 357Less than 6 hours 18% 95 18% 134Less than 12 hours 11% 60 10% 72Less than 24 hours 23% 120 24% 177Number of Respondents
November 2013 November 2014
524 740
524 740

11 © 2014 CFI Group. All rights reserved.
LANCE websites (67%) and Internet searches (50%) are most used methods to search for products.
91% find the information needed.
LANCE Website or Internet most often used for product search
Respondent Information
~ Total percentage may exceed 100 due to multiple responses
Percent Frequency CSI Percent Frequency CSIMethod used to search for products or services~LANCE websites 70% 353 80 67% 496 78Reverb 0% 0 -- 10% 76 78Global Change Master Directory 10% 50 79 6% 45 77Internet search 52% 262 77 50% 368 76Other 5% 24 74 5% 35 79Number of Respondents
Find information neededFound information needed 88% 460 79 91% 675 79Did not find necessary information 12% 64 67 9% 65 61Number of Respondents
November 2013 November 2014
507 740
524 740

12 © 2014 CFI Group. All rights reserved.
Just under one-quarter request assistance from Customer Support.
A large majority (90%) get the help they need on the first request.
The availability of data is improving as the percentage of those that never have experienced a data unavailability rose 7 points (35%) from last year.
Most Get Help Needed on First Request; Fewer Experience Data Unavailability
Respondent Information
~ Total percentage may exceed 100 due to multiple responses
Percent Frequency CSI Percent Frequency CSIUse for NRT data and imageryWithin your project 77% 403 77 78% 404 79For redistribution 5% 26 76 4% 22 85Customization, then distribution 18% 95 80 18% 91 77Number of Respondents
Aware NRT is different from NASAs Standard Science Quality productsAware NRT differs from NASA Standard Science Quality products 0% 0 -- 53% 390 80Not aware that NRT differs from NASA Standard Science Quality products 0% 0 -- 47% 350 74Number of Respondents
Informed when data not availableInformed when data not available 46% 240 80 39% 292 80Not informed 26% 135 74 25% 188 71Never experienced an unavailability 28% 149 79 35% 260 79Number of Respondents
User support staff assistanceUsed support staff 23% 120 80 22% 166 80Not used support staff 77% 404 77 78% 574 77Number of Respondents
Help needed on first requestReceived help needed on first request 84% 101 81 90% 149 81Did not receive help needed on first request 16% 19 75 10% 17 73Number of Respondents
November 2013 November 2014
524 517
120 166
0 740
524 740
524 740

Overview Key Results

14 © 2014 CFI Group. All rights reserved.
NASA LANCE outscores federal government average by 11 points and outscores the aggregate score for internet news and information providers by 3.
The score of 77 is within the range of other federal agency information providers.
Baseline score is on par with other information providers
Benchmarking
Federal Government Average
Internet News and Information
National ACSI
NASA Lance- Aggregate
NASA Earth Observing Data and Information System Users
NOAA, Weather Service Users
66
74
76
77
78
84

15 © 2014 CFI Group. All rights reserved.15
Customer Support85 1.5
Search & Download Visualization79 2.2
Data & ImageryDelivery Format & Method82 1.8
Search & Download Data78 1.2
Usage – Use of LANCE NRT Products82 1.1
Future Use 893.4
Recommend 873.9
SATISFACTION DRIVERS FUTURE BEHAVIORS
Scores represent your performance as rated by your customers
Driver Impacts show you which driver has the most/least leverage – where improvements matter most/least to your customers
Future Behavior Impacts represent the impact of CSI on the future behaviors of your customers
Overall Satisfaction 80Compared to Expectations 77Compared to Ideal 75
Customer Satisfaction Index
77
2014 NASA LANCE Customer Satisfaction Model (n=740)

16 © 2014 CFI Group. All rights reserved.
Priorities for NASA LANCE
0.0 0.5 1.0 1.5 2.0 2.5 3.070
75
80
85
90
Search and Download Visualization Search and Download
Data
Data and Imagery Delivery Format and Method Usage - Use of LANCE
NRT Products
Customer Support
IMPACT
CO
MP
ON
EN
T S
CO
RE
Maintain
Top Priority
Strengths
Areas of Con-cern

Detailed Analysis
18 © 2014 CFI Group. All rights reserved.
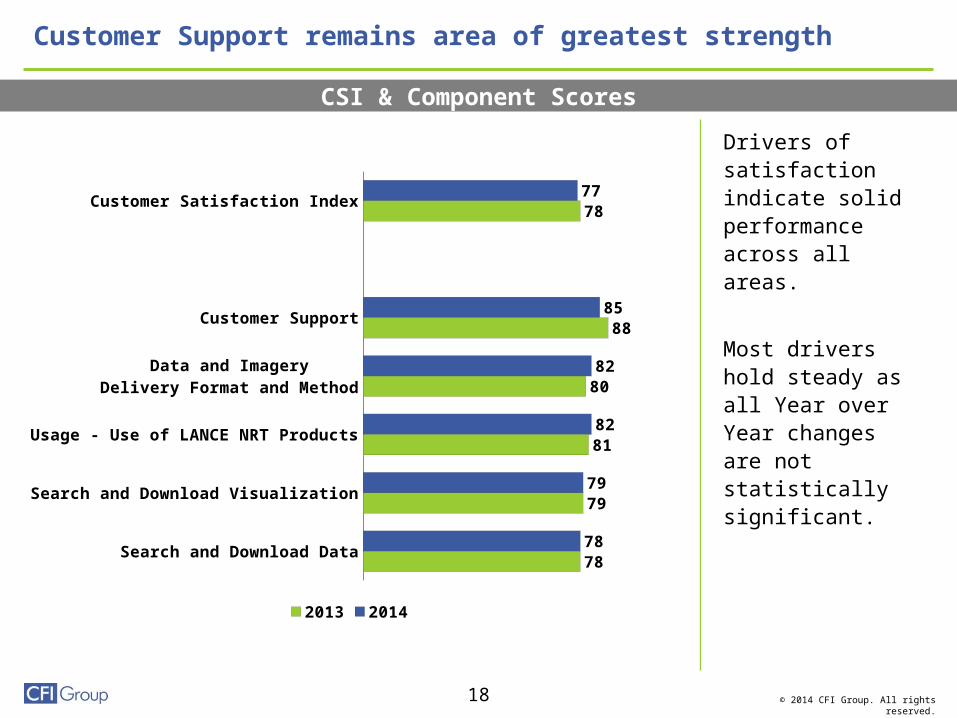
Drivers of satisfaction indicate solid performance across all areas.
Most drivers hold steady as all Year over Year changes are not statistically significant.
Customer Support remains area of greatest strength
CSI & Component Scores
Customer Satisfaction Index
Customer Support
Data and ImageryDelivery Format and Method
Usage - Use of LANCE NRT Products
Search and Download Visualization
Search and Download Data
77
85
82
82
79
78
78
88
80
81
79
78
2013 2014

19 © 2014 CFI Group. All rights reserved.
Sample SizeSearch and Download Visualization 83 77 -6 ↓Search and Download Data 78 78 0Data and Imagery Delivery Format and Method 85 81 -4 ↓Usage - Use of LANCE NRT Products 83 82 -1Customer Support 90 83 -7 ↓Data Track 81 80 -1Search and Download - Data 77 79 2Data Delivery Format - Data 86 81 -5 ↓FIRMS Track 81 78 -3Search and Download - FIRMS 79 77 -2Data Delivery Format - FIRMS 84 83 -1Rapid Response Track 86 75 -11 ↓Search and Download - Rapid Response 86 75 -11 ↓Worldview Track 80 83 3Search and Download - Worldview 80 83 3GIBS Track 87 81 -6Search and Download - GIBS 87 81 -6Data Delivery Format - GIBS 87 81 -6Customer Satisfaction Index 80 77 -3 ↓Likelihood to recommend 88 86 -2Likelihood to use again 92 88 -4 ↓
All other locations Difference
Significant Difference
162
United States
578
US users tend to have higher satisfaction than users outside of the US.
Significant differences exist in Customer Support, Search & Download Visualization and Data & Imagery Delivery
US Customers slightly more satisfied than other locations
CSI & Component Scores by Location
* Significant difference at 90% confidence level

20 © 2014 CFI Group. All rights reserved.
Although Search & Download Visualization holds steady from last year, Ease of Downloading Imagery climbs 5 points*.
Search & Download Visualization has the most impact on satisfaction this year.
* Significant difference at 90% confidence level
Search & Download Visualization is highest impact area
Search & Download Visualization
Search and Download Visualization
Ease of downloading imagery
Ease of finding imagery
Timeliness of image availability
79
84
80
75
79
79
79
November 2013 November 2014
(Impact = 2.2)

21 © 2014 CFI Group. All rights reserved.
Data and Imagery Delivery Format and Method also has a high impact.
Convenience rates slightly higher than timeliness.
Delivery Format and Method rates higher for Convenience
Data and Imagery Delivery Format and Method
Data and ImageryDelivery Format and Method
Convenience of delivery
Timeliness of delivery
82
83
81
80
82
79
November 2013 November 2014
(Impact = 1.8)

22 © 2014 CFI Group. All rights reserved.
Customer Support is a high-impact, high-performing area.
Just over one-fifth (22%) of customers contacted Customer Support.
Support rates highest for professionalism and technical knowledge.
Customer Support is highly professional and technically knowledgeable
Customer Support
Customer Support
Technical knowledge
Professionalism
Timeliness of response
How well issue was handled
85
86
85
84
83
88
89
89
84
86
November 2013 November 2014
(Impact = 1.5)

23 © 2014 CFI Group. All rights reserved.
Search and Download Data has a lower impact on satisfaction.
Ratings are slightly higher for ease of downloading data compared to ease of finding data.
Search & Download Data meeting users’ needs
Search & Download Data
Search and Download Data
Ease of downloading data
Ease of finding data
78
81
77
78
79
77
November 2013 November 2014
(Impact = 1.2)
24 © 2014 CFI Group. All rights reserved.
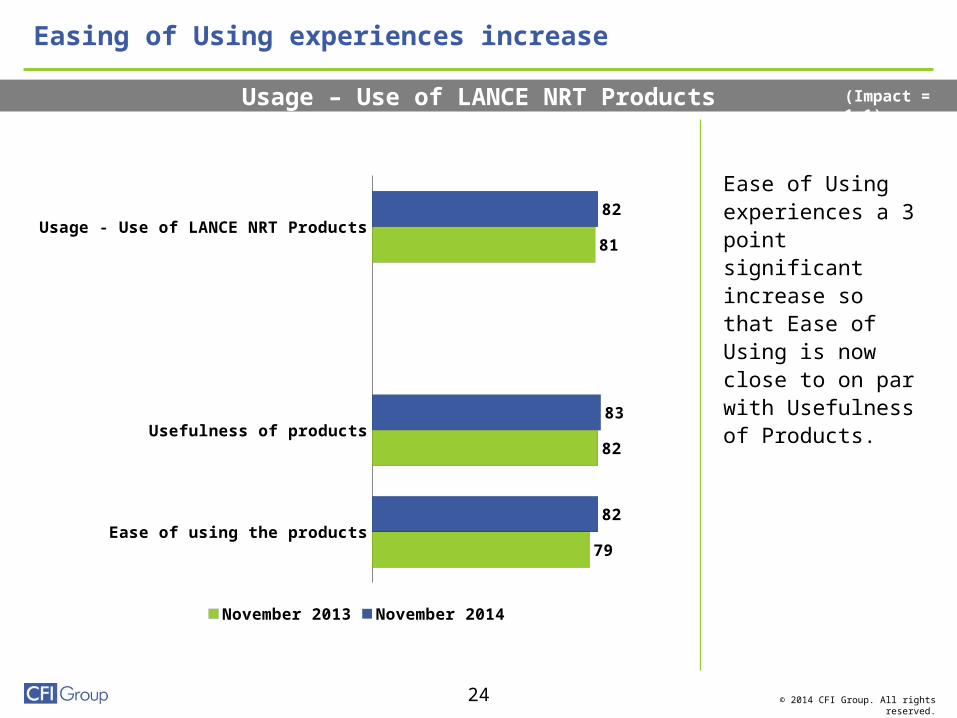
Ease of Using experiences a 3 point significant increase so that Ease of Using is now close to on par with Usefulness of Products.
Easing of Using experiences increase
Usage – Use of LANCE NRT Products
Usage - Use of LANCE NRT Products
Usefulness of products
Ease of using the products
82
83
82
81
82
79
November 2013 November 2014
(Impact = 1.1)

25 © 2014 CFI Group. All rights reserved.
The table shows component and attribute scores for customers surveyed in 2014.
Customer support experiences a drop in Professionalism (-4) and How Well the Issue was Handled (-3).
Ease of Downloading Imagery (84) and Ease of Using LANCE Products (82) experience increases.
Customer Support dips while Ease of Downloading and Using rise
Model Attribute Table
Significant Difference
Aggregate Impact
Sample SizeSearch and Download Visualization 79 79 2.2Ease of finding imagery 79 80 --Ease of downloading imagery 79 84 ↑ --Timeliness of image availability -- 75 --Search and Download Data 78 78 1.2Ease of finding data 77 77 --Ease of downloading data 79 81 --Data and Imagery Delivery Format and Method 80 82 1.8Convenience of delivery 82 83 --Timeliness of delivery 79 81 --Usage - Use of LANCE NRT Products 81 82 1.1Ease of using the products 79 82 ↑ --Usefulness of products 82 83 --Customer Support 88 85 1.5Professionalism 89 85 ↓ --Technical knowledge 89 86 --Timeliness of response 84 84 --How well issue was handled 86 83 ↓ --Customer Satisfaction Index 78 77 N/AOverall satisfaction 81 80 --Compared to expectations 77 77 --Compared to ideal 75 75 --Likelihood to recommend 87 87 3.9Likelihood to recommend 87 87 --Likelihood to use again 88 89 3.4Likelihood to use again 88 89 --
524
November 2013
740
November 2014
* Significant difference at 90% confidence level

26 © 2014 CFI Group. All rights reserved.
Almost all service attributes score between the mid 70s and mid 80s with one major exception.
Rapid Response Real Time Ease of Finding Imagery and Image Availability Timeliness both score in the high 50s.
Users are generally satisfied with most LANCE service attributes
LANCE Service Attributes Table
November 2014
Sample Size Sample Size 740Data Track 80 Worldview Track 82Search and Download - Data 79 Search and Download - Worldview 82Ease of finding data you want 77 Ease of finding imagery you want 88Ease of downloading data 81 Ease of downloading imagery 84Data Delivery Format - Data 82 Ease of downloading data granules 84Convenience of delivery 82 Timeliness of image availability 78Timeliness of data availability 81 Ease of finding imagery you want - real time 79FIRMS Track 79 Timeliness of image availability - real time 77Search and Download - FIRMS 78 GIBS Track 83Ease of finding data you want 78 Search and Download - GIBS 83Ease of downloading data 81 Quality of imagery 85Ease of finding data you want - browse 77 Quality of service documentation 79Timeliness of browse availability - browse 76 Timeliness of image availability 83Data Delivery Format - FIRMS 83 Data Delivery Format - GIBS 83Convenience of delivery 85 Ease of finding imagery you want 83Timeliness of data availability 81 Ease of using the formats and web services provided 82Rapid Response Track 77 Usefulness of near real-time GIBS imagery for your needs 83Search and Download - Rapid Response 77Ease of finding imagery you want 81Ease of downloading imagery 85Timeliness of image availability 74Ease of finding imagery you want - real time 57Timeliness of image availability - real time 58
740
November 2014

27 © 2014 CFI Group. All rights reserved.
63% of users download data at least once a month or more.
Most (90%) are able to download in their preferred format.
Almost all users (94%) prefer either FTP or HTTPS format.
Over 60% download data at least once a month; FTP HTTPS most preferred
Data Service Respondent Information
Percent Frequency CSIFrequency download LANCE near real-time dataDaily 28% 70 81Weekly 15% 38 78Monthly 20% 50 79A few times a year 37% 92 75Number of Respondents
Able to download data in the format you preferAble to download in preferred format 90% 224 79Not able 10% 26 71Number of Respondents
Preferred method for downloading data - DataFTP 51% 128 79HTTPS 43% 107 78Other 6% 15 75Number of Respondents
November 2014
250
250
250

28 © 2014 CFI Group. All rights reserved.
Most (84%) use the email alerts in FIRMS.
82% of users browse or receive FIRMS data at least weekly.
Most (94%) are able to download FIRMS data in their preferred format.
Over 80% of users browse or receive FIRMS data at least weekly
FIRMS Service Respondent Information
Percent Frequency CSIFIRMS services do you use~Email alerts 84% 220 75Web Fire Mapper 50% 131 76SHP, KML, text file download 40% 106 78Archive Download tool 25% 65 7910 day fire maps 25% 67 75Number of Respondents
Frequency browse-download or receive data from FIRMSDaily 65% 172 77Weekly 17% 44 73Monthly 6% 17 69A few times a year 11% 30 76Number of Respondents
Use FIRMS to browse onlyFIRMS to browse only 58% 153 75FIRMS not only to browse 42% 110 77Number of Respondents
Able to download FIRMS data in the format you preferAble to download in preferred format 94% 103 78Not able 6% 7 66Number of Respondents
Preferred method for downloading data - FIRMSFTP 15% 17 74HTTPS 8% 9 79Email alerts 45% 49 81Web services 31% 34 74Other 1% 1 78Number of Respondents
November 2014
263
263
263
110
110

29 © 2014 CFI Group. All rights reserved.
76% browse or receive data at least once a week.
Just under half (43%) have tried Worldview and 21% would consider switching.
76% browse or receive Rapid Response data at least once a week
Rapid Response Service Respondent Information
Percent Frequency CSIFrequency browse or download LANCE near real-time imagery in Rapid ResponseDaily 36% 46 82Weekly 40% 51 77Monthly 16% 20 73A few times a year 9% 11 71Number of Respondents
Use Rapid Response to download imageryUse Rapid Response 84% 108 80Do not use Rapid Response 16% 20 64Number of Respondents
Able to download imagery in the format you preferAble to download in preferred format 96% 104 80Not able 4% 4 73Number of Respondents
Tried viewing-downloading imagery from WorldviewTried in Worldview 43% 46 79Did not try in Worldview 57% 62 81Number of Respondents
Consider switching from Rapid Response to WorldviewWould consider switching 21% 22 83Would not consider switching 20% 21 81Not sure, please send me more information 59% 62 79Number of Respondents
November 2014
128
128
108
108
105

30 © 2014 CFI Group. All rights reserved.
83% of the Worldview service respondents access near real-time imagery at least once a month.
Most (88%) were able to download imagery data in their preferred format.
Worldview accessed at least once a month by over 80% of users
Worldview Service Respondent Information
Percent Frequency CSIFrequency browse or download LANCE near real-time imagery using WorldviewDaily 38% 28 83Weekly 23% 17 81Monthly 22% 16 76A few times a year 16% 12 75Number of Respondents
Use Worldview to download imagery or the underlying data granulesUse Worldview 67% 49 80Do not use Worldview 33% 24 79Number of Respondents
Able to download imagery-data in the format you preferAble to download in preferred format 88% 43 81Not able 12% 6 77Number of Respondents
November 2014
73
73
49

31 © 2014 CFI Group. All rights reserved.
GIBS is accessed at least once a week by 70% of the respondents and is most often accessed via Google.
70% access GIBS at least once a week
GIBS Service Respondent Information
~ Total percentage may exceed 100 due to multiple responses
Percent Frequency CSIFrequency access GIBS imagery servicesDaily 35% 9 79Weekly 35% 9 76Monthly 15% 4 76A few times a year 15% 4 86Number of Respondents
How you access GIBS imagery services~Adobe Flash/Flex 31% 8 76Bing Maps 19% 5 71ESRI ArcGIS Online 19% 5 77ESRI ArcGIS/ArcMap 19% 5 79ESRI iOS 8% 2 81GDAL 8% 2 81Google Earth 58% 15 79Google Maps 46% 12 75Leaflet 8% 2 83NASA World Wind 27% 7 78OpenLayers 4% 1 67SCCIS Uniview 4% 1 74Worldview 23% 6 85Other 12% 3 77Number of Respondents
Able to request GIBS imagery using the web service you preferAble to request in preferred web service 92% 24 79Not able 8% 2 70Number of Respondents
November 2014
26
26
26

32 © 2014 CFI Group. All rights reserved.
Most (92%) are able to request GIBS imagery in their preferred web service.
Just under one-third (31%) redistribute the imagery in some manner.
Over 90% request GIBS imagery in their preferred format
GIBS Service Respondent Information
Percent Frequency CSIAble to request GIBS imagery in the format you preferAble to request in preferred format 92% 24 79Not able 8% 2 70Number of Respondents
Format usedPNG 42% 10 82KML 21% 5 82GeoTIFF 29% 7 78Other 8% 2 67Number of Respondents
Uses of the near real-time GIBS imageryWithin your project 69% 18 78For redistribution 12% 3 79Customization, then distribution 19% 5 82Number of Respondents
November 2014
26
24
26

33 © 2014 CFI Group. All rights reserved.
All of the rated questions for each LANCE service area were averaged to come up with an overall service area score.
There is a 6 point difference between the highest and lowest rated service areas with GIBS at 83 and Rapid Response at 77.
GIBS highest rated among LANCE service areas
Summary
Service Area Comparison
83
82
80
79
77
Rapid Response FIRMS Data Worldview GIBS

34 © 2014 CFI Group. All rights reserved.
Respondents chose the service they wanted to rate. FIRMS and Data Download were the most rated.
Those who rated FIRMS services had the lowest overall CSI score.
CSI Score by Service Area Rated
Percent Frequency CSIService surveyedData download 34% 250 78FIRMS 36% 263 76Rapid Response image subsets 17% 128 78Worldview 10% 73 80Global Imagery Browse Services 4% 26 79

35 © 2014 CFI Group. All rights reserved.
Rapid Response Search and Download Visualization rates lower than the other two service areas.
GIBS Search and Download Visualization rates highest
Search and Download Visualization Service Area Comparison
Search and Download Visualization
83
82
77
Rapid Response Track Worldview Track GIBS Track

36 © 2014 CFI Group. All rights reserved.
Search and Download Data ratings are in the high 70s for both the Data and FIRMS service areas.
Data and FIRMS rate closely
Search and Download Data Service Area Comparison
Search and Download Data
79
78
FIRMS Track Data Track
37 © 2014 CFI Group. All rights reserved.
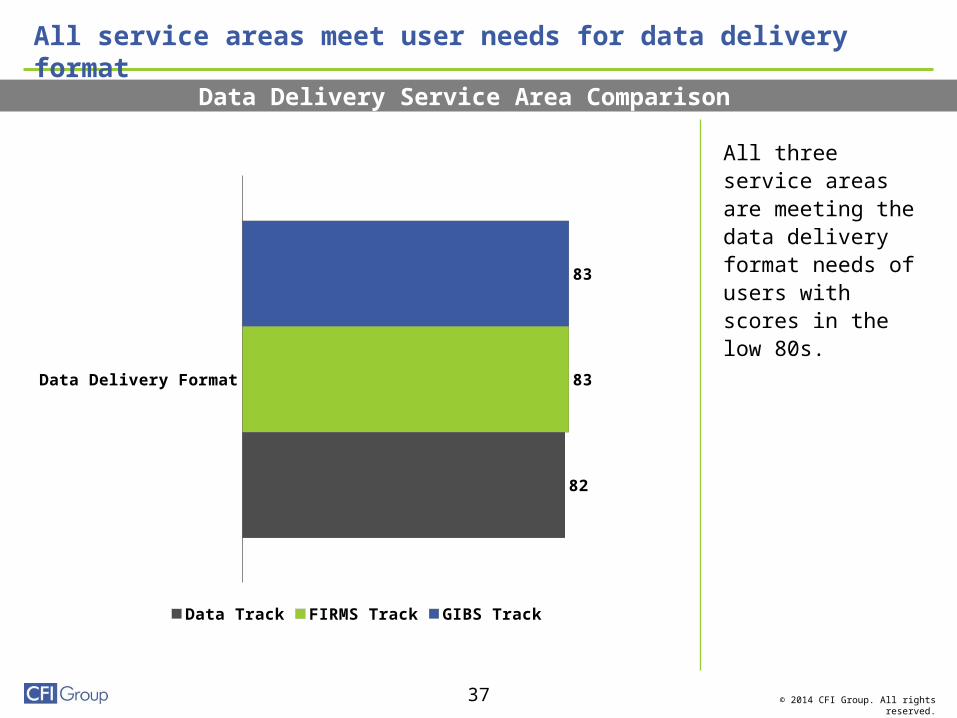
All three service areas are meeting the data delivery format needs of users with scores in the low 80s.
All service areas meet user needs for data delivery format
Data Delivery Service Area Comparison
Data Delivery Format
83
83
82
Data Track FIRMS Track GIBS Track

38 © 2014 CFI Group. All rights reserved.
FIRMS and Data service area users are similarly satisfied with both Search and Delivery attributes.
Scores range from the high 70s to mid 80s.
FIRMS and Data service areas on par with each other for Search and Delivery
Data Search and Delivery Service Area Attribute Comparison
Convenience of delivery
Ease of downloading data
Timeliness of data availability
Ease of finding data you want
82
81
81
77
85
81
81
78
FIRMS Track Data Track

39 © 2014 CFI Group. All rights reserved.
Ease of finding and downloading imagery scores in the low to mid 80s for all three service areas.
Rapid Response real-time scores were much lower than the Wordview.
Some attribute scores are not available for GIBS due to low sample.
Users are satisfied with both Ease of Finding and Download of image
Rapid Response Worldview and GIBS Visualization Search Comparison
Ease of downloading imagery
Ease of finding imagery you want
Timeliness of image availability
Timeliness of image availability- real time
Ease of finding imagery you want- real time
85
81
74
58
57
84
88
78
77
79
83
83
GIBS Worldview Rapid Response

40 © 2014 CFI Group. All rights reserved.
Data service respondents rate Search and Download capabilities in the high 70s/low 80s.
Search and Download capabilities meet Data service respondents’ needs
Data Service Respondents – Search and Download
Search and Download - Data
Ease of downloading data
Ease of finding data you want
79
81
77
November 2014
41 © 2014 CFI Group. All rights reserved.
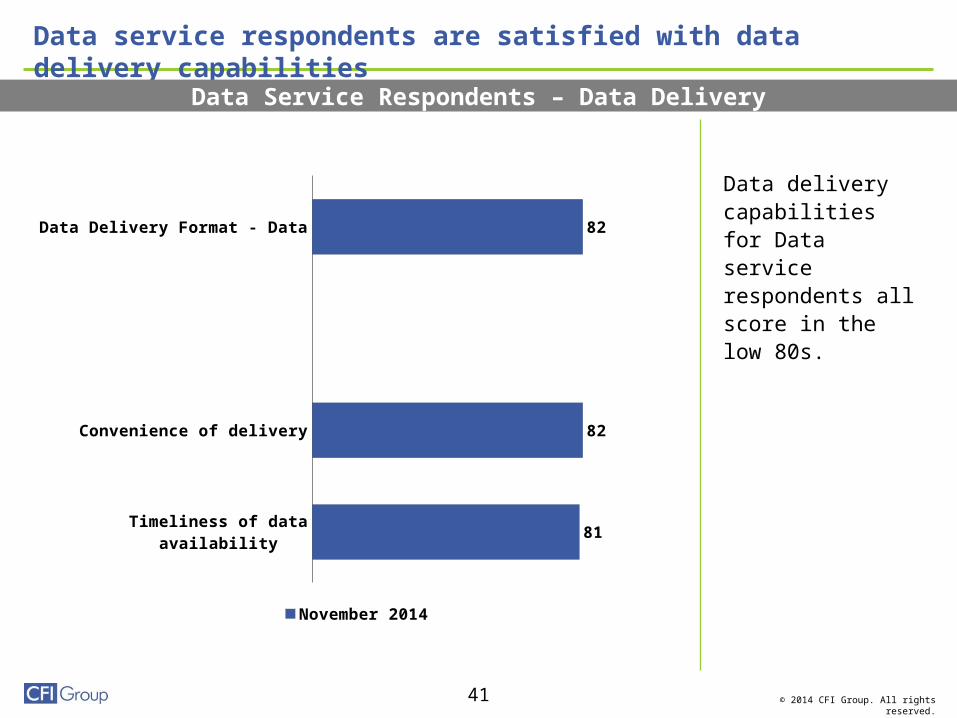
Data delivery capabilities for Data service respondents all score in the low 80s.
Data service respondents are satisfied with data delivery capabilities
Data Service Respondents – Data Delivery
Data Delivery Format - Data
Convenience of delivery
Timeliness of data availability
82
82
81
November 2014
42 © 2014 CFI Group. All rights reserved.
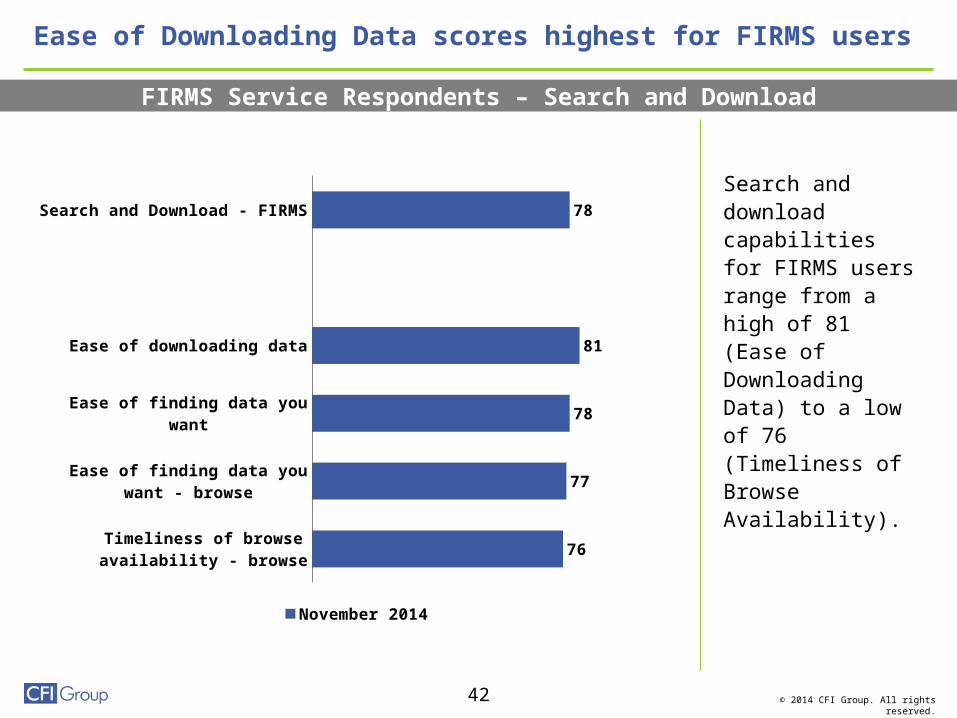
Search and download capabilities for FIRMS users range from a high of 81 (Ease of Downloading Data) to a low of 76 (Timeliness of Browse Availability).
Ease of Downloading Data scores highest for FIRMS users
FIRMS Service Respondents – Search and Download
Search and Download - FIRMS
Ease of downloading data
Ease of finding data you want
Ease of finding data you want - browse
Timeliness of browse availability - browse
78
81
78
77
76
November 2014
43 © 2014 CFI Group. All rights reserved.
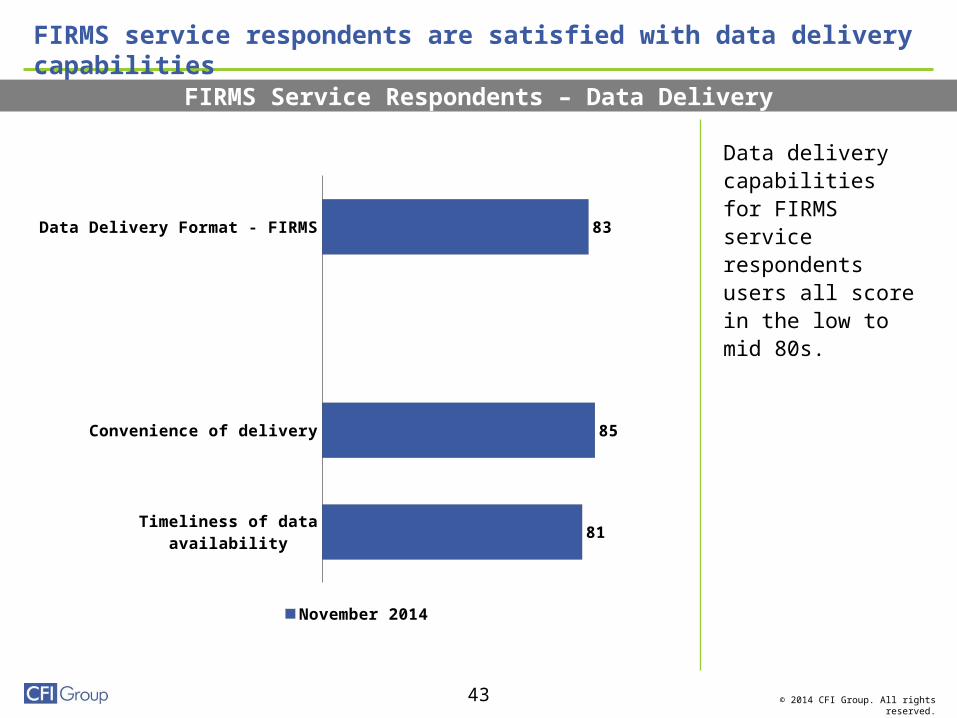
Data delivery capabilities for FIRMS service respondents users all score in the low to mid 80s.
FIRMS service respondents are satisfied with data delivery capabilities
FIRMS Service Respondents – Data Delivery
Data Delivery Format - FIRMS
Convenience of delivery
Timeliness of data availability
83
85
81
November 2014

44 © 2014 CFI Group. All rights reserved.
Rapid Response users are quite satisfied with ease of finding and downloading imagery.
Real time ease of finding and image timeliness score much lower (high 50s).
Real time Image Availability and Ease of Finding rate lowest
Rapid Response Service Respondents – Search and Download
Search and Download - Rapid Response
Ease of downloading imagery
Ease of finding imagery you want
Timeliness of image availability
Timeliness of image availability - real time
Ease of finding imagery you want - real time
77
85
81
74
58
57
November 2014

45 © 2014 CFI Group. All rights reserved.
With scores in the high 70s to high 80s, users are generally satisfied with Worldview Search and Download capabilities.
Worldview users were particularly pleased with the Ease of Finding Imagery (88).
Ease of Finding Imagery scores highest for Worldview users
Worldview Service Respondents – Search and Download
Search and Download - Worldview
Ease of finding imagery you want
Ease of downloading imagery
Ease of downloading data granules
Ease of finding imagery you want - real time
Timeliness of image availability
Timeliness of image availability - real time
82
88
84
84
79
78
77
November 2014

46 © 2014 CFI Group. All rights reserved.
GIBS’ Search and Download capabilities mostly score in the mid 80s with Quality of Service Documentation at 79.
GIBS users are satisfied with Search and Download capabilities
GIBS Service Respondents – Search and Download
Search and Download - GIBS
Quality of imagery
Timeliness of image availability
Quality of service documentation
83
85
83
79
November 2014
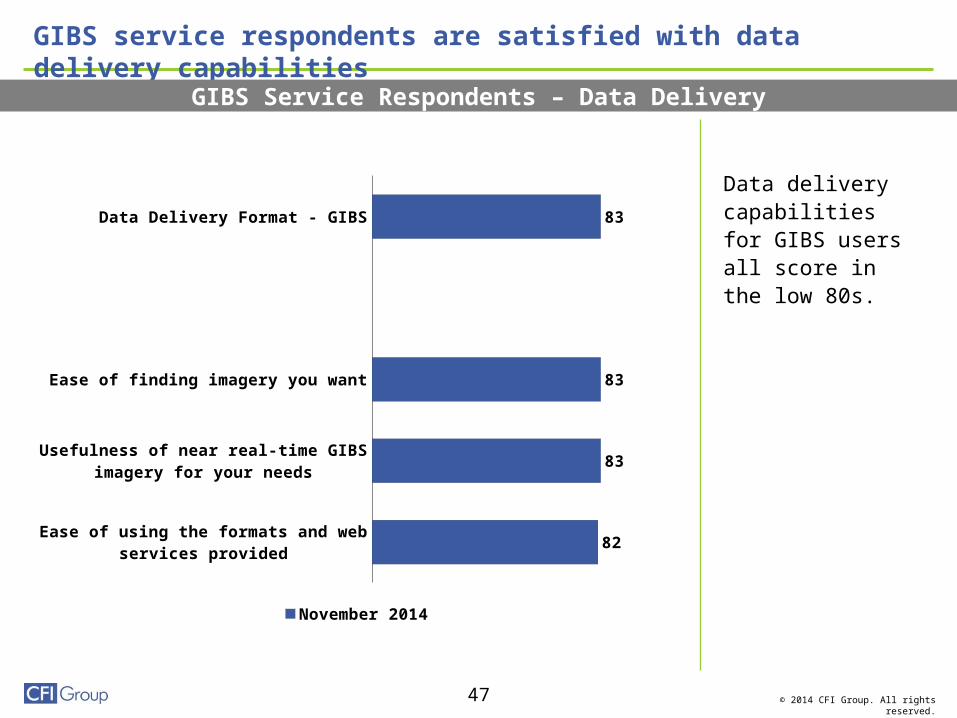
47 © 2014 CFI Group. All rights reserved.
Data delivery capabilities for GIBS users all score in the low 80s.
GIBS service respondents are satisfied with data delivery capabilities
GIBS Service Respondents – Data Delivery
Data Delivery Format - GIBS
Ease of finding imagery you want
Usefulness of near real-time GIBS imagery for your needs
Ease of using the formats and web services provided
83
83
83
82
November 2014

Summary and Recommendations

49 © 2014 CFI Group. All rights reserved.
The measure of Customer Satisfaction with NASA LANCE is 77, down just one point from 2013. This is 11 points above the current federal government average.
Scores for Quality Components or drivers of satisfaction were in the high 70s to mid 80s. Customers were highly likely to recommend products from NASA LANCE, as well as highly likely to use them again. Both areas had ratings in the high 80s.
Search & Download Visualization had the highest impact on satisfaction. This component measures the ease of finding and downloading imagery. Ease of Downloading Imagery (84) rose 5 significant points from last year.
Data & Imagery Delivery Format and Customer Support are the next highest impact areas. Data & Imagery Delivery Format measures the convenience and timeliness of image delivery. Convenience (83) rated slightly higher than Timeliness (81) again this year. Nearly one-quarter (22%) of customers used Customer Support and 90% of the time they received the help needed on the first request. Customer Support was still the highest rated area with a score of 85 despite significant drops in Professionalism (-4) and How Well the Issue was Handled (-3).
Although Search & Download Data and Usage of LANCE Products had the lowest impact scores among all the drivers, both still had a sizeable impact on satisfaction. Both Search & Download Data and Usage of LANCE Products were relatively flat at 78 and 82 respectively.
Summary and Recommendations

50 © 2014 CFI Group. All rights reserved.
The survey also collected background information about NASA LANCE users
LANCE websites (67%) and Internet Searches (50%) were the most common methods to search for products and services.
Fires (60%) vegetation (40%) and weather (39%) were the most common areas of need.
Data downloading, (58%) and FIRMS (51%) were the most commonly used LANCE NRT services.
In terms of the useful timeframe for LANCE NRT products, nearly half (48%) indicated a timeframe of less than 3 hours.
In most cases (91%), users were able to find the information they needed. Just over a quarter (28%) download data on a daily basis.
Most of the time (90%) users are able to download in their preferred format which is split between FTP (51%) and HTTPS (43%).
About one-quarter (25%) of respondents replied that they were not informed when data was not available, but the percentage that Never Experienced Unavailability (35%) rose 7 points from 2013.
Summary and Recommendations
51 © 2014 CFI Group. All rights reserved.
Summary and Recommendations
Based on the findings from the 2014 survey, we make the following recommendations to NASA for LANCE NRT:
Search and Download Visualization is the highest impact area. Scores are good, but there may be some area to improve by increasing the ease of finding and downloading imagery. The ability to set up download criteria to enable automatic downloads would greatly streamline the Search/Download process and may improve Timeliness. This desire is best described by the following user, “It could be great if you could define your own area of interest, e.g. 4 corner coordinates, and then automatically get that NRT cut-out available for download every day.” It should be noted that Timeliness scores were much lower for Non-US locations. This may be due to lower connectivity/internet standards in some countries.
Data and Imagery Delivery Format and Method is the second highest area of impact
and has a very solid rating of 82. It appears that most users are satisfied with the download format, as 90% of respondents are able to download in their preferred format. There does seem to be some room for improving the quality of images delivered however. While most users were thankful for the image, they also expressed a desire for sharper images. Any improvement in image quality would be received favorably.

52 © 2014 CFI Group. All rights reserved.
Customer Support is used by nearly one-quarter of customers (22%) and most (90%) got resolution on the first request. While Customer Support is the highest rated driver at 85, it has experienced some declines in both Professionalism (85) and How Well the Issue was Handled (83). While customer support is still an area of strength, it should be monitored to ensure the drops in Professionalism and Issue Handling are not symptoms of an underlying larger issue that could erode satisfaction in the near future. This will help ensure a high level of customer support for LANCE NRT users.
Search and Download Data and Use of LANCE NRT Products are also still high areas of impact. While scores in these areas are good, satisfaction can be positively influenced if NASA can improve in the area of ease of use. Ease of using products rates rather low (63) for those individuals who cannot download in their preferred format. Only 10% were not able to do so, but providing more formatting options (or helping convert these users to FTP or HTTPS formats) for data and imagery may be an area to improve scores for this segment of users.
Summary and Recommendations

Appendix

54 © 2014 CFI Group. All rights reserved.
The Math Behind the Numbers
x1
x2
x3
x4
x5
x6
lx1
lx 3
lx4
lx5
lx6
y1
y
2y3
ly3
ly2
ly 1x1
x2
h1
xi xi t i= +l x d , for i=1,2,3 t=1,2y j yj j= +l h e1 , for j =1,2,3
b1
b2
h b x b x z1 1 1 2 2 1= + +
lx2
A discussion for a later date…or following this presentation for those who are interested.

55 © 2014 CFI Group. All rights reserved.
Attributes (questions on the survey) are typically answered on a 1-10 scale
> Social science research shows 7-10 response categories are optimal
> Customers are familiar with a 10 point scale
Before being reported, scores are transformed from a 1-10 to a 0-100 scale
> The transformation is strictly algebraic; e.g.
> The 0-100 scale simplifies reporting:• Often no need to report many, if any, decimal places
• 0-100 scale is useful as a management tool
A Note About Score Calculation
Orig. (1-10) Trans. (0-100)1 02 11.13 22.2
8 77.89 88.9
10 100

56 © 2014 CFI Group. All rights reserved.
Deriving Impacts
• Remember high school algebra? The general formula for a line is:
y = mx + b
• The basic idea is that x is a “cause” and y is an “effect”, and m represents the slope of the line – summarizing the relationship between x & y
Y
X
Y
X
• CFI Group uses a sophisticated variation of the advanced statistical tool, Partial Least Squares (PLS) Regression, to determine impacts when many difference causes (i.e., quality components) simultaneously effect an outcome (e.g., Customer Satisfaction)

Thank you
CFI GROUP625 Avis DriveAnn Arbor, MI 48108
734.930.9090 (tel)734.930.0911 (fax)
CFI GROUP WORLDWIDE
MICHIGAN (USA) - Ann Arbor
ENGLAND (UK) – London
SWEDEN - Stockholm
ITALY - Milan
CHINA - Shanghai
BRAZIL - Porto Alegre