nasa - pennsylvania state university
TRANSCRIPT
NASA Contractor Report 181968
Shuttle Upper Atmosphere Mass
Spectrometer (SUMS): Data Analysis
ST Systems Corporation (STX) 17 Research Drive Hampton, VA 23666
Contract NASI-16385
March I987
NASA National Aeronautics and Space Administration
Langley Research Center Hampton, Virginia 23665-5225

A.b s t r ac t
This report presents results and status of work performed
under contract NAS1-16385, Phases I1 and 111, covering software
development and flight data analysis for the Shuttle Upper
Atmosphere Mass Spectrometer (SUMS) qxperiment. A descriptive
summary of the SUMS Flight Data Reduction and Analysis System
(software) is presented, including details of the inlet rediction
algorithm. Static and dynamic calibration test procedures are
discussed and results of the tests are presented. A discussion
of ongoing analysis efforts is included. The results of flight
data analysis for the SUMS 61-C (STS-32) mission are attached to
this report. This was the only SUMS flight during the contract
period and failure of the protection valve caused l o s s of science
data.
i
TABLE O F CONTENTS P a s e
Abstract .................................................. i
SECTION 2 . SUMS FLIGHT DATA REDUCTION AND ANALYSIS SYSTEM 0 . 2-1
Data P r o c e s s i n g Flow and P r o g r a m D e s c r i p t i o n s .... 2-1 2 . 1 . 1 SUMSTRP ................................... 2-2 2 . 1 . 2 SUMSRED ................................... 2-2 2 . 1 . 3 CONVSED ................................... 2-3 2 . 1 . 4 SCANOUT .................................... 2-3 2 . 1 . 5 PCMSEG .................................... 2-3 2 . 1 . 6 CONVHFE ................................... 2-3 2 . 1 . 7 SUMPATH ................................... 2-4 2 . 1 . 8 SUMSBET ................................... 2-4 2 . 1 . 9 SUMS9TRK. PATH9TRK. BET 9TRK .............. 2-4
2 . 1 . 1 1 READPEAKS ................................. 2-5 2 - 1 - 1 2 I 2 8 POOL .................................. 2-5
- 2 .1 .10 SUMS ...................................... 2-4
- 2 . 1 . 1 3 BET POOL .................................. 2-5 2 - 1 - 1 4 PATH POOL ................................. 2-5 2 . 1 . 1 5 TW POOL ................................... 2-6 2 - 1 - 1 6 TINF POOL ................................. 2-6 2 . 1 . 1 7 MW POOL ................................... 2-6 2 - 1 - 1 8 POOL PLOT ................................. 2-7 2 - 1 - 1 9 I N R E D RVO ................................. 2-7 2 - 1 - 2 0 I N R E D RVC ................................. 2-7 2 - 1 . 2 1 SUMSAERO .................................. 2-7
- - - -
- -
2 . 2 I n l e t R e d u c t i o n P r o c e s s .......................... 2-8 2 . 2 . 1 SUMS A n a l y t i c Model ....................... 2-8 2 . 2 . 2 I n l e t System F l i g h t Data
R e d u c t i o n A l g o r i t h m ..................... 2-10 2 . 2 . 3 I n l e t Data R e d u c t i o n L o g i c ................ 2-12
2 . 3 Data Management .................................. 2-16
SECTION 3 . SUMS CALIBRATION .............................. 3-1
3 . 1 S t a t i c C a l i b r a t i o n ............................... 3-1 3 . 2 Dynamic C a l i b r a t i o n .............................. 3-2
3 . 2 . 1 Dynamic T e s t P r e s s u r e P r o f i l e ............. 3-2 3 . 2 . 2 T e s t P r o c e d u r e ............................ 3-4 3 . 2 . 3 T e s t Cases ................................ 3-5 3 . 2 . 4 T e s t R e s u l t s ............................... 3-5
ii i

TABLE O F CONTENTS ( c o n t i n u e d )
Page
S E C T I O N 4 . S U P P O R T I N G ANALYSES ........................... 4-1
4.1 Flow F i e l d A l g o r i t h m ............................. 4-1 4.2 H I R A P D e r i v e d D e n s i t y V a r i a t i o n s ................. 4-2 4.3 A C I P R a t e G y r o D a t a A n a l y s i s ..................... 4-5
S E C T I O N 6 . L I S T O F F I G U R E S ............................... 6-1
ATTACHMENT A - I N T E R I M REPORT ............................. A-1
iv
SECTION 1 - INTRODUCTION
This report covers work performed under Phase I1 and 111 of
contract NAS1-16385 ending March 31, 1987. (Phase I results were
reported in Reference 1.) It includes a description of the SUMS
Flight Data Reduction and Analysis System, a description of the
SUMS calibration technique, and a discussion of support analyses
conducted during SUMS development. The interim final report: for
the only SUMS flight (STS-32, 61-C) was completed in May, 1986,
and is included with this report as Attachment A.
The procedures and software necessary for the reduction and
analysis of SUMS calibration test data were completed prior to
the test performance at the University of Texas-Dallas (UTD).
The test data were processed and analyzed at LaRC and the
calibration constants derived from this analysis were
incorporated into the flight data reduction software.
The SUMS Flight Data Reduction and Analysis System software
was completed before the launch of Shuttle Orbiter Columbia, OV-
102 , on the 61-C mission in January, 1986. Prior to this first
flight, the software system had been checked out using the OEX-
CCT tapes recorded during the OEX Integrated Systems Test (IST)
at NASA/JSC and during the OEX Integrated Vehicle Test (IVT) at
NASA/KSC.
Flight data from the 61-C mission were processed with
virtually no problems and the spectral data from SUMS were
available for review within 24 hours of receipt of data tapes at
LaRC. Analysis of the 61-C flight data showed an apparent
,
1-1

failure of the instrument to measure any ambient gas samples and
subsequent hardware tests confirmed that the protection valve had
failed closed.
During the STS stand-down since mission 51-F, some software
enhancement based on 61-C experience has been accomplished.
Analysis of HIRAP derived atmosphere density data from ten
flights has been performed with the objective of ensuring that
the SUMS software can accommodate the actual density variations
occurring during flight. The large gradients observed in some
HIRAP results could present a problem for SUMS with respect to
dynamic response if these gradients are in fact atmospheric.
A l s o , techniques for combining angular acceleration data derived
from the A C I P rate gyros with the SUMS data have been
developed. This capability will expand the aerodynamic analysis
to include moment coefficient as well as force coefficients.
1-2
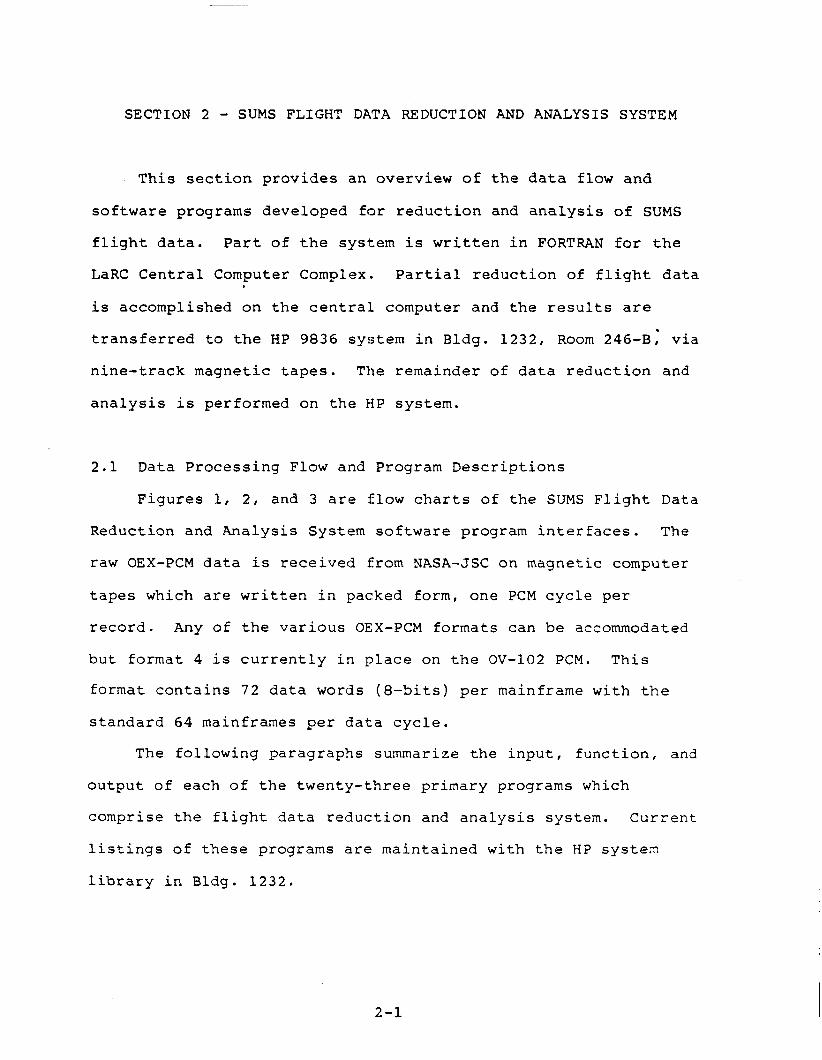
SECTION 2 - SUMS FLIGHT DATA REDUCTION AND ANALYSIS SYSTEM
This section provides an overview of the data flow and
software programs developed for reduction and analysis of SUMS
flight data. Part of the system is written in FORTRAN for the
LaRC Central Computer Complex. Partial reduction of flight data
is accomplished on the central computer and the results are
transferred to the HP 9836 system in Bldg. 1232, Room 246-B, via
nine-track magnetic tapes. The remainder of data reduction and
analysis is performed on the HP system.
2.1 Data Processing Flow and Program Descriptions
Figures 1, 2, and 3 are flow charts of the SUMS Flight Data
Reduction and Analysis System software program interfaces. The
raw OEX-PCM data is received from NASA-JSC on magnetic computer
tapes which are written in packed form, one PCM cycle per
record. Any of the various OEX-PCM formats can be accommodated
but format 4 is currently in place on the OV-102 PCM. This
format contains 7 2 data words (8-bits) per mainframe with the
standard 64 mainframes per data cycle.
The following paragraphs summarize the input, function, and
output of each of the twenty-three primary programs which
comprise the flight data reduction and analysis system. Current
listings of these programs are maintained with the Hi? systez
library in Bldg. 1232.
2-1

2 . 1 . 1 SUMSTRP
SUMSTRP b u f f e r s i n each PCM d a t a cycle a s a record and then
unpacks t h e record t o r e t r i e v e t h e 4608 e i g h t - b i t PCM words. The
I R I G - B time code fo r each mainframe i s decoded and the SUMS words
i n channels 47 , 48, and 49 a r e s t r ipped out . These da ta are
output i n binary format t o magnetic tape , t h ree time words and
t h r e e SUMS words per mainframe.
2.1.2 SUMSRED
S U M S R E D i s t h e major program i n the c e n t r a l computer p a r t of
t h e SUMS system. I t reads t h e SUMS PCM data t ape and processes
the da t a on the b a s i s of SUMS scan i n t e r v a l s of f i v e seconds.
The time words a t t he beginning of a SUMS scan a r e converted t o
GMT seconds t o e s t a b l i s h the scan reference t i m e . F i l l words
containing t h e SUMS instrument s t a t u s f l a g s a re i d e n t i f i e d and a
r u n n i n g record of each s t a t u s f l a g i s maintained. Changes i n
s t a t u s a r e output t o t h e I n s t r u m e n t S t a tus Summary. UAMS
engineering da ta i s s t r ipped f r o m t he word 4 7 , 48 stream and
output a s p a r t of the S U M S scan d a t a on t h e Science and
Engineering Data ( S E D ) t ape . SUMS engineering da ta i n channel 49
a re deca l ib ra t ed and output t o t h e High Frequency Engineering
(HFE) data f i l e . F i n a l l y , the SUMS science da ta words a r e
deca l ib ra t ed and output i n u n i t s of ion cur ren t t o the SED
t ape . D u r i n g t h i s e n t i r e process , a r u n n i n g record of d a t a gaps
i s maintained and output a s t h e Data S ta tus Summary.
2 -2
2.1.3 CONVSED
CONVSED reads the SED tape and outputs the data words to a
'local file via a formatted write. Ten data words are written to
each of 38 records of 132 characters each, representing a
complete SUMS scan of science and engineering data. The local
formatted output file is processed via the system routine TCOPY
to create an output 9-track tape containing 132 column card
images in ASCII. This tape serves as the data interface bekween
the central computer facility and the HP 9836 system for SUMS
science and engineering data.
2.1.4 SCANOUT
SCANOUT reads the SED file and prints selected scans for
review and analysis. The print format includes all science,
engineering, and status data for a complete scan.
2.1.5 PCMSEG
PCMSEG reads the SUMS PCM file and outputs selected segments
of the raw PCM data to a 9-tra.ck interface tape for transport to
the HP 9836 system. This capability facilitates the
reconstruction of SUMS scans which may be out of sync due to data
gaps in the CCT.
2.1.6 CONVHFE
CONVHFE performs a similar function to that of CONVSED in
that the high frequency engineering data is output to a 9-track
interface tape for transport tqo the HP 9836 system.
2 - 3
2.1.7 SUMPATH
Th i s program reads the P o s t f l i g h t A l t i t ude and Tra j ec to ry
History ( P A T H ) t ape f o r o r b i t a l f l i g h t and s t r i p s t h e parameters
usefu l t o SUMS ana lys i s . Data is output t o a 9-track i n t e r f a c e
tape.
2 1 - 8 SUMSBET
SUMSBET s t r i p s r een t ry t r a j e c t o r y da t a from t h e Best
Estimated Tra jec tory (BET) tapes and records the da ta on a 9-
t r a c k i n t e r f a c e tape .
2.1.9 SUMSSTRK, PATHgTRK, BET 9 T R K
These programs a r e s imi l a r i n t h a t t h e y read the 9- t rack
i n t e r f a c e tapes f o r S U M S science and engineering d a t a , PATH
o r b i t a l t r a j e c t o r y and a t t i t u d e d a t a , and r een t ry BET t r a j e c t o r y
and a t t i t u d e d a t a , respec t ive ly , and convert t h e A S C I I formatted
da ta t o i n t e r n a l H P f l o a t i n g poin t numbers. The r e s u l t s a r e
s tored i n t h e appropr ia te f i l e s on t h e HP hard d i s c .
2.1.10 SUMS
S U M S inputs t h e SUMS science and engineering data from the
hard d i s c and "picks" t h e appropriate ion cu r ren t peak from t h e
360 high mass s t eps and 7 2 l o w mass s t e p s fo r each of the
spec i f i ed in t ege r A M W values . The r e s u l t s a r e s to red on t h e
appropr ia te "PEAKS" f i l e . T h i s program a l s o p l o t s a l l t h e ion
cu r ren t peaks f o r each scan a s a s p e c t r a l plot versus AMU or s t e p
number.
2 -4
2 . 1 . 1 1 READPEAKS
READPEAKS p l o t s t h e se l ec t ed peaks versus t i m e f o r t h e
e n t i r e r een t ry o r o r b i t a l sequence. I t a l s o c a l c u l a t e s t h e mass
f r a c t i o n f o r each peak with respec t to t o t a l mass and ou tpu t s
t h i s parameter with t i m e and t h e AMU 2 8 ion c u r r e n t .
2 . 1 . 1 2 I 2 8 POOL - I28 POOL reads t h e I 2 8 f i l e and updates the SUM POOL n ' f i l e - - -
on hard d i s c , where n = s e r i a l number fo r t he r e spec t ive SUMS
f l i g h t . The times of range valve c losure , i n l e t valve c l o s u r e
and e n t r y i n t e r f a c e a r e updated i f des i r ed .
2 . 1 . 1 3 BET POOL - BET POOL reads t r a j e c t o r y da ta a t one second measurement -
i n t e r v a l s from t h e BET f i l e and SUMS scan reference times a t f i v e
second i n t e r v a l s from t h e SUMS - POOL - n f i l e . Tra jec tory
parameters a r e i n t e r p o l a t e d t o SUMS scan reference times and
s tored on the SUM POOL n f i l e . - -
2.1.14 PATH POOL - PATH POOL reads t h e o r b i t a l da ta a t one second i n t e r v a l s on -
t he PATH f i l e and S U M S scan reference times a t f i v e second
i n t e r v a l s on t h e SUM POOL - n f i l e . Tra jec tory parameters a r e - i n t e rpo la t ed t o SUMS scan reference times and s tored on t h e SUM
POOL n f i l e . -
2 -5
2.1.15 TW POOL - TW POOL replaces the wall temperature (T,) on the -
SUM POOL n file. Scan reference times and altitudes are read
from the POOL file.
from
is updated for each flight either from preflight predictions for
quick-look data reduction or from flight measurements for final
data reduction.
- - T, is interpolated to scan reference times
The T, table table of T, versus altitude in the program.
2.1. 16 TINF POOL - T I N F POOL replaces the free-stream temperature on the -
SUM POOL n file. Scan reference times and altitudes are read
from the POOL file. Free-stream temperature is calculated from
the 1976 U.S. Standard Atmosphere kinetic temperature equations
as a function of altitude at each scan reference time. Results
are stored on the POOL file. This program can be updated in the
future to accommodate other kinetic temperature models if
desired.
- -
2.1.17 MW POOL - MW POOL reads scan reference times and altitude from the -
SUM POOL n file. Mean molecul.ar weight from the 1976 U.S. - - Standard Atmosphere equations is calculated for each scan
reference time and output to the POOL file. This program can be
modified to calculate mean molecular weight from the actual S U M S
flight measurements for final flight data reduction.
2-6
2 . 1 . 1 8 POOL PLOT
POOL PLOT i s a p l o t u t i l i t y program which p l o t s any se l ec t ed - parameter i n t h e POOL f i l e versus any o ther parameter i n t h e
f i l e .
2.1.19 I N R E D RVO - INRED RVO c a l c u l a t e s t h e p a r t i a l AMU 2 8 o r i f i c e p r e s s u r e -
from SUMS AMU 2 8 ion c u r r e n t measurements f o r t h e data inte;val
when t h e range valve i s open. The process f o r t h i s c a l c u l a t i o n
i s described i n d e t a i l i n paragraph 2 . 2 . Output of t he reduced
p a r t i a l o r i f i c e pressure i s t o an intermediate file for inpu t t o
INRED RVC. -
2.1.20 I N R E D RVC - INRED RVC accomplishes the same t a sk a s INRED RVO except the - -
data i n t e r v a l i s during t h e range valve open per iod . Optional
p l o t t i n g of r e s u l t s i s ava i l ab le .
2 . 1 . 2 1 S U M S M R O
SUMSAERO performs the following functions:
0 computes dynamic pressure from reduced o r i f i c e p re s su re
and f l o w f i e l d algorithrn
0 computes f r e e stream dens i ty from dynamic pressure and
ve loc i ty
0 computes Knudson number
0 computes viscous i n t e r a c t i o n parameter
2 -7

A l l 1/0 f o r SUMSAERO i s v i a keyboard on prompt or from the
SUM - POOL - n f i l e . Results a r e a v a i l a b l e a l s o through a p l o t
op t ion .
2 . 2 I n l e t Reduction Process
This paragraph descr ibes t h e algorithm f o r reduct ion of SUMS
f l i g h t measurements t o i n l e t o r i f i c e pressure va lues . A lumped-
parameter e l e c t r i c a l network analogy was used t o der ive a rtiath
model of t h e SUMS sys t em response t o a time v a r i a n t o r i f i c e
pressure . This model was cal.ibrated aga ins t the ac tua l
instrument response obtained from a s e r i e s of s t a t i c and dynamic
c a l i b r a t i o n t e s t s . I t then provided t h e a n a l y t i c bas i s f o r the
i n l e t da t a reduct ion algorithm.
2 . 2 . 1 SUMS Analytic Model
The a n a l y t i c model used t o p r e d i c t t he SUMS response t o a
time v a r i a n t o r i f i c e pressure i s described i n Reference 2 . The
model i s based on an e l e c t r i c a l network analogy f o r which t h e
d i f f e r e n t i a l equations descr ibing t h e network response were
solved. This so lu t ion was incorporated i n t o a computer code
which outputs t h e instantaneous SUMS ion source pressure f o r a
given o r i f i c e pressure h i s t o r y . The code a l so outputs t h e r a t i o
of pred ic ted ion source pressure t o t h e t h e o r e t i c a l s t a t i c ion
source pressure a t the given instantaneous o r i f i c e pressure .
This parameter, r e f e r r ed t o a s t h e " f r a c t i o n of s t a t i c p re s su re" ,
i s a measure of t h e dynamic pressure l a g of the SUMS i n l e t
system. Since t h e f r a c t i o n of s t a t i c pressure i s predic ted t o be
2-8

as low as 0 .70 during flight, compensation for dynamic lag in the
data reduction process is necessary to avoid large errors in
interpretation of the SUMS flight data.
The model equation for ion source pressure, P I S , as a
function of orifice pressure, POR, with POR varying as Po + kt, is
PIS = PN(t) + AM (Po + kt) + MBk
where PN(t) = natural response term (torr)
= orifice pressure at t = o (torr)
k = slope of orifice pressure with time
(torr/sec)
t = time (sec)
A , B , M = coefficients dependent on network parameters
(note: some elements of the network are
functions of orifice pressure)
Since PN -f 0 as t + aand k = o for a constant or static orifice
pressure, this equation reduces to
PIS = AMPOR
for the static case, with AM equal to the static pressure drop of
the SUMS inlet system. The fraction of static pressure is then
2-9

PN + AM (Po + k t ) + MBk ' IS(DYN) - - 'IS (STAT I AM (Po + k t ) R =
PN + MBk - - + AM (Po + k t )
which depends upon the natural. response h i s t o r y described by PN
and t h e magnitude of t h e o r i f i c e pressure s lope, k , fo r g iven
system c h a r a c t e r i s t i c s described by A, B , and M.
As previously s t a t e d , the c o e f f i c i e n t s A, B , and M depend
upon t h e model network parameters. The network i s defined by
lumping the d i s t r i b u t e d conductances of t h e i n l e t system and the
UAMS terminat ion i n t o f i v e d i s c r e t e r e s i s t i v e elements and
lumping t h e d i s t r i b u t e d volumes of t h e system i n t o four d i s c r e t e
capac i t i ve elements. E r r o r s assoc ia ted with t h i s approach a r e
pr imar i ly i n t h e "lumping" process and i n the a n a l y t i c
assumptions behind the equations used t o c a l c u l a t e conductance
(Reference 3 ) . Concern over t he magnitude of t hese e r r o r s
motivated t h e performance of a s e r i e s of dynamic c a l i b r a t i o n
t e s t s which serve t o benchmark t h e model aga ins t t h e a c t u a l
system response.
2.2 .2 I n l e t System F l igh t Data Reduction Algorithm
The bas ic equation fo r the i n l e t system da ta reduction s t e p
i s given i n Reference 1 a s
2-10
where At = the five second interval between successive samples
of a given mass number (secs)
APN = change in natural response contribution to ion source
pressure over At (torr)
APIS = change in total ion source pressure over At (torr).
PIS, PN = values of total ion source pressure and natural
response contribut-ion to ion source pressure at end
of interval at (torr)
A problem arises at this point because SUMS provides the ion
current produced by a given source pressure, but because of the
addition of the inlet system t-he mass spectrometer is "closed"
and must be calibrated indirectly for sensitivity in terms of ion
current produced per unit -- orifice pressure. The source pressure
is unknown and is never measured. This requires PIS to be
expressed in terms of POR in j.ts static relationship as developed
in 2.2.1,
PIS = AM POR.
Static calibration determines the sensitivity coefficient, S,
which is the ratio of ion current produced per unit orifice
pressure. This gives
I ,!I I APIs = AM - S PIS = AN s 7
Substituting these expressions in the reduction equation gives
2-11
where subsc r ip t s 1 and 2 r e f e r t o any t w o successive f l i g h t data
measurements a t t h e SUMS scan i n t e r v a l of f i v e seconds, A t . This
i s t h e f i n a l form of t h e i n l e t reduct ion algorithm as programmed
i n t h e SUMS f l i g h t da t a reduct ion software s y s t e m .
2 . 2 . 3 I n l e t Data Reduction Logic
The i n l e t reduct ion algorithm i s used with t h e SUMS a n a l y t i c
model l o g i c t o c a l c u l a t e i n fe r r ed o r i f i c e pressure values from
i n f l i g h t measurements of ion cur ren t . This s e c t i o n desc r ibes the
major l og ic elements of t h e computer rou t ines and t h e l o g i c a l
process f o r performing t h e ca l cu la t ions .
Figure 4 shows t h e expected v a r i a t i o n of mass 28 ion cur ren t
measurements t o be obtained i n f l i g h t with the SUMS inst rument .
This represents t h e raw f l i g h t da ta a f t e r conversion of t he
d i g i t a l l y encoded range and s igna l l e v e l values t o ac tua l ion
cu r ren t valves. The time i n t e r v a l shown i s between the t i m e a t
which H I R A P begins t o provide useable da t a and the time a t which
t h e S U M S i n l e t valve c loses . The sharp drop i n t h e middle i s the
poin t a t which t h e range valve c loses . T h e dashed l i n e a t t h i s
po in t dep ic t s t h e t h e o r e t i c a l system response t o range valve
c losu re fo r an i n f i n i t e pumping speed and no su r face
desorpt ion. I n t h i s case t h e measurements immediately a f t e r
range valve c losure would be useable f o r da ta reduct ion s i n c e
they would represent only t h e con t r ibu t ion of t h e atmospheric
gas . However, because of t he source pumping speed (15 cc / sec )
2-12
and some N2 desorp t ion from su r faces , the a c t u a l s igna l w i l l
f o l l o w the s o l i d l i n e . For severa l scans the s igna l con t r ibu t ion
of the res idua l gas i n t h e source i s a s i g n i f i c a n t percentage of
t he t o t a l s i g n a l so t h a t even small e r r o r s in modeling the decay
c h a r a c t e r i s t i c of t h e system cause l a r g e errors i n t h e reduced
da ta . This e f f e c t i s seen more c l e a r l y i n Figure 5 where t h e ion ,
cur ren t has been adjusted a f t e r range valve c losu re t o account
fo r t h e increased pressure drop a f t e r t h a t t i m e . This figur'e
d e p i c t s the ion cu r ren t t h a t would r e s u l t i f t h e small leak were
l e f t on and t h e analyzer were capable of measuring the h ighe r
c u r r e n t s , except t h a t t he l a r g e spike would not occur. This
spike i s due t o t h e aforementioned f i n i t e pump down which
r equ i r e s about 30 t o 40 seconds t o complete a f t e r the range valve
i s c losed .
The f i r s t s t e p i n the i n l e t reduction process i s t h e
generat ion of a " s t a t i c " o r i f i c e pressure p r o f i l e . I f t h e f l i g h t
measurements of ion c u r r e n t s a r e assumed t o have been made a t
s t a t i c o r i f i c e pressure condi t ions , t h e in fe r r ed o r i f i c e p re s su re
i s ca lcu la ted by the simple r e l a t i o n s h i p
- '28 - - 'ORLSTATIC) s2*
t o which the i n l e t reduct ion algorithm reduces f o r s t a t i c
condi t ions . Applying t h i s r e l a t i o n s h i p t o t h e curve of F igure 4
produces the curve shown on Figure 6 . The sharp spike following
range valve c losu re occurs because t h e s t a t i c assumption does not
account f o r the con t r ibu t ion t o s igna l of the background gas i n
2-13

t he ion source during t h e pump down a f t e r range valve c losu re .
T h e " s t a t i c " o r i f i c e pressure p r o f i l e produces pressure
magnitudes within f i v e t o t h i r t y percent of a c t u a l o r i f i c e
pressure valves and s lopes within two percent of ac tua l except
during the leak switch t r a n s i e n t . The t r a n s i e n t problem i s
handled by d e l e t i n g da ta over t h e t r a n s i e n t i n t e r v a l and t r e a t i n g
the d a t a s e t i n two segments r e f e r r e d t o as range valve open
(RVO) and range valve closed (RCV), t he two segments lying ljefore
and a f t e r t he t r a n s i e n t , r e spec t ive ly . Each of t h e two segments
a re f i t t e d with a polynomial t o smooth t h e measurement "noise"
which i s expected t o be about 3% maximum.
Simulation of SUMS response t o the s t a t i c POR p r o f i l e s
generates a r rays of values f o r A , B , M and PN a t each f i v e second
i n t e r v a l over t h e da ta spans. These values a re then u s e d w i t h
and 528 i n t h e complete reduct ion equation t o c a l c u l a t e
valves of POR which include the e f f e c t s of dynamic lag and
na tu ra l response of t he system. Figure 7 shows t h e typ ica l
d i f f e rences between t h e a c t u a l POR and t h e reduced values
determined by the process a s j u s t described.
Figure 8 d e p i c t s t h e major l og ic of t h e i n l e t reduct ion
process with the add i t iona l s t eps required t o complete the
process f o r a l l atmospheric c o n s t i t u e n t s . The f i n a l reduced
values of POR,28 a r e combined with the s t a t i c POR,28 t a b l e t o
c a l c u l a t e t he f r a c t i o n of s t a t i c pressure fo r mass 28. This
f r a c t i o n i s assumed t o hold t r u e f o r a l l species and i s used t o
c a l c u l a t e the p a r t i a l o r i f i c e pressure, PoR,i f o r each of t h e
spec ies by the r e l a t i o n s h i p
2-14

I i
where PORI.,
R28
‘28
F( s )
*i
~
R28 ’28 F(s)
= p a r t i a l o r i f i c e pressure f o r t h e ith specie , t o r r
= f r a c t i o n of s t a t i c pressure f o r mass 28
= mass 2 8 s e n s i t i v i t y , amp/torr
= c polynomial f o r t h e f r a c t i o n a l n=o,5 ‘ i , n l i s e n s i t i v i t y of spec ie i with r e spec t t o s28
= f l i g h t measured ion cu r ren t f o r ith specie , dmps
F i n a l l y , t he t o t a l o r i f i c e pressure i s computed as
’OR = “ O R , i
The a c t u a l species t o be included i n t h i s s t e p of the S U M S da ta
reduct ion a re determined i n an e a r l i e r s t e p which s e l e c t s t h e
s p e c i f i c peaks t o be processed by subsequent rou t ines . T h e
c r i t e r i a for s e l ec t ion w i l l be determined during post f l i g h t
ana lys i s of the ind iv idua l mass spec t r a fo r each scan. The
computer f i l e which inputs the ion c u r r e n t measurements t o t h e
i n l e t reduct ion rout ines w i l l only contain da ta fo r the
previously se lec ted peaks.
The ana lys i s of SUMS mass s p e c t r a l p l o t s t o determine
chemistry and contaminate e f f e c t s w i l l be an ongoing process
a f t e r f l i g h t with considerable unce r t a in ty a s t o when r e s u l t s
w i l l be ava i l ab le ; consequently, t h e need e x i s t s fo r a quick-look
c a p a b i l i t y for d a t a reduct ion which produces a reasonable f i r s t -
order es t imate of the f l i g h t r e s u l t s . Provision has been made a t
2-15
t he end of t he i n l e t reduction process ( s e e bottom-right of
F i g u r e 8 ) t o t e s t a f l a g fo r quick-look processing and, i f t h i s
f l a g i s t r u e , a quick-look algorithm i s appl ied t o the mass 28
p a r t i a l pressures t o produce a t o t a l pressure es t imate . Th i s
algorithm can accommodate any a r b i t r a r y funct ion f o r t o t a l
p ressure r e l a t e d t o n i t rogen p a r t i a l pressure a s determined from
atmosphere models. The a l t i t u d e vs. t i m e h i s t o r y f o r u s e i n t h i s
algorithm can be e i t h e r t h e p r e f l i g h t pred ic t ion or Best
Estimated Tra jec tory ( B E T ) when ava i l ab le .
2 . 3 Data Management
The very l a r g e q u a n t i t i e s of data obtained from one f l i g h t
of S U M S and t h e plans f o r mul t ip le f l i g h t s r equ i r e s a t t e n t i o n t o
the problem of da ta management. The da ta management plan
developed f o r S U M S i s intended t o minimize the number and volume
of d a t a f i l e s while simultaneously maintaining des i r ed
f l e x i b i l i t y during t h e da t a reduction process and minimizing the
recovery e f f o r t required i n the event of a f i l e media f a i l u r e .
The c r i t i c a l S U M S da ta f i l e i s t h e science and engineering
data f i l e . After t h i s f i l e i s success fu l ly s tored on the H P hard
d i s c and archived 3.5 floppy d i s c copies a r e made, a l l preceeding
tapes and f i l e s i n t he process a r e re leased except the OEX-CCT
which i s re ta ined i n d e f i n i t e l y . (This tape i s a l s o archived a t
t he OEX data labora tory a t N A S A / J S C . ) T h e PEAKS f i l e s a r e saved
and archived.
The SUM POOL n f i l e i s created on t h e hard d i s c fo r each - - f l i g h t and w i l l be maintained i n d e f i n i t e l y . This f i l e con ta ins
2-16

the entire pool of data needed for analysis of the SUMS data. It
can be updated when new data becomes available from the various
data sources or when required during analysis. The file can also
be checkpointed at any time and archived at any given state for
future reference. All files which input to the POOL file can be
released after the initial archiving.
2-17
S E C T I O N 3 - SUMS CALIBRATION
This s ec t ion descr ibes the c a l i b r a t i o n t e s t s conducted with
t h e SUMS f l i g h t hardware p r i o r t o the f i r s t SUMS f l i g h t on t h e
STS-32 mission. The d a t a obtained from these tes ts was u s e d t o
determine the s t a t i c s e n s i t i v i t y of t he i n s t r u m e n t t o an ex te rna l
gas sample i n t e r m s of amperes of ion cu r ren t per u n i t o r i f i c e
pressure and t o determine t h e c a l i b r a t i o n constants for t h e ' i n l e t
reduct ion algorithm used f o r f l i g h t da ta reduct ion. The r e s u l t s
of t hese t e s t s a r e va l id f o r the configurat ion a s t e s t ed . Future
S U M S f l i g h t s w i l l be conducted with a d i f f e r e n t conf igura t ion due
t o the "chin panel' ' modification being performed on OV-102 and,
t h e r e f o r e , t h e dynamic response w i l l be changed, requi r ing
r e c a l i b r a t i o n .
3 . 1 S t a t i c Ca l ib ra t ion
S t a t i c c a l i b r a t i o n of SUMS was performed by exposing t h e
i n l e t t o var ious s t a t i c pressures over t h e instrument opera t ing
range and p l o t t i n g t h e r e s u l t s i n terms of ion cu r ren t versus
o r i f i c e pressure . The s lope of t h i s curve i s t h e ' ' s e n s i t i v i t y " ,
S , of t h e instrument, and proved t o be near ly constant f o r SUMS
a f t e r adjustment of t h e ion pump high vol tage from 3500 t o 1800
v o l t s . The measured s e n s i t i v i t y f o r range valve open was 1 . 7 9 x
amperes per t o r r and f o r range valve closed was 1.43 x 10''
amperes per t o r r .
3-1

3.2 Dynamic Calibration
The closed-source configuration of the SUMS system results
in a significant pressure lag in the presence of an increasing
orifice pressure which will occur during reentry.
lag is expected to produce ion current measurements which are
consistent with equiyalent static orifice pressures up to 30%
less than the actual inflight orifice pressures.
is taken into account in the inlet reduction step in the SUM'S
flight data reduction process. The inlet reduction software
employs the SUMS analytic model which, due to simplifying
assumptions and approximations, must be calibrated against the
actual system response to an increasing orifice pressure.
This dynamic
The dynamic lag
3.2.1 Dynamic Test Pressure Profile
The predicted inflight orifice pressure history is
where K(t) varies to first order with the inverse of atmospheric
scale height. Such a pressure-time history is difficult and
costly to simulate in the laboratory and it is not the most
severe test of the analytic model.
A simple and easy to implement test pressure profile is of
the form
'OR = 'f -Kt - e
+ Po
3-2

where Pf i s some f i n a l pressure t o which the o r i f i c e p re s su re
r i s e s exponent ia l ly from an i n i t i a l p ressure of Po.
c h a r a c t e r i s t i c of a volume a t high pressure pumping i n t o a
re ference volume i n i t i a l l y a t high vacuum through a small
o r i f i c e . The parameter K i s determined by the magnitude of the
This r i s e i s
re ference volume and t h e conductance of t h e o r i f i c e . ,
I f K i s very small (very long t i m e c o n s t a n t ) , t he pressure
r ise i n t h e re ference volume w i l l be near ly l i n e a r over a *
considerable period of t i m e from t h e s t a r t . A l i n e a r pressure
r i s e o f f e r s the i n t e r e s t i n g p o s s i b i l i t y of checking r e p e a t a b i l i t y
during t h e dynamic t e s t s because the dynamic response i s
independent of t h e pressure r a t e fo r a l i n e a r r i s e . The equation
fo r f r a c t i o n of s t a t i c pressure i n 2 . 2 . 1 can be wr i t t en t o f i r s t
order f o r a l i n e a r r i s e a s
D B k 1 + - B ‘OR
A ’OR A Po+ K t R = l + - - =
which, f o r Po + 0, reduces t o
A l i n e a r pressure r ise from art i n i t i a l high vacuum a l so o f f e r s
t h e advantage of checking the a n a l y t i c model over a g r e a t e r range
of dynamic response than w i l l occur i n f l i g h t . The f r a c t i o n of
s t a t i c pressure s t a r t s a t zero and r i s e s a t a r a t e dependent upon
t h e r a t i o B/A, eventua l ly converging on 1 . 0 a t l a r g e t .
Figure 9 shows t h e f r a c t i o n of s t a t i c pressure versus time
3-3

a s pred ic ted by the SUMS a n a l y t i c model for pressure r ise r a t e s
of 1 x torr /second with range valve open and 1 x
torr /second with range valve closed.
produced the same curves. The small d i f f e rence between t h e cases
f o r t h e two range valve pos i t ions i s caused by a s l i g h t change i n
t h e r a t i o B/A when switching leak conductances.
Any r a t e s would have
3.2 .2 T e s t Procedure
Figure 10 dep ic t s the tes t hardware conf igura t ion f o r t h e
dynamic c a l i b r a t i o n tes ts . The S U M S o r i f i c e tube was connected
d i r e c t l y t o the t e s t s t a t i o n "cross" which has a volume of about
1 / 2 l i t e r . Nitrogen a t one atmosphere was supplied through a
con t ro l l ed leak w i t h a t ap t o the c r o s s . The vacuum s t a t i o n was
connected t o t h e cross through a manual valve. This valve was
i n i t i a l l y opened f u l l a t t h e beginning of a t e s t . The con t ro l l ed
leak was adjusted t o g ive a pressure of 1 x t o r r a t t h e
re ference volume. The valve was then closed ( t i m e equal z e r o ) ,
s t a r t i n g the t e s t r u n . The subsequent pressure r ise i n t h e
re ference volume would be near ly l i n e a r as discussed i n t h e
previous paragraph. Baratron pressure a t t h e c r o s s and mass 2 8
peak ion cu r ren t s from the SUMS were recorded on s t r i p c h a r t s as
t h e r u n progressed. Subsequent r u n s a t higher pressure r a t e s
were obtained by simply increasing t h e i n i t i a l p ressure through
an increase i n t h e conductance of t h e cont ro l led leak . Doubling
t h e i n i t i a l p ressure doubles the pressure r a t e .
3-4
3.2.3 Test Cases
A t o t a l of s i x dynamic t e s t s were performed. Five of the
t e s t s were r u n with t h e range valve i n i t i a l l y open while t h e
s i x t h was r u n with t h e
s t a r t . Case 1 was r u n
used approximately t h e
a r e t ab led a s follows:
Case #
range valve manually closed a t t he
a few weeks p r i o r t o the o the r t e s t s and
same pressure r a t e as Case 3 . The cases
Range Valve
Pos i t ion
open
11
I I
II
II
closed
I n i t i a l Pressur'e
Rate
2.,09 10-5
1 .45 10-5
2 . 7 5 10-5
4 . 1 2 10-5
9.19 10-5
1.65 10-4
The pressure p r o f i l e s f o r t he t e s t s a r e shown on Figure 11.
3.2.4 Test Results
Figure 1 2 shows t h e v a r i a t i o n w i t h time of t h e AMU 2 8 peak
ion cu r ren t recorded fo r each of t he s i x t e s t cases . T h e d a t a
a r e corrected f o r i n i t i a l s t a t i c background cur ren t measured
p r i o r t o time zero f o r each case. The dynamic l ag i n t he system
response i s c l e a r l y seen on Figures 1 3 and 14 which show t h e
e f f e c t i v e "dynamic s e n s i t i v i t y " compared with the s t a t i c
s e n s i t i v i t i e s f o r range valve open and closed cases ,
3 -5
r e spec t ive ly .
Figure 15 shows a t y p i c a l dynamic c a l i b r a t i o n t e s t
(case 3 ) r e s u l t compared with t h e c a l i b r a t e d model p red ic t ion .
The only adjustment t h a t was made t o the model was t o element C2
which is t h e lumped volume j u s t ahead of t h e l eaks .
t o 8 .0 cc based on b e s t f i t t o t he c a l i b r a t i o n d a t a . Other t e s t
cases agree with t h e c a l i b r a t e d model a s well a s case 3 except
f o r t e s t case 5 . Exhaustive ana lys i s of t h i s case and t h e test
technique f a i l e d t o explain the discrepancy. Future
r e c a l i b r a t i o n t e s t s p r i o r t o the resumption of STS opera t ions
should reveal whether a problem e x i s t s with the higher p re s su re
C2 was set
r a t e s or whether the case 5 r e s u l t was anomalous.
3-6
SECTION 4 - SUPPORTING ANALYSES
This section presents the status and future plans for
several ongoing analyses which are being conducted in support of
the SUMS experiment.
4.1 Flow Field Algorithm
An analysis of the flow field about the Shuttle Orbite? nose
geometry in rarified hypersonic conditions is being conducted in
support of development of the SUMS flow field algorithm which
will relate measured orifice pressures to dynamic pressure.
Partial results of this analysis were published in Reference 4 .
Although not a part of this contract, this analysis effort has
been coordinated with respect to SUMS needs with respect to
flight data reduction and interpretation.
The flow field analysis to date has provided nominal values
of pressure coefficients at several altitudes over the S U M S
measurement range. These coefficients relate the measured
orifice pressures from SUMS flight data to dynamic pressure which
is needed for calculation of aerodynamic coefficients. The
values received to date have been curve fit and the resulting
polynomial coefficients and logic have been incorporated into the
SUMSAERO program.
Future work in this area will include expansion of the
nominal analysis and the generation of error coefficients for
estimation of uncertainties in the overall SUMS analysis results.
4-1

4 . 2 HIRAP Derived Density Variat ions
Infer red f r e e stream atmospheric d e n s i t i e s ca l cu la t ed from
t h e HIRAP normal acce le ra t ion measurements i n d i c a t e the
p o s s i b i l i t y of r a t h e r l a r g e s p a t i a l f l u c t u a t i o n s i n d e n s i t y
r e l a t i v e t o s tandard. This poses t h e p o s s i b i l i t y of l a r g e
g rad ien t s i n SUMS o r i f i c e pressure which may a f f e c t the SUMS
system response and present a problem w i t h reduct ion of f l i g h t
da t a t o o r i f i c e pressure values . T h e previous d iscuss ion iri
Sec t ion 2 of the i n l e t reduction process assumed t h a t t h e o r i f i c e
pressure increases a s a smooth exponential and accuracies quoted
f o r t h e process were based on t h a t assumption. The HIRAP resu l t s
i n d i c a t e l a rge , up t o f 30%, per iodic v a r i a t i o n s , which, i f due
t o atmosphere, could be problematical .
This problem was i n i t i a l l y inves t iga ted by modeling t h e
HIRAP i n fe r r ed v a r i a t i o n a s a s i n e wave w i t h period as observed
and amplitude of f 30 percent of t he standard atmosphere. The
model was used t o develop an o r i f i c e pressure p r o f i l e based on
t h e flow f i e l d algorithm r e l a t i n g dynamic pressure ( d e n s i t y ) t o
o r i f i c e pressure . The o r i f i c e pressure p r o f i l e was used t o dr ive
t h e SUMS a n a l y t i c model which ca lcu la ted t h e AMU 2 8 ion c u r r e n t
including the e f f e c t of dynamic response. The r e s u l t a n t AMU 28
ion c u r r e n t values were then input t o the i n l e t reduct ion
sof tware t o r e c r e a t e the o r i g i n a l o r i f i c e pressure p r o f i l e .
After some changes t o the i n l e t reduction process ( r e s u l t i n g i n
t h e c u r r e n t v e r s i o n ) , the e r r o r s i n t h e reduct ion process were of
t h e order of one percent maximum.
Data for t h e ten HIRAP f l i g h t s t o date have been t r a n s f e r r e d
4 -2

from NOS tapes to the HP 9936 system. These files contain time
trajectory and altitude parameters, normal and axial
accelerations, control surface deflections, and the atmospheric
densities calculated from normal acceleration and normal force
coefficient. The MSIS-83 (reference 5), MSFC/J70 (reference 6),
and the 1976 U.S. Standard Atmosphere (referFnce 7) models were
programmed in BASIC on the H P system and checked out thoroughly
against their respective FORTRAN versions on the CDC system:
Three sets of data files (one for each atmosphere model) were
then generated with data from the H I R A P files combined with model
density, the ratio of H I R A P density to model density, exospheric
temperature, local temperature, local solar time, solar flux, and
geomagnetic index, Ap. various parameters from these files.
A program was then written to plot the
The density ratios for a11 ten cases were plotted and
analyzed. The altitude range for the data is from 60 to 160
km. Below 80 km, the models tend to overpredict compared to the
HIRAP valves. From 80 to 120 km, a wavelike structure with
amplitudes of f 20 percent variation frequently occurs. From 120
km to 160 km, the general model trend is underprediction of
density. These overall trends hold up well when the ten data
sets are averaged, except that the oscillations in the mid range
are diminished because of randomness.
The STS-32 case is particularly interesting because of a
very large gradient in the density ratio around 107 km.
Accepting this gradient as a variation in atmospheric density is
difficult because of the sharp change in inferred scale height by
4 - 3

a f a c t o r of two over a very small a l t i t u d e change, t h ree km.
Even t h e l a t e r a l d i s t ance involved i s very small , l e s s than 150
km. The l i f t t o drag r a t i o , L /D, could be an ind ica to r of any
cause which would produce t h e r e s u l t s of STS-32 because L / D i s
independent of atmospheric dens i ty except f o r t h e long t e r m
v a r i a t i o n with Knudsen number ( r e l a t e d t o d e n s i t y ) . I f t h e L/D
h i s t o r y shows any unusual behavior around 107 k m , a flow f i e l d
e f f e c t o r an impulsive force becomes suspect . L/D h i s t o r i e S fo r
a l l t e n HIRAP f l i g h t s were caLculated with cor rec t ion t o a f o r t y
degree angle of a t t a c k . The STS-32 case shows a d e f i n i t e
f e a t u r e , a "bump", i n L/D around 105 k m where the l a r g e s t
g rad ien t i n i n f e r r e d dens i ty occurs . Similar f ea tu re s a r e
observed i n s i x o ther cases i n t he range of 102 t o 108 k m with
the magnitude of t he e f f e c t varying from s l i g h t t o even more
pronounced than on STS-32. The o the r t h ree cases do not show any
obvious devia t ion from a smooth curve through t h a t region.
Averaging a l l t en L/D h i s t o r i e s produces a curve which i s
very smooth, almost l i n e a r , through the region 100 t o 110 krn as
the flow t r a n s i t i o n s from f r e e molecule t o continuum. S i n c e the
f e a t u r e s i n t he ind iv idua l curves average out over the t e n cases
and s i n c e they do not even occur i n t h r e e cases , one may conclude
t h a t e i t h e r they a r e random and unrelated o r t h a t they a r e
influenced by one or more v a r i a b l e s .
r e l a t e d t o Knudsen number through dens i ty and the re fo re '
i n d i r e c t l y t o a l t i t u d e . D e n s i t y v a r i a t i o n s of f 40 percent i n
t he a l t i t u d e range 100 t o 110 km could be expected from f l i g h t t o
f l i g h t ; t h e r e f o r e , the a l t i t u d e range f o r a given Knudsen number
T h e t h e o r e t i c a l L/D i s
4 -4

would be about f 3 k m , assuming a s c a l e he ight of 6.5 k m (U.S.
Standard a t 105 km). I f t h e f ea tu res a r e commonly r e l a t e d t o
physics of t he flow f i e l d a s influenced by Knudsen number, they
would then be confined t o t h a t a l t i t u d e range, they should
e x h i b i t s imi l a r c h a r a c t e r i s t i c s , and they should occur on every
f l i g h t . Although the f e a t u r e s do f a l l within the a l t i t u d e range,
they d i f f e r q u a l i t a t i v e l y ( i e . , some concave, s o m e convex) and
they do not appear i n a l l cases .
Analysis of t he angle of a t t a c k and a t t i t u d e t h r u s t e r f i r i n g
h i s t o r i e s led t o t h e idea that. a n a l y s i s of t h e A C I P r a t e gyro
da ta might provide f u r t h e r i n s i g h t i n t o the H I R A P r e s u l t s . The
r e s u l t a n t da ta reduct ion and ana lys i s t h a t ensued i s discussed i n
4 . 3 .
4.3 A C I P Rate Gyro Data Analysis
Software programs have been developed t o s t r i p the A C I P r a t e
gyro d a t a from t h e OEX-CCT tapes and t r a n s f e r t h e data f r o m the
CDC system t o t h e H P 9836 system v ia 9-track magnetic t apes .
Analysis programs have been developed t o smooth t h e angular
v e l o c i t y ( p , q , r ) da ta and c a l c u l a t e angular a c c e l e r a t i o n s . The
angular acce le ra t ions a r e used t o c a l c u l a t e t o t a l moment about
t he o r b i t e r body axes which f a c i l i t a t e s c a l c u l a t i o n of t h e moment
c o e f f i c i e n t s . The noment c o e f f i c i e n t of i n t e r e s t i n p a r t i c u l a r
i s the pi tching moment c o e f f i c i e n t .
Rate gyro da ta f o r STS-32, 30 and 24 have been reduced t o
da t e . Analysis of t h i s da ta showed a near cons tan t moment about
t he y body ax i s on t h e o r b i t e r s of about 250 f t l b p r i o r t o the
4 -5

buildup of aerodynamic fo rces during reent ry . This moment swamps
the aerodynamic moment during descent t o about 1 2 0 km. The
majori ty of the moment i s caused by t h e APU exhaust which i s
d i r ec t ed upward a t t h e a f t body. Detailed ana lys i s of t h e STS-24
data during the i n t e r v a l around APU-2 and 3 t u r n on shows an
increase i n angular acce le ra t ion t o 2 .05 x
u n i t s come on l i n e . The value j u s t before t h e i r t u r n on was
9 .02 x deg/sec2, r e s u l t i n g i n a d i f f e rence of 1.15 x
T h i s d i f f e rence is t w o t h i r d s of t h e t o t a l APU induced moment,
for a t o t a l of 1 . 7 2 x T h i s
compares w i t h a ca l cu la t ed value of 1 . 9 5 x based on t h r u s t
deg/sec2 a s these
deg/sec* f o r a l l t h r e e A P U ' s .
and moment arm.
T h e r e s idua l moment i n t he STS-24 data a f t e r sub t r ac t ing the
ca lcu la ted e f f e c t of a l l t h r e e A P U ' s i s about 40 f t l b . T h i s
res idue increases l i n e a r l y t o 58 f t l b a t en t ry i n t e r f a c e . Par t
of t h i s "residue" could be due t o v a r i a t i o n s i n APU exhaust
t h r u s t magnitude ( t h e c a l c u l a t i o n i n t he previous paragraph
implied equal t h r u s t s ) and t h e long term increase could be due t o
increase i n g r a v i t y g rad ien t torque d u r i n g descent . F u r t h e r
study of t h i s problem w i l l be done t o develop as accurate a
technique for removing the b i a s a s poss ib l e .
T h e r a t e gyro /p i tch ing moment a n a l y s i s i s only p a r t i a l l y
complete a t t h i s time but w i l l be continued during a fu tu re
c o n t r a c t . The a n a l y s i s should aid t h e ove ra l l HIRAP d e n s i t y
ana lys i s e f f o r t and w i l l be a valuable addi t ion t o the SUMS-HIMP
ana lys i s for f u t u r e f l i g h t s . The software developed f o r t h i s
a n a l y s i s w i l l be incorporated i n t o t h e SUMS F l i g h t Data Reduction
4-6

and Analysis System.
4-7
SECTION 5 - REFERENCES
1. H i n s o n , Edwin W . , " F i n a l R e p o r t f o r P h a s e I , C o n t r a c t NAS1-'
1 6 3 8 5 , SASC P r o j e c t 6 0 6 7 " , Systems a n d A p p l i e d S c i e n c e s
C o r p . , Hampton, VA, November, 1981.
2 . H i n s o n , Edwin W . , "SUMS P r e l i m i n a r y D e s i g n a n d Data A n a l y s i s
Deve lopmen t" , NASA CR-165696, May 1981.
3 . Dushman, S a u l , " S c i e n t i f i c F o u n d a t i o n s of Vacuum T e c h n i q u e ' ' ,
2nd E d i t i o n , J o h n Wiley a n d S o n s , N . Y . , 1 9 6 2 .
4 . Moss, J. N . and B i r d , G . A . , "Monte Carlo S i m u l a t i o n s i n
S u p p o r t of t he S h u t t l e Upper Atmospheric Mass S p e c t r o m e t e r
E x p e r i m e n t " , AIAA P a p e r 85-0968, J u n e , 1985 .
5. H e d i n , A . E . , "A R e v i s e d T h e r m o s p h e r i c Model Based o n Mass
S p e c t r o m e t e r and I n c o h e r e n t S c a t t e r Data: MSIS-83", J G R ,
V o l . 8 8 , p. 1 0 1 7 0 , 1 9 8 3 .
6 . J o h n s o n , Dale L. and S m i t h , Robert E . , "The MSFCIJ70 O r b i t a l
A tmosphere Model and t he D a t a Bases for the MSFC S o l a r
A c t i v i t y P r e d i c t i o n T e c h n i q u e " , NASA TM-86522, Novenber ,
1 9 8 5 .
7 "U S. S t a n d a r d Atmosphere, 1 9 7 6 " , U . S. Government P r i n t i n g
O f f i c e , October, 1 9 7 6 .
5-1
SECTION 6 - LIST OF FIGURES
Fig. 1 SUMS Flight Data Processing Flow, Mainframe Segment.
Fig. 2 SUMS Flight Data Processing Flow, HP-9836 Segment, Part 1 of 2.
Fig. 3 SUMS Flight Data Processing Flow, HP-9836 Segment, Part 2 of 2.
Fig. 4 Predicted AMU 28 Ion Current.
Fig. 5 Relative I28 Corrected for Dynamic Range.
Fig. 6 Static Approximation to POR History.
Fig. 7 Error Between Reduced and Actual POR.
Fig. 8 Inlet Reduction Logic.
Fig. 9 Typical Predicted Dynamic Test Response.
Fig. 10 Dynamic Calibration Test Configuration.
Fig. 11 Dynamic Calibration Test Orifice Pressures.
Fig. 12 Dynamic Calibration Test Ion Currents.
Fig. 13 Typical Dynamic Sensitivity, Range Valve Open.
Fig. 14 Typical Dynamic Sensitivity, Range Valve Closed.
Fig. 15 Typical Comparison of Dynamic Test with Calibrated Model.
6-1

I- z w t W w cn w
IY a LL Z
U t
H
13 -7
c
H
0 l-
4 a
!- I u -I LL
H
i c3
c3
LL H
t
r
i
i
1 I
I I
6-2

FIG. 2 SUMS FLIGirT DATA PROCESSING FLOW HP-9836 SEGMENT, PART 1 O F 2
MA I N F R A M E Ai lCHIVE ON S Y S T E M 3.5 F L O P P Y
1 SUMS k- SPECTRA PLOTS
rSAINFRGHE PETHSTRK (FIG. 3) S Y S T E M
MAINFRSME --@-jGw-- DATE ( F I G . 3 1
S Y S T E i l TAPE I--
6 - 3

FIG. 3 SUMS FLIGHT DATA PROCESSING FLOW HP-9836 SEGMENT, PART 2 OF 2
, i
TINF-POOL -:
i
6-4

FIGURE 4 PREDICTED AMU 2 8 I O N CURRENT
1 .E-€
1 . E-5
1 .E-!C
1.E-I1
l.E-12
1 . E-6
1 . E-7
1 .E-8
1 .E-9
J . RANGE VALVE CLOSURE
100 280 308 480
T I M E , SECONDS
5 0 0 6
FIG. 5 RELATI‘JE I 2 8 CO22ECTED FOR DY”. F!AI:GE
1 . E- 1 1 f---4-- :d El ! 00 200 300 400 500 620
TIME, SECONDS
6 -5
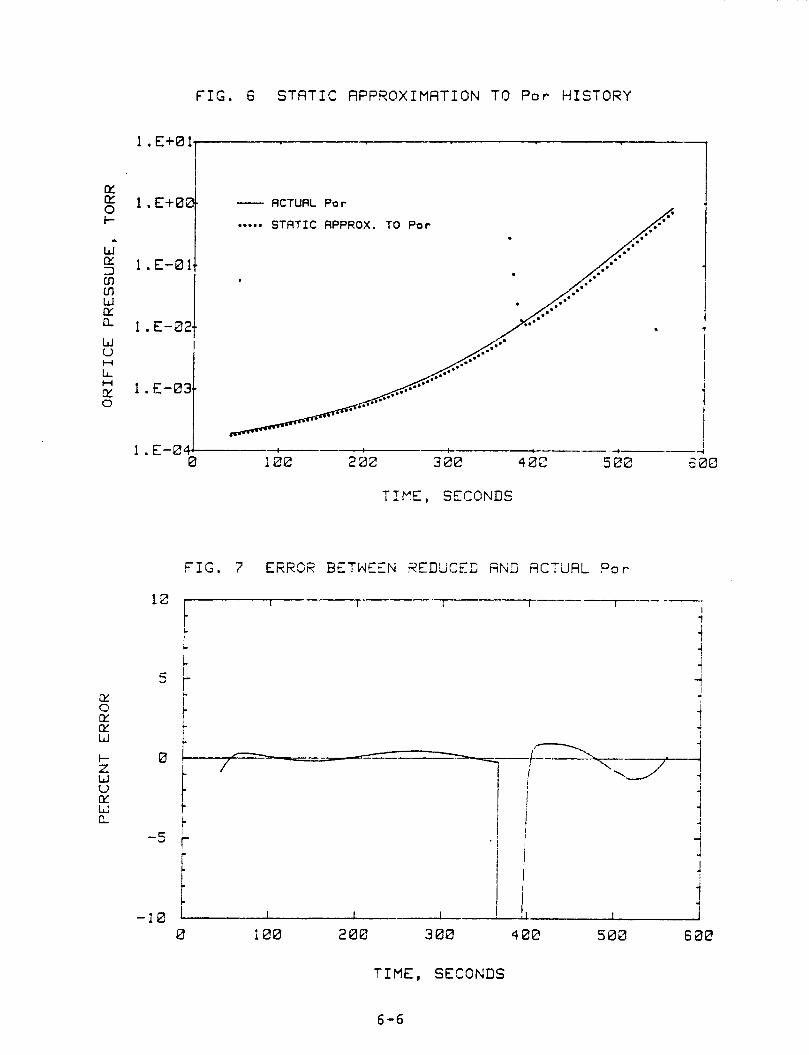
FIG. 6 S T R T I C APPROXIMATION TO Por H I S T O R Y
I-
"
W 0
IL H
H E 0
1 .E+81
ACTUflL P o r
-*=.- STATIC APPROX. TO Por
I 1 I
4
1. E-02,
I i 1. E-E4 -- ___e--+--- a-- 4
0 1 ee 222 3 aiz 4ai2 52a sao
TIFE, SECONDS
FIG. 7 ERRCR BETWEEN 2EDUCED AN5 i?CTUAL P o r
0 206 3 0a 4 0@
T I M E , SECONDS
6-6
FIG. 8 INLET REDUCTION LOGIC
POLYNOMIAL F I T OF Por VS t F O R
DflTA SEGMENT
I ( 2 8 ) ONLY GENERATE STATIC Por VS t TRBLE RMU 28 ONLY
i
I
-- t -- i CALCULATE TRRLE 1
O F FRflCTICN OF i STRTIC PRESSURE
! I -.--- I
-1 I__-
.\ QUICK- \ YES1 W I C K - L O C K 1 LOOK >d A!..G3RITHY FOR I
PASS? /’ j TCTAL P o r I --- ,’
t
6 -7
FIG. 9 TYPICAL PREDICTED DYNAMIC T E S T RESF'ONSE
W E 3 m tn w E a w 0 E 3 0 cn u I- I- Lo
L 0
z 0
I- V U E L
H
a
H
1.0
0.8
Q . 6
0.4
0 .2
a . O
- RRNGE VFIL'JE OPEN PRESS!JRE RATE - 1.0E-5 TORR/SEC
0 0 0 RRNGE V R L V f CLOSED PRESSLIRE RATE 1.0E-4 TCRWSEC
+-..----- ! -----A 50 : 00 150 2 00 2 5 0
T I M E , SECONCS
i -- i I ' N2
I
SPHERE
i4IGI-i PRESSUXE GAS SL;P?LY
---/ r- SUMS - -1 I I-!
RANUAL VALVE
PUMP , -r-
FIG. IC DYNSMIC CALIBRFiTION TEST C O N F I G U R f l T I O N
6-8
FIG. 1 1 DYN. CAL. TEST ORIFICE PRESSURES
(k: E 0 I-
W DL 3 tn tn W (k:
W u LL
CE 0
-
a
H
H
1 .E-81
1 . E-82
1. E-03
1 . E-E4
! . E-05
! . E-e8
I . E-29
1 .E-:@
1 .E-l1
1 .E-12, I
--
TEST +1 - TEST +3 0 0 0
w
5 0 : t30 158
TIME, SECObiDS
FIG. 12 m r d . CRL. TEST I O N CURRENTS
2 0 0 2 10
i I
TEST + 1 -- I TEST +3 0 0 3
i TEST +4 - TESfliS I
c_L_I -_--- ---- 1 I I
1
I I I
--- I ---
I
--- 5 0 10e 150 2Q0 2 5 0
TIME, SECONDS
6-9
FIG. 13 TYPICRL D Y N A M I C SENSITIVITY RANGE VALVE OPEN
1 ~
fY E 0 c
I
w Q! 3 in cn w E
W u LL
ai 0 \ ID N
a
H
n
+-I
1. E-E
1. E-? 0 TEST +1 DYNAflIC SENSITIVITY
0
0
0
0
--.- __e +-- 1 .E-8 0 5e 1 zc !5E 2@8 2 5 8
TIP?€, SECCNDS
FIG. !4 T'IPICFIL DYKFiMIC S E N S I T l V I T Y R W G E VFILVE CLOSE3
. -- I -- -I
I 1 1 . E - 8 .
I
0
TIME, SECONDS
6-10

FIG. 15 TYPICFIL COMPRRISGN G F DYN. TEST WITH CRLIBRATED MGGEL
1
. 8
.6
.$
. 2
e 0
TIYf, SECONDS
6-11

ATTACHMENT A
INTERIM REPORT
Interim Report
Results of Shuttle Upper Atmosphere Mass Spectrometer (SUMS)
61-C Flight Data Analysis
Edwin Hinson
NAS1-16385
May 1986
A-2
T a b l e of C o n t e n t s
P a a e
1.0 I n t r o d u c t i o n ............................................ 1
2 . 0 SUMS 61-C O r b i t a l O p e r a t i o n s ............................ 3
2 . 1 Orb i t a l Sequence D e s c r i p t i o n ....................... 3
3.0 SUMS 61-C Reen t ry O p e r a t i o n s ............................ 6
2 . 2 F l i g h t D a t a R e s u l t s from O r b i t a l Sequences ......... 4
3.1 R e e n t r y Sequence D e s c r i p t i o n ........................ 6 3.2 F l i g h t Data R e s u l t s from Reen t ry Sequence .......... 6
4 .0 V a r i a t i o n i n Background L e v e l s .......................... 8
5.0 Conclus ions ............................................. 9
A-3

1.0 Introduction
The Shuttle Upper Atmosphere Mass Spectrometer ( S U M S ) installed on Shuttle Orbiter OV-102 (Columbia) was flown for the first time on Shuttle Flight 61-C in January, 1986. 'Columbia was launched on January 12, 1986, at Kennedy Space Center and landed at Edwards AFB, Cal., on January 18, 1986. This was Columbia's first flight after extensive modification which included the installation of S U M S and other major Orbiter Experiments Project (OEX) flight hardware.
The major objective for S U M S on this first flight was to demonstrate its operational status and to collect data on gas composition and density at the S U M S inlet port during reentry. This data would allow assessment of the S U M S inlet system design parameters and would facilitate the determination of hypersonic, rarified flow aerodynamic coefficients in the transition regime in conjunction with the High Resolution Accelerometer Package ( H I R A P ) . A secondary objective was to evaluate the on-orbit performance of the S U M S system and the procedures for making S U M S / H I R A P measurements of atmospheric density and accelerations during orbital operations. For this purpose, a series of three orbital sequences were executed during the mission.
S U M S flight data was recorded on the OPS-1 recorder during the orbital sequences and the early segment of reentry up to entry interface minus 50 seconds. Reentry data from entry interface minus 105 seconds to landing was recorded on the O E X recorder. The OPS-1 sequences in orbit were dumped to the Hawaii ground station on a telemetry channel and processed via JSC to LaRC using the OEX ground data system. The reentry segnents on the OPS-1 and OEX recorders were processed through the OEX data system after return of Columbia to KSC. All SUMS flight data was successfully processed through the SUMS flight data reduction system at LaRC with no probleas. Mass spectra plots were available on the HP 9836 system typically within 2 4 hours of data receipt at LaRC.
Analysis of data from the three orbital sequences showed apparently normal instrument operation but no evidence of atmospheric or contaminant gases other than preflight background levels in the mass spectra. Engineering parameters were all within specification and all valves were commanded open. The reentry data also showed normal instrument operation and all valves commanded open but also no evidence of atmospheric or contaminant gases. The expected valve closures failed to occur at the predicted times and no rises in the at3ospheric gas peaks were observed. The contingency command to close all valves was issued by the S U M S sequence and control logic when the inlet pressure transducer reached the maximum of 5 . 4 torr at low altitude. These flight data results indicated a possible valve malfunction or clogged filter which prevented atmospheric gas from reaching the mass spectrometer through the inlet system.
A-4
SUMS was removed from Columbia at KSC and ground tests were conducted to determine the reason for the apparent in-flight malfunction. The tests at KSC provided preliminary indication that the protection valve had failed closed. SUMS was then transported to the University of Texas at Dallas (UTD) where further tests confirmed erratic operation of the protection valve.
A-5
2.0 SUMS 61-C Orbital Operations
SUMS was designed to measure partial pressures of atmospheric gas constituents at the SUMS inlet port in the transition region between free molecular flow at orbital . altitudes and continuum flow after reentry. Practical considerations dictated some tradeoff of measurement range at high altitudes. Yet measurement of atmospheric gases at orbital altitudes is possible given the right conditions of altitude and solar activity, the two major variables affecting density in the thermosphere. Successful measurement of atmospheric parameters with SUMS in conjunction with HIRAP acceleration measurements at orbital altitudes would greatly enhance knowledge of free- molecular flow aerodynamics of the Orbiter.
Mission 61-C was flown during the period of very low solar activity within the current 11 year sunspot cycle. The orbital altitude was also higher than initially planned because of lower payload weight. These factors virtually eliminated the possibility of making aerodynamically useful orbital measurements with SUMS and HIRAP on this mission. Figure 1 was generated with postflight values of observed 10.7 cm solar flux and shows that ion currents generated by atmospheric nitrogen and oxygen at the 61-C altitude would have been an order of magnitude below background levels and therefore undetectable.
The merit of performing the SUMS orbital sequences can certainly be questioned in light of such pessimistic predictions. The factors which entered into the decision to perform them anyway were the very light crew workload on mission 61-C making the Orbiter readily available for the required attitude maneu-vers, the relatively unpredictable solar activity, and the potential secondary benefits such as contaminant and background measurements.
Figure 2 is of interest regarding future attenpts to rake orbital measurements with SUMS fo r aerodynamic purposes. ';?lis graph was generated for high solar activity which should prevail before the SUMS flights are completed due to the Shuttle program delay caused by the Challenger l o s s . Adequate atr&ospheric signal levels are indicated at 300 km and below.
2.1 Orbital Sequence Description
The S U M S flight operations on mission 61-C were specified by Detailed Test Objective (DTO) 0902, JSC-16725, Revision G. This DTO establishes the SUMS corrmand history and orbiter attitu2e maneuvers required to perform the orbital sequences.
The baseline sequence contained in DTO 0902 is summarized briefly as follows: (1) SUMS and HIRAP power is applied 2 hours before the sequence for warmup, ( 2 ) the orbiter is maneuvered nose down, SUMS orifice forward at a pitch attitude of -110 degrees, ( 3 ) data recording is started, ( 4 ) the orbiter is
A- 6

pitched negat ive ly a t 0.5 deg/sec t o r o t a t e the o r i f i c e through t h e v e l o c i t y vec tor up t o an a t t i t u d e of +90 degrees , and ( 5 ) the recorder i s stopped and SUMS/HIRAP powered o f f . The Orb i t e r maneuver provides maximum projected a rea which c r e a t e s maximum drag a c c e l e r a t i o n f o r HIRAP a t the beginning and end of t h e sequence and a l s o provides zero angle of a t t ack of the SUMS port (maximum s e n s i t i v i t y t o atmosphere) near t he middle of t h e sequence. P robab i l i t y of sensing t h e atmosphere is maximized by performing the sequence a t l oca l s o l a r time equal t o 1400 h o u r s ( t h e middle of t h e d iu rna l bu lge) .
Only one o r b i t a l sequence was implemented f o r SUMS d u r i n g t h e p r e f l i g h t mission planning fo r 61-C. This sequence was o r i g i n a l l y scheduled for day 4 of a nominal 5 day mission. I n f l i g h t , t h e mission was f i r s t shortened by one day and t h e SUMS sequences rescheduled fo r day 3 . Subsequently, t h e mission was extended t o 6 days because of KSC weather problems, allowing two a d d i t i o n a l S U M S o r b i t a l sequences during t h i s per iod of very low Orbi te r a c t i v i t y . The t h r e e SUMS o r b i t a l sequences a re i d e n t i f i e d and labe led a s ORB-1 , ORB-2, and ORB-3.
2 . 2 F l i g h t Data Results from Orb i t a l Sequences
The t a r g e t values fo r i n i t i a l p i t c h a t t i t u d e , p i tch a t t i t u d e r a t e , and f i n a l p i t c h a t t i t u d e for t h e SUMS o r b i t a l sequences were -110 deg., 0 . 5 deg/sec, and +90 deg, r e spec t ive ly , w h i l e holding yaw and r o l l angles w i t h i n t h e range of f10 deg. Tolerances on p i t c h angles were f 5 deg. N o t o l e rance was spec i f i ed f o r p i t c h r a t e d u r i n g the maneuver b u t values i n t?-ie range of 0 .4 t o 2 degrees per second a r e considered acceptab le . The a c t u a l a t t i t u d e r a t e s achieved d u r i n g the mission were 0.83, 0 . 4 9 , and 0.53 deg/sec fo r ORB-1 , ORB-2, and ORB-3, r e spec t ive ly .
Figures 3 , 4 , and 5 show the angle of a t t ack h i s t o r i e s f o r t h e S U M S i n l e t p o r t r e l a t i v e t o the ve loc i ty vec to r for each of the o r b i t a l sequences. These f igures a r e approxiEations wh ich were constructed from a t t i t u d e r a t e gyro outputs . The i n i t i z l and f i n a l a t t i t u d e s a r e assumed t o meet t he t a r g e t c r i t e r i a b u t t h i s assumption has not been confirmed t o da te . n e s e graphs w i l l be updated w i t h t h e ac tua l reduced a t t i t u d e h i s t o r i e s %?.en they a r e received a t LaRC.
The predominant cons t i t uen t s of t h e upper atnosphere a t 61-C o r b i t a l a l t i t u d e s a r e molecular n i t rogen and atomic oxygen, w i t h molecular oxygen the t h i r d most abundant specie . Since a t o r . i c oxygen recombines on t h e SUMS i n l e t system s u r f a c e s , the SUF of atmospheric 0 and O2 w i l l appear a t t h e 3 2 AMU peak i n S U M S s p e c t r a . The only peaks of i n t e r e s t a r e t h e r e f o r e 2 8 and 3 2 in so fa r a s t he atmosphere i s concerned. Other atmospheric c o n s t i t u e n t s a r e f a r below t h e SUMS d e t e c t a b l e l i m i t .
The reduced da ta fo r 2 8 and 3 2 AMU f o r the t h r e e 61-C o r b i t a l sequences a re shown on Figures 6 through 8. None of t h e da ta s e t s shows any evidence of a r i s e i n ion c u r r e n t around t h e
A- 7
SUMS port zero angle of attack point, indicating that either the atmospheric density was too low or that SUMS was not open to the atmosphere. The signal levels in all cases are consistent with background levels seen in preflight tests.
A- a
3 . 0 SUMS 61-C Reentry Operations
The primary ob jec t ive of the SUMS experiment i s t o measure t h e p a r t i a l p ressures of atmospheric spec ie s a t t h e SUMS i n l e t p o r t during reent ry . These measurements can then be used t o c a l c u l a t e dynamic pressure which combined with acce le ra t ion measurements from HIRAP al low the c a l c u l a t i o n of aerodynamic force c o e f f i c i e n t s fo r t h e S h u t t l e Orb i t e r . SUMS was designed t o obta in da t a i n t h e r een t ry phase where t h e aerodynamic f l o w t r a n s i t i o n s from free-molecular t o continuum.
3.1 Reentry Sequence Descr ipt ion
app l i ca t ion of instrument power 2 hours before deo rb i t burn i n i t i a t i o n . From t h i s po in t on u n t i l power i s removed a f t e r landing, SUMS i s opera t ing and providing da ta t o t h e PCM. The PCM and recorder a re turned on 5 minutes p r i o r t o deorbi t b u r n i n i t i a t i o n and remain on u n t i l a f t e r landing.
SUMS Operation during reent ry i s autonomous a f t e r t h e
Power app l i ca t ion t o SUMS i n i t i a t e s t he sequence and cont ro l l o g i c which i n i t i a l l y opens a l l valves ( range, i n l e t , and p r o t e c t i o n ) i f t h e check f o r i n l e t p ressure l e s s than 5 to r r i s t r u e . As descent occurs , t h e 1 g i c checks fo r t h r e e consecutive ion cu r ren t peaks above 1 x lo-' ampere and on t h i s occurrence c loses t h e range valve. The SUMS i n l e g pressure a t which t h e range valve i s closed i s about 5 x 10- t o r r depending on dynamic l a g of t h e i n l e t system. As the descent cont inues, t h logic checks again for th ree consecutive peaks above 1 x lo-' a r p e r e and on the second occurrence c loses the i n l e t and pro tec t ion valves a t an i n l e t p ressure j u s t under one t o r r . The instrument continues t o output background spec t r a u n t i l power i s turned off on t h e ground.
Figure 9 shows the pred ic ted 28 AMU peak (n i t rogen) response during reentry for an interval of about f200 seconds a ound entry i n t e r f a c e . about one minute a f t e r e n t r y i n t e r f a c e a t which t i n e t h e range valve should c lose , increas ing the pressure drop across t h e i n l e t system by a f ac to r of 100. After t h e na tu ra l response t r a n s i e n t damps out f o lowing range valve c losu re , t he ion current r i s e s again t o lo-' where t h e i n l e t valve should c lose . The 28 peak w i l l cont ro l the range valve and i n l e t valve c losures because it i s t h e dominant atmospheric specie a t a l t i t u d e s near en t ry i n t e r f a c e . The oxygen peak w i l l behave s i m i l a r l y but w i l l n o t reach t h e m a x i m u m cur ren t a s t he n i t rogen peak w i l l .
The 2 8 peak ion cur ren t should r i s e t o 10 -4 ampere
3.2 Fl igh t Data Results from Reentry Sequence
during t h e time from d e o r b i t burn t o almost 1000 seconds a f t e r e n t r y i n t e r f a c e . As w i t h t he o r b i t a l sequences, there is no ind ica t ion of atmospheric gas i n t h e mass spec t r a over t h i s i n t e r v a l .
Figure 10 shows t h e reduced ion c u r r e n t s f o r 28 and 32 M U
A- 9

The SUMS engineer ing data showed a l l parameters were normal throughout t he r een t ry sequence. All s t a t u s f l a g s were n o r m a l and a l l valves had been commanded open a t the beginning of t h e sequence. '
The range valve was predicted t o c lose around 48557 seconds GMT or about 77 seconds p a s t e n t r y i n t e r f a c e . N o r i s e i n the atmospheric gas peaks was noted before t h i s t i m e and the range valve c losure was not ind ica ted i n t h e SUMS s t a t u s data n e a r t h i s t i m e . The i n l e t valve was predicted t o c lose a t 48690 seconds GMT and t h i s opera t ion was not ind ica ted near t h e expected t i m e e i t h e r .
Figure 11 shows t h e reduced da ta from the SUMS i n l e t *
pressure t ransducer which has i t s pickoff point a t the i n l e t por t s i d e of t h e i n l e t valve. The pressure i s a t background l e v e l up t o 48600 seconds a t which time it s t a r t s t o r ise , reaching the maximum of 5.4 t o r r a t 48750 seconds. The S U M S sequence and cont ro l l o g i c commanded a l l valves t o c lose when the i n l e t pressure reached m a x i m u m t o p ro tec t t h e system from excessive ex te rna l p re s su re . Figure 11 ind ica t e s t h e time a t which t h e i n l e t valve was predic ted t o c lose and the measured pressure a t t h i s time was q u i t e c lose t o t h e pred ic ted value.
A-10
4 . 0 Variation in Background Levels
Comparison of background levels over the four sets of 61-C flight data ( 3 orbital, 1 reentry) shows some variations within the range of an order of magnitude. In some cases the background levels are nearly constant over the sequence: in others, a definite rise is noted. These variations pose the question as to whether SUMS may have been open to the atmosphere during one or more of the orbital sequences and may have been exposed to contaminants outgassing from the Orbiter or possibly to water vapor trapped in the inlet port in the launch pad environment.
Figure 1 2 shows the water vapor history for all four sequences. The ORB-1 equence produced the highest H20 background, 1 . 7 x 10- '' amperes, and was most nearly constant over the measurement inter The ORB- sequence produced the lowest background, 2 x 10-'31io 3 x lo-", and had the largest variation across the measurement interval, about 50%. The ORB-2 and reentry sequences fall between these extremes, both in average magnitude and slope.
The background water peak is due to surface desorption of adsorbed water vapor and is temperature dependent. This process can also occur with other gases on a lesser scale. Figures 13 and 14 show the C 0 / N 2 (28 M U ) and C 0 2 ( 4 4 AMU) histories, respectively, and clearly indicate the sane general behavior as the water peak. The consistent behavior of these three peaks indicates that their gas source was internal background influenced by a common variable, temperature, and was not the external Orbiter environment.
No temperature measurerient at the surfaces where desorptior, occurs is made. The nearby ion source temperature is measured but it is influenced primarily by the source filazent dissapation and stabilizes more rapidly than surfaces such as the cap area. The cap area temperature could be influenced by warn-up tirne, among other factors, such that some correlation could exist between background levels and warm-up time.
ORB-1, ORB-2, and the reentry sequence were provided the full two hour warmup time before data acquisition started. 'The background peaks for these sequences are grouped fairly close together. However, power was applied to SUMS quite late in preparation for ORB-3 because of schedule pressures in the Orbiter operations. (Note: ORB-2 and 3 were inserted in the Orbiter mission operations during flight after the landing delay occurred.) The background signals for ORB-3 were considerably lower than the levels for the other sequences and show steeper slopes in the earlier portion of an exponential rise with temperature as expected. The variations in background levels appear to be caused by the combination of warmup time variations and ambient temperature variations.
A-11

5.0 Conclusions
Analysis of the SUMS 61-C flight data has been completed and clearly indicates a malfunction prevented the mass spectrometer from measuring any detectable gases enter'ing the SUMS inlet port. The following observations and conclusions are evident from this analysis.
(1) There is no evidence of atmospheric or contaminant gases in any of the SUMS orbital measurements.
( 2 ) There is no evidence of atmospheric gases during reentry.
( 3 ) Analysis indicates variation in signal levels over a sequence or between sequences was due to internal surface temperature variations.
( 4 ) SUMS sequence and control logic operated normally in closing all valves due to sensing high inlet pressure at low altitude during reentry.
(5) All engineering and status parameters were normal during all 61-C operations.
( 6 ) The SUMS inlet port was not blocked as indicated by the inlet pressure transducer.
( 7 ) The SUMS gas path appeared to be blocked between t3e inlet pressure transducer pick-off point and the riass spectrometer ion source.
(8) T!ie most likely source of such blockage was a cloq~ed filter or failed-closed condition of either the inlet or protection valve.
A-12
FIGURE 1 PREDICTED N2 AND 02 ION CURRENTS SOLAR MINIMUM ( 6 1 - C )
1 .E-9
1 .E-10
1 .E-12
1 .E-13
MSIS 83 ATMOSPHERE MODEL PREDICTED TW/TINF-.S N2 PERK f 10.7-77
RP-4
PRED I CTED 02 PEAK
28 PEAK BRCKGROUND ------
32 PERK BACKGROUND ---
CRBITAL ALTITUDE, K M
FIGURE 2 PREDICTED N2 AND 02 ICN C U R 2 E N T S SOLAR M f l X I M U M
KSIS 83 ATMCSPrlERE MCSEL TW/T 1 NF- . S F 1 0 . 7 9 3 2 8 RP-4
PQEDICTED N2 PERK
PREDICTED 02 PEAK
28 PEAK BRCKGRCLiND ---
32 PERK BACKSQDUND -- -
L I 1 - d - L l . E - 1 4 ' ' ' ' ' ' ' ' ' ' ' ' ' 1 a0 1 5 0 2 00 2 5 0 3 00 3 5 0 4 El0
ORBITAL ALTITUDE, KM
A-13
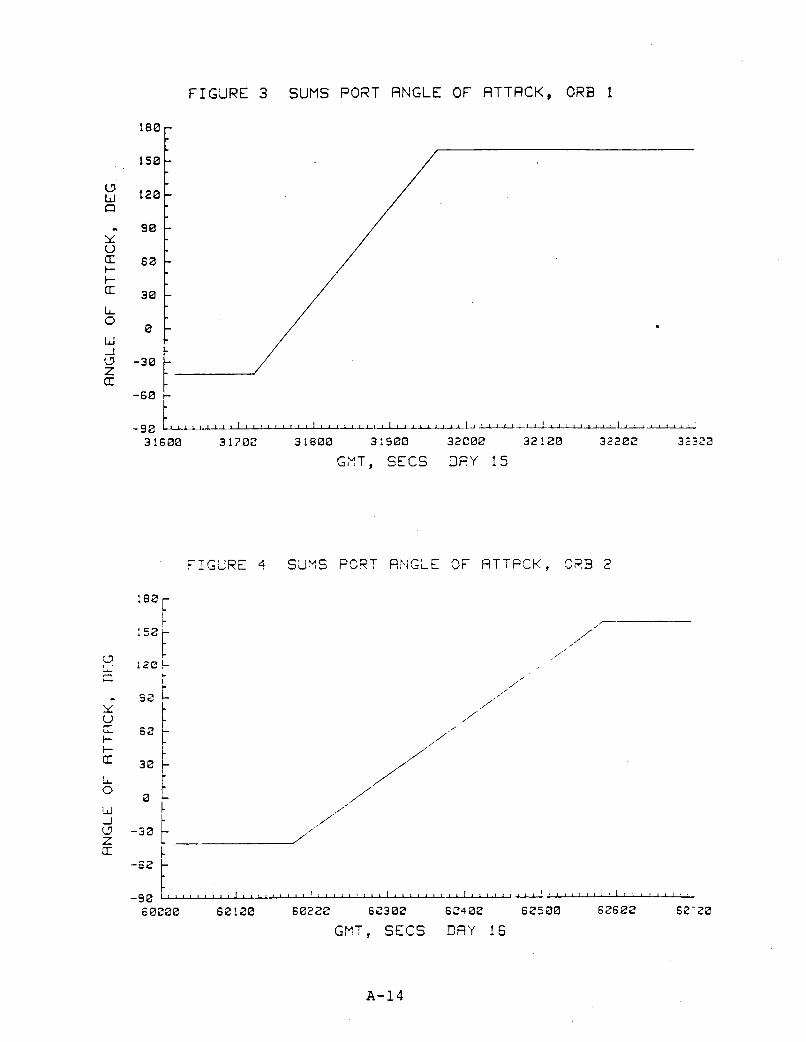
FIGURE 3 SUMS PORT ANGLE OF ATTRCK, ORB 1
t- I- CE
LL 0 w
-9e 3 1680 31700 3 1800 3190Q 32C00 32 : E 0 3 2 t e z 323za
GiYT, SECS D A Y 15
FIGERE 4 SLiMS PCRT ANGLE O F HTTPCK, SZB 2
108 r : 58
I 7
/' ,/,' i /
iy : 12eL fl
Y
I- t-
L ,,
/
/
/' 0 - s @ ; z s a L
//'
-68 1, 1 , , , , , , , , , , , , , , , , , , , , , , , , , , , , , , I , , , ~ ~ , , , I , , , , , , , , , , , , , , , , , . , , , , ,
30 1 L 0
J
Z ct
/ /'
/ 'A " u -3a 1 ,/'
i
-9e 6212e 68220 6C300 60480 625 a0 s 26 ez 62-20 SEf0&30
GMT, SECS CRY !6
A-14
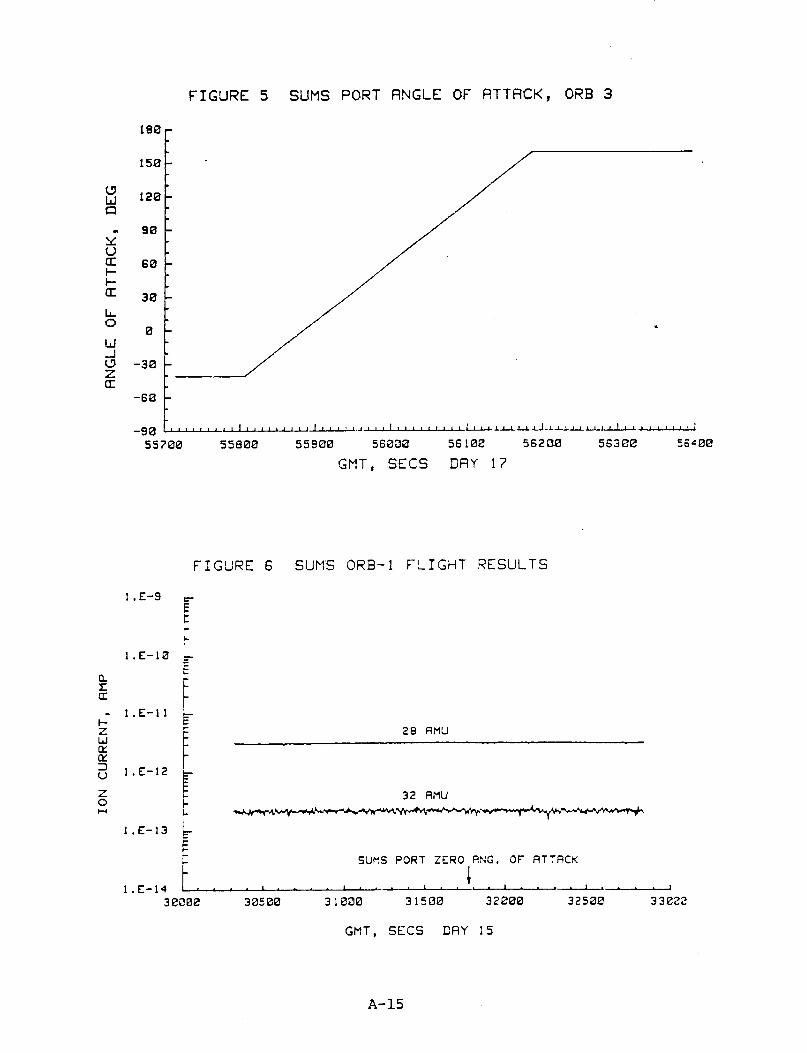
180
150
120
90
60
30
0
-30
FIGURE 5 SUMS PORT RNGLE OF RTTACK, ORB 3
1 .E-9
1 .E-10
- 1.E-11 I- z W a: a:
1.E-12
z 0 W
FIG?JRE 6 SUM'S ORB-1 FLIGHT RESULTS
t F r 2 8 RMU
t
1.E-13 c € i- SUES PORT ZER0,ANG. OF ATTACK
3 e00@ 3 05 00 3 i 080 315130 3 2 a00
GMT, SECS CAY :5
A-15
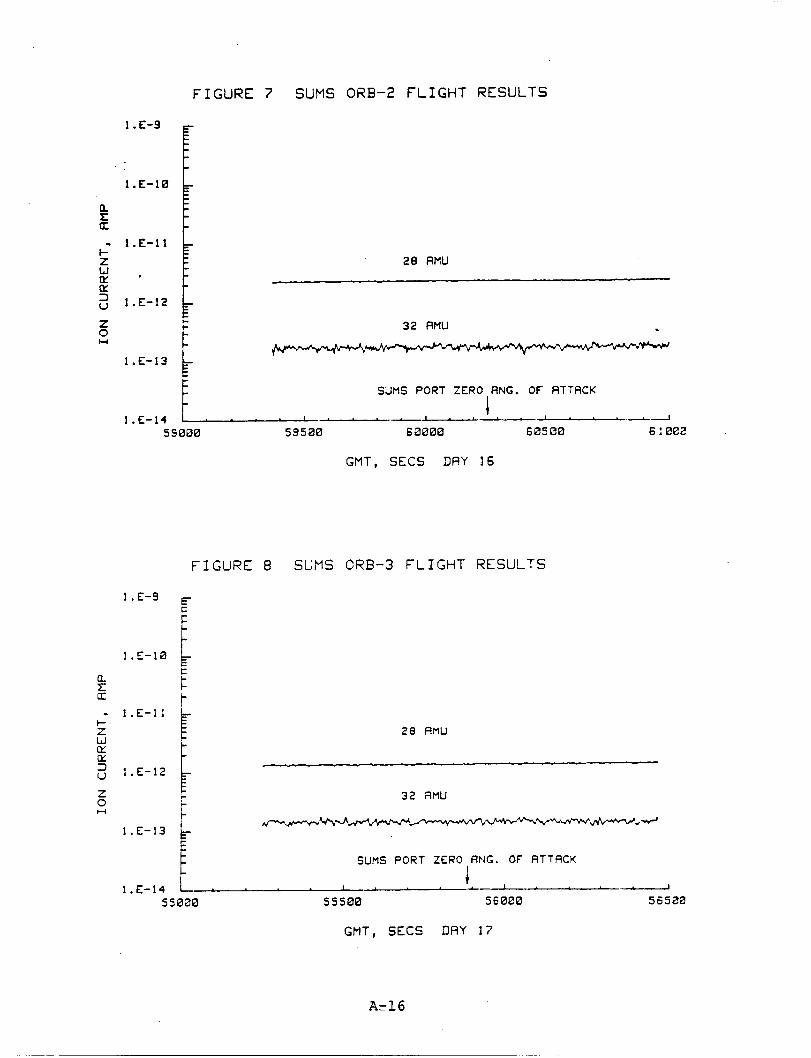
FIGURE 7 SUMS ORB-2 FLIGHT RESULTS
F 1. E-9
z 0 c H
k 1 .E-13
32 AMU
j T , - @ - - -
S U P S PORT ZERO R N G . OF RTTRCK
A- I . . , . . , +I 1 .E-14 5 S 000 L.. 59500 . 6 0000 60500 6 : aee
GMT, SECS DRY 16
FIGURE 8 SGMS CRB-3 F L I G H T RESULTS
1.E-9
E
SUMS P O R T ZERO ANG. OF R T T A C K
I I . d l . E - 1 4 I 5 5 020 55500 5 E 000 56580
GMT, SECS DRY 17

a CK
1.E-11
FIGURE 9 SUMS 6 1 - C PREFLIGHT RESPONSE PREDICTION
?
I-
0
Z 0 H 1.E-12
1.E-13
I I I I I I I I I I I I I I I I I I I I I I
I N T E R F R C E I I
I (48480) I
RRNGE I N L E T V A L V E VALVE
CLOSURE CLOSLJRE (40557) (48692 1 7
LlllllltlltllAI1I11I1II * ' ' I ' ' ' " " " I ' I ' " " "
I I
GMT, SECS DAY 18
F IGURE 10 SUMS REENTRY F L I G H T RESLiLTS
E 1 .E-9
t c 1 .E-10
a E U
28 AMU
32 AMU
* v * - + - + W v -vww-,*-
f ENTRY INTERFACE -1 1,
- 1.E-11 I- z W z z 2 l.E-12
Z 0 1 H
1 .E-13
1 .E-14 I . . . . I . . . . I . . . . 1 . . . . I . . . . . . . . 1 . *
45500 46000 46500 47060 4 7 5 0 0 48000 48500 4,0000 49580
GMT, SEC DRY 18
A-17

[L II U . I- z w IY w 3 U
z C H
FIGURE 1 1 SUMS 6 1 - C INLET PRESSURE
PRED T I r
/- 0
INLET VALVE CLOSURE
i
r ENTRY INTERFACE
ALL VALVES COM?lANCED TO CLOSE
1 . 1 0 1 I 0 I * I -d
4 8 4 5 0 48500 4 8 5 5 8 48600 48650 487&0 48758 48823
GMT, SECS D A Y 18
FIGURE 12 H28 ( 1 8 AMU) H I S T O R Y
ORB- I 2.E-12
I
i 6.E-13
4.E-13
2.E-13
1 .E-13 0 5 00 1 00a 1500 2000 2 5 0 0 3eaa 3508 4 000
REFERENCE T I M E IN SECS
A-18
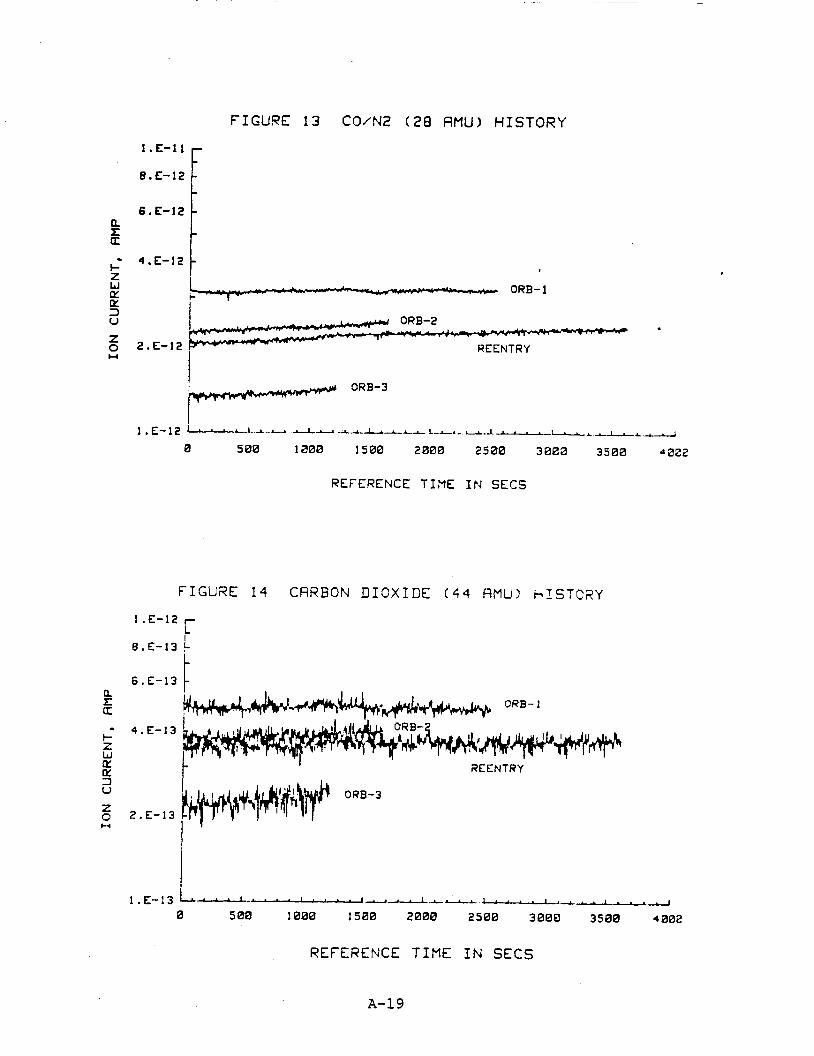
FIGURE 13 CO/N2 ( 2 8 f lMU1 HISTORY 1.E-11
8.E-12
6.E-12
- 4.E-12 I- z 1
w 8 I- cy % e g ORB-2 z 0 2.E-12 REENTRY W
REFERENCE TIME I N SECS
FIGUilE 14 CRRBON DIOXIDE (44 HMU) H I S T C R Y
F 6.E-13 !-
6.E-13 t
REFERENCE TIME IN SECS
A-19

Standard Bibliographic Page
1. Report No. NASA CR-181968
2. Government Accession No. 3. Recipient’s Catalog No.
7. Author(s)
4. Title and Subtitle
S h u t t l e Upper Atmosphere Mass Spec t romete r (SUMS) : Data A n a l y s i s System and 6 1-C F l i g h t Data R e s u l t s
8. Performing Organization Report No.
5 . Report Date
March 31 , 1 9 8 7 6. Performing Organization Code
E . Hinson IO. Work Unit No.
9. Performing Organization Name and Address 506-40-9 1-03
ST Systems C o r p o r a t i o n (STX) 1 7 Research Drive Hampton, V i r g i n i a 23666
12. Sponsoring Agency Name and Address
. . .~ . _
11. Contract or Grant No.
NAS1-16385 13. Type of Report and Period Covered
C o n t r a c t o r Repor t N a t i o n a l A e r o n a u t i c s and Space A d m i n i s t r a t i o n Washington, D.C. 20546
I
L5. Supplementary Notes
. A
14. sponsor;ng Agency Code
Langley T e c h n i c a l Monitor : R . Blanchard
6. Abstract
b . Security Classif.(of this report) U n c l a s s i f i e d
T h i s r e p o r t p r e s e n t s r e s u l t s and s t a t u s of work performed under c o n t r a c t NAS1-16385, Phases I1 and 111, c o v e r i n g s o f t w a r e development and f l i g h t d a t a a n a l y s i s f o r t h e S h u t t l e Upper Atmosphere Mass Spec t romete r (SUMS) expe r imen t . A d e s c r i p t i v e summary o f t h e SUMS F l i g h t Data Reduct ion and A n a l y s i s System ( s o f t w a r e ) i s p r e s e n t e d , i n c l u d i n g d e t a i l s of t h e i n l e t r e d u c t i o n a l g o r i t h m . S t a t i c and dynamic c a l i b r a t i o n t e s t p rocedures a r e d i s c u s s e d and r e s u l t s of t h e tes ts are p r e s e n t e d . A d i s c u s s i o n of ongoing a n a l y s i s e f f o r t s i s i n c l u d e d . The r e s u l t s of f l i g h t d a t a a n a l y s i s f o r t h e SUMS 61-C (STS-32) miss ion are a t t a c h e d t o this r e p o r t . This w a s t h e only S U M S f l i g h t d u r i n g t h e c o n t r a c t p e r i o d and f a i l u r e of t h e p r o t e c t i o n v a l v e caused loss of s c i e n c e d a t a .
20. Security Clqsif.(of this page) 21. No. of Pages 22. Price Unc l a s s i f 1 ed . 68
7. Key Words (Suggested by Authors(s)) n a s s s p e c t r o m e t e r r a r i f i e d f low aerodynamics S h u t t l e Orb i t e r (STS)
18. Distribution Statement
U n c l a s s i f i e d - Unlimited
S u b j e c t Category 35