nasa technical note 0 nasa d-4981 amptiac
TRANSCRIPT
7'3766
NASA TECHNICAL NOTE 0 NASA TN D-4981
ooJ
0%
AMPTIAC
STRAIN-RATE SENSITIVITY OF THREETITANIUM-ALLOY SHEET MATERIALS AFTER
PROLONGED EXPOSURE AT 5500 F (5610 K)
by Robert M. Baucom
Langley Research Center 20000711 153Langley Station, Hampton, Va.
NATIONAL AERONAUTICS AND SPACE ADMINISTRATION e WASHINGTON, D. C. • JANUARY 1969
DISTRIBUTION STATEMENT A Reproduced FromApproved for Public Release Best Available Copy
Distribution Unlimited
NASA TN D-4981
STRAIN-RATE SENSITIVITY OF THREE TITANIUM-ALLOY
SHEET MATERIALS AFTER PROLONGED EXPOSURE
AT 5500 F (5610 K)
By Robert M. Baucom
Langley Research Center
Langley Station, Hampton, Va.
NATIONAL AERONAUTICS AND SPACE ADMINISTRATION
For sale by the Clearinghouse for Federal Scientific and Technical InformationSpringfield, Virginia 22151 - CFSTI p
STRAIN-RATE SENSITIVITY OF THREE TITANIUM-ALLOY
SHEET MATERIALS AFTER PROLONGED EXPOSURE
AT 5500 F (5610 K)
By Robert M. Baucom
Langley Research Center
SUMMARY
Results are presented of an investigation ooe effects of strain rate on three
titanium-alloy sheet materials before and after prolonged exposure without stress at
5500 F (5610 K). The strain-rate sensitivity of the three alloys, Ti-8AI-lMo-IV,
Ti-4Al-3Mo•-V,, and Ti-6A1-4V, was determined from the results of tensile tests per-
formed at three strain rates on smooth and V-notched specimens. Little change in the
tensile properties of smooth and V-notched specimens was observed at any given strain
rate during accumulated exposure times up to 22)000 hours. This result indicates that
the alloys under investigation are apparently stable for the exposures noted. The effect
of an increase in strain rate on the tensile properties was generally a moderate increase
in strength for each of the alloys. The sensitivity of Ti-8AI-IMo-IV and Ti-4A1-3Mo-lV
to sharp notches tended to decrease with an increase in strain rate.
INTRODUCTION
The skin materials for a Mach 3 transport will experience cumulative exposure to
elevated temperature up to about 30 000 hours (ref. 1) during the expected service life of
the airplane. Such exposures can possibly lead to changes in mechanical properties of
the skin materials. In addition, the skin materials will experience a wide range of loading
rates in flight and during landing. Investigations of the effects of exposure to elevated
temperature and of loading rate on mechanical properties of selected titanium-alloy and
stainless-steel sheet have been undertaken at the Langley Research Center. Some results
obtained for exposures up to 22 000 hours at 5500 F (5610 K) on the stability of these
materials were reported in reference 2.
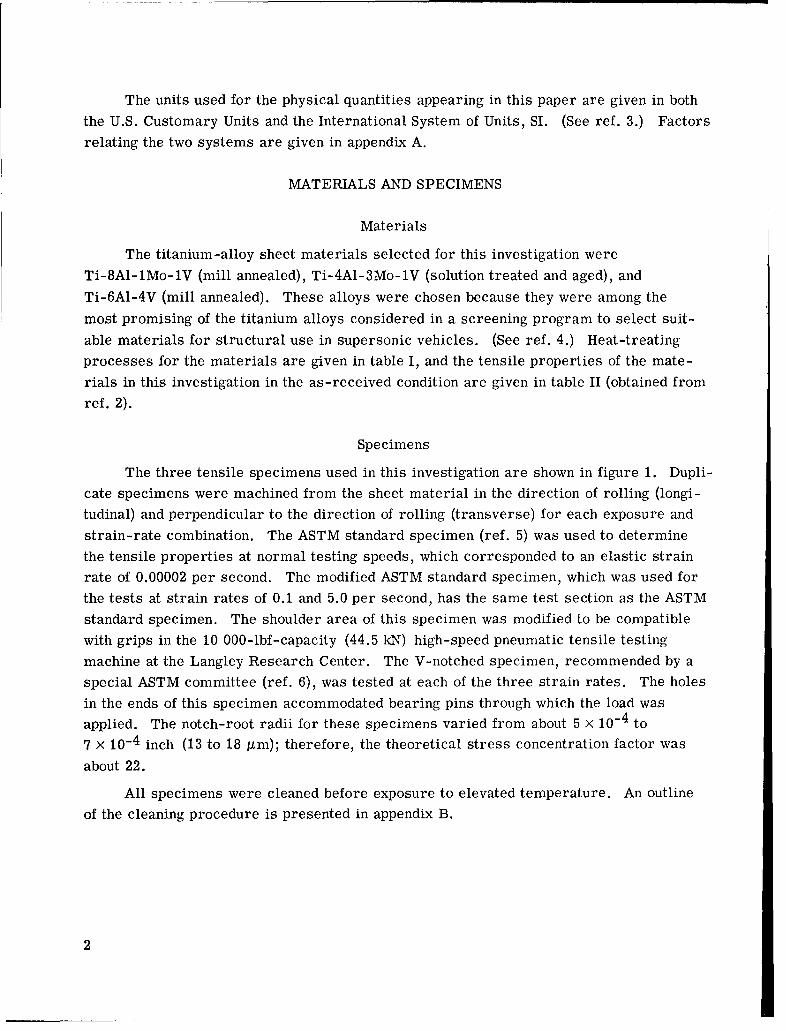
As a continuation of the Langley research on supersonic-transport materials, this
report presents results of an investigation of the effects of exposures up to 22 000 hours
at 5500 F (5610 K) on the strain-rate sensitivity of Ti-8AI-lMo-IV, Ti-4A1-3Mo-IV,
and Ti-6A1-4V titanium-alloy sheet. Tensile properties of notched and smooth speci-
mens (for elastic strain rates of 0.00002, 0.1, and 5.0 per second) were determined at
room temperature after exposure to elevated temperature.
The units used for the physical quantities appearing in this paper are given in both
the U.S. Customary Units and the International System of Units, SI. (See ref. 3.) Factors
relating the two systems are given in appendix A.
MATERIALS AND SPECIMENS
Materials
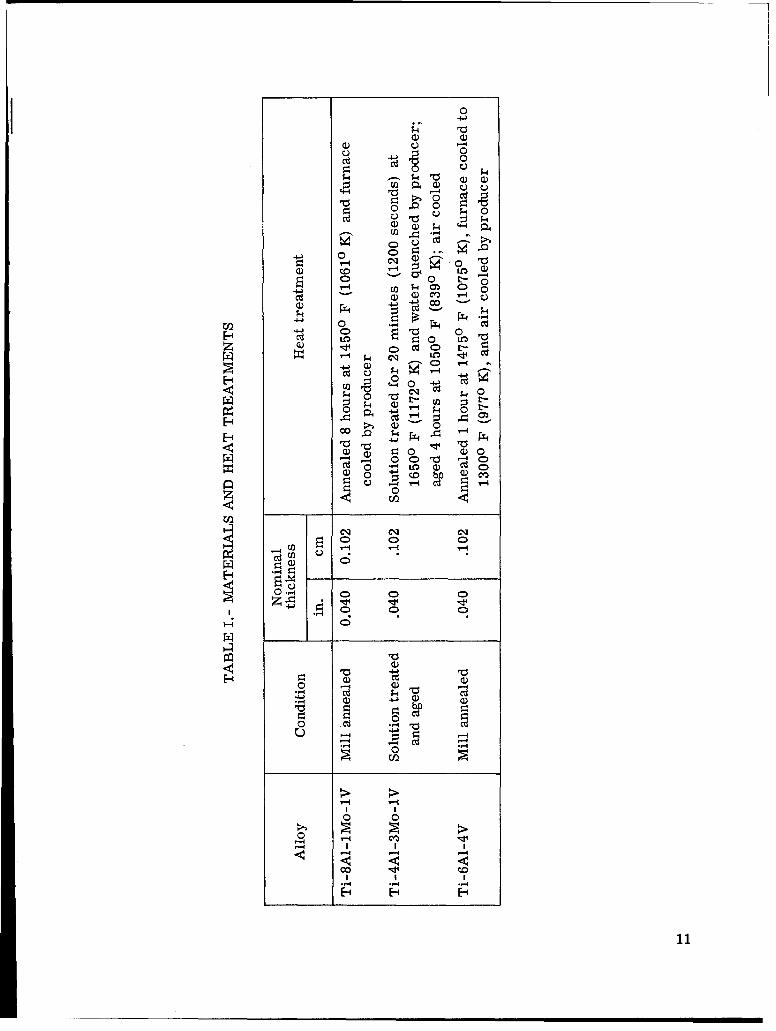
The titanium-alloy sheet materials selected for this investigation were
Ti-8A1-lMo-1V (mill annealed), Ti-4A1-3Mo-1V (solution treated and aged), and
Ti-6A1-4V (mill annealed). These alloys were chosen because they were among the
most promising of the titanium alloys considered in a screening program to select suit-
able materials for structural use in supersonic vehicles. (See ref. 4.) Heat-treating
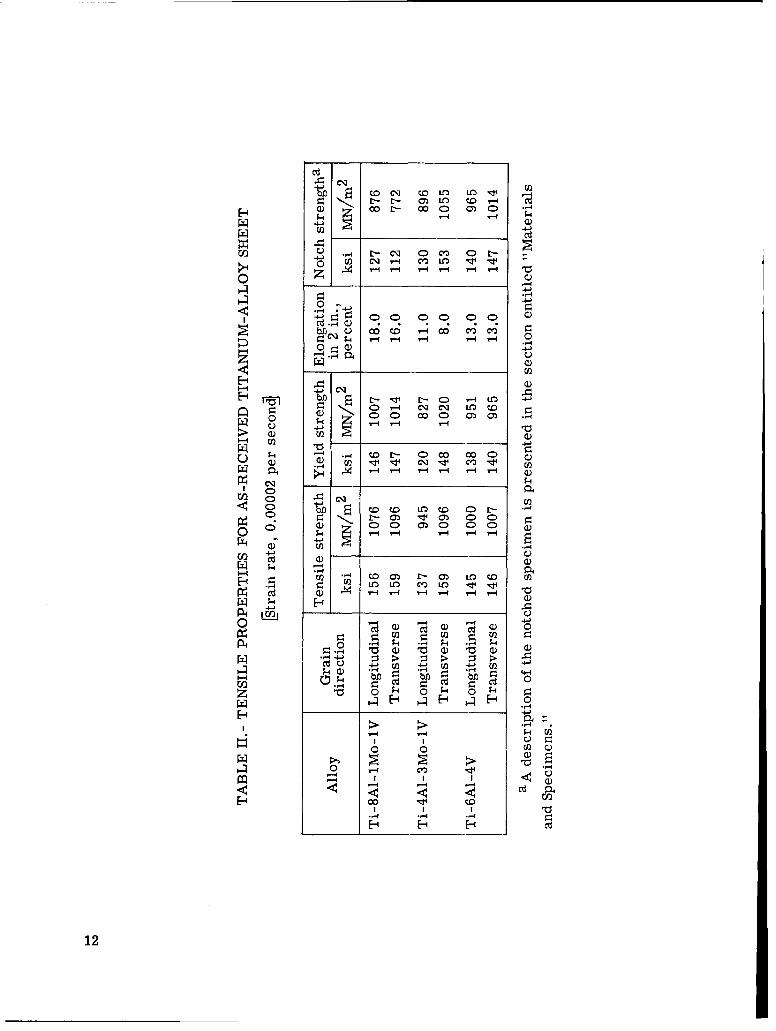
processes for the materials are given in table 1, and the tensile properties of the mate-
rials in this investigation in the as-received condition are given in table II (obtained from
ref. 2).
Specimens
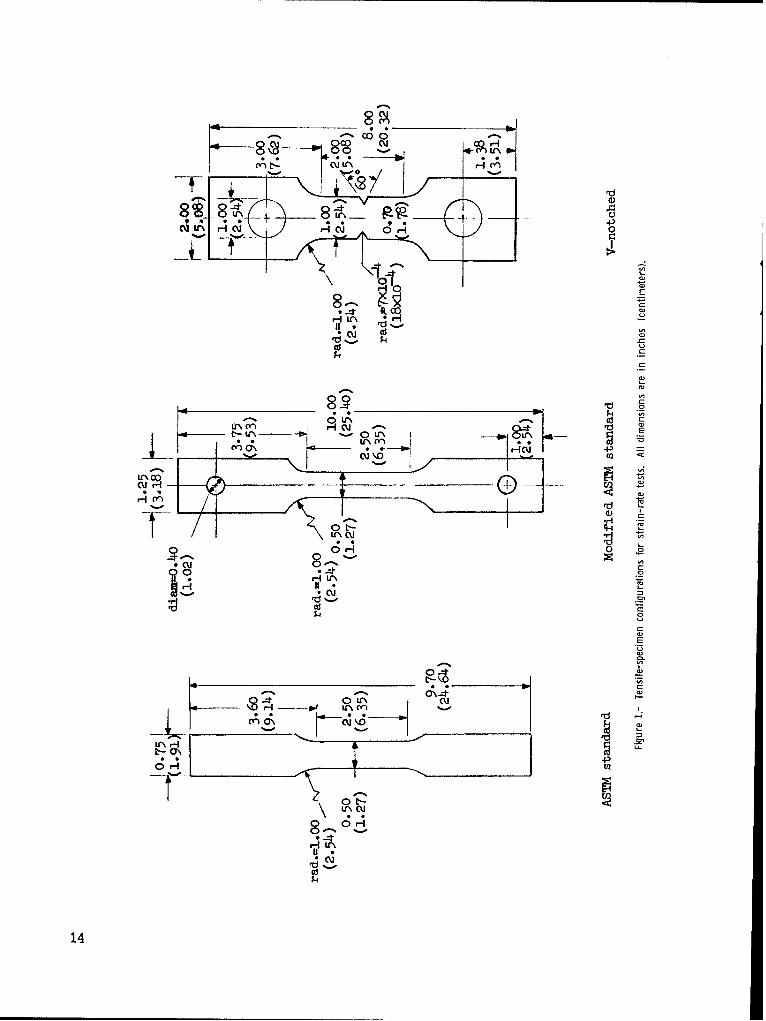
The three tensile specimens used in this investigation are shown in figure 1. Dupli-
cate specimens were machined from the sheet material in the direction of rolling (longi-
tudinal) and perpendicular to the direction of rolling (transverse) for each exposure and
strain-rate combination. The ASTM standard specimen (ref. 5) was used to determine
the tensile properties at normal testing speeds, which corresponded to an elastic strain
rate of 0.00002 per second. The modified ASTM standard specimen, which was used for
the tests at strain rates of 0.1 and 5.0 per second, has the same test section as the ASTM
standard specimen. The shoulder area of this specimen was modified to be compatible
with grips in the 10 000-lbf -capacity (44.5 kN) high-speed pneumatic tensile testing
machine at the Langley Research Center. The V-notched specimen, recommended by a
special ASTM committee (ref. 6), was tested at each of the three strain rates. The holes
in the ends of this specimen accommodated bearing pins through which the load was
applied. The notch-root radii for these specimens varied from about 5 X 10⁻⁴ to
7)< 10-4 inch (13 to 18 Mim); therefore, the theoretical stress concentration factor was
about 22.
All specimens were cleaned before exposure to elevated temperature. An outline
of the cleaning procedure is presented in appendix B.
2
TESTING PROCEDURES AND EQUIPMENT
Exposure
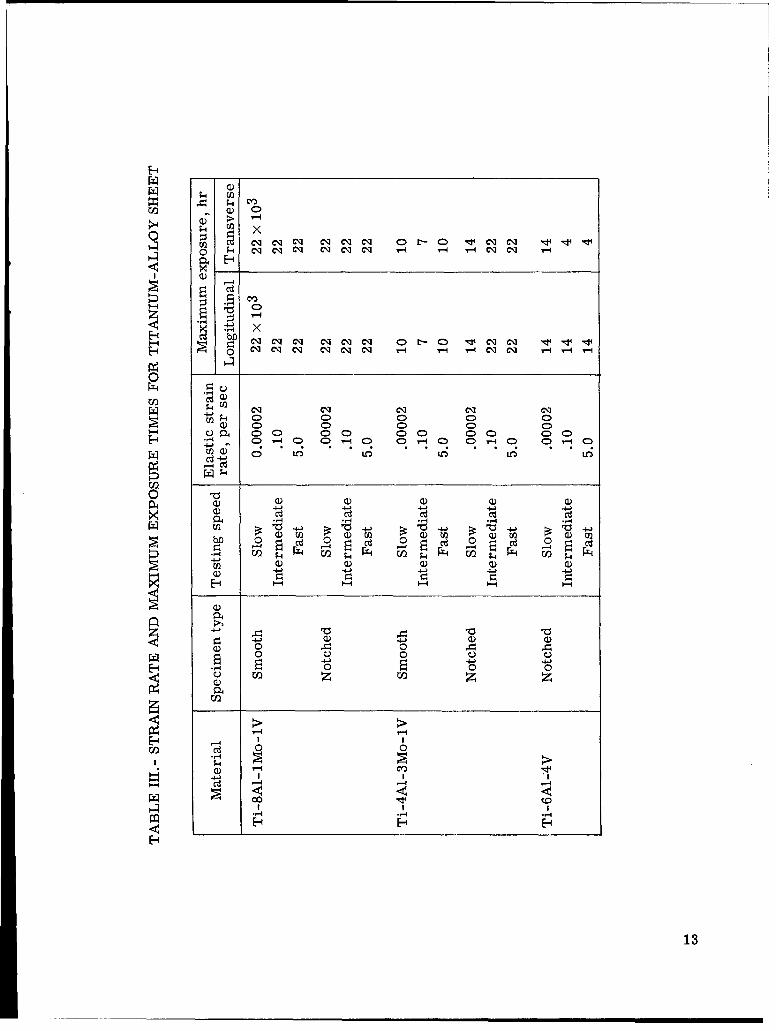
Test specimens were placed in furnaces and exposed with no applied load to temper-
atures of 5500 ± 100 F (5610 ± 60 K). At predetermined exposure times of 2000, 4000,
7000, 10 000, 14 000, 18 000, and 22 000 hours, specimens were removed and subjected to
tensile tests at room temperature. The maximum accumulated exposure time for each of
the specimen types is given in table Ill.
Normal -Loading-Rate Tests
The tensile tests at the normal loading rate were performed in the 100 000-lbf-
capacity (445 kN) hydraulic testing machine at the Langley Research Center. For tensile
tests of smooth specimens, load-strain curves were obtained with an x-y recorder.
Differential-transformer strain gages were clamped to both sides of the specimens to
measure strain over a 1-inch (2.54-cm) gage length up to approximately 0.015. Con-
ducting the tests at a constant loading rate through yield resulted in a strain rate of
0.00002 per second in the elastic region and a strain rate of approximately 0.00008 per
second through yield. The loading rate was then increased to provide a strain rate of
approximately 0.0008 per second to failure. The notched specimens were tested at a
nominal strain rate of 0.00002 per second (based on the net section) in the same hydraulic
testing machine used for the tensile tests of the standard smooth specimens. No attempt
was made to determine load-strain curves for the notched specimens at any of the strainrates.
Rapid- Loading-Rate Tests
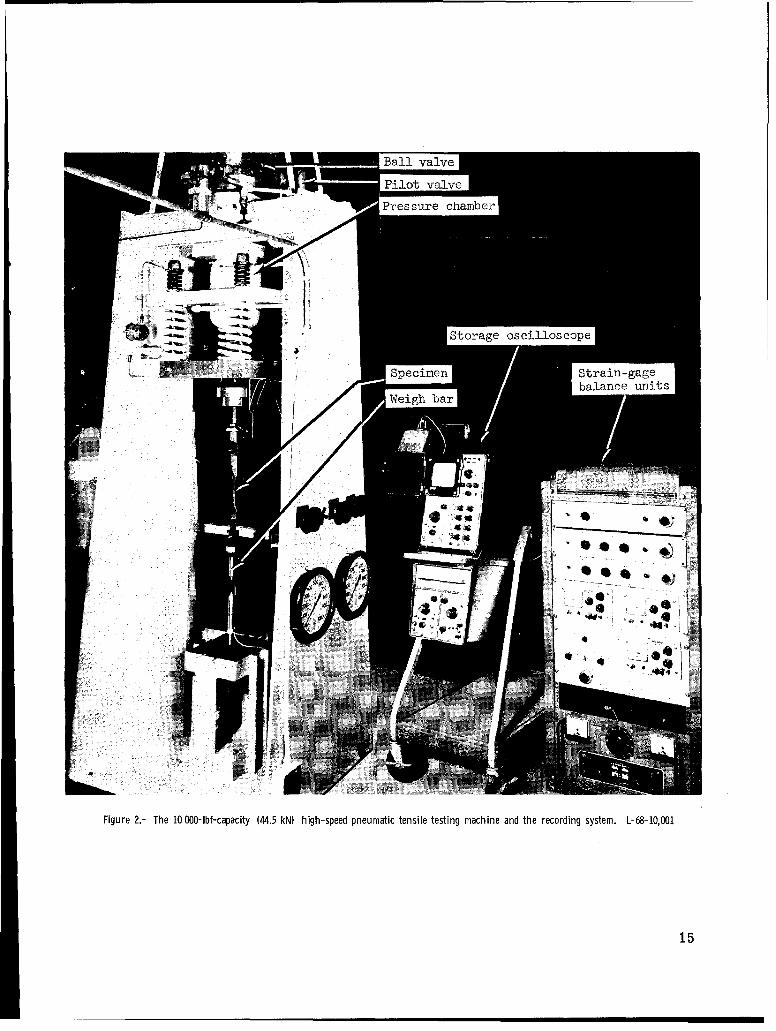
The rapid-loading tests were performed in the 10 000-lbf -capacity (44.5 kN) high-
speed pneumatic tensile testing machine at the Langley Research Center shown in fig-
ure 2. The operation of this machine is described in detail in reference 7. The load
was applied to the specimen by differential air pressure acting on a piston. Testing speed
was varied by using different valve systems to exhaust air from the pressure chamber.
For this investigation, pilot- and ball-valve assemblies were used to obtain the interme-
diate and fast testing speeds, respectively.
The loads during tests were measured by a specially designed stiff weigh bar
attached to the bottom grip. The weigh bar was machined from 17-4 PH stainless steel
and instrumented with four p -type -semiconductor strain gages. These gages provided
approximately 60 times the output of conventional foil or wire strain gages at a given
applied voltage and strain level. This feature permitted a reduced strain level in the
load-sensing element for the same output as a standard load cell of the same capacity.
3

The stiffer bar increased the natural frequency of oscillation of the weighing system and
eliminated the spurious load oscillations which were encountered during testing with a
conventional load cell (ref. 7).
The strains were measured with conventional foil strain gages mounted in the test
section of the smooth specimens after exposure. A special adhesive designed for high-
strain-rate applications was used to bond the gages to the specimens. After the gage
leads were attached, a moisture-proof coating was applied to the gage surface.
The recording system for the high-speed testing machine (fig. 2) consisted of a
time-delay circuit, strain-gage amplification units, dual-trace storage oscilloscope with
camera attachment, and power supplies. The adjustable time-delay circuit was regulated
from prior calibration data to allow the sweep on the storage oscilloscope to be triggered
at the correct time so that complete test information was recorded. The storage oscillo-
scope displayed the load and strain time histories on the screen of the cathode-ray tube
and retained the traces until a record was obtained with a camera attachment.
RESULTS AND DISCUSSION
In the following sections, discussion is presented on load-time, strain-time, and
stress-strain curves, and the effects of exposure and strain rate for Ti-8A1-lMo-1V,Ti-4A1-3Mo-1V, and Ti-6A1-4V alloys.
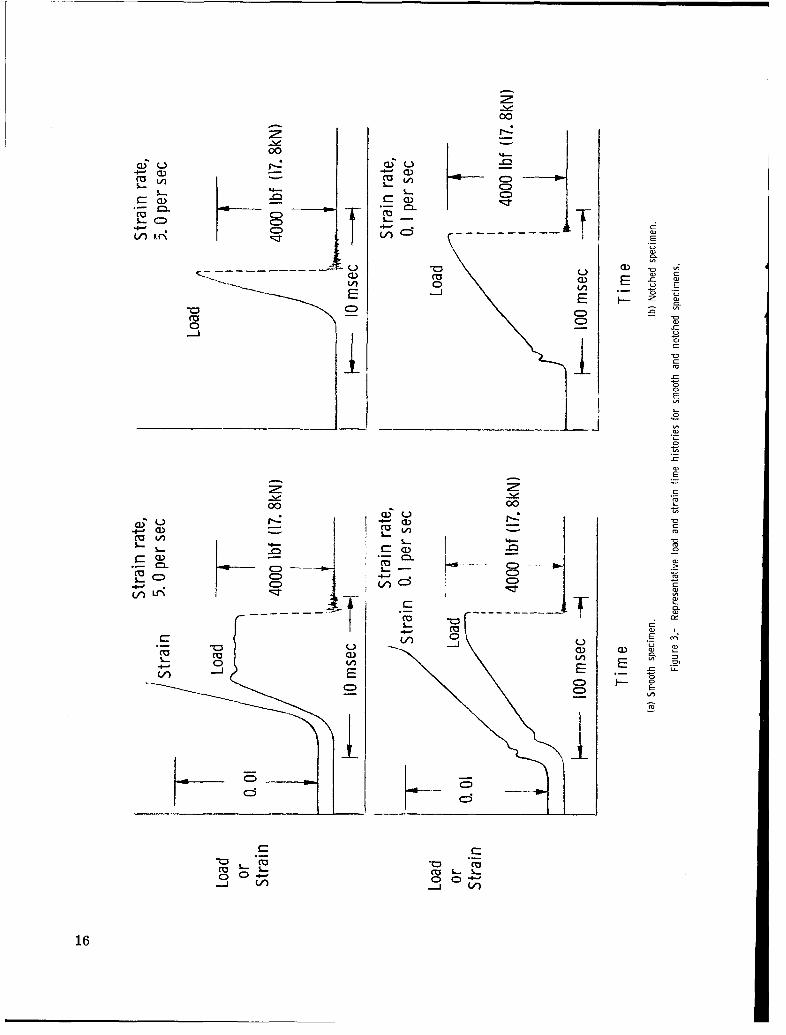
Load- and Strain-Time Characteristics
Representative load and strain time histories obtained from tests conducted in the
10 000-lbf -capacity (44.5 kN) high-speed pneumatic tensile testing machine for smooth
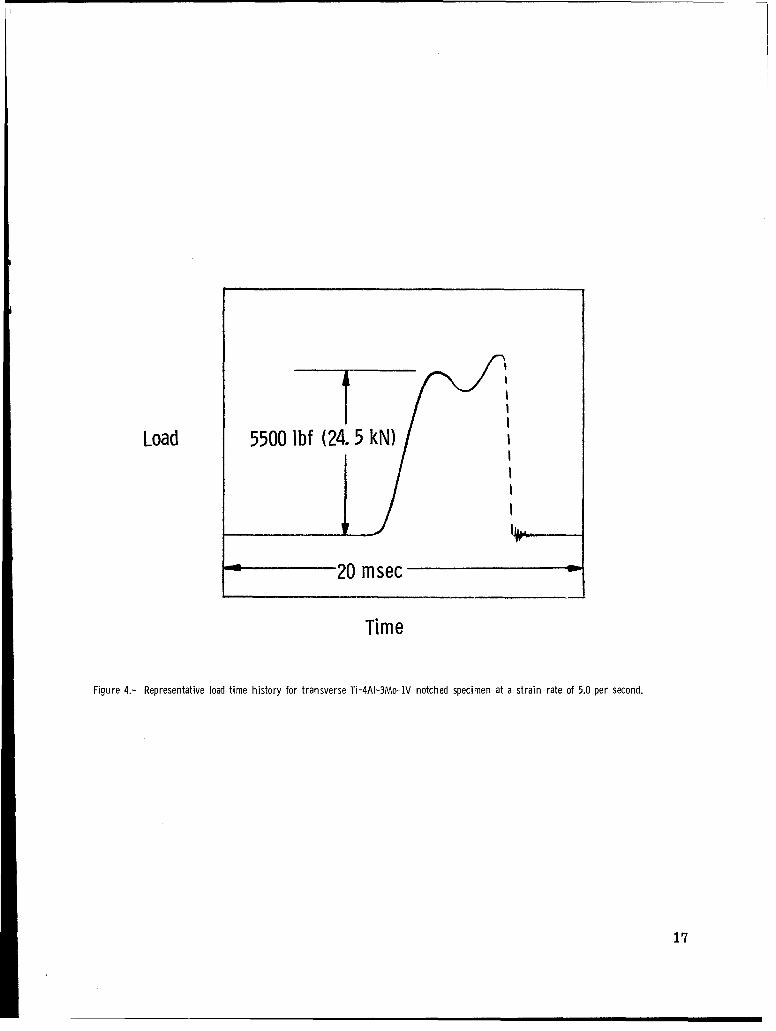
and notched specimens are shown in figure 3. An exception to the representative data is
the load time history presented in figure 4, which was obtained only with the transverse
Ti-4A1-3Mo-IV notched specimens at a strain rate of 5.0 per second.
For smooth specimens (fig. 3(a)) at an elastic strain rate of approximately 5.0 per
second, the load and strain signals began smoothly. Approximately 2 milliseconds after
loading began, the load and strain signals became essentially linear until the yield
strength of the material was reached. At this point, rapid plastic deformation sheared
the foil strain gages from the specimen and the strain signal disappeared from the oscil-
loscope screen. After an upper yield strength was reached, the load leveled off for the
remainder of the test. At an elastic strain rate of approximately 0.1 per second, the load
and strain signals became irregular about 10 milliseconds after the test began, after
which the curves became approximately linear until the fracture point was almostreached. The strain gages remained intact for strain levels up to 0.012 so that
4
stress-strain curves could be plotted through the yield region. The load-time curve for
this strain rate does not demonstrate the abrupt yield behavior observed in tests at
5.0 per second.
For the notched specimens at an elastic strain rate of 5.0 per second, loading
became nearly linear with time about 2 milliseconds after loading began. The load sig-
nal terminated abruptly when the rupture load was reached. The notched specimens
tested at an elastic strain rate of 0.1 per second exhibited load-time characteristics
similar to the characteristics for smooth specimens tested at this strain rate except that
the load signal is terminated after a shorter testing time.
A representative load-time history for Ti-4A1-3Mo-1V transverse notched speci-
mens tested at an elastic strain rate of 5.0 per second is shown in figure 4. Except for
these specimens, the loads required for failure of all specimens in this program were
below 5500 pounds (24.5 kN) and no irregularities in loading were encountered. For
loads above 5500 pounds applied to these specimens, however, the loading curve dips
downward (fig. 4) before resumption of loading to specimen failure. About 4.5 millisec-
onds are required for the load to return to the level at which the drop in loading began.
This loading irregularity has been attributed to a testing-machine characteristic.
Because of this variation, a large spread in test times was experienced for the
Ti-4A1-3Mo-1V notched specimens at the highest strain rate.
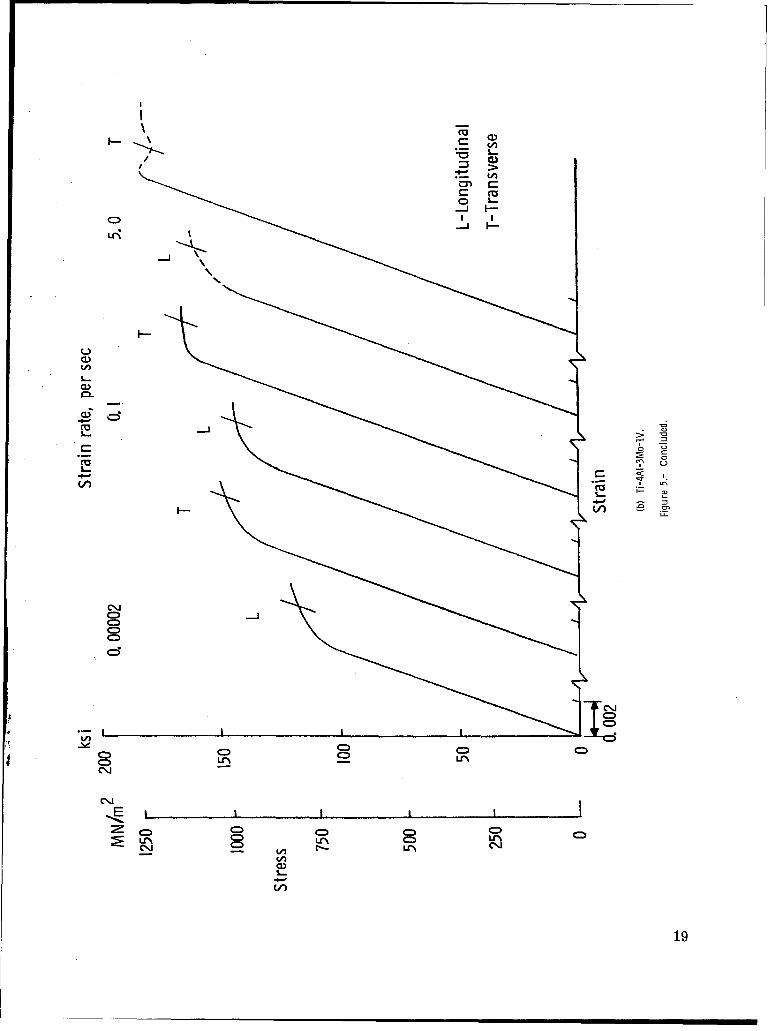
Stress-Strain Properties of Smooth Specimens
Typical stress-strain curves for smooth Ti-8A1-lMo-1V and Ti-4A1-3Mo-1V speci-
mens are shown in figure 5. Curves for the tests conducted at an elastic strain rate of
0.00002 per second were plotted directly on an x-y recorder and those for the tests at
0.1 and 5.0 per second were drawn from the load- and strain-time oscilloscope traces.
At the highest strain rate, the shape of the stress-strain curves in the yield region for
these materials could not be determined precisely because the strain gages sheared off
the specimen as plastic deformation began. Therefore, the dashed portion of the curves
was estimated from load-time histories.
In figure 5(a), the longitudinal Ti-8A1-lMo-1V specimens exhibited a slightly higher
yield stress than the transverse specimens at strain rates of 0.00002 and 0.1 per second.
At 5.0 per second, the load at fracture was approximately the same as the upper yield
load, as discussed in reference 8.
Stress-strain curves for Ti-4A1-3Mo-1V are shown in figure 5(b). This material
is considerably stronger in the transverse direction than in the longitudinal direction for
the three strain rates. The shapes of the stress-strain curves are nearly the same for
5
the three rates, except for the transverse direction at the highest strain rate. As wastrue for the Ti-8A1-lMo-IV alloy tested at this rate, the strain gages were sheared off
the specimen as plastic flow began.
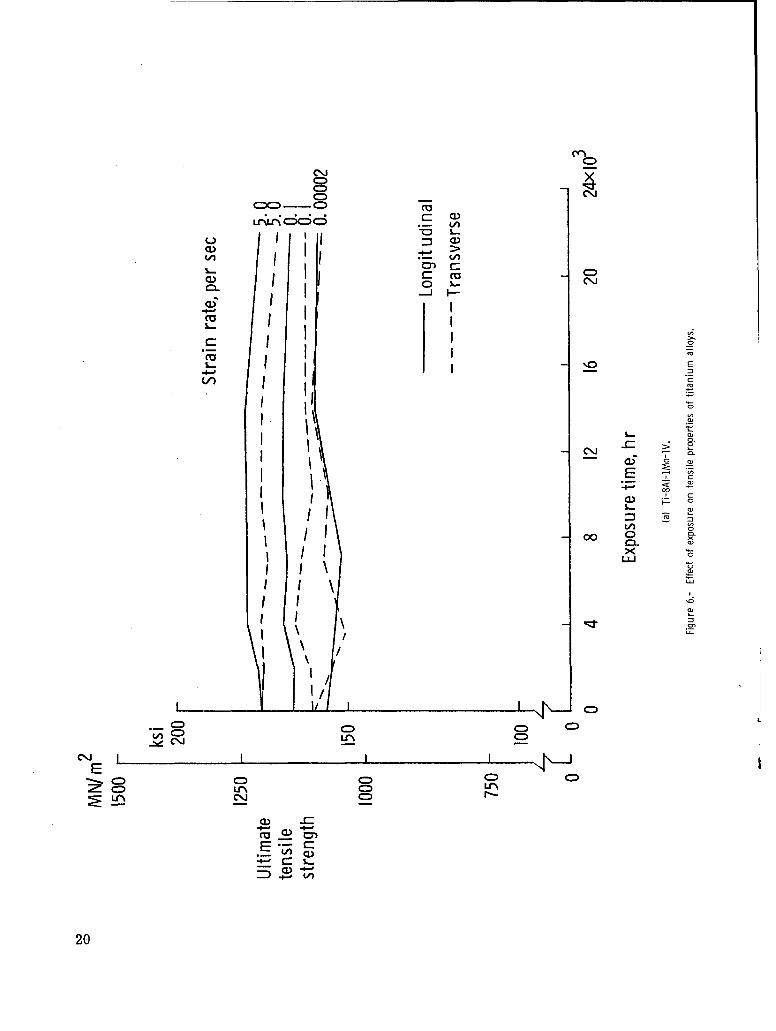
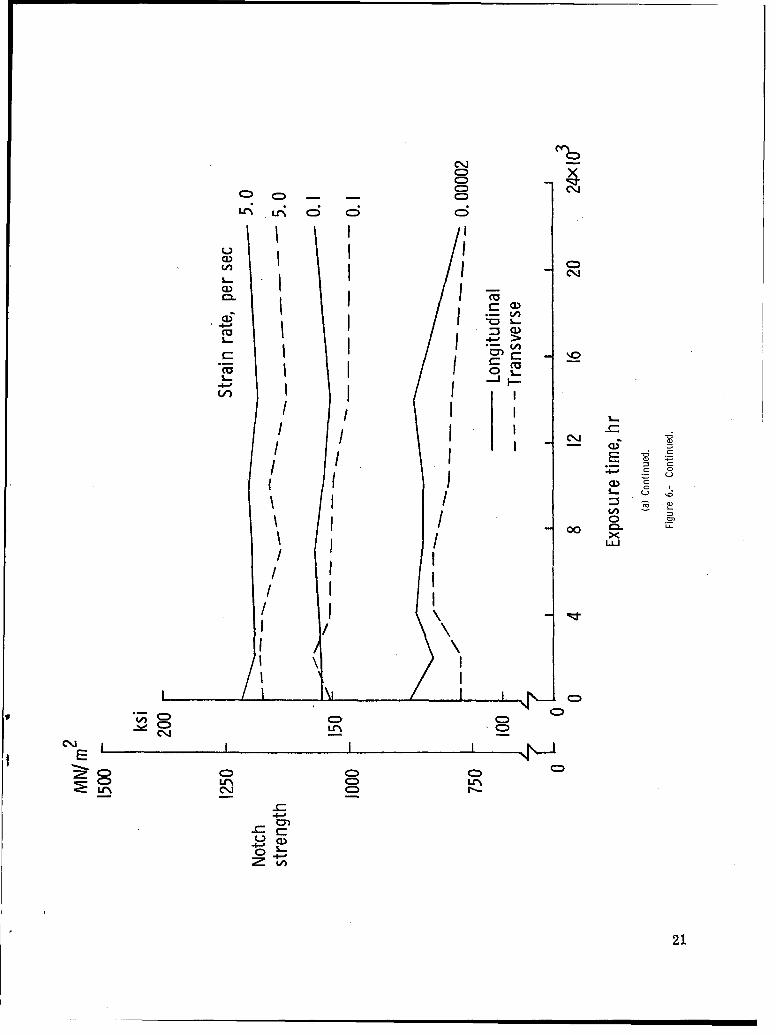
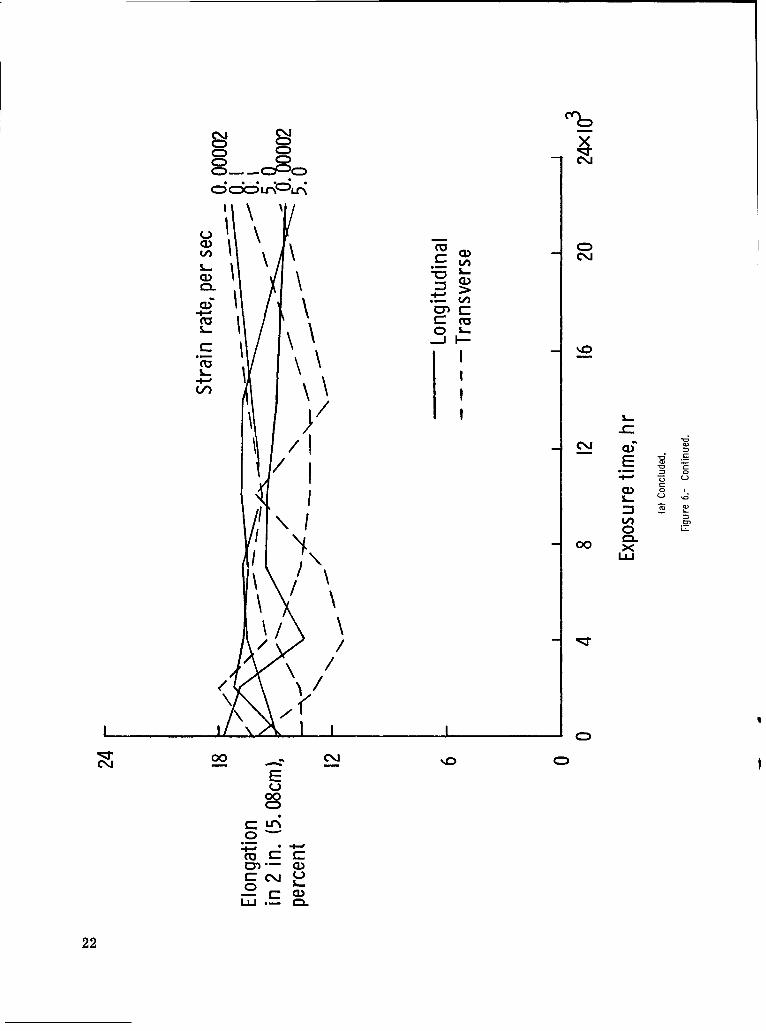
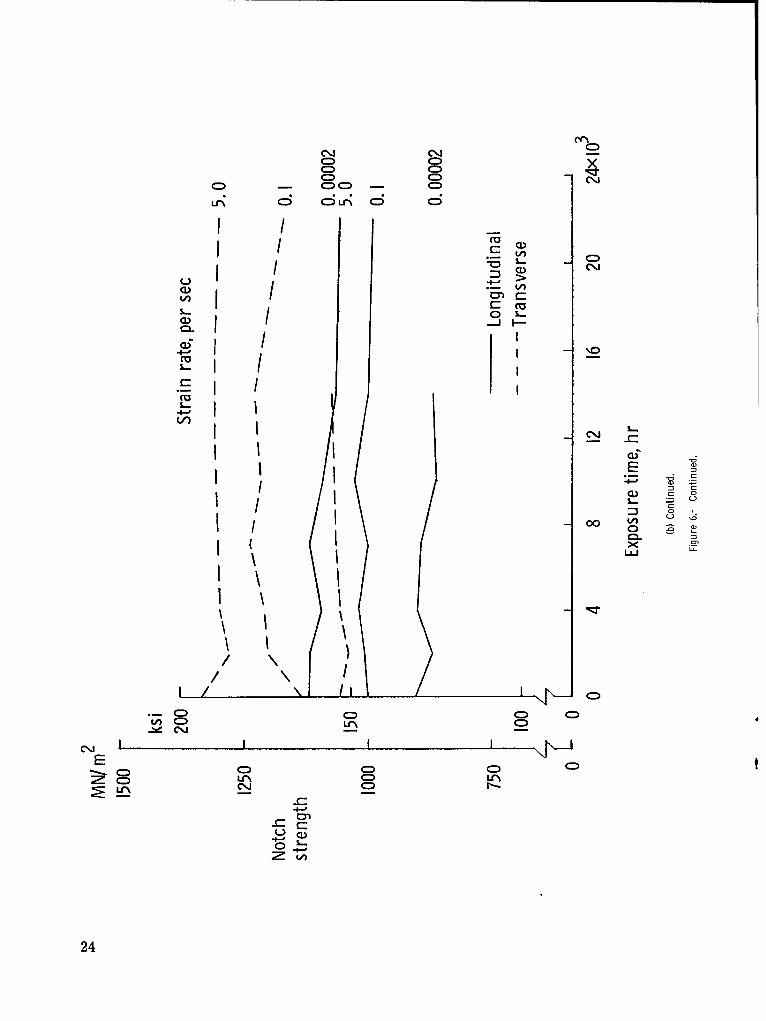
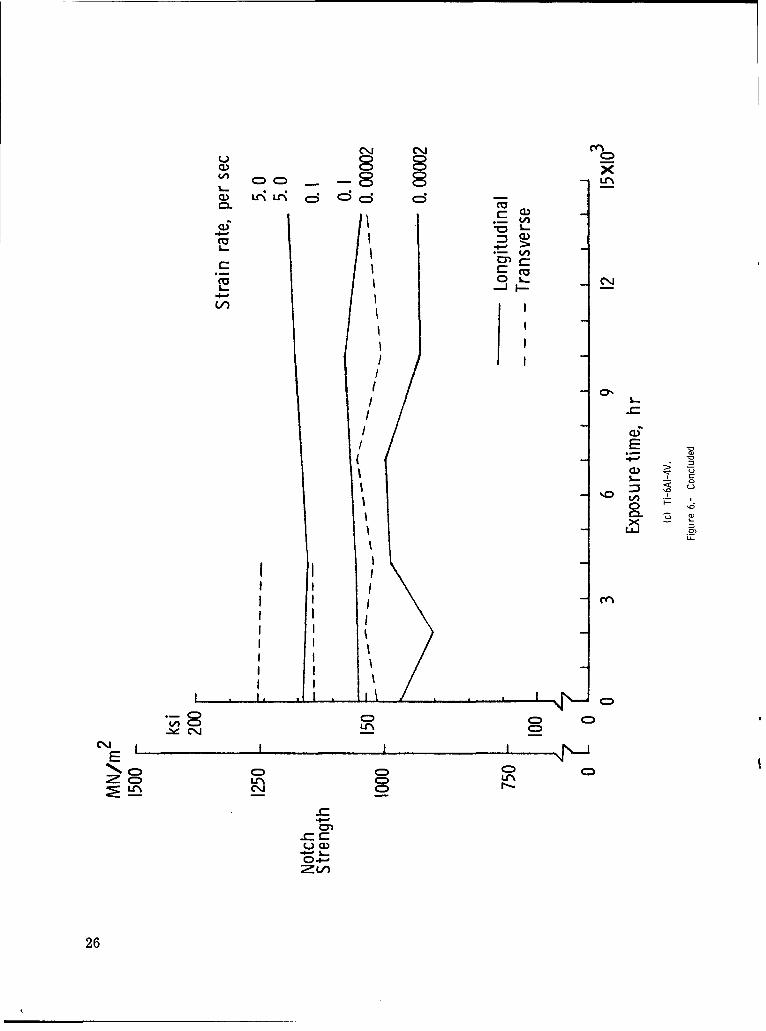
Effect of Exposure
The effect of exposure at 5500 F (5610 K) up to 22 000 hours on tensile properties
of the titanium alloys is shown in figure 6. Ultimate tensile strength, notch strength, andelongation are shown for Ti-8AI-lMo-IV (fig. 6(a)) and Ti-4A1-3Mo-IV (fig. 6(b)) at room
temperature for the three strain rates. Notch strength for Ti-6A1-4V is shown in
figure 6(c).
In general, exposure does not produce a consistent increase or decrease in tensile
properties of the three alloys at any of the strain rates for the test range of exposure
times. Notice that data are not available to 22 000 hours for all specimens. Additional
information on the effect of exposure up to 22 000 hours on the tensile properties ofTi-6AI-4V obtained at low strain rates may be obtained from reference 2. Results pre-sented therein also showed no significant effect of exposure on tensile properties.
Effect of Strain Rate
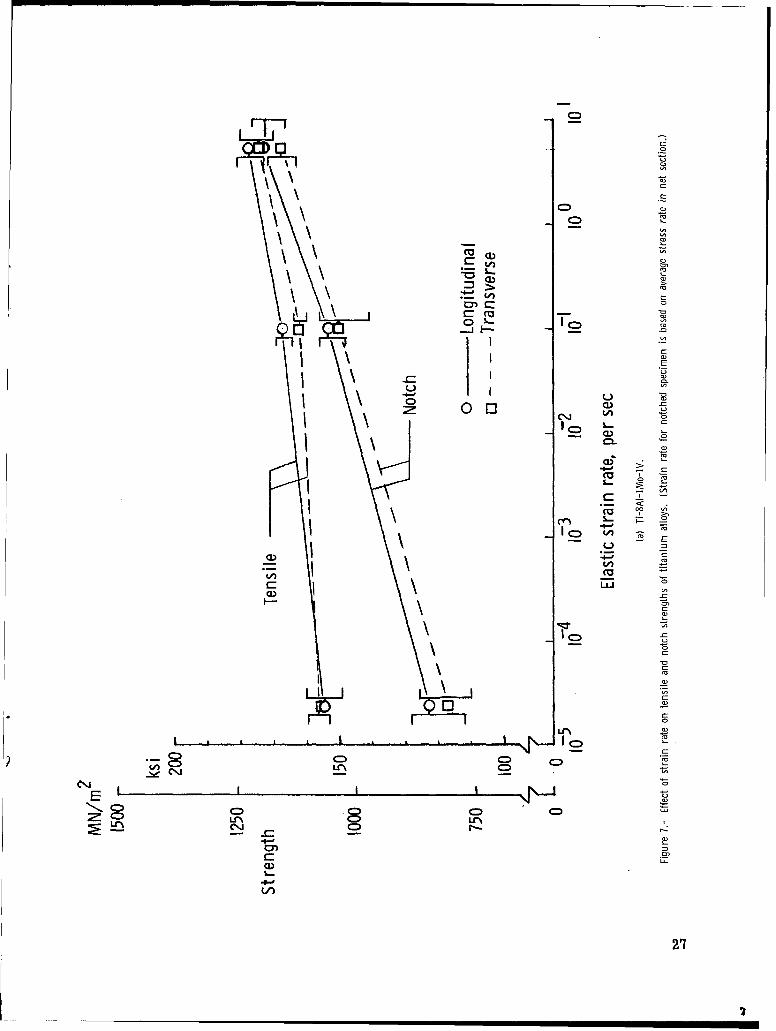
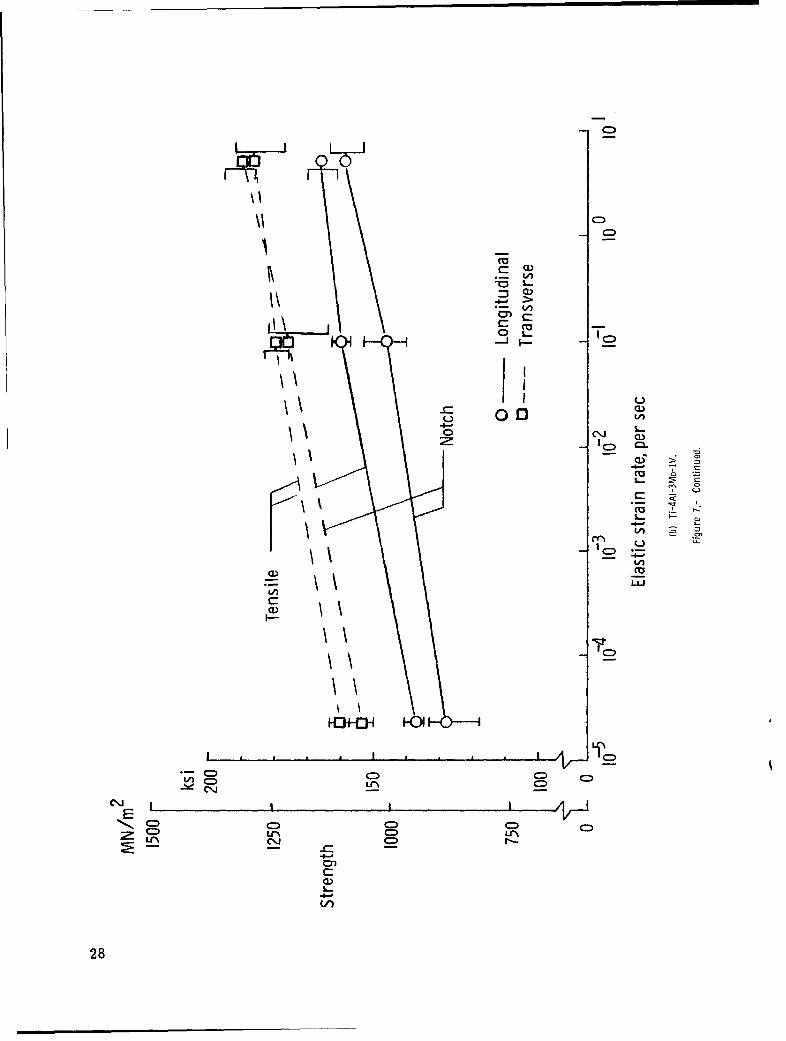
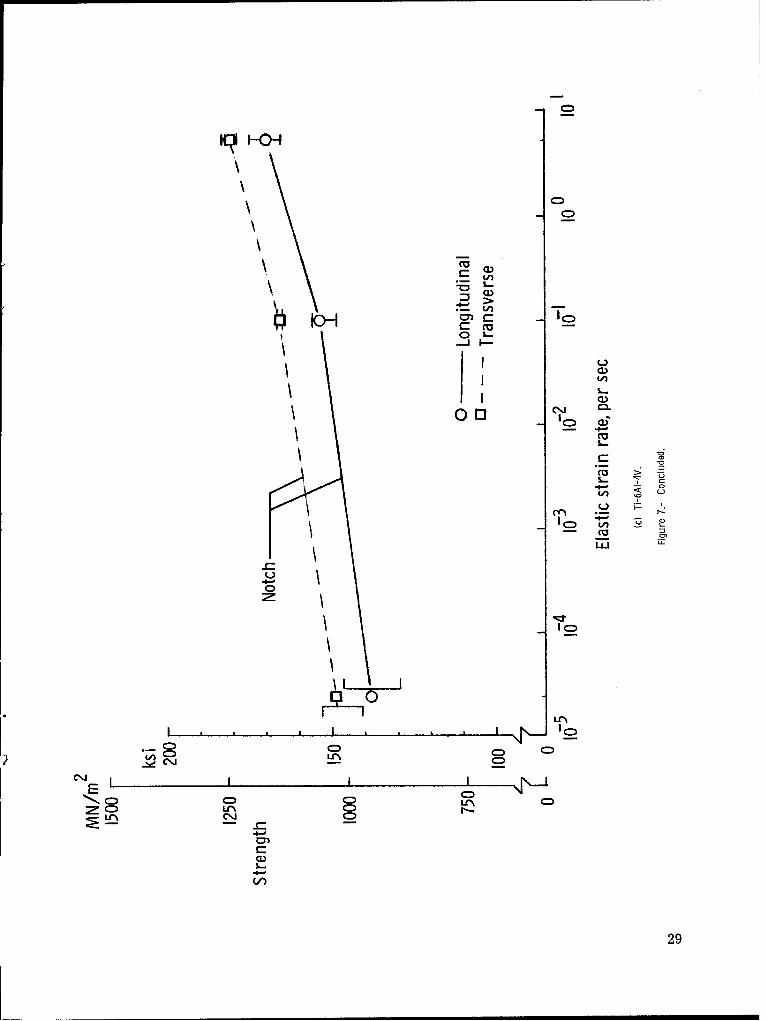
Tensile and notch strengths.- The effect of an increase in strain rate on the tensile
(i.e., referring to smooth specimens) and notch strengths for Ti-8A1-lMo-IV,
Ti-4A1-3Mo-IV, and Ti-6AI-4V titanium alloys is shown in figure 7. The data points onthe curves represent the average of the test results for all exposure times for a particu-lar strain rate and grain direction. The scatter bands attached to each data point presentthe highest and lowest strength values recorded over the entire exposure range. Thetensile and notch strengths of Ti-8AI-lMo-1V (fig. 7(a)) increased moderately with strain
rate. The results for the longitudinal direction were slightly higher than those for thetransverse direction, except at the lowest strain rate, where the tensile strengths for
both directions were very nearly the same. For Ti-4A1-3Mo-1V (fig. 7(b)), the trans-verse tensile and notch strengths were higher than the strengths of the longitudinal speci-mens at each of the three strain rates. The same pattern of increasing strength was dis-played for both specimen grain directions, with the notched specimens exhibiting a slightlygreater increase than the smooth specimens as the strain rate was increased. The notch
strength of Ti-6AI-4V (fig. 7(c)) increased with increasing strain rate for both specimengrain directions. At each of the three strain rates, the transverse strengths were higher
than the longitudinal strengths. No data on the effect of strain rate on the tensile strength
were obtained.
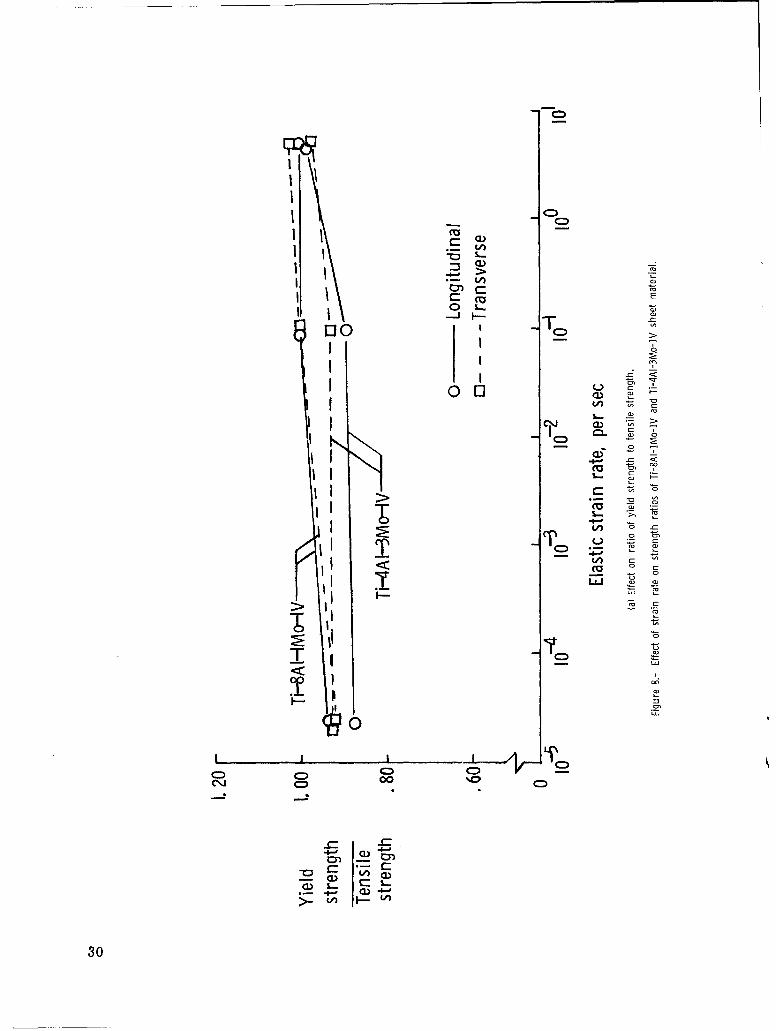
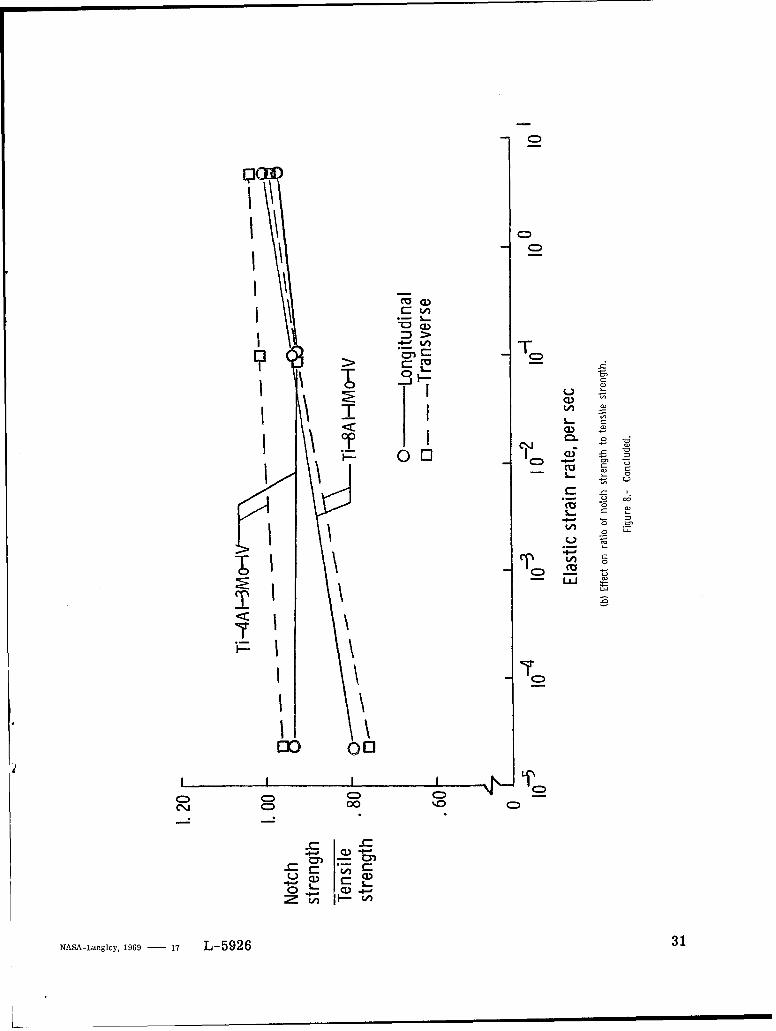
Relation between yield, notch, and tensile strengths.- The effect of strain rate on
the yield and notch strength ratios is shown in figure 8. The data points on the curves
6
represent the average of strength data for all exposures at each strain rate. The effect
of strain rate on the yield strength ratio (the ratio of yield strength to ultimate tensile
strength) for Ti-8A1-lMo-IV and Ti-4A1-3Mo-1V is shown in figure 8(a). For both
alloys, the yield strength increased more rapidly with strain rate than the tensile
strength. The yield strength ratio for Ti-8A1-lMo-IV and Ti-4A1-3Mo-lV (based on the
upper or initial yield stress) varied from about 0.92 at a strain rate of 0.00002 per sec-
ond to about 0.98 at 5.0 per second. The fact that at the highest rate of 5.0 per second
the yield strength ratio for both alloys approached unity indicates that the yield strength
was very nearly the same as the ultimate tensile strength.
The effect of strain rate on the notch strength ratio (the ratio of notch strength to
ultimate tensile strength) of Ti-8AI-lMo-IV and Ti-4A1-3Mo-IV is shown in figure 8(b).
For both Ti-8AI-IMo-IV and Ti-4A1-3Mo-IV, the notch strength increased more rapidly
with strain rate than the tensile strength. The ratio for Ti-4A1-3Mo-IV varied from
about 0.95 at a strain rate of 0.00002 per second to 1.00 at a strain rate of 5.0 per second.
The notch strength ratio for Ti-8AI-lMo-IV varied from about 0.78 at 0.00002 per sec-
ond to 0.99 at 5.0 per second. The increase in notch strength ratio with strain rate for
both materials indicates that the alloys appear to be less notch sensitive at a higher
strain rate even though the tensile strengths are greater.
CONCLUDING REMARKS
An investigation was performed to determine the effects of exposure up to
22 000 hours at 5500 F (5610 K) on the strain-rate sensitivity of Ti-8A1-lMo-IV (mill
annealed), Ti-4A1-3Mo-lV (solution treated and aged), and Ti-6A1-4V (mill annealed)
sheet. These effects were determined from changes in tensile properties of smooth and
V-notched specimens obtained (before and after exposure) at strain rates that ranged
from 0.00002 to about 5.0 per second. No significant change was observed in tensile
properties of either the V-notched or the smooth alloy specimens at any of the strain
rates after exposures up to 22 000 hours at 5500 F (5610 K). This result indicates that
there was no material deterioration due to the exposure. The effect of increasing strain
rate on the alloys was generally a corresponding moderate increase in the tensile (i.e.,
referring to smooth specimens) and notch strengths. For Ti-8A1-lMo-IV and
Ti-4A1-3Mo-IV, the yield and notch strengths increased more rapidly with increasing
strain rate than did the ultimate tensile strength.
Langley Resedirch Center,
National Aeronautics and Space Administration,
Langley Station, Hampton, Va., September 13, 1968,
129-03-06-05-23.
7
APPENDIX A
CONVERSION OF U.S. CUSTOMARY UNITS TO SI UNITS
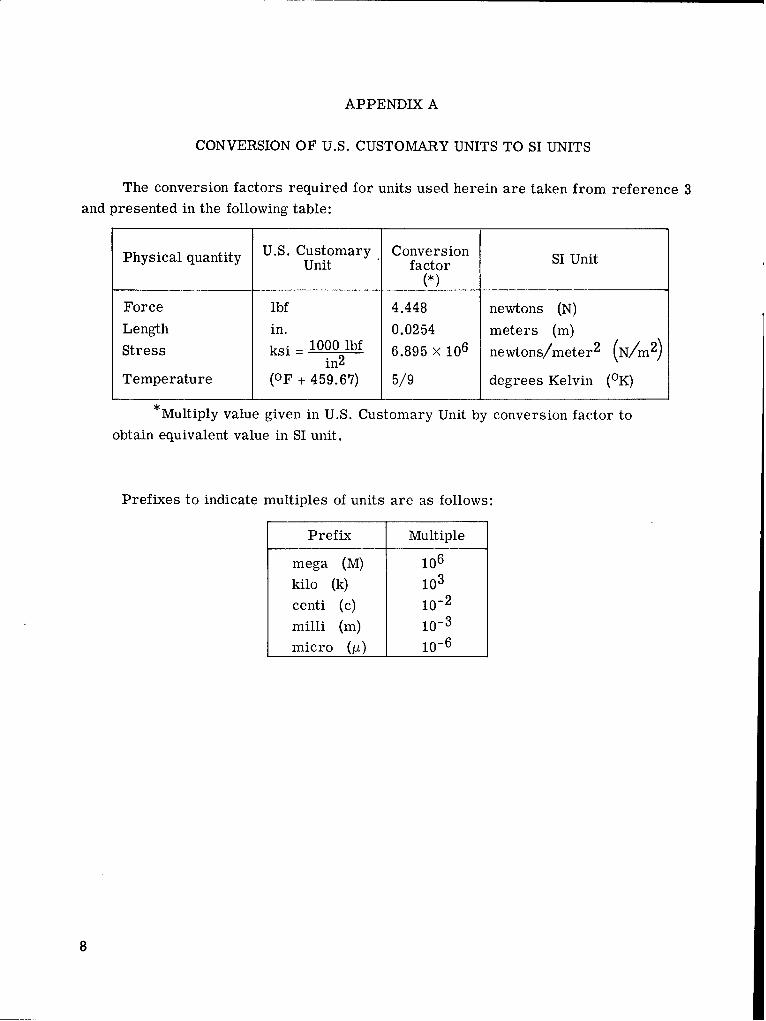
The conversion factors required for units used herein are taken from reference 3
and presented in the following table:
Physical quantity U.S. Customary Conversion SI UnitUnit factor(*)
Force lbf 4.448 newtons (N)
Length in. 0.0254 meters (m)Stress ksi 6.895 X 10⁶ newtons/meter 2 (N/m2)
Temperature (OF + 459.67) 5/9 degrees Kelvin (OK)
*Multiply value given in U.S. Customary Unit by conversion factor to
obtain equivalent value in SI unit.
Prefixes to indicate multiples of units are as follows:
Prefix Multiple
mega (M) 106
kilo (k) 103
centi (c) 10-2
milli (m) 10-3
micro (i) 10-6
8
APPENDIX B
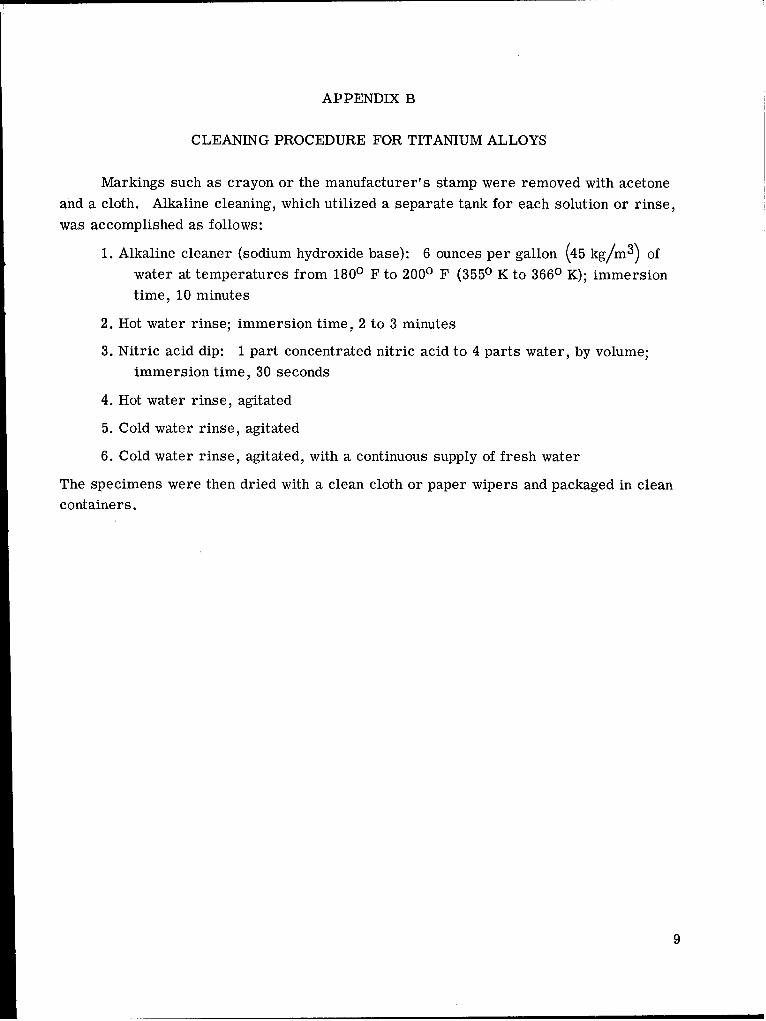
CLEANING PROCEDURE FOR TITANIUM ALLOYS
Markings such as crayon or the manufacturer's stamp were removed with acetone
and a cloth. Alkaline cleaning, which utilized a separate tank for each solution or rinse,was accomplished as follows:
1. Alkaline cleaner (sodium hydroxide base): 6 ounces per gallon (45 kg/in 3 ) of
water at temperatures from 1800 F to 2000 F (3550 K to 3660 K); immersiontime, 10 minutes
2. Hot water rinse; immersion time, 2 to 3 minutes
3. Nitric acid dip: 1 part concentrated nitric acid to 4 parts water, by volume;immersion time, 30 seconds
4. Hot water rinse, agitated
5. Cold water rinse, agitated
6. Cold water rinse, agitated, with a continuous supply of fresh water
The specimens were then dried with a clean cloth or paper wipers and packaged in cleancontainers.
9
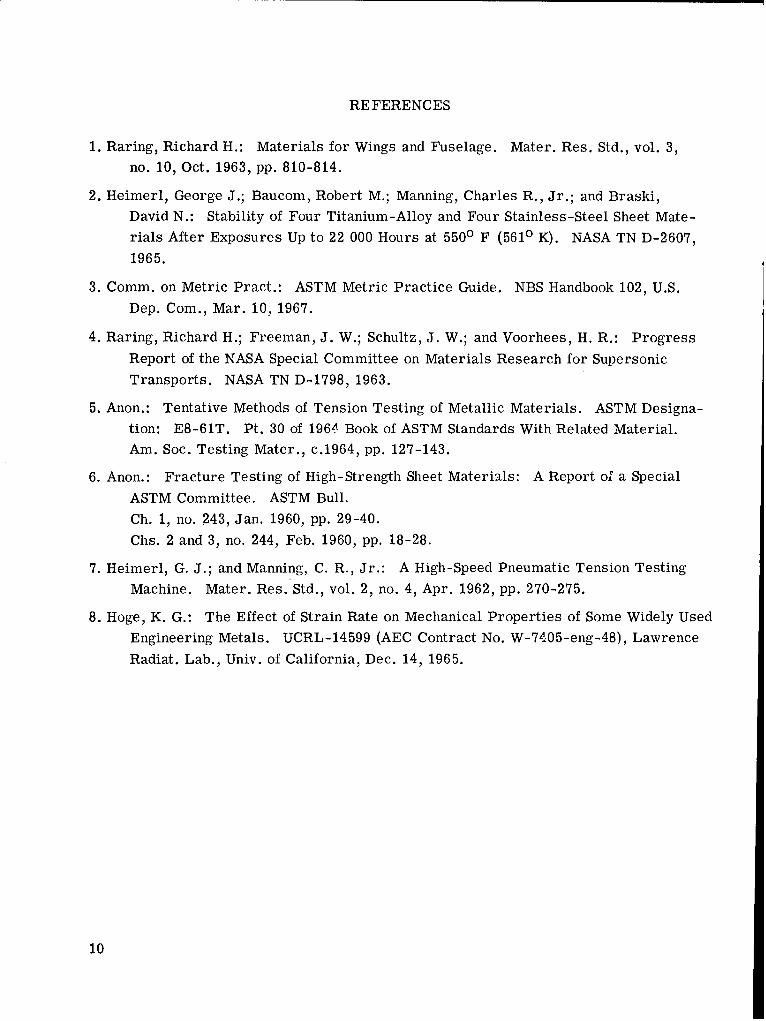
RE FERENCES
1. Raring, Richard H.: Materials for Wings and Fuselage. Mater. Res. Std., vol. 3,
no. 10, Oct. 1963, pp. 810-814.
2. Heimerl, George J.; Baucom, Robert M.; Manning, Charles R., Jr.; and Braski,
David N.: Stability of Four Titanium-Alloy and Four Stainless-Steel Sheet Mate-
rials After Exposures Up to 22 000 Hours at 5500 F (5610 K). NASA TN D-2607,
1965.
3. Comm. on Metric Pract.: ASTM Metric Practice Guide. NBS Handbook 102, U.S.
Dep. Com., Mar. 10, 1967.
4. Raring, Richard H.; Freeman, J. W.; Schultz, J. W.; and Voorhees, H. R.: Progress
Report of the NASA Special Committee on Materials Research for Supersonic
Transports. NASA TN D-1798, 1963.
5. Anon.: Tentative Methods of Tension Testing of Metallic Materials. ASTM Designa-
tion: E8-61T. Pt. 30 of 196A Book of ASTM Standards With Related Material.
Am. Soc. Testing Mater., c.1964, pp. 127-143.
6. Anon.: Fracture Testing of High-Strength Sheet Materials: A Report of a Special
ASTM Committee. ASTM Bull.
Ch. 1, no. 243, Jan. 1960, pp. 29-40.
Chs. 2 and 3, no. 244, Feb. 1960, pp. 18-28.
7. Heimerl, G. J.; and Manning, C. R., Jr.: A High-Speed Pneumatic Tension Testing
Machine. Mater. Res. Std., vol. 2, no. 4, Apr. 1962, pp. 270-275.
8. Hoge, K. G.: The Effect of Strain Rate on Mechanical Properties of Some Widely Used
Engineering Metals. UCRL-14599 (AEC Contract No. W-7405-eng-48), Lawrence
Radiat. Lab., Univ. of California, Dec. 14, 1965.
10
0
W '0
Cd ', 0r.0 C.)
cd~,0 0 Z'
Cd u ."o 0
-~ 0-4 " W
a))~i2 00,- 0 C
0 raq Cdd0 t
C)
LOp 0 -0 0
LD --4
00'L a) 0 dý~;4 Cd, p-4
i0 Q)0-4 -4 r c
0d 0 -A m 0L
0 0ý 0Db4-4 0
'0
0'
0 C) ) '-4
0 Cd PC
9 g0i 0
Cd
>11
tn S q cc Lfl Ifn *:v
t- t-0 n o -
00 L 00 00 C.
tr- r-o CV L I1
bbw00 cc oý ýVC14
E-4 W) U -
o -q .,O co-- 0~a) rn 00 C) 0
0 p
u CD L--a C)0 00 C-4 4 - -
-4-i -4
Ca.
-P4
r- Ln Lnc m-o LC -W Icd r)-4-4 '-4 -4 ~-q -
Ua.pq ý-H
10 (1 - 1) 101 Q
z 0
E-4 +j
1-4 ~ 0~ -
E-4 0.
12.
E-4w
rn
U ) 0
0 p C1 e q e q C4 r4 r-4 rICq cq V-4
E-4U
0 0000
C)0 0 0 00
UW 0 C4 ~ CqC3 C4C l C -C) C
0x 4q ,**c C4 eq r 4 r*, r 4 a C4r4 -
C's W
4-)s cl qc qCLM- 0)C 0 C) C.)
C)0 C0C 0
UO CD0 00 C 0 0 C ýC
5-4 C> C > C) C D 40 CCdC
0
U) 4-)4-J 13
88
C6 .)800
*.9 . ~ l-I
-N
H UNU.\0 CY ~
Ou-4 0l\ C)U
*CUo 0N t-
0
CUC
7 OH
U.
es
14E
•' • Pilot Valv
Pres sure chamber
• i~torage oscillosoe
S] i ~~~Specimen Sran ag
S~Weigh bar
Figure 2.- The 10 000- lbf -capacity (44.5 kN) high-speed pneumatic tensile testing machine and the recording system. L-68-10,001
15
00
C )L - -( - - - - -
E E
C=) Cu)0~
Cu>00
-a)E
00 00
u CD
CLD. 4- L.
44- C)~j
(a a
Cw CL)L
0 EE_
E
CD,
CýI_________ Ko
C:> _o
16
Load 5500 Ibf (24. 5 kN)
20 msec
Time
Figure 4.- Representative load time history for transverse Ti-4AI-3Mo-1V notched specimen at a strain rate of 5.0 per second.
17

C:))
CDC
C=; E
0.)L0
L.o
cC 2CDC
.4-D
CC
CDC
Cli
C)j
C:) CD C=) C: C)
C)CD C C:)
Ln
18
CD0
tA~C)
I-- U1N
.419
C.) I~
V)
a) 0 a)
CU :)
"" E
Ca) CDU'
E
200
C=C
Lr\Lý 6 6
I D
U)~C I IC:
I I
I _.
Ci) CDC
I -
CE
I 21
-CC)
-- >
.E .U
oE -= ci
ca,~ ~
S. -' '
22~

C:)J
L) :)
00 e-
eJ L.
I 0))LI L..CD
CD CDohdIId
C-,D
22
C).
CD u
LL..
C:%
CD v
I- 0 &-
CCu
CI C) C: 0:C:) C=)0
E0L ~ Ci 0= ) =
C= 0.% ) l
UN C=) /
cm.
C:
24

C:\
C~~> CC. L
Cl)CE
C:) C%4
a;; / - I ;U
1.... ~ 6100 01=-I
C-)D
00
Ci)
25
a)=C:)
CD Ltý L C6i
O- -0 L
I-o cJIl
I -
a)0
oo'
LLU
26I
rýF-1C
j0
CucC)
0 13
a)
ccu - cc
C -
w I 5
C= CD
c>~ C)C-C) CO\
-~ C27
'CI
C ciD
00
C: ) >M
ca
C:
Lv'
CD, C:-= IJD
C,
28c
000
cc~ -
-II-D
EcI D
cmL
22
LI))
oco
£10 0
00iL
C)I C>C: 00 *
I~j C=
CDi
Ln2
30 U
-- \
IT coo
75,
- w
co co .
C=)
I 0na ,
TIT
EQ 003
C) ~00C=
_F aC) CD
NASA-Langley, 1969 - 17 L-5926 31