naspi control solutions task team paper: using synchrophasor data · pdf file ·...
TRANSCRIPT

NASPI Control Solutions Task Team Paper:Using Synchrophasor Data for Phase
Angle Monitoring
NASPI Work Group Meeting – Session 4Sarma Nuthalapati (Texas A&M), Michael Cassiadoro (TRS)
Seattle, WA – October 19, 2016

TopicsI. Describe purpose of NASPI Control Room
Solutions Task Team (CRSTT) focus area docs.II. Provide overview of CRSTT Phase Angle
Monitoring Paper.III. Review applications described in paper.
2

NASPI CRSTT Focus Area Documents
Primary Objective – Develop series of papers exploring the following areas of interest:• System Islanding Detection and Blackstart Restoration• Voltage Stability Assessment• Phase Angle Monitoring• Oscillation Detection• Disturbance Detection and Location• Reactive Power Balancing
3

Phase Angle Monitoring Paper
Key Objectives:• Learn how PMU data and synchrophasor application
outputs are being used for phase angle monitoring• Share grid operator and electric utility experiences• Collect videos to demo operational tools

Potential Use:Local Area - Monitor bus voltage angle difference between line terminals to determine if line will be within maximum allowable closing limits prior to test. Wide Area - Monitor phase angles across Wide-Area to identify significant divergences that indicate increased static stress.
Value Add:Increase amount of time staff has to take corrective action and reduce phase angle to within acceptable limits if needed; allow staff to identify increases in static stress that may be precursors to a disturbance event.
5
PMU-Based Phase Angle Measurements

6
Monitoring Local Phase Angle Differences
POSCO WAMS Display – Voltage Magnitude, Angle Difference and Frequency Difference. Screenshot taken from “Automated Event Analysis Tool using Synchrophasor Data in Indian Grid” presentation delivered at NASPI Work Group Meeting on March 24, 2015.
7
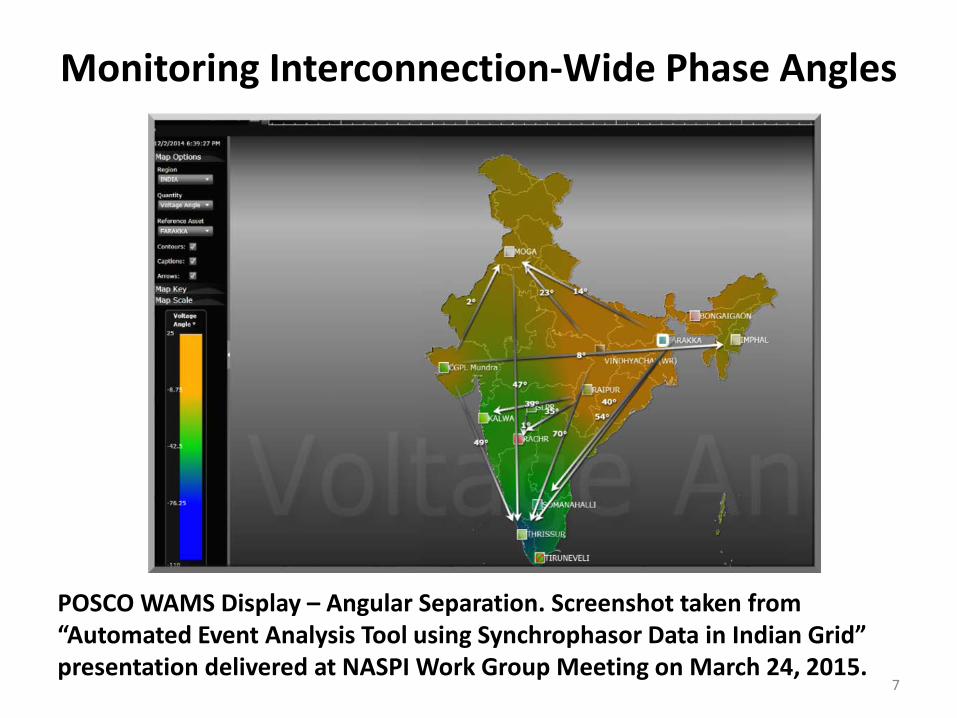
Monitoring Interconnection-Wide Phase Angles
POSCO WAMS Display – Angular Separation. Screenshot taken from “Automated Event Analysis Tool using Synchrophasor Data in Indian Grid” presentation delivered at NASPI Work Group Meeting on March 24, 2015.

8
NASPI CRSTT Application Template

• Organizations contacted – 17 responded out of 27• Alstom Grid • Dominion Virginia Power (DVP) • Duke Energy • Electric Power Group (EPG)• Electric Power Research Institute (EPRI) &
PowerTech Labs• Entergy• Electric Reliability Council of Texas (ERCOT)• Lower Colorado River Authority (LCRA)
Transmission Services Corporation• Midcontinent ISO (MISO)• ISO New England (ISO-NE)• National Instruments• Pacific Northwest National Lab (PNNL)• Power System Operation Corp, India (POSCO)• PJM Interconnection• Quanta Technology• Rensselaer Polytechnic Institute (RPI)• Schweitzer Engineering Laboratories (SEL)
• V&R Energy• Washington State University (WSU)• American Transmission Company (ATC)• Pacific Gas & Electric (PG&E)• Swissgrid• Peak Reliability• New York ISO (NYISO)• Southern California Edison (SCE)• Florida Reliability Coordinating
Council/Florida Light and Power (FRCC/FLP)
• XM, Columbia
Requests for Participation

User Responses Vendor Responses• Dominion Virginia Power (DVP)• ISO New England (ISO-NE)• American Transmission Company (ATC)• PJM Interconnection• Power System Operation Corporation,
India (POSCO)• Peak Reliability • Southern California Edison (SCE)• LCRA Transmission Services Corp.• Duke Energy • Electric Reliability Council of Texas
(ERCOT)• XM, Columbia
• Alstom Grid • Electric Power Group (EPG)• Electric Power Research Institute (EPRI)
& PowerTech Labs• Quanta Technology• Schweitzer Engineering Labs (SEL)• V&R Energy
Requests for Participation (Cont.)

Application Types – Majority of responders using:• Alstom Phasor Point & e-Terravision• EPG RTDMS• GE Power On (formerly XA/21)• SEL SynchroWAVe Central
Numerous entities developing customized or highly configured apps to meet their respective needs (including use of open source software).
11
Summary of User Responses

12
Visualization Examples
American Transmission Company – Display of voltage angle information using Alstom Phasor Point.
13
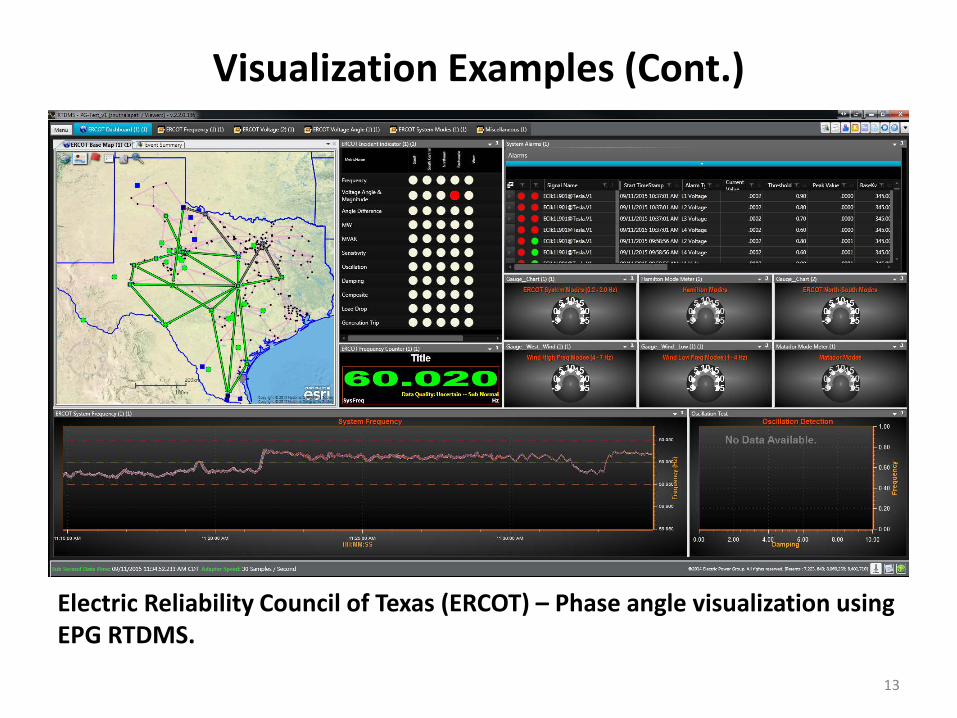
Visualization Examples (Cont.)
Electric Reliability Council of Texas (ERCOT) – Phase angle visualization using EPG RTDMS.
14
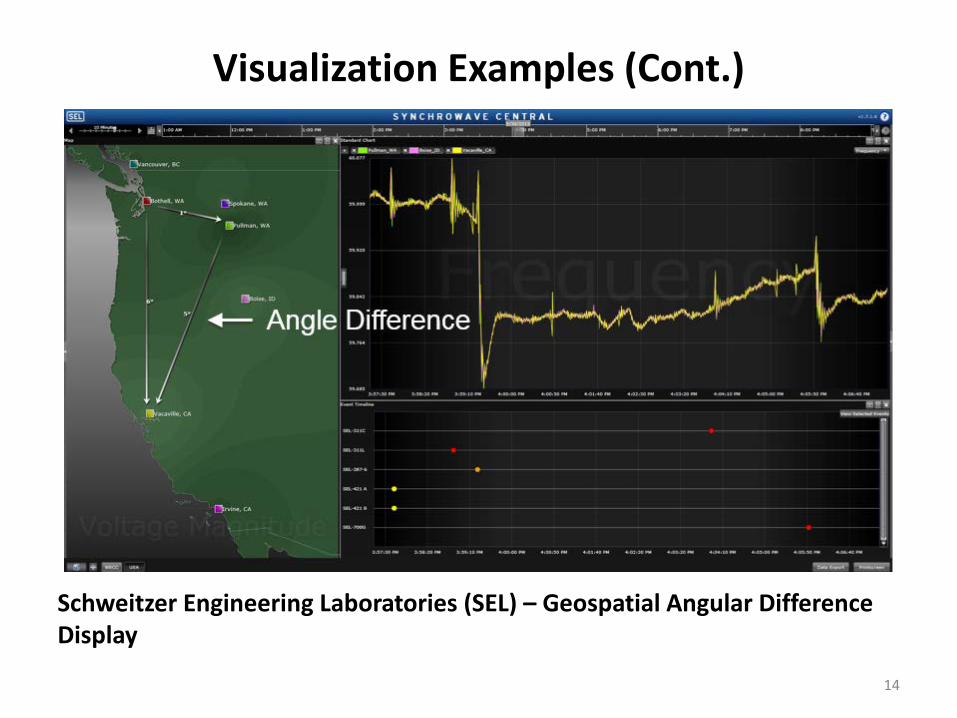
Visualization Examples (Cont.)
Schweitzer Engineering Laboratories (SEL) – Geospatial Angular Difference Display

Primary Objectives• Provide Real-time wide-area situational awareness to System
Operators and Operations Engineers• Identify growing angular separation• Alert users to conditions that may require action• Allow for analysis of Real-time and historical data
Current Users• Majority of apps used by Operations Engineering staff at this
time.• Only POSCO has fully integrated its app into the control room
environment for System Operator use. 15
Summary of User Responses

Key Takeaways• Visualization Methods – Apps must allow users to view phase
angle measurements in different ways (e.g., geospatial maps, schematic displays, high-speed trends, tabulars).
• Integration Effort – Ability to integrate apps into EMS is key, majority of responders will not task System Operators with monitoring alarms outside of the EMS.
• How to Operationalize – Must address CIP concerns, establish actionable limits and develop operating guidelines and procedures.
16
Summary of User Responses (Cont.)

• NASPI CRSTT Focus Area Document on ‘Using Synchrophasor Data for Phase Angle Monitoring’, May 2016 (https://www.naspi.org/File.aspx?fileID=1567)
• NERC’s Phase Angle Monitoring Technical Reference Document, June 2016 (http://www.nerc.com/comm/PC/Synchronized%20Measurement%20Subcommittee/Phase%20Angle%20Monitoring%20Technical%20Reference%20Document%20-%20FINAL.pdf)
17
References
