nat region aeronautical radio stations network 2013 data ... and nat documents/nat...
TRANSCRIPT

NAT REGION Aeronautical Radio Stations Network
2016
Data consolidation report
(Presented by Portugal)
NAT AERONAUTICAL RADIO STATIONS NETWORK DATA CONSOLIDATION REPORT 2016 – AS ENDORSED AT NAT IMG/50
(Appendix K to the NAT IMG/50 Summary of Discussions – NAT IMG Decision 50/7 refers)

NAT Region Aeronautical Radio Stations 2016 Data Consolidation Report Page 2
NAT Region Aeronautical Radio Stations 2016 Data Consolidation Report Page 3
Contents 1 INTRODUCTION ............................................................................................................................... 7
2 NAT REGION VOICE TRAFFIC OVERVIEW (BY RADIO STATION AND OVERALL SUM) ...................... 8
2.1 Total of messages and relative variation ................................................................................ 8
2.2 Five year period traffic variation ........................................................................................... 11
2.3 Band/Frequency utilization ................................................................................................... 14
2.3.1 Aeronautical stations individual analysis ...................................................................... 15
2.3.2 NAT overall analysis ...................................................................................................... 17
3 VOICE COMMUNICATION SYSTEM PERFORMANCE ASSESSMENT ............................................... 18
3.1 ATC intervention messages (Clearances, Requests and Advisories) ..................................... 18
3.2 Surveillance messages (Position reports) ............................................................................. 19
3.3 FAA voice communications performance assessment ......................................................... 20
4 APPENDIXES .................................................................................................................................. 23
4.1 Appendix 1 – NAT Region ...................................................................................................... 25
4.2 Appendix 2 – Bodo ................................................................................................................ 33
4.3 Appendix 3 - Gander ............................................................................................................. 37
4.4 Appendix 4 - New York .......................................................................................................... 41
4.5 Appendix 5 - Santa Maria ...................................................................................................... 45
4.6 Appendix 6 – Shanwick and Iceland ...................................................................................... 49

NAT Region Aeronautical Radio Stations 2016 Data Consolidation Report Page 4
TABLES Table 1 –Total of voice messages and relative variation in comparison with previous year ................. 8
Table 2 – Relative variation of voice messages between 2011 and 2015 ............................................ 12
Table 3 – Most used HF bands and frequencies ................................................................................... 14
Table 4 – Santa Maria voice ATC intervention messages summary ..................................................... 18
Table 5 – Santa Maria voice surveillance messages summary ............................................................. 19

NAT Region Aeronautical Radio Stations 2016 Data Consolidation Report Page 5
FIGURES Figure 1 - RELATIVE VARIATION 2016-2015 (NAT REGION AND BY RADIO STATION) ............................ 9
Figure 2 – Aeronautical stations traffic comparison ............................................................................. 10
Figure 3 – Traffic comparison among aeronautical stations in the last five years ............................... 11
Figure 4 - 5 year relative variation of voice messages (NAT Region and by radio station) .................. 12
Figure 5 – 2011-2015 voice messages variation (absolute and relative) .............................................. 12
Figure 6 – Monthly variation of RT contacts ......................................................................................... 16
Figure 7 – Frequency usage .................................................................................................................. 16
Figure 8 – Aggregate RT contacts by NAT/RDARA family and on VHF/SATVOICE ................................ 17
Figure 9 – Santa Maria voice ATC intervention messages performance .............................................. 18
Figure 10 – Santa Maria voice surveillance messages performance .................................................... 19
Figure 11 – FAA voice communication performance assessment criteria ............................................ 20
Figure 12 – FAA voice communication performance ............................................................................ 20
Figure 13 – FAA voice surveillance performance assessment criteria .................................................. 21
Figure 14 – FAA voice surveillance performance .................................................................................. 21

NAT Region Aeronautical Radio Stations 2016 Data Consolidation Report Page 6

NAT Region Aeronautical Radio Stations 2016 Data Consolidation Report Page 7
1 INTRODUCTION This data consolidation is presented in accordance with NATSPG Conclusion 29/13 - HF DATA
COLLECTION alineas a), b) and c) and reflects the NAT Aeronautical Stations contacts in 2016.
The report is organized to provide both a global overview and individual Stations analysis. It allows
an annual comparison of total RT contacts, frequency utilization and NAT Family utilization in both
graphic and tabular forms.
Additionally, for the aeronautical stations able to provide that information, the report contains an
assessment of the Voice Communications System Performance and information on the use of
SATVOICE, in accordance with CNSG9 Summary of Discussions, paragraphs 4.2 to 4.4 and ACSG14
Summary of Discussions, paragraph 3.8.
NAT Region Aeronautical Radio Stations 2016 Data Consolidation Report Page 8
2 NAT REGION VOICE TRAFFIC OVERVIEW (BY RADIO STATION AND
OVERALL SUM)
2.1 Total of messages and relative variation
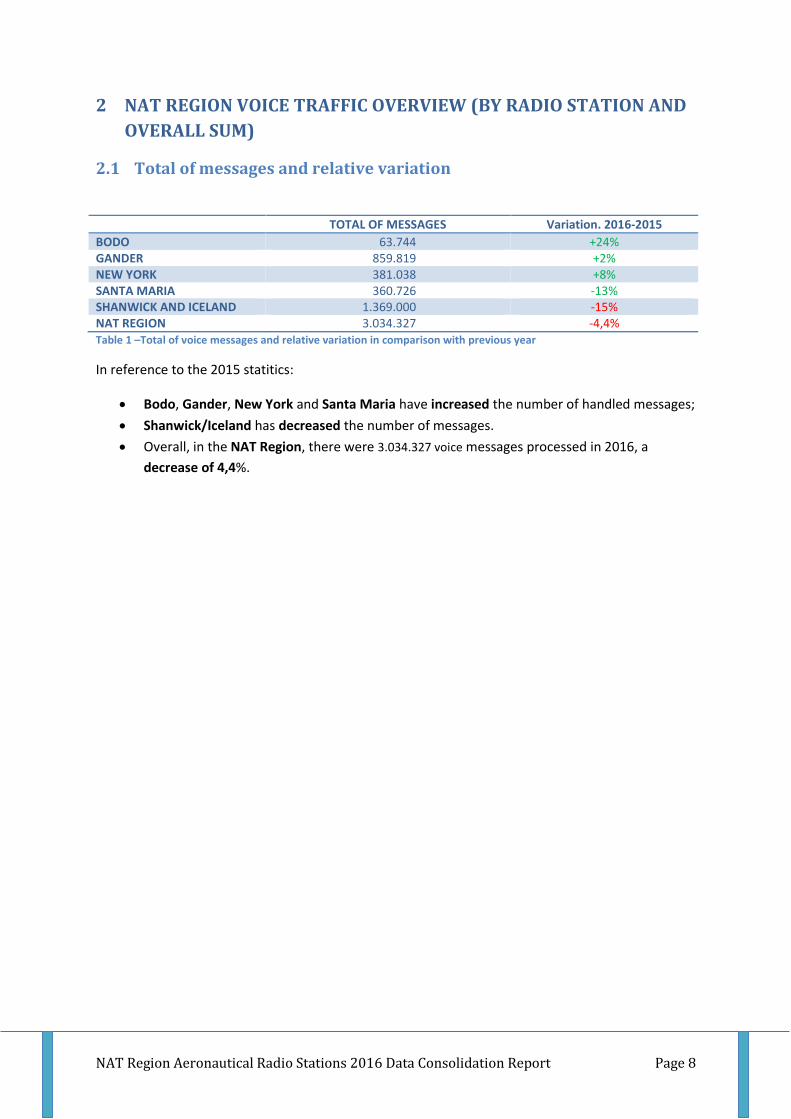
TOTAL OF MESSAGES Variation. 2016-2015
BODO 63.744 +24% GANDER 859.819 +2% NEW YORK 381.038 +8% SANTA MARIA 360.726 -13% SHANWICK AND ICELAND 1.369.000 -15% NAT REGION 3.034.327 -4,4% Table 1 –Total of voice messages and relative variation in comparison with previous year
In reference to the 2015 statitics:
Bodo, Gander, New York and Santa Maria have increased the number of handled messages;
Shanwick/Iceland has decreased the number of messages.
Overall, in the NAT Region, there were 3.034.327 voice messages processed in 2016, a
decrease of 4,4%.

NAT Region Aeronautical Radio Stations 2016 Data Consolidation Report Page 9
Figure 1 - RELATIVE VARIATION 2016-2015 (NAT REGION AND BY RADIO STATION)

NAT Region Aeronautical Radio Stations 2016 Data Consolidation Report Page 10
Figure 2 – Aeronautical stations traffic comparison
In 2016, from NAT voice messages total:
Shanwick/Iceland processed 45%;
Gander processed 28%;
New York processed 13%;
Santa Maria processed 12%; and
Bodo processed 2%.
NAT Region Aeronautical Radio Stations 2016 Data Consolidation Report Page 11
2.2 Five year period traffic variation
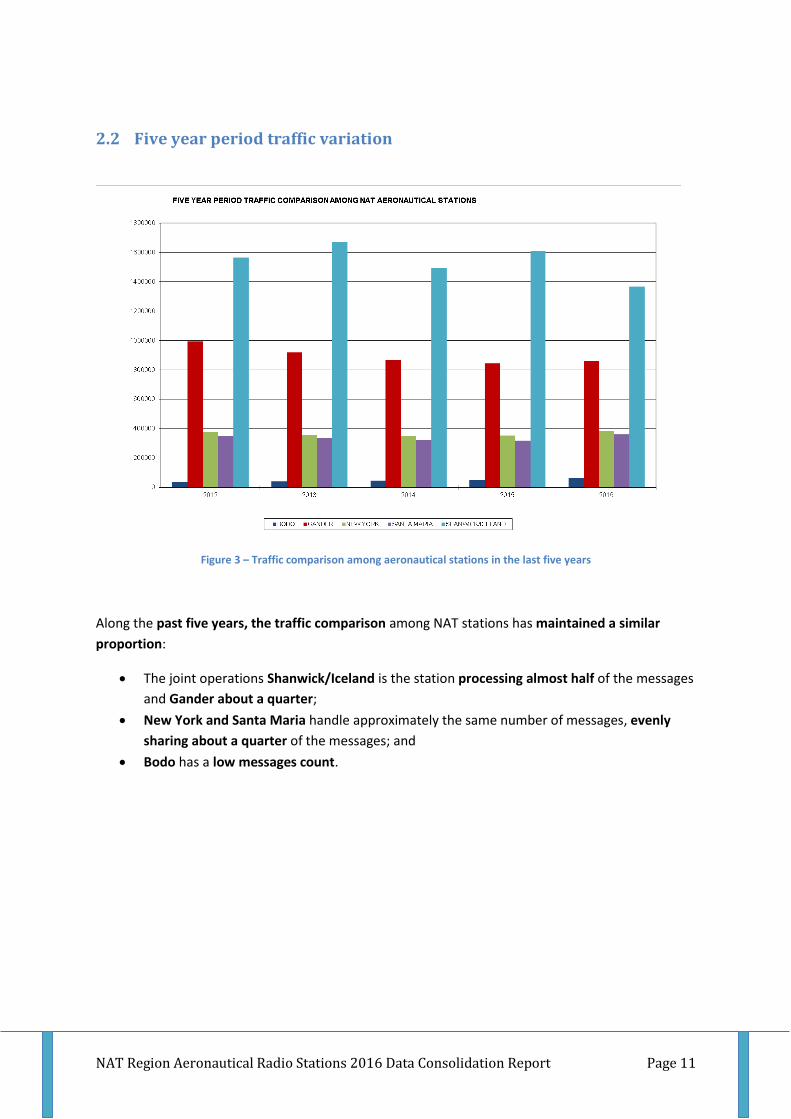
Figure 3 – Traffic comparison among aeronautical stations in the last five years
Along the past five years, the traffic comparison among NAT stations has maintained a similar
proportion:
The joint operations Shanwick/Iceland is the station processing almost half of the messages
and Gander about a quarter;
New York and Santa Maria handle approximately the same number of messages, evenly
sharing about a quarter of the messages; and
Bodo has a low messages count.

NAT Region Aeronautical Radio Stations 2016 Data Consolidation Report Page 12
5 YEAR VARIATION
2012-2013 2013-2014 2014-2015 2015-2016 2012-2016 BODO +18% +15% +13% +24,3% +89,7% GANDER -7% -5% -2,9% +1,8% -13,4% NEW YORK -6% -2% +1,3% +8,1% +1,0% SANTA MARIA -3% -4% -0,6% +13,3% +4,0% SHANWICK/ICELAND +7% -10% +7,6% -14,8% -12,6% NAT REGION +0,03% -7% +2,9% -4,4% -8,5%
Table 2 – Relative variation of voice messages between 2011 and 2015
Figure 4 - 5 year relative variation of voice messages (NAT Region and by radio station)
Figure 5 – 2011-2015 voice messages variation (absolute and relative)
NAT Region Aeronautical Radio Stations 2016 Data Consolidation Report Page 13
Along the five years analyzed:
Bodo has increased each year the number of messages, with a 90% increase in 2016 in
comparison with 2012.
Gander has decreased the number of messages from 2012 till 2015 and increased slightly in
2016. In 2016 the number of handled messages was 13% less than in 2012.
New York has decreased the number of messages from 2012 till 2014 and increased slightly
in 2015 and 2016. In 2016 the number of handled messages was 1% more than in 2012.
Santa Maria also has decreased the number of messages from 2012 till 2015 and increased
slightly in 2016. In 2016 the number of handled messages was 4% more than in 2012.
The joint operations of Shanwick and Iceland had an increase in 2013 and 2015 while
decreasing in 2014 and 2016. In 2016 the number of handled messages was 13% less than in
2012
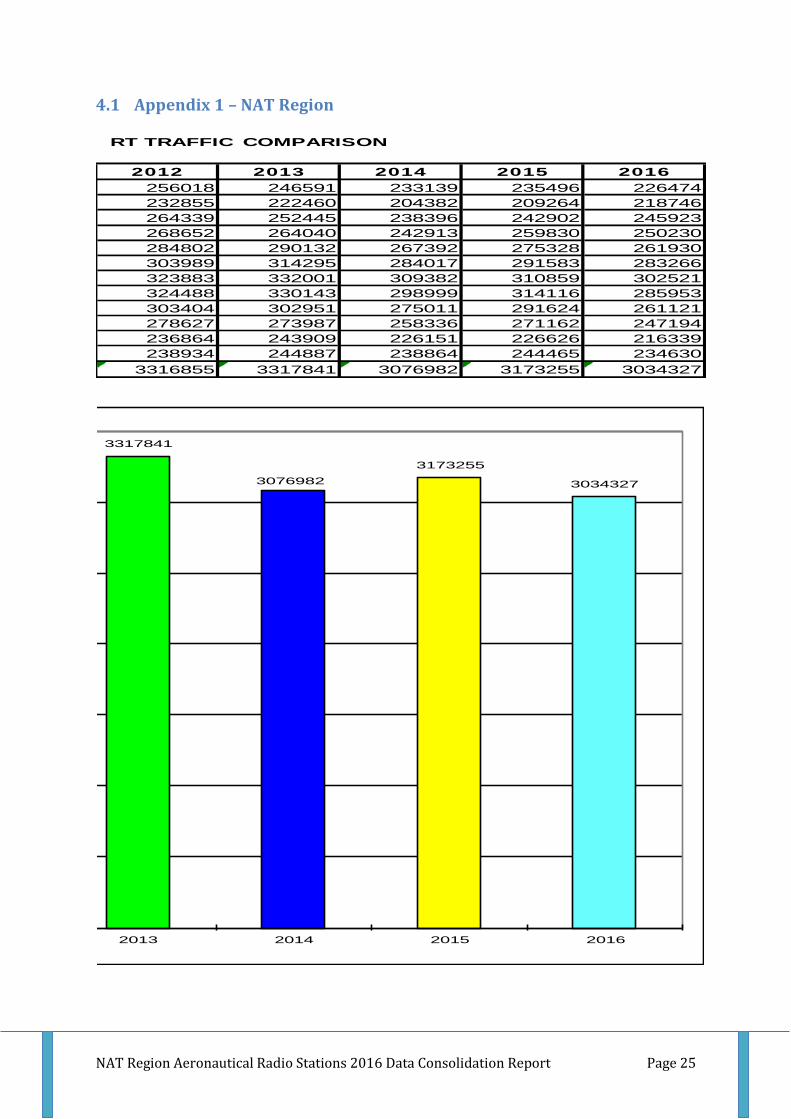
Overall in the NAT Region, voice messages have increased in 2013 (very slightly) and 2015
and decreased in 2014 and 2016. There were about 9% less of voice messages handled in
the NAT Region in 2016 when comparing to 2012.
NAT Region Aeronautical Radio Stations 2016 Data Consolidation Report Page 14
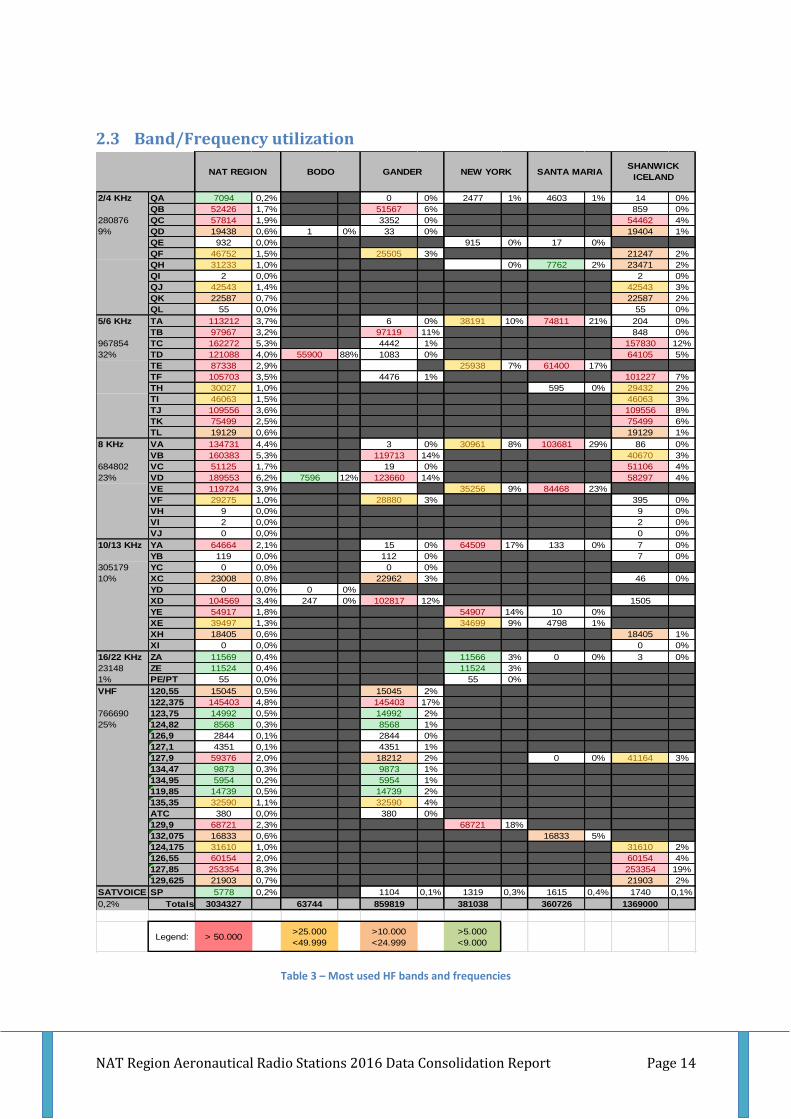
2.3 Band/Frequency utilization
Table 3 – Most used HF bands and frequencies
2/4 KHz QA 7094 0,2% 0 0% 2477 1% 4603 1% 14 0%
QB 52426 1,7% 51567 6% 859 0%
280876 QC 57814 1,9% 3352 0% 54462 4%
9% QD 19438 0,6% 1 0% 33 0% 19404 1%
QE 932 0,0% 915 0% 17 0%
QF 46752 1,5% 25505 3% 21247 2%
QH 31233 1,0% 0% 7762 2% 23471 2%
QI 2 0,0% 2 0%
QJ 42543 1,4% 42543 3%
QK 22587 0,7% 22587 2%
QL 55 0,0% 55 0%
5/6 KHz TA 113212 3,7% 6 0% 38191 10% 74811 21% 204 0%
TB 97967 3,2% 97119 11% 848 0%
967854 TC 162272 5,3% 4442 1% 157830 12%
32% TD 121088 4,0% 55900 88% 1083 0% 64105 5%
TE 87338 2,9% 25938 7% 61400 17%
TF 105703 3,5% 4476 1% 101227 7%
TH 30027 1,0% 595 0% 29432 2%
TI 46063 1,5% 46063 3%
TJ 109556 3,6% 109556 8%
TK 75499 2,5% 75499 6%
TL 19129 0,6% 19129 1%
8 KHz VA 134731 4,4% 3 0% 30961 8% 103681 29% 86 0%
VB 160383 5,3% 119713 14% 40670 3%
684802 VC 51125 1,7% 19 0% 51106 4%
23% VD 189553 6,2% 7596 12% 123660 14% 58297 4%
VE 119724 3,9% 35256 9% 84468 23%
VF 29275 1,0% 28880 3% 395 0%
VH 9 0,0% 9 0%
VI 2 0,0% 2 0%
VJ 0 0,0% 0 0%
10/13 KHz YA 64664 2,1% 15 0% 64509 17% 133 0% 7 0%
YB 119 0,0% 112 0% 7 0%
305179 YC 0 0,0% 0 0%
10% XC 23008 0,8% 22962 3% 46 0%
YD 0 0,0% 0 0%
XD 104569 3,4% 247 0% 102817 12% 1505
YE 54917 1,8% 54907 14% 10 0%
XE 39497 1,3% 34699 9% 4798 1%
XH 18405 0,6% 18405 1%
XI 0 0,0% 0 0%
16/22 KHz ZA 11569 0,4% 11566 3% 0 0% 3 0%
23148 ZE 11524 0,4% 11524 3%
1% PE/PT 55 0,0% 55 0%
VHF 120,55 15045 0,5% 15045 2%
122,375 145403 4,8% 145403 17%
766690 123,75 14992 0,5% 14992 2%
25% 124,82 8568 0,3% 8568 1%
126,9 2844 0,1% 2844 0%
127,1 4351 0,1% 4351 1%
127,9 59376 2,0% 18212 2% 0 0% 41164 3%
134,47 9873 0,3% 9873 1%
134,95 5954 0,2% 5954 1%
119,85 14739 0,5% 14739 2%
135,35 32590 1,1% 32590 4%
ATC 380 0,0% 380 0%
129,9 68721 2,3% 68721 18%
132,075 16833 0,6% 16833 5%
124,175 31610 1,0% 31610 2%
126,55 60154 2,0% 60154 4%
127,85 253354 8,3% 253354 19%
129,625 21903 0,7% 21903 2%
SATVOICE SP 5778 0,2% 1104 0,1% 1319 0,3% 1615 0,4% 1740 0,1%
0,2% Totals 3034327 63744 859819 381038 360726 1369000
Legend: > 50.000>25.000
<49.999
>10.000
<24.999
>5.000
<9.000
SHANWICK
ICELANDSANTA MARIANEW YORKGANDERBODONAT REGION

NAT Region Aeronautical Radio Stations 2016 Data Consolidation Report Page 15
2.3.1 Aeronautical stations individual analysis
2.3.1.1 Bodo
88% of messages on the 5-6 KHz band, on frequency TD.
12% of messages on the 8 KHz band, on frequency VD.
2.3.1.2 Gander
68% on HF
o About 31% on the 8 KHz band, mostly on frequencies VB, VD and VF.
o About 15% on the 11/13 KHz band, mostly on frequencies XD and XC.
o About 11% the 5/6 KHz band, mostly on frequency TB.
o About 9% on the 2/4 KHz band, mostly on frequency QB and QF.
32% on VHF
o The most used VHF frequency was 122,375 MHz
SATVOICE residual
2.3.1.3 New York
82% on HF
o About 42% on the 11/13 KHz band, mostly on frequencies YA, YE and XE.
o About 17% on the 8 KHz band, mostly on frequencies VE and VA.
o About 17% the 5-6 KHz band, mostly on frequencies TA and TE.
o About 6% on the 16/22 KHz band, mostly on frequencies ZA and ZE.
18% on VHF
SATVOICE residual
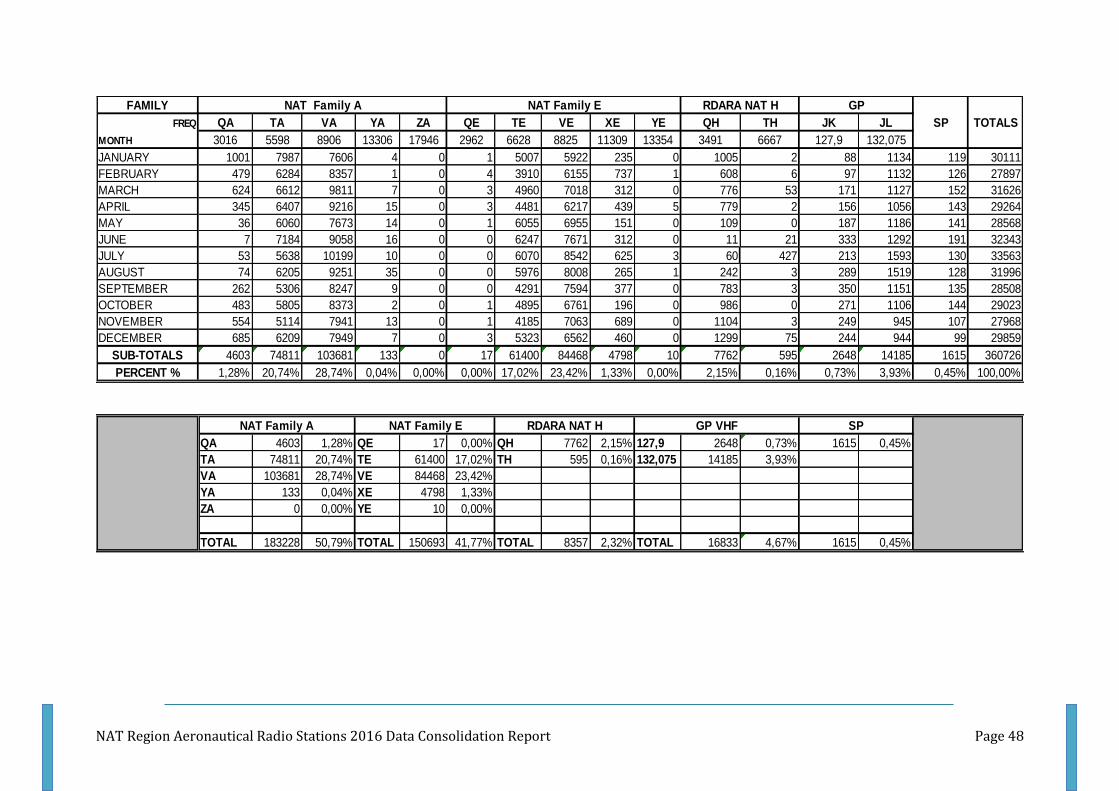
2.3.1.4 Santa Maria
95% on HF
o About 52% on the 8 KHz band, mostly on frequencies VA and VE.
o About 38% the 5-6 KHz band, mostly on frequencies TA and TE.
o About 3% on the 2/4 KHz band, mostly on frequencies QH and QA.
o About 1% on the 11/13 KHz band, mostly on frequency XE.
5% on VHF
SATVOICE residual
2.3.1.5 Shanwick/Iceland
70% on HF
o About 44% the 5-6 KHz band, mostly on frequencies TC, TJ, TF, TK, TD, TI, TH and TL.
o About 14% on the 2/4 KHz band, mostly on frequencies QC, QJ, QH, QK, QF and QD.
o About 11% on the 8 KHz band, mostly on frequencies VC, VD and VB.
o About 1% on the 11/13 KHz band, mostly on frequency XH.
30% on VHF
o The most used VHF frequency was 127,850 MHz
SATVOICE residual

NAT Region Aeronautical Radio Stations 2016 Data Consolidation Report Page 16
Figure 6 – Monthly variation of RT contacts
Figure 7 – Frequency usage

NAT Region Aeronautical Radio Stations 2016 Data Consolidation Report Page 17
Figure 8 – Aggregate RT contacts by NAT/RDARA family and on VHF/SATVOICE
2.3.2 NAT overall analysis
Overall, in the NAT Region, the most used HF frequencies are of the 5-6 KHz band (32%) and the 8
KHz band (23%).
VHF frequencies are used in about 25% of contacts, alleviating HF congestion, particularly in Gander
and Shanwick/Iceland.
SATVOICE still has a residual use, representing only 0,2% of total voice messages in the NAT Region.
Santa Maria and New York were the stations with the higher relative usage of SATVOICE
(respectively 0,4% and 0,3%).
The most used HF frequencies in the NAT Region were VD (189.553; 6,2%), VB (160.383; 5,3%) and
TC (162.272; 5,3%) while on VHF it was 127.850 MHz (253.354; 8,3%) and 122,375 (145.403; 4,8%).
The most used NAT Family was “D” (14,3%) and the most used RDARA was “J” (8,2%). VHF has
assured about a quarter of NAT voice communications (25%).

NAT Region Aeronautical Radio Stations 2016 Data Consolidation Report Page 18
3 VOICE COMMUNICATION SYSTEM PERFORMANCE ASSESSMENT Only Santa Maria Radio Station has provided the data to assess the voice communications system
performance according the common agreed template.
The analysis was made between January 1, 2016 to December 31, 2016 (12 months).
The FAA has made an assessment within the PARC CWG, comparing the SATVOICE and HF voice
performance, both against RCP/RSP 400, between January 1, 2015 to December 31, 2016 (24
months).. Although these statists have been produced within a different context, because they are
valuable, a summary is presented also in this report.
3.1 ATC intervention messages (Clearances, Requests and Advisories) The voice ATC intervention performance analysis focused on Clearances (excluding OCL), Requests
and Advisories (excluding SQK) and measures the time interval between the time the message is
received at the station and the time the readback message is sent to ATC. The time unit used is
minutes.
Table 4 – Santa Maria voice ATC intervention messages summary
Santa Maria Radio processed 23.520 messages and delivered 95% of them within 5 minutes and 98%
within 10 minutes. The aggregate average message delay was 2,4 minutes.
About 70% of the messages are clearances. The message performance and average message delay is
slightly better than the aggregate values.
Figure 9 – Santa Maria voice ATC intervention messages performance
Msg Total Msg Daily Average Count Msg Average Delay (minutes)
CLE 16165 44 2,1
ADZ 2961 8 2,1
RQU 4394 12 3,1
Aggregate 23520 130 2,4

NAT Region Aeronautical Radio Stations 2016 Data Consolidation Report Page 19
3.2 Surveillance messages (Position reports) The Voice surveillance performance analysis focused on POS messages (excluding data link equipped
aircraft) and measures the time interval between the time over position and time message is sent
from the radio station to the ATC unit. The time unit used is minutes.
Table 5 – Santa Maria voice surveillance messages summary
Santa Maria Radio processed 48.979 messages and delivered 89% of them within 5 minutes and 95%
within 10 minutes. The average message delay was 3,6 minutes
Figure 10 – Santa Maria voice surveillance messages performance
Msg Total Msg Daily Average Count Msg Average Delay (minutes)
POS 48979 134 3,6

NAT Region Aeronautical Radio Stations 2016 Data Consolidation Report Page 20
3.3 FAA voice communications performance assessment About 99% of intervention messages were delivered and confirmation sent to the controller within 5
minutes.
Figure 11 – FAA voice communication performance assessment criteria
Figure 12 – FAA voice communication performance
NAT Region Aeronautical Radio Stations 2016 Data Consolidation Report Page 21
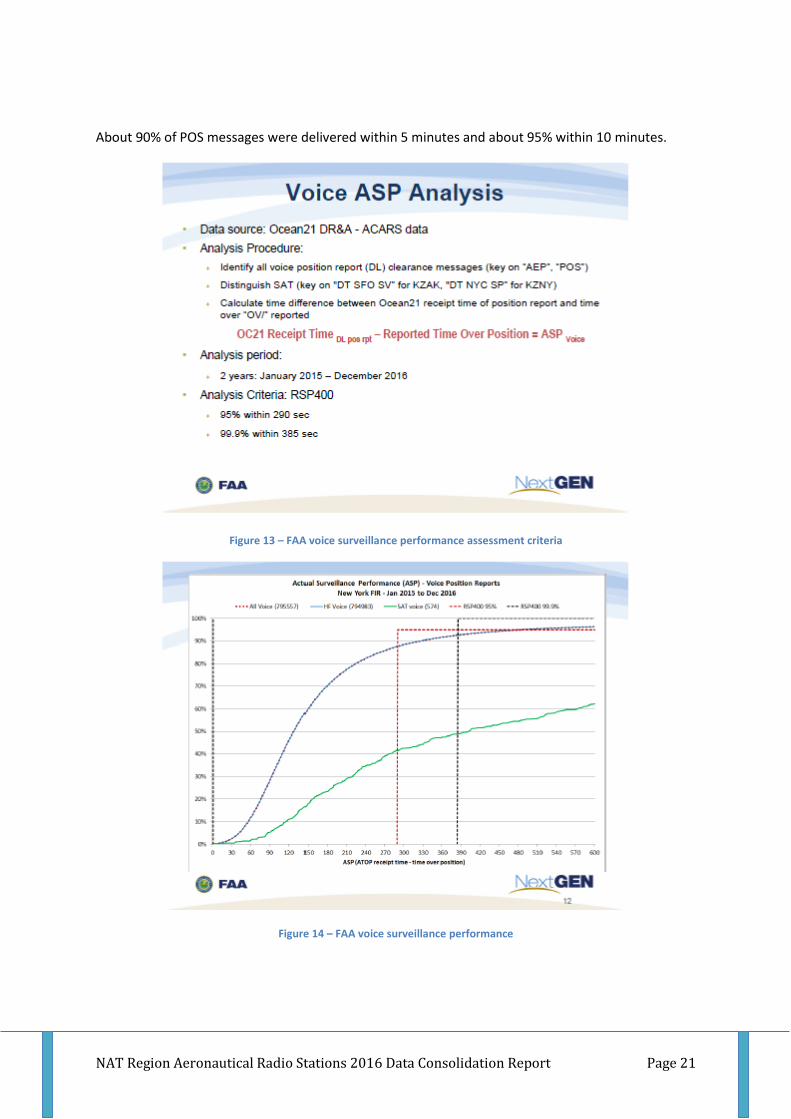
About 90% of POS messages were delivered within 5 minutes and about 95% within 10 minutes.
Figure 13 – FAA voice surveillance performance assessment criteria
Figure 14 – FAA voice surveillance performance

NAT Region Aeronautical Radio Stations 2016 Data Consolidation Report Page 22

NAT Region Aeronautical Radio Stations 2016 Data Consolidation Report Page 23
4 APPENDIXES In the appendixes, a detailed analysis of traffic is provided for each station.

NAT Region Aeronautical Radio Stations 2016 Data Consolidation Report Page 24
NAT Region Aeronautical Radio Stations 2016 Data Consolidation Report Page 25
4.1 Appendix 1 – NAT Region
2012 2013 2014 2015 2016
256018 246591 233139 235496 226474
232855 222460 204382 209264 218746
264339 252445 238396 242902 245923
268652 264040 242913 259830 250230
284802 290132 267392 275328 261930
303989 314295 284017 291583 283266
323883 332001 309382 310859 302521
324488 330143 298999 314116 285953
303404 302951 275011 291624 261121
278627 273987 258336 271162 247194
236864 243909 226151 226626 216339
238934 244887 238864 244465 234630
3316855 3317841 3076982 3173255 3034327
RT TRAFFIC COMPARISON
3317841
3076982
3173255
3034327
2013 2014 2015 2016

NAT Region Aeronautical Radio Stations 2016 Data Consolidation Report Page 26

NAT Region Aeronautical Radio Stations 2016 Data Consolidation Report Page 27

NAT Region Aeronautical Radio Stations 2016 Data Consolidation Report Page 28

NAT Region Aeronautical Radio Stations 2016 Data Consolidation Report Page 29

NAT Region Aeronautical Radio Stations 2016 Data Consolidation Report Page 30

NAT Region Aeronautical Radio Stations 2016 Data Consolidation Report Page 31
0
1000
2000
3000
4000
5000
6000
7000
JAN
FE
B
MA
R
AP
R
MA
Y
JUN
JUL
AU
G
SE
P
OC
T
NO
V
DE
C
BODO AERONAUTICAL STATION HF FAMILIES AND VHF/SATCOM UTILIZATION
NAT "A"
NAT "B"
NAT "C"
NAT "D"
NAT "E"
NAT "F"
NAT "H"
NAT "I"
NAT "J"
VHF
SP
0
5000
10000
15000
20000
25000
30000
35000
JAN
FE
B
MA
R
AP
R
MA
Y
JUN
JUL
AU
G
SE
P
OC
T
NO
V
DE
C
GANDER AERONAUTICAL STATION HF FAMILIES AND VHF/SATCOM UTILIZATION
NAT "A"
NAT "B"
NAT "C"
NAT "D"
NAT "E"
NAT "F"
NAT "H"
NAT "I"
NAT "J"
VHF
SP
0
2000
4000
6000
8000
10000
12000
14000
16000
18000
20000
JAN
FE
B
MA
R
AP
R
MA
Y
JUN
JUL
AU
G
SE
P
OC
T
NO
V
DE
C
NEW YORK AERONAUTICAL STATION HF FAMILIES AND VHF/SATCOM UTILIZATION
NAT "A"
NAT "B"
NAT "C"
NAT "D"
NAT "E"
NAT "F"
NAT "H"
NAT "I"
NAT "J"
VHF
SP0
2000
4000
6000
8000
10000
12000
14000
16000
18000
JAN
FE
B
MA
R
AP
R
MA
Y
JUN
JUL
AU
G
SE
P
OC
T
NO
V
DE
C
SANTA MARIA AERONAUTICAL STATION HF FAMILIES AND VHF/SATCOM UTILIZATION
NAT "A"
NAT "B"
NAT "C"
NAT "D"
NAT "E"
NAT "F"
NAT "H"
NAT "I"
NAT "J"
VHF
SP
0
5000
10000
15000
20000
25000
30000
35000
40000
45000
JAN
FE
B
MA
R
AP
R
MA
Y
JUN
JUL
AU
G
SE
P
OC
T
NO
V
DE
C
SHANWICK/ICELAND AERONAUTICAL STATIONS HF FAMILIES AND VHF/SATCOM UTILIZATION
NAT "A"
NAT "B"
NAT "C"
NAT "D"
NAT "E"
NAT "F"
NAT "H"
NAT "I"
NAT "J"
VHF
SP

NAT Region Aeronautical Radio Stations 2016 Data Consolidation Report Page 32
NAT Family "A" NAT Family "B" NAT Family "C" NAT Family "D" NAT Family "E" NAT Family "F"
QA 7094 0,23% QB 52426 1,73% QC 57814 1,91% QD 19438 0,64% QE 932 0,03% QF 46752 1,54% QH 31233 1,03% QI 2 0,00% QJ 42543 1,40% 119,850 14739 0,49% 5778 0,19%
TA 113212 3,73% TB 97967 3,23% TC 162272 5,35% TD 121088 3,99% TE 87338 2,88% TF 105703 3,48% TH 30027 0,99% TI 46063 1,52% TJ 109556 3,61% 120,550 15045 0,50%
VA 134731 4,44% VB 160383 5,29% VC 51125 1,68% VD 189553 6,25% VE 119724 3,95% VF 29275 0,96% VH 9 0,00% VI 2 0,00% VJ 0 0,00% 122,375 145403 4,79%
YA 64664 2,13% YB 119 0,00% XC 23008 0,76% XD 104569 3,45% XE 39497 1,30% YF 0 0,00% XH 18405 0,61% XI 0 0,00% QK 22587 0,74% 123,750 14992 0,49%
ZA 11569 0,38% YC 0 0,00% YD 0 0,00% YE 54917 1,81% TL 19129 0,63% QL 55 0,00% TK 75499 2,49% 124,175 31610 1,04%
PE/PT 55 0,00% ZE * 11524 0,38% 124,820 8568 0,28%
126,550 60154 1,98%
126,900 2844 0,09%
127,100 4351 0,14%
127,850 253354 8,35%
127,900 59376 1,96%
129,625 21903 0,72%
129,900 68721 2,26%
132,075 16833 0,55%
134,470 9873 0,33%
134,950 5954 0,20%
135,350 32590 1,07%
ATC 380 0,01% TOTAL
TOTAL 331325 10,9% TOTAL 310895 10,2% TOTAL 294219 9,7% TOTAL 434648 14,3% TOTAL 313932 10,3% TOTAL 181730 6,0% TOTAL 98803 3,3% TOTAL 46122 1,5% TOTAL 250185 8,2% TOTAL 766690 25,3% 5778 0,2% 3034327
RDARA "H" * RDARA "I" * RDARA "J" * GP VHF SP

NAT Region Aeronautical Radio Stations 2016 Data Consolidation Report Page 33
4.2 Appendix 2 – Bodo
2012 2013 2014 2015 2016
JANUARY 3168 2902 3550 5134 4833
FEBRUARY 2501 2860 2863 3843 4875
MARCH 2550 2131 3658 4515 4565
APRIL 2920 3259 3039 3393 5081
MAY 2444 3013 3011 4738 5068
JUNE 2500 3607 3516 3884 4923
JULY 2524 3253 4250 4418 6547
AUGUST 2827 4218 4412 4667 6461
SEPTEMBER 3356 4187 3836 4127 5374
OCTOBER 3075 3144 4574 3828 5475
NOVEMBER 2566 3460 4037 4184 5375
DECEMBER 3174 3497 4658 4547 5167
TOTAL 33605 39531 45404 51278 63744
RT TRAFFIC COMPARISON
MONTH YEAR
33605
39531
45404
51278
63744
0
10000
20000
30000
40000
50000
60000
70000
2012 2013 2014 2015 2016

NAT Region Aeronautical Radio Stations 2016 Data Consolidation Report Page 34

NAT Region Aeronautical Radio Stations 2016 Data Consolidation Report Page 35
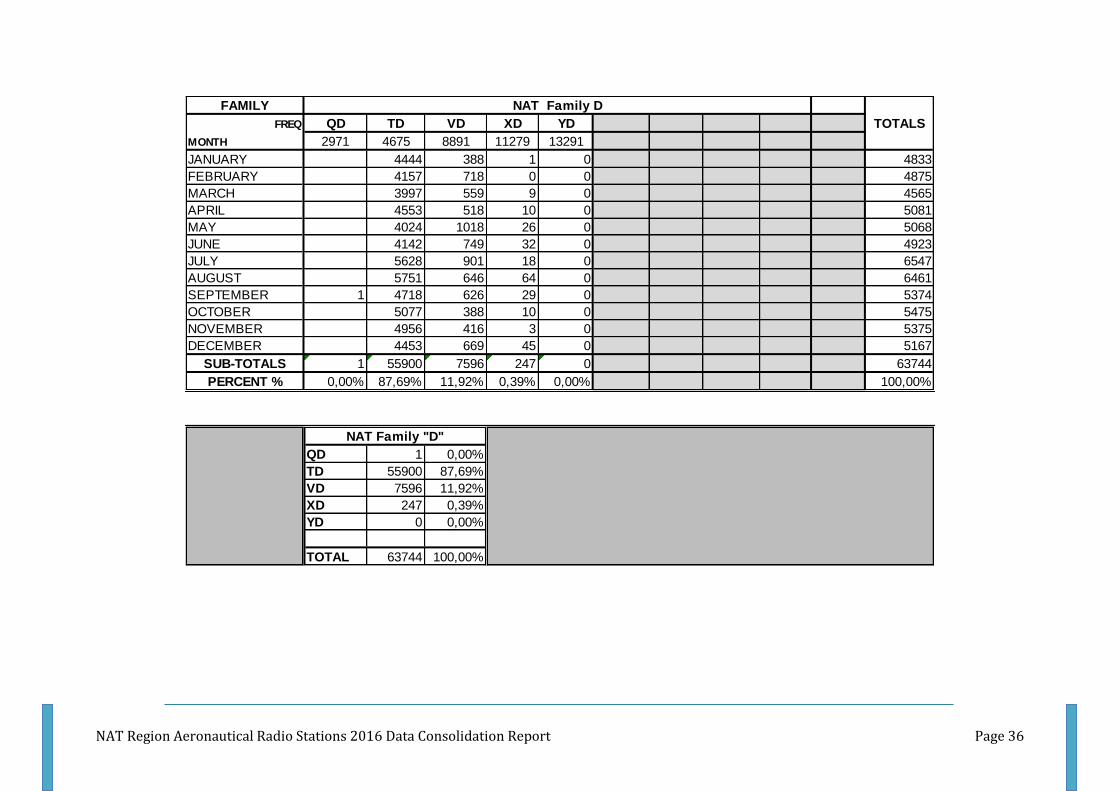
NAT Region Aeronautical Radio Stations 2016 Data Consolidation Report Page 36
FAMILY NAT Family D
FREQ QD TD VD XD YD TOTALS
MONTH 2971 4675 8891 11279 13291
JANUARY 4444 388 1 0 4833
FEBRUARY 4157 718 0 0 4875
MARCH 3997 559 9 0 4565
APRIL 4553 518 10 0 5081
MAY 4024 1018 26 0 5068
JUNE 4142 749 32 0 4923
JULY 5628 901 18 0 6547
AUGUST 5751 646 64 0 6461
SEPTEMBER 1 4718 626 29 0 5374
OCTOBER 5077 388 10 0 5475
NOVEMBER 4956 416 3 0 5375
DECEMBER 4453 669 45 0 5167
SUB-TOTALS 1 55900 7596 247 0 63744
PERCENT % 0,00% 87,69% 11,92% 0,39% 0,00% 100,00%
NAT Family "D"
QD 1 0,00%
TD 55900 87,69%
VD 7596 11,92%
XD 247 0,39%
YD 0 0,00%
TOTAL 63744 100,00%

NAT Region Aeronautical Radio Stations 2016 Data Consolidation Report Page 37
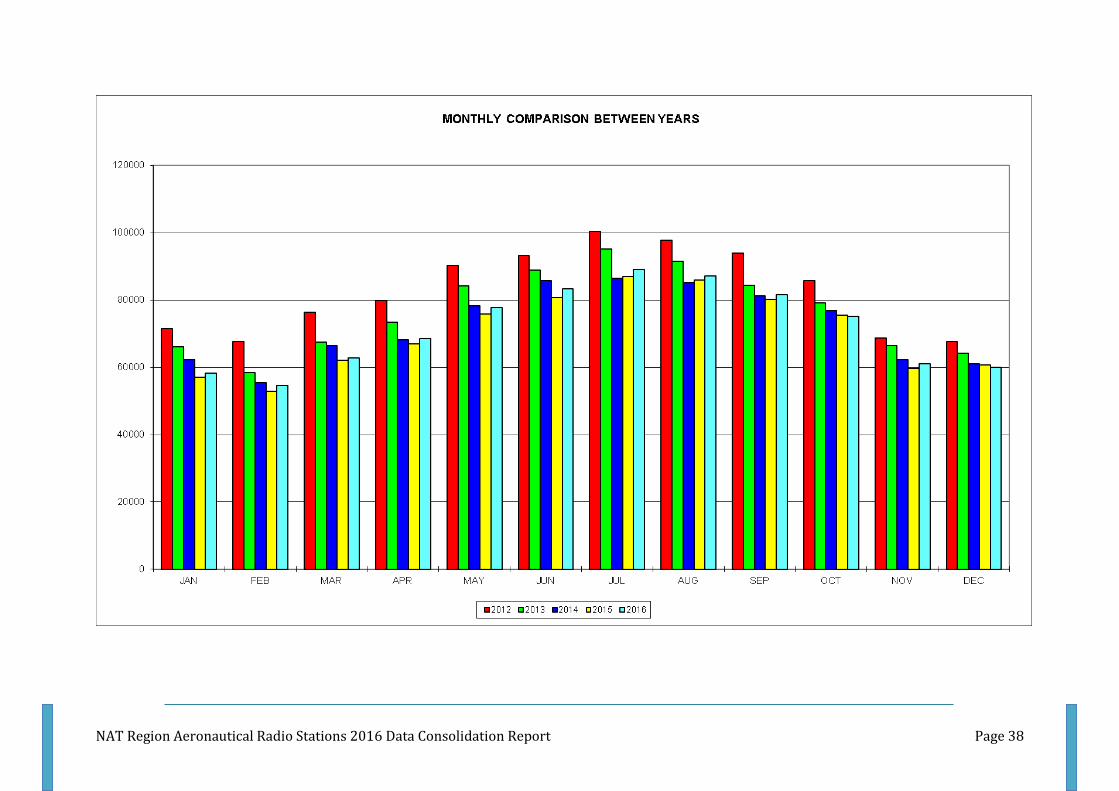
4.3 Appendix 3 - Gander
2012 2013 2014 2015 2016
JANUARY 71467 66153 62217 56984 58221
FEBRUARY 67738 58515 55551 52935 54668
MARCH 76385 67508 66394 62040 62856
APRIL 79855 73387 68167 66942 68583
MAY 90220 84240 78303 75799 77781
JUNE 93317 88971 85728 80711 83342
JULY 100321 95184 86497 86952 89141
AUGUST 97752 91444 85186 85936 87212
SEPTEMBER 93916 84328 81313 80133 81657
OCTOBER 85745 79101 76812 75587 75180
NOVEMBER 68660 66509 62232 59607 61122
DECEMBER 67625 64276 61042 60722 60056
TOTAL 993001 919616 869442 844348 859819
RT TRAFFIC COMPARISON
MONTH YEAR
993001
919616
869442844348
859819
0
200000
400000
600000
800000
1000000
1200000
2012 2013 2014 2015 2016
NAT Region Aeronautical Radio Stations 2016 Data Consolidation Report Page 38

NAT Region Aeronautical Radio Stations 2016 Data Consolidation Report Page 39

NAT Region Aeronautical Radio Stations 2016 Data Consolidation Report Page 40
FAMILY NAT Family A NAT Family B NAT Family C NAT Family F
FREQ QA TA VA YA QB TB VB YB QC TC VC XC YC QD TD VD XD QF TF VF YF 120,55MHz122,375MHz123,75MHz124,82MHz126,9MHz127,1MHz127,9MHz134,47MHz134,95MHz119,85MHz135,35MHz ATC SP TOTALS
MONTH 3016 5598 8906 13306 2899 5616 8864 13291 2872 5649 8879 11336 13306 2971 4675 8891 11279 3476 6622 8831 13291 120,55 122,375 123,75 124,82 126,9 127,1 127,9 134,47 134,95 119,85 135,35 ATC
JANUARY 0 1 3 3 5426 6053 7949 0 40 6 2 2 0 3 89 9022 6309 1575 3 4915 0 732 9690 602 422 313 0 971 494 309 252 2883 8 144 58221
FEBRUARY 0 2 0 2 5226 4629 6727 2 2366 744 2 122 0 1 120 8425 5588 3 4 3745 0 1026 9458 721 453 334 2 933 467 344 1538 1592 6 86 54668
MARCH 0 0 0 0 4624 3832 9203 79 889 3669 2 3 0 3 62 9174 7931 523 164 3675 0 1078 10559 913 592 542 411 1143 496 320 443 2301 104 121 62856
APRIL 0 0 0 3 5888 8012 10306 1 15 1 0 2 0 1 5 9576 9105 298 38 4075 0 1709 11433 1346 707 177 324 1301 538 388 974 2274 19 67 68583
MAY 0 0 0 2 5908 10318 12176 14 7 3 2 2780 0 0 6 10259 10487 1 8 1858 0 1285 12241 1531 825 195 221 1576 810 543 1470 3176 11 68 77781
JUNE 0 0 0 2 5287 11907 12839 0 11 3 1 4851 0 2 2 10774 10606 599 4 11 0 1447 13394 1486 1026 676 154 1875 1017 632 1287 3375 16 58 83342
JULY 0 0 0 0 4322 12657 12786 1 6 3 1 4864 0 0 197 12450 10314 802 1295 7 0 1040 15783 1452 964 2 1 2199 1043 670 2341 3829 21 91 89141
AUGUST 0 2 0 1 1305 12395 12375 0 1 4 2 2714 0 0 1 11943 11397 4134 330 2057 0 1086 15439 1519 610 2 1385 2095 1053 539 1125 3618 14 66 87212
SEPTEMBER 0 0 0 1 1738 9478 10864 14 5 2 3 4040 0 0 7 11534 9867 5638 181 383 0 1208 14346 1441 749 413 413 2284 1306 668 1251 3712 16 95 81657
OCTOBER 0 1 0 0 3887 6070 9233 0 11 1 0 3569 0 1 266 10685 8626 3951 2170 1683 0 1424 12619 1841 968 1 626 1303 1053 701 1721 2671 4 94 75180
NOVEMBER 0 0 0 1 2979 6263 7732 0 1 3 1 11 0 11 120 9288 6629 4705 122 3244 0 2065 10018 1276 807 188 264 1150 762 449 2085 840 10 98 61122
DECEMBER 0 0 0 0 4977 5505 7523 1 0 3 3 4 0 11 208 10530 5958 3276 157 3227 0 945 10423 864 445 1 550 1382 834 391 252 2319 151 116 60056
SUB-TOTALS 0 6 3 15 51567 97119 119713 112 3352 4442 19 22962 0 33 1083 123660 102817 25505 4476 28880 0 15045 145403 14992 8568 2844 4351 18212 9873 5954 14739 32590 380 1104 859819
PERCENT % 0,00% 0,00% 0,00% 0,00% 6,00% 11,30% 13,92% 0,01% 0,39% 0,52% 0,00% 2,67% 0,00% 0,00% 0,13% 14,38% 11,96% 2,97% 0,52% 3,36% 0,00% 1,75% 16,91% 1,74% 1,00% 0,33% 0,51% 2,12% 1,15% 0,69% 1,71% 3,79% 0,04% 0,13% 100,00%
NAT Family "A" NAT Family "B" NAT Family "C" NAT Family "D" NAT Family "F" GP VHF SP
QA 0 0,00% QB 51567 6,00% QC 3352 0,39% QD 33 0,00% QF 25505 2,97% 120,55 15045 1,75% 1104 0,13%
TA 6 0,00% TB 97119 11,30% TC 4442 0,52% TD 1083 0,13% TF 4476 0,52% 122,375 145403 16,91%
VA 3 0,00% VB 119713 13,92% VC 19 0,00% VD 123660 14,38% VF 28880 3,36% 123,75 14992 1,74%
YA 15 0,00% YB 112 0,01% XC 22962 2,67% XD 102817 11,96% YF 0 0,00% 124,82 8568 1,00%
YC 0 0,00% 126,9 2844 0,33%
127,1 4351 0,51%
127,9 18212 2,12%
134,47 9873 1,15%
134,95 5954 0,69%
ATC 14739 1,71%
ATC 32590 3,79%
ATC 380 0,04%
TOTAL 24 0,00% TOTAL 268511 31,23% TOTAL 30775 3,58% TOTAL 227593 26,47% TOTAL 58861 6,85% TOTAL 272951 31,75% 1104 0,13%
NAT FAMILY "D" GP VHF
NAT Region Aeronautical Radio Stations 2016 Data Consolidation Report Page 41
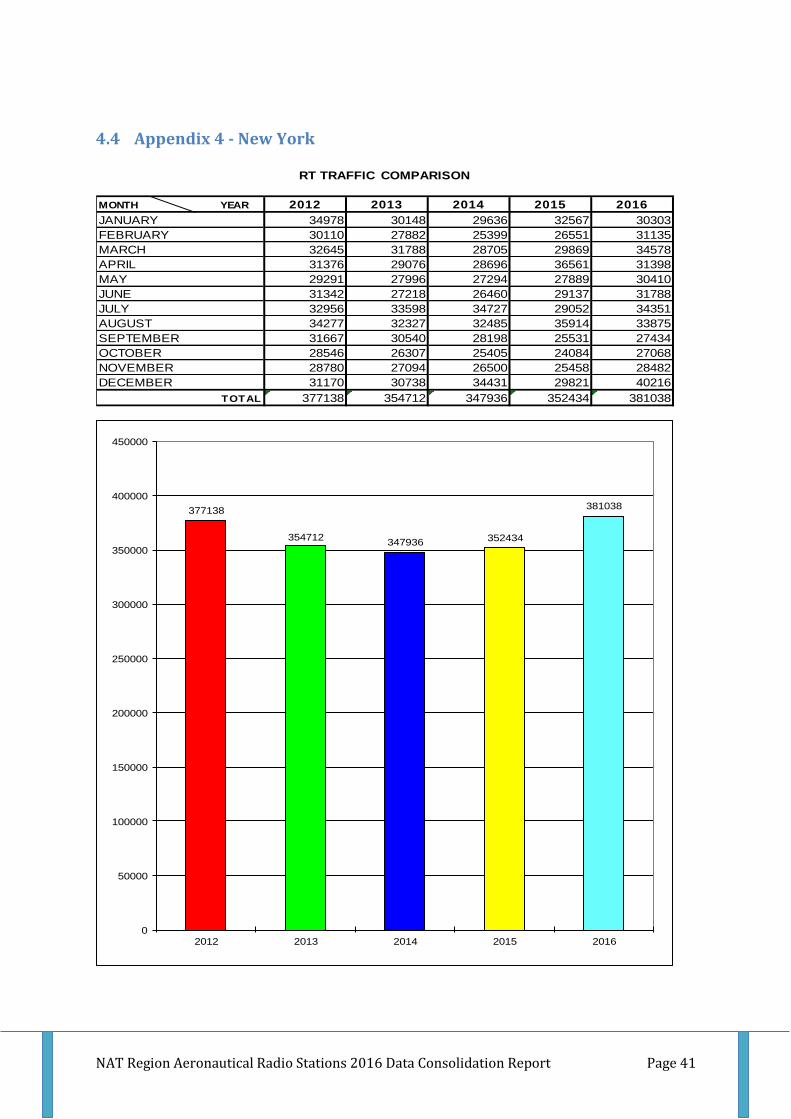
4.4 Appendix 4 - New York
2012 2013 2014 2015 2016
JANUARY 34978 30148 29636 32567 30303
FEBRUARY 30110 27882 25399 26551 31135
MARCH 32645 31788 28705 29869 34578
APRIL 31376 29076 28696 36561 31398
MAY 29291 27996 27294 27889 30410
JUNE 31342 27218 26460 29137 31788
JULY 32956 33598 34727 29052 34351
AUGUST 34277 32327 32485 35914 33875
SEPTEMBER 31667 30540 28198 25531 27434
OCTOBER 28546 26307 25405 24084 27068
NOVEMBER 28780 27094 26500 25458 28482
DECEMBER 31170 30738 34431 29821 40216
TOTAL 377138 354712 347936 352434 381038
RT TRAFFIC COMPARISON
MONTH YEAR
377138
354712347936 352434
381038
0
50000
100000
150000
200000
250000
300000
350000
400000
450000
2012 2013 2014 2015 2016

NAT Region Aeronautical Radio Stations 2016 Data Consolidation Report Page 42

NAT Region Aeronautical Radio Stations 2016 Data Consolidation Report Page 43

NAT Region Aeronautical Radio Stations 2016 Data Consolidation Report Page 44
FAMILY NAT Family A NAT Family E GP
FREQ QA TA VA YA ZA PE/PT QE TE VE XE YE ZE JW SP TOTALS
MONTH 3016 5598 8906 13306 17946 21964 2962 6628 8825 11309 13354 17952 129,9
JANUARY 419 4629 1570 4149 19 3 265 3921 2634 163 4253 1252 6901 125 30303
FEBRUARY 53 3137 2516 7474 33 3 87 2816 2646 401 2756 3373 5764 76 31135
MARCH 177 2702 3268 8363 51 3 116 2709 3200 486 5166 1571 6676 90 34578
APRIL 27 2358 2857 5796 89 2 76 2397 2460 1318 8032 333 5532 121 31398
MAY 33 2474 2737 4548 317 0 48 1213 3274 1949 6885 506 6293 133 30410
JUNE 4 923 4779 4155 1587 8 3 596 3662 2066 5643 1691 6576 95 31788
JULY 19 1604 3474 3813 4239 5 3 510 4323 1202 7460 1602 5969 128 34351
AUGUST 34 1834 3770 4474 3457 19 27 802 3498 3209 6420 800 5377 154 33875
SEPTEMBER 331 2715 2137 4879 1428 8 60 1620 2292 5027 2150 183 4486 118 27434
OCTOBER 269 2952 1231 5697 160 0 70 2163 2403 4946 2625 159 4295 98 27068
NOVEMBER 134 3679 1134 5589 132 3 52 3027 2191 6135 2166 42 4117 81 28482
DECEMBER 977 9184 1488 5572 54 1 108 4164 2673 7797 1351 12 6735 100 40216
SUB-TOTALS 2477 38191 30961 64509 11566 55 915 25938 35256 34699 54907 11524 68721 1319 381038
PERCENT % 0,65% 10,02% 8,13% 16,93% 3,04% 0,01% 0,24% 6,81% 9,25% 9,11% 14,41% 3,02% 18,04% 0,35% 100,00%
NAT Family "A" NAT Family "E" GP VHF/SP
QA 2477 0,65% QE 915 0,24% 129,9 68721 18,04% 1319 0,35%
TA 38191 10,02% TE 25938 6,81%
VA 30961 8,13% VE 35256 9,25%
YA 64509 16,93% XE 34699 9,11%
ZA 11566 3,04% YE 54907 14,41%
PE/PT 55 0,01% ZE 11524 3,02%
TOTAL 147759 38,78% TOTAL 163239 42,84% TOTAL 68721 18,04% 1319 0,35%
SP

NAT Region Aeronautical Radio Stations 2016 Data Consolidation Report Page 45
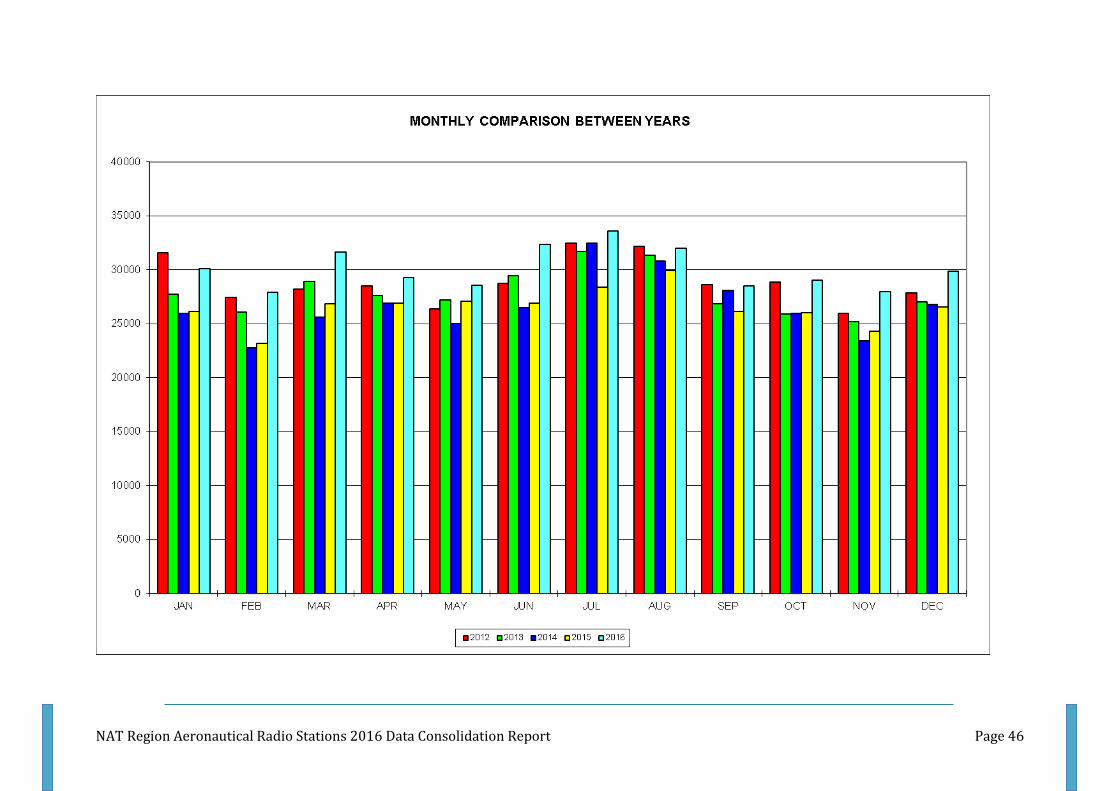
4.5 Appendix 5 - Santa Maria
2012 2013 2014 2015 2016
JANUARY 31553 27742 25988 26133 30111
FEBRUARY 27467 26099 22758 23164 27897
MARCH 28210 28936 25581 26865 31626
APRIL 28505 27601 26928 26904 29264
MAY 26401 27215 24996 27073 28568
JUNE 28715 29425 26515 26893 32343
JULY 32463 31700 32468 28386 33563
AUGUST 32180 31356 30806 29915 31996
SEPTEMBER 28631 26820 28089 26137 28508
OCTOBER 28842 25919 25945 26042 29023
NOVEMBER 25933 25213 23432 24295 27968
DECEMBER 27857 27043 26770 26549 29859
TOTAL 346757 335069 320276 318356 360726
RT TRAFFIC COMPARISON
MONTH YEAR
346757
335069
320276 318356
360726
0
50000
100000
150000
200000
250000
300000
350000
400000
2012 2013 2014 2015 2016
NAT Region Aeronautical Radio Stations 2016 Data Consolidation Report Page 46

NAT Region Aeronautical Radio Stations 2016 Data Consolidation Report Page 47
NAT Region Aeronautical Radio Stations 2016 Data Consolidation Report Page 48
FAMILY NAT Family A NAT Family E RDARA NAT H
FREQ QA TA VA YA ZA QE TE VE XE YE QH TH JK JL SP TOTALS
MONTH 3016 5598 8906 13306 17946 2962 6628 8825 11309 13354 3491 6667 127,9 132,075
JANUARY 1001 7987 7606 4 0 1 5007 5922 235 0 1005 2 88 1134 119 30111
FEBRUARY 479 6284 8357 1 0 4 3910 6155 737 1 608 6 97 1132 126 27897
MARCH 624 6612 9811 7 0 3 4960 7018 312 0 776 53 171 1127 152 31626
APRIL 345 6407 9216 15 0 3 4481 6217 439 5 779 2 156 1056 143 29264
MAY 36 6060 7673 14 0 1 6055 6955 151 0 109 0 187 1186 141 28568
JUNE 7 7184 9058 16 0 0 6247 7671 312 0 11 21 333 1292 191 32343
JULY 53 5638 10199 10 0 0 6070 8542 625 3 60 427 213 1593 130 33563
AUGUST 74 6205 9251 35 0 0 5976 8008 265 1 242 3 289 1519 128 31996
SEPTEMBER 262 5306 8247 9 0 0 4291 7594 377 0 783 3 350 1151 135 28508
OCTOBER 483 5805 8373 2 0 1 4895 6761 196 0 986 0 271 1106 144 29023
NOVEMBER 554 5114 7941 13 0 1 4185 7063 689 0 1104 3 249 945 107 27968
DECEMBER 685 6209 7949 7 0 3 5323 6562 460 0 1299 75 244 944 99 29859
SUB-TOTALS 4603 74811 103681 133 0 17 61400 84468 4798 10 7762 595 2648 14185 1615 360726
PERCENT % 1,28% 20,74% 28,74% 0,04% 0,00% 0,00% 17,02% 23,42% 1,33% 0,00% 2,15% 0,16% 0,73% 3,93% 0,45% 100,00%
NAT Family A NAT Family E RDARA NAT H GP VHF
QA 4603 1,28% QE 17 0,00% QH 7762 2,15% 127,9 2648 0,73% 1615 0,45%
TA 74811 20,74% TE 61400 17,02% TH 595 0,16% 132,075 14185 3,93%
VA 103681 28,74% VE 84468 23,42%
YA 133 0,04% XE 4798 1,33%
ZA 0 0,00% YE 10 0,00%
TOTAL 183228 50,79% TOTAL 150693 41,77% TOTAL 8357 2,32% TOTAL 16833 4,67% 1615 0,45%
GP
SP

NAT Region Aeronautical Radio Stations 2016 Data Consolidation Report Page 49
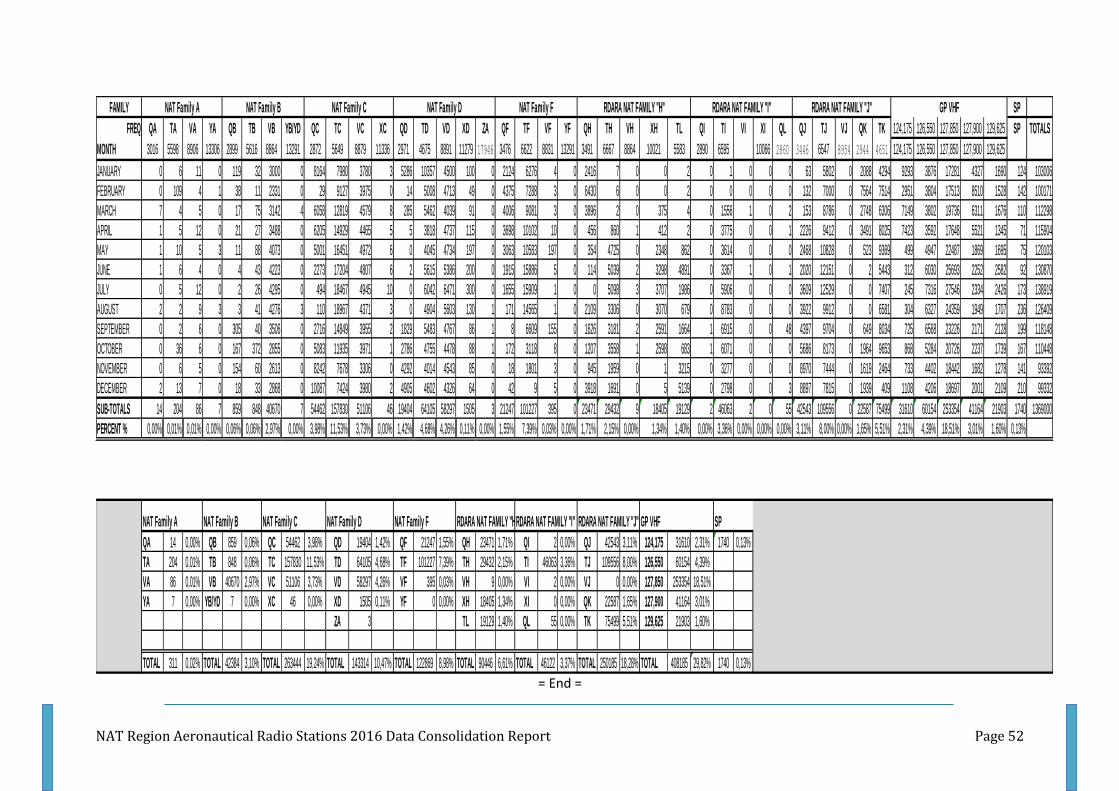
4.6 Appendix 6 – Shanwick and Iceland
2012 2013 2014 2015 2016
JANUARY 114852 119646 111748 114678 103006
FEBRUARY 105039 107104 97811 102771 100171
MARCH 124549 122082 114058 119613 112298
APRIL 125996 130717 116083 126030 115904
MAY 136446 147668 133788 139829 120103
JUNE 148115 165074 141798 150958 130870
JULY 155619 168266 151440 162051 138919
AUGUST 157452 170798 146110 157684 126409
SEPTEMBER 145834 157076 133575 155696 118148
OCTOBER 132419 139516 125600 141621 110448
NOVEMBER 110925 121633 109950 113082 93392
DECEMBER 109108 119333 111963 122826 99332
TOTAL 1566354 1668913 1493924 1606839 1369000
RT TRAFFIC COMPARISON
MONTH YEAR
1566354
1668913
1493924
1606839
1369000
0
200000
400000
600000
800000
1000000
1200000
1400000
1600000
1800000
2012 2013 2014 2015 2016

NAT Region Aeronautical Radio Stations 2016 Data Consolidation Report Page 50

NAT Region Aeronautical Radio Stations 2016 Data Consolidation Report Page 51
NAT Region Aeronautical Radio Stations 2016 Data Consolidation Report Page 52
= End =
FAMILY SP
FREQ QA TA VA YA QB TB VB YB/YD QC TC VC XC QD TD VD XD ZA QF TF VF YF QH TH VH XH TL QI TI VI XI QL QJ TJ VJ QK TK 124,175 126,550 127,850 127,900 129,625 SP TOTALS
MONTH 3016 5598 8906 13306 2899 5616 8864 13291 2872 5649 8879 11336 2971 4675 8891 11279 17946 3476 6622 8831 13291 3491 6667 8864 10021 5583 2890 6595 10066 2860 3446 6547 8954 2944 4651 124,175 126,550 127,850 127,900 129,625
JANUARY 0 6 11 0 119 32 3000 0 8164 7980 3780 3 5286 10357 4500 100 0 2124 6276 4 0 2416 7 0 0 2 0 1 0 0 0 63 5802 0 2088 4294 9293 3876 17281 4327 1690 124 103006
FEBRUARY 0 109 4 1 38 11 2331 0 29 9127 3975 0 14 5008 4713 49 0 4375 7288 3 0 6430 6 0 0 2 0 0 0 0 0 132 7000 0 7564 7514 2951 3804 17513 8510 1528 142 100171
MARCH 7 4 5 0 17 75 3142 4 6058 12819 4579 8 285 5462 4039 91 0 4006 9081 3 0 3896 2 0 375 4 0 1556 1 0 2 153 8786 0 2748 6306 7149 3802 19736 6311 1676 110 112298
APRIL 1 5 12 0 21 27 3488 0 6205 14929 4465 5 5 3818 4737 115 0 3698 10102 10 0 456 860 1 412 2 0 3775 0 0 1 2226 9412 0 3491 8025 7423 3592 17648 5521 1345 71 115904
MAY 1 10 5 3 11 88 4073 0 5001 16451 4972 6 0 4045 4734 197 0 3063 10583 197 0 354 4725 0 2348 862 0 3614 0 0 0 2468 10828 0 523 9369 499 4947 22487 1869 1695 75 120103
JUNE 1 6 4 0 4 43 4223 0 2273 17204 4807 6 2 5615 5386 200 0 1915 15886 5 0 114 5039 2 3298 4891 0 3367 1 0 1 2020 12151 0 2 5443 312 6030 25693 2252 2582 92 130870
JULY 0 5 12 0 2 26 4295 0 494 18467 4945 10 0 6042 6471 300 0 1655 15909 1 0 0 5098 3 3707 1986 0 5906 0 0 0 3609 12529 0 0 7407 245 7316 27546 2334 2426 173 138919
AUGUST 2 2 9 3 3 41 4276 3 110 18967 4371 3 0 4904 5603 130 1 171 14565 1 0 2109 3306 0 3070 679 0 8783 0 0 0 3922 9912 0 0 6581 304 6327 24359 1949 1707 236 126409
SEPTEMBER 0 2 6 0 305 40 3506 0 2716 14849 3955 2 1829 5483 4767 86 1 8 6609 155 0 1626 3181 2 2591 1664 1 6915 0 0 48 4397 9704 0 649 8034 725 6568 23226 2171 2128 199 118148
OCTOBER 0 36 6 0 167 372 2855 0 5083 11935 3971 1 2786 4755 4478 88 1 172 3118 8 0 1207 3558 1 2598 683 1 6071 0 0 0 5686 8173 0 1964 9653 868 5284 20726 2237 1739 167 110448
NOVEMBER 0 6 5 0 154 60 2613 0 8242 7678 3306 0 4292 4014 4543 85 0 18 1801 3 0 945 1959 0 1 3215 0 3277 0 0 0 8970 7444 0 1619 2464 733 4402 18442 1682 1278 141 93392
DECEMBER 2 13 7 0 18 33 2868 0 10087 7424 3980 2 4905 4602 4326 64 0 42 9 5 0 3918 1691 0 5 5139 0 2798 0 0 3 8897 7815 0 1939 409 1108 4206 18697 2001 2109 210 99332
SUB-TOTALS 14 204 86 7 859 848 40670 7 54462 157830 51106 46 19404 64105 58297 1505 3 21247 101227 395 0 23471 29432 9 18405 19129 2 46063 2 0 55 42543 109556 0 22587 75499 31610 60154 253354 41164 21903 1740 1369000
PERCENT % 0,00% 0,01% 0,01% 0,00% 0,06% 0,06% 2,97% 0,00% 3,98% 11,53% 3,73% 0,00% 1,42% 4,68% 4,26% 0,11% 0,00% 1,55% 7,39% 0,03% 0,00% 1,71% 2,15% 0,00% 1,34% 1,40% 0,00% 3,36% 0,00% 0,00% 0,00% 3,11% 8,00% 0,00% 1,65% 5,51% 2,31% 4,39% 18,51% 3,01% 1,60% 0,13%
NAT Family A NAT Family B NAT Family C NAT Family D NAT Family F RDARA NAT FAMILY "H"RDARA NAT FAMILY "I" RDARA NAT FAMILY "J" GP VHF SP
QA 14 0,00% QB 859 0,06% QC 54462 3,98% QD 19404 1,42% QF 21247 1,55% QH 23471 1,71% QI 2 0,00% QJ 42543 3,11% 124,175 31610 2,31% 1740 0,13%
TA 204 0,01% TB 848 0,06% TC 157830 11,53% TD 64105 4,68% TF 101227 7,39% TH 29432 2,15% TI 46063 3,36% TJ 109556 8,00% 126,550 60154 4,39%
VA 86 0,01% VB 40670 2,97% VC 51106 3,73% VD 58297 4,26% VF 395 0,03% VH 9 0,00% VI 2 0,00% VJ 0 0,00% 127,850 253354 18,51%
YA 7 0,00% YB/YD 7 0,00% XC 46 0,00% XD 1505 0,11% YF 0 0,00% XH 18405 1,34% XI 0 0,00% QK 22587 1,65% 127,900 41164 3,01%
ZA 3 TL 19129 1,40% QL 55 0,00% TK 75499 5,51% 129,625 21903 1,60%
TOTAL 311 0,02% TOTAL 42384 3,10% TOTAL 263444 19,24% TOTAL 143314 10,47% TOTAL 122869 8,98% TOTAL 90446 6,61% TOTAL 46122 3,37% TOTAL 250185 18,28% TOTAL 408185 29,82% 1740 0,13%
NAT Family A NAT Family B NAT Family C NAT Family D NAT Family F RDARA NAT FAMILY "H" RDARA NAT FAMILY "I" RDARA NAT FAMILY "J" GP VHF