natalensis - welcome to doras - doras -...
TRANSCRIPT
NATALENSIS
C h a r a c t e r i s a t i o n a n d g r o w t h o p t i m i s a t i o n o f s t r e p t o m y c e s
A thesis presented for the degree o f M.Sc.
by
M iriam O ’Shea, B.Sc.
Under the supervision o f Dr. Patricia Kieran
School o f Biological Sciences Dublin City University
Septem ber 1998

I hereby certify that this m aterial, which I now subm it for assessm ent on
the program m e o f study leading to the award o f MSc. in Biological
Sciences, is entirely my own work and has not been taken from the w ork
o f others, save and to the extent that such w ork has been cited and
acknow ledged within the text o f my work.
Signed: 'k /U e ig /M ID No-: ^ 1 0 ^ 0 2 .
Candidate
Date Sl2
TABLE OF CONTENTS
A b stra c t v i i
N o m en c la tu re v iii
A b b rev ia tio n s ix
L ist o f F ig u res x
L ist o f T a b les x iii
1 IN T R O D U C T IO N 1
2 C H A R A C T E R IS A T IO N A N D G R O W T H O P T IM IS A T IO N
O F F IL A M E N T O U S M IC R O -O R G A N IS M S
2.1 Introduction 2
2.2 The Actinomycetes 3
2.2.1 Streptomyces nataîensis and the production o f pim aricin 5
2.3 M orphological characterisation 7
2.3.1 M orphology - the classical definitions 7
2.3.2 The development o f morphological studies 8
2.3.3 Image analysis 9
2.4 The factors which affect morphology 10
2.4.1 Environmental factors - physical 12
2.4.1.1 Aeration conditions 12
2.4.1.2 Dilution rate 12
2.4.1.3 A gitation effects 12
2.4.1.4 pH 13
2.4.1.5 C 0 2 14
2.4.1.6 Temperature 14
2.4.2 Environmental factors - chemical 15
2.4.3 Environmental factors - biological 15
2.4.4 M icrobiological factors 16
2.4.4.1 M edia composition 16
Acknowledgements vi
i

H
2A.4.2 Growth rate 17
2.5 Growth optimisation - case studies 18
2.5.1 Aspergillus niger 18
2.5.2 Aureobasidium pullulans 20
2.5.3 Streptomyces akiyoshiensis 21
2.5.4 Streptomyces armentosus 22
2.5.5 Mortierella cilpina 22
2.5.6 Amycolalopsis orientalis 23
2.5.7 Streptomyces griseoflavus 24
2.5.7 Streptomyces antibioticus 24
2.5.9 Streptomyces clavuligerus 25
2.5.10 Rhizopus arrhizus 26
2.5.11 Product optimisation studies 26
2.6 Subsequent effects o f growth optimisation 28
2.6.1 Rheology 28
2.6.1.1 Effects o f morphology and biomass on
rheology 28
2.6.1.2 Effect o f rheology on downstream
processing 32
2.6.2 Biochemical effects 32
2.7 Summary 33
3 M A T E R IA L S A N D M E T H O D S
3.1 The organisms 34
3.2 Autoclaving procedure 34
3.3 Media 34
3.3.1 Maintenance media 34
3.3.2 Inoculum preparation medium 34
3.3.3 Fermentation media 35
3.3.3.1 YEPD liquid medium 35
3.3.3.2 Production medium 35
3.3.3.3 Unbuffered medium 35
ii

3.3.3.4 Buffered m edia 36
3.3.3.5 Peptone medium 36
3.3.3.6 Carbonated m edium Type 1 36
3.3.3.7 Carbonated m edium Type 2 37
3.3.3.8 Actinomycete medium 37
3.4 Cultivation o f the organism 37
3.4.1 Cultivation on solid medium 3 7
3.4.1.1 YEPD agar 37
3.4.1.2 Oatmeal agar 38
3.4.2 Shake flask cultures 38
3.4.2.1 Inoculum cultures 38
3.4.2.2 Shake flask fermentations 38
3.4.3 1L STR fermentations 38
3.4.4 10 Litre fermentations 39
3.4.4.1 F ermenter configuration 3 9
3.4.4.2 Fermenter set-up and sterilisation 40
3.4.4.3 Fermenter operation 41
3.4.4.4 Fermenter validation 41
3.5 M easurement o f fermentation parameters 42
3.5.1 Determination o f biomass 42
3.5.1.1 Attempts to remove carbonate for
biomass determination 42
3.5.2 Determination o f sugar concentration 44
3.5.3 Determination o f pH 45
3.5.4 Determination o f dissolved oxygen concentration 46
3.6 Detection o f pim aricin 46
3.6.1 Bioassay 46
3.6.2 UV method 49
3.6.3 HPLC method for the detection o f pim aricin 49
3.6.3.1 Validation o f technique and problems 51
encountered
3.7 Statistical analysis o f data 55
iii

4 M O R P H O L O G IC A L C H A R A C T E R IS A T IO N
4.1 Introduction 56
4.2 Image analysis hardware 56
4.3 Image analysis software 57
4.4 The morphology o f the organism 58
4.5 Slide preparation prior to image analysis 60
4.6 Image analysis protocol for the characterisation o f
Streptomyces natalensis 60
4.7 M orphological characterisation 62
4.7.1 M orphological development during cultivation 62
4.7.2 M orphological distributions 68
R E S U L T S A N D D IS C U S S IO N : S H A K E F L A S K A N D
S T IR R E D T A N K R E A C T O R S T U D IE S 72
5.1 Batch growth characteristics for Streptomyces natalensis 72
5.2 Inoculum studies 75
5.3 Volume studies 76
5.4 Stirred tank reactor studies 82
5.4.1 1 Litre system 82
5.4.2 10 Litre fermentations 85
R E S U L T S A N D D IS C U S S IO N : M E D IA S T U D IE S 90
6.1 The effect o f m edia components on the growth and
morphological characteristics o f S. natalensis 90
6.1.1 Biom ass characteristics during cultivation 90
6.1.2 Effect o f media components on biomass production rate 93
6.1.3 M orphological consequences o f m edia manipulation 95
6.1.4 Relationship between morphology and growth param eters98
6.2 Effects o f m edia m anipulation on S. natalensis 102
6.2.1 Organic versus inorganic nitrogen sources 103
6.2.2 Effect o f ammonium sulphate concentration 106
6.2.3 Effect o f peptone concentration
iv
109

6.2.4 Carbonate studies 111
6.2.4.1 Effect o f calcium carbonate concentration 111
6.2.4.2 Influence o f carbonate source 112
6.2.5 Effect o f phosphate concentration 113
6.2.6 Effect o f glucose concentration 115
6.2.7 Effect o f corn steep powder (CSP) concentration 117
6.3 Summary 119
7 . C O N C L U S IO N S A N D R E C O M M E N D A T IO N S 120
7.1 Conclusions 120
7 .2 R ecom m endations 122
B IB L IO G R A P H Y 124
A PPEN D IX 1
Image analysis program 13 5
v

A C K N O W L E D G E M E N T S
I would like to sincerely thank my supervisor, Dr. Patricia Kieran, for all her support,
guidance and patience over the past years. Thanks for remaining calm through all the
ups and downs!
I would also like to thank the staff members o f the School o f Biological Sciences for
their advice and help, particularly Dr. Padraig Walsh, Dr. Greg Foley and Prof.
Richard O ’Kennedy. Thanks also to the technical staff, w ithout whose help this
project would have never ended, particularly Ben Austin, Robert Law son and Patricia
Carty.
I would like to thank my employers and co-workers at Jacobs International for all
their flexibility and support over those difficult last few weeks
A special thanks to my fellow members o f BERG, past and present - Donal, Tony,
Una, Audrey, Therese and Sara. Thanks especially to Donal, m y brother, for the
invaluable advice and the brainstorming sessions. To M arianne - thanks for the
HPLC lessons, and Therese, thanks for all the help. I would also like to thank all the
other members o f the postgrad community for their friendship and support-
especially Vivienne, Kevin, Jane, Sharon and Deirdre. I hope we rem ain the firm
friends w e’ve become.
To the other friends that proved a welcome break from DCU - Una, Catherine,
Bronagh, Sinead, Caroline, Kevin, Eddie, Andrew and Gerry - thanks for being there.
To m y parents, for allowing me to stay a student for a little longer than they had
planned!!! Thanks also to my brothers for their encouragement. W ithout all o f your
support, I would never have gotten through.

A B S T R A C T
The morphological development and growth characteristics o f the actinomycete
Streptomyces natalensis were studied in submerged culture. The m orphology o f the
organism was m onitored using semi-automated image analysis. A protocol was
developed for taking geometric measurements o f the cell population in term s o f
pellet area, perim eter and diameter.
The organism was found to be pH sensitive and, under certain circumstances, was
shown to suffer from oxygen limitation. The optimum inoculum for a 100 m l,
fermentation (in a 250 mL shake flask) was found to be a 5 m L aliquot o f a 96 hour
old culture. However, a 100 mL culture was employed, despite superior performance
at the 50 mL scale, due to reproducibility problems encountered w ith the smaller
volume. W hen S. natalensis was cultivated in a 150 mL culture (in a 250 mL flask)
the organism was found to be subject to oxygen limitation.
M edium com position also affected the growth o f the organism, w ith a YEPD-based
medium and an actinomycete medium developed by Sarra et al. (1996) resulting in
the greatest levels o f biomass production. W ith the exception o f C aC 0 3,
concentrations o f the individual components in a medium developed by Struyk and
W aisvisz (1975) were found to be optimal, although yielding lower levels o f biomass
than the YEPD or Actinomycete media. I f the calcium carbonate concentration was
reduced from the recommmended 8 g/L to 4 g/L, biomass production was enhanced.
The organism grows predominantly in a pelleted form with some filamentous clumps
present under certain conditions. The pellets increase in size until the culture is
approximately 73 hours old, at which time the pellets undergo some form o f
disintegration which may be caused by lysis or breakage due to pellet-pellet
collisions. After this time, the average pellet area decreases sharply to a stable value.
This pattern is relatively insensitive to changes in m edia components or
concentrations. The only exceptions are during cultivation in either YEPD or
actinomycete media (Sarra et al., 1996), where the percentage o f filamentous clumps
present in the sample increases consistently.

NO M ENCLATURE
S y m b o l D efin itio n U nits
c, Flexibility constant -
Cm Biomass concentration g/L
Cn Concentration o f pim aricin in standard p.g/mL
Cs Concentration o f pim aricin in sample (ig/mL
Cw Ratio o f mycelial wet to dry weight -
D Impeller diameter m
d,n Hyphal diameter pm
H Liquid height in fermenter M
K Consistency index Nsn/m 2
K Casson constant (Pa s)05
kLa Volumetric oxygen mass transfer coefficient s'1
1.« Length o f a mycelial hypha (xm
M f Apparent morphology factor -
n Flow behaviour index -
Pn Peak height o f pimaricin standard Mm
Po2 Partial pressure o f oxygen N/m2
Ps Peak height o f sample at 317nm Mm
Rvh Specific biomass production rate g/L.h
T Vessel diameter m
Aerobic yield o f cells per gram substrate g/g substrate
a Constant ~
P Constant -
S Morphology factor -
r Constant -
Pm Density o f mycelium Kg/m3
T Shear stress Pa

ABBR EVIATIO NS
AA Arachidonic acid
atm Atmosphere
ATCC American Type Culture Collection
CBS Central Bureau Voor Schimellcultures
CMC C ar bo x y ni et h 1 y ce 11 u 1 o se
CMS Counterflow mixing system
CSP Corn Steep Powder
DNS 3,5-dinitrosalycylic acid
GA Gibberellic acid
HON 5-hydro xy-4-oxonorval i ne
HPLC High Performance Liquid Chromatography
IPYA Indole-3-pyruvic acid
KHCF Potassium hexacyanoferrate 11 - trihydrate
NCIM B National Collections o f Industrial and Marine Bacteria
NRRL Northern Regional Research Laboratory
psi Pounds per square inch
RP Rheological parameters
rpm Revolutions per minute
STR Stirred Tank Reactor
TMS Turbine mixing system
u v Ultra violet
w m Vol umes/vo 1 ume/minu te
YEPD Yeast Extract, Peptone, Dextrose

LIST OF FIGURES
Figure 2.1 Factors affecting aggregation
Figure 3.1 Data obtained during calcium carbonate solubility tests
Figure 3.2 Sample o f glucose standard curve for DNS assay
Figure 3.3 Sample o f standard curve for pimaricin bioassay
Figure 3.4 Sample o f (a) positive (250 pg/mL) and (b) negative results for
pimaricin bioassay
Figure 3.5 (a) Positive (10 pg/m L) and (b) negative UY profiles for Pimaricin
detection
Figure 3.6 Pimaricin positive (0.05 g/L) (a) and negative (b) HPLC profiles
Figure 4.1 Example o f Streptomyces natalensis morphology (a) typical pellets
and clumps, lOOx; (b)‘hairy’ pellets, lOOx and (c) filamentous
clumps, lOOx
Figure 4.2 Example o f typical image analysis field, 40x
Figure 4.3 Schematic diagram outlining the calculation o f the mean particle
diameter used during S. natalensis studies
Figure 4.4 Image analysis protocol
Figure 4.5 Morphological development o f S. natalensis during cultivation in
buffered medium (a) particle area, (b) particle convex area and (c)
particle diameter
Figure 4.6 Development o f (a) particle perimeter, (b) particle roughness and
(c) percentage clumps in shake flask culture
Figure 4.7 M orphological development o f pellet core in shake flasks - (a) core
area and (b) core convex area
Figure 4.8(a) Development o f number based particle size distributions during
cultivation in buffered fermentation medium in shake flask cultures
Figure 4.8(b) Development o f volume based particle size distributions during
cultivation in buffered fermentation medium in shake flask cultures
Figure 5.1 Biomass profiles for Streptomyces natalensis grown in both
unbuffered and buffered media
Figure 5.2 Growth curve for Streptomyces natalensis grown in buffered

fermentation medium: (a) biomass and pH profiles, (b) extracellular
total reducing sugars concentration and (c) m orphological
variations throughout the batch growth cycle
Figure 5.3 The effect o f inoculum age and volum e on (a) biomass
accumulation and (b) morphology
Figure 5.4 Biomass profiles obtained during volume studies
Figure 5.5 Biomass yield per gram o f substrate utilised during volume studies
Figure 5.6 Morphological characteristics during volume studies
Figure 5.7 Biomass profiles for S. natalensis cultivated in IL fermenter
Figure 5.8 Morphological profiles o f S. natalensis in IL fermenter
Figure 5.9 Profiles for (a) biomass, (b) dissolved oxygen and (c) sugars during
a 10L fermentation (N = 400 rpm, aeration rate = 1 w m )
Figure 5.10 Observed values for (a) Yx/s and (b) specific biomass production
rate for 10L fermentations
Figure 5.11 Morphological development o f S. natalensis during 10L
fermentations
Figure 6.1 Effect o f medium composition on batch growth curve
Figure 6.2 Maximum biomass yield per gram of glucose utilised during m edia
studies
Figure 6.3 M aximum specific biomass production rates observed during m edia
studies
Figure 6.4 Particle area development during batch cultivation
Figure 6.5 Variation in (a) particle diameter, (b) Yx/s and (c) Rvb for S.
natalensis in peptone medium
Figure 6.6 Relationship between overall Yss values and final particle area for
all investigated media
Figure 6.7 Relationship between overall specific biomass production rate and
final particle area for all investigate media
Figure 6.8 Investigation o f relationship between growth rate and particle
morphology
Figure 6.9 Biomass profiles during shake flask cultivations using different
nitrogen sources

Figure 6.10
Figure 6.11
Figure 6.12
Figure 6.13
Figure 6.14
Figure 6.15
Figure 6.16
M orphological profiles for S. natalensis w ith varying nitrogen
sources
M aximum biomass concentrations observed during am monium
sulphate studies
M aximum biomass concentrations observed during the
optimisation o f peptone medium
M axim um biomass concentrations observed during optimisation
studies o f production medium
M aximum biomass concentrations observed during phosphate
studies
Biomass concentrations observed during glucose optimisation
studies
Overall biomass concentrations observed during com steep powder
(CSP) studies
LIST OF TABLES
Table 2.1 Factors affecting the formation o f floes
Table 3.1 Solid media formulation
Table 3.2 Inoculum preparation medium
Table 3.3 Production medium formulation
Table 3.4 Phosphate buffer formulation
Table 3.5 Formulation o f actinomycete medium
Table 3.6 Configuration o f the IL fermenter
Table 3.7 Configuration o f ‘M icogen’ fermenter
Table 3.8 Effect o f pH adjustment on fermentation broth sample characteristics
Table 5.1 Growth characteristics o f shake flask cultures in buffered fermentation
medium - volume studies
Table 5.2 Overall values for Y„s and Rvb rate obtained during volume studies
Table 5.3 Final average morphological characteristics for shake flask cultures in
buffered fennentation medium - volume studies
Table 5.4 M aximum growth parameters observed - IL fermenter
Table 6.1 Maximum biomass concentrations for media studies
Table 6.2 Overall and R evalues for shake flask cultures - m edia studies
Table 6.3 Average morphological characteristics for shake flask cultures in
various m edia after 200 hours o f cultivation
Table 6.4 Summary o f m edia studies
Table 6.5 Biomass yields for nitrogen studies
Table 6.6 Effect o f ammonium sulphate concentration in buffered fermentation
medium on shake flask culture characteristics
Table 6.7 M orphological characteristics observed during optimisation o f
ammonium sulphate concentration in buffered ferm entation medium
Table 6.8 Effect o f peptone concentration in buffered fermentation m edium on
shake flask culture characteristics
Table 6.9 M orphological characteristics observed after 200 hours during
optimisation o f peptone medium

Table 6.10
Table 6.11
Table 6.12
Table 6.13
Table 6.14
Table 6.15
Table 6.16
Table 6.17
Table 6.18
Effect o f calcium carbonate on the growth characteristics o f S.
natalensis in production medium
M orphological characteristics observed after 200 hours during
optimisation o f calcium carbonate concentration
Effect o f carbonate source on the growth o f S. natalensis in
production medium
Effect o f KH2P 0 4 concentration on growth in buffered fermentation
medium
Effect o f variations in KH2P 0 4 concentration in buffered m edium on
the morphology o f S. natalensis
Optimisation o f glucose concentration in buffered fermentation
medium
Effect o f glucose concentration in buffered m edium on the
morphology o f S. natalensis
Optimisation o f corn steep powder concentration in buffered
fermentation medium
Effect o f corn steep powder concentration in buffered m edium on the
morphology o f S. natalensis
xiv

CHAPTER 1
INTRODUCTION
Streptomyces natalensis is an actinomycete which was first isolated in 1955 in Natal,
South Africa. It produces pimaricin (natamycin) which is an anti fungal agent.
Pimaricin has been used in preserving food and beverages which are particularly
prone to fungal contamination, e.g. to protect the surface o f salami (Holley, 1981).
However, very little research has been reported on the characterisation o f this
organism in submerged culture or on optimisation o f cultivation conditions.
The morphology o f filamentous organisms is o f interest both from a biological and
biochemical engineering viewpoint. Biologically, morphology can be used in the
identification o f an organism and can reflect its pathogenic potential and adaptation
to its environment. In relation to biochemical engineering, the m orphological
characteristics exhibited by the organism in submerged culture can influence the
viscosity o f the broth, and thus impact on oxygen transfer, growth, productivity and
downstream processing for recovery o f the desired product. The morphology o f
submerged cultures varies greatly, depending both on the organism and on the
growth conditions, with suspensions o f unicells, long hyphal filaments and pellets
among the possible forms observed (Edelstein and Hadar, 1983).
Currently, there is a strong trend towards quantifying microbial morphology in
suspension cultures using image analysis (Thomas and Paul, 1996). Allowing rapid,
accurate and detailed analysis o f morphology, image analysis has clear advantages
over earlier approaches to morphological measurements e.g. digitising tables and
Coulter counters.
In this project, both shake flasks and stirred tank reactors (STRs) were used to
cultivate the organism and the concentrations o f the principal m edia components
were varied. The effects o f these changes on the growth and m orphological
characteristics o f S. natalensis were monitored with a view to optimising the
cultivation conditions.
1

CH APTER 2
CH AR ACTER ISATIO N AND G RO W TH O PTIM ISATIO N OF
FILAM ENTO US M ICR O -O RG ANISM S
2.1 INTRODUCTION
A number o f economically important industrial fermentations employ filamentous
micro-organisms. Examples o f these processes include the production o f antibiotics
(e.g. penicillin by Pénicillium chrysogenum), the production o f enzymes (e.g.
rifam ycin oxidase by Curvularia lunata), and the production o f exopolysaccharides
(e.g. pullulan by Aureobasidium pullulons). The physical properties o f these systems
differ significantly from those o f non-filamentous bacteria and yeast cultures. This is
due primarily to the fact that filamentous systems can exhibit two extreme types o f
morphology in submerged fermentation, namely, the pelleted and the free
filamentous forms (M etz and Kossen, 1977; Olsvik el a l, 1993). Between these two
extremes can lie a wide range o f mycelial morphology, the existence o f which is
frequently ignored, particularly in rheological studies.
The rheological properties o f a filamentous fermentation fluid are normally
considered to be determined by both the biomass concentration and the
morphological form o f the mycelia (Roels et al., 1974; K im et al., 1983). Therefore,
the control o f mycelial morphology during fermentation is often a prerequisite for
industrial applications as it is well established that the broths involved in such
processes are highly viscous with non-Newtonian rheological properties.
Hence, when optimising a filamentous fermentation, great care must be taken to
prevent, if possible, both the mass transfer and downstream processing complications
associated with the formation o f highly viscous filamentous broths. By controlling
both the fermentation media components and operating parameters, a delicate
balance can be achieved between optimising biomass and product yields, and
maintaining broth viscosity at an acceptable level. This review outlines some o f the
research into the control o f biomass and morphology development, including media
optimisation studies and the effects o f fermentation param eters such as agitation and
2

aeration. Correlations relating biomass concentration and m orphological
characteristics to the rheological profiles o f filamentous fermentations are also
discussed.
2.2 THE ACTINOMYCETES
Until the late 1950’s the actinomycetes were regarded, on the basis o f their
macroscopic and microscopic morphology, as an unusual group o f fungi. However,
application o f electron microscopy showed that the actinomycetes were prokaryotic,
gram-positive bacteria (Williams, 1990). Growth o f actinomycetes is filamentous on
solid substrate. In submerged cultures, the preferred choice for industrial
fermentations, growth can occur in different modes, i.e. pellets, mycelial fragments
and well-dispersed mycelia. Oxygen requirements o f actinomycetes can vary (Piret
and Demain, 1988). Some genera are fermentative; others are oxidative.
Although actinomycetes occur in a wide range o f environments, the vast majority are
saphrophytcs, found in terrestrial and aquatic habitats. The genus Streptomyces
predominates in almost all soil types. They are important colonisers o f soil organic
material, the bulk o f which consists o f insoluble polymers. Some genera are more
common in freshwater environments. Others are thermophilic and play an im portant
role in the decomposition o f composts and fodders, which are self-heating processes
(Williams, 1990).
Actinomycetes play both detrimental and beneficial roles in nature. H um an diseases
such as ‘farm er’s lung’ (caused by a number o f organisms including
Thermoaetinomyees vulgaris) and hypersensitivity pneumonitis (Streptomyces albus)
are due to production o f spores (Lacey, 1988). A number o f domestic animal
diseases also arise from these organisms (Lechevalier, 1988), e.g. mastitis
(Actinomyces pyogenes), foot rot (Dermatophilus eongolenis), and tuberculosis
(Mycobacterium bovis). They are also responsible for ‘bulking’ in sewage treatm ent
plant and cause the formation o f scums and foams.
3

Actinomycetes are extremely active in biodégradation and have been known to cause
spoilage o f hay, straw, cereal grains, seeds, bagasse, plant fibres, wood, pulp, paper,
wool, hydrocarbons, rubber and plastics (Demain, 1988). These biodegradative
properties, however, can be channelled into waste removal activities and are
extremely important in the recycling o f materials in nature. M ost agricultural and
urban wastes primarily consist o f cellulose complexed w ith varying am ounts o f
hemicellulosic polysaccharides and lignin, and the cellulases and xylanases o f a
number o f actinomycete species are well characterised (Crawford, 1988).
A large number o f actinomycete enzymes are currently o f interest in areas such as
enzyme processes, clinical chemistry, and medical therapy. Glycosidases e.g.
amylase, are exploited for the degradation o f plant biomass; proteases serve as
additives to detergents and are used in the tanning industry. Glucose isomerases
have been successfully used to obtain fructose heavy syrups. Enzymes produced by
actinomycetes have been used for beer and wine clarification and also serve as non
toxic food preservatives. Cholesterol oxidase (Streptomyces violascens and
Norcardia spps.) has been used for the rapid determination o f total cholesterol levels
in blood (Peczynska-Czoch and Mordarski, 1988).
However, the greatest contribution that actinomycetes have made to science is
through their production o f antibiotics and anti-tumour agents. About two-thirds o f
the known antibiotics are produced by actinomycetes and approximately 80% o f
these have been produced by the Streptomyces species (W illiams, 1990; H aque et al.,
1995). Streptomycin is produced by Streptomyces griseus and has antibiotic activity
against Mycobacterium tuberculosis. This was the first commercially successful
antibiotic produced by an actinomycete (Claridge, 1979). Tetracyclines, which have
had a significant impact on both chemotherapy and non-medical fields, are also
produced by a number o f Streptomycete species. (Hostâlek et al., 1979). The
actinomycete Amycolatopsis orientalis produces the glycopeptide antibiotics
vancomycin and iV-demethylvancomycin, which continue to be the antibiotics o f
choice against (3-lactam resistant enterobacteria (McIntyre et al., 1996).
4

2.2.1 Streptomyces natalensis AND THE PRODUCTION OF PIMARICIN
The polyene macrolide, pimaricin, was first discovered in 1955 when a group o f
Dutch investigators isolated a new, highly active antibiotic from the culture m edium
of a Streptomyces strain (Struyk and Waisvisz, 1975). The Streptomyces strain
originated from a soil sample taken in Natal, South A frica and was nam ed
Streptomyces natalensis. The World Health Organisation did not accept the name
pim aricin and the antibiotic’s name was subsequently changed to ‘natam ycin’. Both
names appear in the literature. The antibiotic is also commercially produced by
Streptomyces gilvosporeus (McCabe, 1990). M orphologically, S. natalensis grows
filamentously on agar. The hyphae are branched, irregularly twisted, generally o f
uniformly thickness (Struyk and Waisvisz, 1975). There is little inform ation in the
literature on the morphology o f the organism in submerged culture.
Pimaricin is a white to creamy white, almost tasteless, and almost odourless,
crystalline powder (De Ruig et al., 1987). The chemical formula is C ^H ^N O ^ and
the molecular weight is 665.74. Temperatures o f up to 120°C do not im pair the
antibiotic activity, as long as the exposure time is less than 1 hour (Raab, 1972).
Pimaricin may be inactivated under the influence o f UV light with wavelengths o f
300 - 350 nm (M cCabe, 1990). The compound is o f particular potential interest in
the food industry because o f its effectiveness in inhibiting fungal growth, w ithout
interfering with bacterial fermentation or ripening processes. The low solubility o f
natamycin makes it suitable for surface treatment o f foods, because it does not
readily migrate into the interior and does not adversely affect flavour or appearance
(Tuinstra and Traag, 1982; Fletouris et al., 1995). M ore recently, natam ycin has
been used in the treatment and prevention o f a number o f poultry diseases
(Raghoenath and Webbers, 1997).
Despite its recognised potential, there has been limited research on
commercialisation o f natamycin, because o f the extremely high cost o f its
manufacture, w ith recovery and purification requiring multiple steps, including pH
changes and concentration steps (Millis et al., 1991). The high cost is predominantly
due to the use o f organic solvents e.g. butanol (Struyk and Waisvisz, 1975), in the
5
extraction o f pimaricin from fermentation broth. Borden et al. (1995) patented the
extraction o f pim aricin from fermentation broth, using a substantially water-miscible
solvent at alkaline pH. More recently, however, Raghoenath and W ebbers (1997)
developed a recovery process which does not require the use o f any organic solvents.
Bridger (1968) obtained antibiotic yields o f 750 mg/L during fermentation. Struyk
and W aisvisz (1975) observed concentrations o f between 535 and 640 mg/L o f
pimaricin in a number o f fermentation broths. M illis et al. (1991) noted pim aricin
concentrations o f up to 2 g/L.
A number o f techniques are employed at present to detect pim aricin at residue levels
in fermentation broths and on some food products. These include bioassays, UV
spectroscopy and, the m ost common, HPLC. The latter technique has been used to
detect pim aricin penetration in cheese (Tuinstra and Traag, 1982). M ahon (1990)
developed a HPLC method for the routine estimation o f pimaricin levels in
fermentation broths. De Ruig (1987) developed a UV spectrophotometric m ethod to
measure pim aricin content in cheese and cheese rind and the technique was advanced
by Fletouris et al. (1995). This UV method has many advantages over the HPLC
approach as it does not require concentration or purification o f the sample prior to
analysis. The analysis is simple and is completed in 6 minutes, compared to 13.5
minutes with the HPLC technique.
In DCU to date a two previous studies have been completed in the optimisation o f
pimaricin production by S. natalensis. M ahon (1990) studied pim aricin production
during cultivation in a 10L fermenter. Yields o f up to lg /L o f pim aricin were
observed. A HPLC assay method was also developed in this study. M cCabe (1990)
studied the effect o f some media components on pim aricin production in both shake
flasks and a 10L fermenter. Two methods were used to assay for the presence o f
pimaricin; a bioassay and UV spectroscopy. Yields o f up to 700 mg/L were observed
during this study.
6

2.3 MORPHOLOGICAL CHARACTERISATION
2.3.1 MORPHOLOGY - THE CLASSICAL DEFINITIONS
M orphology is the description o f the external form and structure o f an organism, but
can also describe the nature o f the mycelial network and the homogenous phase. The
morphology o f a micro-organism influences mycelial growth and, consequently, in
submerged cultures, affects production kinetics, by determining the rheology o f the
broth and by causing diffusion limitation o f nutrients w ithin mycelial floes. Usually,
microbial morphology is characterised by visual observation using a microscope.
Hyphal floes exhibit several morphological forms. In submerged culture, mycelial
growth can be in the form o f disperse filamentous m ycelia (e.g. Fusarium
graminearium), spherical colonies or ‘pellets’ (e.g. Aspergillus niger) or any
combination o f these extremes depending on the fermentation conditions (Cox and
Thomas, 1992). Some micro-organisms are dimorphic, e.g. Kluyveromyces
marxianus. This phenomenon may be described as the process by w hich the
filamentous form is transferred into a yeast-like form or vice versa as a result o f
environmental conditions (Walker and O ’Neill, 1990).
In pelleted form, the mycelium develops as stable spherical aggregates, com prising a
branched and partially intertwined network o f hyphae. These pellets can have
diameters o f several millimetres. The m ost im portant advantage o f growth in
pelleted form is a considerable reduction in broth viscosity, in comparison to growth
in filamentous form (Hersbach et al., 1988).
Several mechanisms have been proposed for pellet formation: agglom eration o f
spores and hyphae, agglomeration o f hyphae and agglomeration o f solid particles and
hyphae. Pellet-pellet and pellet-wall (i.e. fermenter wall, baffles etc.) interactions are
also considered to be o f importance in pellet formation (Metz and Kossen, 1977).
Pellet morphologies have been classified into three loosely banded groups
encompassing the variations observed under different fermentation regimes
(Hersbach et al., 1988).
7

• Fluffy loose pellets: pellets that have a compact central core w ith a loosely packed
filamentous outer zone
• Compact smooth pellets: pellets that have a compact core w ith limited lateral
growth
• Hollow pellets: pellets that have developed from the previous two forms, and have
a hollow core
2.3.2 THE DEVELOPMENT OF MORPHOLOGICAL STUDIES
Characterisation o f mycelial morphology is important for the design and operation o f
fermentations involving filamentous micro-organisms. Initial investigations o f
mycelial morphology relied upon inaccurate and time-consuming manual
measurements from photographs. One o f the earliest semi-automated methods for
morphological characterisation employed an electronic digitiser (M etz et al., 1981).
Photographs o f the micro-organism were projected onto a digitising table, where the
images could be manually traced with a cursor. Co-ordinates along an individual
hypha were recorded and used to calculate morphological measurements such as
m ain hyphal length, total hyphal length and the number o f hyphal tips. This method,
however, was slow and labour intensive. Quantification o f morphology throughout
the fermentation ideally requires an automated method o f analysing a significant
number o f m ycelia from each sample. Methods based on digital image analysis have
now been developed (Adams and Thomas, 1988), and will be discussed in further
detail in Section 2.3.3.
Fractal models have been used for the characterisation o f morphology (Patankar et
al., 1993). A fractal is an object in which similar structural patterns are repeated at
different length scales, with the result that small sections o f the object, upon
magnification, appear very similar to the original object. In mycelia, the repeated
branching o f the mycelial hyphae in a tree-like form during growth gives rise to self
similarity and the fractal structure. The fractal model yields a single quantitative
index o f morphology, which has been found to have general applicability and can be
used in empirical or theoretical correlations between morphology and other
properties. Patankar et al. (1993) successfully applied a fractal model to the
8

characterisation o f P. chrysogenum, Streptomyces tendae, and Streptomyces griseus
cultures in a bioreactor. Experimental observations and simulations o f mycelial
growth validated the fractal model. Jones et al. (1993) also investigated the use o f
fractal geometry in the quantitative analysis o f a mycelial inoculum o f Pycnoporus
cinnabarinus.
M orphologically based models for the development of hyphal structures and pellets
have been proposed by a number o f workers including Yang et al. (1992) and
Nielsen (1993). Filtration has been used to monitor the m orphological development
o f microbial broths (Oolman and Liu, 1991).
2.3.3 IMAGE ANALYSIS
Image analysis is a technique which can be used for the rapid and automatic
measurement o f the morphological characteristics o f micro-organisms. It has been
used to characterise freely dispersed hyphae in terms o f m ain hyphal length, total
hyphal length and number o f tips (e.g. Packer and Thomas, 1990; Tucker et al.,
1992; Vanhoutte et al., 1995). Researchers have also developed protocols to measure
the morphological parameters o f pelleted micro-organisms in term s o f the area,
diameter and roughness o f individual pellets (e.g. Cox and Thomas, 1992; Reichl et
al., 1992a). In addition to the morphological characterisation o f filamentous
organisms, image analysis techniques have also been used to monitor the
morphology o f budding yeast cells (Pons et al., 1993), dimorphic yeast (O ’Shea and
Walsh, 1996) and plant cells (Kieran et al., 1993).
The principle steps in image analysis are:
• Image capture: the conversion o f an image into an electronic signal suitable for
digital processing and storage. The image is captured using a television camera,
which may be mounted on a microscope, and converted into a grid o f pixels.
• Segmentation: the act o f separating the regions o f interest w ithin a captured image
from the background. The most com m on method used is called thresholding,
which works well in situations where illumination can be carefully controlled. I f
illumination is a problem then other techniques such as ‘edge finding’ and ‘region
9
growing’ are also available.
• Object detection: a data reduction step that produces a description o f each ‘object’
(defined in image analysis terms as the individual regions o f interest within the
whole scene). These sets o f descriptions, which should fully characterise each
object, are stored and used in subsequent measurement operations.
• Measurement: the gathering o f quantitative data for the objects o f interest.
• Analysis o f the data collected.
Tucker et al. (1992) proposed the use o f an image processing system for
physiological studies on filamentous micro-organisms, w ith particular reference to
the effect o f fermentation conditions on mycelial extension and branching. Tucker
and Thomas (1994) used image analysis in studies o f the effect o f spore
concentration on the subsequent morphology o f P. chrysogenum. In addition to
determining simple morphological parameters, a direct correlation between total
hyphal length and dry weight was obtained. M orphological characteristics could,
therefore, be used to determine the growth kinetics o f filamentous fungi (Lejeune and
Baron, 1995).
2.4 THE FACTORS WHICH AFFECT MORPHOLOGY
The morphology o f a filamentous micro-organism developing in any fermentation
system may be represented as a final result o f competing influences: equilibrium
between forces o f cohesion and disintegration. As can be seen from Figure 2.1, a
wide range o f factors influence the formation o f floes, clumps and pellets. A more
comprehensive list o f the factors affecting morphology is presented in Table 2.1
(Atkinson and Daoud, 1976).
There is substantial evidence in the literature, to suggest that engineering variables
have considerable influence upon the morphology o f moulds. Factors such as
oxygen tension, growth rate and shearing forces can influence the growth,
morphogenesis and productivity o f a filamentous micro-organism (Van Suijdam and
Metz, 1981).
10

Microbiological factors
Nutrition
Figure 2.1: Factors affecting aggregation (Adaptedfrom: Atkinson andDaoud, 1976)
Table 2.1: Factors affecting the formation of floes (From: Atkinson and Daoud, 1976)
Microbiological Environmental
Physical Chemical Biological
Cell wall
Genetics
Growth rate
Nutrition
Physiological age
Hydrodynamic Properties Presence of Inoculum size
aeration
dilution rate
fermenter size
time and intensity of
agitation
viscosity
Interfacial Phenomena
gas bubbles
surface active agents
suspended solids
Ionic Properties
organic solvents
PH
presence of calcium ions
Temperature
chelating agents Presence of
C/N ratio
enzymes
ferrocyanide
nitrogenous
substances
oils
sugars
trace metals
other
organisms or
strains
11

2.4.1 ENVIRONMENTAL FACTORS - PHYSICAL
2.4.1.1 AERATION CONDITIONS
In fermentations conducted in sparged vessels, the role o f aeration is two-fold: it
satisfies the oxygen needs o f the micro-organisms and contributes to fluid mixing.
Relatively small changes in the dissolved oxygen concentration in the m edium o f
aerobic cultures can result in changes in the physiological state o f micro-organisms.
In pellets, oxygen limitation can cause autolysis, eventually leading to the form ation
o f hollow pellets (Hersbach et al., 1988). It has been reported (Schugerl et al., 1983)
that the dissolved oxygen concentration in pellets which have diameters greater than
400(j.m is reduced below the critical value in the centre o f the pellet, even w hen the
bulk medium is saturated w ith oxygen. In studies w ith P. chrysogenum, hyphae
cultivated under oxygen aeration were found to be thicker, shorter and more highly
branched than in an air-sparged system (Van Suijdam and Metz, 1981). Carter and
Bull (1971), w hen investigating the morphology o f Aspergillus nidulans, found that
abnormal morphologies, such as large, thick-walled cells, were observed at oxygen
tensions below 18 mmHg.
2.4.1.2 DILUTION RATE
Weibe and Trinci (1991) investigated the effect o f dilution rate on the m orphology o f
F. graminearium and found that, for the two strains used in the study, hyphal
diameter increased w ith increasing dilution rate. For strain A3/5, hyphal diameter
increased from 1.8|jm to approximately 2.8pm , when the dilution rate increased from
0.07h‘' to 0.19h"'. For strain C106, hyphal diameter increased from 1.7|j,m to
approximately 4.0(o,m for the same increase in dilution rate.
2.4.1.3 AGITATION EFFECTS
During cultivation in a conventional stirred tank reactor, aggregates are subject to
agitation-related effects at all times, from formation through the presence o f stable
floes, to subsequent break up. M orphology can be significantly influenced by
agitation. However, the published results are contradictory, which indicates that the
effect o f stirrer speed on fungal morphology is influenced by various parameters such
as preculture conditions, medium composition and viscosity (Schugerl et al., 1998).
For example, M akagiansar et al. (1993), working w ith P. chrysogenum, found that
12

mean hyphal length decreased with increasing agitation rate from 350jxm at 265 rpm
to 120(j,m at 1150 rpm. However, in chemostat studies o f P. chrysogenum, Van
Suijdam and M etz (1981) found that the influence o f shear stress upon the hyphal
length o f the mycelium branches was very limited. A substantial reduction in length
could be achieved only through an unpractically large increase in energy input.
Seichert et al. (1982) found that, at low impeller frequencies, A. niger form ed long
sparsely branched hyphae with thin walls while at higher frequencies, heavily
branched thick hyphae with thick walls were formed. W hen cultivated on a rotary
shaker, A. niger grew as pellets, approximately 3mm - 4m m in diameter; in baffled
flasks it grew in filaments or in spheres o f less than 1mm in diameter (M usilkova et
al., 1982). M itard and Riba (1988), also working w ith A. niger, noted that no
aggregates were observed when a rotational speed o f 1500 rpm was used.
In a study o f Streptomyces clavuligerus, it was found that increasing stirrer speed
accelerated the fragmentation rate (Belmar-Beiny and Thomas, 1991). Ohta et al.
(1995) noticed an agitation effect on the morphology o f Streptomyces fradiae, w ith
hyphal length decreasing w ith increasing agitation rate. In studies o f
Saccharopolyspora erythraea, M artin and Bushell (1996) found that particle size
distribution was significantly affected by stirrer speed, w ith mean particle diameters
o f 70jim and 124|jm recorded at 1500 rpm and 750 rpm, respectively. M cNeil and
Kristiansen (1987) found that the percentage o f yeast-like cells, as opposed to
filamentous cells, present in an A. pullulans fermentation increased from
approximately 5% to 100% when the impeller speed was increased from 100 rpm to
750 rpm. In studies o f a number o f Absidia species, Davoust and Hansson (1992)
found that a low impeller speed generally resulted in pulpy growth and that elevated
stirrer speeds caused the formation o f a more compact morphology.
2.4.1.4 pH
In filamentous organisms such as A. niger and P. chrysogenum, pH has been found to
play an important role in the overall morphology, particularly in the formation o f
pellets (M etz and Kossen, 1977). W hen studying the effects o f pH variations on the
13

morphology o f A. niger, Papagianni et al. (1994) reported that when the pH was
increased from 2.1 to 4.5, the average filament length and diameter increased from
242.2 ljim and 1.65(.im to 265.10jam and 2.54jj,m, respectively. Both McNeil et al.
(1989) and Reeslev et al. (1991) found that with A. pullulans the proportion o f yeast
like cells rose with increasing pH, in the range 3.5 - 6.3. W hen investigating the
influence o f pH on the morphology o f Streptomyces akiyoshiensis, Glazebrook et al.
(1992) observed that an initial pH o f 5.5 minimised aggregation o f the mycelium
while supporting adequate biomass production. A t pH 6.5 and above, the
suspensions consisted o f well dispersed single spores. The morphology o f S. tendae
was found to be significantly effected by pH (Vecht-Lifshitz et al., 1990). A t a pH
optimal for growth (pH 7 - 8), the average pellet diameter was 0.1mm - 0.2mm,
whereas when the pH was reduced to pH 4 the pellet diameter was significantly
larger (1.2mm - 1.5mm).
2.4.1.5 CARBON DIOXIDE
In a study on P. chrysogenum (Smith and Ho, 1985), cultivation at influent carbon
dioxide (C 0 2) concentrations o f 15% and 20% resulted in morphological
abnormalities. Swollen and stunted hyphae predominated, w ith a significant quantity
o f spherical or yeast-like cells. Ho et al. (1987) noticed a similar effect, when
cultivating P. chrysogenum, at C 0 2 concentrations o f between 0% and 8%, the
organism grew in filamentous form. In research on P. chrysogenum, Ju et al. (1991)
found that at an influent C 0 2 concentration o f 20%, the organism grew in pelleted
form. McIntyre and McNeil (1997) investigated the effects o f C 0 2 on the
m orphology o f A. niger. It was observed that, in processes w ith high dissolved C 0 2
levels, (12% and 15%), a deviation from the pelleted growth desirable for citrate
production occurred after 16 hours o f cultivation. Longer hyphae were visible
around the edges o f the pellets. The short, stubby hyphae characteristic o f citrate
production became less prevalent as the C 0 2 levels were increased.
2.4.1.6 TEMPERATUREW hile investigating the morphology o f S. tendae, Vecht-Lifshitz et al. (1990) found
that incubation temperatures o f approximately 31°C resulted in pulpy growth, while
pelleted growth was observed at incubation temperatures o f between 26°C and 30°C.
14

However, Reiehl et al. (1992b) found that temperature variations between 27°C and
37°C had no effect on the mean hyphal growth unit o f S. tendae. Lindberg and
M olin (1993) noted a considerable temperature dependency by the m orphology o f
Mortierella alpina. At temperatures o f 12°C and 18°C, stable pellets were formed,
w ith diameters o f 0.2mm and 0.4mm, respectively. A t 25°C, large pellets (10m m
diameter) were formed which exhibited mycelial growth after 24 hours o f cultivation.
In their studies on A. awamori, Schiigerl et al. (1998) observed that at a cultivation
temperature o f 25 °C, only pellets were observed. W hen the organism was cultivated
in 35°C, clumped growth predominated.
2.4.2 ENVIRONMENTAL FACTORS - CHEMICAL
The influence o f the ammonium-glucose ratio on the morphology o f A. pullulans in
continuous cultivation was investigated by Reeslev et al. (1996). The yeast-like
fraction o f the biomass was about 40% when the fermentation was nitrogen-lim ited
but was reduced to 5% - 15% when glucose-limited. A more comprehensive review
o f the effects o f m edia components on the morphology o f filamentous m icro
organisms can be found in Section 2.4.4.1.
2.4.3 ENVIRONMENTAL FACTORS - BIOLOGICAL
Tucker and Thomas (1994) investigated the effects o f inoculum spore concentration
on the subsequent morphology o f P. chrysogenum cultivated in both shake flasks and
a 6L agitated bioreactor. The study revealed that, even at the same inoculum
concentration, differences were found between the two systems in terms o f the final
morphology o f both the freely dispersed m ycelia and the mycelial aggregates.
Inocula concentrations o f greater than 105 spores mL"1 were required for the
development o f filamentous as opposed to aggregated forms. Nielsen et al. (1995)
reported that for P. chrysogenum, at high spore concentrations, hyphal elements
agglomerate and develop into large diameter pellets, but for very high spore
concentrations, above 108 spores m L '1, the final hyphal element is small and
agglomerates are not, therefore, formed. Schiigerl et al. (1998) observed that at high
inoculum spore concentrations (>105 spores m L '1), A. awamori forms filamentous
mycelia and small pellets whereas w ith low spore concentrations (102 spores m L '1)
15

large pellets are formed. It has been noted that in S. tendae, the average pellet size
decreased with increasing inoculum concentration (Vecht-Lifshitz el al., 1990),
reaching a plateau at large inoculum sizes; for example w ith an inoculum o f 101 — 104
spores m L '1, the average pellet size remained close to 1mm.
The use o f a 0.1% vegetative inoculum in the cultivation o f S. akiyoshiensis yielded
cultures with relatively large mycelial pellets (Glazebrook et al., 1992). Although
the average pellet size decreased as the inoculum size was increased, it rem ained
m uch larger than those produced from a spore inoculum.
2.4.4. MICROBIOLOGICAL FACTORS
2.4.4.1 MEDIA COMPOSITION
The simplest m ethod o f altering the growth o f any organism is to alter its food
source. The organism must adapt to changes in the nutrients available and in their
concentrations. As well as resulting in changes in growth rates, biomass
concentrations and substrate utilisation profiles, a change in nutrients can also have a
significant effect on both the macroscopic and microscopic morphology o f the
organism.
Reichl el al. (1992b) found that a reduction in glucose concentration from 40g/L to
lg /L in the cultivation medium for S. tendae, resulted in an increase in branching rate
and specific growth rate, while the apical extension rate o f individual hyphae was
unchanged. In studies with S. akiyoshiensis, Glazebrook et al. (1992) found that
glucose and lactose yielded the smallest mycelial aggregates (0.18mm and 0.2mm,
respectively).
W hen carboxymethlycellulose (CMC) was used as the sole carbon source in the
cultivation o f C. lunata, the organism formed m ycelia as opposed to the pellets
formed in the presence o f glucose (Banerjee, 1993). W hen Rhizopus arrhizus is
grown in glucose-peptone and glucose-CSL-salts media, the organism forms pellets
(Morrin and Ward, 1990). Supplementation o f these m edia with CMC or Carbopol
results in the production o f dispersed or clumped mycelial growth.
16

Joung and Blaskovitz (1985) observed a significant influence o f am monium nitrate
on the morphology o f A. niger in submerged culture. At an am monium nitrate
concentration o f 0.33g/L, pellets comprising m ycelia hyphal stems, vesicles, stigm ata
and conidial spores were observed. All m edia containing lg /L am monium nitrate
yielded only long, smooth filaments. Furthermore, m edia containing 3g/L
ammonium nitrate produced fungal mycelia which were short and branched.
Byrne and W ard (1989) studied the effect o f peptone concentration on the
morphology o f R. arrhizus and found that as the concentration was increased from
lg/L to 20g/L, the morphology changed from pelleted form to clumped mycelia.
Glazebrook et al. (1992) also examined the effects o f varying nitrogen sources on the
morphology o f S. akiyoshiensis and found that the largest mycelial aggregates,
(0.27mm), were formed when the organism was cultivated in glutamate, the smallest,
(0.07mm), with ammonium sulphate.
The formation o f yeast-like cells and yeast-like growth in A. pullulans fermentations
has been controlled by the initial concentration o f yeast extract in the m edium
(Reeslev et al., 1991). In the presence o f sufficient yeast extract the growth form was
filamentous until glucose became exhausted at the onset o f stationary phase, after
which the presence o f yeast-like cells predominated.
The effects o f the concentration o f peanut flour on the cell m orphology o f
Cephalosporium acremonium were investigated by Schiigerl et al. (1988). The
mould, which forms long hyphae, adhered to the surface o f the solid particles.
However, as the fermentation progressed, the peanut flour dissolved.
Simultaneously, the long hyphae became swollen and gradually decomposed into
spherical arthrospores.
2.4A.2 GROW TH RATE
For the dimorphic micro-organism, K. marxianus, W alker and O ’Neill (1990) found
that in aerobic liquid culture both morphology and metabolism changed in a dramatic
fashion over the course o f a growth cycle. The results indicated that, in addition to
17

oxygen availability, growth rate also influences the physiology o f the organism.
M etz and Kossen (1977) reported that the number o f pellets in chemostat cultures o f
P. chrysogenum increased with increasing growth rate. It was postulated that this
effect m ight be due to the presence o f shorter, more branched hyphae, leading to a
reduction in the interaction between hyphae and an increased likelihood o f pellet
formation.
The degree o f clumping exhibited by filamentous bacteria and fungi has been
reported to increase with the age o f the culture during the exponential phase, but
subsequently decrease as the culture enters the stationary phase (Atkinson and
Daoud, 1976).
2.5 GROW TH O PTIM ISATIO N - C ASE STU D IES
In any fermentation involving filamentous micro-organisms, a num ber o f elements
have to be taken into consideration in order to optimise the overall process. W here
appropriate a delicate balance must exist between optimal biom ass yield and
secondary metabolite production. Moreover, the effects o f growth optim isation on
the fermentation parameters and downstream processing m ust not be ignored, in
particular, the effects o f increased biom ass levels and, where relevant, viscous
extracellular products, on broth rheology.
2.5.1 Aspergillus niger
M usilkova et al. (1982) investigated the effects o f aeration on both biomass and citric
acid yields in A. niger and found that when the organism was cultivated in baffled
shake flasks, the biomass yield (13g/L) was similar to that produced in an unbaffled
shake flask (12.5g/L). Although dissolved oxygen concentrations were not
measured, the implication was that biomass production in A. niger was relatively
insensitive to aeration level as the oxygen transfer rate in baffled flasks was
estimated to be about four times that in unbaffled flasks. A similar result was
reported by Friedrich et al. (1989). However, M usilkova et al. (1982) noted that the
use o f baffled flasks caused an appreciable increase in citric acid biosynthesis.
18

Friedrich et al. (1989) noted that if, in an A. niger fermentation at maximal growth
rate, the aeration rate was increased from 0.5 to 1.2 vvm and agitation increased from
300 to 500 rpm, the depectinising activity o f the proteolytic enzymes produced was
double that obtained when the original conditions are m aintained throughout the
fermentation.
Papagianni el al. (1994) investigated the influence o f agitation on the production o f
citric acid by A. niger. In these studies it was noted that as the agitation rate in the
bioreactor was increased from 100 rpm to 300 rpm, citric acid production increased
to a maximum value and was not further affected by increasing agitation rate.
McIntyre and McNeil (1997) studied the effect o f carbon dioxide concentration on
biomass and citrate yields by A. niger. It was observed, in this study, that as the inlet
C 0 2 concentration was increased from 0% to 3%, the yield factor for biomass
decreased from 0.141 to 0.120g biomass/g substrate. As the concentration was
further increased to 12% the Yx/s increased to a maximum value o f 0.234. Further
increases in C 0 2 concentration led to a reduction in the biomass yield. The
maximum product yield, 0.643g product/g substrate, was observed at 5% C 0 2 while
the minimum, 0.290, occurred at 12% C 0 2.
In studies on the production o f citric acid by A. niger, Papagianni et al. (1994) found
that increasing pH reduced citric acid production rates: at pH 2.1 the citric acid yield
was 60.52 g/L, whereas at pH 4.5, the yield was 11.73 g/L.
Friedrich et al. (1990) studied the effects o f inoculum size on both biomass
concentration and proteolytic enzyme production by A. niger, using the Apple Juice
Depectinising Assay. It was observed that biomass levels were unaffected by
inoculum size. However, as the inoculum size was increased from 100 spores/L to
108 spores/L, the final proteolytic enzyme activity decreased from 60 U/mL to 30
U/mL.
19

M cIntyre and M cNeil (1997) observed that citrate production in A. niger began only
after all nitrogen was utilised in the fermentation medium. Friedrich el al. (1990)
reported that while biomass levels in A. niger fermentations were unaffected by the
presence o f potassium hexacyanoferrate II - trihydrate (KHCF), supplem entation
with KHCF doubled the proteolytic enzyme concentration compared to the
concentration in unsupplemented medium.
2.5.2 Aureobasidium pullulans
A. pullulans is capable o f growing and synthesising pullulan on a wide range o f
carbon sources, although sucrose and glucose support the highest yields (Seviour et
a l, 1992).
W hen studying the effect o f C: N ratio on the morphology and productivity o f A.
pullulans, Reeslev et al. (1996) noted that as the feed concentration o f am monium
sulphate was increased from 0.3g/L to 1.45g/L the steady state concentration o f
biomass increased from 1.9g/L to 7.0g/L. W hen the am m onium concentration was
further increased, subsequent increases o f biomass were achieved at the expense o f
pullulan productivity. It was concluded that nitrogen is a limiting nutrient. It was
also observed that if the fermentation was nitrogen-limited, the pullulan productivity
was 36 mg/g/h; no exopolysaccharide production was observed when the system was
glucose-limited.
The formation o f exopolysaccharides by A. pullulans is known to be affected by the
initial concentration o f yeast extract in the medium (Reeslev et al., 1991). The
product yield decreases as yeast extract concentration increases. In continuous
culture, the highest rates o f polysaccharide production by A. pullulans occurred under
conditions o f nitrogen-limitation and constant dilution rate, at a pH o f 4.5 (Seviour et
al., 1992).
Reeslev et al. (1991) investigated the effect o f pH on the production o f
exopolysaccharides by A. pullulans and found that product yield at pH 3.5 is nearly
double that at pH 6.5. However, there appears to be no link between culture pH and
20

the rate o f ethanol production by A. pullulans (Madi et al., 1996).
The final biomass level in batch cultures o f A. pullulans increased from 4.5g/L to
6.5g/L as the operating pressure was increased from 0 M Pa to 0.5 M Pa (Dufresne et
al., 1990). A t a pressure o f 0.8 MPa, the final biomass levels decreased sharply to
0.5g/L and remained at this value for all higher pressures investigated. The pressure
exerted on the system also influenced pullulan production. The quantity o f pullulan
produced increased as the pressure was increased from 0.1 M Pa to 0.65 M Pa, to a
maximum value o f 13.75g/L. This effect was attributed to increased oxygen transfer
rates at higher pressures. Beyond this critical pressure the pullulan concentration
decreased sharply to l.Og/L. The authors postulated that this was due to the
competing effects o f oxygen availability and pressure inhibition.
2.5.3 Streptomyces akiyoshiensis
In a wide-ranging study o f S. akiyoshiensis, Glazebrook et al. (1993) investigated the
effects o f m edium composition, pH and inoculum size on system performance. The
highest biomass yield was obtained using asparagine as the nitrogen source; the
lowest yields were obtained w ith ammonium sulphate. The production o f 5-hydroxy-
4-oxonorvaline (HON) by S. akiyosheinsis is also greatly influenced by the choice o f
nitrogen source. Potassium nitrate or aspartic acid resulted in optimal HON
production (4.5mM and 4.0mM, respectively); with asparagine or am monium
sulphate, a HON concentration o f 0.1 m M was obtained.
The choice o f carbon source is influenced by the nitrogen source em ployed and
starch appears to be the optimal carbon source for the production o f HON, (5.6mM),
by S. akiyoshiensis, when cultivated with K N 0 3 (Glazebrook et al., 1993). However,
using aspartic acid as the nitrogen source, glucose was found to be optimal (4.2mM
HON produced).
S. akiyoshiensis optimally produces HON (17 mM) after 7 days at pH 7.2, whereas at
pH 5.7 and pH 6.0 the HON concentration is less than 5 mM.
21

Glazebroolc et al. (1993) also observed that the production o f HON becom es more
rapid w ith increasing vegetative inoculum levels. However lower production rates
allowed a higher product yield (e.g. 13.9 m M compared to 12.5 m M produced during
rapid growth).
2.5.4 Streptomyces armentosus
He et al. (1995) extensively investigated the effects o f medium com position on
biomass yields and secondary metabolite production by S. armentosus. Starch
yielded the highest biomass concentrations (6.1g/L) w hile the lowest level (2.4g/L)
was observed with galactose. W hen starch was used as the carbon source, the
armentomycin yield was double that obtained with other carbon sources.
Biomass production by S. armentosus also appears to be affected by the choice o f
nitrogen source used in the cultivation medium and the highest level (6.7g/L) was
observed when cultivated with lysine. Armentomycin yields were highest when
either lysine, alanine or glycine were used as the nitrogen sources.
A n initial phosphate concentration o f 3mM in S. armentosus fermentations gave the
highest armentomycin titre; increasing the phosphate concentration beyond this value
lowered the titre, but the reduction was not significant.
2.5.5 Mortierella alpina
Lindberg and M olin (1993) studied the influence o f a number o f param eters on
production formation by M. alpina. It was found that biomass was unaffected by
glucose levels. Optimisation o f the production o f arachidonic acid (AA) was found
to be dependent on glucose-limitation. W hen the organism was cultivated at 18°C
the production o f AA was significantly improved if glucose was lim ited (57% of
total fatty acids present in glucose-limited cultures as opposed to 33% w ith excess
glucose). A similar trend was observed when the organism was cultivated at 25°C,
w ith AA constituting 44% o f total fatty acids in glucose-limited cultures compared to
30% w ith excess glucose.
22

Lindberg and M olin (1993) also investigated the effect o f pH and incubation
temperature on the biomass yields o f M. alpina. It appears that the optim um pH for
the cultivation o f the organism is 6.5, yielding a dry weight o f 23g/L. I f the pH is
further increased, the biomass yield decreases and growth ceases when the pH
reaches 8.5. It was observed that the time taken to reach a biom ass concentration o f
21g/L increased from 45 hours at 25°C to 138 hours at 12°C. The percentage o f
arachidonic acid (AA) produced by M. alpina in fermentation was also found to be
affected by pH, increasing from 26% o f total fatty acid content at pH 5.5 to 31% at
pH 6.5.
The proportion o f AA produced was also shown to be temperature dependent, w ith
an optimum temperature o f 18°C (32% AA), dropping to 30% at 25°C and to 24% at
12°C. These cultures were cultivated in non-limited nutrient conditions.
2.5.6 Amycolatopsis orientalis
A. orientalis appears to be affected by the phosphate concentration in the m edium
(McIntyre et al., 1996). As the phosphate concentration increases from 2m M to
4mM, the final biomass concentration increases from approxim ately 8.5g/L to
9.9g/L. Further increases to 8mM yield a biomass level o f 8.75g/L. The m aximum
specific production rate o f vancom ycin (0.45 mg/g.h) was obtained at the lowest
phosphate feed concentration investigated (2 mM).
M cIntyre et al. (1996) also studied the effect o f dilution rate on biomass
concentrations o f A. orientalis. Biomass yields remained unchanged as the dilution
rate was increased from 0.02h"’ to 0.09h"’ in phosphate-limited chem ostat cultures.
However the biomass decreased dramatically as the dilution rate was further
increased to 0 .14h *. In the case o f glucose-limited chemostat cultures, a similar
effect was observed except that as the dilution rate was increased from 0.02b'1 to
0.09h"‘, biom ass levels increased slightly. It was observed that in phosphate-limited
chemostat cultures, the m aximum vancomycin production rate (0.37 mg/g/h)
occurred at a dilution rate o f 0.087h"’. A similar trend was also apparent when the
fermentations were operated under glucose-limited conditions, although the
23

corresponding maximum vancomycin production rate (0.12 mg/g/h) was three times
lower than under phosphate-limited conditions.
Clark et al. (1995) reported that vancomycin was produced by A. orientalis only if
oxygen limitation was prevented.
2.5.7 Streptomyces griseoflavus
El-Abyad el al. (1994) performed a number o f studies on the effects o f medium
com position and medium supplementation on both biom ass and product formation
by S. griseoflavus. Asparagine was found to be the optimal nitrogen source for
biomass production. However, ammonium nitrate proved to be the m ost favourable
nitrogen source for the production o f indole-3-pyruvic acid (IPYA), yielding
9.5mg/L. Supplementation o f nutrient media with a num ber o f indole compounds
affected biomass production; maximum biomass levels were obtained using
indoleacetic acid (0.8g/L) and minimum levels with tryptophan (0.12g/L). It was
also observed that when nutrient medium was supplemented with NaCl (7g/L) the
final IPYA concentration increased 6-fold to a value o f 13.37mg/L. Supplementation
o f the m edium with indole compounds reduced IPYA production in all cases, with
the m ost dramatic reduction, from 2mg/L to 0.25mg/L observed on addition o f indole
acetamide.
2.5.8 Streptomyces antibioticus
Haque et al. (1995) found glycerol to be the best carbon source, in studies on the
optimisation o f the cultivation o f S. antibioticus. In this case, arginine was the best
nitrogen source for the optimisation o f both biomass and antibiotic production.
Glycerol was also found to promote synthesis o f a broad-spectrum antibiotic
resulting in an inhibition zone o f 24m m in plate cultures o f E. coli. The same
workers reported an optimal pH o f 6.8 for antibiotic production, w ith minimal
production at pH 6.0.
24

2.5.9 Streptomyces clavuligerus
S. clavuligerus was found to grow best when glycerol was used as the carbon source,
while the most effective nitrogen sources were glutamate, glutamine and histidine
(Vining et al., 1987). Cephamycin production by S. clavuligerus was also m onitored
in this study and it was noted that succinate resulted in a cephamycin titre (65mg/L)
over twice that observed with maltose (32mg/L) and three times that observed w ith
glycerol (20mg/L). Trypticase soy broth as a nitrogen source resulted in 142mg/L
cephamycin; the lowest titre, 22mg/L, was observed w ith urea.
Brana et al. (1986) also noted, in studies w ith S. clavuligerus, that the production o f
cephalosporins in a chemically defined medium was strongly influenced by the
nature o f the nitrogen source used. Some amino acids such as proline (0.8 units
antibiotic/mg biomass) and arginine (0.9 units/mg biomass) inhibited antibiotic
production. The optimal nitrogen sources for the production o f cephalosporins are
asparginine (25 units/mg) and aspartate (22.9 units/mg). Biomass production (3.4
g/L) in these fermentations was optimal when histidine was used; those nitrogen
sources which result in low antibiotic production also result in poor biom ass
concentrations.
Production o f cephamycin and clavulanic acid by S. clavuligerus is controlled by
phosphate concentrations in the medium (Lebrihi et al., 1987). In the presence o f
2mM phosphate, the levels o f cephamycin (60mg/L) and clavulanic acid (80mg/L)
were higher than in the presence o f 75mM phosphate, w ith concentrations o f
approximately 10mg/L o f both products under the latter conditions. The phosphate
inhibition o f cephalosporin production was also noted by Lübbe et al. (1985).
Production o f cephalosporin was reduced from 0.062 g/L to 0.028 g/L, when the
phosphate concentration was increased from 20 mM to 100 mM ; biomass levels were
observed to be unaffected.*
W hen 130 pg/mL of ferrous iron was added to the fermentation medium for S.
clavuligerus, the production o f cephamycin C increased from 98 fig/mL to 200
|ig/m L (Rollins et al., 1987).
25

W hen cultivated in a 7L STR, biomass concentrations by S. clavuligerus were lower
at 490 rpm than at either 990 rpm or 1300 rpm (Belmar-Beiny and Thomas, 1991).
This may have been due to the levels o f dissolved oxygen in the broth. It was noted
that w ith the higher agitation rates, the dissolved oxygen did not fall below 90%.
However, when an agitation rate o f 490rpm was used, the dissolved oxygen tension
fell to 60% saturation.
2.5.10 Rhizopus arrhizus
Byrne and Ward (1989) found that, during the cultivation o f R. arrhizus, as the
peptone concentration was increased from l.Og/L to 20.0g/L the biomass level
increased from 0.45g/L to 4.95g/L. A t a constant initial peptone level o f 5g/L, when
the glucose concentration was increased from 5g/L to 45g/L, the dry w eight
increased from 1.75g/L to 1.95g/L. The nitrogen source had a greater effect on
biomass yields than other components in the medium.
M orrin and W ard (1990), also studying the cultivation o f R. arrhizus, noted that
supplementation o f the medium w ith CMC promoted production o f biomass at the
expense o f fumaric acid. Supplementation o f a glucose-peptone medium w ith CMC
increased fumaric acid production from 1.78g/L to 5.36g/L. However, fumaric acid
levels were considerably reduced (from 1.78g/L to 0.92g/L), on the supplementation
o f the medium w ith Carbopol.
2.5.11 P R O D U C T O P T IM IS A T IO N STU D IES
The productivity o f C. acremonium has been shown to increase w ith increasing
peanut flour concentration (Schiigerl et al., 1988). Cephalosporin C concentrations o f
5.5 - 6.0 lcg/m3 were obtained at a flour concentration o f 30 kg/m 3. A t a flour
concentration o f 100 kg/m3, the Cephalosporin C concentration increased to 10 - 11
kg/m 3. I f the oxygen partial pressure did not drop below 20% o f the saturation value,
then no oxygen limitation occurred.
Kaiser et al. (1994) found that biomass production in submerged cultivation o f
Streptomyces parvulus was adversely affected by high dissolved oxygen
26
concentrations. Increasing dissolved oxygen concentration to an equivalent o f 1260
mbar did not effect biomass concentration. However, w hen the dissolved oxygen
concentration was increased further to an equivalent o f 2205 mbar, the observed
biomass concentration decreased by 40%. Also the production o f m anumycin also
decreased with increasing dissolved oxygen concentration. As the dissolved oxygen
level increased from 305 mbar to 1670 mbar (partial pressure), the production o f
manumycin decreased from 27 mg/L to 2.5 mg/L.
It was observed that the production o f erythromycin by S. erythraea was unaffected
by oxygen limitation; production continued even at an oxygen concentration o f 0%
(Clark el al., 1995). Investigations into the effect o f agitation on the production o f
erythromycin by S. erythraea indicated that at an agitation rate o f 1500 rpm,
production was lower than at 750 rpm, with yields o f 0.867 m g/m g biom ass and
0.913 mg/mg biomass, respectively (Martin and Bushell, 1996). Lynch and Bushell
(1995) found that the production o f erythromycin in S. erythraea was signifir.ant.1y
enhanced in cyclic fed batch culture (maximum production - 75 mg/L) compared to
batch culture (maximum production - 40 mg/L). Chem ostat culture resulted in
reduced production with m aximum levels (10.36 mg/L) at a dilution rate o f 0.04h"'.
As the dilution rate increased, the productivity fell.
Priede et a l (1995) investigated the growth o f Fusarium moniliforme (a.k.a.
Gibberella fujikuroi) in two dissimilar stirred bioreactors, nam ely STRs equipped
with a turbine mixing system (TMS) and a counterflow mixing system (CMS). The
agitator speed in the CMS was adjusted to yield the same specific power input as in
the TMS. Thus, the agitator speed in the TMS was varied between 200 rpm and 300
rpm, and in the CMS between 410 rpm and 565 rpm. It was found that the levels o f
Gibberellic acid (GA) produced were significantly higher in the TMS (380 mg/L),
than in the CMS (270 mg/L). While traces o f GA were produced before exhaustion
o f nitrogen from the medium, the onset o f significant production corresponds to full
nitrogen depletion (Vass and Jefferys, 1979). W ith regard to the influences o f
temperature, it was reported that the maximum specific growth rate occurs at 31°C,
decreasing rapidly at higher temperatures and less rapidly at lower temperatures. The
27

specific growth rate is independent o f pH in the range 4 - 6 . However, moving
outside this range causes a reduction in the specific growth rate (Vass and Jefferys,
1979).
2.6 THE SUBSEQ UENT EFFECTS OF GROW TH OPTIM ISATION
The behaviour o f fermentation broths is o f considerable importance, from the
viewpoint o f cellular kinetics and in the engineering design o f fermenters. The
economic cost o f a fermentation process can be greatly increased by allowing the
viscosity o f the fermentation broth to increase unchecked. The power input required
to effectively agitate the broth and to ensure adequate gas transfer, and the cost o f
downstream processing in the recovery o f the final product, are both increased
beyond economic viability by highly viscous pseudoplastic fermentation broths
(Charles, 1978). The rheological characteristics o f fermentation broths m ust be
monitored carefully throughout the course o f the fermentation and if possible,
manipulated to yield the most suitable compromise between biomass yields and
economic considerations. Another consideration in the fermentation process is
possible feedback inhibition occurring due to the accumulation o f the product o f
interest in the fermentation broth. Both o f these factors are further discussed in this
section.
2.6.1 R H E O L O G Y
2.6.1.1 EFFECTS OF MORPHOLOGY AND BIOMASS ON RHEOLOGY
The concentration and the morphological state o f the mycelium normally determine
the rheological properties o f mycelial fermentation broths. High biomass
concentration will, in general, lead to high viscosity (Olsvik and Kristiansen, 1994).
However, describing viscosity as a function o f biom ass concentration alone is of
limited value, as process variables such as dissolved oxygen and specific growth rate
have been shown to influence the relationship between the biomass concentration and
the consistency index (Olsvik and Kristiansen, 1992a; 1992b). Moreover, factors
such as hyphal-hyphal interactions, which are difficult to quantify and which may
28

vary with fermentation conditions, impacting upon rheology, (Van Suijdam and
M etz, 1981).
Roels et al. (1974) proposed a correlation between morphology and rheology. This
correlation introduced a morphology factor, 5, defined as:
i ' 6 ■ (c, y ■ cir (l ^'til0.5 >
3 ' P m\
V ) /
where C, is a flexibility constant, Cw is the ratio o f mycelial wet to dry weight, lin is
the length o f a mycelial thread, pm is the mycelial density, dm is the hyphal diameter.
The value o f 8 was found to depend on the ratio o f mycelial length to diameter, or
more generally, its morphology. Using a Casson m odel to describe the rheological
behaviour o f such broths, it was assumed that both kc and t 0 5 (Casson parameters)
were functions o f the volume fraction o f the mycelial particles, and thus o f biomass
concentration and the morphology factor. In a review o f the work o f Roels et al.
(1974), M etz et al. (1981) concluded that, although the introduction o f the
m orphology factor was o f great value, the correlation presented in equation (2.1)
could not be used for the following reasons:
• Network interaction between the branched hyphae is neglected.
• The hyphae are treated as flexible chains and are supposed to form a spherical
coil. This is in conflict with microscopic observations.
• The assumption inherent in the Casson model, that the coils present in the form o f
‘rouleux’ orientated at 45° to the direction o f flow, is questionable.
• The randomising effect o f the Brownian motion, essential for the validity o f
polym er rheology theories, is essentially absent in mould suspensions.
In studies o f A. niger broths, Fatile (1985) observed power-law (pseudoplastic)
behaviour and showed that the power-law constants could be related to biomass
concentration and the shape o f the mycelial aggregates. M itard and Riba (1988), also
working with A. niger, showed that the size and peripheral structure o f the pellets
clearly had an impact on the rheology o f the fermentation suspension.
29

From studies o f C. acremonium, Kim and Yoo (1992) proposed a correlation for the
consistency index, which could be estimated from the cell concentrations
corresponding to different morphological types. Theoretical values o f consistency
index derived from the correlation were in close agreement with experimental values.
W ith the use o f image analysis, Packer and Thomas (1990) showed that in
submerged culture, P. chrysogenum existed as clumps, which could not be easily
disrupted by dilution. They suggested that in such cases the hyphal dim ensions o f
free mycelia might influence the broth viscosity to a lesser extent and that the
rheological properties o f the broth could be correlated w ith morphological
parameters describing the size and shape o f these clumps. Similar conclusions were
reported for P. chrysogenum by Tucker et al. (1993) and for A. niger by Olsvik et al.
(1993). In both cases, it was found that the power law consistency index could be
correlated with biomass concentration and the roughness factor o f the clumps.
During studies on the fermentation characteristics o f Trichoderma harzianum,
Serrano-Carreon et al. (1997) observed that the morphological development o f the
organism appeared to influence the rheological properties o f the broth. As the
fermentation progressed, the viscosity increased, despite a reduction in biom ass
concentration. The authors postulated that the increased viscosity was related to
changes in hyphal flexibility and hyphal-hyphal interactions, although no
corroborating quantitative data were available.
Tucker and Thomas (1993) found that the rheological parameters o f P. chrysogenum
broths correlated well with two morphological variables: mean clump compactness
and roughness. The following generalised correlation was proposed:
RP = constant * Cma * (roughness)P * (compactness)T (2.2)
where RP represents rheological parameters (e.g. K and n), Cm is the biomass
concentration and a , (3, and F are constants. Values for the relevant param eters were
presented for P. chrysogenum broths but the model has yet to be applied to other
systems.
30
In order to relate rheological behaviour to cell morphology for broths o f Aspergillus
awamori, Ruohang and Webb (1995) derived two empirical correlations, where the
only variable was cell concentration. This approach is obviously very attractive in
that it allows for simple broth rheology prediction during the ferm entation process;
conversely, biomass concentration could be inferred from rheological measurements.
However, such correlations seldom have widespread applicability. Queiroz et al.
(1997) attempted to correlate biomass concentrations in A. awamori fermentations
with the rheological characteristics o f the broth. It was observed that the flow
behaviour index, n, was less affected by initial substrate concentration than the
consistency index, K. As the biomass concentration increased throughout the
fermentation, the broth became pseudoplastic, exhibiting a considerably increased
apparent viscosity. This trend reflected the predominance o f the filamentous, as
opposed to pelleted, growth form. It was noted that the m ost significant increases in
K occurred when the biomass concentration was in the range 4 - 1 2 g/L, the upper
limit corresponding to carbon source exhaustion.
In a study o f P. chrysogenum, Liu and Yu (1993) found that two o f the
morphological parameters inferred from rheology measurements (8, defined by the
Casson model, and 8*, defined by intrinsic viscosity) varied systematically w ith broth
age and with the morphology which was microscopically observed. Because
different fermentations require different growth morphologies for optimum product
yield, and the morphology o f mycelial broths varies w ith broth age, it was suggested
that these morphological parameters might be used to quantitatively represent the
morphology o f mycelial broths.
Despite the proliferation o f combined rheological and morphological studies on
specific fermentation systems, the rheological characteristics o f a fermentation broth
cannot always be related to the cell morphology. For example, W arren et al. (1995)
found no relationship between broth rheology and cell morphology in studies o f three
actinomycetes, Streptomyces rimosus, S. erythraea and Actinomadura roseorufa.
31

2.6.1.2 EFFECTS OF RHEOLOGY ON DOWNSTREAM PROCESSING
As observed in Section 2.6, the rheological characteristics o f a fermentation broth
can impact significantly on downstream processing operations. One example o f this
is the production o f viscous polysaccharides e.g. pullulan, dextran, and xanthan gum
(McNeil and Harvey, 1993).
Separation o f micro-organisms from high viscosity fermentation broths is difficult
and time-consuming using conventional methods. W hile studying A. pullulans as a
source o f pullulan, Yamasaki et al. (1993a, 1993b) attempted to use cross-flow
membrane filtration to isolate the organism from the fermentation broth. A. pullulans
assumes two different morphologies and their findings showed that the yeast-like
form (which produces pullulan) was suited to cross-flow filtration in term s o f both
permeation flux and transition o f pullulan. W ith this knowledge, the fermentation
conditions could be optimised both to increase pullulan production and to improve
the separation o f biomass from the pullulan. I f this were attempted for other viscous
fermentation broths, more production processes might become feasible and viscosity-
related problems could be minimised during the recovery stages (Yamasaki et a l,
1993a, 1993b).
2.6.2 B IO C H E M IC A L E F F E C T S
Biosynthesis o f many antibiotics is known to be sensitive to accumulation o f the
antibiotic. For example, during studies o f josam ycin production by S. narbonensis,
Eiki et al. (1988) observed that mycelial growth and josam ycin production were
interrupted concomitantly in the course o f the fermentation even when sufficient
glucose was provided. The organism was examined for antibiotic sensitivity and it
was noted that mycelial growth was inhibited on the addition o f 0.25 - 0.4 mg
josam ycin/mL broth. This growth inhibition could be partially reversed in a slightly
acidic environment and with the addition o f yeast extract and magnesium phosphate.
Xylanase production by a selection o f actinomycetes was also found to be subject to
end-product inhibition (Ball and McCarthy, 1989). W hen Streptomyces viridifleans
32

is cultured in m edia containing glucose, production o f chitinase is subject to both
end-product inhibition and catabolite repression (Gupta et al., 1995).
2.7 SUMMARY
On the basis o f the work reviewed here, it can be seen that it is o f crucial im portance
to be able to understand and predict the complex relationships that exist betw een the
morphological development o f a filamentous organism and accumulation o f both
biomass and metabolites o f interest. O f equal importance is the need to predict the
effect that both morphology and biomass can have on broth rheological
characteristics and downstream processing requirements. Despite this importance,
very few authors have taken both morphology and rheology simultaneously into
consideration simultaneously when studying filamentous microorganisms.
In relation to the optimisation o f secondary metabolite production, both rheological
and biochemical effects must ideally be taken into consideration as w ell as the
influence o f changes in media components or the fermentation param eters on the
biomass, morphology and growth characteristics o f the organism. A delicate
compromise m ust be achieved between these varying factors in order that any
fermentation involving microorganisms is truly optimised.
33

CH APTER 3
M ATERIALS AND EXPERIM EN TAL M ETH O DS
3.1 THE ORGANISMS
The organism used for all studies was Streptomyces natalensis, NCIM B num ber
10038 (NCIMB Ltd., UK). This organism is also listed as ATCC 27448 (American
Type Culture Collection, USA), CBS 700.57 (Central Bureau Voor Schimellcultures,
Holland) and NRRL 2651 (Northern Research Laboratory, USA). The organism was
obtained as a freeze-dried culture and was resuspended in liquid medium. Both plate
and liquid cultures were established using the resuspended organism.
3.2 A UTOCLA VING PROCEDURE
Both solid and liquid media were sterilised by autoclaving in a Tomy SS-325
autoclave (Tomy Seiko Ltd., Japan), at 121°C (15psi) for 15 minutes.
3.3 MEDIA
The components for all media were dissolved in deionised water.
3.3.1 M A IN T E N A N C E M E D IA
The organism was maintained on both Oatmeal and YEPD agar plates. The
components and relevant concentrations for both media are shown in Table 3.1.
3.3.2 IN O C U L U M P R E P A R A T IO N M E D IU M
As recommended by Struyk and W aisvisz (1975), the organism was cultivated in
liquid culture medium prior to inoculation o f the fermentation media, to ensure
adequate biomass for inoculation. The concentrations o f the relevant components o f
this medium are shown in Table 3.2. Prior to autoclaving, the m edium was filtered
through W hatman No. 1 filter papers using a Buchner funnel apparatus to remove
any particulate matter.
34

Table 3.1 Solid m edia formulation
M edium C om ponen t M a n u fa c tu re r 1C o n cen tra tio n (g/L)
Oatmeal agar Oatmeal (food grade) Flahavans and Sons 30
(Waterford, Ireland)
Technical agar No. 3 Oxoid 20
(Basingstoke, U K )
YEPD agar Yeast extract Oxoid 10
Bacteriological peptone Oxoid 20
Glucose monohydrate B D H 20
(Poole, U K )
Technical agar No. 3 Oxoid 10
T ab le 3.2 Inoculum preparation medium
C om ponen ts M a n u fa c tu re r C o n cen tra tio n (g/L)
Glucose monohydrate BD H 10
Sodium Chloride M erck (Germany) 10
Bacteriological Peptone Oxoid 5
Corn Steep Powder Merck 3
3.3.3 F E R M E N T A T IO N M E D IA
3.3.3.1 YEPD LIQUID MEDIUM
The components and concentrations used in the formulation o f this medium are
described in Table 3.1. Technical agar No. 3 was omitted from the liquid medium.
3.3.3.2 PRODUCTION MEDIUM
The components o f the production m edium are shown in Table 3.3. The majority of
m edia used were based on this production medium formulation which was used by
both M ahon (1990) and McCabe (1990). The variations employed during media
studies are described in Chapter 4.
3.3.3.3 UNBUFFERED MEDIUM
This m edium was formulated as described in Table 3.3 w ith the omission o f calcium
carbonate.
35

Table 3.3 Production medium formulation
Component Manufacturer Concentration (g/L)
Glucose monohydrate BDH 30
Corn steep powder Merck 1
Ammonium sulphate BDH 5
Potassium chloride Riedel-de Haën (Germany) 4
Potassium dihydrogen phosphate May and Baker (Dagenham, UK) 0.2
Calcium carbonate Riedel-de Haën 8
3.3.3.4 BUFFERED MEDIA
A num ber o f bu ffe red m ed ia were em ployed, based on the fo rm u la tio n o f the
p ro d u c tio n m ed ium , described in Tab le 3.3. in a ll cases, the ca lc ium carbonate was
replaced w ith a phosphate b u ffe r (Tab le 3.4). A fte r the re leven t com ponents were
d isso lved in deionised water, each so lu tion was filte re d as described in Section 3.3.2,
to rem ove res idua l pa rticu la te m atter. The concentrations o f the com ponents o f these
m edia w ere varied in m edia studies.
3.3.3.5 PEPTONE MEDIUM
The fo rm u la tio n o f th is m ed ium is as described in Tab le 3.3 w ith am m on ium
sulphate substitu ted w ith an equal concentra tion o f peptone, 5g /L .
Table 3.4 Phosphate buffer formulation (made up to 1L)
Com ponent M anufactu rer M olarity C oncentration (mL/L)
Sodium hydroxide Merck 0.2 M 500
Sodium dihydrogen phosphate Riedel-de Haen 0.2 M 300
Deionised water 200
3.3.3.6 CARBONATED MEDIUM TYPE 1
T h is m ed ium is as described in Table 3.3, w ith the ca lc iu m carbonate rep laced w ith
8g /L sod ium carbonate (R iede l-de Haen).
36

3.3.3.7 CARBONATED MEDIUM TYPE 2
Th is m ed ium is as described in Table 3.3, w ith the ca lc ium carbonate replaced w ith
8g /L o f sod ium hydrogen carbonate (R iede l-de Haen).
3.3.3.8 ACTINOMYCETE MEDIUM
Th is m ed ium is as described by Sarra el al. (1996). The com ponents are de ta iled in
Table 3.5.
Table 3.5 Formulation of Actinomycete medium (Sarra et al., 1996)
Com ponent M anufactu rer C oncentration (g/L)
Glucose monohydrate BDH 40
Yeast extract Oxoid 6
Bacteriological peptone Oxoid 4
Glycine Riedel-de Haën 2
MgS04.H20 May and Baker 0.50
KH2PO4 May and Baker 0.68
3.4 CULTIVATION OF THE ORGANISM
3.4.1 CU LTIVA TIO N ON SOLID M EDIA
The organ ism was m ain ta ined on bo th Y E P D and Oatm eal agar plates. S ubcu ltu ring
was pe rfo rm ed on a fo r tn ig h tly basis to ensure v ia b le vegeta tive cultures. The
o rgan ism was m a in ta ined on O atm eal plates and was cu ltu red on Y E P D was to
ind ica te tha t the fe rm en ta tion was uncontam inated. Each in o cu lu m sam ple was also
exam ined m ic ro sco p ica lly fo r con tam ina tion p r io r to use.
3.4.1.1 YEPD AGAR
A loop fu l l o f ce lls was taken fro m a stock p late and aseptica lly streaked onto a fresh
Y E P D plate. These plates w ere then incubated at 30°C fo r 4 days and stored at 4°C.
A fte r in o cu la tin g liq u id m ed ium w ith these plate cultures, i t was fo u n d tha t the
v ia b il i ty o f the organ ism was adversely a ffected after 2 weeks.
37

3.4.1.2 OATMEAL AGAR
A 3 mL aliquot of sterile Ringers solution was used to suspend a lawn of the
organism taken from a maintenance plate and 1 mL of this suspension was then used
to inoculate a fresh plate. These plates were incubated at 30°C for 4 days for
vegetative growth and for 14 days for spore formation. Vegetative growth results in
a creamy yellow lawn of growth. A characteristic grey colour indicates the presence
of spores. These plates were then stored at 4°C.
3.4.2 SH A K E F L A S K C U LT U R E S
All shake flask cultures were grown in 250 mL Erlenmeyer flasks, containing
between 50 and 150 mL of medium as specified. The flasks were incubated at 30°C
and at a rotational speed of 180rpm on a two-tier LH engineering orbital shaker, with
a throw of 50 mm. Cotton wool bungs were used to close the flasks and prevent
contamination, while still allowing an oxygen supply to the organism.
3.4.2.1 INOCULUM SHAKE FLASK CULTURES
For inoculum cultures, 50 mL aliquots of inoculum preparation medium were placed
in 250 mL Erlenmeyer flasks and inoculated with 1 mL of suspended culture from an
Oatmeal maintenance plate. The flasks were incubated for 96 hours under the
conditions described in Section 3.4.2. Similar conditions were employed by Mahon
(1990).
3.4.2.2 SHAKE FLASK FERMENTATIONS
For all fermentations, with the exceptions of the volume study cultures, 100 mL
aliquots of a fermentation medium were placed in 250 mL Erlenmeyer flasks and
each inoculated with 5 mL from an inoculum culture. The flasks were then incubated
for up to 8 days at 30°C on an orbital shaker (180rpm). In the case of volume study
fermentations, 50 mL, 100 mL and 150 mL aliquots were variously employed. The
inoculum volume was scaled accordingly. These flasks were incubated in the same
manner as all others.
3.4.3 1L S T R F E R M E N T A T IO N S
In these fermentations, the organism was cultivated in a baffled ‘Micogen’
fermentation pot. Air was supplied to the fermentation broth by an aquarium air
38

pump (Interpet Ltd., Surrey, U.K.). Prior to being introduced to the broth the air was
filtered through a sterile air filter. The aeration rate in all cases was 0.75vvm (based
on initial broth volume) and air was introduced by a sparger, centrally positioned, 1
cm below the impeller. Temperature control was implemented using a circulating
water bath with the water circulated through the vessel baffles. A working volume of
800 mL was used. The medium was autoclaved in the glass fermentation pot (New
Brunswick Scientific Ltd.), by placing the vessel (including associated air filters) into
the Tomy SS-325 autoclave, at 121°C (15psi) for 20 minutes. Agitation was
implemented using a Biolafitte agitator motor, coupled to a shaft fitted with a turbine
impeller. The organism was cultivated for up to 10 days and the broth was sampled
on alternate days. Further details on the design of the fermenter are provided in
Table 3.6.
T ab le 3.6 Configuration of the 1L fennenter
Vessel diameter (T) (cm) 10.50
Liquid height (H) (cm) 9.25
Impeller diameter (D) (cm) 4.75
Clearance of impeller above base (cm) 2.00
D/T 0.45
H/T 0.91
3.4.4 10 L IT R E FE R M E N T A T IO N S
A 10L “Micogen” fermenter was also used for batch fermentations and had one
major advantage over both shake flask and 1L STR work. Due to the large culture
volume, samples could be taken without significantly reducing the culture volume.
This removed the risk of flask-flask variations encountered with shake flask work,
and increased the accuracy of the data collected.
3.4.4.1 FERMENTER CONFIGURATION
The fermenter used was a 16L stainless steel vessel equipped with a self-sterilising
sample port at the base. Agitation was supplied by a belt driven stainless steel shaft,
on which three Rushton turbine impellers were mounted. Aeration was supplied via
39

a nozzle sparger centrally positioned below the bottom impeller. Further details are
provided in Table 3.6.
T ab le 3.7 Configuration of “Micogen” fermenter
Vessel diameter (T) (cm) 22.0
Height of the liquid (H) (cm) 26.5
Impeller diameter (D) (cm) 7.50
Clearance of lowest impeller above base (cm) 7.00
Impeller spacing on shaft (cm) 10.00
D/T 0.34
H/T 1.20
3.4.4.2 FERMENTATION SETUP AND STERILISATION
Prior to use, the vessel was cleaned thoroughly and rinsed with deionised water. 1OL
of prepared medium was then added through one of the access ports on the top-plate.
10 mL of silicone antifoam was added prior to sterilisation in the fermenter. The
dissolved oxygen probe (Mettler Toledo) polarised according to manufacturers’
instructions was inserted into one of the top ports. The vessel was sealed and the
agitation rate set to 600 rpm. Sterilisation was performed in situ by passing steam at
15 - 20psi through the vessel baffles. Once the pressure in the vessel had reached
5psi (corresponding to a temperature of approximately 105°C) steam was introduced
to the medium through the main sparger. This flow was halted when the temperature
reached approximately 118°C as, if the steam injection was prolonged, the vessel
temperature would overshoot the desired 121 °C. When the temperature in the vessel
reached 121°C, it was held constant for 25 - 30 minutes, to ensure effective
sterilisation of the medium. Once the sterilisation cycle was complete, the steam
supply was terminated and the vessel cooled by passing water through the baffles.
As the vessel temperature fell towards 100°C, the vessel was sparged with sterile air
to prevent the pressure dropping below 5psi. This pressure was then maintained
throughout the fermentation.
40

3.4.4.3 FERMENTER OPERATION
Once the vessel had stabilised at cultivation temperature and the dissolved oxygen
probe calibrated, the vessel pressure was dropped briefly to allow inoculation via one
of the top ports. A blowtorch was used to sterilise the neck of the Erlenmeyer flask
and the port, immediately prior and subsequent to the transfer.
3.4.4.4 FERMENTER VALIDATION
A number of problems were encountered in maintaining sterility during the
cultivation of S. natalensis in the 16L fermenter. Frequently, in the fermentations
attempted, the fermentation would become contaminated after approximately 24
hours with a Bacillus strain. Several tests were performed to isolate the
contamination source.
Initially, it was thought that the excessive foaming encountered during normal
operation compromised the integrity of the seals and/or filters and thereby caused the
contamination problem. However by varying the antifoam addition profile, it was
observed that the foaming occurred as a result of contamination and not as a
precursor, as was originally suspected.
The next step of the validation process focused on the sterilisation operation. 10L of
production medium was placed in the fermenter and sterilised as outlined in Section
3.4.4.2. After the medium was cooled to 27°C, a sample was taken aseptically and
microscopically examined. When the sample appeared free from any microbial
presence, a loopful was steaked on a YEPD agar plate and incubated for three days at
30°C. This plate subsequently indicated that the sample was sterile when removed
from the vessel.
The integrity of the seals was then examined. Again, 10L of production medium was
autoclaved in situ as described in Section 3.4.4.2. After the medium was cooled, the
fermenter was allowed stand for four days at a pressure of 5psi, agitated at 600rpm.
The vessel was not aerated. At the end of the four days, a sample was aseptically
removed and analysed microscopically. A loopful was also streaked onto a YEPD
agar plate. Again the sample was proven to be sterile.
41

The fermenter was filled with production medium which was sterilised and allowed
to cool. The vessel was then aerated with compressed air at 1 vvm and agitated at
600rpm. No inoculum was added. However, after 24 hours the fermentation
medium was found to be contaminated. The air filter was replaced and a number of
successful runs at 400rpm were accomplished. There was, however, a recurrence of
this sterility problem after a few weeks. It appeared to be associated with the inlet air
line and/or the connections to the vessel. It was not possible to remedy the problem
and no further work in the 16 L vessel could be undertaken.
3.5 MEASUREMENT OF FERMENTATION PARAMETERS
3.5.1 D E T E R M IN A T IO N O F B IO M A SS
Whatman No. 1 filter papers (70mm diameter) were pre-dried overnight at 105°C.
This temperature was previously used to dry actinomycete, yeast and bacteria
samples. Deionised water (100 mL) was passed through the filter paper in a Buchner
funnel apparatus and the filter was then weighed on an analytical balance. A
predetermined volume of culture fluid was passed through the wet filter paper in the
Buchner funnel. The resultant supernatant was again filtered through the filter cake
to ensure removal of all cellular material. The filter cake was then washed with 100
mL of deionised water to remove any residual extracellular material from the cake
mass. The paper was reweighed and the increase in filter weight used to calculate
sample wet weight (g/L).
To determine the sample dry weight (g/L), the pre-dried filters were quickly weighed
on an analytical balance prior to use. The protocol followed is as described for the
wet weight calculations with the exception that prior to weighing the filter cake, the
paper was then returned to the oven and dried overnight. Again the increase in filter
weight was used to calculate sample dry weight (g/L).
3.5.1.1 ATTEMPTS TO REMOVE CARBONATE FOR BIOMASS DETERMINATION
Due to the fact that the production medium described in Section 3.3.3.2 contained
calcium carbonate, it was not possible to accurately determine the biomass yields
42

using this medium. Therefore, a number of strategies were investigated with a view
to removing the suspended solids in order to aid in the analysis of fermentation broth
samples.
While it is known (Perry and Green, 1997) that calcium carbonate is only sparingly
soluble in water (0.0014%), the first test involved establishing the solubility of
calcium carbonate in the medium. A known quantity of pre-dried calcium carbonate
was added to an aliquot of medium, mixed thoroughly and the resulting suspension
filtered. The supernatant was passed through the filter cake again, to eliminate the
possibility of some of the carbonate escaping through the filter paper. The dry
weight of the filter cake was determined. It can be seen, from Figure 3.1, that
calcium carbonate is slightly soluble in the medium. In the fermentation medium,
the calcium carbonate acts as a buffering agent and some dissolution occurs during
the course of the fermentation, as the broth pH changes. Therefore, knowledge of the
initial calcium carbonate concentration in the production medium is not sufficient to
permit the accurate determination of the contribution of solid CaC03 to the biomass
concentration, as estimated by dry weight measurements.
bfloodOSh<D+->so
’<D£Q
Concentration of C aC 03 (g/L)
F ig u re 3.1 Data obtained during calcium carbonate solubility tests
43

A second test was performed in an attempt to separate the suspended solids from the
biomass by centrifugation. However, the density of the carbonate was similar to that
of the biomass and the two could not be separated in this way.
Calcium carbonate becomes soluble as the pH of the medium is lowered. Therefore,
the third experiment involved reducing the pH of a broth sample to pH 3.0 by the
addition of concentrated phosphoric acid. This resulted in the full dissolution of
calcium carbonate in the medium. In order to apply this technique to broth samples,
it was necessary to determine whether changing the pH of a broth sample would
result in cell lysis, leading to lower dry weight readings and/or variations in
morphological data. Table 3.8 shows the dry weight and morphological data for both
control flasks and samples in which the pH was reduced to pH 3.0. This test was
performed a minimum of three times. It can be seen that the imposed pH variation
does not significantly affect the characteristics of the sample. This method was,
therefore, adopted for the removal of suspended solids in production medium, and
was used in the collection of all data presented in this thesis.
T ab le 3.8 Effect of pH adjustment on fermentation broth sample characteristics
C h arac te ris tic s m easu red C o n tro l p H ad ju s ted flask
Overall pH 6.26 3.01
Dry weight (g/L) 1.04 1.06
Pellet area (mm^) 7.87 * 10-3 7.52 * 10-3
Pellet diameter (mm) 0.08 0.10
% Clumps 37.73 36.84
3.5.2 D E T E R M IN A T IO N O F SU G A R C O N C E N T R A T IO N
All reducing sugar concentrations were determined using a variation of the
dinitrosalycyclic acid method (Miller, 1959). A 0.5 mL sample of the supernatant
recovered on filtering the broth through a Whatman No. 1 filter paper was added to
1.5 mL of DNS reagent. In some cases, it was necessary to dilute the supernatant
sample with deionised water. The samples were then boiled for 10 minutes in a
waterbath. A 5 mL aliquot of deionised water was added to each vial and the
samples were then allowed to cool to room temperature. The optical density of the
44

samples was read at 540nm on a uv/vis spectrometer (Pye Unicam 8625, ATI
Unicam, Cambridge, UK). A standard curve for the concentration range O.Og/L -
l.Og/L was found to be linear and was repeated for each set of samples analysed. A
representative standard curve is presented in Figure 3.2. The sugar concentration in
each sample was determined from the measured absorbance, using the standard
curve.
Glucose concentration (g/L)
F ig u re 3.2 Sample of glucose standard curve for DNS assay
3.5 .3 D E T E R M IN A T IO N O F pH
Broth pH was determined using a WTW Microprocessor Precision-pH/mV-Meter
meter. Samples of the supernatant generated from tlie dry weight analysis were used
in preference to cell samples.
45

3.5.4 D E T E R M IN A T IO N O F D ISSO LV ED O X Y G EN C O N C E N T R A T IO N
The dissolved oxygen concentration was monitored in the 16L ‘Micogen’ system
using a Mettler Toledo dissolved oxygen probe connected to a Mettler Toledo
dissolved oxygen transmitter (Model 4300). After connection to the transmitter, the
probe was allowed to polarise according to manufacturer’s instructions for 1 - 2
hours. It was then calibrated prior to inoculation.
3.6 DETECTION OF PIMARICIN
Three separate methods were used in an effort to detect pimaricin in the fermentation
cultures of S. natalensis. These methods varied in both sensitivity and accuracy.
3.6.1 BIO A SSA Y
This assay, developed by Raab (1972), is the least sensitive and least accurate of the
methods employed in the detection of pimaricin. An overnight culture of
Saccharomyces cerevisiae, listed as ATCC number 9763, was prepared and 0.1 mL
of this culture was used to seed 300 mL of molten YEPD agar. This agar was then
dispensed into sterile petri dishes (Sterilin) - exactly 20 mL per plate - and these were
allowed to set. Using a flame sterilised 7mm cork borer, a well was made in the
centre of each plate. A 150jaL aliquot of either supernatant sample or pimaricin
standard was placed in the well. The plates were then covered and allowed to stand
at room temperature for 2 hours, to permit sample diffusion to take place. They were
then incubated overnight at 30°C. After incubation, clear zones on the plates,
highlighted using a light box, indicated the presence of pimaricin and could be
compared to the range of standards. The pimaricin standards used for this assay were
in the range 5pg/mL to 400|ig/mL. The pimaricin was diluted in a 65:35 mixture of
methanol and distilled water. Supernatant samples were also diluted in methanol-
water (65:35).
The accuracy of this method is limited as it relies on the human eye to differentiate
between the varying diameters of the clear zones. The absence of a visible clear zone
at a pimaricin concentration of 5 |ig/mL suggests that the method may be insensitive
46

to low levels of pimaricin. However it is an easy and inexpensive method for
qualitatively establishing the presence of pimaricin at concentrations in excess of 5
f-ig/mL. For the conditions investigated, a linear relationship was found to exist
between pimaricin concentration in the range 50 -350 jig/mL and the diameter of the
resulting clear zone. Figure 3.3 shows the standard curve for this bioassay, while
Figure 3.4 demonstrates the distinction between positive and negative results.
3 0
S S
N
Cj<D<+-io
Q5
0 5 0 100 150 2 0 0 2 5 0 3 0 0 3 5 0 4 0 0
Concentration o f pimaricin standard (¡itg/mL)
F ig u re 3.3 S am ple o f standard curve for p im aric in bioassay
47

Figure 3.4 Sample of (a) positive (50 (ig/mL) and (b) negative results for pimaricinbioassay

3.6.2 UV METHODThis method was adapted from the work of De Ruig et al. (1987). It is significantly
more sensitive than the bioassay as it can detect concentrations of pimaricin as low as
lfig/mL. Samples of supernatant were diluted in a methanol water mix (65:35).
Standard pimaricin solutions of 5p,g/mL and 15p.g/mL were run with each batch of
samples. The UV absorbance of the samples in the range 340nm to 300nm were
scanned using an UV-160A Shimadzu spectrophotometer. Aqueous methanol was
used as a blank. The height of the characteristic pimaricin peak at 317nm has been
shown to be directly proportional to the concentration between 1 and 17 fag/m L
(McCabe, 1990), and these peak heights can be used to calculate the concentration of
pimaricin in broth supernatant samples. Figure 3.5 illustrates the characteristic
pimaricin peak on the absorption spectrum.
Using equation (3.1) the pimaricin concentration in a sample can be calculated.
Pc V C YlCs = -----------x dilution factor (3-1)
Pn
where
Cs = Concentration of pimaricin in sample (pg/mL)
Ps = Peak height of sample at 317nm (mm)
Pn = Peak height of pimaricin standard (mm)
Cn = Concentration of pimaricin in standard (pg/mL)
3.6.3 HPLC METHOD FOR THE DETECTION OF PIMARICINThe following method was developed by Mahon (1990), for the pre-treatment of
fermentation samples prior to pimaricin detection using a HPLC based method.
A 2 mL aliquot of fermentation sample was placed in a glass universal containing 2
mL of 2M NaOH. These samples were vortexed and left to stand overnight to
facilitate the leaching of pimaricin from the mycelium. The pH of the samples was
then adjusted to approximately pH 3.0 with 0.5 mL concentrated phosphoric acid
(BDH) and the samples were immediately extracted with 5 mL of butan-l-ol (BDH).
49

Figure 3.5 (a) Positive (10 (ig/inL) and (b) negative UV profiles for pimaricin detection.
50

(a)
D A T A P R O C E S S I N G Y / N ?
(b)
3 0 5 . 0 5 . 0 < N M / ' D I U . > 3 4 0 . 0
1 7 - 0 8 6 / 0 4 ‘ 9 8 I 3 4 9 . 0 N H - 8 . 8 5 1 f t !
Figure 3.5 (a) Positive (10 jug/mL) and (b) negative UV profiles for pimaricin detection.
50

A Shimadzu Liquid Chromatograph equipped with an LC-9A pump and an SPD-
6AV uv/vis spectrophotometric detector was used for analysis, at a wavelength of
303nm. A flowrate of 0.5 mL/min was employed and the pressure cut-off point was
set at 1300Pa. A guard column packed with C8 packing was used to protect the
analysis column, a LiChrosorb RP8-10 column, of length 25 cm and diameter 4.6
mm. Both the guard column and the analysis column were obtained from Hichrom
(Reading, U.K.). The chromatograph was attached to a computer for data acquisition
purposes.
The mobile phase used in this study was a 65:35 mixture of HPLC grade methanol
and aqueous potassium dihydrogen phosphate solution (3.03g/L). This mobile phase
was filtered through 0.45pm Millipore filters and degassed prior to use under
vacuum. It was then passed through the column for approximately 1 hour to
equilibrate the column to the mobile phase.
A 10 pL aliquot of sample was injected into the HPLC system using a 100 pL
microliter syringe (Hamilton Bonaduz Ltd., Switzerland). The trace plotted on the
computer was used to calculate the concentration of pimaricin levels. The areas
under the peaks obtained by injecting pimaricin standards (0.005g/L - 0.05g/L) were
used to quantify the concentration in the injected samples. Figure 3.6 outlines (a) a
pimaricin positive trace and (b) a negative trace.
3.6.3.1 VALIDATION OF TECHNIQUE AND PROBLEMS ENCOUNTEREDDespite using all three methods for all fermentation samples collected during the
studies of S. natalensis, all results were negative for pimaricin. Attempts were made
to validate the HPLC extraction method as this is the most sensitive of the three
detection methods described. All tests performed were completed a minimum of four
times. The first step was to identify the peaks associated with the solvents used in
the extraction process and those corresponding to the fermentation medium. A
simple visual comparison confirmed that the peaks observed with the extracted
fermentation samples did not correspond to pimaricin.
51

(a)
'.1,0
VIO
200
240200IAO
i:?o
9 0
1 2 . 74
0RAPH Kt:Y __ShO UV lOO 7.
1 8 .0 0 HIN.'/.& @A Y/7.C
4 0
ÎJ 't.i O l . t t j_______ 1UJ_______ 1 2 U . i •> I . ___ lfc j_______ 1 8 -L
(b)
Figure 3.6 Pimaricin (a) positive (0.05 g/L) and (b) negative HPLC profiles
52

For the UV method, only extracellular pimaricin (i.e. that present in the supernatant)
is detected. Accordingly, no pre-treatment of the biomass should, in theory, be
necessary for the HPLC method. However, a pre-treatment stage was introduced by
Mahon (1990) with a view to maximising pimaricin concentration for detection. As
all broth samples for analysis were frozen for storage, a sample pimaricin solution
was frozen overnight and, when thawed, analysed using HPLC. The results indicated
that the pimaricin was unaffected by freezing.
1 mL of supernatant was spiked with 1 mL of pimaricin standard (0.05 g/L) and
extracted as described in Section 3.6.3. This also yielded a negative trace. It was
then attempted to ascertain whether this result was associated with one of the
chemical species previously employed, i.e. phosphoric acid, 2M NaOH, or the
butanol extraction step. Pimaricin was found to be unaffected by the presence of the
phosphoric acid. However when a standard was placed in an equal volume of 2M
NaOH overnight, it was found that the pimaricin was partially degraded, resulting in
a detection of 0.0055g/L instead of 0.0125g/L pimaricin. This pH sensitivity of
pimaricin was previously mentioned by Borden et al. (1995). Using a one-step
extraction into butanol yielded in a negative trace. While Mahon (1990) succeeded
in detecting pimaricin in broth samples, it is now felt that the results were affected by
the pre-treatment process. It is likely that the detected levels of pimaricin presented
by Mahon (1990) underestimate the actual concentrations present in the broth
samples analysed. It was, therefore, necessary to alter both these steps in the
extraction technique.
Two alterations in the butanol extraction procedure were attempted using pimaricin
standard solutions. Initially the duration of extraction was increased to both 1 hour
and 2 hours. These one step extractions both proved ineffective. A three step
extraction was then attempted. 1 mL of the standard was added to 1.5 mL of butanol
and handshaken. This was allowed to stand for 15 minutes and was shaken again.
The butanol layer was at this time removed and placed in a separate glass universal.
Fresh butanol (1.5 mL) was added to the original sample and the extraction step
repeated. Again the butanol layer was removed and added to the butanol from the
53
first step. Fresh butanol (2 mL) was added to the sample and the steps were again
repeated. This resulted in a very small peak at the time of interest but was still
ineffective.
Another, more effective, solvent was then sought to replace butanol. Acetone and
methanol were both examined. Acetone, when used to extract the supernatant spiked
with pimaricin, resulted in a 90% extraction. Methanol however resulted in a 98%
extraction and was employed in all subsequent studies. With biomass samples, the
sample for HPLC was filtered through a 0.45pm filter prior to injection.
It was postulated that, by reducing the exposure time of the pimaricin to the 2M
NaOH, the degradation of the pimaricin would be reduced. Flowever, even by
reducing the exposure time to 1 hour the sample still yielded a negative trace. It was
then decided to reduce the concentration of the NaOH to 0.5M while the exposure
times were varied between 15 minutes and 12 hours. Although the extent of
degradation was reduced, only 24% extraction efficiency was achieved after an
exposure time of 15 minutes, using 0.5M NaOH. Using 0.2M NaOH for exposure
times of up to 1 hour, a maximum of 45% of the original pimaricin was detected after
an exposure time of 30 minutes.
A substitute method for cell lysis was then investigated. 2M Na2C 03 was examined
for its effect on pimaricin. This was a much more effective technique, resulting in an
83% recovery after 10 minutes exposure. Reducing the molarity of Na2C 03 to 0.2M
did not affect the efficiency of the assay. In an effort to facilitate cell lysis and the
leaching of pimaricin from the mycelia, a 0.05g/L solution of pimaricin and 2M
Na2C 03 were boiled for 1 hour. This resulted in a negative HPLC trace, suggesting
that pimaricin might be heat sensitive. To investigate this possibilty further, the
standard solution was heated to 50°C for 2 hours. Subsequent HPLC analysis
indicated 90% pimaricin recovery. However when 2M Na2C 03 was added to the
pimaricin standard prior to heating, the pimaricin detected during HPLC analysis was
2% of the concentration used. When fermentation samples were tested using this
method, negative traces were also observed.
54

Physical extraction was also attempted with the biomass samples being processed in
a bead mill prior to filtration and extraction with methanol. This also yielded a
negative trace. It was therefore decided to abandon attempts to monitor pimaricin in
fermentations as the organism did not appear to produce the antibiotic under any of
the cultivation conditions attempted.
In summary, it is postulated that the use of organic solvent, combined with an
alkaline treatment, as praticed by Mahon (1990), does not accurately detect the level
of pimaricin present in fermentation broth. A gentler technique should be
undertaken, using for example a physical method of cell disruption (e.g. bead mill)
followed by addition to methanol or acetone. While Mahon was successful in
detecting levels of pimaricin, it can be assumed that a proportion of pimaricin present
in the supernatent would have been adversely affected by the technique employed.
However, further work must be undertaken in both extraction and purification from
fermentation broth to ensure that the highest recovery possible is achieved.
3.7 STA TISTICAL ANAL YSIS OF DA TA
Statistical analysis of the data collected during this study was performed using the
statistical package included in Sigma Plot Scientific Graph System (Jandel
Corporation), Version 1.02. Plotted values represent the mean of the data, with error
bars representing the standard error.
55

C H APTER 4
RESULTS AND DISCUSSION: M O R PH O LO G IC A L
CH ARACTERISATIO N
4.1 IN T R O D U C T IO N
When biologists first began investigating micro-organisms, only qualitative analysis
could be performed using a microscope. The use of digitising tables in conjuction
with microscopes represented a considerable improvement in terms of quantitative
measurements. However, the main disadvantages of these early methods for
measuring the morphological characteristics of an organism lay in the fact that they
were time consuming and subject to human error. The advent of image analysis
provided a faster, more accurate, potentially automated, or semi-automated, method
of extracting pertinent morphological measurements from stored images and slides; if
correctly performed, there is a complete lack of bias in the measurements.
4.2 IM A G E A N A L Y S I S H A R D W A R E
The three main hardware components used in the image analysis system employed in
this work were a personal computer, a CCD type TV camera and a microscope.
The computer supporting the processing and analysis software contained a 66MHz
Intel 486 DX2 processor. An AcerView 56L Low radiation 15” colour monitor
(Acer Peripherals Inc., Taiwan) was used. The system also contained an ELViS
frame-grabber board, to facilitate the capture of live and frozen video-based images.
The camera employed was a JVC TK-1280E colour video camera (Victor Company
of Japan, Ltd., Japan), which was attached to the microscope via a C-mount adapter.
All studies were performed at a magnification of 40x, using an Olympus BX40
brightfield microscope (Olympus Optical Company, Japan). At this magnification,
each pixel corresponded to 2.08|im. Both lighting and condenser settings were
maintained at constant levels to ensure that the conditions, under which the images
were analysed, were reproducible.
56

4.3 IMA GE ANAL YSIS SOFTWARE
The Leiea Q500MC software employed was a Windows-based package, which has a
number of image processing/ analysis facilities, the most important being:
1. the ability to acquire either a live or stored grey image and display that image on
screen. Each grey image is composed of 720x512 pixels, in which each pixel has
a grey level ranging from 0 (representing black) to 255 (representing white).
Initially a live image is displayed on the screen. Most applications work with
monochrome images where grey level differences are exploited to distinguish
critical features. Colour systems are also available, but their handling requires
more expensive equipment and specialised software (Paul and Thomas, 1998).
At this stage the lighting and focus may be adjusted until the image is of a
suitable quality, at which point the image is frozen and is then available for
processing. The package allows for the short-term storage of up to seven images,
in regions known as planes. These planes are also extremely useful for the
modification and processing of an image without overwriting or losing the
original.
2. the ability to modify and enhance the acquired image until suitable for further
analysis. Such modifications include edge enhancers and detectors, image
smoothing, sharpening and inversion. These processes are only used if the
quality of the frozen image hinders the separation of the regions of interest from
the rest of the grey image.
3. the ability to segment regions of interest from the grey image resulting in a binary
image. This feature is also known as detection. In order to isolate the regions of
interest, the software package uses detectable differences in grey levels between
the regions of interest, defined as ‘ 1’, and the background, defined as ‘0’.
4. the ability to subsequently facilitate both manual and automatic modification of
the binary image. Due to poor detection or the presence of dust or debris, it is
sometimes necessary to manipulate the detected image. Six binary planes are
provided to facilitate the modification of binary images.
5. the ability to measure a number of selected features contained in the binary
image. The software allows the measurement of multiple parameters on any
given feature in a binary image, such as feature area, or dimensions such as
57

diameter and perimeter. Also, measurements can be used to remove features
from an image e.g. by specifying a minimum acceptable area for regions of
interest, debris can be simply removed from a binary image.
6. the ability to present the measured data in a form suitable for further processing
or statistical analysis.
7. the ability to program routines to automatically complete complex series of the
above events (QUIPS); these routines can be designed to run without manual
intervention. Due to the provision of programming operations facilitating data
input and output and the ability to conditionally execute certain operations,
QUIPS proved very flexible and user friendly.
4 .4 T H E M O R P H O L O G Y O F T H E O R G A N IS M
In submerged culture, Streptomyces natalensis has been observed to grow in two
distinct forms - pelleted growth and filamentous clumped growth. In any
fermentation sample, the population contains varying percentages of these
morphological forms. Depending on the fermentation medium used and the
fermentation conditions to which the organism is exposed, as can be seen from
Figure 4.1, pellets may be further reclassified as ‘smooth’ (a) or ‘hairy’ (b).
Filamentous clumps are shown in Figure 4.1 (c). These images were collected at
lOOx magnification to highlight the differences between the three forms. The effects
of varying the medium components and fermentation parameters on the organism
morphology are discussed in more detail in Chapters 5 and 6.
58

(C)
Figure 4.1 Example of Streptomyces natalensis morphology (a) typical pellets, 100x; (b)
‘hairy’ pellets, lOOx and (c) filamentous clumps, lOOx (Bar = 50pm)
59

4.5 S L ID E P R E P A R A T IO N P R IO R TO IM A G E A N A L Y S IS
Due to the morphology of the organism, the use of glass microscope slides was found
to yield inaccurate results. This was due to the fact that when the coverslip was
placed on the slide, the particles were flattened and therefore appeared much larger
during analysis than in suspension. A Sedgewick Rafter chamber (Graticules Ltd.,
U.K.) was therefore used as it provided the depth necessary to allow accurate
morphological measurements. A 1 mL aliquot of broth was placed in the chamber
using a 1 mL Gilson pipette, with a tip diameter of 1 mm, which is approximately 10
times greater than the diameter of the largest biological entity encountered in a
typical broth. This sample was allowed to settle for approximately one minute. The
samples were diluted, when necessary, with distilled water.
4.6 IM A G E A N A L Y S IS P R O T O C O L F O R T H E C H A R A C T E R IS A T IO N O F S.
N A T A L E N S IS
An example of a typical morphological field acquired during characterisation can be
seen in Figure 4.2. It is apparent that the sample contains some debris as well as
various combinations of morphological groups. Also, the divisions on the
Sedgewick Rafter cell are detectable and interfere with the measurements. Therefore,
a great deal of image pre-treatment must be performed prior to the measurement of
the morphological parameters.
The first step is to isolate the large pellets from smaller pellets, clumps, media debris
and the Sedgewick Rafter divisions, using a size filter and a roundness filter. This
step is necessitated by the fact that, when detected, the larger pellets frequently
appear attached to the divisions or to smaller pellets, and must be separated, to ensure
accurate measurement. This is achieved by a series of erosions and dilations of the
binary image. The isolated large pellets are then returned to the binary image storing
the smaller pellets and clumps. This binary image must undergo further editing to
remove the debris and divisions. The debris is removed by including a minimum
area feature accept (all particles less than 2.15 * 10'4 mm2 are removed) in the
program, while the Sedgewick Rafter divisions are removed by including a
roundness feature accept.
60

#
Chamberdivisions t*
Clumps
Two pel] ‘attacha division
Figure 4.2 Example of typical image analysis field, 40x
A manual edit stage is included to remove any objects which evaded the automatic
edit functions e.g. air bubbles, and which would otherwise be included in the final
binary image. For each detected object, the following parameters are then measured:
area, diameter, perimeter, and convex area. The area and convex area of the pellet
cores are also measured. The convex area of the pellet is the area of a convex hull
surrounding the pellet. The value used for the diameter is the mean of the
measurements taken in six different directions (Figure 4.3). The circular outline in
Figure 4.3 indicates the convex area of the pellet.
Figure 4.3 Schematic diagram outlining the calculation of the mean pellet diameter used
during S. natalensis studies.
61

Using these data, the pellet roughness and the percentage of filamentous clumps in
the sample can be calculated. Pellets were defined as any entity with a distinct core;
clumps were defined as those without a clear core. The core is defined as any
particle with an area less than 2.29 * 1 O'" mm2. The percentage of clumps present in
a broth sample was calculated on a volume basis, using equation 4.1. Pellet
roughness or “hairiness” is calculated using equation 4.2.
/ clump volume (4 .1)% clumps = = -------------------------------------- x 100
y total particle volume
roughness =Core area - Core convex area
v Pellet area - Pellet convex areax 1 0 0 ( 4 - 2 )
A minimum of 100 entities were measured in each sample. This limit was tested for
statistical accuracy and reproducibility. For a single broth sample the image analysis
protocol was run four times. The first run measured 50 objects; the second measured
100; the third, 150; and the fourth 200. It was found that the values recorded for the
morphological parameters did not vary for sample sizes greater than than 100. This
test was repeated and the same findings were observed.
Figure 4.4 shows an outline of the image analysis protocol used. Appendix A
contains a copy of the protocol code.
4 .7 M O R P H O L O G IC A L C H A R A C T E R IS A T IO N
4.7.1 M O R PH O LO G IC A L DEVELO PM ENT DURING CU LTIVA TIO N
As outlined in Section 4.6, the morphological parameters measured during the
fermentation of S. natalensis were particle area, particle convex area, particle
diameter, particle perimeter, pellet core area, pellet core convex area and percentage
clumps. Figure 4.5 illustrates the development of (a) area, (b) convex area and (c)
diameter over the course of a batch growth cycle in 250 mL shake flasks containing
buffered fermentation medium. Figure 4.6 shows (a) pellet perimeter, (b) particle
62

roughness and (c) percentage clumps. The development o f the pellet core is shown
in Figure 4.7. The data presented in Figures 4.5 - 4.7 are the mean values for data
acquired from ten independent runs; error bars represent the standard error.
Figure 4.4 linage analysis protocol
63

(a )
(b)
(c)
<DJUTjiCl,
<sX<u>cou
eJ,«£cd
» r—HT 3
"o
Time (hours)
Tim e (hours)
Time (hours)
Figure 4.5 Morphological development o f S. natalensis during batch cultivation in
buffered medium (a) particle area, (b) particle convex area and (c) particle
diameter
64

(a)
(b)
(c)
CACXio
Tim e (hours)
Time (hours)
Time (hours)
Figure 4.6 D e v e lo p m e n t o f (a ) p a r t ic le p e r im e te r , (b ) p a r t ic le r o u g h n e s s a n d ( c )
p e r c e n t a g e c lu m p s ( v o lu m e b a s e d ) in s h a k e f la s k c u ltu r e s
65

(a) 0.015
^ 0.012aë, 0.009
0.006
(b)
£03X<uÙoo<DOU
50 100 150
Time (hours)
200 250
Time (hours)Figure 4.7 Morphological development of pellet core in shake flasks - (a) core area and
(b) core convex area
It can be seen from Figure 4.5 (a) that during the first 80 hours after inoculation, the
particles present in the broth grow significantly in size, with the average area
increasing approximately 20 fold, from 5.2 x 10"4 mm2 to 0.01 mm2. At about 80
hours, the particles present in the sample appear to undergo some form of
disintegration with the average area plummeting to 4.1 x 10'3 mm2 at 120 hours and
only falling slightly for the remainder of the cultivation period. Coincident with
particle area disintegration, the volume based percentage of clumps present in the
broth increases from 0.35% to 30.4%, accounted for by fragments of the
disintegrated particles. Initially the percentage of clumps present in the sample
66

(Figure 4.6 (c)) decreases during the early stages of the fermentation. This appears to
be due to the fact that the clumps are growing and expanding to form pellets. Also,
as outlined in Figure 4.6 (b) the roughness of the particles present decreases until
approximately 73 hours. This may be due to a particle consolidation period at the
beginning of the fermentation. As can be seen from Figure 4.7, the development of
the pellet core area behaves in a similar fashion to the development of the particle
area.
There are two possible explanations for the observed pellet disruptions. The first is
that the biomass concentration has increased to a level at which the pellets are
colliding with each other, causing breakage. This results in a decrease in the mean
pellet area observed in these fermentation samples. As the biomass level does not
fall for the remainder of the cultivation period, individual pellets in the shake flask
never get the opportunity to regrow to the previously observed extent.
The second explanation is that the particles initially increase to this maximum value,
through rapid radial expansion. However, as will be discussed in Chapter 5, S.
natalensis appears to be sensitive to the dissolved oxygen levels in the fermentation
broth. The maximum particle area observed was 0.015 mm2, corresponding to a
mean diameter of 90 pm, when the organism was cultivated in buffered fermentation
medium. Although this diameter is significantly lower than the value of 400 pm
suggested by Schiigerl et al. (1983) for limitation in P. chrysogenum pellets, it is
possible that in cultivations of S. natalensis, these pellets may be subjected to oxygen
limitation.
Given that the biomass concentration in the flasks did not exceed 1.4g/L (d.w.)
during the first 100 hours of cultivation, it is unlikely that the first scenario is wholly
applicable, and it is postulated that a combination of these two scenarios results in
the observed morphological profile in shake flask fermentations.
67

4.7.2 M O R P H O L O G IC A L D IST R IB U T IO N S
In a number of studies and mathematical models, a common misconception is that
the culture consists of uniformly sized pellets. Since the collection of pellet sizes
defines the amount of mycelial surface exposed to the nutrient laden medium, it
implicitly determines the proportion of mass that actually contributes to growth.
Fragmentation can increase this proportion by shifting pellet size distributions to
smaller radii, for which there is more surface area exposed per unit volume (Edelstein
and Fladar, 1983). A number of factors influence these variations in distributions.
The first is a reseeding phenomenon whereby miniature pellets arise from the
fragments broken from the larger pellets due to collisions. Other features include
pellet lysis and cell death.
Figure 4.8 shows (a) number and (b) volume-based size distribution profiles for S.
natalensis during batch cultivation in buffered fermentation medium in shake flasks.
Because smaller clumps predominate, on a number basis throughout the growth
cycle, the contribution of larger pellets to the total biomass present is less obvious
than when the data are presented as a volume-based distribution.
As is evident from Figure 4.8, the size distribution profiles of vary significantly
during cultivation. Initially the population is relatively homogeneous, all of the
biomass appearing in the form of small particles with a volume of less than 0.016
mm3. As the fermentation progresses, the population becomes more heterogeneous,
with the percentage volume occupied by larger particles increasing. Analysis of the
number-based distributions (Figure 4.8(a)) confirms the reduction in average pellet
size between 78 hours and 96 hours observed in Figure 4.5(a) with comparatively
little variation in the size distributions thereafter. Flowever, the corresponding
volume-based profiles are less clear. It is obvious that the larger pellets, >0.3 mm3,
constitute a significant fraction of the biomass during the latter stages of the cycle (>
144 hours). It is also possible that during these times, a larger number of entities
should be analysed than the minimum of 100, established on the basis of validation
trials performed during the earlier stages of the growth cycle (120 hours).
68

5 haiis 24 hours100-I
80 -
6 0 -
4 0 -
2 0 -
0 - ■ i 1
0.0 0.3 0.6 0.9 Particle volume (mm3)
66 hours
0.0 0.3 0.6 0.9
Particle volume (mif)
192 hours
0.0 0.3 0.6 0.9 Particle volume (mm3)
100 -n
8 0 -
60 -
4 0 -
20
0 -
48 hours
i r 0.0 0.3 0.6 0.9
Particle volume (mm3)
73 hairs
n r0.0 0.3 0.6 0.9
Particle volume (mm)
121 hours
i r0.0 0.3 0.6 0.9
Particle voluire (mm3)
144 hours
KX) -i 100 -T
SO 80 -
6 0 - 6 0 -
4 0 - 4 0 -
20 - 2 0 -
0 - l l o -
0.0 0.3 0.6 0.9
Part icle voluire (mrr)
220 bom's
i r0.0 0.3 0.6 0.9
Particle vdume (mm1)
n r 0.0 0.3 0.6 0.9
Particle volume (rrm)
96 hatrs
n r0.0 0.3 0.6 0.9
Particle volume (inn3)
170 hours
i r0.0 0.3 0.6 0.9
Particle volume (inn3)
240 hours
1 r0.0 0.3 0.6 0.9
Particle volume (mm3)
Figure 4.8(a) Development of number based particle size distributions during
cultivation in buffered fermentation medium in shake flask cultures.
69

Dis
trib
uti
on
(%
)
5 hours 24 hours
0.0 0.3 0.6 0.9
P a r t ic le v o lu m e (m m 3)
66 hours
i r0.0 0.3 0.6 0.9
P a r t ic le V o lu m e (m m 3)
121 hours
“ I r
0.0 0.3 0.6 0.9
P a r t ic le v o lu m e (m m 3)
192 hours
i r0.0 0.3 0.6 0.9
P a r t ic le v o lu m e (m m 3)
48 hours
1 r
0.0 0.3 0.6 0.9
P a r t ic le v o lu m e (m m 3)
73 hours
_l----- r
0.0 0.3 0.6 0.9
P a r t ic le v o lu m e (m m 3)
144 hours
0.0 0.3 0.6 0.9
P a r t ic le v o lu m e (m m 3)
220 hours
0.0 0.3 0.6 0.9
P a r t ic le v o lu m e (m m )
0.0 0.3 0.6 0.9
P a r t ic le v o lu m e (m m 3)
96 hours
i r
0.0 0.3 0.6 0.9
P a r t ic le v o lu m e (m m 3)
170 hours
0.0 0.3 0.6 0.9
P a r t ic le v o lu m e (m m 3)
240 hours
i r
0.0 0.3 0.6 0.9
P a r t ic le v o lu m e (m m 3)
Figure 4.8(b) Development of volume based particle size distributions during
cultivation in buffered fermentation medium in shake flask cultures.
70

It is postulated that as the fermentation progresses the particle area increases as the
particles expand and grow. When they reach a critical area, breakage occurs, due to
collisions and/or oxygen limitation phenomena and the subsequent reseeding
described by Edelstein and Hadar (1983) ensues.
71

CH APTER 5
RESULTS AND DISCUSSIO N: SHAKE FL A SK AN D STIRR ED TAN K R EA CTO R STUDIES
5.1 B A T C H G R O W T H C H A R A C T E R IS T IC S O F S trep tom yces na ta lensis
The organism was initially cultivated in unbuffered fermentation medium as
described in Section 3.3.3.3, in order to facilitate measurement of biomass yields, in
the absence of suspended carbonate particles. However, in this medium the organism
was found to be pH-limited; growth was inhibited when the pH fell below pH 4.0.
The organism was then cultivated in buffered fermentation medium, as detailed in
Section 3.3.3.4. The observed differences in biomass yield for buffered and
unbuffered media are presented in Figure 5.1. The data presented in this and all
subsequent figures represent the mean values for samples taken from a number of
replicate runs. Each sample represents one shake flask. In Figure 5.1, the error bars
on the unbuffered fermentation medium data represent the standard error for four
runs, while those on the buffered fermentation data represent the standard error for
ten runs. All biomass data refer to dry weight values.
0 25 50 75 100 125 150 175 200 225Time (hours)
F ig u re 5.1. Biomass profiles for Streptomyces natalensis grown in both unbuffered and
buffered media ( • unbuffered medium; 0 buffered medium; pH of
unbuffered broth).
2.5 7
2.0
0.0 3
72

After approximately 66 hours of cultivation in unbuffered medium, by which stage
the broth pH has fallen to a value of 4.0, growth ceases. Biomass levels do not
exceed 0.5 g/L. In the corresponding buffered system, a biomass concentration of
2.61 g/L was achieved after 225 hours of cultivation.
As these effects may be associated with the presence of the phosphate buffer, the
influence of medium components and concentrations is discussed further in Chapter
Typical biomass and pH profiles for S. natalensis grown in buffered fermentation
medium are presented in Figure 5.2(a). Glucose concentration in the medium is
outlined in Figure 5.2 (b), with the corresponding morphological characteristics of
the organism shown in Figure 5.2(c).
It is not possible to compare these profiles with the results presented by either
McCabe (1990) or Mahon (1990) which are the only sources of comparative data on
S. natalensis. Neither had the use of an image analyser and so their morphological
observations were purely qualitative. McCabe did not monitor biomass production,
as no method for removing calcium carbonate from the fermentation sample was
employed. Mahon presented biomass concentration as wet weight, containing
calcium carbonate. Moreover, as the strain used by both authors produced pimaricin
while that strain used in this study did not, it is difficult to estimate the effect that this
would have on either morphology or biomass production.
73

(a ) “tC/Jmboffl
(b)
(c)
o,o
Time (hours)
Time (hours)
Figure 5.2. Growth curves for S’, natalensis grown in buffered fermentation medium: (a)
biomass and pH profiles, (b) extracellular total reducing sugars concentration
and (c) morphological variations throughout the batch growth cycle.
74

The following studies were performed in order to identify the optimum inoculum
conditions in terms of size and age. Eight flasks, each containing 50 mL of inoculum
medium, were inoculated with 1 mL of plate suspension and incubated at 30°C. At
24 hour intervals, a single flask was removed and the contents of this flask used to
inoculate three other flasks, each containing 100 mL of buffered fermentation
medium. The first flask was inoculated with 1 mL, the second with 5 mL and the
third with 10 mL. The flasks were incubated under normal growth conditions and
after 96 hours the broth was analysed, as described in Section 3.6. When the
inoculum was older than 144 hours, no growth was observed in the inoculated flasks.
Accordingly, only the data obtained from the first six inoculum cultures harvested are
discussed. These studies were performed in duplicate.
Figure 5.3 shows (a) biomass and (b) morphological profiles for these inoculum
systems. It is evident from the data presented that both the inoculum age and volume
employed have a significant effect on overall biomass yield. Dealing initially with
the volume of inoculum used, it can be seen that, with regard to biomass yield, the
use of a 1 mL inoculum is very inefficient regardless of culture age. The maximum
biomass obtained using a 1 mL inoculum (0.98g/L) was observed with a 120 hour
inoculum but this was smaller than the biomass levels observed for either of the other
inoculum volumes of any age, except for the 10 mL inoculum at 144 hours (0.44g/L).
It is also clear that of the inoculum volumes studied, a 1 mL aliquot of inoculum
culture (120 hours) resulted in the largest particle area observed, 0.063 mm2.
For larger inocula it can be seen that when the inoculum cultures are young (72 hours
or less), a 10 mL inoculum yields higher biomass concentrations. For the older
cultures, a 5 mL inoculum is more effective, with the highest biomass concentration
(1,65g/L) obtained at 96 hours. No underlying relationship between particle area and
either inoculum volume or age could be discerned. On the basis of these studies, an
optimum inoculum size of 5 mL taken from a 96 hour inoculum culture was
identified for 100 mL shake flask cultures and was employed in all subsequent work.
5.2 INOCULUM STUDIES
75

(a)
(b)
CN
0.07
0.06| 0.05
<D 0.04a<D 0.03
i- m
0• (“H
1 0.02p H 0.01
0.0024
Inoculum age (hours)
48 72 96 120 144
Inoculum age (hours)
Figure 5.3. The effect of inoculum age and volume on (a) biomass accumulation and (b)
morphology after 96 hours of cultivation ( 0 1 mL inoculum^! 5 mL
inoculum; 0 10 mL inoculum).
5.3 V O L U M E S T U D IE S
In order to ascertain the effect of broth volume on the cultivation of S. natalensis, a
number of shake flask studies were performed. Cultures were established in 250 mL
Erlenmeyer flasks, using buffered fermentation medium, with broth volumes of 50
mL, 100 mL and 150 mL. The optimal inoculum age and volume determined in
Section 5.2 were employed with the inoculum volume scaled appropriately. The data
76

presented in this study represent the mean values obtained from six replicate runs.
Error bars have been excluded for clarity but the maximum error during any
fermentation was 29%, observed after 48 hours using 150 mL of fermentation
medium.
It can be seen from Table 5.1 that for the systems investigated, the maximum values
of biomass concentration (3.92g/L), specific biomass production rate, Rvb
(0.027g/L.h) and biomass yield, Yx/s (0.175g/g glucose) were obtained using a 50 mL
working volume and all values decrease as the broth volume increases.
Table 5.1 Growth characteristics of shake flask cultures cultured in buffered
fermentation medium - volume studies
Volume (mL) M ax. biomass (g/L) M ax. Rvk (g/L.h) M ax. Y x/s (g/g glucose)
50 3.920 0.027 0.175
100 2.116 0.018 0.134
150 1.125 0.016 0.096
Figure 5.4 shows the biomass profiles obtained during these volume studies. Clearly
the smaller the liquid volume employed, the higher the accumulated biomass
concentrations. The overall biomass concentration in the 50 mL culture is almost
four times that obtained in the flask containing 150 mL. Specific surface area
available for 0 2 mass transfer increases with decreasing liquid volume. This appears
to suggest that when S. natalensis is cultivated in larger volumes of medium, the
organism may be subject to oxygen deprivation, resulting in diminished growth.
This oxygen sensitivity exhibited by S. natalensis was also noticed by other
researchers (Ives, P., personal communication, 1996). Biomass concentrations in
fermentations of S. clavuligerus are known to be adversely effected by low oxygen
levels (Belmar-Beiny and Thomas, 1991). It is possible that baffled shake flasks
could be used to overcome or at least reduce this oxygen limitation problem.
77

(a)
w% 2a zaoffl 1
Figure 5.4.
55 110 165Time (hours)
24i-i'5i> 18COh
T O « /-v
tuo 12 p GO
Time (hours)
(a) Biomass and (b) sugar profiles obtained during volume studies ( # 5 0 mL
volume, O 100 mL volume, ■ 150 mL volume).
The biomass yields per gram of glucose utilised, Y^, for each system are shown in
Figure 5.5. It can be seen that when a 100 mL volume is used, Yx/s increases to the
maximum value of 0.134g/g glucose, at approximately 96 hours. The biomass yield
then decreases to a value which is maintained for the remainder of the growth cycle.
In the cases of the 50 mL and 150 mL systems, the maximum biomass yield occurs
much later in the fermentation, at approximately 170 hours and 144 hours,
respectively. However, at all stages, the biomass yield in the 150 mL system is, in
general, lower than those observed in either of the other two systems. Assuming that
0 2 may be limiting, this data suggests that glucose is being diverted elsewhere, as
less biomass is produced per unit substrate. Unlike the other volumes, the Yx/s values
78

for the 50 mL system increase throughout the first 120 hours, before appearing to
stabilise at approximately the maximum value of 0.175g/g glucose.
0.15 -i-------------------------------------------------------------------------
Time (hours)
F ig u re 5.5. Biomass yield per gram of glucose utilised during volume studies. (0 50 mL
volume, O 100 mL volume,■ 150 mL volume).
With regard to the Rvb, the maximum values observed during the fermentation are
found at 96 hours in the 50 mL system and 66 hours in both the 100 mL and 150 mL
systems. Table 5.2 shows the overall Y ^ and Rvb values obtained for these systems
and all are seen to decrease with increasing volume.
T ab le 5.2 Overall values for Yx/s and Rvb during volume studies
V olum e (m L) O verall R v fo (g/L .h) O v era ll Yx/S (g/g glucose)
50 0.018 0.132
100 0.010 0.101
150 0.005 0.081
79

Morphologically, it can be seen from Table 5.3 that, for the range of conditions
investigated, the greatest overall particle area and perimeter were observed at a
working volume of 150 mL. Moreover, it was noted that pellet perimeter and
diameter both increase with increasing culture volume. However, there was no
apparent relationship between culture volume and average particle area. This
indicates that the pellets are less compact when a working volume of 100 mL is used,
compared to those produced with either of the other two volumes. The
morphological parameters listed in Table 5.3 have been defined in Section 4.5 and
the values reported are those observed at the end of the fermentation, normally
between 190 hours and 200 hours.
T ab le 5.3 Final average morphological characteristics for shake flask cultures in buffered
fermentation medium - volume studies
V olum e (m L) P a rtic le a rea (m m 2) P e rim e te r (m m ) D iam e te r (m m )
50 4.329 * 10-3 0.185 0.047
100 2.637 * 10-3 0.216 0.052
150 4.288 * 10-3 0.239 0.061
Figure 5.6 outlines the development of particle area with time in the three systems.
All three cultures behaved in a broadly similar fashion. In the 50 mL culture, the
particle area increased during the first 24 hours and then decreased to a minimum at
66 hours. The particle area increased for a second time to the maximum area
observed at 95 hours and then decreased to a stable value which did not vary for the
remainder of the fermentation. With both the 100 mL and 150 mL cultures, the
particle area increased to the maximum observed value at 73 hours and then
decreased, although the effect is more pronounced at the 100 mL scale than for 150
mL. In the case of the 100 mL system, the area subsequently decreased to a stable
value which was maintained for the remainder of the fermentation. However in the
case of the 150 mL working volume, the particle area decreased slowly throughout
the rest of the growth curve and did not stabilise as was observed with the 50 mL and
100 mL cultures.
80

0.020
^ 0.016
§ 0.012
g 0.008
a o.oo4
i 0.000Ph
Time (hours)
0.020
^ 0.016 H
§ 0.012
S 0.008 -1£ 0.00401 0.000Pm
Time (hours)
<Dv -
O
0 50 100
Time (hours)
150 200
Figure 5.6 Morphological characteristics during volume study fermentations ( • 50
mL volume, O 100 mL volume,® 150 mL volume).
It is postulated that the differences observed between these area profiles may be, in
part, attributable to the intensity o f the agitation conditions prevailing in the flasks.
81
As all flasks were maintained on the same shaker table, the power input per unit
volume increases with decreasing liquid volume. Accordingly, the environment in
the 50 mL system is most severe, which may account for the reduction in average
particle area during the early stages of cultivation and the failure of particles to
expand to the same extent as in the other systems. However, it is evident from the
corresponding biomass profiles that growth is not adversely effected under these
conditions. In the 150 mL system, conversely, the largest pellets were formed.
However, the biomass profiles suggest that the organism was subject to oxygen
limitation under these conditions.
Despite the fact that the highest biomass was observed with a fermentation culture
volume of 50 mL, a 100 mL working volume was used in all shake flask studies.
This was due to the practical difficulties associated with comprehensive analysis of
the smaller broth volume.
5.4 S T IR R E D T A N K R E A C T O R S T U D IE S
As can be seen from Figures 5.4 - 5.6, the growth and morphological profiles for S.
natalensis show evidence of fluctuations which are obviously associated with the
cultivation conditions in the shake flask at various liquid volumes e.g. due to oxygen
limitation or agitation effects, or which may be due to the fundamental limitations of
shake flask cultivation procedures. Because the broth volumes employed are
relatively small, (50 - 100 mL), it is necessary to harvest the full flask contents each
time. This leads to the possibility of flask/flask variations, although these effects
should be minimised by the use of a minimum of four replicates in all cases.
However, scale-up to 1L and 10L STRs was undertaken with a view to overcoming
the inherent limitations of shake flask systems.
5.4.1 1 LITRE SYSTEM
The organism was cultivated at two agitation rates, 250 rpm and 500 rpm at a
constant aeration rate of 600 mL/min (corresponding to a value of 0.75w in on the
basis of the original broth volume. A working volume of 800 mL (buffered
82

fermentation medium) was used. At each agitation rate, two fermentations were
undertaken.
Figure 5.7 shows the biomass profiles for these two sets of conditions. At both
speeds the biomass production in the STR system is greater than that observed with a
100 mL shake flask system (Figure 5.4). At an agitation rate of 250rpm the biomass
concentration observed increased consistently throughout the first 240 hours of
growth. However, at 500rpm, the biomass level fluctuated, with an initial peak (3.74
g/L at 92 hours). This was followed by a significant reduction to 2.0 g/L at 144
hours. As there is no replicate data for this time point, it is unclear if this biomass
profile is accurate. The maximum biomass concentration achieved in the system at
500rpm, (3.74g/L), was 24% greater than that 250rpm, (2.84g/L). It is postulated
that this effect is attributed to the increased oxygen transfer rates occuring at the
higher agitation rate. Table 5.4 details the maximum values of and Rvb values
obtained for these 1L fermentations.
Time (hours)
Figure 5.7 Biomass profiles for S. natalensis cultivated in a IL fermenter. ( • 500rpm,
O 250rpm,---- shake flask system (100 mL volume))
83

Table 5.4 Maximum growth parameters observed - IL fermentations
Agitation rate (rpm) Max. Yx/s (g/g glucose) Max. Rvb (g/L.h)
250 0.197 0.031
500 0.221 0.041
Due to the limited data available, particularly during the 500 rpm runs, it is difficult
to draw any conclusions about substrate consumption profiles or biomass production
rates. However on the basis of the available data it is obvious that as the system is
scaled up from shake flask to STR, higher biomass levels are achieved and that
higher biomass concentrations are supported by the higher agitation rates
investigated.
The morphological development of S. natalensis in the 1L STR is outlined in Figure
5.8. As can be seen, at an agitation rate of 250rpm, the particle area decreases
steadily to the minimum observed value of 1.555 * 10"3 mm2, at the end of the
fermentation. Again, as with the biomass profiles, this morphological profile is
much smoother than that observed at 500rpm. At the higher speed, the particle area
increases to the maximum area observed, 4.580 * 10"3 mm2, at the end of the
fermentation with one sharp reduction at 144 hours corresponding to a similar
reduction in the biomass profiles (Figure 5.7). However as previously mentioned
only one sample was taken at this time point and the data are not, therefore, reliable.
It should be noted that during each of these 1L runs, five samples, each of 35 mL,
were harvested. This volume constituted approximately 22% of the total working
volume. As was evident from the volume studies (Section 5.3), morphological
profiles obtained during batch cultivation are strongly dependent on the prevailing
hydrodynamic and/or oxygen transfer conditions. As the broth volume was reduced
by sampling, both oxygen transfer rates and specific power input to the system might
reasonably be expected to increase, with consequences for both growth and
morphological characteristics. As sample volumes of at least 35 mL were required
for comprehensive broth analysis, this is an inherent limitation of batch cultivation
studies at the 1L scale.
84

0.016
Time (hrs)
Figure 5.8 Morphological profiles of S. natalensis in 1L fermenter (# 500 rpm, O
250 rpm, shake flask system (100 mL volume))
5.4.2 10 LITRE FERMENTATIONS
Cultivation of the organism was scaled up to the ‘Micogen’ 16L fermenter. A
working volume of 10L of production medium was used. The purpose of this scale
up was to facilitate repeated sampling of the fermentation broth. Because of the
larger volumes employed in the ‘Micogen’ system, multiple sampling does not affect
the volume to any great extent, thereby minimising the volume-related variations in
oxygen mass transfer and agitation intensity encountered in the 1L vessel. As
detailed in Section 3.4.3.4, an agitation rate of 400rpm and an aeration rate of 1 .Owm
were used in all cases. Three fermentations were performed under these conditions
and the data presented in this section represent the mean values for these runs.
Biomass, dissolved oxygen and sugar profiles are presented in Figure 5.9. Biomass
85

concentration data only exists for one of the three runs (Figure 5.10 (a)) as there were
initial problems with suspended solids in the medium. Error bars are omitted from
Figure 5.10 (b) for clarity.
As can be seen, the dissolved oxygen concentration decreases gradually to
approximately 40% while the biomass concentration increases to a maximum value
of 2.61g/L. From Figure 5.9(c) it can be seen that after approximately 76 hours, the
sugars present in the medium are exhausted and therefore, the fermentations were
terminated at this time. The biomass concentration, observed at this agitation rate, is
low compared to both the 1L fermenter and the shake flask results. Visually, it
appeared that an agitation rate of 400 rpm was sufficient to prevent cell settling, and
therefore the oxygen concentrations presented in Figure 5.9(b) are representative of
the concentrations to which the organism was exposed. Thus, if intra-pellet diffusion
limitations can be discounted, it appears as if oxygen limitation should not be an
issue for this broth. Ideally, however, further runs should be undertaken at higher
aeration rates, or at higher operating pressure with a view to investigating the
influence of dissolved oxygen levels on system performance. However, for the
reasons outlined in Section 3.4.4.4, no further runs could be undertaken with the
‘Micogen’ vessel.
As can be seen from a comparison of Figure 5.10 and Figure 5.5, Yx/S (and Rvb)
profiles deviate significantly from those observed in shake flasks. In both cases the
values for the 10L fermentations increase constantly to the maximum values
observed. It is postulated that the smoother trends observed for these runs are
attributable to the maintenance of uniform conditions for the duration of the
cultivation period coupled with the elimination of flask/flask variations.
86

(a)
(b)
(c)
ox n—9baXo<Dj>'oMWQ
CL)
oo£}O
Tim e (hours)
Time (hours)
Time (hours)
Figure 5.9 Profiles for (a) biomass, (b) dissolved oxygen and (c) total extracellular
reducing sugars during a 10L fermentation. (N = 400 rpm, aeration rate = 1
vvm)
87

(a)
(b)
Time (hours)
Time (hours)
Figure 5.10 Observed values for (a) Yx/s and (b) Rvh for I0L fermentations
Figure 5.11 shows the morphological profile for S. na ta lensis when cultivated in the
16L fermenter. Clearly, the particle area increases as the fermentation progresses,
with the maximum particle area observed at approximately 66 hours. After this
maximum has been reached the particle area begins to decrease slightly. This trend
is similar to those observed in shake flask fermentations over the same time period.
88

Time (hours)
Figure 5.11 Morphological development of S. natalensis during 10L fermentations (• )
and shake flask cultures (O)
89

CH APTER 6
RESULTS AND DISCUSSIO N: M ED IA STUDIES
6.1 T H E E F F E C T O F M E D IA C O M P O N E N T S O N T H E G R O W T H A N D
M O R P H O L O G IC A L C H A R A C T E R IS T IC S O F S. N A T A L E N S IS
These studies were undertaken to determine the effects of medium composition on
the growth and morphology of the organism. In all cases, 250 mL Erlenmeyer shake
flasks were employed, with a working volume of 100 mL. Both Mahon (1990) and
McCabe (1990) used inoculum medium and production medium in their studies of S.
natalensis. In this study, as mentioned in Section 5.1, to avoid the presence of
suspended solids in the medium, both unbuffered and buffered fermentation media
were used. The effect of nitrogen source on the cultivation of filamentous micro
organisms is well documented (e.g. Brana et a l, 1986; Vining et al., 1987;
Glazebrook et al., 1993; He et al., 1995). Therefore it was decided, in this study, to
study the effects of YEPD medium and peptone medium on the growth and
morphological characteristics of S. natalensis. Sarra et al. (1996) reported high
biomass yields in fermentations of Saccharopolyspora erythraea, and it was also
decided to cultivate S. natalensis in the medium employed. The various media are
described in Section 3.3.
6.1.1 BIOMASS PRODUCTION
Figure 6.1 outlines the biomass profiles observed with each of the seven media used
in the cultivation of S. natalensis. A minimum of two replicate runs were performed
using the actinomycete medium (Sarra et al., 1996) and the inoculum medium, with
duplicate flasks sampled at each point; four replicate runs for YEPD, peptone and
unbuffered fermentation media; five runs using production medium and ten using
buffered fermentation medium. All runs were terminated after 200 hours, with the
exceptions of those employing buffered fermentation medium and production
medium which were allowed to run for 240 hours. The data presented in this section
are the mean values for the relevant runs.
90

Bio
mas
s (g
/L)
YEPD medium
*âonC/ÌO
» T*H
CO
Time (hours)
Actinomycete medium
Time (hours)
Production medium
Time (hours)
âc3Ù02
Peptone medium U nbuffered m edium Inoculum medium Buffered m edium
Time (hours) Time (hours) Time (hours) Time (hours)
Figure 6.1 Effect of medium composition on batch growth curve (# biomas, Oextracellular total reducing sugars)

Table 6.1 outlines the maximum biomass concentrations obtained with each
medium and the time taken to reach these biomass levels. The highest biomass
levels were obtained with YEPD medium (4.47g/L) and the actinomycete medium
(3.43g/L) described by Sarra et al. (1996) suggesting that the yeast extract
contained in both media contributes to elevated biomass production. The lowest
biomass level, 0.496g/L, was observed using the unbuffered fermentation medium;
as stated in Section 5.1, poor biomass accumulation in this case was attributed to
pH limitation. It appears as if the choice of buffer employed has little effect on
maximum biomass concentration as both buffered fermentation medium (phosphate
buffer) and production medium (buffered by calcium carbonate) yield
approximately the same biomass concentration.
T ab le 6.1 Maximum biomass concentrations for media studies
C u ltiva tion m edium M axim um biom ass
(g/L)
T im e tak en to re ach
m ax im um biom ass (h)
YEPD 4.47 120.3
Actinomycete 3.43 193.7
Buffered fermentation 2.61 223.5
Production 2.11 239.0
Inoculum 1.53 74.33
Peptone 1.34 143.0
Unbuffered fermentation 0.50 57.50
Although it can also be seen from Table 6.1 that unbuffered fermentation medium
resulted in the shortest time to reach the maximum biomass for the fermentation,
virtually no growth occurred and thus this medium cannot be compared to the other
six employed.
Inoculum medium and YEPD medium, which do not contain added buffers,
resulted in maximum biomass levels at 74.3 hours and 120.25 hours, respectively.
Although the actinomycete medium developed by Sarra et al., (1996) is not
buffered, the organism takes longer to reach its maximum biomass than the peptone
medium. This may be associated with an inhibitory effect of the high initial
92

glucose concentration (40g/L) in the actinomycete medium. This glucose effect is
examined in more detail in Section 6.5. Production medium, designed to support
the production of pimaricin (Struyk and Waisvisz, 1975), resulted in the longest
time to reach maximum biomass, 239 hours. However, this is only slightly longer
than for the buffered fermentation medium (223.5 hours).
6.1.2 EFFEC T O F M EDIA COM PONENTS ON BIOM ASS YIELD
C O EFFICIEN TS
Figure 6.2 outlines the biomass yield coefficients observed with each of the media
employed. The maximum biomass yield (0.665g/g glucose) was also obtained with
YEPD medium; the lowest (0.122g/g glucose) with the production medium.
0.7
0.6
0.5'o'cdI 0.43COtU)^ 0.3
0.2
0.1
0.0
Figure 6.2 Maximum biomass yield per gram of glucose utilised during media studies
With regard to the specific biomass production rate, Rvb, it can be seen from Figure
6.3 that the maximum value observed during the media studies was with
93

actinomycete medium (0.067g/L.h). The lowest value, 0.018g/L.h, was noted with
buffered fermentation medium.
0.08 *1
0.07 -
0.06 -
^ 0.05 -
^ 0.04 -
P=H0.03
0.02 -
0.01 -
0.00
Figure 6.3 Maximum specific biomass production rates observed during media studies
As stated in Section 5.3, the Yx/s values for the volume study fermentations
decrease from the maximum value to stabilise at a value that is maintained for the
remainder of the fermentation. A similar trend occurs for most of the fermentations
in this study with two exceptions. When unbuffered medium is used in the
cultivation of S. natalensis, the Yx/S values decrease and do not stabilise. This is
due to the suspension of biomass production after the pH drops below pH 4.0. All
substrate use also ceases at this point. The Yx/S values for the fermentation using
the actinomycete medium developed by Sarra et al. (1996) also decrease and do not
stabilise after the maximum values. From Figure 6.1 it can be seen that the
biomass concentrations continued to increase throughout the duration of
cultivation; the system did not reach stationary phase. This resulted in the observed
lack of stabilisation in Y ^ values.
94

Also, as stated in Section 5.3, the Rvb values for each of the fermentations outlined
decreases after the maximum recorded value to a stable value that is maintained for
the duration of the cultivation periods. Table 6.2 lists the overall values for Yx/s and
Rvb recorded for each medium. Clearly when using phosphate buffer, the overall
Rvb value is very low.
Table 6.2 O verall Y x /S and R v b values fo r shake flask cu ltu res - m ed ia stud ies
M edium O verall Y x /s (g/g glucose) O verall Rvb (g/L.h)
Y EPD 0.219 0.022
A ctinom ycete 0.188 0.018
B uffered 0.099 0.008
P roduction 0.081 0.009
Inocu lum 0.164 0.010
Pep tone 0.048 0.005
U nbuffered 0.019 0.003
6.1.3 M O R PH O LO G IC A L CONSEQUENCES O F M EDIA M AN IPULA TIO N
As very little morphological characterisation of S. natalensis has been performed,
semi-automated image analysis was used in this study to monitor the
morphological development of the organism. Medium components have been
observed to affect the morphology of actinomycetes, and other filamentous
organisms (Reeslev et al., 1991; Glazebrook el al., 1992; Reichl el al., 1992b;
Banerjee, 1993). During the media studies reported here it was observed that no
significant changes in the overall morphological form of S. natalensis, were
associated with the choice of cultivation medium.
Table 6.3 shows the values for particle diameter and perimeter observed in each
medium after approximately 200 hours of culitvation. Figure 6.4 outlines the
development of particle area during cultivation in the seven media used. As with
the biomass values (Section 6.1.1), the values presented in this section are the
average values obtained for all relevent runs performed.
95

Table 6.3 Average morphological characteristics for shake flask cultures in various
media after 200 hours of cultivation
M edium Perim eter (m m) D iam eter (m m )
YEPD 0.099 0.026
Actinomycete 0.113 0.030
Buffered 0.216 0.052
Peptone 0.190 0.047
Inoculum 0.113 0.030
Production 0.220 0.051
Unbuffered 0.435 0.067
On the basis of average particle perimeter, diameter and area, after 200 hours of
cultivation, the smallest particles were observed in the YEPD and actinomycete
media, which supported the highest levels of growth. When buffer is added, the
mean particle area increases, with all unbuffered media (YEPD, actinomycete and
inoculum media) yielding smaller particle dimensions than either buffered media or
production medium. While the final particle measurements observed when the
organism is cultivated in unbuffered fermentation medium are greater than those
for any other medium, this may be due, in part, to the severe pH conditions the
organism experienced in this fermentation and is discounted due to the lack of
growth. The organism formed the largest pellets when grown in production
medium (3.377 * 10'3mm2)(Figure 6.4). The presence of yeast extract and peptone
in media result in the formation of small ‘hairy’ pellets. It was also observed that,
as the nitrogen source was changed from inorganic to organic, the particle area
decreased.
96

YEPD medium
KS<DJh"ot:ctì
0.02
0 . 0 1 -
^ 0.00
Actinomycete medium0.02
0.01
Production medium
T I - I
0 60 120 180 240
0.00
Tim e (hours)
Peptone medium Unbuffered medium
0 60 120 180 240
Tim e (hours) Tim e (hours)
Inoculum medium Buffered medium0.02
0.01 J
0.00
0.02
1 r r0 60 120 180 240
0.01 -
0.00 i i r0 60 120 180 240
Tim e (hours) Tim e (hours) Tim e (hours)
Figure 6.4 Particle area development during batch cultivation
Tim e (hours)

Analysis of the system morphology after a specified cultivation period is a
convenient and useful way of comparing the influence of various media. However,
these results would obviously be enhanced by more comprehensive media profiles
{e.g. nitrgen, phosphate) which might reveal evidence of nutrient limitation at
earlier stages in the cultivation period which would impact on subsequent
morphological profiles.
6.1.4 RELATIONSHIP BETWEEN MORPHOLOGY AND G R O W T H PARAMETERS
As can be seen in Figure 6.4 the particle areas observed during the medium studies
fluctuate, and in all cases, the maximum particle area is observed within the first
100 hours of cultivation. It was decided to compare the morphological
development with the biomass production rate profiles observed for the peptone
run. This medium was only taken as an example to illustrate the relationship
between biomass and pellet morphology in shake flask cultivations.
Figure 6.5 compares particle diameter development with both Yx/s and Rvb profiles
during the cultivation of the organism in peptone medium. Clearly, the initial
development of the particle diameter cannot be correlated with Yx/s and Rvb values.
However, when the organism begins to stabilise morphologically (at approximately
120 hours), both the Yx/s and Rvh values also reach their stable levels. Therefore a
possible relationship between the final morphology of the organism and the overall
values for Yx/s and R^ was further investigated.
Figure 6.6 compares the final particle diameter of S. natalensxs in all shake flask
cultures with the corresponding overall Yx/s values. As is clear from this graph, the
scatter of the data is too great to indicate a relationship between these two
parameters.
98

Time (hours)
Time (hours)
(C)
Time (hours)
Figure 6.5 Variation in (a) particle diameter, (b) Yx/s and (c) Rvb f°r S. natalensis in
peptone medium.
99

0.12
t 3
t >
<u>—Ho
Spm
0.09
0.06
0.03
• •
0.00 i 1- - - - r— - - 1--- i--- 1- - - - 1- - - - r0.00 0.04 0.08 0.12 0.16 0.20 0.24 0.28 0.32
Overall Yx/s(g/g substrate)
Figure 6.6 Relationship between overall Yx/S values and final particle area for all
Investigated media.
However, as outlined in Figure 6.7, it can be postulated that a relationship exists
between the overall Rvb values observed for shake flask cultivation of S. nalalensis and the corresponding final morphological parameters. This trend is independent
of medium composition or their concentration. The particle diameter increases
sharply as the Rv), increases initially to a value of approximately 0.07 g/L.h. This
seems to indicate that at either very low or very high specific biomass production
rates, the average area of individual particles is also small.
100

0.08
0.000.000 0.005 0.010 0.015 0.020 0.025
Overall Rvb (g/L.h)
Figure 6.7 Relationship between overall specific biomass production rate and final
particle area for all investigated media
The specific growth rates for the seven media studied, were also calculated. A
possible correlation between these data and the corresponding morphological
measurements was investigated but, as can be seen from Figure 6 .8, there was no
apparent relationship. This difficulty in relating the particle morphology as
characterised by average particle diameter to the growth rate is thought to be due to
the increasing heterogeneity of morphological forms present in the fermentation
broth throughout the cultivation period (Section 4.7.2).
101

0.30
0.25
I 0.20
(3-4->►<D| 0.15
<D
• | 0.10 Pn
0.05
0.000.00 0.01 0.02 0.03 0.04 0.05
Growth rate (h '1)
Figure 6.8 Investigation of relationship between growth rate and particle morphology
6.2 EFFECT OF MEDIA MANIPULATION ON S. natalensis
In an attempt to optimise the buffered fermentation medium used in the majority of
shake flask studies on S. natalensis, and originally recommended by Struyk and
Waisvisz (1975), the concentrations of a number of key components were varied.
The subsequent effects on both the morphological and growth characteristics of the
organism were monitored. The concentration ranges studied in this and all
subsequent studies are not complete but provide an indication of the influence of
various components on system performance. Table 6.4 summarizes the
concentrations of the media components used in these studies. All fermentations
were duplicated while the control fermentation, using buffered fermentation
medium, was run ten times. In the case of the carbonate studies, production
medium, also recommended by Struyk and Waisvisz (1975), was used as the
control medium.
102

Table 6.4 Summary o f media studies
Component Medium Control Concentration(g/L)
Range Investigated(g/L)
Nitrogen(NH4)2S04
Bufferedfermentation
5 2.5-10
NitrogenPeptone
Peptone 5 2.5-10
CarbonateCaC03
Production 8 4 -1 6
CarbonateNa2C03
Production CaC03 8g/L 8
CarbonateNaHC03
Production CaC03 8g/L 8
Phosphate Bufferedfermentation
0.2 0.2 - 0.8
Corn Steep Powder
Bufferedfermentation
1 1 -4
Glucose BufferedFermentation
30 10-40
6.2.1 ORGANIC VERSUS INORGANIC NITROGEN SOURCESFrom a cursory examination of the data presented in Table 6.1 and Figures 6.2 and
6.3, clear differences exist between the growth characteristics of S. natalensis when
cultivated in buffered fermentation medium, containing inorganic nitrogen, and
peptone medium, where the main nitrogen source is organic. These effects may be
due, not just to the choice of nitrogen source, but also the nitrogen concentrations
in the media. In the buffered fermentation medium, nitrogen constituted 1.06 g/L
of the 5 g/L ammonium sulphate added. In the peptone medium, only 0.7 g/L of
the 5 g/L peptone was accounted for by nitrogen. Ideally, trials should have been
performed at equal initial nitrogen concentrations. All other components in these
media are identical. Peptone medium, although yielding a lower maximum
biomass concentration than the buffered fermentation medium (Table 6.1), resulted
in a greater Y^, value (Figure 6.2) and the greatest overall Rvb value (Figure 6.3).
Figure 6.9 outlines the differences in the observed biomass profiles for S. natalensis when cultivated in buffered fermentation medium containing inorganic
nitrogen - (NH4)2S04, peptone medium (organic nitrogen) or a medium containing a
103

combination of both nitrogen sources. Each of these trials was repeated a number
of times: ten times for the buffered fermentation medium containing ammonium
sulphate; four times for the peptone medium; twice for the medium containing both
nitrogen sources, with duplicate samples taken for each time point. Error bars were
omitted from Figure 6.9 for clarity, but did not exceed 20%.
Time (hours)
Figure 6.9 Biomass profiles during shake flask cultivations using different nitrogen
sources ( O (NI [4)2804 ; £ peptone; | (NH4)2S0 4 and peptone)
Clearly the highest final biomass concentration, (1.817g/L) is achieved with an
inorganic nitrogen source. The lowest overall biomass concentration (1.193g/L)
was observed when peptone medium was used to cultivate the organism. However,
given that the ratio of these levels (1.52) is almost identical to the ratio of the initial
nitrogen concentration in the media, (1.51), it is difficult to infer any effect
independently associated with the choice of nitrogen source. The highest biomass
concentration at any stage, nearly double that obtained using organic nitrogen, was
observed when the organism was grown in buffered fermentation medium
104

supplemented peptone. This biomass level was reached faster than the maximum
biomass observed with either of the other media.
Table 6.5 outlines the Yx/s and Rvb values obtained during these nitrogen studies.
As was evident from Figure 6.2, the maximum biomass yield increases as the
nitrogen source changes from inorganic to organic. Glazebrook et al. (1993) also
noted, in studies on S. akiyoshiensis, that inorganic nitrogen resulted in lower
biomass yields.
Table 6.5 Biomass yields for nitrogen studies
Nitrogen source Max. Yx/S (g/g glucose)
Max. Rvfo (g/L.h)
Overall Yx/S (g/g glucose)
Overall Rvb (g/L.h)
(NH4)2S04 0.134 0.018 0.099 0.0076
(NH4)2S0 4 and peptone 0.239 0.021 0.077 0.0053
Peptone 0.267 0.026 0.048 0.0050
The maximum overall Yx/s and Rvb values were observed when the peptone was the
sole nitrogen source available to the organism. Flowever, as can be seen from
Table 6.5, the overall Yx/s and Rvb values behave differently to the maximum values.
As the nitrogen source is changed from inorganic to organic the overall values for
Yx/s and Rvb decrease. The maximum values observed at the end of the
fermentations were when ammonium sulphate was used as the sole nitrogen source.
This medium yielded an overall Yx/s value over twice that observed with peptone
medium.
It can be seen, from Figure 6.10, that the morphological profiles of S. natalensis exhibit very similar trends regardless of the nitrogen source employed. In all three
cases, a local maximum in particle area occurred at approximately 75 hours. At
this stage, the smallest particles (5.162 * 10‘3mm2) were formed in buffered
fermentation medium supplemented with peptone. The largest particles
(0 .011mm2) occurred in buffered fermentation medium (inorganic nitrogen source).
These particles were over twice the size of those observed with the peptone
supplemented medium.
105

0.012
0 . 0 1 0 -
^ 0.008 - B,cd
| 0.006 -<D
O
(2 0.004 -
0.002 -
0 . 0 0 0 -
0 50 100 150 200 250
Time (hours)
Figure 6.10 Morphological profiles for S. natalensis with varying nitrogen sources (O
(NH4)2S0 4 ; £ peptone; | (NH4)2S04 and peptone)
The same trends apply to the final particle areas. The largest final mean particle
area (2.214 * 10'3mm2), occurred in the buffered fermentation medium, with the
smallest (1.307 * 10"3mm2) in the supplemented buffered fermentation medium.
6.2.2 EFFECT OF AMMONIUM SULPHATE CONCENTRATIONThe concentration of ammonium sulphate used in buffered fermentation medium is
5g/L, and this was varied to ascertain the effects of inorganic nitrogen
concentration on growth. It can be seen from both Table 6.6 and Figure 6.11 that
of the range of conditions investigated, this concentration is optimal, yielding the
maximum growth characteristics - 2.116g/L biomass, 0.134g/g glucose and
0.018g/L.h.
106

Table 6.6 Effect o f ammonium sulphate concentration in buffered fermentation medium
on shake flask culture characteristics (control conditions highlighted)
Ammonium sulphate concentration (g/L)
Max. Y x/s (g/g glucose)
Max. Rvb (g/L.h)
Overall Yx/S (g/g glucose)
Overall Rvb (g/L.h)
2.5 0.117 0.013 0.117 5.888 * 10^
5.0 0.134 0.018 0.099 7.600 * IO’-*7.5 0.085 0.013 0.073 5.697 * 10--*
10.0 0.060 0.012 0.057 5.336 * IO'-5
Once the concentration of ammonium sulphate is changed, the maximum biomass
concentration and Rvb decrease, by approximately 50% in the case of biomass
concentration, regardless of whether the concentration of ammonium sulphate is
increased or decreased. The maximum also decreases if the concentration of
ammonium sulphate is varied. When the concentration was decreased to 2.5g/L the
Yx/s value decreases slightly. When the concentration was increased beyond 5g/L,
the reduction in biomass yield was even more severe, falling from 0.134g/g glucose
to 0.060g/g glucose when the ammonium sulphate concentration was doubled to
lOg/L.
In relation to the overall values noted for Rvb, the same trends are clear. 5g/L yields
the maximum overall value. The overall values for Yx/s, however, behave
differently, with 2.5g/L ammonium sulphate resulting in the highest value. As the
concentration increases, the Yx/S values decrease.
With respect to morphology, the data presented in Table 6.7 represent the final
average particle areas, observed at approximately 200 hours. The smallest particles
were formed when the organism was cultivated under the control conditions (5g/L
of ammonium sulphate). As the ammonium sulphate concentration is increased,
the particle area increases, from 2.637 x 10"3mm2 to 3.109 x 10'3mm2, observed
when lOg/L is used. The greatest increase is seen when the concentration of
ammonium sulphate is reduced to 2.5g/L. It can be seen from the data presented
that, even though the smallest particle area was observed at an ammonium sulphate
concentration of 5g/L, both the perimeter and diameter were greater than those
107

observed for both 2.5g/L and lOg/L. This indicates that these particles are ‘hairier’
than those formed in media containing other concentrations of ammonium sulphate.
2.5
2.5 5.0 7.5 10.0
Concentration of Ammonium sulphate (g/L)
Figure 6.11 Maximum biomass concentrations observed during ammonium sulphate
studies (control concentration highlighted)
Table 6.7 Morphological characteristics observed during optimisation of ammonium
sulphate concentration in buffered fermentation medium (control conditions
highlighted)
Ammonium sulphate concentration (g/L)
Average particle area (mm2)
Perimeter (mm) Diameter (mm)
2.5 4.028 * 10-3 0.161 0.045
5.0 2.637*10-3 0.216 0.0527.5 2.932 * 10-3 0.180 0.048
10.0 3.109 * 10-3 0.175 0.046
108
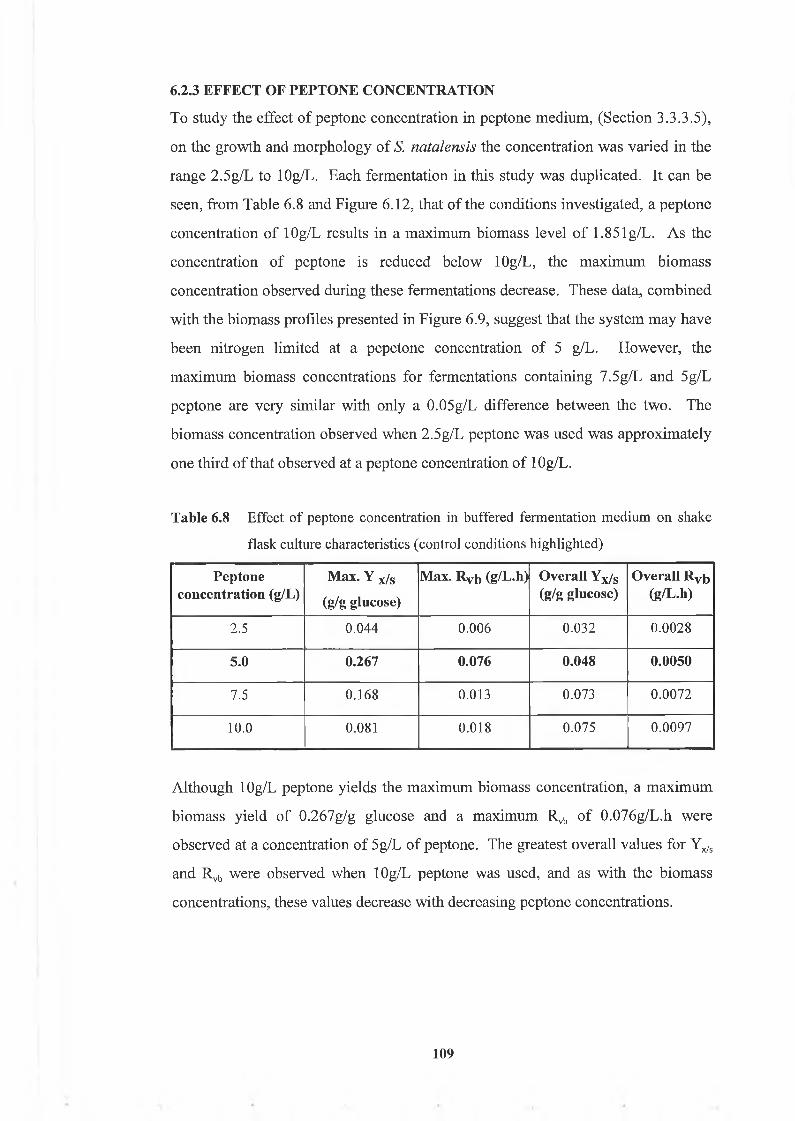
6.2.3 EFFECT OF PEPTONE CONCENTRATIONTo study the effect of peptone concentration in peptone medium, (Section 3.3.3.5),
on the growth and morphology of S. natalensis the concentration was varied in the
range 2.5g/L to lOg/L. Each fermentation in this study was duplicated. It can be
seen, from Table 6.8 and Figure 6.12, that of the conditions investigated, a peptone
concentration of lOg/L results in a maximum biomass level of 1.851 g/L. As the
concentration of peptone is reduced below lOg/L, the maximum biomass
concentration observed during these fermentations decrease. These data, combined
with the biomass profiles presented in Figure 6.9, suggest that the system may have
been nitrogen limited at a pepetone concentration of 5 g/L. However, the
maximum biomass concentrations for fermentations containing 7.5g/L and 5g/L
peptone are very similar with only a 0.05g/L difference between the two. The
biomass concentration observed when 2.5g/L peptone was used was approximately
one third of that observed at a peptone concentration of lOg/L.
Table 6.8 Effect of peptone concentration in buffered fermentation medium on shake
flask culture characteristics (control conditions highlighted)
Peptone concentration (g/L)
Max. Y x/s (g/g glucose)
Max. Rvb (g/L.h) Overall Yx/S (g/g glucose)
Overall Rvfo (g/L.h)
2.5 0.044 0.006 0.032 0.0028
5.0 0.267 0.076 0.048 0.00507.5 0.168 0.013 0.073 0.0072
10.0 0.081 0.018 0.075 0.0097
Although 1 Og/L peptone yields the maximum biomass concentration, a maximum
biomass yield of 0.267g/g glucose and a maximum Rvb of 0.076g/L.h were
observed at a concentration of 5g/L of peptone. The greatest overall values for Yx/s
and Rvb were observed when lOg/L peptone was used, and as with the biomass
concentrations, these values decrease with decreasing peptone concentrations.
109

2.5
2.0
2.5 5.0 7.5 10.0
Peptone concentration (g/L)
Figure 6.12 Maximum biomass concentrations observed during the optimisation of the
peptone medium (control conditions highlighted)
As can be seen from Table 6.9, the largest particles with an average area of 8.082 x
10~3mm2 were observed when the organism was cultivated in 7.5g/L of peptone.
Cultivation in 5g/L of peptone resulted in the smallest particles, 1.537 x 10 !mm2.
These pellets were ‘hairier’ than the others observed in this study with the
smoothest seen with 7.5g/L peptone. These morphological parameters were
observed at approximately 200 hours.
Table 6.9 Morphological characteristics observed after 200 hours during optimisation of
peptone medium (control conditions highlighted)
Peptone concentration(g/L)
Average particle area (mm2)
Perimeter (mm) Diameter (mm)
2.5 1.901 * 10-3 0.150 0.041
5.0 1.537 * 10-3 0.190 0.0477.5 8.082 * 10-3 0.351 0.092
10.0 2.744 * 10-3 0.225 0.056
110

6.2.4 CARBONATE STUDIES6.2.4.1 EFFECT OF CALCIUM CARBONATE CONCENTRATIONTo observe the effect of the concentration of calcium carbonate in production
medium on the growth of S. natalensis, concentrations of between 4g/L and 16g/L
were investigated. The control value used in these studies was 8g/L (production
medium). As can be seen from Figure 6.13, the maximum biomass concentration
was observed at a calcium carbonate concentration of 4g/L. However the
difference in the biomass concentrations obtained is not great, with approximately
0.6g/L between the maximum and minimum values observed.
The maximum biomass yield, 0.122g/g glucose, was achieved at a concentration of
8g/L (Table 6.10). As the carbonate concentration is increased to 16g/L, it can be
seen that the biomass yield per gram of glucose falls from 0 .122g/g glucose to
0.065g/g glucose. When the concentration of calcium carbonate is halved to 4g/L
the value also decreases, (0.085g/g glucose). A similar trend is observed for
the Rvb values and the overall values for Yx/s.
4.0 8.0 12.0 16.0
Concentration of Calcium carbonate (g/L)
Figure 6.13 Maximum biomass concentrations observed during optimisation studies of
production medium (control conditions highlighted)
111

Table 6.10 Effect o f calcium carbonate on the growth characteristics o f S. natalensis in
production medium (control conditions highlighted)
CaC03
concentration (g/L)Max. Y x/s (g/g glucose)
Max. Rv b
(g/L.h)Overall Yx/S (g/g
glucose)Overall Rv b
(g/L.h)4.0 0.085 0.032 0.078 0.013
8.0 0.122 0.040 0.081 0.00912.0 0.066 0.011 0.066 0.011
16.0 0.065 0.010 0.065 0.010
Table 6.11 shows the effect of the carbonate concentration on the morphological
characteristics of the organism during shake flask cultivation. It was observed that
the maximum particle area occurred at a concentration of 16g/L. As the
concentration of calcium carbonate was decreased below this value, the particle
area, perimeter and diameter decrease.
Table 6.11 Morphological characteristics observed after 200 hours during optimisation of
calcium carbonate concentration (control conditions highlighted)
CaC0 3 concentration (g/L) Particle area (mm2) Perimeter (mm) Diameter (mm)4.0 4.588 * 10-4 0.094 0.026
8.0 3.377 * 10--5 0.220 0.05112.0 3.508 * 10^ 0.236 0.054
16.0 3.826 * 10^ 0.243 0.059
6.2.4.3 INFLUENCE OF CARBONATE SOURCEIn an attempt to reduce the level of suspended solids in the medium, other
carbonate sources were investigated and their effects on the growth of the organism
monitored. It appears, from Table 6.12, that these carbonate sources were
unsuitable for the cultivation of S. natalensis. Final biomass levels were
approximately one tenth (with either of the replacement carbonate sources) of those
observed with calcium carbonate. These replacement sources also resulted in very
low Yx/S and Rvb values compared to those observed when the organism was
cultivated in production medium. For this data it can be concluded that no growth
occurred and no further efforts to identify an alternative source were undertaken.
112
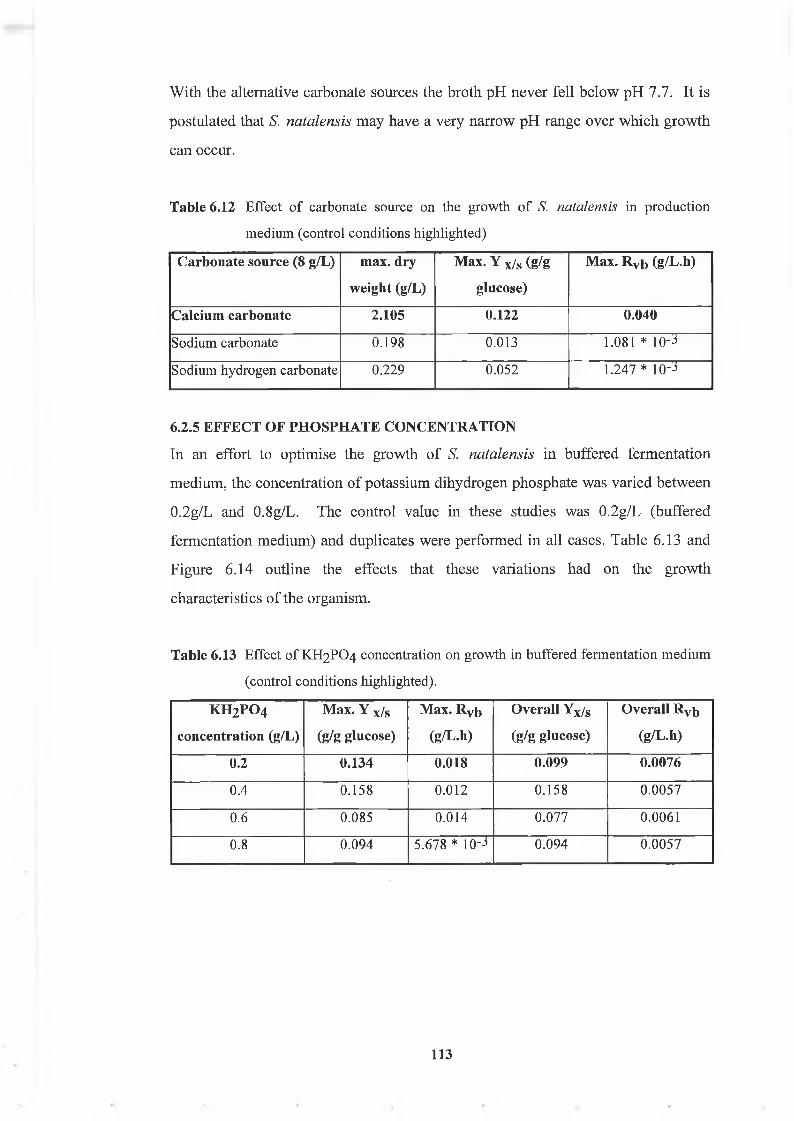
With the alternative carbonate sources the broth pH never fell below pH 7.7. It is
postulated that S. natalensis may have a very narrow pH range over which growth
can occur.
Table 6.12 Effect of carbonate source on the growth of S. natalensis in production
medium (control conditions highlighted)
Carbonate source (8 g/L) max. dry weight (g/L)
Max. Y x/s (g/g glucose)
Max. Rvb (g/L.h)
Calcium carbonate 2.105 0.122 0.040Sodium carbonate 0.198 0.013 1.081 * 10-^
Sodium hydrogen carbonate 0.229 0.052 1.247 * 10-J
6.2.5 EFFECT OF PHOSPHATE CONCENTRATIONIn an effort to optimise the growth of S. natalensis in buffered fermentation
medium, the concentration of potassium dihydrogen phosphate was varied between
0.2g/L and 0.8g/L. The control value in these studies was 0.2g/L (buffered
fermentation medium) and duplicates were performed in all cases. Table 6.13 and
Figure 6.14 outline the effects that these variations had on the growth
characteristics of the organism.
Table 6.13 Effect of KH2PO4 concentration 011 growth in buffered fermentation medium
(control conditions highlighted).
KH 2PO4
concentration (g/L)Max. Y x/s (g/g glucose)
Max. Rvb (g/L.h)
Overall Yx/s (g/g glucose)
Overall Rvfo(g/L.h)
0.2 0.134 0.018 0.099 0.00760.4 0.158 0.012 0.158 0.0057
0.6 0.085 0.014 0.077 0.0061
0.8 0.094 5.678 * 10-^ 0.094 0.0057
113

With the alternative carbonate sources the broth pH never fell below pH 7.7. It is
postulated that S. natalensis may have a very narrow pH range over which growth
can occur.
Table 6.12 Effect of carbonate source on the growth of S. natalensis in production
medium (control conditions highlighted)
Carbonate source (8 g/L) max. dry weight (g/L)
Max. Y x/s (g/g glucose)
Max. Rv b (g/L.h)
Calcium carbonate 2.105 0.122 0.040Sodium carbonate 0.198 0.013 1.081 * 10‘3
Sodium hydrogen carbonate 0.229 0.052 1.247 * 10-3
6.2.5 EFFECT OF PHOSPHATE CONCENTRATIONIn an effort to optimise the growth of S. natalensis in buffered fermentation
medium, the concentration of potassium dihydrogen phosphate was varied between
0.2g/L and 0.8g/L. The control value in these studies was 0.2g/L (buffered
fermentation medium) and duplicates were performed in all cases. Table 6.13 and
Figure 6.14 outline the effects that these variations had on the growth
characteristics of the organism.
Table 6.13 Effect of KH 2PO4 concentration on growth in buffered fermentation medium
(control conditions highlighted).
K H 2PO4
concentration (g/L)Max. Y x/s (g/g glucose)
Max. Rvb (g/L.h)
Overall Yx/S (g/g glucose)
Overall Rvb (g/L.h)
0.2 0.134 0.018 0.099 0.00760.4 0.158 0.012 0.158 0.0057
0.6 0.085 0.014 0.077 0.0061
0.8 0.094 5.678 * 10-3 0.094 0.0057
113

2.5
â ‘-5
2.0 -
0.5
0.00.2 0.4 0.6 0.8
Concentration of KH2P 0 4 (g/L)
Figure 6.14 Maximum biomass concentrations observed during phosphate studies
For the concentration range studied, the maximum biomass concentration
(2.116g/L), and highest specific biomass production rate were obtained at the
control conditions. Increasing the concentration of potassium dihydrogen
phosphate beyond this value results in a reduction of approximately lg/L,
regardless of the increase. The inhibitory effect of phosphate was also reported for
the actinomycete, S. clavuligerus, (Liibbe et al., 1985; Lebrihi et al., 1987). As
outlined in Table 6.13, the maximum biomass yield per gram of glucose utilised
was observed at a potassium dihydrogen phosphate concentration of 0.4g/L. When
the concentration was increased to 0.6g/L, the yield dropped from 0.158g/g to
0.085g/g. Similar trends were observed for the overall values of Yx/s and Rvb.
Using 0.2g/L of KH2P 0 4, the maximum value for Rvb was achieved.
The concentration of potassium dihydrogen phosphate in the medium also affects
the morphology observed during the fermentation as is outlined in Table 6.14. The
(control conditions highlighted).
114

area, perimeter and diameter do not behave in a similar fashion, suggesting
variations in the ‘hairiness’ of the particles. The maximum particle area was
observed at 0.8g/L of potassium dihydrogen phosphate. If the concentration of
KH2P 0 4 is decreased to 0.6g/L, the mean particle area decreases to the minimum
value observed in this study.
Table 6.14 Effect of variations in KH2PO4 concentration in buffered medium on the
morphology of S. natalensis (control conditions highlighted)
KH 2PO4 concentration(g/L)
Average particle area (mm2)
Perimeter (mm) Diameter (mm)
0.2 2.637*10--* 0.216 0.0520.4 3.609 * 10-Ì 0.195 0.052
0.6 2.582 * 10-3 0.202 0.054
0.8 4.340 * 10-3 0.271 0.070
6.2.6 EFFECT OF GLUCOSE CONCENTRATIONWhen varying the concentration of glucose used in the buffered fermentation
medium it was observed that the control concentration, 30g/L, yielded the
maximum biomass concentration (Figure 6.15). Reductions in the glucose
concentration resulted in a reduction in overall biomass of approximately lg/L
(20g/L glucose) and 0.5g/L (lOg/L glucose). The greatest reduction occurred,
however, when the concentration of glucose was increased to 40g/L. McCabe
(1990) also reported a similar decline in biomass production at glucose
concentrations in excess of 30g/L. When cultivating M. alpina, Lindberg and
Molin (1993) observed that when glucose was in excess the production of
arachadonic acid was inhibited.
115

10 20 30 40Concentration of glucose (g/L)
Figure 6.15 Biomass concentrations observed during glucose optimisation studies
(control conditions highlighted)
However, from Table 6.15 it can be seen that 30g/L glucose yielded the lowest
maximum value of Yx/s, with lOg/L glucose yielding almost double this value. In
relation to overall values, the maximum was observed at 1 Og/L glucose. This
value decreases as the concentration of glucose is increased. The maximum value
for specific biomass production was observed when 3 Og/L of glucose was used.
The minimum Rvb value was observed at 40g/L glucose.
Table 6.15 Optimisation of glucose concentration in buffered fermentation medium
(control conditions highlighted)
Glucose concentration(g/L)
Max. Y x/s (g/g glucose)
Max. Rvb (g/L.h) Overall Yx/S (g/g glucose)
Overall Rvfo (g/L.h)
10.0 0.253 0.010 0.248 0.009
20.0 0.186 0.006 0.186 0.003
30.0 0.134 0.018 0.099 0.00840.0 0.179 0.003 0.028 0.001
116

The inhibitory effects observed at a glucose concentration of 40g/L may be, in part,
responsible for the length of time the organism took to reach its maximum biomass
level when cultivated in the actinomycete medium developed by Sarra el al. (1996),
which was discussed in Section 6.1.1.
The smallest mean particle areas observed during this study occurred at 40g/L
glucose (Table 6.16). This concentration did not result in the greatest percentage of
clumped growth in the fermentation, which occurred at 20g/L glucose. 30g/L
glucose resulted in the greatest particle area.
Table 6.16 Effect of glucose concentration in buffered medium on the morphology of S. natalensis (control conditiond highlighted)
Glucose concentration (g/L) Average particle area (mm2)
Perimeter (mm) Diameter (mm)
10.0 2.523 * 10-3 0.188 0.05120.0 1.377 * 10-3 0.144 0.03930.0 2.637*10--* 0.216 0.05240.0 1.261 * 10-3 0.141 0.038
6.2.7 EFFECT OF CORN STEEP POWDER (CSP) CONCENTRATIONThe final medium component studied in relation to medium optimisation was CSP.
As can be seen from Figure 6.16, the maximum biomass concentration was
observed when 4g/L of CSP was used in buffered fermentation medium. However
there was very little variation in the biomass concentrations with just 0.65g/L
between the maximum, (2.366g/L) and the minimum, (1.724g/L), observed at a
CSP concentration of 2g/L. As can be seen from Table 6.17, however, the reverse
holds for the values of Yx/s observed during this study. The maximum value was
observed when 2g/L CSP was used; the minimum with 4g/L. Overall Rvb values
increase with increasing CSP concentrations.
117

2.5
1.0 2.0 3.0 4.0
Concentration of com steep powder (g/L)
Figure 6.16 Overall biomass concentrations observed during CSP studies (control
conditions highlighted)
Table 6.17 Optimisation of CSP concentration in buffered fermentation medium (control
conditions highlighted)
Corn steep powder concentration (g/L)
Max. Y x/s (g/g glucose)
Max. Rvb (g/L.h)
Overall Yx/S (g/g glucose)
Overall Rvb (g/L.h)
1.0 0.134 0.018 0.099 0.008
2.0 0.155 0.015 0.076 0.0093.0 0.131 0.020 0.090 0.011
4.0 0.108 0.020 0.098 0.012
Morphologically, the mean particle area decreases with increasing concentration of
CSP. The maximum particle area, observed when lg/L CSP was used, was over
twice that observed with 4g/L.
118

Table 6.18 Effect of CSP concentration in buffered medium on the morphology of S. natalensis (control conditions highlighted).
CSP concentration (g/L) Average particle area (mm2)
Perimeter (mm) Diameter (mm)
1.0 2.637* 10--* 0.216 0.0522.0 1.566 * 10-3 0.161 0.0403.0 1.045 * 10-3 0.136 0.0354.0 8.924 * 10-4 0.123 0.033
6.3 SUMMARY
From the preceding studies it is obvious that the choice of medium can have a
significant effect on biomass concentration and morphology of S. natalensis. The
use of YEPD medium results in the largest biomass concentration observed during
this study. Actinomycete medium also resulted in a high biomass concentration.
There was very little difference in the morphology observed during any of the
media studies. The organism still grew primarily in pelleted form, although the
observed particles were slightly smaller when cultivated in YEPD or actinomycete
medium.
Varying the concentrations of some of the components of buffered fermentation
medium showed that, for the ranges tested, the concentrations suggested by Struyk
and Waisvisz (1975) are optimal in relation to biomass levels. However, reducing
the CaC03 concentration in the production medium used by Mahon (1990) and
McCabe (1990) from 8g/L to 4g/L yielded a small improvement in final biomass
levels. Studies involving peptone indicated that a concentration of lOg/L resulted
in a higher biomass concentration than the control value of 5g/L employed.
However, further trials would be required to conclusively identify optimum
peptone levels.
119
CHAPTER 7
CONCLUSIONS AND RECOMMENDATIONS
7.1 CONCLUSIONS
The purpose of this study was to characterise the morphological development of the
organism, S. natalensis, in submerged culture and to investigate the effects of
cultivation conditions and medium components on both growth and morphology.
It was found that S. natalensis is a pH sensitive organism which may also be
sensitive to oxygen transfer rates. In studies of S. tendae, Glazebrook et al. (1992)
noted that as the volume of inoculum was increased, the size of the particles
decreased. This trend was only observed with S. natalensis using inoculum cultures
of 72 hours and 96 hours.
Morphological studies of S. natalensis indicate that the organism grows largely in
pelleted form with a varying percentage (calculated on a volume basis) accounted for
by clumps of less than 2.29 * 103 mm2. For the control conditions employed (100
mL buffered fermentation medium in a 250 mL flask), the maximum average particle
area was observed at approximately 73 hours, after which the particles reduce in size
to a stable value which is maintained for the duration of the fermentation. Particle
volume distributions indicate that there is a persistent small pellet population which
is maintained as a result of the recurring disruption of larger pellets.
The organism is also affected by the hydrodynamic environment in the cultivation
vessel, as characterised by liquid volume in shake flasks rotated at a constant speed,
with a higher percentage of clumped growth in smaller volumes, corresponding to
increased levels of biomass production. Limited studies in 1L and 10L STR
configurations indicated that the organism may be sensitive to variations in agitation
conditions.
Use of phosphate buffer instead of CaC03 increases the time taken to reach
maximum biomass concentration. The presence of yeast extract results in the highest
120

biomass, and Rvb values. Morphologically, unbuffered media result in smaller
particle areas and a higher percentage of clumps present in the fermentation broth.
As with particle development, both the Yx/s and Rvb values increase to a maximum
(observed at approximately 73 hours) and subsequently decrease to stable values,
maintained for the remainder of the cultivation period. This trend was observed
during the majority of shake flask fermentations. There appears to be a relationship
between Rvb and particle area. However, no relationship was observed between
either Yx/s or growth rate and the morphology of the organism as defined by average
particle area. This may be due to the increased heterogeneity in the fermentations as
time progresses.
Use of an organic nitrogen source results in significantly higher Rvb and values
than the inorganic nitrogen source. From the data presented, there is evidence to
suggest that peptone concentration may have been limiting. Inorganic nitrogen
resulted in the largest particle areas, while the smallest particles were observed using
a combination of both inorganic and organic nitrogen. The organism requires
calcium to grow as using alternative carbonate sources to calcium carbonate resulted
in stunted growth and morphological development.
It appears that the concentration of components in buffered fermentation medium
result in optimal biomass production for this medium. Increasing the concentration
of CSP to 4g/L resulted in a slight increase in biomass concentration. Similarly, with
respect to the production medium, decreasing the concentration of calcium carbonate
to 4g/L resulted in a slight increase in the observed maximum biomass concentration.
Increasing the concentration of peptone in the peptone medium to lOg/L resulted in a
significant increase of biomass concentration.
121

7.2 RECOMMENDATIONS
• Further work should be undertaken on the pimaricin extraction and detection
methods listed in Section 3.6, particularly in the HPLC technique developed by
Mahon (1990). The use of other solvents and cellular disruption techniques
should be examined to increase the accuracy and sensitivity of the method.
• Reinvestigation of validation protocol by which the minimum number of entites
to ensure statistically representative samples was determined; analysis on a
volume, rather than number basis might be more appropriate.
• Development of the image analysis program to highten the detection sensitivity
in order to minimise the manual editing stage.
• Also, in relation to image analysis a second program must be written to analyse
filamentous fragments formed during cultivation at high agitation rates and also
when cultivated in YEPD and, to a lesser extent, Actinomycete medium.
• Baffled flasks should be introduced to volumes studies, with a view to reducing
the inhibitory effect of oxygen limitation at larger volumes.
• In relation to the medium studies, further work must be done to find a substitute
carbonate source in order to avoid the presence of suspended solids in the
medium if possible while meeting nutritional and buffering requirements.
• Further work in the nitrogen studies is required as, on the basis of studies in
buffered fermentation and peptone media, it is possible that in the latter the
organism may have been subject to nitrogen limitation. Monitoring of nitrogen
utilisation would be benificial.
• Lower concentrations of both calcium carbonate and phosphate should also be
investigated as the maximum biomass concentrations were observed at the lowest
concentrations (4 g/L and 0.2 g/L, respectively) investigated. Higher
concentrations of com steep powder should be investigated in relation to biomass
production.
• Further studies into the possible alkaline sensitivity of the organism should also
be undertaken as this has a major influence into the choice of possible substitute
buffers.
122

• Further studies of the apparent inhibitory effect of high glucose concentrations
are recommended. Possible suggestions for overcoming this problem would be
to operate on a fed-batch basis.
• STR studies under a range of operation and agitation conditions to identify
optimum environment for cultivation.
123

BIBLIOGRAPHY
• Adams, H.L. and Thomas, C.R. (1988). The use of image analysis for
morphological measurements on filamentous micro-organisms. Biotechnol. Bioeng. 32, 707 - 712.
• Atkinson, B. and Daoud, I.S. (1976). Microbial flocculation in fermentation
process engineering. Adv. Biochem. Eng. 4, 41 - 124.
• Ball, A.S. and McCarthy, A.J. (1989). Production and properties of xylanases
from actinomycetes. J. Appl. Bacter. 66 , 439 - 444.
• Banerjee, U.C. (1993). Effect of glucose and carboxymethylcellulose on growth
and rifamycin oxidase production by Curvularia lunata. Curr. Microbiol. 2 6 , 261
-265.
• Belmar-Beiny, M.T. and Thomas, C.R. (1991). Morphology and clavulanic acid
production of Streptomyces clavuligerus: effect of stirrer speed in batch
fermentations. Biotechnol. Bioeng. 37, 456 - 462.
• Borden, W.G., Maher, M.J. and Sklavounos, C. (1995). Process for natamycin
recovery. International Patent WO 95/27073.
• Brana, A.F., Wolfe, S. and Demain, A.L. (1986). Relationship between nitrogen
assimilation and cephalosporin synthesis in Streptomyces clavuligerus. Arch. Microbiol. 146, 46- 51.
• Bridger, H.J. (1968). Tetraene antibiotic purification. United States Patent No.
3,378,441.
• Byrne, G.S. and Ward, O.P. (1989). Effect of nutrition on pellet formation by
Rhizopus arrhizus. Biotechnol. Bioeng. 33, 912-914.
• Carter, B.L.A. and Bull, A.T. (1971). The effect of oxygen tension in the medium
on the morphology and growth kinetics of Aspergillus nidulans. J. Gen. Micro. 65, 265 - 273.
• Charles, M. (1978). Technical aspects of the rheological properties of microbial
cultures. Adv. Biochem. Eng. 8 , 1 - 64.
• Claridge, C.A. (1979). Aminoglycoside antibiotics. In: Rose, A.H. (ed.).
Economic microbiology Volume 3. Secondary products of metabolism, 151 - 238.
124

• Clark, G.J., Langley, D. and Bushell, M.E. (1995). Oxygen limitation can induce
microbial secondary metabolite formation: investigations with miniature
electrodes in shaker and bioreactor culture. Microbiol. 141, 663 - 669.
• Cox, P.W. and Thomas, C.R. (1992). Classification and measurement of fungal
pellets by automated image analysis. Biotechnol. Bioeng. 3 9 , 945 - 952.
• Crawford, D.L. (1988). Biodégradation of agricultural and urban wastes. In:
Goodfellow, M., Williams, S.T. and Mordarski, M. (eds.). Actinomycetes in
biotechnology, 433 - 459.
• Davoust, N. and Hansson, G. (1992). Identifying the conditions for development
of beneficial mycelium morphology for chitosan-producing Absidia spp. in
submersed cultures. Appl. Microbiol. Biotechnol. 36, 618 - 620.
• Demain, A.L. (1988). Actinomycetes: What have you done for us lately? Biol. Actinomycetes, 19-25.
• De Ruig, W.G., Van Oostrom, J.J. and Leenheer, K. (1987). Spectrometric and
liquid chromatographic determination of natamycin in cheese and cheese rind. J. Assoc. Official Anal. Chem. 70, 6 , 944 - 948.
• Dufresne, R , Thibault, J., Leduy, A. and Lencki, R. (1990). The effects of
pressure on the growth of Aureobasidium pullulans and the synthesis of pullulan.
Appl. Microbiol. Biotechnol. 3 2 , 526 - 532.
• Edelstein, L and Hadar, Y. (1983). A model for pellet size distributions in
submerged mycelial cultures. J. Theor. Biol. 105, 427 - 452.
• Eiki, H., Gushima, H., Saito, T., Ishida, H., Oka, Y. and Osono, T. (1988).
Product inhibition and its removal on josamycin fermentation by Streptomyces narbonensis var. josamyceticus. J. Ferm.Technol. 66 , 5, 559 - 565.
• El-Abyad, M.S., El-Sayed, M.A., El-Shanshoury, A.R. and Farid, M. (1994).
Optimisation of culture conditions for indol-3-pyruvic acid production by
Streptomyces griseoflavus. Can. J. Microbiol. 40, 9, 754 - 760.
• Fatile (1985). Rheological characteristics of suspensions of Aspergillus niger. correlation of rheological parameters with microbial concentration and shape of
the mycelial aggregate. Appl. Microbiol. Biotechnol. 21 , 60 - 64.
125

• Fletouris, D.J., Botsoglou, N.A. and Mantis, A.J. (1995). Rapid
spectrophotometric method for analyzing natamycin in cheese and cheese rind. J. AOACInt. 78, 4, 1024 - 1029.
• Friedrich, J., Cimerman, A. and Steiner, W. (1989). Submerged production of
protolytic enzymes by Aspergillus niger: effect o f different aeration/agitation
regimes. Appl. Microbiol. Biotechnol. 31 , 490 - 494.
• Friedrich, J., Cimerman, A. and Steiner, W. (1990). Production of protolytic
enzymes by Aspergillus niger. effect of inoculum size and potassium
hexacyanoferrate II - trihydrate. Appl. Microbiol. Biotechnol. 33, 377-381.
• Glazebrook, M.A., Vining, L.C. and White, R.L. (1992). Growth morphology of
Streptomyces akiyoshiensis in submerged culture: influence of pH, inoculum, and
nutrients. Can. J. Microbiol. 38, 2, 98 - 103.
• Glazebrook, M.A., Vining, L.C., White, R.L., Smith, K.C. and Chedrawy, E.G.
(1993). Nutrient effects on growth and the production of 5-hydroxy-4-
oxonorvaline by Streptomyces akiyoshiensis. Can. J. Microbiol. 39 , 5, 536 - 542.
• Gupta, R., Saxena, R.K., Chaturvedi, P. and Virdi, J.S. (1995). Chitinase
production by Streptomyces viridificans: its potential in fungal cell wall lysis. J. Appl. Bacter. 78, 378 - 383.
• Haque, S.F., Sen, S.K. and Pal, S.C. (1995). Nutrient optimization for production
of broad-spectrum antibiotic by Streptomyces antibioticus SRI5.4. Acta. Microbiol. Immunol. Hungar. 42, 2, 155 - 162.
• He, J.Y., Vining, L.C., White, R.L., Horton, K.L. and Doull, J.L. (1995). Nutrient
effects on growth and armentomycin production in cultures of Streptomyces armentosus. Can. J. Microbiol. 41, 186 - 193.
• Hersbach, G.J.M., Van der Beek, C.P. and Van Dijck, P.W.M. (1988). The
penicillins: properties, biosynthesis and fermentation. In: Vandamme, E.J. (ed),
Drugs and the Pharmaceutical Sciences, Vol. 22: The Biotechnology of Industrial
Antibiotics, 70 - 76.
• Ho, C.S., Shanahan, J.F. and Edwards, A. (1987). The effect of carbon dioxide on
penicillin fermentations: mycelial growth and penicillin productivity. Eur. Cong. Biotechnol. 3, 555.
126

• Holley, R.A. (1981). Prevention of surface mold growth on Italian dry sausage by
natamycin and potassium sorbate. Appl. Environ. Microbiol. 41, 2, 422 - 429.
• Hostalek, Z., Blumauerova, M. and Vanek, Z. (1979). Tetracyline antibiotics. In:
Rose, A.H. (ed.). Economic microbiology Volume 3. Secondary products of
metabolism, 294 - 354.
• Ives, P. (1996). Personal communication.
• Jones, C.L., Lonergan, G.T. and Mainwaring, D.E. (1993). Mycelial fragment size
distribution: an analysis based on fractal geometry. Appl. Microbiol. Biotechnol. 39, 242 - 249.
• Joung, J.J. and Blaskovitz, R.J. (1985). Role of ammonium nitrate in
morphological differentiation of Aspergillus niger in a submerged culture. Dev. Ind. Microbiol. 26, 487 - 494.
• Ju, L.K., Ho, C.S. and Shanahan, J.F. (1991). Effects of carbon dioxide on the
rheological behaviour and oxygen transfer in submerged penicillin fermentations.
Biotechnol. Bioeng. 38, 1223 — 1232.
• Kaiser, D., Onken, U., Sattler, I. and Zeeck, A. (1994). Influence of increased
dissolved oxygen concentration on the formation of secondary metabolites by
manumycin - producing Streptomyces parvulus. Appl. Microbiol. Biotechnol. 41,
309 - 312.
• Kieran, P.M., Malone, D.M. and MacLoughlin, P.F. (1993). Variation of
aggregates size in plant cell suspension batch and semi-continuous cultures.
Trans. IChemE. 71, (Cl): 40 - 46.
• Kim, J.H., Lebault, J.M. and Reuss, M. (1983). Comparitive study on rheological
properties of mycelial broth in filamentous and pelleted forms. Eur. J. Appl. Microbiol. Biotechnol. 18, 11 - 16.
• Kim, E.Y. and Yoo, Y.J. (1992). Analysis of broth rheology with cell morphology
in Cephalosporium fermentation. Biotechnol. Tech. 6 , 6, 501 - 506.
• Lacey, J. (1988). Actinomycetes as biodeteriogens and pollutants. In: Goodfellow,
M., Williams, S.T. and Mordarski, M. (eds.). Actinomycetes in biotechnology,
359 -432.
127

• Lebrihi, A., Germain, P. and Lefebvre, G. (1987). Phosphate repression of
cephamycin and clavuianic acid production by Streptomyces clavuligerus. Appl. Microbiol. Biotechnol. 26 , 130 - 135.
• Lechevalier, M.P. (1988). Actinomycetes in agriculture and forestry. In:
Goodfellow, M., Williams, S.T. and Mordarski, M. (eds.). Actinomycetes in
biotechnology, 327 - 358.
• Lejeune, R. and Baron, G.V. (1995). On the use of morphological measurements
for the quantification of fungal growth. Biotechnol. Tech. 9, 5, 327 - 328.
• Lindberg, A.M. and Molin, G. (1993). Effect of temperature and glucose supply
on the production of polyunsaturated fatty acids by the fungus Mortierella alpina CBS 343.66 in fermentor cultures. Appl. Microbiol. Biotechnol. 39, 450 - 455.
• Liu, T. and Yu, D. (1993). Morphological measurements on Penicillium chrysogenum broths by rheology and filtration methods. Biotechnol. Bioeng. 42,
777-784.
• Liibbe, C., Wolfe, S. and Demain, A.L. (1985). Repression and inhibition of
cephalsporin sythetases in Streptomyces clavuligerus by inorganic phosphate.
Arch. Microbiol. 140, 317 - 320.
• Lynch, H.C. and Bushell, M.E. (1995). The physiology of erythromycin
biosynthesis in cyclic fed batch culture. Microbiol. 141, 3105 - 3111.
• Madi, N.S., McNeil, B. and Harvey, L.M. (1996). Influence of culture pH and
aeration on ethanol production and pullulan molecular weight by Aureobasidium pullulans. J. Chem. Tech. Biotechnol. 66 , 343 - 350.
• Mahon, D. (1990). Fermentor studies of the production of pimaricin by
Streptomyces natalensis. MSc Thesis, Dublin City University.
• Makagiansar, H.Y., Ayazi Shamlou, P., Thomas, C.R. and Lilly, M.D. (1993).
The influence of mechanical forces on the morphology and penicillin production
of Penicillium chrysogenum. Bioprocess Eng. 9, 83 - 90.
• Martin, S.M. and Bushell, M.E. (1996). Effect of hyphal micromorphology on
bioreactor performance of antibiotic producing Saccharopolyspora erythraea cultures. Microbiol. 142, 1783 - 1788.
• McCabe, P. (1990). Production of pimaricin by Streptomyces natalensis in
submerged culture. MSc Thesis, Dublin City University.
128

• McIntyre, J.J., Bull, A.T. and Bunch, A.W. (1996). Vanomycin production in
batch and continuous culture. Biotechnol. Bioeng. 49 , 412 - 420.
• McIntyre, M. and McNeil, B. (1997). Dissolved carbon dioxide effects on
morphology, growth, and citrate production in Aspergillus niger A60. Enzyme Micro. Technol. 20, 135 - 142.
• McNeil, B. and Harvey, L.M. (1993). Viscous fermentation products. Crit Rev. Biotechnol. 13, 4, 275 - 304.
• McNeil, B. and Kristiansen, B. (1987). Influence of impeller speed upon the
pullulan fermentation. Biotechnol. Letts. 9, 2, 101 - 104.
• McNeil, B., Kristiansen, B. and Seviour, R.J. (1989). Polysaccharide production
and morphology of Aureobasidium pullulans in continuous culture. Biotechnol. Bioeng. 33, 1210- 1212.
• Metz, B. and Kossen, N.W.F. (1977). The growth of moulds in the form of pellets
- a literature review. Biotechnol. Bioeng. 19, 781-799.
• Metz, B., De Bruijn, E.W. and Van Suijdam, J.C. (1981). Method for quantitative
representation of the morphology of moulds. Biotechnol. Bioeng. 23 , 149 - 162.
• Miller, G.L. (1959). Use of dinitrosalicylic acid reagent for the determination of
reducing sugars. Anal. Chem. 31, 426 - 428.
• Millis, J.R., Olson, P.T. and Reimer, M.H. (1991). Natamycin recovery.
International Patent W092/10580.
• Mitard, A. and Riba, J.P. (1988). Morphology and growth of Aspergillus niger ATCC 26036 cultivated at several shear rates. Biotechnol. Bioeng. 32 , 835 - 840.
• Morrin, M. and Ward, O.P. (1990). Relationships between fungal growth,
morphology and fumaric acid production by Rhizopus arrhizus. Mycol. Res. 94 , 4,
505 - 510.
• Musilkovâ, M., Ujcovâ, E., Seichert, L. and Fencl, Z. (1982). Effect of changed
cultivation conditions on the morphology of Aspergillus niger and on citric acid
biosynthesis in laboratory cultivation. Folia Microbiol. 27, 328 - 332.
• Nielsen, J. (1993). A simple morphologically structured model describing the
growth of filamentous micro-organisms. Biotechnol. Bioeng. 41, 715 - 727.
• Nielsen, J., Johansen, C.L., Jacobsen, M., Rrabben, P. and Villadsen, J. (1995).
Pellet formation and fragmentation in submerged cultures of Pénicillium
129

chrysogenum and its relation to penicillin production. Biotechnol. Prog. 11, 93 -
98.
• Ohta, N., Park, Y.S., Yahiro, K. and Okabe, M. (1995). Comparison of neomycin
production from Streptomyces fradiae cultivation using soybean oil as the sole
carbon source in an air-lift bioreactor and a stirred tank reactor. J. Ferm. Bioeng. 79 ,5 ,4 4 3 -4 4 8 .
• Olsvik, E. and Kristiansen, B. (1992a).On-line rheological measurements and
control in fungal fermentations. Biotechnol. Bioeng. 40 , 375 - 387.
• Olsvik, E. and Kristiansen, B. (1992b). Influence of oxygen tension, biomass
concentration, and specific growth rate on the rheological properties of a
filamentous fermentation broth. Biotechnol. Bioeng. 40 , 1293 — 1299.
• Olsvik, E. and Kristiansen, B. (1994). Rheology of filamentous fermentations.
Biotechnol. Adv. 12, 1 -3 9 .
• Olsvik, E., Tucker, K.G., Thomas, C.R. and Kristiansen, B. (1993). Correlation of
Aspergillus niger broth rheological properties with biomass concentration and the
shape of mycelial aggregates. Biotechnol. Bioeng. 42 , 1046 - 1052.
• Oolman, T. and Liu, T.C. (1991). Filtration properties of mycelial microbial
broths. Biotechnol. Prog. 7, 534 - 539.
• O’Shea, D.G. and Walsh, P.K. (1996). Morphological characterisation of the
dimorphic yeast Kluyveromyces marxianus var. marxianus NRRLy2415 by semi
automated image analysis. Biotechnol. Bioeng. 51, 679 - 690.
• Packer, H.L. and Thomas, C.R. (1990). Morphological measurements on
filamentous micro - organisms by fully automatic image analysis. Biotechnol. Bioeng. 35, 835 - 840.
• Papagianni, M., Mattey, M. and Kristiansen, B. (1994). Morphology and citric
acid production of Aspergillus niger PM1. Biotechnol. Letters 16, 9, 929 - 934.
• Patankar, D.B., Liu, T. and Oolman, T. (1993). A fractal model for the
characterisation of mycelial morphology. Biotechnol. Bioeng. 42, 571 - 578.
• Paul, G.C. and Thomas, C.R. (1998). Characterisation of mycelial morphology
using image analysis. Adv. Biochem. Eng. Biotechnol 60, 1 - 59.
130

• Peczynska-Czoch, W. and Mordarski, M. (1988). Actinomycete enzymes. In:
Goodfellow, M., Williams, S.T. and Mordarski, M. (eds.). Actinomycetes in
biotechnology, 219 - 283.
• Perry, R.H. and Green, D.W. (1997). Perry’s Chemical Engineers’ Handbook, 2-
11.
• Piret, J.M. and Demain, A.L. (1988). Actinomycetes in biotechnology: an
overview. In: Goodfellow, M., Williams, S.T. and Mordarski, M. (eds.).
Actinomycetes in biotechnology, 461 - 482.
• Pons, M.N., Vivier, H., Remy, J.F. and Dodds, J.A. (1993). Morphological
characterisation of yeast by image analysis. Biotechnol. Bioeng. 42, 1352 - 1359.
• Priede, M.A., Vanags, J.J., Viesturs, U.E., Tucker, K.G., Bujalski, W. and
Thomas, C.R. (1995). Hydrodynamic, physiological, and morphological
characteristics of Fusarium monoiliforme in geometrically dissimilar stirred
bioreactors. Biotechnol. Bioeng. 48, 266 - 277.
• Queiroz, M.C.R., Facciotti, M.C.R. and Schmidell, W. (1997). Rheological
changes of Aspergillus awamori broth during amyloglucosidase production.
Biotechnol. Lett. 19, 2, 167- 170.
• Raab, W.P. (1972). Natamycin (Pimaricin). Its properties and possibilities in
medicine. Georg Thieme publishers, Stuttgart.
• Raghoenath, D.K. and Webbers, J.J.P. (1997). Natamycin recovery. International patent WO 97/29207.
• Reeslev, M., Nielsen, J.C., Olsen, J., Jensen, B. and Jacobsen, T. (1991). Effect of
pH and the initial concentration of yeast extract on regulation of dimoiphism and
exopolysaccharide formation of Aureobasidium pullulans in batch culture. Mycol. Res. 95, 2, 220 - 226.
• Reeslev, M., Jorgensen, B.B. and Jorgensen, O.B. (1996). Exopolysaccharide
production and morphology of Aureobasidium pullulans grown in continuous
cultivation with varying ammonium - glucose ratio in the growth medium. J. Biotechnol. 51, 131 - 135.
• Reichl, U., King, R. and Gilles, E.D. (1992a). Characterisation of pellet
morphology during submerged growth of Streptomyces tendae by image analysis.
Biotechnol. Bioeng. 39, 164 - 170.
131

• Reichl, U., King, R. and Gilles, E.D. (1992b). Effect of temperature and medium
composition on mycelial growth of Streptomyces tendae in submerged culture. J. Basic. Microbiol. 32 , 3, 193 - 200.
• Roels, J.A., Van der Berg, J. and Vonken, R.M. (1974). The rheology of mycelial
broths. Biotechnol. Bioeng. 16, 181 -208 .
• Rollins, M.J., Jensen, S.E. and Westlake, D.W.S. (1987). Regulation of antibiotic
production by iron and oxygen during defined medium fermentations of
Streptomyces clavuligerus. Appl. Microbiol. Biotechnol. 31 , 390 - 396.
• Ruohang, W. and Webb, C. (1995). Effect of cell concentration on the rheology of
glucoamylase fermentation broth. Biotechnol. Tech. 9, 1, 55 - 58.
• Sarra, M., Ison, A.P. and Lilly, M.D. (1996). The relationships between biomass
concentration, determined by a capacitance-based probe, rheology and
morphology of Saccharopolyspora erythraea cultures. J. Biotechnol. 51 , 157 -
165.
• Schiigerl, K., Wittier, R. and Lorenz, T. (1983). The use of molds in pellet form.
T. I.B. Tech. 1 ,4 , 120 - 123.
• Schiigerl, K , Bayer, T., Niehoff, J., Moller, J. and Zhou, W. (1988). Influence of
cell environment on the morphology of molds and the biosynthesis of antibiotics
in bioreactors. Bioreactor Fluid Dynamics, 229 -243.
• Schiigerl, K., Gerlach, S.R. and Siedenberg, D. (1998). Influence of the process
parameters on the morphology and enzyme production of Aspergilli. Adv. Biochem. Eng. Biotechnol. 60, 195 - 266.
• Seichert, L., Ujcova, E., Musilkova, M. and Fencl, Z. (1982). Effect of aeration
and agitation on the biosynthetic activity of diffusely growing Aspergillus niger. Folia Microbiol. 27, 333 - 334.
• Serrano-Carreon, L., Flores, C and Galindo, E. (1997). y-Decalactone production
by Trichoderma harzianum in stirred bioreactors. Biotechnol. Prog. 13, 205 -
208.
• Seviour, R.J., Stasinopoulos, S.J., Auer, D.P.F. and Gibbs, P.A. (1992).
Production of pullulan and other exopolysaccharides by filamentous fungi. Crit. Revs. Biotechnol. 12, 3, 279 - 298.
132

• Smith, M.D. and Ho, C.S. (1985). The effect of dissolved carbon dioxide on
penicillin production: Mycelial morphology. J. Biotechnol. 2, 347 - 363.
• Struyk, A.P. and Waisvisz, J.M. (1975). Pimaricin and process of producing same.
United States Patent No. 3,892,850.
• Thomas, C.R. and Paul, G.C. (1996). Applications of image analysis in cell
technology. Current Opinion in Biotechnology, 7, 35 - 45.
• Tucker, K.G., Kelly, T., Delgrazia, P. and Thomas, C.R. (1992). Fully automatic
measurement of mycelial morphology by image analysis. Biotechnol. Prog. 8 , 4,
353 - 359.
• Tucker, K.G., Mohan, P. and Thomas, C.R. (1993). The influence of mycelial
morphology on the rheology of filamentous fermentation broths. From: The 3rc International Conference on Bioreactor and Bioprocess Fluid Dynamics, 14 -
16th September, 261 - 273.
• Tucker, K.G. and Thomas, C.R. (1993). Effect of biomass concentration and
morphology on the rheological parameters of Pénicillium chrysogenum fermentation broths. Trans. I. Chem. E. 71, C, 111 - 117.
• Tucker, K.G. and Thomas, C.R. (1994). Inoculum effects on fungal morphology:
shake flasks vs. agitated bioreactors. Biotechnol. Tech. 8 , 3, 153 - 156.
• Tuinstra, L.G.M. and Traag, W.A. (1982). Liquid chromatographic determination
of natamycin in cheese at residue levels. J. Assoc. Off. Anal. Chem. 65, 4, 820 -
822.
• Vanhoutte, B., Pons, M.N., Thomas, C.R., Louvel, L. and Vivier, H. (1995).
Characterisation of Pénicillium chrysogenum physiology in submerged cultures by
color and monochrome image analysis. Biotechnol. Bioeng. 48 , 1-11.
• Van Suijdam, J.C. and Metz, B. (1981). Influence of engineering variables upon
the morphology of filamentous molds. Biotechnol. Bioeng. 23, 111 - 148.
• Vass, R.C. and Jefferys, E.G. (1979). Gibberellic acid. In: Rose, A.H. (ed.),
Economic Microbiology, Vol. 3: Secondary products of metabolism, 421 - 433.
• Vecht-Lifshitz, S.E., Magdassi, S. and Braun, S. (1990). Pellet formation and
cellular aggregation in Streptomyces tendae. Biotechnol. Bioeng. 35, 890 - 896.
133
• Vining, L.C., Jensen, S.E., Westlake, D.W.S., Aharonowitz, Y. and Wolfe, S.
(1987). Cephamyein production and isopenicillin N synthetase activity in cultures
of Streptomyces clavuligerus. Appl. Microbiol. Biotechnol. 2 7 , 240 - 246.
• Walker, G.M. and O’Neill, J.D. (1990). Morphological and metabolic changes in
the yeast Kluyveromyces marxianus var. marxianus NRRLy2415 during
fermentation of lactose. J. Chem. Tech. Biotechnol. 4 9 , 75 - 89.
• Warren, S.J., Keshavarz-Moore, E., Shamlou, P.A., Lilly, M.D., Thomas, C.R.
and Dixon, K. (1995). Rheologies and morphologies of three actinomycetes in
submerged culture. Biotechnol. Bioeng. 4 5 , 80 - 85.
• Weibe, M.G. and Trinci, A.P.J. (1991). Dilution rate as a determinant of mycelial
morphology in continuous culture. Biotechnol. Bioeng. 3 8 , 75 - 81.
• Williams, S.T. (1990). Actinomycetes - the ray fungi. Mycologist 4 , 3, 110 -115.
• Yamasaki, H. Lee, M.S., Tanaka, T. and Nakanishi, K. (1993a).Characteristics of
cross-flow filtration of pullulan broth. Appl. Microbiol. Biotechnol. 3 9 , 26 — 30.
• Yamasaki, H. Lee, M.S., Tanaka, T. and Nakanishi, K. (1993b). Improvement of
performance for cross-flow membrane filtration of pullulan broth. Appl. Microbiol. Biotechnol. 3 9 , 21 —25.
• Yang, H., Reichl, U., King, R. and Gilles, E.D. (1992). Measurement and
simulation of the morphological development of filamentous micro-organisms.
Biotechnol. Bioeng. 39, 44-48.
134

APPENDIX 1 - IMAGE ANALYSIS PROGRAM
IN IT IA L S E T U PF o r ( L O O P = 0 to 6 , s te p 1 )
B I N E D O U T = L O O P
B in a r y E d i t ( C le a r B I N E D O U T )
N e x t ( L O O P )
S e le c t L e n s ( T r a n s m it te d , 4 x , m a g c h a n g e r 1 .0 x , 2 .0 8 7 3 1 m ic r o n s p e r p i x e l )
M e a s u r e f r a m e ( x 3 1 , y 6 1 , W id th 6 5 8 , H e ig h t 4 5 0 )
S e tu p R e s u lt s W in d o w ( M o v e F e a tu re R e s u lt s to x 4 0 , y 4 9 6 , w 5 2 0 , h 104 )
D im ( X ( 2 0 0 ) )
D im ( F T R R E S ( 1 0 0 0 0 ,2 0 ) )
M E A S U R E M E N T O F P E L L E T S A N D C L U M P SC O U N T E R = 1
P a u s e T e x t ( " E n te r n o . o f f i e l d s " )
In p u t ( F I E L D S )
F o r ( L O O P E R = 1 to F I E L D S , s te p 1 )
L iv e im a g e ( in to Im a g e 1 )
P a u s e T e x t ( " F o c u s o n c e l ls o f in t e r e s t " )
P a u s e ( N o d ia lo g )
A C Q O U T P U T = L O O P E R
A c q u i r e ( in to A C Q O U T P U T )
L U T I N P U T = A C Q O U T P U T
L U T O U T P U T = L U T I N P U T
G r e y L U T ( S q u a re f r o m L U T I N P U T to L U T O U T P U T )
N e x t ( L O O P E R )
F o r ( L O O P E R = 1 to F I E L D S , s te p 1 )
R E M O V A L O F D E B R ISD E T I M A G E = L O O P E R
F E R E T S = 3 2
B in a r y L o g ic a l ( c o p y B in a r y O to B in a r y 1 )
M I N A R E A = 1
D e te c t [ P A U S E ] ( b la c k e r th a n D E T L O W E R , f r o m D E T I M A G E in to D E T B I N A R Y )
B in a r y A m e n d ( E r o d e f r o m B in a r y O to B in a r y l , c y c le s 13, o p e ra to r O c ta g o n )
B in a r y A m e n d ( D i la t e f r o m B in a r y l to B in a r y 2 , c y c le s 17 , o p e ra to r O c ta g o n )
B in a r y L o g ic a l ( C = A A N D B : C B in a r y 3 , A B in a r y O , B B in a r y 2 )
B in a r y L o g ic a l ( C = A X O R B : C B in a r y 4 , A B in a r y O , B B in a r y 3 )
B in a r y A m e n d ( D i la t e f r o m B in a r y 3 to B in a r y 5 , c y c le s 1, o p e ra to r O c ta g o n )
B in a r y I d e n t if y ( O u t l in e f r o m B in a r y 5 to B in a r y 5 )
B in a r y L o g ic a l ( c o p y B in a r y 5 to B in a r y l )
F e a tu re A c c e p t :
A r e a f r o m 0. to 3 9 1 2 7 1 6 .
F e a tu re A c c e p t :
R o u n d n e s s f r o m 1. to 5.
M e a s u r e fe a tu re ( p la n e B in a r y 4 , 3 2 fe re ts , m in im u m area: 5 0 , g re y im a g e : Im ag eO )
S e le c te d p a ra m e te rs : A r e a , R o u n d n e s s
C o p y A c c e p t e d F e a tu re s ( f r o m B in a r y 4 in to B in a r y 5 )
B in a r y L o g i c a l ( c o p y B in a r y 5 to B in a r y 4 )
B in a r y L o g ic a l ( C = A O R B : C B in a r y 5 , A B in a r y 3 , B B in a r y 4 )
B in a r y L o g i c a l ( C = A A N D B : C B in a r y 4 , A B in a r y l , B B in a r y 5 )
B in a r y L o g ic a l ( C = A X O R B : C B in a r y 5 , A B in a r y 5 , B B in a r y 4 )
B in a r y L o g ic a l ( c o p y B in a r y 5 to B in a r y O )
C le a r A c c e p t s
M I N A R E A = 5 0
135

M F E A T I N P U T = 0
F A C C O U T P U T = 2
M e a s u r e fe a tu re (p la n e M F E A T I N P U T , F E R E T S fe re ts , m in im u m area: M I N A R E A , g r e y im a g e : F T R G R E Y . I M A G E
fe a tu re c o u n ts in to F T R C O U N T ( 2 ) , r e s u lt s in to F T R R E S U L T S ( c o u n t , l ) )
S e le c te d p a ra m e te rs : A r e a
C o p y A c c e p t e d F e a tu re s ( f r o m M F E A T I N P U T in to F A C C O U T P U T )
B in a r y L o g i c a l ( c o p y B in a r y 2 to B in a r y 1 )
B in a r y E d i t [ P A U S E ] ( D e le te f r o m B in a r y l to B in a r y l , n ib F i l l , w id t h 1 )
B in a r y L o g i c a l ( c o p y B in a r y l to B in a r y 0 )
S E P A R A T IO N O F P E L L E T S A N D C L U M P SB in a r y A m e n d ( E r o d e f r o m B in a r y l to B in a r y 2 , c y c le s 7 , o p e ra to r O c t a g o n )
B in a r y A m e n d ( D i la t e f r o m B in a r y 2 to B in a r y l , c y c le s 7 , o p e ra to r O c ta g o n )
B in a r y L o g i c a l ( c o p y B in a r y l to B in a r y 2 )
B in a r y S e g m e n t ( B u i l d f r o m B in a r y O to B in a r y l , o p e ra to r O c ta g o n )
B in a r y L o g i c a l ( C = A X O R B : C B in a r y 3 , A B in a r y O , B B i n a r y l )
M E A S U R E M E N T O F P E L L E T SM F E A T I N P U T = 1
M e a s u r e fe a tu re ( p la n e M F E A T I N P U T , F E R E T S fe re ts , m in im u m area: M I N A R E A , g r e y im a g e : F T R G R E Y . I M A G E
fe a tu re c o u n ts in to F T R C O U N T ( 2 ) , r e s u lt s in to F T R R E S U L T S ( c o u n t , 9 ) )
S e le c te d p a ra m e te rs : A r e a , F e re tO , F e re t9 0 , P e r im e te r , F e re t4 5 , F e re t6 7 .5 , F e r e t l3 5 , F e r e t l5 7 . 5 , C o n v e x A r e a
F o r ( N = 1 to F T R C O U N T ( 2 ) , s te p 1 )
W = F T R R E S U L T S ( N , 2 ) + F T R R E S U L T S ( N , 3 ) + F T R R E S U L T S ( N , 5 ) + F T R R E S U L T S ( N , 6 )
Y = F T R R E S U L T S ( N , 7 ) + F T R R E S U L T S ( N , 8 )
X ( N ) = W + Y
X ( N ) = X ( N ) / 6
N e x t ( N )
C O U N T 1 = C O U N T E R
F o r ( N = 1 to F T R C O U N T ( 2 ) , s te p 1 )
F T R R E S ( C O U N T E R , 1) = F T R R E S U L T S ( N , 1 )
F T R R E S ( C O U N T E R , 2 ) = F T R R E S U L T S ( N , 4 )
F T R R E S ( C O U N T E R , 3 ) = F T R R E S U L T S ( N , 9 )
F T R R E S ( C O U N T E R , 4 ) = X ( N )
C O U N T E R = C O U N T E R + 1
N e x t ( N )
M F E A T I N P U T = 2
M I N A R E A = 0
M e a s u r e fe a tu re (p la n e M F E A T I N P U T , F E R E T S fe re ts , m in im u m area: M I N A R E A , g r e y im a g e : F T R G R E Y . I M A G E
fe a tu re c o u n ts in t o F T R C O U N T ( 2 ) , r e s u lt s in to F T R R E S U L T S ( c o u n t , 2 ) )
S e le c te d p a ra m e te rs : A r e a , C o n v e x A r e a
F o r ( N = 1 to F T R C O U N T ( 2 ) , s te p 1 )
F T R R E S ( C O U N T l , 5 ) = F T R R E S U L T S ( N , 1)
F T R R E S ( C O U N T l , 6 ) = F T R R E S U L T S ( N , 2 )
C O U N T 1 = C O U N T 1 + 1
N e x t ( N )
M E A S U R E M E N T O F C L U M P SM F E A T I N P U T = 3
M e a s u r e fe a tu re (p la n e M F E A T I N P U T , F E R E T S fe re ts , m in im u m area: M I N A R E A , g r e y im a g e : F T R G R E Y . I M A G E
fe a tu re c o u n ts in t o F T R C O U N T ( 2 ) , r e s u lt s in to F T R R E S U L T S ( c o u n t , 9 ) )
S e le c te d p a ra m e te rs : A r e a , F e re tO , F e re t9 0 , P e r im e te r , F e re t4 5 , F e re t6 7 .5 , F e r e t l3 5 , F e r e t l5 7 . 5 , C o n v e x A r e a
F o r ( N = 1 to F T R C O U N T ( 2 ) , s te p 1 )
W = F T R R E S U L T S ( N , 2 ) + F T R R E S U L T S ( N , 3 ) + F T R R E S U L T S ( N , 5 ) + F T R R E S U L T S ( N , 6 )
Y = F T R R E S U L T S ( N , 7 ) + F T R R E S U L T S ( N , 8 )
X ( N ) = W + Y
X ( N ) = X ( N ) / 6
136

N ext ( N )For ( N = I to FTRCO UNT(2), step I )
FTRRES(COUNTER, 1 ) = F TR R E S U LTS (N .l)FTRRES(COUNTER,2) - FTRRESU LT S (N ,4)FTRRES(COUNTER,3) = FTRRESU LTS(N ,9)FTR RES(COUNTER,4) = X (N )FTRRES(COUNTER,5) = FTRRESULTS(O.OO)FTRRES(COUNTER,6) = FTRRESULTS(O.OO)CO UNTER = C O U NTER +1
Next ( N )Next (L O O P E R )
DATA OUTPUTFor ( N = 1 to C O U N T E R -], step 1 )
For ( M = 1 to 6, step 1 )D isplay ( FTRRES(N ,M ), fie ld w idth: 8, righ t jus tified , pad w ith spaces, 2 digits after tab fo llow s )
Next ( M )D isplay Line
Next ( N )
137