nation building through foreign intervention: evidence ... · nation building through foreign...
TRANSCRIPT

NATION BUILDING THROUGH FOREIGNINTERVENTION: EVIDENCE FROM
DISCONTINUITIES IN MILITARY STRATEGIES∗
Melissa Dell and Pablo Querubin
Harvard and NBER, NYU
August, 2017
Abstract: This study uses discontinuities in U.S. strategies employed during the VietnamWar to estimate their causal impacts. It identifies the effects of bombing by exploitingrounding thresholds in an algorithm used to target air strikes. Bombing increased the mil-itary and political activities of the communist insurgency, weakened local governance, andreduced non-communist civic engagement. The study also exploits a spatial discontinuityacross neighboring military regions, which pursued different counterinsurgency strategies.A strategy emphasizing overwhelming firepower plausibly increased insurgent attacks andworsened attitudes towards the U.S. and South Vietnamese government, relative to a morehearts and minds oriented approach.
Keywords : nation building, development aid, Vietnam War
JEL Codes : F35, F51, F52
Word Count: 20078
∗Support for this research was provided by the National Science Foundation (Award Number 1628867).Katherine Chen, Peter Hickman, Luis Felipe Jaramillo, Nhung Le, Phan Ngoc, and Minh Trinh provided ex-cellent research assistance. We thank Ethan Bueno de Mesquita, Benjamin Crost, Nathan Hendren, NathanNunn, Jesse Shapiro, and seminar participants at the Becker Friedman Institute, the Canadian Institute forAdvanced Research, Clemson, Cornell, Duke, the ENSA Meeting at ASSA 2017, GWU, Harvard, ITAM,LSE, Michigan, MIT, the NBER Political Economy program meeting, the NBER Development of the Amer-ican Economy program meeting, Northwestern, NYU, Stanford, UC Berkeley, UC San Diego, UC SantaCruz, University of British Columbia, the University of Maryland and the Warwick/Princeton/Utah Polit-ical Economy Conference for helpful comments. Contact: [email protected], address: HarvardUniversity Department of Economics, Littauer Center M-24, Cambridge MA 02138.

“Never before did the people of Vietnam, from top to bottom, unite as they did during the
years that the U.S. was bombing us. Never before had Chairman Ho Chi Minh’s appeal - that
there is nothing more precious than freedom and independence - gone straight to the hearts
and minds of the Vietnamese people.” - Tran Quang Co
“The solution in Vietnam is more bombs, more shells, more napalm.” - General William
DePuy
1 Introduction
Military interventions in weakly institutionalized societies were a central feature of the Cold
War and continue through the present. These interventions consume significant resources and
may have important national security consequences for all countries involved. A variety of
strategies have aimed to defeat insurgents and build states capable of monopolizing violence,
ranging from the deployment of overwhelming firepower to initiatives to win hearts and
minds through development aid. This study identifies the causal effects of key interventions
employed during the Vietnam War by exploiting two distinct policy discontinuities: one
varies the intensity of an overwhelming firepower approach - air strikes - and the other
compares an overwhelming firepower approach to a more hearts and minds oriented approach.
The overwhelming firepower approach can be summed up by the Vietnam era adage:
“get the people by the balls and their hearts and minds will follow” (Kodosky, 2007, p.
175). Military strategy emphasized that overwhelming firepower could reduce insurgent
forces, disrupt operations, and crush morale. According to General William DePuy: “The
solution in Vietnam is more bombs, more shells, more napalm” (Sheehan, 1988, p. 619).
Civilian strategists advocated that coercion could also incentivize citizen compliance, with
National Security Adviser Walt Rostow arguing that countering Communism required “a
ruthless projection to the peasantry that the central government intends to be the wave
of the future” (Milne, 2008, p. 88). In contrast, skeptics highlighted that insurgents were
difficult to locate and that overwhelming firepower could backfire if civilians were hit instead.
It could create grievances that inspired citizens to join the insurgency and could widen the
political legitimacy gap between the insurgents and the South Vietnamese government. As
James Scott (1985, 2009) argues, a coercion-oriented approach will be ill-suited to gaining
cooperation if citizens have many ways to undermine a state they do not genuinely support.
Air strikes were a key component of overwhelming firepower, with the Air Force receiving
over half of wartime appropriations and twice as many tons of explosives dropped as during
World War II, about 500 pounds of ordinance per resident of South Vietnam (Thayer, 1975).
This study empirically estimates the impacts of bombing near civilian populations, a common
1

occurrence: in our sample 21% of hamlet-month observations had ordinance dropped within 5
kilometers of the hamlet centroid. Outcome data on security, governance, civic engagement,
and economics are drawn from armed forces administrative records, data compiled by a
military-civilian pacification agency, and public opinion surveys.
This is a challenging question to examine because military forces may target places
where insurgency is already on the rise, confounding simple correlations. Moreover, an
unconditional random allocation, beyond being unfeasible and unethical, would likewise be
uninformative, since military resources in practice are targeted to where they are believed to
be most effective. The most informative estimation approach would be to exploit a source
of plausibly random variation that influenced the allocation of military force at the margin,
between places that had been deemed potential targets. We can closely approximate this
empirical setup by exploiting a newly-discovered algorithm component of bombing strategy
that includes plausibly exogenous discontinuities. Declassified Air Force histories document
that one of the factors used in allocating weekly pre-planned bombing missions was hamlet
security (Project CHECO, 1969).1 A Bayesian algorithm combined data from 169 questions
on security, political, and economic characteristics into a single hamlet security rating. The
output ranged continuously from 1 to 5 but was rounded to the nearest whole number before
being printed from the mainframe computer.
The study estimates the causal impacts of overwhelming firepower by comparing places
just below and above the rounding thresholds, using being below the threshold as an instru-
ment for bombing. Following score assignment, places that fall just below the cutoffs are
significantly more likely to be bombed. There is not evidence that the hamlet-level score
was used systematically for other resource allocations, including of ground and naval troops,
and hence it allows us to isolate the impacts of air strikes. Hamlets near the thresholds
are similar prior to score assignment, indicating that places just above the thresholds are a
good control group for those just below. Placebo checks document that there were no effects
during a 1969 pilot, when the score was computed but not disseminated.
The estimates document that bombing near population centers undermined U.S. military
objectives, leading more Vietnamese to participate in Viet Cong (VC) insurgent military and
political activities. The initial deterioration in security entered the next quarter’s security
score, increasing the probability of future bombing. Moving from no strikes during the sample
period to the sample average increased the probability that there was a village VC guerrilla
squad - which consists of local fighters - by 27 percentage points, relative to a sample mean of
0.38. It also increased the probability that the VC Infrastructure - the VC’s political branch
- was active by 25 percentage points and increased the probability of a VC-initiated attack on
1Other factors included goals in the military region, security of friendly forces, location of combat ma-neuver battalions, and enemy movements.
2

local security forces, government officials, or civilians by 9 percentage points. Public opinion
surveys and armed forces administrative data show similar patterns, alleviating concerns
that effects could be due to measurement error in a given dataset. Qualitative evidence
suggests that insurgents were difficult to identify and that hitting civilians instead generated
grievances that increased insurgent support.
Impacts on places that were hit will not necessarily aggregate up to the overall impacts
if bombing affects other places beyond those directly hit. We find limited evidence that
targeting one village affected security in nearby areas or within the same VC administrative
district, and to the extent spillovers exist they tend to go in the same direction as the direct
effects. Moreover, the presence of impacts on local outcomes - such as the local guerrilla
squad and the local VC Infrastructure - indicates that the effects we estimate do not just
reflect a reallocation of insurgent troops.
The broader U.S. objective in Vietnam was to create a state that would provide a bul-
wark against communism after U.S. withdrawal. The hope was that by signaling to the
population that the government - and not communist rebels - were the main game in town,
over time individuals would become more engaged with the state and non-communist civil
society. Some strategists also argued that bombing the countryside would lead to mass mi-
gration to cities, where citizens could be more easily controlled. In contrast, we show that
bombing weakened local government and non-communist civic society, while generating at
most limited out-migration. Moving from zero to sample mean bombing during the conflict
reduced the probability that the local government collected taxes by 25 percentage points.
Bombing also decreased access to primary school by 16 percentage points and reduced par-
ticipation in non-communist civil society organizations by 13 percentage points. Qualitative
evidence suggests that it widened the political legitimacy gap between the government and
insurgents, potentially leading citizens to undermine the state in a variety of ways.
We also shed light on how the overwhelming firepower approach compares to a more
hearts and minds oriented strategy, by exploiting a spatial regression discontinuity between
Military Corps Region I - commanded by the U.S. Marine Corps (USMC) - and Military
Corps Region II - commanded by the U.S. Army. The Marines emphasized providing security
by embedding soldiers in communities and winning support through development programs
(USMC, 2009). Their approach was motivated by the view that “in small wars the goal is to
gain decisive results with the least application of force...the end aim is the social, economic,
and political development of the people” (USMC, 1940). In contrast, the Army relied on
overwhelming firepower deployed through search and destroy raids (Long, 2016; Krepinevich,
1986). While a number of factors could differ between the Army and USMC, most differences
appear to be relatively modest during the Vietnam War era, whereas counterinsurgency
strategies are markedly different.
3

Comparisons of nearby hamlets on either side of the corps boundary paint a picture
that is consistent with the bombing results. Specifically, regression discontinuity estimates
document that public goods provision was higher on the USMC side of the boundary for
targeted public goods. Moreover, hamlets just to the USMC side of the boundary were
attacked less by the VC and were less likely to have a VC presence. Finally, public opinion
data document that citizens in the USMC region reported more positive attitudes towards
the U.S. and all levels of South Vietnamese government. While we cannot rule out that
other differences between the Army and Marines contribute to these estimates - or isolate
the contributions of different features of the USMC counterinsurgency strategy - it is difficult
to tell a story where differences in counterinsurgency strategies are not important. Pre-period
VC attacks, other pre-characteristics, geography, urbanization, and soldier characteristics -
including Armed Forces Qualifying Test scores - are all relatively balanced.
Understanding whether overwhelming firepower strategies are likely to achieve their de-
sired objectives remains policy relevant. While targeting has improved significantly, it re-
mains imperfect. Insurgents have responded by embedding more tightly amongst civilians,
and it is widely accepted that heavy reliance on air power will lead to collateral damage.2
Recently, human rights organizations have provided detailed evidence that Russian bombing
in Syria, as well as bombing by the Syrian regime, has killed numerous civilians, in part by
using munitions such as cluster bombs that were widely employed in Vietnam.3 Addition-
ally, politicians continue to advocate an overwhelming firepower approach, deployed from the
air since sending ground troops is unpopular.4 Our estimates highlight ways in which this
could pose challenges to achieving desired objectives when insurgents are embedded amongst
civilians. They do not reveal whether a more hearts and minds oriented approach is more
effective than refraining from intervention, a question beyond the scope of this paper.
This study contributes compelling identification to issues difficult to elucidate through
correlations, informing the literature on military force in civil conflicts. Kocher et al. (2011)
also examine bombing in Vietnam, testing how bombing in September of 1969 impacted an
index of VC insurgent activity in subsequent months.5 Miguel and Roland (2011) use distance
2For example, a dataset from the Bureau of Investigative Journalism suggests that since 2004, civilianshave represented 25% of the deaths in U.S. drone strikes of Pakistan.
3See Graham-Harrison (2016), Smith-Spark et al. (2016), Human Rights Watch (2015), Amnesty Inter-national (2015).
4Donald Trump argued: “I would bomb the [expletive] out of them [ISIS in Iraq]. I would just bombthose suckers...I would blow up every single inch” (Trump in Fort Dodge, 2016). Ted Cruz similarly stated:“We’ll carpet bomb [ISIS] into oblivion. I don’t know if sand can glow in the dark, but we’re going to findout” (Cruz in Cedar Rapids, 2015).
5The study instruments bombing using the VC index for July-August of 1969 and finds positive impactson the VC index for September-November of 1969. We employ an identification strategy in which theinstrument is orthogonal to initial insurgent activity and other pre-characteristics - an essential identifyingassumption that is unlikely to hold when the lagged dependent variable is used as the instrument - andexamine a longer period and much broader set of outcomes.
4

to the 17th parallel to instrument for district level bombing and do not find persistent effects
on poverty today. Condra et al. (2010), Dube and Naidu (2015), Dell (2015) and Acemoglu
et al. (2016) find evidence that military force can backfire in reducing violence.6 In contrast,
Lyall (2009) uses a differences-in-differences strategy across Chechnyan villages to show that
shelled villages experienced a substantial reduction in insurgent attacks.7
Consistent with this study’s results exploiting the Army-USMC natural experiment,
Berman et al. (2011), Beath et al. (2012), and Blattman and Annan (2015) find evidence
that hearts and minds initiatives can reduce conflict.8 In contrast, Crost et al. (2014) offer a
cautionary note, documenting that insurgents may sabotage development programs if they
expect them to weaken their support.9
The study is organized as follows: Section 2 provides an overview of the conflict, the use
of overwhelming firepower, and the rules of engagement with regards to targeting civilians. It
then discusses the potential effects of different military strategies, drawing on evidence from
the academic literature, policymakers, and accounts given by Vietnamese on the ground.
Section 3 examines the impacts of bombing population centers, first discussing how air
strikes were targeted (Section 3.1), then outlining the empirical approach (Section 3.2) and
data sources (Section 3.3), and finally presenting the results (Section 3.4). Next, Section 4
compares the overwhelming firepower and hearts and minds approaches by examining the
discontinuity between the Army and USMC corps regions. Finally, Section 5 concludes.
2 The Context
2.1 An Overview of the Vietnam War
Following Vietnamese independence from France, the Geneva Accords of 1954 temporarily
divided Vietnam at the 17th Parallel, until nationwide elections could be held in 1956.
Elections were not held, in part because the U.S. concluded that the communist revolutionary
6Condra et al. (2010) show that counterinsurgency-generated civilian casualties in Afghanistan, but notIraq, are associated with increases in insurgent violence over a period of six weeks to six months. Dell (2015)documents that a military force approach to combating the drug trade backfired in Mexico, generatingsignificant increases in violence; Dube and Naidu (2015) find that U.S. military bases in Colombia increaseparamilitary attacks; and Acemoglu et al. (2016) show that incentives that encourage military force inColombia led to a deterioration in security and a weakening of the local state.
7The study argues that exposure to shelling is as if random since artillery fire was often conducted byinebriated soldiers following a policy of random firing intervals.
8Berman et al. (2011) document that improved public service provision reduced insurgent violence inIraq. Using a randomized experiment, Beath et al. (2012) show that participating in the largest developmentprogram in Afghanistan improves perceptions of well-being, attitudes towards the government, and levels ofsecurity, but only in relatively secure regions; and Blattman and Annan (2015) find that a combination ofcapital inputs, agricultural training, and counseling reduced participation in conflict in Liberia.
9Similarly, Nunn and Qian (2014) find that U.S. food aid increases conflict.
5

hero Ho Chi Minh would be elected by a landslide. Ho Chi Minh proceeded to establish a
Soviet-backed communist state in the north, and the U.S.-backed dictator Ngo Dinh Diem
declared leadership of a non-communist state in the south.
A communist insurgency began in South Vietnam, led by the Viet Cong (VC). In 1965,
Lyndon Johnson deployed around 200,000 troops to South Vietnam. U.S. troop levels peaked
at over half a million in 1969, and the U.S. withdrew in January of 1973. The costs of the
conflict in Vietnamese lives were staggering. The Vietnamese government (1995) estimated
more than three million total deaths between 1954 and 1975, including over 2 million civilian
deaths. A 2008 British Medical Journal study estimated a death toll of 3.8 million (Ober-
meyer et al., 2008). All sides - the North Vietnamese, South Vietnamese, Viet Cong, and
Americans - contributed significantly, though breakdowns of casualties by responsible party
vary widely. The financial costs of the war to the U.S. were also substantial, with the De-
partment of Defense estimating that it cost the U.S. taxpayer over a trillion USD. Spending
on Vietnam during the Lyndon Johnson administration exceeded spending on the War on
Poverty by a factor of 17 (Appy, 2015).
The ultimate U.S. objective in Vietnam was the creation of a stable non-communist state
that could stand as a bulwark against communism without massive U.S. intervention. This
required achieving the so-called “crossover point”, where VC deaths and defections exceeded
new recruits, in a way that could be sustained as the U.S. scaled back military intervention.
The U.S. considered two broad counterinsurgency strategies - overwhelming firepower and
hearts and minds - and in practice the overwhelming firepower approach dominated.
2.2 Overwhelming Firepower
2.2.1 Background
More firepower was unleashed during the Vietnam War than during any other conflict in
human history. The U.S. had a vast arsenal that no country - let alone a third world
insurgency - could match.10 More than twice as many tons of explosives were dropped as
during World War II and four times more tons were dropped on South Vietnam than on
North Vietnam, about 500 pounds of ordinance per inhabitant. The munitions unleashed
equaled the power of 640 Hiroshima-sized atomic bombs, and the amount of ammunition
fired per soldier was twenty-six times greater than in World War II (Turse, 2013, p. 79).
Bombing played a particularly central role, in a conflict where sending ground troops was
unpopular. Between 1965 and 1972, U.S. aircraft flew 3.4 million combat sorties in Southeast
10The U.S. also had a nuclear arsenal, but deploying this would have risked total war with the Soviets orChinese and hence was avoided. This study does not speak to what would have happened had firepower onthis scale been unleashed.
6

Asia, with a plurality of these conducted in South Vietnam. The largest bomber was the
B-52, and the U.S. flew around 125,000 B-52 sorties. Many air strikes were conducted by
smaller aircraft, such as the F-4 Phantoms, which typically dropped napalm and cluster
bombs. Napalm, an incendiary engineered to stick to clothes and skin, had been modified to
burn hotter and longer than in World War II, and around 400,000 tons of it were dropped
during the conflict, killing or disfiguring anyone in its path. Another incendiary sometimes
used in bombs - and frequently in grenades - was white phosphorous, which became embedded
and slowly burned the body. In 1969 alone, the U.S. military purchased 379 million white
phosphorus grenades (SIPRA, 1978, p. 52-53). Cluster bombs contained steel pellets with
razor sharp edges. The “pineapple” cluster bomb contained 250 steel pellets, and the “guava”
cluster bomb contained 650 separate bomblets, each of which contained 300 steel pellets, for
a total of 200,000 steel fragments per bomb. During the war, the U.S. military purchased
approximately 37 million “pineapple” bombs and 285 million “guava” bomblets (Prokosch,
1995, p. 97, 100). Munitions expenditures were also unparalleled. Over the course of the war,
U.S. troops expended 15 billion pounds of artillery shells, much in the form of harassment
and interdiction (H & I) fire (Turse, 2013, p. 91). H & I involved firing at regular intervals
without a specific target and was intended to keep the enemy in a state of unease.
2.2.2 The Rules of Engagement and Civilian Casualties
Directly targeting civilians violated the laws of war, but in practice the rules of engagement
(ROE) allowed for many scenarios where civilians could be hit by overwhelming firepower,
a tragedy exacerbated by the difficulties of distinguishing civilians from insurgents. If any
type of fire came from the vicinity of a village, the ROE permitted attacking it without
warning. If civilians were thought to be supporting the VC - i.e. by providing food or
intelligence - the village could also be targeted, but a South Vietnamese official, termed a
backseat, was supposed to give approval “whenever possible” (Reisman and Antoniou, 1994,
p. 111-113). Nick Turse (2013, p. 54-55), a historian who has conducted the most thorough
investigation of civilian casualties in Vietnam to date, cites evidence from journalists and U.S.
correspondence that in practice the backseat oftentimes gave the U.S. blanket authorization
to conduct airstrikes in his region, and in cases where more detailed instructions were given
they were sometimes ignored. A warning was also supposed to be provided to the village first.
This could come in a variety of forms, including a blanket leaflet drop on the area. Because
such warnings were general and frequent, it could be difficult for villagers to distinguish
whether they were on a target list or receiving a generic warning (Appy, 2015, p. 167).
In addition, the U.S. designated some regions as free fire zones, where anyone could be
fired on without violating the laws of war. Civilians were supposed to be warned by South
7

Vietnamese officials to leave, but in practice, a U.S. internal investigation found that “doubt
exists” that the program to warn civilians was “either effective or thorough” (Walton, 1970).
Even if warned, many faced severe credit constraints in leaving their ancestral villages.
Appendix Figures A-1 and A-2 show leaflets that illustrate U.S. willingness to target
civilian villages. Leaflets, dropped from high altitudes, could blow many kilometers before
hitting the ground, and hence they could be targeted to districts but not specific villages.
Leaflet 244-055-68 shows a picture of a village leveled by bombing and informs citizens:“if
you support the Viet Cong, your village will look like this.” It warns: “The Viet Cong hide
among the innocent women and children in your villages to fire upon troops and aircraft. If
the Viet Cong in this area use you or your village for this purpose, you can expect death
from the sky. Do not let the Viet Cong be the reason for the death of your loved ones.”
Leaflet HQ-18-67 warns: “It is regrettable that the Government of Vietnam has to use bombs
and artillery to drive the Viet Cong from places where they’re hiding. In order to liberate
your area, sometimes there is no other means.” The leaflet instructs citizens to protect their
lives by asking VC to leave the village. Leaflet 244-068-68, entitled “Your village has been
bombed”, explains the village has been bombed because it helped the VC in some way.
This begs the question of how unarmed civilians could eject armed insurgents. Viet-
namese accounts indicate that many found the rules of engagement profoundly unjust, in a
conflict where civilians on U.S. soil were never in danger. As Viet Thanh Nguyen wrote in
his Pulitzer Prize winning novel: “We are all guilty until proven innocent, as even the Amer-
icans have shown. Why else do they believe everyone is really Viet Cong? Why else do they
shoot first and ask questions later?” (Nguyen, 2015, loc. 2902). Turse (2013, p. 55) argues:
“At every turn, the onus was put on Vietnamese civilians to actively demonstrate that they
were indeed noncombatants...by staying out of off-limits areas (the borders of which they
might not know)... by not running or not walking in a certain way, or not standing still and
thus looking unnatural; by somehow forcing armed guerrillas from their villages but also not
carrying weapons, which would automatically brand a Vietnamese as VC.”
Moreover, the rules were not always followed. In a survey of generals who commanded
troops in Vietnam, only 19 percent said that the ROE were “carefully adhered to throughout
the chain of command” before the My Lai massacre became public knowledge (Nov. 1969),
while 15 percent responded that that ROE weren’t even “particularly considered in the day
to day conduct of the war” (Kinnard, 1991, p. 54-55). The remainder responded that the
rules were “fairly well adhered to.” The U.S. kept a count of enemy dead, which was an
important metric of success within certain sectors of the armed forces (Turse, 2013, p. 43).
Many have written about how this created perverse incentives for civilian casualties, and a
study of similar incentives by Acemoglu et al. (2016) in Colombia indeed finds this to be
the case. In 1970, an internal report by the U.S. Army’s general counsel examined whether
8

the body count encouraged troops “to inflate the count by violating established ROE,”
concluding that there was “a certain inescapable logic” to accusations that emphasizing the
body count led to violations of the ROE (Turse, 2013, p. 47).
2.2.3 Overwhelming Firepower for Achieving Military Objectives
U.S. leaders emphasized a variety of reasons why overwhelming firepower would be effective
in defeating the VC. “Long range artillery, naval gunfire, fighter bombers, strategic bombers
and land and amphibious raids will hamper his operations, reduce his forces, destroy his
morale and materially detract from his ability to prosecute the war effectively” (U.S. Army
Chief of Staff William Westmoreland, p. 90 of Hunt, 2010). Policymakers also argued that
insurgents were fundamentally rational and would be deterred once they realized the costs of
facing an enemy who would not hesitate to unleash his arsenal. Mcgeorge Bundy, National
Security Adviser and a Harvard political scientist, advocated bombing, telling Johnson: “a
reprisal policy - to the extent that it demonstrates U.S. willingness to employ this new norm
in counter-insurgency - will set a higher price for the future upon all adventures of guerrilla
warfare, and it should therefore increase our ability to deter such adventures” (Hunt, 2010,
p. 68). “The national security adviser’s objective was to break the will of the insurgency
in ways consistent with the expectations of game theory” (Goldstein, 2008, p. 155-156). By
setting a harsh punishment for villages that aided the VC, this behavior could be deterred.
Overwhelming firepower projected U.S. strength, signaling that it was not a “paper tiger”
who would sit by idly as communism spread. “What we can say is that even if it fails, the
policy [bombing] will be worth it,” Bundy told Johnson. “At a minimum, it will damp down
the charge that we did not do all that we could have done” (Goldstein, 2008, p. 220).
When overwhelming firepower did not end the war as quickly as expected, the military
establishment argued that it was effective but not enough had been deployed, given the
propensity of the Vietnamese to fight. According to Westmoreland: “the Oriental doesn’t
put the same high price on life as does the Westerner. Life is plentiful, life is cheap in the
Orient. As the philosophy of the Orient expresses it, life is not important” (Davis, 1974).
Vietnamese and skeptical Americans, in contrast, suggested a number of reasons over-
whelming firepower could backfire in achieving U.S. military objectives. In principle, the
U.S. had enough firepower to destroy the VC many times over, but they first had to locate
them. Even targeting VC leadership proved difficult - for example, the Soviets closely mon-
itored if U.S. bombers were heading towards VC headquarters and relayed this information
to them (Tang and Chanoff, 1985, p. 162).
These difficulties were multiplied in targeting rank and file VC, many of whom were
part-time guerrilla fighters operating in the immediate vicinity of their villages who could
9

not be distinguished from civilians without close local cooperation. Even when they could be
identified, the VC had sympathizers in almost every branch of the South Vietnamese Army
(ARVN), and they knew the terrain much better than American ground troops or external
ARVN forces (Hunt, 2010, p. 64-65). It would pose less risk to U.S. lives to target VC from
the air, but the common F-105 bomber had a circular error probability of 447 feet, meaning
that half the bombs dropped fell within this radius of the target. This was sufficient to hit
a village or in the vicinity of a VC base, but imprecise enough that civilians could easily be
hit instead of insurgents.
When civilians were hit, some might decide to join the cause because of grievances, or
grievances might reduce their propensity to share information with the South Vietnamese
government and increase their propensity to aid the VC. According to one soldier: “During
one of the air strikes in Haiphong my fiance was killed by an American bomb. Immediately
afterwards I decided that I had to go South to fight...I desperately wanted to go and kill
a couple of Americans to relieve the bitterness I felt. (Hunt, 2010, p. 137). Additionally,
economic destruction could reduce the opportunity cost of joining the insurgency.
If seeing a neighbor targeted led nearby villages to believe that they could avoid getting
hit by opposing the insurgents, it could decrease VC support. On the other hand, if they felt
there was little that they could do to avoid meeting the same fate - i.e. because they couldn’t
evict armed insurgents - or if they felt moral outrage at the situation, they too might decide
to join the insurgent cause. As one Vietnamese citizen wrote: “Don’t be pessimistic when
you read this letter. Instead you should intensify your hatred...fight harder and avenge the
people of South Vietnam” (Hunt, 2010, p. 140).
The VC, aware of their acute firepower disadvantage, made efforts to win the sympathy
of the population. According to a VC nurse: “I was told that our first mission was to win
the people’s sympathy. If we helped them as much as we could we would win them over.
After we won them over, they would help us” (Hunt, 2010, p. 142). The VC could also
be brutal, but even so we might expect Vietnamese citizens to respond more negatively to
civilian casualties caused by a foreign power - seen by many as the successor to imperialist
France - as compared to casualties caused by a local insurgency.11
The best quantitative information on VC motivations, while imperfect, comes from in-
terviews that RAND conducted with 2,400 VC defectors and POWs between 1964 and 1968.
A RAND study compares VC volunteers to forced draftees (Denton, 1968). Volunteers were
significantly more likely than forced draftees to report grievances against the government
and also to face economic hardship, suggesting that overwhelming firepower could lead indi-
11Lyall et al. (2013) provide evidence from Afghanistan that in response to harm by U.S. backed governmentforces, citizens increase support for the Taliban and decrease support for the government, but they do notrespond symmetrically to Taliban induced harm.
10

viduals to volunteer for a range of reasons.12 These results are in line with Elisabeth Wood’s
study of El Salvadorian rebels, whom she finds are motivated by having experienced violence
and injustice at the hands of the government.
These hypotheses have specific testable predictions. If Westmoreland and Bundy were
right, VC activity should decline following the deployment of overwhelming firepower, im-
mediately and in the longer run. In contrast, if overwhelming firepower backfired, we would
expect it to increase VC activity. To disentangle potential spillovers, we can observe both
the activity of the local guerrilla squad - which consisted entirely of part-time insurgents
from the village - and of main force squads - regular forces that moved across locations - in
places that were hit and in places nearby.
2.2.4 Overwhelming Firepower for Nation Building
Policymakers argued that beyond crippling the VC militarily, bombing would also help the
state to better control the civilian population, allowing it to monopolize violence even af-
ter U.S. withdrawal. First, bombing the countryside would drive citizens from rural areas,
where they were difficult to control, to urban areas and government refugee camps, where
the state had a more developed presence. According to Westmoreland: “in order to thwart
the communist’s designs,” the U.S. had to eliminate the fish [the VC] or “dry up the water
[civilian supporters] so that the fish cannot survive” (Elliott, 2003, p. 336).13 Sam Hunt-
ington (1968) made this argument even more forcefully, terming the approach of bombing
the countryside “on such a massive scale as to produce a massive migration from country-
side to city” forced draft urbanization. “The war in Vietnam is a war for the control of
population...The effective response lies neither in the quest for conventional military victory
nor in the esoteric doctrines and gimmicks of counter-insurgency warfare [hearts and minds
initiatives]. It is instead forced-draft urbanization and modernization which rapidly brings
the country in question out of the phase in which a rural revolutionary movement can hope
to generate sufficient strength to come to power.” Little attention was given to the massive
suffering such an approach could cause. National Security Adviser and MIT economist Walt
Rostow likewise saw communist insurgencies as a threat at a primitive stage of economic
development, that could be countered by providing “a ruthless projection to the peasantry
that the central government intends to be the wave of the future” (Milne, 2008, p. 88).
The qualitative evidence suggests that in practice movement to urban areas and refugee
camps happened to a lesser extent than expected by advocates of forced draft urbanization.
12Common grievances included being falsely accused by the government and the killing or rape of a familymember by government forces.
13Another U.S. senior officer put it even more bluntly in an interview with reporter R.W. Apple: “You’vegot to dry up the sea the guerrillas swim in - that’s the peasants - and the best way to do that is to blastthe hell out of their villages so they’ll come into our refugee camps” (Apple, 1971, p. 449).
11

As one peasant who moved to Saigon after his hamlet had been destroyed reported about
those who remained: “Most of them are poor farmers. A few of them had left the village
for [Saigon]-controlled areas but they had to come back since they were not able to make a
living over there. Those who stayed didn’t have a choice” (Tirman, 2011, p. 162).
It is also unclear that a “ruthless projection” of power would do much to convince citizens
to obey a central state that they did not find legitimate initially. The VC had an inherent
political advantage, given its close ties with the anti-colonial struggle and the fact that
the U.S. and aligned South Vietnamese government were seen by many as the successor to
imperialist France. Overwhelming firepower may have rallied Vietnamese around what many
saw as an imperialist enemy, galvanizing citizens into action. Communist leader Tran Quang
Co argued: “Never before did the people of Vietnam, from top to bottom, unite as they did
during the years that the U.S. was bombing us. Never before had Chairman Ho Chi Minh’s
appeal - that there is nothing more precious than freedom and independence - gone straight
to the hearts and minds of the Vietnamese people” (Goldstein, 2008, p. 122). According to
the memoir of Truong Nhu Tang, a senior VC leader, “our true strength and the enemy’s
true weakness was on the political front. The advantage in political leadership was not
something that the Americans could easily build up or provide” (Tang and Chanoff, 1985, p.
59). Senator William Fulbright (1965) argued that the U.S. had failed “to understand social
revolution and the injustices that give it rise...instead of supporting the great majority of
people,” America sided with “corrupt and reactionary military oligarchies.”
Overwhelming firepower could have plausibly widened the legitimacy gap between the VC
and South Vietnamese government. James Scott (1985, 2009) has argued that a coercion-
oriented approach is ill-suited to nation building, as citizens have many ways to undermine
a state they do not support, even short of joining an insurgency. Much as bombing inspired
some to join the insurgency, for many others it may have simply reduced their support for
the government, leading them to evade tax collection, not participate in state endorsed or-
ganizations, etc. Bombing might also directly reduce public goods provision, further eroding
support. VC leader Truong Nhu Tang writes about how a series of school closures in 1971
provided a boost to VC recruitment (Tang and Chanoff, 1985, p. 202).
These alternative views have specific testable predictions. If Westmoreland and Hunt-
ington were right, we would expect population to decline substantially following the use of
overwhelming firepower and VC activity to ultimately decline as rural insurgents were de-
prived of civilian supporters. If Rostow was correct, we would expect VC activity to decline
in bombed areas - or places nearby that observed the ruthless projection of power - and over
time engagement with the South Vietnamese government and non-communist organizations
should increase. If instead Tran Quang Co, Truong Nhu Tang, and James Scott were right,
we should see an increase in VC activity, a decline in non-communist civic engagement, and
12

a decline in the functioning of South Vietnamese government following the deployment of
overwhelming firepower. To the extent that population did not change dramatically, losses
in the countryside would be unlikely to be offset by movement to cities or refugee camps.
2.3 Overwhelming Firepower versus Hearts and Minds
This study primarily focuses on the overwhelming firepower approach - the central U.S. strat-
egy pursued in Vietnam - but some voices within the armed forces advocated a strategy more
focused on winning hearts and minds and working with locals to neutralize specific threats.
In particular, a qualitative literature highlights major differences in how the U.S. Army and
U.S. Marine Corps (USMC) approached counterinsurgency (Long, 2016; Krepinevich, 1986).
The Army has traditionally emphasized overwhelming firepower and large-scale operations,
a by-product of its formative years during the U.S. Civil War. In contrast, following the
Spanish-American War the USMC developed as a de facto imperial police force with oper-
ations in the Caribbean. USMC units worked closely with local police to maintain order,
developing an organizational culture that prioritized small units, limited firepower, and close
collaboration with locals and civilians.14 This study exploits a natural experiment comparing
the Army to Marines to shed light on whether their very distinct counterinsurgency (COIN)
strategies plausibly led to different outcomes.
Specifically, US Army leadership emphasized overwhelming firepower, deployed through
search and destroy raids that aimed to neutralize the VC. Hearts and minds initiatives had
little place in armed conflict, which was about control. As expressed in an official Army pub-
lication: “Units in Vietnam emphasized pacification by stressing civic action [development
aid] efforts. In our opinion, this was a mistake...we always stressed the military...The only
way to overcome VC control is by brute force...one has to lower the boom occasionally and
battalion commanders have authority to use heavy firepower in populated areas” (Ewell and
Hunt, 1974, p. 160). Westmoreland described his COIN strategy in one word: “firepower”
(Krepinevich, 1986, p. 197). Development aid could be undertaken by USAID later (Daddis,
2011). This approach was reflected in the Army’s preferred metrics: the enemy body count,
battalion (large-scale) days of operation, ammunition expended, and the ratio of U.S. to
enemy deaths (Sheehan, 1988, p. 287-288; Krepinevich, 1986, p. 196-205).15
In contrast, the Marines designated Civic Action - development aid - and Combined Ac-
tion - small units embedded in communities that worked closely with local security forces - as
pillars of their counterinsurgency mission.16 The 1962 USMC Manual argues that firepower
14The USMC also had an amphibious sub-culture that operated as an advanced landing team for the Navy,but technological advancements following World War II made this function largely obsolete.
15The favored metrics of the Air Force, sorties flown and bomb tonnage dropped, were similar.16The nascent U.S. Army Special Forces pursued an approach that resembled that of the USMC.
13

alone would not work because “a positive program of civil assistance must be conducted to
eliminate the original cause of the resistance movement” (USMC, 1962, p. 72). “Marine
units built schools, roads, marketplaces, and hospitals...provided regular medical care...and
provided training and equipment to local and regional militias” (USMC, 2009). Combined
Action units eschewed heavy firepower, as it was likely to harm populations they were pro-
tecting (Long, 2016). Moreover, “one of the most important duties to be performed by the
commander...is to gain the cooperation and assistance of local police” (USMC, 1962, p.16).
Recall that it was difficult to find the VC, but locals - if willing to cooperate - often had
substantial information.17 The USMC’s favored metrics focused on measuring the above
inputs to pacification (USMC, 1970, p. 15-17).18
These different approaches have testable implications. We will use a spatial discontinuity
design to compare hamlets commanded by the U.S. Army to nearby hamlets commanded by
the USMC, examining whether hearts and minds initiatives, security, and attitudes towards
Americans and the South Vietnamese government differed.
3 Overwhelming Firepower
3.1 McNamara and the Whiz Kids
The United States utilized an unprecedented number of quantitative metrics during the
Vietnam War, spurred by the systems analysis perspective that Secretary of Defense Robert
McNamara brought to the Department of Defense (DoD). McNamara pioneered the use of
operations research in the private sector during his tenure in the 1950s as President of Ford
Motor Company. Upon being named Secretary of Defense by Kennedy in 1961, McNamara
surrounded himself with “Whiz Kid” analysts from the Rand Corporation, aiming to bring
economics, operations research, game theory, and computing into DoD operations. This
produced policies and data that offer unique opportunities for estimating causal impacts.
As Defense Secretary (1961-1968), McNamara launched a variety of data systems to
monitor the progress of the Vietnam War. Field data were key-punched into mainframe
computers in Saigon and Washington and used to determine resource allocation. The result-
ing electronic data would have likely been destroyed, but data tapes produced by the two
IBM 360 mainframe computers in Saigon and Washington were subpoenaed during an IBM
lawsuit. Much of this study’s outcome data are drawn from these tapes.
17Working closely with local authorities to provide security and basic public goods may have convincedsome citizens “that they will be well rewarded and well protected when they serve as local agents in theregime’s political network,” which Roger Myerson (2011) argues is fundamental to counterinsurgency.
18When the CIA developed the original, subjective Hamlet Evaluation System in 1967, they used theUSMC Matrix metric as a template.
14

The study uses discontinuities in quantitative ratings of hamlet security to identify the
causal effects of overwhelming firepower. In 1967, the U.S. and South Vietnam began the
Hamlet Evaluation System (HES). Initially, U.S. district advisers assigned hamlets A-E let-
ter grades based on their subjective perceptions, but two 1968 studies showed that subjective
ratings did not always correlate well with actual conditions. In response, the U.S. hired a de-
fense consulting firm to develop an objective metric of hamlet security. In the Revised HES,
169 monthly and quarterly questions about security, politics, and economics were collected
by US advisory personnel affiliated with Civil Operations and Revolutionary Development
Support (CORDS), a joint civilian-military agency. Data were collected between July of
1969 and 1973 by U.S. District Advisers and their subordinates, in conjunction with South
Vietnamese District Heads and Province Heads, who obtained information by visiting ham-
lets and interviewing locals. District advisers were part of a personnel structure that advised
the South Vietnamese government. Information was not collected for hamlets controlled by
the VC, which are around 3% of hamlet-month observations.
The majority of the questions were classified into nineteen submodels, and Bayes Rule was
used to aggregate responses within each submodel into a continuous score ranging from 1 to
5. The submodel scores were rounded to the nearest whole number - creating discontinuities
- and combinatorial logic aggregated the rounded scores into an overall security score.
Specifically, the algorithm starts with a flat prior that each hamlet belongs to one of five
security classes, ranging from A (very secure) to E (very insecure). Then:
1. It updates using Bayes Rule, the question responses, and conditional probability ma-
trices, which give the probabilities that each question would take on different response
values if the hamlet was very secure (A), somewhat secure (B), and so forth. Appendix
Figure A-3 shows some example conditional probability matrices, where the first col-
umn gives response probabilities if the hamlet is an A, and so forth. The successive
application of Bayes Rule yields a posterior probability that a hamlet belongs to each
of the five latent security classes for that submodel.
2. An A is assigned 5 points, a B 4 points, a C 3 points, a D 2 points, and an E 1 point.
Then the expected value of the posterior distribution is computed, using the points
assigned to each latent class.
3. This expected value is rounded to the nearest whole number to produce a score for
that submodel. For example, a hamlet with a numerical score of 4.4999 is rounded
down to a 4/B (somewhat secure), whereas a hamlet with a numerical score of 4.5001
is rounded up to a 5/A (very secure).
4. Combinatorial logic is used to aggregate the rounded submodel scores, two or three at
15

a time, into an overall security score, which was disseminated to military planners.
Figure I illustrates the logic for combining scores two at a time. It is symmetric, taking
an average of the two submodel scores and rounding down. Figure A-4 shows the three-way
logic, which combines three scores non-symmetrically. Figure II illustrates how the nineteen
submodel scores are combined, using the two and three-way logic, to produce a single hamlet
security score.19 Intermediate scores were also created during this process, covering military,
political, and economic topics. While national and provincial trends in these intermediate
scores were disseminated, the coding manuals for creating reports document that only the
overall score was reported at the hamlet level, and hence we focus on it.
Consider the following simplified example of how the algorithm provides identification.
Suppose the security score combined two submodels, whose continuous scores are shown on
the x- and y-axes of Figure I. The thick lines show the thresholds between different output
scores, and their location is determined by the rounding of the input scores and the decision
logic used to combine the rounded submodel scores. The thresholds create discontinuities,
and identification can be achieved by comparing nearby hamlets on either side. For example,
a hamlet with continuous submodel scores of 4.7 (rounded to 5/A) and 4.49 (rounded to 4/B)
- which would produce a 4/B output score - could be compared to a hamlet with input scores
4.7 (rounded to 5/A) and 4.5 (rounded to 5/A) - whose output score would be a 5/A.
The security score combines 19 submodels, creating a 19 dimensional equivalent of Figure
I. The study computes the location of the A-B, B-C, C-D, and D-E thresholds and calculates
the distance - using a Euclidean metric in continuous score space - from each observation
to the nearest threshold. To compute the continuous scores, which were never printed or
saved from the mainframe’s memory, we located the conditional probability matrices in
uncatalogued documents at Fort McNair. We obtained the question responses from tapes
now held at the U.S. National Archives.20 The tapes also contain the rounded scores, and
we can reproduce all rounded scores using the algorithm and question responses. Appendix
Figure A-5 plots average HES scores across the sample period.21
Substantial variations in the score are strongly correlated with changes in the security
situation. However, meeting memos held in an uncatalogued collection at Fort McNair
emphasize the arbitrariness of the algorithm’s details. Military field officers were sent a
survey stating “you have been selected to participate in the design of a Bayesian processor”,
which elicited the conditional probabilities for one of the submodels. When the surveys were
19The way that submodel scores were combined changed somewhat between 1970 and 1971 to de-emphasizeeconomic submodels, but the conditional probabilities remained the same.
20HES is in Record Group (RG) 472. There is a version online from RG 330, but it is missing most months.21Appendix Figures A-6 through A-10 show a histogram plot of distance to the nearest threshold (the
running variable), as well as histogram plots of each of the nineteen continuous submodel scores. Each binis a discrete value of the score, and the y-axis shows the percentage of observations in that bin.
16

returned, the probabilities had a high variance. Conditional probabilities more than two
standard deviations from the mean were dropped, and the remaining responses were averaged
to create a conditional probability matrix for each question. When the same question enters
multiple submodels, the conditional probabilities can be different.
This study documents that the discontinuities have a strong influence on the targeting of
air strikes. Public information about targeting is thin - as it was a highly classified process
and much information remains classified today - but we can piece together some understand-
ing from declassified materials. 10% of sorties supported ground operations and most of the
remainder targeted Viet Cong supply lines and insurgents (Thayer, 1975). Declassified stud-
ies by the Defense Office for Systems Analysis (Thayer, 1975) reveal that over half of air
attacks in South Vietnam did not respond to real-time intelligence. Moreover, most were
pre-planned by the corps commander, according to a pre-allocated quota. Prior to 1968
planners had to provide answers to a detailed set of questions before allocating a sortie, but
as the air war accelerated this process was streamlined significantly to make allocating a
large number of sorties feasible. Overall hamlet security, as summarized by the HES score,
was a relevant consideration (Project CHECO, 1969). Other factors taken into consideration
included goals in the military region, security of friendly (U.S. and SVN) forces, location of
combat maneuver battalions, and enemy movements.
3.2 Empirical Strategy
Estimating the impacts of overwhelming firepower is challenging, as planners may target
places where insurgency is on the rise, confounding OLS analysis. An unconditional random
allocation, beyond being unfeasible and unethical, would likewise be uninformative, since
military resources in practice are targeted to where they are believed to be most effective.
The most informative estimation approach would be to exploit a source of plausibly random
variation that influenced the allocation of military force at the margin, between places that
had been deemed potential targets, and our specification approximates this.
The endogenous variables are immediate bombing in quarter t+1 and cumulative bombing
averaged across quarters t+ 1 through U.S. withdrawal, both instrumented by whether the
hamlet was below the security score threshold when the score was computed at the end of
quarter t.22 Quarters are used because the score was calculated primarily from quarterly
data, with just a few inputs updated monthly. The first stage takes the following form, and
the second stage regressions are analogous:
22Other papers have also exploited rounding discontinuities for identification, notably the Luca (2011)study of Yelp ratings.
17
yh,t+n =γ1belowht +4∑
d=1
δdDhtd +4∑
d=1
υdDhtdfd(distht) +4∑
d=1
ψdDhtdfd(distht)belowht
+ αt + βXht + εht
(1)
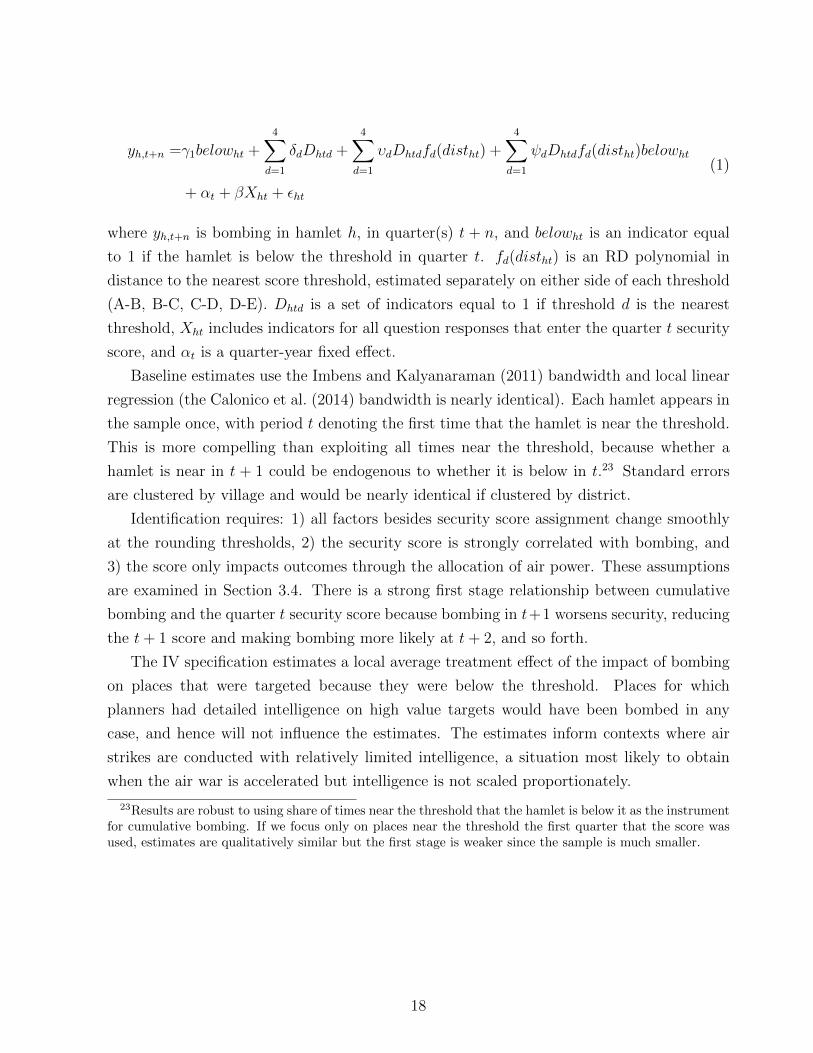
where yh,t+n is bombing in hamlet h, in quarter(s) t + n, and belowht is an indicator equal
to 1 if the hamlet is below the threshold in quarter t. fd(distht) is an RD polynomial in
distance to the nearest score threshold, estimated separately on either side of each threshold
(A-B, B-C, C-D, D-E). Dhtd is a set of indicators equal to 1 if threshold d is the nearest
threshold, Xht includes indicators for all question responses that enter the quarter t security
score, and αt is a quarter-year fixed effect.
Baseline estimates use the Imbens and Kalyanaraman (2011) bandwidth and local linear
regression (the Calonico et al. (2014) bandwidth is nearly identical). Each hamlet appears in
the sample once, with period t denoting the first time that the hamlet is near the threshold.
This is more compelling than exploiting all times near the threshold, because whether a
hamlet is near in t + 1 could be endogenous to whether it is below in t.23 Standard errors
are clustered by village and would be nearly identical if clustered by district.
Identification requires: 1) all factors besides security score assignment change smoothly
at the rounding thresholds, 2) the security score is strongly correlated with bombing, and
3) the score only impacts outcomes through the allocation of air power. These assumptions
are examined in Section 3.4. There is a strong first stage relationship between cumulative
bombing and the quarter t security score because bombing in t+1 worsens security, reducing
the t+ 1 score and making bombing more likely at t+ 2, and so forth.
The IV specification estimates a local average treatment effect of the impact of bombing
on places that were targeted because they were below the threshold. Places for which
planners had detailed intelligence on high value targets would have been bombed in any
case, and hence will not influence the estimates. The estimates inform contexts where air
strikes are conducted with relatively limited intelligence, a situation most likely to obtain
when the air war is accelerated but intelligence is not scaled proportionately.
23Results are robust to using share of times near the threshold that the hamlet is below it as the instrumentfor cumulative bombing. If we focus only on places near the threshold the first quarter that the score wasused, estimates are qualitatively similar but the first stage is weaker since the sample is much smaller.
18

3.3 Data
3.3.1 Bombing Data
This study utilizes data from the U.S. National Archives. Our preferred data on bombing are
from the Hamlet Evaluation System (HES), a joint data collection effort between the U.S.
and South Vietnam described in Section 3.1. HES records whether air or artillery fire struck
near a populated area of the village during the past month, and we use this to compute
the share of months during the quarter with a strike. Since we do not find impacts of the
security score on ground troop activity - using HES as well as detailed administrative data
- we expect any impacts to be driven primarily by air strikes. However, even if results are
driven by both air and artillery fire, the study’s broader arguments about the impacts of
overwhelming firepower would remain unchanged.
We also examine Air Force data providing the coordinates of ordinance dropped over
South Vietnam.24 Unfortunately, the system was migrated during our sample period, leading
to fragmentary information.25 It is also difficult to infer whether the ordinance struck a
populated area, as the data record the approximate coordinate where the ordinance was
dropped, not what it hit, and we only know the coordinate of the hamlet centroid.26
3.3.2 Outcome Data
We combine three diverse sources of outcome data to elucidate robust insights about impacts:
HES, armed forces administrative data, and public opinion surveys. One can raise concerns
with any single data source, but together they help to paint a consistent picture.
HES contains answers to questions about monthly and quarterly security, as well as
economic, governance, and civic society outcomes, and has been described above. The main
concern in the context of outcome data is that it exhibits differential measurement error
by whether the hamlet was bombed. For example, CORDS advisers may have reported
less VC activity to show that bombing was working, or more VC activity to justify that
bombing was needed. While there have been critiques of HES, overall the evidence points
to the source as being reasonable, if potentially noisy, and to our knowledge there are no
critiques suggesting differential measurement error by bombing or incentives for this type of
misreporting. A well-known critique of HES comes from a memoir by David Donovan (1985),
24These are “Combat Air Activities” (RG 218, 529) and “Sorties Flown in Southeast Asia” (RG 218).25Some months appear in both systems but record different incidents. Some months are marked as
incomplete in both systems.26These data also contain information on the type of target, which in theory could provide additional
information not available from HES but in practice is typically missing: for 71% of strikes in our samplethe target is missing, 9% list it as “confirmed enemy”, 3.9% list it as “bunkers”, 3% list it as “any [enemy]personnel”, and 2.8% list it as “structures.”
19

who observed its collection during his tour of duty in Vietnam. He argued that U.S. District
Advisers delegated collection to subordinates or collected information hastily since they were
overworked. He also claims that advisers feigned progress by inflating responses over time.
While it was plausibly common to rely on subordinates, and to be hasty, it is not obvious
that Donovan’s experiences generalize. For example, scores tend to deteriorate across our
sample period. An academic critique of Vietnam era data by Gregory Daddis (2011, p. 40)
argues that the main failing, particularly in the case of HES, stemmed “not from a lack of
effort” by those collecting the data, but rather from an over-reliance on summary statistics
without a careful interpretation of what the data implied about policy effectiveness.27
Second, we examine administrative data from the U.S. and South Vietnamese armed
forces on operations, attacks, and casualties. Specifically, data on ground troops are from the
“Situation Report Army” (RG 218). Data on enemy initiated attacks from 1964-1969 come
from the “Vietnam Database” (RG 330), and data on naval incidents are from the “Naval
Surveillance Activities File” (RG 218). Finally, data on South Vietnamese territorial defense
units are from the “Territorial Forces Evaluation System” (RG 472) and the “Territorial
Forces Activity Reporting System” (RG 330). The collection of these data was independent
of HES. VC casualties (the so-called body count) should be taken with a grain of salt - as
they conflated civilians with insurgents and were exaggerated - but attacks, U.S. operations,
and U.S. casualties are well-measured.
Finally, public opinion data on citizen attitudes towards local government, national gov-
ernment, and the war are available for a sample of hamlets through the Pacification Attitudes
and Analysis Survey (PAAS, RG 472), a U.S.-South Vietnamese effort that was compiled by
Vietnamese enumerators. PAAS was launched in March of 1970 and was conducted monthly
until December of 1972, overlapping closely with the period in which the security score was
used to target bombing, though unfortunately not all months have been preserved.28 Each
month, surveys were conducted in 6 randomly selected hamlets per province. 15 respondents
were randomly selected per hamlet, with stratification on demographic characteristics. The
number of months in which a given question was included in the questionnaire - and whether
the question was asked in all or only a subset of hamlets - varies. Sample sizes for some
interesting questions - such as those about anti-Americanism - are sufficiently small that few
observations are left when we limit to hamlets near the security score discontinuities.
27In a description of HES, CORDS director Robert Komer (1970) similarly concludes: “Vietnam hasbeen the most extensively commented on but least solidly analyzed conflict in living memory...[HES’s] fullexploitation may have to be left to the academic community.”
28Tapes containing information for May, 1970 through February, 1971 and for August and September of1971 were not preserved.
20

3.4 Results
3.4.1 First Stage
We begin by examining graphically the relationship between being below the security score
threshold and the share of months in the quarter with air or artillery strikes near inhabited
areas. Discontinuity fixed effects are partialled out so barely A’s are compared to barely B’s
and so forth, but other controls are excluded in order to transparently display the raw data.
As discussed above, since we find little immediate impact of the security score on ground
troop activity, we expect impacts to be driven primarily by air strikes. However, even if
the discontinuity is driven by both air and artillery fire, the study’s arguments about the
impacts of overwhelming firepower would remain unchanged.
Figure III, panel (a) uses a local linear polynomial to plot strikes in quarter t+ 1 against
the distance to the nearest threshold in quarter t. Dashed lines show 95% confidence in-
tervals. A negative distance signifies that the hamlet is below the threshold. Strikes fall
discontinuously at the threshold, indicating that the score was an important determinant.
When the controls from eq. (1) are included, estimates become more precise but do not
change in magnitude. Panel (b) repeats this exercise for the cumulative specification, plot-
ting the distance to the threshold in quarter t against average strikes in quarters t+1 through
U.S. withdrawal. Again, strikes change discontinuously at the threshold. As we’ll show, the
cumulative first stage is strong because bombing reduces security, which lowers the score and
makes future bombing more likely.
Appendix Figure A-11 documents that these estimates are highly robust to the choice of
bandwidth and are also robust to the choice of RD polynomial, as are the study’s other main
outcomes.29 Estimates tend to become noisier when a quadratic RD polynomial is used and
sometimes are no longer statistically significant, but the point estimates are typically similar
in magnitude and statistically indistinguishable.
Panel (c) examines how the score relates to bombing in the quarters before and after it
was computed, by plotting quarter-by-quarter RD estimates from equation (1). There is no
pre-period impact of being below the threshold, and the effect persists following the score’s
dissemination.30 Panel (d) shows the McCrary plot, which tests for selective sorting around
the threshold. Given that the continuous scores were never viewed and required the world’s
most powerful computer to calculate, it would have been difficult to manipulate around the
threshold, and indeed there is no discontinuity in the density of observations.31 During 1969
29The quadratic RD polynomial specification becomes extremely noisy when the polynomial is estimatedseparately on each side of the four score discontinuities. Hence, for the quadratic specification, we estimatea single RD polynomial, separately above and below the thresholds.
30The sample can be extended further back, but sample size declines substantially.31Moreover, the conditional probabilities were classified and were not known by those in the field who
21

the system was in pilot, and the security score was computed but not disseminated. Panels
(e) and (f) document that there are no impacts of security scores in 1969 on bombing in the
following quarter or cumulatively until U.S. withdrawal.
Next, we examine whether hamlets barely above the threshold are a valid control group
for those barely below. Since the data used to compute the score were not received until
the close of the quarter, there should be no contemporaneous impact. Figure IV, panel (a)
documents that contemporaneous strikes change smoothly at the threshold. Strikes during
quarter t−1 (panel b) and on average during the pre-period (panel c) also change smoothly.
Table I examines pre-period balance for the study’s outcomes, using the pre-period char-
acteristics as the dependent variables in equation (1). Columns (1) and (2) consider quarter
t− 1 and columns (3) and (4) the entire pre-period. The coefficients on below are typically
small and statistically insignificant, with the few statistically significant differences plausibly
arising due to sampling error.
To further check for balance, we predict strikes in t + 1 using the variables that enter
the period t security score but not the score itself. Figure IV, panel (d) documents that
predicted strikes change continuously, as expected given that the characteristics that enter
the score change smoothly. Panel (e) documents a similar pattern for predicted cumulative
strikes. Information about VC attacks on troops is available for an extended pre-period.
Panel (f) plots the quarterly relationship from eq. (1) between being below the threshold
and VC attacks for 1964-69, documenting that attacks are balanced throughout the period.
Finally, we conduct the following randomization exercise. For each of the study’s out-
comes, we randomly re-assign distance to the threshold. We regress the outcome of interest
on the re-assigned indicator for whether the hamlet is below the threshold, and then re-
peat this exercise 1,000 times. Appendix Figures A-12 through A-24 plot the distribution of
placebo coefficients for each of the study’s outcome variables, showing the actual coefficient
on below the threshold with a vertical red line. For both the immediate and cumulative first
stage, the actual coefficient is far in the right tail of the placebo distribution, indicating that
these effects are very unlikely to arise by chance. Table A-1 reports the share of the 1000
absolute placebo coefficients that are larger in magnitude than the absolute actual coefficient
on the below threshold dummy.32 The p-values computed using the randomization exercise
provide a similar picture to those computed using conventional inference.
Table II reports the first stage estimates using the RD specification from equation (1).
Being below the score threshold in quarter t increases the share of months in quarter t + 1
with bombing or artillery fire that hit near inhabited areas by 5.4 percentage points, relative
to a sample average probability of 28 percent (column 1). The F-statistic, equal to 14.9,
collected the data (Komer, 1970).32We use absolute coefficients in order to conduct a two-sided test.
22

indicates a strong first stage relationship. Columns (2) and (3) document that there is no
discontinuity using period t and t−1 bombing, respectively, and column (4) shows that there
are no significant impacts using scores from 1969, when the score was not disseminated.
Column (5) reports the first-stage for the cumulative specification. Being below the
threshold in quarter t increases the share of months with bombing or artillery fire that hit
inhabited areas in quarters t+ 1 through U.S. withdrawal by 4.4 percentage points, relative
to a sample average probability of 26 percent. The first stage F-statistic is 11.5. Column
(6) shows that cumulative pre-period bombing is balanced, and column (7) documents that
there is no impact of being below the threshold in 1969 on cumulative bombing afterwards.
These patterns can be validated with the Air Force ordinance data, which while incom-
plete for our period, provide corroborating information. RD estimates document that being
below the threshold increases the tons of ordinance dropped within 5 kilometers of the ham-
let by 22 percentage points, though the effect is noisily estimated and would not provide a
strong first stage. 21% of hamlet-months have ordinance dropped within 5 kilometers.
While the circular error probability of bombers was in principle low enough to target a
given village, in practice neighbors could be hit instead. This would weaken our first stage,
and the strength of the first stage suggests targeting was reasonable. Appendix Table A-2
does not find a statistically significant impact of own score on neighbors’ bombing, where
neighbors are other villages within a 10 km radius (estimates are robust to other radii).
We focus on bombing because we do not find evidence that the score directly affected
other military allocations. However, even if it did the interpretation of the results as inform-
ing our understanding of the overwhelming firepower strategy would remain unchanged. To
examine whether there are direct effects on other allocations, we focus on whether they
change in quarter t + 1: military planners use recent information to locate insurgents and
hence it is unlikely that the score would have no immediate effects but would directly influ-
ence allocations later. To the extent that long-run but not short-run allocations changed,
this would suggest indirect effects - i.e. troops responding to a deterioration in security
caused by bombing. Since this could also happen immediately, positive short-run impacts of
the score on other allocations would not necessarily imply direct effects, but null correlations
would suggest that direct effects are unlikely.
Table III, column (1) documents that there is no discontinuity in whether friendly (U.S.
or SVN) ground troops operated near populated areas in quarter t+1. These data are drawn
from the same questionnaire as the data on air/artillery strikes and are used to maximize
comparability. Columns (2) and (3) use armed forces administrative data to document that
the score likewise does not immediately impact U.S. battalion operations or U.S. initiated
attacks, and columns (4) and (5) show that there are no effects on South Vietnamese battalion
23

operations or South Vietnamese initiated attacks.33 The coefficients are small and precisely
estimated. Moreover, there is no discontinuity in U.S.-initiated naval attacks (column 6),
in the presence of South Vietnamese Regional or Popular Forces, which were regional self-
defense forces (columns 7 and 8), or in the presence or share of households participating in
the People’s Self-Defense Forces, which were local self defense units (columns 9 and 10).34
Finally, there is no effect on the presence of South Vietnamese development aid teams (the
Rural Development Cadre, column 11). In an extensive qualitative search, the only other
allocation we could find that used the hamlet-level HES score directly was the Accelerated
Pacification Campaign, which aimed to drive VC out of D and E hamlets following the Tet
Offensive. It began in 1968 and had concluded before the start of our sample period.
3.4.2 Impacts on Military Objectives
We now turn to an investigation of how overwhelming firepower impacted U.S. military
objectives, using the hypotheses discussed in Section 2.2.3 as a guide. Data are drawn from
HES, armed forces administrative records, and public opinion surveys.
HES contains multiple questions on security, some with categorical responses. We code
these into binary indicators that preserve as much variation as possible (see the data appendix
for more details). For example, a coding of no VC attacks as 0 and sporadic/frequent
VC attacks as 1 preserves significantly more information than a coding of no/sporadic VC
attacks as 0 and frequent attacks as 1, since frequent attacks are rare.35 To address multiple
hypothesis testing concerns - and also to show that effects are not driven by the coding of
categorical questions into binary outcomes - we compute a summary measure created using
latent class analysis (LCA) that combines information from all available security questions.36
Based on the observed question responses, latent class analysis uses a mixture model to
estimate the posterior probability that each hamlet belongs to one of two latent groups
associated with “high” and “low” security. LCA is described in detail in the data appendix.37
Table IV, column 1 reports the immediate effect of bombing on the security LCA, using
33Battalion operations exclude small scale operations. Data on small operation movements are unavailable,but U.S. (SVN) initiated attacks include all attacks made by the U.S. (SVN), regardless of the size of theattacking unit.
34Data on U.S. initiated attacks are available through the first quarter of 1972. Data on the allocation ofnaval personnel are only available at the district level.
35An alternative would be to estimate a multinomial logit, but this does not converge well since there isoften little variation in some of the categories.
36We include questions that are available for the entire sample period. Results are similar if we includequestions that were only asked during part of the sample period.
37An alternative method sometimes used to address multiple comparisons is a Bonferroni adjustment,which divides the p-value required to reject the null by the number of hypotheses under consideration. TheBonferroni correction targets Type 1 error but at the same time can severely exacerbate Type 2 error becauseit substantially reduces power. Hence, we prefer the much higher-powered LCA approach.
24

whether the hamlet was below the threshold as the instrument. Moving from no strikes to
the sample mean of 0.28 strikes per month decreases the posterior probability of being in
the high security class by 19 percentage points (−0.67 × 0.28), relative to an overall sample
mean of 0.65, and the effect is statistically significant at the 1% level.38 Column (2) considers
cumulative effects until U.S. withdrawal. The point estimate of -0.64 (s.e. 0.25) suggests that
moving from no cumulative strikes - which is rare - to the sample average of 0.26 strikes per
month decreases the posterior probability of being in the high security class by 17 percentage
points. Appendix Figures A-25 and A-26 plot the reduced form RD relationships. Placebo
checks, reported in Appendix Table A-3 for this and the other main outcomes, document
that bombing does not impact the security posterior probability in t−1, nor does cumulative
bombing affect the average pre-period posterior probability.
The remaining columns examine cumulative effects until U.S. withdrawal, for outcomes
that enter the LCA.39 Estimates using the immediate specification tend to be qualitatively
similar but noisier. Moving from no bombing to the sample mean increases the average
probability of an armed VC presence in a hamlet-month by 15 percentage points, relative
to a sample mean probability of 0.19, and the estimate is statistically significant at the 5%
level (column 3). Figure V, panel (a) plots the reduced form relationship between distance to
the threshold and VC armed presence in the raw data, revealing a clear discontinuity. Col-
umn 4 documents that moving from no bombing to the sample mean increases the average
probability that there is an active VC village guerrilla squad during a given quarter by 27
percentage points. The village guerrilla squad consists of locals, and hence this is an impor-
tant outcome indicating an increase - and not just a reallocation - of VC activity. Bombing
also increases the probability that a VC main or full-time local squad, which may operate
throughout the region, is active (column 5) and increases the probability that there is a VC
base nearby (column 6). Finally, bombing increases attacks on local security forces, govern-
ment officials, and civilians by 9 percentage points, relative to a sample mean of 16 percent
of hamlet-months witnessing an attack (column 7). Together these outcomes illustrate that
rather than reducing insurgent forces and draining insurgent morale, overwhelming firepower
near civilian populations increased VC activity and local participation in the VC.
In addition to its military branch, the VC also maintained a political branch - called
the VC Infrastructure - tasked with propaganda, recruitment, and extortion (taxation).
38The main text reports IV estimates, and Appendix Table A-4 documents that OLS estimates are similar.This could be the case because on average biases in the OLS cancel each other out - i.e. an upward omittedvariables bias cancels a downward attenuation bias - or the OLS could be a biased estimate of an averagetreatment effect that is different from the local average treatment effect estimated by the IV.
39Appendix Table A-5 reports estimates for the other outcomes that enter the security LCA. The effectsare qualitatively similar, but the outcomes reported in Table A-5 tend to have significantly less variationthan the outcomes in the main text. Hence more power is required to detect effects, and impacts tend notto be statistically significant.
25

Column 8 documents that moving from no bombing to sample mean bombing increases
the probability that there is an active VC Infrastructure by 25 percentage points, and this
effect is statistically significant at the 5% level. Figure V, panel (b) plots the reduced
form relationship between distance to the threshold and VC Infrastructure presence in the
raw data. Bombing also increases the share of households estimated to have engaged in
VC Infrastructure activities by around 4 percentage points (column 9). These outcomes
again illustrate an increase in local engagement with the VC. There is not a statistically
significant effect on whether a VC propaganda drive was held, although the coefficient is
large and positive (column 10). Finally, bombing increases the probability that the VC
extorted residents by 23 percentage points, relative to a sample mean of 0.27 (column 11).
We explore a variety of robustness checks. Appendix Figure A-11 documents that the
estimated impacts on the security LCA are robust to the choice of bandwidth and RD
polynomial.40 Moreover, Appendix Figure A-27 (A-28) plots quarter x quarter reduced form
(IV) estimates. There is no impact of being below the threshold (bombing) before score
assignment, whereas being below the threshold (bombing) reduces the security LCA after
score assignment. The impacts after score assignment are all negative, as expected, though
some are noisily estimated. Similar figures are shown for the study’s other main outcomes.
Our specification pools four separate thresholds, and one interesting question is whether
effects obtain across all thresholds or are concentrated around particular ones. 35% of obser-
vations are near the A-B threshold, 46% near the B-C threshold, 16% near the C-D threshold,
and 3% near the D-E threshold. Hence, we are most powered to detect effects around A-B
and B-C, and very under-powered to detect effects around the lower thresholds. Figure A-29
plots bombing against distance to the threshold, separately for all four thresholds. It docu-
ments discontinuities at the A-B, B-C, and D-E thresholds. Around the A-B threshold, low
A’s have only around a 5% chance of being hit in a given month, whereas high B’s have a
10% chance of being hit. Air Force planners were combining various pieces of information to
target the VC, and having a higher score led them to give the area the benefit of the doubt
more often. Low B’s have around a 25% chance of being hit, whereas high C’s have a 30%
chance. Around the C-D threshold, both low C’s and high D’s have around a 50% chance
of being hit. Finally, around the D-E threshold, low D’s have around a 55% chance of being
hit, whereas high E’s have nearly a 75% chance of being hit. Figure A-30 shows that the
discontinuities in the security posterior probability closely match this pattern. There is not
enough power to run IV estimates by threshold, but Figure A-31 shows coefficient plots for
the reduced form for the outcomes in Table IV. Impacts of the score on security outcomes are
concentrated around the A-B, B-C, and D-E thresholds, though some estimates are noisy.
40The other outcomes in Table IV are similarly robust but are not shown to avoid displaying a very largenumber of coefficients.
26

Similar patterns obtain for the study’s outcomes more generally.
Thus far we have focused on direct impacts, but bombing could also affect other loca-
tions. As discussed in Section 2, nearby places might be less likely to support the VC if
seeing a neighbor get bombed leads residents to update their beliefs about the costs of sup-
porting the insurgents. Additionally, VC recruiters might go to the bombed areas instead
of targeting nearby places. On the other hand, if nearby bombing creates grievances or
disillusionment - or impacts the opportunity cost of insurgency - it could increase VC sup-
port. We examine spillovers using two measures of neighbors: contiguous areas and places in
the same VC administrative district.41 Spillovers would likely occur in nearby places, since
media markets were nearly non-existent (radio and television were state-owned), and VC
recruitment networks were highly local. Moreover, spillovers might be more likely to occur
in denser areas, and hence we consider spillover estimates both for the full sample and only
in the sub-sample with above median hamlet density. Tables A-6 through A-25 report four
spillovers specifications - nearby, same VC district, nearby dense only, and same VC district
dense only - for all the study’s outcomes, where the average outcome in the nearby areas is
used as the dependent variable. There is limited evidence of spillovers, and to the extent
they exist, they tend to go in the same direction as the direct effects. This is true both for
the full sample and for the more densely populated areas. These results suggest that in a
context where so many explosives were dropped that the odds of having explosives hit near
your own hamlet were high, seeing neighbors hit either had little effect, or the intimidation
effects on average approximately canceled out grievance or opportunity cost-type effects.
A potential concern with the above results using HES data is that CORDS advisers may
have reported less VC activity to show that bombing was working, or more VC activity to
justify that bombing was needed.42 Administrative data on U.S. troop movements and ca-
sualties provide an alternative, very well-measured source of information on security, that is
informative because over time troops would plausibly respond to a deterioration of security.
The data are also interesting in their own right, as overwhelming firepower unleashed by
ground troops could contribute to the impacts of bombing. Table V, columns 1 through 6
consider immediate effects, and columns 7 through 12 examine cumulative impacts. Con-
sistent with ground troops not directly using the score to allocate resources, there are no
contemporaneous effects. In contrast, column 7 documents, using data from HES, that
moving from no bombing to sample mean bombing over the course of the war increases the
monthly probability that friendly troops operated nearby by 17 percentage points. Moreover
41The appendix uses a radius of 10 kilometers. Results are similar when other radii are utilized.42HES continued to be collected by the South Vietnamese for a year following U.S. withdrawal. The
study cannot reject that the impacts of cumulative bombing on the average LCA posteriors prior to U.S.withdrawal are the same as those on the average LCA posteriors in the year following U.S. withdrawal. Thissuggests that effects are unlikely to be driven purely by reporting incentives of the U.S. district advisers.
27

armed forces administrative data show that U.S. battalion operations are more likely over
the course of the war near more bombed areas (column 8), as are U.S. initiated attacks
(column 9). Figure V, panel (c) plots the RD relationship between distance to the threshold
and U.S. initiated attacks.
There is no impact on the number of U.S. deaths (column 10), which with a mean of
0.06 are relatively rare within a 5km radius of any given hamlet, whereas bombing increases
South Vietnamese and VC troop deaths (columns 11 and 12). There is a large literature
arguing that VC deaths - the so-called “body count” - were largely fabricated and conflate
civilians with insurgents, and thus it is unfortunately difficult to conclude from these data
how many VC insurgents were killed. Regardless, the various security measures in Table IV
suggest that on net VC activity increased following bombing.
These estimates are complimented by Figure A-44, which examines citizens’ perceptions
of security. The data are drawn from public opinion surveys collected by South Vietnamese
enumerators and provide an alternative source to corroborate the effects documented above.
The surveys were conducted in six randomly selected hamlets in each province x month and
not all months have been preserved. Hence, these data are available for a much smaller
sample, and due to lower power the first stage is weaker, though the coefficients do not
differ significantly. To avoid a weak first stage, Figure A-44 instead plots the reduced form.
Perceived VC terrorism in the hamlet is higher below the threshold (panel a); the probability
of citizens reporting VC recruitment is higher, though the effect is noisy (panel b); citizens’
assessment of the effectiveness of local officials at ensuring security is worse (panel c); and
citizens rate the police as less effective in preventing VC activity (panel d).
The evidence in Section 2.2 suggests grievances and changes in the economic opportunity
cost of joining the insurgency as potential reasons why bombing near civilian population
centers could backfire militarily. South Vietnam was a subsistence agricultural economy
with little capital to destroy. The economic effects, reported in Table VI, appear weaker and
more delayed than the security effects, suggesting that grievances may be more central, but
it would be unwarranted to dismiss opportunity costs given the noisy nature of the available
economic data.
Specifically, column 1 reports the immediate effect of bombing on the probability of
being in the high economic latent class - constructed using the same methodology as the
security LCA - and the estimate is small and statistically insignificant. Column 2 considers
the cumulative specification. The point estimate is negative and fairly large but not quite
statistically distinct from zero. Columns 3 to 8 report cumulative estimates for all outcomes
used in the LCA. Bombing decreases the availability of manufactures (column 4), reduces the
likelihood that there is a surplus of goods (column 5), and reduces the share of households
with access to a vehicle (column 7). The point estimate for the availability of non-rice
28

foodstuffs (column 3) is negative but statistically insignificant, and the impacts on whether
plots are left fallow due to security concerns (column 6) and the share of households requiring
assistance to subsist (column 8) are positive but insignificant.
3.4.3 Nation Building Objectives
Those who believed overwhelming firepower could be used as a tool for nation building
argued that it would drive citizens to urban areas - where they were easier to control - and
would signal that the central state intended to be the wave of the future. The hope was
that by signaling to the population that the government, not communist rebels, would be
the main game in town, over time individuals would become more engaged with the state
and non-communist civic society. This would lead to better local administration, public
goods provision, and civic engagement. In contrast, skeptics argued that overwhelming
firepower would widen the political legitimacy gap between the VC and the South Vietnamese
government, already seen by many as an imperialist puppet of the U.S.
Table VI, column (9) examines quarterly population growth. Hamlet population was de-
clining in this period, though the secondary literature notes that Vietnamese often remained
even when their towns were destroyed (Appy, 2015, p. 167). The coefficient on bombing
is negative but statistically insignificant. Bombing also reduced population through deaths,
and hence it appears unlikely that it led to movements to urban areas on the massive scale
envisioned by advocates of forced draft urbanization (as confirmed by urban population).
Next, we consider impacts on local government administration. Column 1 of Table VII
examines the contemporaneous effect of bombing on a local government administration LCA,
which incorporates the government’s ability to tax, staff its positions, and interface with
citizens. The point estimate is small and statistically insignificant, which is not surprising
since this may change slowly. Column 2 documents that an increase in cumulative bombing
until U.S. withdrawal from zero to the sample mean decreases the posterior probability of
being in the high administration latent class by 8 percentage points.
Columns 3 through 5 examine outcomes that enter the administration LCA.43 Moving
from no bombing to sample mean cumulative bombing decreases the probability that all
village committee positions are filled by 21 percentage points, relative to a sample average of
0.84 (column 3). The village committee administered public goods provision, and Figure V,
panel (d) plots the reduced form relationship for this outcome. Moreover, bombing reduces
the probability that the local government systematically collects taxes by 25 percentage
points, relative to a sample mean of 0.70 (column 4). Finally, the village chief is less likely to
visit all neighborhoods in the village at least once a month in more bombed areas (column
43Additional outcomes entering the LCA are presented in Table A-26. The other outcomes do not haveas much variation, and thus we are less powered to detect effects.
29

5). Bombing could directly impact the functioning of local government, and by widening
the political legitimacy gap it could lead citizens to undermine it in many small ways, even
short of joining an insurgency (Scott, 1985).
Both education and health care were provided primarily by local governments. Column
6 documents that there is not an immediate effect of bombing on the posterior probability
of being in the high education provision latent class, which incorporates questions about
the accessibility of primary and secondary education and challenges faced by schools. In
contrast, moving from no bombing to sample mean bombing over the course of the war
reduces the probability of being in the high latent class by 12 percentage points, relative to
a sample mean of 0.66 (column 7). Columns 8 and 9 document that cumulative bombing
reduces access to primary and secondary school, respectively. See also Figure V, panel (e).
Decreases in the government’s ability to provide public goods may have further widened the
legitimacy gap, and the VC argued that a lack of access to schools provided a recruitment
boost (Tang and Chanoff, 1985, p. 202). Next, columns 10 and 11 consider the impact
of immediate and cumulative bombing on the health care provision LCA. If anything, the
impact is positive, but it is not statistically significant. Bombing could increase health care
demand. Column 12 examines whether public works were under construction during the
quarter. The estimate is negative and large but not statistically significant.
Increasing non-communist civic engagement was another aim of nation building in South
Vietnam, but the study shows that bombing had the opposite effect. Column 1 of Table VIII
documents that there is an immediate negative impact of bombing on civil society, which is
significant at the 10% level. Column 2 estimates that moving from no bombing to sample
mean cumulative bombing reduces the probability of being in the high civil society latent
class by 14 percentage points, relative to a sample mean of 0.69, and this effect is significant at
the 5% level. Columns 3 to 9 report cumulative estimates for all outcomes used in the LCA.
Moving from no to sample average bombing reduces the share of individuals participating
in civic organizations by 13 percentage points, relative to a sample mean of 0.29 (column
3). Figure V, panel (f) plots this reduced form relationship. The impacts on participation
in the People’s Self Defense Force and economic training programs are negative but not
statistically significant (columns 4 and 5). Locally organized self-development projects are
less likely to be underway in more bombed hamlets (column 7). There is not a statistically
significant impact on the presence of youth organizations (column 8) or whether the local
council meets frequently with citizens (column 9). In summary, bombing made citizens more
likely to engage in the insurgency and less likely to participate in non-communist civil society,
plausibly by reducing the legitimacy of the non-communist state in the eyes of its citizens.
30

4 Overwhelming Firepower versus Hearts and Minds
4.1 Overview
This section examines a second natural experiment, which compares the overwhelming fire-
power strategy pursued by the U.S. Army to a more hearts and minds oriented counterin-
surgency (COIN) approach pursued by the U.S. Marines (USMC).
Military historian Austin Long examines a 1967 natural experiment in which the Army
replaced the Third Marine Division, which was diverted to deal with urgent threats along
the DMZ. Long documents that the USMC emphasized small-unit operations in conjunction
with locals, whereas the Army emphasized overwhelming firepower. For example, the Army
expended significantly more rounds of ammunition than the USMC after assuming control of
the districts, even on days with no enemy contact. The latter occurred because of harassment
and interdiction (H & I), which did not have a specific target but rather fired at a general
area that could contain the enemy but also civilians. 88% of Army rounds were used for H
& I in the districts Long examines. Moreover, refugees were produced five times faster after
the Army arrived than when the USMC controlled the districts.
This study exploits another natural experiment comparing the Army and Marines to
shed light on whether their distinct COIN strategies plausibly led to different outcomes.
The USMC commanded Corps I, the northernmost of the four military regions in South
Vietnam, whereas the Army commanded neighboring Corps II. Lyndon Johnson deployed
the Marines - who serve as international first responders - to Vietnam in 1965 to protect a
key airbase in Da Nang, located in Corps I. Later that year the USMC expanded into the
rest of northern South Vietnam. The Marines were given command of Corps I upon arrival
and retained it until March of 1970, when the Army assumed command, and the USMC
withdrew from Vietnam in April of 1971. The corps boundaries followed pre-existing province
boundaries. Army soldiers operated in Corps I, under USMC command, and administrative
data document that the Marines were concentrated almost exclusively in Corps I.44 The
3rd Division was stationed along the DMZ and engaged primarily in conventional warfare,
whereas the 1st Division conducted counterinsurgency in the remainder of Corps I.
We use an RD to compare across the corps boundary (Figure VI). If other factors change
smoothly, the RD will isolate the causal impact of the USMC relative to the Army, though
there could be other mechanisms beyond COIN strategies that led to different outcomes.
Qualitative evidence points to the differences in COIN strategies discussed in Section 2.3 as
particularly central, painting a picture that is consistent with the bombing results.
4499.7% of armed incidents involving the USMC occurred in Corps I, 99.8% of attacks on U.S. Marineswere in Corps I, and 99.8% of deaths of U.S. Marines were in Corps I. Appendix Figures A-45 to A-47 plotUSMC initiated attacks, enemy attacks on the USMC, and USMC casualties, respectively.
31

Differences in personnel recruitment, training, and rotation are the most plausible al-
ternative channels that differentiate the Army and Marines, but these differences appear
relatively modest. Notably, average Army and Marines scores on the Armed Forces Qualify-
ing Test (AFQT) - which was taken by all soldiers - were not different, nor were the shares
of soldiers drawn from the lowest AFQT score groups (Dawson, 1995). High school com-
pletion rates for Army soldiers were slightly higher. The Army also had a higher share of
soldiers from the Selective Service, but rates varied from year to year, and the USMC relied
extensively on the draft from 1968 until withdrawal. Table A-27 compares a wide range of
demographic characteristics of Army and USMC casualties.45 USMC casualties were mod-
estly more likely to be from the Northeast, whereas US Army casualties were modestly more
likely to be from the South, but there are no differences in racial composition.
Initially, USMC boot camp was 4 weeks longer than Army boot camp, but due to man-
power shortages it was shortened from 12 to 8 weeks - the same length as Army boot camp -
starting in 1967. Both the USMC and Army pursued an individual rotation policy, in which
enlisted men were rotated in and out of combat units on a 12 (Army) or 13 (USMC) month
schedule. During a tour of duty, Army officers spent six months each in combat and staff
positions, whereas USMC officers could be assigned for the entire year to combat, which may
have boosted morale or provided more relevant experience (Gabriel and Savage, 1979).46 It
is possible that differences in officer rotation or other officer characteristics could contribute
to differences across the boundary, though impacts are statistically identical across quarters
and thus unlikely to be driven entirely by officers in months 7 through 12 of their rotation
or by particular individuals stationed near the boundary.
4.2 Empirical Design
To compare the impacts of the USMC to those of the Army, the study uses a spatial regression
discontinuity across the Corps Region I-II boundary:
yhs = α0 + α1USMChs + f(laths, lonhs) + βGhs + αs + εhs (2)
where USMChs is a dummy equal to 1 if hamlet h, along segment s, is in Corps I and
f(laths, lonhs) is an RD polynomial in latitude and longitude. Ghs is a vector of geographic
controls, and αs is a boundary segment fixed effect that splits the boundary into two seg-
ments. Standard errors are clustered by village. The baseline utilizes a local linear specifi-
cation and a bandwidth of 25 kilometers. Results are robust to alternative specifications.47
45This information cannot be released for individuals who are still living.46Due to rotation policies, however, officers would not spend the entire time with the same soldiers, and
often not in command of the same unit.47Table A-28 examines robustness to using a quadratic RD polynomial, and Table A-29 examines a wider
32

The identifying assumptions for a spatial RD are the same as those for the RD in security
score space, and Table IX examines whether pre-characteristics change smoothly at the corps
region boundary, which followed the pre-existing provincial boundary. Column 1 considers
VC attacks, averaged from 1964 through when the Marines established operations in southern
Corps I in May, 1965. VC attacks are balanced during the pre-period. The dependent
variable in Column 2 is a dummy for whether the hamlet is urban. The estimate is small
and statistically insignificant, suggesting no difference in urbanization across the boundary.
Columns 3 and 4 consider elevation and slope, respectively, documenting that there are no
statistically significant differences.
Next, geo-referenced 1929 maps are used to compute whether there are various landmarks
located near the hamlet: factories (column 5), markets (column 6), military posts (column
7), telegraphs (column 8), and train or tram stations (column 9). While the landmarks tend
to be rare, the limited data from the French colonial period are highly aggregated, and these
maps provide a unique source of hamlet level information. Overall, colonial landmarks are
balanced, though military posts are higher on the Marines’ side of the boundary, and the
difference is significant at the 10% level. Columns 10 and 11 examine the density of all roads
and paved colonial-built roads near the hamlet, taken from the 1929 maps. Total roads are
higher on the Marines side, but paved roads are not. Data on outcomes like schooling or
health care are not available, and these were not widely accessible.
4.3 Results
We compare outcomes across the Army-USMC boundary, using the spatial RD described by
equation (2) and data drawn from HES, military administrative records, and public opinion
surveys. Outcomes are averaged for the period prior to USMC withdrawal in April 1971.
We first examine whether public goods targeted by the Marines - education and health
care - were higher on their side of the boundary, using data from HES. CORDS, the agency
that collected these data, was not directly affiliated with the USMC or Army. Columns 1 and
2 of Table X document that the posterior probability of being in the high education latent
class is 24 percentage points higher on the USMC side of the boundary and the probability
of being in the high health care provision latent class is 56 percentage points higher.48
Columns 3 through 9 examine differences across the boundary in security. The posterior
probability of being in the high security latent class is 10 percentage points higher on the
50 kilometer bandwidth. Results are broadly similar. While the education LCA is still positive and fairlylarge in magnitude, it is no longer statistically significant.
48Results for specific outcomes, available upon request, document that primary school completion is 39percentage points higher, medical services are 19 percentage points more likely to be available, and publicworks are 28 percentage points more likely to be under construction on the USMC side.
33

Marines’ side of the boundary, relative to a sample mean of 0.35, but the estimate is not
statistically significant (column 3). Security impacts are concentrated in VC military but
not political activity. The village is less likely to have an armed VC presence (column 4), and
VC initiated attacks on hamlets are lower (column 5). However, there is not a statistically
significant difference in the presence of the VC Infrastructure (column 6).
Columns 7 through 9 consider military administrative data. VC attacks on troops are
significantly lower on the USMC side. This could reflect lower VC presence but may also
result from the fact that search and destroy - pejoratively known as “dangling the bait” -
often found the amorphous Viet Cong by sending troops into areas where they would attack,
and then responded with overwhelming firepower. The impacts on friendly (U.S. and South
Vietnamese) and enemy troop deaths are negative but not statistically significant (columns
8 and 9). Appendix Figure A-48 shows RD figures for key outcomes. The x and y axes
plot latitude and longitude, whereas shading is used to denote the outcomes. Predicted
values are shown in the background and the raw data values are displayed using points in
the foreground. Discontinuities in outcomes at the corps boundary are clearly visible.
Columns 10 through 12 consider the administration, civic society, and economic posterior
probabilities, and do not find statistically significant impacts. We’ve also examined whether
bombing differs across the boundary. As expected given that security enters the algorithm
targeting air strikes, bombing was 11 percentage points lower on the USMC side of the
boundary, but the difference is not statistically significant (s.e. = .10).49 Nonetheless,
bombing could be a channel magnifying initial security differences. Effects are similar when
we limit the sample to 1969, before the security score was used to target bombing.50
It could be that spillovers from Corps I impact nearby Corps II hamlets, leading the
boundary region to be atypical. Table A-30 shows that results are broadly similar when
we compare only hamlets 10-25 km from the boundary, suggesting that areas very near the
boundary are not atypical.51
A potential interpretation of the results thus far is that while less aggression reduced vio-
lence, instead of winning hearts and minds it may have simply led the Vietnamese to perceive
non-communists as weak. Public opinion surveys, while potentially subject to experimenter
demand effects, can help shed light on whether hearts and minds were influenced. Table XI
49CAP targeted public goods also enter the security score algorithm, but are among the less influentialquestions and alone cannot explain much of the potential difference in air strikes.
50It is also possible that the USMC strategy could have reduced or magnified the impacts of bombing. Wedo not estimate the impacts of bombing separately for Corps I because the significantly smaller sample inthis region weakens the first stage, but the reduced form impacts are broadly similar for Corps I and II.
51As an additional check, we conduct the same randomization exercise as we did for bombing, where werandomly reassign distance to the threshold, and results are reported in Appendix Figures A-49 throughA-54 and Appendix Table A-32. The p-values computed using the randomization exercise provide a verysimilar picture to those computed using conventional clustered inference, suggesting that the results areunlikely to arise by chance.
34

examines attitudes towards Americans and the South Vietnamese government. Since there
are only 13 sampled hamlets within 25 km of the corps boundary, we use OLS to compare
places within 100 km.
Respondents in Corps I were 16 percentage points more likely to state that they liked
Americans and significantly less likely to respond that they hated Americans (columns 1 -
2).52 Moreover, respondents were 39 percentage points more likely to state that there was
no hostility towards the U.S. in their community, 11 percentage points more likely to state
that there is harmony between Americans and Vietnamese, and 38 percentage points more
likely to state that the American presence was beneficial (columns 3 - 5).
Citizens in Corps I were also more likely to respond that they were fully confident in
the effectiveness of the South Vietnamese government (column 6). They were more likely
to rate the South Vietnamese Army (ARVN) as effective (column 7), to rate the Popular
and Regional Forces (PF and RF) - regional security forces - as effective (columns 8 and 9),
and to rate the police as effective in countering the VC and maintaining order (columns 10
and 11). Finally, they also rated local officials as more effective in ensuring security (column
12).53 These results are consistent with the hypothesis that hearts and minds were won - or
lost less - relative to a more exclusive focus on overwhelming force.
5 Conclusion
Military interventions in weakly institutionalized societies were a central feature of the Cold
War and continue through the present. This study identifies the causal impacts of bombing
South Vietnamese population centers by exploiting discontinuities in an algorithm used to
target air strikes. Bombing increased Viet Cong military and political activity, weakened
local government administration, and lowered non-communist civic engagement. Consistent
with this, evidence suggests that the Army’s reliance on overwhelming firepower led to worse
outcomes than the USMC’s more hearts and minds oriented approach.
We do not have systematic data on the perspectives of those who bore the brunt of
overwhelming firepower, but qualitative evidence points to grievances and a widening of the
political legitimacy gap between the South Vietnamese government and Viet Cong as central
mechanisms. While we can only speculate about what would have happened in scenarios
off the equilibrium path, the empirical results and qualitative evidence push us towards
agreement with President John F. Kennedy’s 1954 assertion: “I am frankly of the belief
that no amount of American military assistance in Indochina can conquer an enemy which is
52The omitted category, and modal response, is “neither likes nor hates Americans.”53Table A-31 show that results are broadly similar when the sample is limited to hamlets further than 25
km from the boundary.
35

everywhere and at the same time nowhere...and which has the sympathy and covert support
of the people.”
Social scientists played an outsized role in convincing Kennedy’s successor - President
Lyndon Johnson - that the war could indeed be won through the deployment of America’s
arsenal. None were more influential than Johnson’s national security advisers: McGeorge
Bundy - a political scientist who in the 1950s had been the youngest dean in Harvard’s history
- and MIT economist Walt Rostow - who was termed “America’s Rasputin” for the influence
he held over Johnson. “Rostow was the prophet of American victory in the Vietnam War.
He felt that he intuitively understood the nature of communist insurgency - as the disease of
the ‘transition to capitalism’ - and was confident that he knew how to win the war” (Milne,
2008, p. 148). Rostow and Bundy used their models of universal economic development and
game theoretic conflict to make forceful arguments for what they believed ought to happen,
but gave little consideration to what might happen due to forces outside their models. They
had little appreciation for the role that anti-colonial sentiments and other factors central to
Vietnam’s history played in shaping citizens’ motivations.54
Bundy and Rostow contrast with another influential Vietnam War architect, Defense
Secretary Robert McNamara, who began his career as the youngest professor in Harvard
Business School history and has been described as the father of evidenced based policymak-
ing. McNamara initially advocated involvement in Vietnam but began encouraging Johnson
to craft an exit strategy as early as 1966, when unfavorable evidence started to mount. Mc-
Namara ultimately argued: “this [expletive] bombing campaign, it’s been worth nothing,
it’s done nothing, they’ve dropped more bombs than in all of Europe in all of World War II
and it hasn’t done a [expletive] thing” (Milne, 2008, p. 5). McNamara did not make these
critiques public, and within the administration he was marginalized for his lack of creative
ideas on how to win the war: “Robert McNamara was a brilliant manager of facts and data
but no innovator. He took his ideas from others, subjected them to a quantitative critique,
and if the numbers worked, his decisions were made” (Milne, 2008, p. 148). Social scientists
are not likely to soon regain the zenith of influence that they enjoyed in the 1960s - and
lost in no small part because of their role along with military leaders such as Westmore-
land in orchestrating America’s greatest military defeat. Yet the need for insightful policy
ideas, carefully informed by the motivations of those on the ground and worth little unless
subjected to rigorous empirical critique, remains imperative.
Harvard University and NBER; New York University
54Rostow, confident of the universality of the forces argued in his magnum opus Stages of EconomicGrowth, took little interest in the Vietnamese context. As his MIT colleague - East Asian specialist LucianPye - told his class in 1961 in reference to Rostow: “You know, you don’t quite sleep so well any more whenyou know some of the people going to Washington” (Milne, 2008, p. 72).
36

References
Acemoglu, Daron, Leopoldo Fergusson, James A. Robinson, Dario Romero, andJuan F. Vargas, “The Perils of High-Powered Incentives: Evidence from Colombia’sFalse Positives,” Working Paper 22617, National Bureau of Economic Research, 2016.
Amnesty International, “Syria: Russia’s Shameful Failure to Acknowl-edge Civilian Killings,” https://www.amnesty.org/en/latest/news/2015/12/
syria-russias-shameful-failure-to-acknowledge-civilian-killings/ 2015.
Apple, R.W., “Calley: The Real Guilt,” 1971.
Appy, Christian G., American Reckoning: The Vietnam War and Our National Identity,New York, NY: Penguin Publishing Group, 2015.
Beath, Andrew, Fotini Christia, and Ruben Enikolopov, “WinningHearts and Minds through Development: Evidence from a Field Experiment inAfghanistan,” Working Paper 2011-14, MIT, 2012. https://www.princeton.edu/ pc-global/conferences/methods/papers/beath.pdf.
Berman, Eli, Jacob N. Shapiro, and Joseph H. Felter, “Can Hearts and Minds BeBought? The Economics of Counterinsurgency in Iraq,” Journal of Political Economy,2011, 119 (4), 766–819.
Blattman, Christopher and Jeannie Annan, “Can Employment Reduce Lawlessnessand Rebellion? A Field Experiment With High-Risk Men in a Fragile State,” WorkingPaper 21289, National Bureau of Economic Research, 2015.
Calonico, Sebastian, Matias D Cattaneo, and Rocio Titiunik, “Robust Nonpara-metric Confidence Intervals for Regression-Discontinuity Designs,” Econometrica, 2014,82 (6), 2295–2326.
Condra, Luke, Joseph H. Felter, Radha K. Iyengar, and Jacob N. Shapiro, “TheEffect of Civilian Casualties in Afghanistan and Iraq,” Working Paper 16152, NationalBureau of Economic Research 2010.
Crost, Benjamin, Joseph Felter, and Patrick Johnston, “Aid Under Fire: Devel-opment Projects and Civil Conflict,” The American Economic Review, 2014, 104 (6),1833–1856.
Daddis, Gregory A, No Sure Victory: Measuring US Army Effectiveness and Progress inthe Vietnam War, Oxford University Press, 2011.
Davis, Peter, Hearts and Minds, BBS Productions/ Rainbow Pictures Corporation, 1974.
Dawson, David A., “The Impact of Project 100,000 on the Marine Corps,” Technical Re-port Occasional Paper Series, History and Museums Division, Headquarters, U.S. MarineCorps 1995.
Dell, Melissa, “Trafficking Networks and the Mexican Drug War,” The American EconomicReview, 2015, 105 (6), 1738–1779.
37

Denton, Frank, “Volunteers for the Viet Cong,” Technical Report, RAND 1968.
Donovan, David, Once a Warrior King: Memories of an Officer in Vietnam, McGraw-HillCompanies, 1985.
Dube, Oeindrila and Suresh Naidu, “Bases, Bullets and Ballots: the Effect of USMilitary Aid on Political Conflict in Colombia,” Journal of Politics, 2015, 77 (1), 249–267.
Elliott, David, The Vietnamese War: Revolution and Social Change in the Mekong Delta,1930-1975, Routledge, 2003.
Ewell, Lieutenant General Julian J and Ira Hunt, Sharpening The Combat Edge: TheUse Of Analysis To Reinforce Military Judgment, Pickle Partners Publishing, 1974.
Fulbright, William, “Congressional Record, Senate,” Technical Report 9 1965.
Gabriel, Richard and Paul Savage, Crisis in Command: Mismanagement in the Army,Macmillan, 1979.
Goldstein, Gordon M, Lessons in Disaster: McGeorge Bundy and the Path to War inVietnam, Macmillan, 2008.
Graham-Harrison, Emma, “Russian Airstrikes in Syria Killed 2,000 Civilians in SixMonths,” https://www.theguardian.com/world/2016/mar/15/russian-airstrikes-in-syria-killed-2000-civilians-in-six-months 2016.
Human Rights Watch, “Russia/Syria: Extensive Recent Use of Cluster Muni-tions,” https://www.hrw.org/news/2015/12/20/russia/syria-extensive-recent-use-cluster-munitions 2015.
Hunt, Michael H, A Vietnam War Reader: A Documentary History from American andVietnamese Perspectives, Univ of North Carolina Press, 2010.
Huntington, Samuel P, “The Bases of Accommodation,” Foreign Affairs, 1968, 46 (4),642–656.
Imbens, Guido and Karthik Kalyanaraman, “Optimal Bandwidth Choice for the Re-gression Discontinuity Estimator,” The Review of Economic Studies, 2011, pp. 933–959.
Kennedy, John F., “Speech Given on Indochina, Washington, DC,” Technical Report 41954.
Kinnard, Douglas, The War Managers, Da Capo, 1991.
Kocher, Matthew A., Thomas B. Pepinsky, and Stathis N. Kalyvas, “Aerial Bomb-ing and Counterinsurgency in the Vietnam War,” American Journal of Political Science,2011, 55 (2), 201–218.
Kodosky, Robert J., Psychological Operations American Style: The Joint United StatesPublic Affairs Office Reference, Information and Interdisciplinary Subjects Series, Lexing-ton Books, 2007.
38

Komer, Robert, “Impact of Insurgency on Pacification in South Vietnam,” TechnicalReport, RAND 1970.
Krepinevich, Andrew F, The Army and Vietnam, JHU Press, 1986.
Long, Austin, The Soul of Armies: Counterinsurgency Doctrine and Military Culture inthe US and UK, Cornell University Press, 2016.
Luca, M, “Reviews, Reputation, and Revenue: The Case of Yelp.com,” Working Paper12-016 2011.
Lyall, Jason, “Does Indiscriminate Violence Incite Insurgent Attacks? Evidence fromChechnya,” Journal of Conflict Resolution, 2009.
, Graeme Blair, and Kosuke Imai, “Explaining Support for Combatants DuringWartime: A Survey Experiment in Afghanistan,” American Political Science Review, 2013,107 (04), 679–705.
Miguel, Edward and Gerard Roland, “The Long-Run Impact of Bombing Vietnam,”Journal of Development Economics, 2011, 96 (1), 1 – 15.
Milne, David, America’s Rasputin: Walt Rostow and the Vietnam War, Macmillan, 2008.
Myerson, Roger B., “Rethinking the Fundamentals of State Building,” Working Paper2011.
Nguyen, Viet Thanh, The Sympathizer: A Novel, Grove/Atlantic, Inc., 2015.
Nunn, Nathan and Nancy Qian, “US Food Aid and Civil Conflict,” The AmericanEconomic Review, 2014, 104 (6), 1630–1666.
Obermeyer, Ziad, Christopher J.L. Murray, and Emmanuela Gakidou, “Fifty Yearsof Violent War Deaths from Vietnam to Bosnia: Analysis of Data from the World HealthSurvey Programme,” The BMJ, 2008, 336 (7659), 1482–1486.
Project CHECO, TACC Fragging Procedures, HQPACAF, 1969.
Prokosch, Eric, The Technology of Killing: A Military and Political History of Antiper-sonnel Weapons, Zed Books, 1995.
Reisman, Michael W. and Chris T. Antoniou, The Laws of War: A Comprehen-sive Collection of Primary Documents on International Laws Governing Armed Conflict,Vintage Books, 1994.
Scott, James C., Weapons of the Weak: Everyday Forms of Peasant Resistance, YaleUniversity Press, 1985.
, The Art of Not Being Governed: An Anarchist History of Upland Southeast Asia, YaleUniversity Press, 2009.
Sheehan, Neil, A Bright Shining Lie: John Paul Vann and America in Vietnam, Vintage,1988.
39

SIPRA, Anti-Personnel Weapons, Crane Russak & Company, Incorporated, 1978.
Smith-Spark, Laura, Jomana Karadsheh, and Euan McKirdy, “Ac-tivists: 3,800 Syrian Civilians Killed in a Year of Russian Airstrikes,”http://www.cnn.com/2016/09/30/middleeast/un-aleppo-condemnation/ 2016.
Tang, Truong Nhu and David Chanoff, A Vietcong Memoir: An Inside Account of theVietnam War and Its Aftermath, New York, NY: Vintage Books, 1985.
Thayer, Thomas C., A Systems Analysis View of the Vietnam War: 1965-1972. 12 Vol-umes, Defense Technical Information Center, 1975.
Tirman, John, The Deaths of Others: The Fate of Civilians in America’s Wars, OxfordUniversity Press, 2011.
Turse, Nick, Kill Anything that Moves: The Real American War in Vietnam, Macmillan,2013.
USMC, Marine Corps Manual 1940.
, “Operations Against Guerrilla Forces, FMFM-21,” 1962.
, “Civil Affairs in I Corps Republic of South Vietnam, April 1966 - April 1967,” 1970.
, Vietnam War: U.S. Marine Corps Official History Volumes, United States Marine Corps’History and Museums Division, 2009.
Walton, John M., “Summary of Investigation, Company A, 2nd Battalion, 60th Infantry,1st Infantry Division,” Technical Report 8 1970.
Wood, Elisabeth Jean, Insurgent Collective Action and Civil War in El Salvador, Cam-bridge University Press, 2003.
40

Table I: Balance Checks
t− 1 Full Pre-PeriodRD Coeff SE RD Coeff SE
(1) (2) (3) (4)
Bombing -0.001 (0.018) 0.020 (0.016)SecuritySecurity LCA -0.002 (0.015) 0.002 (0.015)Enemy Forces Present -0.017 (0.018) -0.008 (0.014)Village Guerrilla Squad 0.026 (0.021) 0.015 (0.019)VC Main Force Squad -0.019 (0.022) -0.021 (0.019)VC Base Nearby 0.022 (0.018) 0.012 (0.017)VC Attack 0.007 (0.015) 0.005 (0.012)Active VC Infrastructure -0.013 (0.018) -0.022 (0.017)% Households Participate VC -0.003 (0.005) -0.005 (0.006)VC Propaganda -0.019 (0.014) -0.018 (0.014)VC Taxation -0.024 (0.020) -0.019 (0.019)TroopsFriendly Forces Nearby -0.02 (0.024) -0.004 (0.019)US Operations 0.006 (0.005) 0.005 (0.003)US Initiated Attacks 0.007 (0.006) 0.009 (0.005)US Deaths 0.036 (0.060) 0.036 (0.094)SVN Deaths 0.326 (0.191) 0.141 (0.057)VC Deaths 2.000 (1.950) 0.320 (2.027)EconomicEconomic LCA -0.031 (0.016) -0.024 (0.016)Non-Rice Food Available -0.055 (0.019) -0.038 (0.019)Manufactures Available -0.036 (0.016) -0.018 (0.016)Surplus Goods Produced -0.023 (0.020) -0.011 (0.020)Fields Fallow Due to Insecurity 0.029 (0.019) 0.017 (0.019)HH With Motorized Vehicle -0.005 (0.005) -0.004 (0.006)HH Require Assistance to Subsist 0.003 (0.007) 0.007 (0.007)Hamlet Population Growth 0.003 (0.012) 0.006 (0.010)Urban -0.015 (0.012) -0.018 (0.012)GovernanceAdministration LCA 0.005 (0.008) 0.012 (0.009)Local Government Taxes -0.007 (0.021) 0.016 (0.021)Village Committee Filled -0.001 (0.020) 0.026 (0.019)Local Chief Visits Hamlet 0.01 (0.012) 0.012 (0.012)Education LCA 0.007 (0.015) 0.000 (0.015)Primary School Access 0.004 (0.012) 0.013 (0.012)Secondary School Access -0.005 (0.019) 0.004 (0.018)Health LCA 0.01 (0.015) 0.013 (0.015)Public Works Under Construction 0.005 (0.027) 0.040 (0.022)Civic SocietyCivic Society LCA 0.009 (0.018) 0.020 (0.018)HH Participation in Civic Orgs -0.008 (0.011) 0.006 (0.010)HH Participation in PSDF 0.005 (0.012) 0.002 (0.011)HH Participation in Econ Training -0.017 (0.009) 0.003 (0.007)HH Participation in Devo Projects -0.012 (0.013) -0.004 (0.010)Self Devo Projects Underway -0.021 (0.024) -0.030 (0.019)Youth Organization Exists 0.014 (0.022) 0.014 (0.021)Council Meets Regularly with Citizens -0.008 (0.023) -0.018 (0.023)
Notes: Columns (1) and (3) report the coefficients on below in RD regressions.Columns (2) and (4) report robust standard errors clustered by village.

Table II: First Stage
Dependent Variable is Share Months Bomb/Artillery:
t + 1 t t− 1 t + 1 Post Pre Post70-72 70-72 70-72 69 70-72 70-72 69(1) (2) (3) (4) (5) (6) (7)
Below 0.054 0.011 -0.001 -0.016 0.044 0.020 -0.002(0.014) (0.011) (0.018) (0.019) (0.013) (0.016) (0.017)
Obs 12,188 12,259 11,382 4,510 12,206 11,427 4,527Clusters 2261 2277 2196 1435 2265 2201 1439Mean 0.28 0.31 0.33 0.39 0.26 0.36 0.30
Notes: The dependent variable is the share of months that friendly air or ar-tillery fire struck in or near a populated area. Below is an indicator equal toone if the security score is below the threshold in quarter t. The regression alsoincludes a linear RD polynomial - estimated separately on either side of thethreshold for each discontinuity - as well as discontinuity fixed effects, quarter-year fixed effects, and controls for the characteristics that enter the period tsecurity score. Robust standard errors clustered by village are in parentheses.

Tab
leII
I:O
ther
Res
ourc
eA
lloca
tion
s
Dep
end
ent
vari
able
is:
Imm
edia
te(t
+1)
Fri
end
lyU
SU
SS
VN
SV
NN
aval
Reg
ion
alP
opu
lar
PS
DF
%H
HR
DC
ad
reF
orce
sO
ps
Att
acks
Op
sA
ttac
ks
Att
acks
For
ces
For
ces
Pre
sent
PS
DF
Pre
sent
(1)
(2)
(3)
(4)
(5)
(6)
(7)
(8)
(9)
(10)
(11)
Bel
ow0.
016
0.00
40.
005
-0.0
18-0
.014
-0.0
000.
026
0.01
20.0
13
0.0
04
0.0
12
(0.0
18)
(0.0
05)
(0.0
05)
(0.0
18)
(0.0
18)
(0.0
06)
(0.0
21)
(0.0
13)
(0.0
11)
(0.0
10)
(0.0
19)
Ob
s12
,188
12,1
8112
,181
12,1
8112
,181
11,5
3510
,432
10,4
3211,7
96
11,8
39
11,6
10
Clu
ster
s22
6122
6122
6122
6122
6122
2121
6221
622180
2196
2179
Mea
n0.
530.
020.
020.
020.
020.
010.
350.
100.8
60.4
60.5
3
Notes:
Below
isan
ind
icat
oreq
ual
toon
eif
the
scor
eis
bel
owth
eth
resh
old
inqu
arte
rt.
Th
ere
gre
ssio
nin
clu
des
ali
nea
rR
Dp
olyn
omia
l-
esti
mat
edse
par
atel
yon
eith
ersi
de
ofth
eth
resh
old
for
each
dis
conti
nu
ity
-as
wel
las
dis
conti
nu
ity
fixed
effec
ts,
qu
arte
r-yea
rfi
xed
effec
ts,
and
contr
ols
for
the
char
acte
rist
ics
that
ente
rth
ep
erio
dt
secu
rity
score
.R
ob
ust
stan
dard
erro
rscl
ust
ered
by
vil
lage
are
inp
aren
thes
es.

Tab
leIV
:Sec
uri
ty
Dep
end
ent
vari
able
is:
Sec
uri
tyA
rmed
Vil
gV
CV
CV
CR
egV
C%
HH
VC
VC
Pos
teri
orP
rob
VC
Gu
erM
ain
Bas
eA
ttac
kIn
fra
Part
Pro
pE
xto
rts
t+
1C
um
Pre
sent
Squ
adS
qu
adN
earb
yH
amle
tA
ctiv
ity
VC
Infr
Dri
veP
op
(1)
(2)
(3)
(4)
(5)
(6)
(7)
(8)
(9)
(10)
(11)
Bom
bin
g(t
+1)
-0.6
73(0
.246
)B
omb
ing
(Cu
m)
-0.6
420.
571
1.03
00.
640
1.13
90.
328
0.97
80.1
59
0.2
78
0.8
93
(0.2
46)
(0.2
22)
(0.4
35)
(0.3
87)
(0.4
29)
(0.1
83)
(0.3
84)
(0.0
95)
(0.1
79)
(0.4
17)
Ob
s12
,188
12,2
0612
,189
11,9
2311
,924
11,9
2512
,149
11,9
2111,9
14
12,1
39
11,9
04
Clu
ster
s22
6122
6522
6322
0422
0422
0522
6221
982200
2260
2195
Fst
at14
.43
12.1
211
.89
10.0
310
.18
10.0
411
.45
10.4
111.7
611.4
410.4
3M
ean
0.65
0.68
0.19
0.38
0.39
0.22
0.16
0.25
0.0
30.0
90.2
7
Notes:
Bombing
mea
sure
sth
esh
are
ofm
onth
sth
atfr
ien
dly
air
orar
till
ery
fire
was
dir
ecte
din
or
nea
ra
pop
ula
ted
are
a.
Bom
b-
ing
isin
stru
men
ted
by
wh
eth
erth
eh
amle
tw
asb
elow
the
secu
rity
scor
eth
resh
old
.T
he
regr
essi
on
als
oin
clu
des
ali
nea
rR
Dp
olyn
omia
l-
esti
mat
edse
par
atel
yon
eith
ersi
de
ofth
eth
resh
old
for
each
dis
conti
nu
ity
-as
wel
las
dis
conti
nu
ity
fixed
effec
ts,
qu
arte
r-ye
arfi
xed
effec
ts,
and
contr
ols
for
the
char
acte
rist
ics
that
ente
rth
ese
curi
tysc
ore.
Rob
ust
stan
dard
erro
rscl
ust
ered
by
vil
lage
are
inp
aren
thes
es.

Tab
leV
:A
rmed
For
ces
Adm
inis
trat
ive
Dat
a
Dep
end
ent
vari
able
is:
Imm
edia
teC
um
ula
tive
Fri
end
lyU
SU
SU
SS
VN
VC
Fri
end
lyU
SU
SU
SS
VN
VC
For
ces
Op
sA
ttac
ks
Tro
opD
eath
sF
orce
sO
ps
Att
ack
sT
roop
Dea
ths
(1)
(2)
(3)
(4)
(5)
(6)
(7)
(8)
(9)
(10)
(11)
(12)
Bom
bin
g(t
+1)
0.29
40.
068
0.08
8-0
.204
-1.2
63-4
.742
(0.3
26)
(0.0
94)
(0.0
96)
(0.8
06)
(2.9
76)
(18.
764)
Bom
bin
g(C
um
)0.
635
0.11
00.1
13
-0.0
48
24.5
47
171.5
69
(0.3
12)
(0.0
63)
(0.0
63)
(0.2
09)
(12.8
63)
(78.8
79)
Ob
s12
,188
12,1
8112
,181
12,1
8112
,181
12,1
8112
,206
12,1
9912,1
99
12,1
99
12,1
99
12,1
99
Clu
ster
s22
6122
6122
6122
6122
6122
6122
6522
652265
2265
2265
2265
Fst
at14
.43
14.4
714
.47
14.4
714
.47
14.4
712
.12
12.0
512.0
512.0
512.0
512.0
5M
ean
0.52
0.02
0.02
0.14
1.84
4.80
0.43
0.01
0.0
20.0
62.4
18.7
4
Notes:
Bombing
mea
sure
sth
esh
are
ofm
onth
sth
atfr
ien
dly
air
orar
till
ery
fire
was
dir
ecte
din
orn
ear
ap
op
ula
ted
are
a.
Bom
bin
gis
in-
stru
men
ted
by
wh
eth
erth
eh
amle
tw
asb
elow
the
secu
rity
scor
eth
resh
old
.T
he
regr
essi
onal
soin
clu
des
ali
nea
rR
Dp
oly
nom
ial
-es
tim
ate
dse
par
atel
yon
eith
ersi
de
ofth
eth
resh
old
for
each
dis
conti
nu
ity
-as
wel
las
dis
conti
nu
ity
fixed
effec
ts,
qu
art
er-y
ear
fixed
effec
ts,
an
dco
ntr
ols
for
the
char
acte
rist
ics
that
ente
rth
ese
curi
tysc
ore.
Rob
ust
stan
dar
der
rors
clu
ster
edby
vil
lage
are
inp
are
nth
eses
.

Tab
leV
I:E
conom
icO
utc
omes
Dep
enden
tva
riab
leis
:E
conom
icN
on-R
ice
Man
uf.
Surp
lus
No
Far
m%
HH
%H
HH
amP
oste
rior
Pro
bF
ood
Goods
Goods
Sec
uri
tyO
wn
Req
uir
eP
opt
+1
Cum
Ava
ilA
vail
Pro
dB
adV
ehic
Ass
ist
Gro
wth
(1)
(2)
(3)
(4)
(5)
(6)
(7)
(8)
(9)
Bom
bin
g(t
+1)
0.02
9(0
.148
)B
ombin
g(C
um
)-0
.452
-0.3
36-0
.839
-0.7
750.
636
-0.3
020.
074
-0.0
63(0
.287
)(0
.379
)(0
.460
)(0
.487
)(0
.418
)(0
.154
)(0
.158
)(0
.212
)O
bs
12,1
8812
,206
11,8
8211
,882
11,8
9410
,976
11,9
3511
,848
11,9
66C
lust
ers
2261
2265
2187
2187
2190
2072
2204
2197
2209
Fst
at14
.43
12.1
29.
669.
669.
9010
.18
11.8
411
.74
10.3
8M
ean
0.67
0.68
0.71
0.61
0.43
0.28
0.26
0.07
-0.0
2
Note
s:B
ombi
ng
mea
sure
sth
esh
are
ofm
onth
sth
atfr
iendly
air
orar
tiller
yfire
was
dir
ecte
din
ornea
ra
pop
ula
ted
area
.B
ombin
gis
inst
rum
ente
dby
whet
her
the
ham
let
was
bel
owth
ese
curi
tysc
ore
thre
shol
d.
The
regr
essi
onal
soin
cludes
alinea
rR
Dp
olynom
ial
-es
tim
ated
separ
atel
yon
eith
ersi
de
ofth
eth
resh
old
for
each
dis
conti
nuit
y-
asw
ell
asdis
conti
nuit
yfixed
effec
ts,
quar
ter-
year
fixed
effec
ts,
and
contr
ols
for
the
char
acte
r-is
tics
that
ente
rth
ese
curi
tysc
ore.
Rob
ust
stan
dar
der
rors
clust
ered
by
villa
gear
ein
par
enth
eses
.

Tab
leV
II:
Gov
ernan
ce
Dep
enden
tva
riab
leis
:A
dm
inis
trat
ion
Vilg
Vilg
Chie
fE
duca
tion
Pri
mar
ySec
Hea
lth
Pub
Pos
teri
orP
rob
Com
mG
ovV
isit
sP
oste
rior
Pro
bSch
ool
Sch
ool
Pos
teri
orP
rob
Wor
ks
t+
1C
um
Fille
dT
axes
Ham
let
t+
1C
um
Acc
ess
Acc
ess
t+
1C
um
Con
s.(1
)(2
)(3
)(4
)(5
)(6
)(7
)(8
)(9
)(1
0)(1
1)(1
2)B
ombin
g(t
+1)
-0.0
91-0
.090
0.27
7(0
.110
)(0
.183
)(0
.175
)B
ombin
g(C
um
)-0
.305
-0.7
98-0
.944
-0.5
60-0
.447
-0.6
23-0
.752
0.41
7-0
.523
(0.1
44)
(0.3
80)
(0.4
43)
(0.2
41)
(0.2
83)
(0.3
07)
(0.4
55)
(0.2
86)
(0.4
92)
Obs
12,1
8812
,206
11,8
1511
,878
11,9
2812
,188
12,2
0611
,928
11,9
0612
,188
12,2
0611
,904
Clu
ster
s22
6122
6521
8821
8922
0222
6122
6522
0421
9222
6122
6521
91F
stat
14.4
312
.12
10.3
310
.62
11.4
414
.43
12.1
211
.61
9.76
14.4
312
.12
10.3
4M
ean
0.97
0.96
0.84
0.70
0.93
0.59
0.66
0.88
0.37
0.72
0.76
0.51
Note
s:B
ombi
ng
mea
sure
sth
esh
are
ofm
onth
sth
atfr
iendly
air
orar
tiller
yfire
was
dir
ecte
din
ornea
ra
pop
ula
ted
area
.B
ombin
gis
inst
rum
ente
dby
whet
her
the
ham
let
was
bel
owth
ese
curi
tysc
ore
thre
shol
d.
The
regr
essi
onal
soin
cludes
alinea
rR
Dp
olynom
ial
-es
tim
ated
separ
atel
yon
eith
ersi
de
ofth
eth
resh
old
for
each
dis
conti
nuit
y-
asw
ell
asdis
conti
nuit
yfixed
effec
ts,
quar
ter-
year
fixed
ef-
fect
s,an
dco
ntr
ols
for
the
char
acte
rist
ics
that
ente
rth
ese
curi
tysc
ore.
Rob
ust
stan
dar
der
rors
clust
ered
by
villa
gear
ein
par
enth
eses
.

Tab
leV
III:
Non
-Insu
rgen
tC
ivic
Soci
ety
Dep
enden
tva
riab
leis
:C
ivic
Soci
ety
%H
Hw
ith
aM
emb
erA
ctiv
ein
Sel
fD
evY
outh
Cou
nci
lP
oste
rior
Pro
b.
Civ
icP
SD
FE
con
Dev
Pro
jO
rgM
eets
t+
1C
um
Org
Unit
sT
rain
Pro
jU
nder
way
Exis
tsR
egula
rly
(1)
(2)
(3)
(4)
(5)
(6)
(7)
(8)
(9)
Bom
bin
g(t
+1)
-0.3
31(0
.186
)B
ombin
g(C
um
)-0
.523
-0.5
04-0
.260
-0.2
25-0
.563
-0.4
710.
166
-0.1
28(0
.248
)(0
.266
)(0
.238
)(0
.230
)(0
.357
)(0
.245
)(0
.359
)(0
.421
)O
bs
12,1
8812
,206
11,9
2711
,914
11,9
6711
,298
11,8
6311
,855
11,7
61C
lust
ers
2261
2265
2202
2201
2209
2168
2186
2189
2143
Fst
at14
.43
12.1
211
.28
11.6
110
.35
8.53
11.0
311
.25
11.1
6M
ean
0.61
0.69
0.29
0.52
0.20
0.37
0.89
0.76
0.58
Note
s:B
ombi
ng
mea
sure
sth
esh
are
ofm
onth
sth
atfr
iendly
air
orar
tiller
yfire
was
dir
ecte
din
ornea
ra
pop
ula
ted
area
.B
ombin
gis
inst
rum
ente
dby
whet
her
the
ham
let
was
bel
owth
ese
curi
tysc
ore
thre
shol
d.
The
regr
essi
onal
soin
cludes
alinea
rR
Dp
olynom
ial
-es
tim
ated
separ
atel
yon
eith
ersi
de
ofth
eth
resh
old
for
each
dis
conti
nuit
y-
asw
ell
asdis
conti
nuit
yfixed
effec
ts,
quar
ter-
year
fixed
effec
ts,
and
contr
ols
for
the
char
acte
rist
ics
that
ente
rth
ese
curi
tysc
ore.
Rob
ust
stan
dar
der
rors
clust
ered
by
villa
gear
ein
par
enth
eses
.

Tab
leIX
:A
rmy
and
Mar
ines
:B
alan
ceC
hec
ks
Dep
enden
tva
riab
leis
:V
CM
ilit
ary
Tra
mor
Tot
alC
olon
ial
Att
ack
Urb
anE
lev.
Slo
pe
Fac
tory
Mar
ket
Pos
tT
eleg
raph
Tra
inR
oad
(Km
)(1
)(2
)(3
)(4
)(5
)(6
)(7
)(8
)(9
)(1
0)(1
1)M
arin
es0.
020
0.03
1-7
8.04
2-1
.552
0.00
3-0
.032
0.30
0-0
.017
0.03
82.
253
-0.1
09(0
.047
)(0
.037
)(1
07.5
61)
(1.4
97)
(0.0
10)
(0.0
40)
(0.1
60)
(0.0
37)
(0.0
47)
(0.8
16)
(0.7
10)
Obs
302
289
302
302
302
302
302
302
302
302
302
Clu
ster
s64
6364
6464
6464
6464
6464
Mea
n0.
350.
0430
2.24
3.32
0.01
0.03
0.05
0.02
0.05
1.63
0.64
Note
s:M
arin
esis
anin
dic
ator
equal
toon
eif
the
obse
rvat
ion
isin
Cor
ps
Reg
ion
I.R
egre
ssio
ns
also
incl
ude
alinea
rR
Dp
olynom
ial
inla
titu
de
and
longi
tude
and
ab
oundar
yse
gmen
tfixed
effec
t.R
obust
stan
dar
der
rors
clust
ered
by
villa
gear
ein
par
enth
eses
.

Tab
leX
:A
rmy
and
Mar
ines
:P
ublic
Goods
and
Sec
uri
ty
Dep
enden
tva
riab
leis
:E
duc
Hea
lth
Sec
ur
Arm
edV
CA
ctiv
eV
CF
rien
dly
VC
Adm
inC
ivic
Soc
Eco
nP
oste
rior
VC
Init
VC
Att
acks
Tro
opP
oste
rior
Pro
bab
ilit
yP
rese
nt
Att
ack
Infr
.T
roop
sD
eath
sP
robab
ilit
y(1
)(2
)(3
)(4
)(5
)(6
)(7
)(8
)(9
)(1
0)(1
1)(1
2)M
arin
es0.
243
0.56
20.
095
-0.5
60-0
.482
-0.0
18-0
.191
-0.6
28-1
.935
0.14
70.
130
-0.2
42(0
.096
)(0
.198
)(0
.110
)(0
.075
)(0
.061
)(0
.036
)(0
.071
)(0
.405
)(2
.807
)(0
.138
)(0
.153
)(0
.270
)O
bs
302
302
302
300
300
286
302
302
302
302
302
302
Clu
ster
s64
6464
6364
6364
6464
6464
64M
ean
0.25
0.36
0.35
0.32
0.33
0.87
0.18
0.68
4.06
0.87
0.35
0.39
Note
s:M
arin
esis
anin
dic
ator
equal
toon
eif
the
obse
rvat
ion
isin
Cor
ps
Reg
ion
I.R
egre
ssio
ns
also
incl
ude
alinea
rR
Dp
oly-
nom
ial
inla
titu
de
and
longi
tude,
asw
ell
asge
ogra
phic
contr
ols
and
ab
oundar
yse
gmen
tfixed
effec
t.R
obust
stan
dar
der
rors
clust
ered
by
villa
gear
ein
par
enth
eses
.

Tab
leX
I:A
rmy
and
Mar
ines
:A
ttit
udes
Tow
ards
Am
eric
ans
and
Sou
thV
ietn
am
Dep
end
ent
vari
able
is:
Res
pon
den
tN
oA
mer
ican
Fu
lly
Poli
ceL
oca
lL
ikes
Hat
esH
osti
lity
Vie
tnam
Pre
sen
ceC
onf
AR
VN
PF
RF
Eff
ecti
veO
ffici
als
Am
eric
ans
Am
.H
arm
ony
Ben
efici
alin
GV
NE
ffec
tive
VC
Ord
erE
ffec
tive
(1)
(2)
(3)
(4)
(5)
(6)
(7)
(8)
(9)
(10)
(11)
(12)
Mar
ines
0.15
8-0
.086
0.39
20.
111
0.38
30.
139
0.11
00.
288
0.287
0.1
79
0.1
75
0.1
90
(0.0
82)
(0.0
23)
(0.1
10)
(0.0
58)
(0.0
79)
(0.0
41)
(0.0
60)
(0.0
66)
(0.1
58)
(0.0
51)
(0.0
39)
(0.0
55)
Ob
s11
711
711
511
611
725
018
117
985
408
344
288
Clu
ster
s66
6665
6666
112
102
109
54
178
156
145
Mea
n0.
240.
040.
480.
180.
510.
430.
790.
350.
55
0.7
70.2
80.5
6
Notes:
Mar
ines
isan
ind
icat
oreq
ual
toon
eif
the
obse
rvat
ion
isin
Cor
ps
Reg
ion
I.R
egre
ssio
ns
als
oin
clu
de
geo
gra
ph
icco
ntr
ols
.R
obu
stst
and
ard
erro
rscl
ust
ered
by
vil
lage
are
inp
aren
thes
es.

Figure I: Decision Logic (2-Way)
A B C D E
A
B
C
D
E
4.5
0
3.5
2.5
1.5
2.5 3.5 4.5 1.5
E
E
D
D
C
E
D
D
C
C
D
D
C
C
B
D
C
C
B
B
C
C
B
B
A
Notes: This figure shows the aggregation logic for combining 2 submodel scores at a time.
52

Figure II: Model Aggregation
HES Rating
Military
Comm-Dev
Enemy Military
Friendly Military
Social Programs
Enemy Military Presence Enemy Military Activity
Impact of Military Activity
Political
Friendly Military Activity Friendly Military Presence PSDF Activity
Enemy Political
Friendly Political
Enemy Political Presence Enemy Political Activity
Local Administration Law Enforcement Political Mobilization
Development Assistance Land Tenure (1)
PSDF Activity Information/PSYOFS Rural Development Cadre (2)
Political Programs
Education Public Health Social Welfare
Economic Activity
Security
*
2
3
2
2
2
2
3
2
2
2
2
3
3
2
2
The HES rating will equal security unless: 1. HMBO1 = 1 or 2 when the HES Rating will be set to ‘V’ 2. Community Development (Comm-Dev) is three letter grades higher or lower than security whereupon it will
be raised or lowered by one letter grade as applicable. If security is Not-evaluated (N) , the HES Rating will = ‘N’ (1) If Land Tenure = ‘N’, use Development Assistance only. (2) If RD Cadre = ‘N’, use a two way decision table rather than the three way table.
Notes: This figure illustrates how the nineteen submodel scores are combined two or three at a time tocreate a single hamlet security score. “N” indicates a missing value and “V” indicates Viet Cong controlled.

Figure III: First Stage
(a) Immediate First Stage
-.1-.0
50
.05
.1bo
mbi
ng in
per
iod
t+1
-.2 -.16 -.12 -.08 -.04 0 .04 .08 .12 .16 .2distance to threshold in period t
(b) Cumulative First Stage
-.05
0.0
5.1
bom
bing
unt
il U
.S. w
ithdr
awal
-.2 -.16 -.12 -.08 -.04 0 .04 .08 .12 .16 .2distance to threshold in period t
(c) Impacts by Quarter
●
● ●
●
● ●
●
●
●
●●
−0.05
0.00
0.05
0.10
0.15
−2 −1 0 1 2 3 4 5 6 7 8Quarter
Period
●
●
Pre−period
Post−period
(d) McCrary Test
010
020
030
040
0O
bser
vatio
ns
-1 -.9 -.8 -.7 -.6 -.5 -.4 -.3 -.2 -.1 0 .1 .2 .3 .4 .5 .6 .7 .8 .9 1distance to threshold in period t
(e) 1969 (t + 1)
-.1-.0
50
.05
.1.1
5bo
mbi
ng in
per
iod
t-1
-.2 -.16 -.12 -.08 -.04 0 .04 .08 .12 .16 .2distance to threshold in period t
(f) 1969 (Cum)
-.05
0.0
5.1
pre-
pero
id b
ombi
ng
-.2 -.16 -.12 -.08 -.04 0 .04 .08 .12 .16 .2distance to threshold in period t
Notes: In panels (a), (b), (d), (e), and (f), each point plots an average value within a bin. Discontinuityfixed effects have been partialled out. The solid line plots a local linear regression and dashed lines show95% confidence intervals. In panel (c), each point plots a coefficient from a separate regression and linesshow 95% confidence intervals.
54

Figure IV: Placebos
(a) Contemporaneous Bombing-.1
-.05
0.0
5.1
.15
bom
bing
in p
erio
d t
-.2 -.16 -.12 -.08 -.04 0 .04 .08 .12 .16 .2distance to threshold in period t
(b) t− 1 Bombing
-.1-.0
50
.05
.1bo
mbi
ng in
per
iod
t-1
-.2 -.16 -.12 -.08 -.04 0 .04 .08 .12 .16 .2distance to threshold in period t
(c) All Prior Quarters Bombing
-.1-.0
50
.05
.1pr
e-pe
riod
bom
bing
-.2 -.16 -.12 -.08 -.04 0 .04 .08 .12 .16 .2distance to threshold in period t
(d) Predicted Bombing (t + 1)
-.1-.0
50
.05
.1pr
edic
ted
bom
bing
-.2 -.16 -.12 -.08 -.04 0 .04 .08 .12 .16 .2distance to threshold in period t
(e) Predicted Bombing (Cum)
-.06
-.04
-.02
0.0
2.0
4pr
edic
ted
bom
bing
-.2 -.16 -.12 -.08 -.04 0 .04 .08 .12 .16 .2distance to threshold in period t
(f) 1964-1969 VC-Initiated Attacks
●
●
●
●●
●●
●
●
●
●
●
●
●●
●●
●
●
●
●●
●
−0.075
−0.050
−0.025
0.000
0.025
0.050
1964 1965 1966 1967 1968 1969Quarter
VC
Initi
ated
Atta
cks
Notes: In panels (a) through (e), each point plots an average value within a bin. Discontinuity fixedeffects have been partialled out. The solid line plots a local linear regression and dashed lines show 95%confidence intervals. In panel (f), each point plots a coefficient from a separate regression and lines show95% confidence intervals.
55

Figure V: Reduced Forms
(a) VC Presence (Cumulative)
-.05
0.0
5
-.2 -.16 -.12 -.08 -.04 0 .04 .08 .12 .16 .2distance to threshold in period t
(b) Active VC Infrastructure (Cumulative)
-.1-.0
50
.05
-.2 -.16 -.12 -.08 -.04 0 .04 .08 .12 .16 .2distance to threshold in period t
(c) U.S. Initiated Attacks (Cumulative)
-.01
-.005
0.0
05.0
1
-.2 -.16 -.12 -.08 -.04 0 .04 .08 .12 .16 .2distance to threshold in period t
(d) Village Committee Filled (Cumulative)
-.1-.0
50
.05
-.2 -.16 -.12 -.08 -.04 0 .04 .08 .12 .16 .2distance to threshold in period t
(e) Access to a Primary School (Cumulative)
-.04
-.02
0.0
2.0
4.0
6
-.2 -.16 -.12 -.08 -.04 0 .04 .08 .12 .16 .2distance to threshold in period t
(f) Participation in Civic Orgs (Cumulative)
-.06
-.04
-.02
0.0
2.0
4
-.2 -.16 -.12 -.08 -.04 0 .04 .08 .12 .16 .2distance to threshold in period t
Notes: Each point plots an average value within a bin. Discontinuity fixed effects have been partialledout. The solid line plots a local linear regression and dashed lines show 95% confidence intervals.
56

Fig
ure
VI:
Cor
ps
Reg
ion
Bou
ndar
y
!!
!!
!!
!!
! !!!!
!!
!
! !!! !!!
!
!!! !!! !! !! !!!! !!!
!! ! !!!
!!
! ! !!!
!! ! !! !!
!!!
!
!
!!
!!
!!!
!!! !
!!
!!
!!!! !! ! !!!!!
! !!!!
!
!!
!
!
! !!
!!! ! ! !
!! !!
! !!
!!! !
!!!!!!
!!!!
!!! ! !
!!
!!!
!
!!!! !!
!!!!!! !
!!!!! !!
!!!!!!!
!! ! !!!
!!!!!!!!
!! !!!!!!!! !! ! !!
!!! !!!
!!!
!!!! !!
!!!!
!!!
!
!! !!! !
!!!
!
!!
!!!!
!!
!!
!
!!!! !!
!!!!!
!!!!!!!!!!!
!!!
!
!
!
!!!
!!
!!
!!!
!!!
!!
!
!
!!
!
!!!!!
!
!! !!
! ! !!!
!!
!!
!
!!
! ! !
!!
!! !!!
!! !
!
!!!
!!
!!!!
!
!
!
!!
!!!
!
! !! !!
! !! !
!
! !!
!!!
!!!
Eleva
tion
High
: 310
6
Low
: -129
Haml
ets!
0-25 k
m
Notes:
Th
ism
app
lots
ham
lets
nea
rth
eC
orp
sI-
IIb
ou
nd
ary
.S
eeth
ele
gen
dfo
rm
ore
det
ail
s.