national advisory committee for … acr no. l5g31 the terminal velocity is alao important because it...
TRANSCRIPT

BBS»
fU :" '-'•' • ';- '.;- ACE No. L5G31
NATIONAL ADVISORY COMMITTEE FOR AERONAUTICS
WARTIME REPORT ORIGINALLY ISSUED
August 19^5 as Advance Confidential Report L5G31
A SIMPIiE METHOD FOE ESTIMATING TERMEHAL TELOCITY
IUCEÜDIKG EFFECT OF COMPRESSIBILITY ON ERAG
By Ealph. P. Bielat
Langley MemorieQ. Aeronautical Laboratory Langley Field, Ya.
NACA tf
\
WASHINGTON L^Q^^mop}^ARY
'•'••«O/JATORy NACA WARTIME REPORTS are reprints of papers originally issued to pro^dV^pMF^s£r^ution of advance research results to'an authorized group requiring them for the war effort. They were pre- viously held under a security status but are now unclassified. Some of these reports were not tech- nically edited. All have been reproduced without change in order to expedite general distribution.
L - 78

3 1176 01354 2007 3- -. r
NACA ACR No. L^GJl
NATIONAL ADVf^R^SOMM^TjEE FOR AERONAUTICS
ADVANCE CONFIDENTIAL REPORT
A SIMPLE METHOD FOR ESTIMATING TERMINAL VELOCITY
INCLUDING EFFECT OF COMPRESSIBILITY ON DRAG
By Ralph P. Bielat
SUMMARY
A generalized, drag curve that provides an estimate for the drag rise due to compressibility has been obtained from an analysis of wind-tunnel data of several airfoils, fuselages, nacelles, and windshields at speeds up to and above the wing critical speed. The airfoils analyzed had little or no sweepback and effective aspect ratios above 6.5« A chart based on the generalized drag curve is presented, from -which the terminal velocity of a conventional airplane that employs a wing of moderate aspect ratio and very little sweepback in a vertical dive may be rapidly esti- mated. In order to use the chart, the only data that need be known about the airplane are a low-speed drag coefficient, the wing critical speed, and the wing loading. The terminal velocities for three airplanes were computed in order to illustrate the use of the method and chart. Good agreement bet-ween the estimated terminal velocity and the measured flight terminal velocity was indicated for all three airolanes.
INTRODUCTION
Several high-speed military airplanes in dives have encountered difficulties that could not be easily con- trolled by normal means. These difficulties, which may consist of diving moments, large changes in trim, large stick forces, tail buffeting, and the like, occur in high- speed dives when the speed of the airplane exceeds the critical speed by a large amount. For those airplanes for which maximum diving speeds are at or near the critical speed, little or no-trouble occurs. The more recent fighter airplanes, however, have terminal Mach numbers well in excess of the critical Mach number and, as a result, often encounter difficulties in dives. Determi- nation of the terminal velocity of the airplane is there- fore important' in order that the probabi11 ty of encoun- tering trouble in dive'swm*a^*13© estimated..

NACA ACR No. L5G31
The terminal velocity is alao important because it forms the outer limits of the V-G diagram. Usually the outer limit of the V-G- diagram is established by multi- plying the maximum level-flight speed of an airplane by an arbitrary factor somewhat greater than 1.0. ri'he termi- nal velocity of most recent airplanes, however,- generally falls much below this arbitrary maximum speed, and these airplanes are therefore unnecessarily penalised by extra weight because they are designed for conditions that are not reached in actual flight.
The present report outlines a simple method for obtaining the terminal velocity of an airplane in a verti- cal dive and includes an estimate for ühe drag increase due to compressibility effects. The wind-tunnel test data were obtained from model tests conducted in the Langley 2k~Inch and 8-foot high-speed tunnels. Ail the data presented herein v;ere obtained for zero lift.
The problem of determining the terminal velocity for airplanes for which the terminal velocity is near the critical speed is comparatively simple inasmuch as a constant value of drag coefficient can be assumed. The diving speeds of most present-day airplanes, however, occur beyond the critical speed and the problem is not so simple. The following two factors are involved« (1) the determination of the critical speed and (2) the rate-of " drag increase at speeds above the critical speed.
The critical speed used herein was arbitrarily'taken as the critical speed of the wing-root section. Pressure- distribution data obtained from wind-tunnel tests--«ere used to determine the critical speed, which is defined, as the flight speed at which sonic velocity is reached locally. If experimental data are not available,., ho-vrever,- the methods outlined in references 1 and 2 can be used for the determination of the critical speed. Selection,. of the critical speed at the wing-root section for use in- terminal-velocity estimation is justified on the. grounds, that the root section usually has a lower critical speed than any other component part of the airplane. "The i*ing root has the lowest, critical speed because of ..its „high thickness ratio and' contributes a large part of the total airplane drag because of the large fraction of the '.ring, area concentrated at the inboard sections of tapered.wings.
The rate of drag increase at speeds above the., criti- cal speed is more difficult to determine in the calculation
NACA ACR No. L5G51
of the terminal velocity than the critical speed. A study of the drag of airfoils, fuselages, nacelles, and windshields ha3 been made from wind-tunnel test data in order to determine the effects of compressibility on the drag. Eecause the rate of drag increase at speeds above the critical speed is so great, it was found that, within the accuracy required for terminal-velocity calculations, an average rate of drag increase may be used. A curve indicating the average rate of drag increase is presented herein. This curve was derived from an analysis of wind- tunnel data.
The method described herein for obtaining the termi- nal velocity of an airplane in a vertical dive has been in use at the MCA since I9I4-I. Publication of the method, however, had been delayed pending the investigation of constriction corrections to be applied to Lhe wind-tunnel data and the completion of high-speed dive, tests made with several airplanes in order to compare terminal velocities obtained in flight with terminal velocities estimated by the simple method described herein. This method is not applicable to airplanes that utilize wing shapes of low aspect ratio and "large sweepback but should be applied only to airplanes of conventional design that employ wing shapes of moderate aspect ratio and small amounts of sweepback due to wing taper ratio.
SYMBOLS
V velocity
a speed of sound in air
M Mach number (V/a)
Op drag coefficient
CL lift coefficient
p mass density of air
S wing area
W weight of airplane
p atmospheric pressure at any altitude

Y ratio of specific heats (I.I4.O for air)
t/c ratio of thickness to chord of wing
Subscripts:
cr critical (when local sonic velocity has been reached on some point of body)
min minimum
T terminal
DESCRIPTION OP F0D.3LS
Airfoil models.- The airfoil models used herein represent two classes of airfoils - namely, the conven- tional NACA sections and the more recent low-drag high- critical-speed NAGA sections. The conventional NACA air- foil sections are characterized by pressure distributions that have high peak pressures occurring near the leading edge. The low-drag NACA airfoil'sections have compara- tively flat pressure distributions with the peak pressures occurring at approximately 60 percent of the chord behind the leading edge.
Airfoils typical of the conventional airfoils are the NACA OOO9-63, 0012-63, 23012, and 23OIL..7 sections; a current transport-model airfoil that has an NACA 2215 section at the root and tapers to an NACA 2212 section at the tip; and the Davis airfoil with a thickness ratio of 20.15 percent. The low-drag airfoils include the following NACA airfoil sections«
lc-215 65-type modified, -=0.196
^i?i 66,1-115 fe;g5 67-11^.5 4( c-J-2 67 0-P1E 65(2lS)-220 Of^-dLj
The effective aspect ratio of the airfoil models tested varied from 6.5 to infinity.
Fuselage models.- The fuselage models are typical of fuselage snapes in use on current airplanes. The various fuselages represent bomber, fighter, and transport air- planes. Figure I shows the side-view drawing and the fineness ratio in side elevation of the different fuselage shapes. These fuselage models were tested in conjunction with wings (shown as dashed 1ines in fig. 1) and represent a wide variation in w^h^r^flfefft^f interference.

NACA ACR Wo. L5G31
Nacelle and windshield modela.- The data for the various nacelles and windshields were obtained from refer- ences 3 and I}., respectively. The nacelle and windshield designations used herein correspond to the designations used in references 3 and i}.. All the nacelle models were tested with the same wing model, which consisted of the outboard panel of a wing section designed for use on a bomber airplane. The wing was a thick .low-drag airfoil that had an NACA 65(2l8)-221 section at the root and tapered to an NACA b6(2xl5)-li.l6 section at the tip. The windshields were tested with a wing-fuselage combination. Drawings of the nacelle and windshield models are shown in figures 2 and 3 J> respectively.
RESULTS AND DISCUSSION
Drag Characteristics
Drag analysis.- In order to obtain a correlation of the rate of drag increase at speeds above the critical speed, the drag results for the various component parts of the airplane have been reduced to nondimensional param- eters; that is, CD/CJ)-. is plotted against M/Mcr
for each part tested. The use of these parameters represents a convenient method of making the data non- dimensional in such a manner that the unknown quantities are expressed in terms of the known quantities.
The drag results at speeds up to and above the criti- cal speed for the conventional ITACA airfoils are presented in figures l\. and 5« Figures 6 to 9 show the variation of G-QICJX . with M/Mor for the low-drag high-critical-
speed airfoils. It will be noted that all the airfoils presented in figures I4., 6, 7> an<3 8 exhibited approxi- mately the same rate of drag increase at speeds above the critical speed; for this reason a curve of the average rate of drag increase at speeds above the critical speed maybe used. An average increase in drag of approximately 30 per-
cent above the minimum drag was indicated at —-— =• 1.0; Mcv -
at speeds of only 10 to 15 percent above the critical speed, however, the drag increased.-approximately 90 to 200 percent. This rapid Increase in drag at speeds above the critical sr>eed is associated with the formation

KACA ACR NO. L5GJ1
of compression shock waves and their effect on the boundary layer over the surface of the airfoils. The family of airfoils used in figure 5 showed less percentage of increase in drag at the critical speed than the HACA 0009, 0012, or the low-drag high-critical-speed airfoil sections. Both published (reference 5) and unpublished high-speed data show that the NACA 23O-series airfoils differ from most of the other airfoils in that the critical speed can be exceeded by as much as 0.15 in Mach number before any serious changes in the aerodynamic characteristics of the airfoil occur. The critical speed of the KACA 23O-series airfoils is therefore exceeded by approximately 7^ percent
before the same percentage of increase in drag occurs as is shown for the other airfoils. The importance of this difference in the shape of the drag curve above the criti- cal soeed on the estimation of terminal velocity is dis- cussed in the section entitled "Terminal-Velocity Calcula- tion."
The rapid increase in drag before the critical speed is reached, which is shown for the NACA 67-III4-.5 airfoil in figure 9, is due to early separation of the flow over the after portion of the airfoil. This condition also affects the method for estimating the terminal velocity. An error in estimating the terminal velocity when the flow separates will occur only for those airplanes for which terminal velocities are at or near tne critical speedj this separation of flow will not appreciably affect the determination of the terminal velocity for high- performance airplanes for which the terminal velocity occurs at speeds well above the critical speed.
Figure 10 shows the variation of CQ/CJV.. with
M/Mcr for several fuselage shapes and fineness ratios. The drag increments for the nacelles and windshields are presented in figures 11 and 12, respectively. The criti- cal speeds for these bodies were based on the wings with which the models were tested and were determined for the wing-roob juncture. The effect of compressibility on the rate of drag increase at speeds above the wing critical speed for these bodies is similar to that for the air- foils.
In the correlation of the average drag increases of the various components of the airplane throughout the Mach number range, a generalized drag curve was derived

NACA ACR No, L5GJ1 «MfflMMMlB 7
and is presented in figure 13. The data presented in figures [[., 6, 7J 8, 10, 11, and 12 were used to obtain the generalized drag curve. The generalized drag curve is an average of the drag data for the airfoils, fuselages, nacelles, and windshields at speeds up to 10 percent above the critical speed. Only the average drag of the airfoils at speeds from 10 to 15 percent above the criti- cal speed was used. The generalised, drag curve was extra- polated by use of a straight-line extrapolation from 15 to 25 percent above the critical speed. The straight- line extrapolation is believed to be sufficiently accurate for estimation of the terminal velocity in this region where the drag rises rapidly due to compressibility effects.
Constriction corrections.- Corrections for constriction effects have been applied to the data. The constriction corrections have been determined from pressure measure- ments obtained in the Lang ley 2ij.-Inch and 8-foot high- speed tunnels on NACA 0012 airfoil models of various sizes. The magnitude of the corrections, applied to the drag coefficients amounted to less than one-half of 1 per- cent of the dynamic pressure q at low speeds and increased to approximately 2 percent of q at the criti- cal speeds and to approximately 5 percent of q at a value of the Mach number below the choking speed of the tunnel. The corrections to the Mach numbers amounted to approximately one-half of these values. The constriction corrections were such that the coefficients were reduced and the Mach numbers were increased by the values stated. The greatest percentage of increase in correction, as would be expected, occurred for the models that had the largest ratio of model area to tunnel area.
Comparison with flight data.- Figure lij. shows the variation of over-all drag coefficient with Mach number" for the XP-51 airplane as measured in flight and the variation with Mach number of the wing-profile drag at the mid-semi span station measured by the wake-survey method. These flight data are preliminary as corrections to the data have not been applied. The results obtained by use of the generalised drag curve in estimating the drag increases with Mach number are also shown in fig- ure lij. for comparison with the flight measurements of over-all drag and wing-profile-drag data of the XP-51 air- plane. The curves for the wing-profile drag and the over- all airplane drag in flight begin to rise rather steeply

8 JTACÄ ACR NO. L5G31-
at about the same Mach number. This fact tends to justify the assumption that the wing-root critical speed is a suitable criterion to use in terminal-velocity calcula- tions. The estimated drag derived fron the generalized drag relation indicates higher drag coefficients at Mach numbers of approximately 0.55 "to 0.75 than are shown for both the measured wing-profile drag and the over-all drag coefficients. Of more importance, however, is the good agreement that is shown for the values obtained by use of the generalized drag curve and the measured flight data at Mach numbers greater than 0.75* which is the region where the terminal Mach number usually occurs.
Figure 15 shows a comparison of measured flight drag and estimated drag for the XF2A-2 airplane of refürence 6. An important difference in the drag curves occurs at Mach numbers around the critical Kach number. The estimated drag indicates lower drag coefficients than do the flight measurements. This difference is believed to be due to a combination of early shock formation on the cowling and airplane-wing roughness, which i3 believed to have caused some separation of the flow. Good agreement is indicated between the flight measurements and the estimated drag in the region where the drag coefficients rise steeply, which is the region that determines the terminal Mach number.
Terminal-Velocity Calculation
The generalized drag curve (fig. 15) may be used as an approximation in determining the terminal velocity of an airplane in a vertical dive. The terminal velocity is reached when the drag of the airplane is equal to the weight of the airplane. The drag of the airplane in a dive combines both airplane and propeller characteristics. In the present analysis, however, zero propeller thrust is assumed and the propeller drag or thrust is therefore neglected. At supercritical speeds the drag or thrust caused by the propeller is considered to be negligible as compared with the drag of the airplane, particularly if the pilot throttles the engine and adjusts the propeller to a high blade-angle position.
The terminal velocity for zero-lift conditions is given by the relation

NAOA ACR Ho. L5G31
or, in terms of the terminal Mach number Mrp with the JYP speed of sound equal to \i-L£-,
1 a STP%
Equation (2) can "be rewritten in the form
. w 2- 1 1
J-min / Hain
W 1
* PS°Dmin °D/°Ehi- (5)
m
where - is constant for each airplane at the pSCD min
altitude for which Mrp is calculated and
which is obtainable from the generalized drag curve. Equation (3) can then be solved for the parameter
. Figure 16 shows solutions of equation (3) for
vr various values of Mcr and
PS% m
In computations of the terminal velocity, the only data that must be known about the airplane are the minimum

10 NACA ACR No. L5G31
drag coefficient at zero (or approximately zero) lift coefficient or a low-speed drag coefficient whereby the minimum drag coefficient can be computed by use of the generalized drag curve, the wing critical speed, and the wing loading.- Values of these quantities, all of which are used in calculations other than those for the terminal velocity, are easily obtained. With these values known
W for a particular airplane, the parameter can be
calculated for different altitudes; then, for given values
of M or and ff the terminal Mach number can be mm
obtained by uge of figure l6.
In order to illustrate the method of obtaining the terminal velocity graphically, the terminal velocities have been calculated for the XP2A-2, P-39N-1, and p-ltf air- planes. The pertinent data for these airplanes, are given in the following table:
TABLK" I
AIRPLANE DATA
Airplane M cr mm
W S
(lb/sq ft)
XF2A-2 0.6l (flight) .66 (corrected)
0.022 (flight) 26.1
P-39N-1 O.675 (estimated) 0,018 (estimated) 34.1
P-4.7 \0.6l\. (wind tunnel)! 0.020 (flight) 1 .69 (corrected) j
i+5.0
By use of these data the parameter PSCD mm
computed for each airplane. The use of figure 16 to estimate the terminal Mach number is illustrated for the P-ij.7 airplane at 15,000 feet altitude. The variation of

NACA ACR No. L5G31 ^lülÜttteHWi 11
terminal Mach number with altitude thus obtained for the three airplanes is presented in. figure 17.
Also included in figure 17, for comparison with the estimated variation of terminal Mach number with altitude, are records of flight data for the XF2A-2, the P-Ij.7, the P-47C-1-RE, and the P-39N-I airplanes. The flight record for the P-^C-l-RE aitplane was obtained by the late Major Perry Ritchie in a terminal-velocity dive made at Wright Field in July lSk3 • The points represented by circles were obtained from a dive of a P-ij-7 airplane made by a test pilot for the Republic Aviation Corporation. Unfortunately, a complete dive history is not available for this dive but it is believed that, had one been available, it would have followed a path similar to that obtained by the late Major Ritchie for the P-ii.7C-l~RE air- plane. It is further believed that the test points obtained at altitudes of 22,000 feet and 10,000 feet represent entry into and pullrout from the dive, respec- tively. Data for the XP2A-2 airplane were obtained from reference 6 and the data for the P-39N-1 were obtained from dive tests made at Ames Aeronautical Laboratory. The present method for estimating the terminal Mach number yields results that compare favorably with the flight measurements; the difference between the two is no greater than 0.02 in Mach number. This method for estimating the terminal Mach number is therefore believed to be suffi- ciently accurate for usual engineering purposes.
The section entitled "Drag Characteristics" indicates that the NACA 230-series airfoils and airfoils similar to the NACA 230-series could exceed the critical speed by approximately 0.05 to 0.15 in Mach number before any important changes in the aerodynamic characteristics
occurred. At -^— = 1.0, therefore, the NACA 230-series Mcr
airfoils and similar airfoils did not show the same percentage increase in drag as was shown for almost all the other airfoils and for the generalized drag curve. Since in the calculation of the terminal velocity the critical speed of the airplane is based on the critical speed of the wing, it can be expected that for airplanes utilizing NACA 230-series airfoil sections or similar sections the estimation of the terminal velocity will be in error. If the generalized drag curve is used in the estimation of the terminal velocity, the indicated wing
critical speed must be increased approximately "J— percent

for the NACA 2J0-series sections. This correction was applied to the critical speeds of the P-i±7 and XF2A-2 air- planes (see table I), since these airplanes have NAOA 23O- series sections. The dashed curve on figure 17 for Mcr = 0.61}. is the result obtained if the indicated criti- cal Mach number is used rather than the effective critical Mach number, which is about 7— percent higher.
Langley Memorial Aeronautical Laboratory National Advisory Committee for Aeronautics
Langley Field, Va.
REFERENCES
1. Robinson, Russell G., and Wright, Ray E.: Estimation of Critical Speeds of Airfoils and Streamline Bodies. KACA ACR, March I9J4.O.
2. Heaslet, Max. A.: Critical Mach Numbers of Various Airfoil Sections. NACA ACR No. kG-l8, 19Ui-.
3. Becker, John V.: High-Speed Tests of Radial-Engine Nacelles on a Thick Low-Drag Wing. NACA ACR, May IShZ.
!>.. Delano, James B., and Wright, Ray H.: Investigation of Drag and Pressure Distribution of Windshields at High Speeds. NACA ARR, Jan. I9L2.
5« Becker, John V.: High-Speed iVind-Tunnel Tests of the NACA 2J012 and 25012-61). Airfoils. "NACA ACR, Feb. 19l|-l.
6. Rhode, Richard V., and Pearson, H. A.j Observations of Coinoressibility Phenomena in Flight, NACA ACR No. 3D15, 19k3*

NACA ACR No. L5G31 Fig. la-g
/"/nene55 ratio, 10.32.
(b) C^" c
Fineness ratio , 6.65
cc) <C \—- - Fineness ra+io, 7.30
(d) • <^~~~~~*
Fineness ratio , 6-/4
Fineness ratio , 5.60
Fineness ratio , 4.75
,_• — -_^ --=K^eMeS3S. * NATIONAL ADVISORY (Q) C "• -jF COMMITTEE FOR AERONAUTICS
Fineness raiio , 3.30 Ficjure / .- 5ids-vie\ss drawing of various
fuselage shapes.

Fig. 2 NACA ACR No. L5G31
.-iS*'-;iF,:sr:.s»
Circular cross sect ton
Mace lie I
Plar\-vie\sv profile
Nacelle 2
EHip-tical cross section Circular cross Section
£ä^- Nacelle 3 Nacelle 4
Circular cross section
Nacelle 5 NATIONAL ADVISORY COMMITTEE FOR AERONAUTICS
Figure 2.- Nacelles tested. CDesignations from reference 3.)

NACA ACR No. L5G31 tig. 3
Windshield
*•>-*• C^
'-°-3 C^
4-0-3 £^
X-' A
NATIONAL ADVISORY COMMITTEE FOR AERONAUTICS
Plane. A-ft of a/I* vsindsh ields is iocaied at same position on -Fuselage •
Figure 3- W/'ndshields tested, (Designations from reference 4-.)
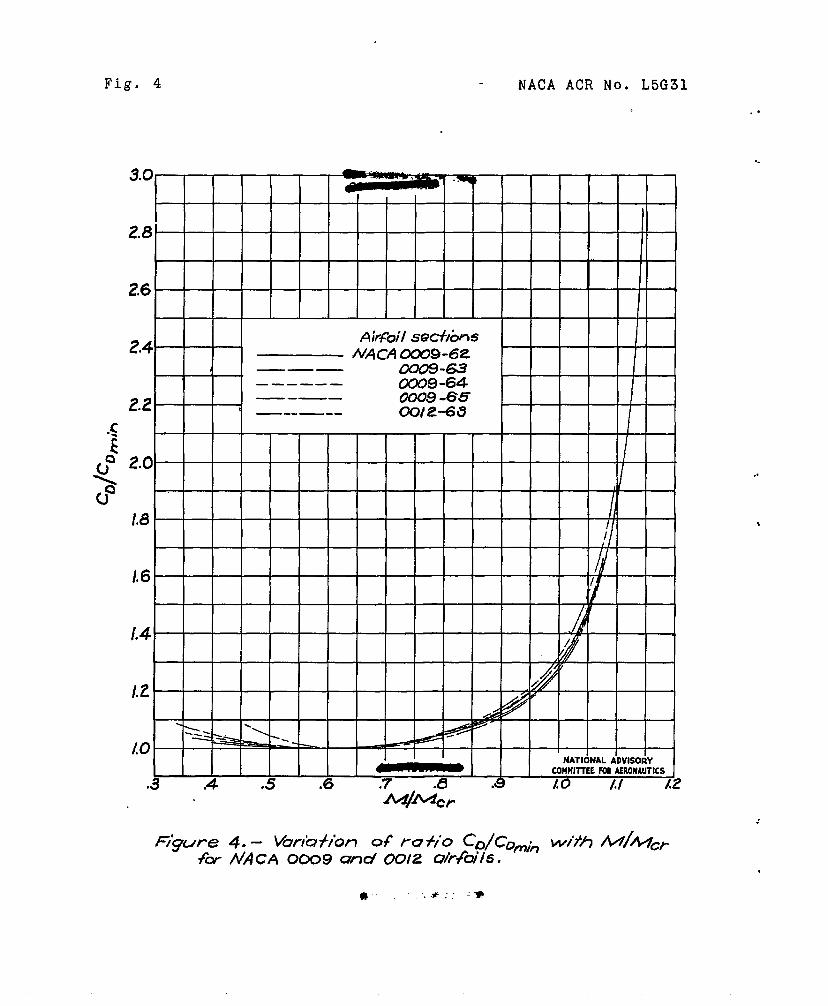
Fig. 4 NACA ACR No. L5G31
3.V —W^WWii1.» .lot,, t-wr ufac •
2.8
2.6
2.4 Airfoil SQC+/bns
j
/
0009-64 0009 -6ö~ 2.2
.c OO/a-63
5 f 2.0
'
f / f
/.a // //
A6 1 , l]
* g
/.4 A ¥
\.t /
^£. ̂ /
1.0 ~^~ ~~£^s
•<••*
•*-.*. ^^
NATIONAL ADVISORY COMMITTEE FD« AERONAUTICS
J z ̂ •s. .( m r .£ i X i /. O i. / f.Z yw/A</cr
F/gure 4.— Varia Hon of r a Ho Co/Co^^ wtth A^/v/c/- •fbr HACA 0009 and 0O/2. air-foils.
* :: - *

NACA ACR No. L5G31 Pigs. 5,6
•s
I?
/. o 111
1.6 j Airfoil section s NACA 230/2
230/4.7 ZZlS(root) to 22/2 C+tp)
1 IA
//
I.Z //
.^^
1.0 ~^ ̂ =rs :—S".^ ""^Ä~* r^r= J=^9'
NATIONAL ADVISORY COMMITTEE FOB AERONAUTICS
•t 1 ,^ I • *. S- .< 5 .7 . .a .9 1.0 u I.Z MJMzr
Figure. o~. - Variation* of rcr+fo CD/CDrnfn with M/Mcr
for three Convent/oner/ NACA airfoils*
1.6
C 14 ' 's,
o
1.0
.3
Airfoil seeff'ons NACA /6-509
/6-5/ö~ / 1
•
/
s. / sJT
NATIONAL ADVISORY COMMITTEE FOR AERONAUTICS
_ 1 ,,....1 1 1 .6 .7 .8 3 1.0 1.1 I.Z
Figure 6.— Variation of ratio Co/CDrriin with MJMcr for NACA 16-509 ctnd 16-5/5 airfoils. Transition fixed at O.IO chore/.

Fig. 7a,b MACA ACR No. L5G31
Q o
ü°
1.8
1 £ ••
AO
/4 /; /
/
/2 s .0&&"
jfi V
/ rt /.0
(o) Transition fixed at OJO chord.
Airfoil sections NACA66,/-//5
41-Et5 67,0-2/5 /e-ais
oQ
Q O
AO
1.6
1.4 J. '/
/
i.Z j& j *f.
*** /
1.0 NATIONAL ADVISORY
COMMITTEE FO» AERONAUTICS
3 ,d * 4 T A .7 r .6 3 .1 \ / 0 1. / /2 M/Mcr
(b) Transition -fixed at 0.4O chord. ..
Figure 7 •" Vernation of ratio co/con>in Wl^ f^i^^cr for severert A/ACA airfoils .

NACA ACR No. L5G31 Fig. 8
2.6
2.4
2.Z
2.0
i 1.8
Q
1.6
t.4
1.2
1.0
• f Airfoil sec+ions
i j
i v/ACA 47-215 67}0-ZI5 /6-2/5
1
/ //
/ //
i
/
/
J i
" i y- t'
4 ^-5^-
—"^ "::^: b^ NATIONAL ADVISORY
COMMITTEE FOR AERONAUTICS
.4 .7 .a .9 I.O I.I /.Z
Figure & .- Var/aHör» of ratio CD/cDmin vv/'^"1 A^/A^c/- •For several NACA airfoils . No -rrans/Hon.

Fig. 9 NACA ACR No. L5G31
CO
2.6 / 1 2.4
Airfoil sections I MAC A 65(Z\S)-ZZO , ,t \
65-type rnodffiect, ^t=a/96 Paws air-foil, */c "CX20/5 / 67-114.5 I 2.Z
•£ 2.0 Q
t / / /
o Q 18 /,
1 1
i f
/.6
/ / /
i 1
1 / I
/.4 1 V /
/
/
/ " I. /
/
1.2 / /
/
/
&?** *s s /
r f
1.0 ^** **^C ^x ^. -^
**•
^"^Ljai • S
x >
NATIONW. ADVISORY COMMITTEE FM AER0N4UTIC&
? .-< f * X 7 .1 1 .& ) /. 0 /. / It A^/A^cr
Figure 9 . - Variation of ratio CD/C0 • with MfMcr for Davis airfoil and <severcrl TvACA airfoils.

NACA ACR No. L5GS1 Fig. 10
c
Q O
2.2 (MM W^^^^B \
Fuse/ape Fineness CSee fig-0
(a) • (b)
. (d) (e)
ratio I0.3Z 6.65 730 6./4 S.60 4.75 3.30
i
i 2.0
. ., . , .., . ,.
1.8 —'- ~— r9) • i
i
1.6 —
/
IA //>
it
/
1.2 A f 4 ?y / /
1.0 s^^ i«2ÖS
^Sk ̂ 0 '^•"'
NATIONAL ADVISORY COMMITTEE FOR AERONAUTICS
. J /< % i F .t 7 A \ e j /. 0 ././ IZ M/Mcr
Flcjure IO. — Variation of ratio CDJCD . with Asl/MCr for several fuse/age shapes. n

Figs
t.a
. 11,12
1
NACA ACR No. L5(
1 Nacelle CSee />£. 2.)
16 2 3 4 5
.c /
oQ IA
*W> • ... -'S *. •9 /
l.Z //. /
^&' ^^. O .'
1.0 -• —**.* 0?^
*&""*•
NATIONAL ADVISORY COMMITTEE FOP AEROHWTIOS
3 x J 4 5" A • .7 .8 .9 I.O I.I /;
Figure II.- Variation of ratio CD/^Dmtn with MfMcr for several nacelle shapes.
2.0
1.8
c 16
oQ
o 1.4
l.Z
1.0
.3
Windshield C See fia-3) 3-1-1 3-1-2 Z-O-3 fit*.
f /< li
I / r
A // 1 V' /
/
-<& t ' • y
a=Sc ^^?
,jt«r
NATIONAL ADVISORY COMMITTEE Ft* AERONAUTICS
.7 .3 .9 1.0 1.1 l.Z
Ficjure 12. .- Variation of ratio CD/CDm-n with /W//Wc/- for several windshield shapes.

NACA ACR No. L5G31 Fig.' 15
;,?zmnmt>.
5.8
*5A * f
/
5.0 *
/
4.6 / / /
4.2 * /
/ ]
3.8 z
/ / / I
Q 3.4 Exirvtpolcrt&d /
/ /
^3.0
/ / / / /
2.6 '
/
2.2 /
/
1.8 /
/
U / /
1.0 NATIONA . ADVISORY
C 3MMIT Itt h UR At tUNAU TICS
.3 .5 .6 .7 .8 .9 1.0 /./ I.Z 1.3
Figure 13.~ Qen&ra/izeG/ c/r&c/ Curve,

Figs. 14,15 NACA ACR No. L5G71
k o
8
s
.OS —Overall draq >o,<ae I fPliri hf) —*—Vjifrq profile draqt CL < 0.4-] K v
tetirncrred drad from generalized drag curve Cfi'g. 13}
.04
.03 t
§
.02 O Q VmSgggt o-gr
'
.01 & A A ^<t A A
NATIONAL ADVISORY COMMITTEE F« AERONAUTICS
0 / •i 7 s .4 .5 .6 .7 .6
Mach, rv-tmber; JSS$
Figure 14 ~ Variation o-F measured fi/'ghf drag and estimated drag v/ith J\skxih number for XP-51 airplane.
.05 \
•0° .04
—o— Ovepall drag (Flight E&fima+ed drag from
generalized drag curve ffia. IS0
4» 3 h &:'.
it
[/ +• | .03
- . 0 ^ k. f
o <3 >
fr • • ä
& •
8 °2 u «- '*
0*
NATIONAL ADVISORY COMMITTEE F« AERONAUTICS
0 . 1 * ? 7 .4 f- #/ .< .i 7 .6 J Asfach number j Asi
Figure 15 - Variation of measured flight drag and estimated drag with Mach number -for XF2A-2. airplane-.

NACA ACR No. L5G31 Fig. 16
JO775 iSÖ35 30 ^5 Cn'Hcctl Mach numb&r, Asicr
Figure /6 ." Terminal Mac/n number chari-

v. Q)
•Q
•s I v.
^o "-•~ ••
88 PulhOLfh* Term/'na/ •«— Erytru
86 r P-47 airplane ~-- ><-- ' \. (Estimated; /y, ^* N. L corre c ted to %.69)
84 Nyr —P-47C -1-e.E airplane \ (Fliahit data') '
/ < i
82 " \r P-39N-I airplane
MEstima+ed? ,- "S r/3- 47 airplane
. „ - -"\ ^Estimated • A^=0.64)
ÖO __.-'
! P~47~^ "" •
.78 *"~ "P~39A/-I~y
-" r-T rXF2A~Z airplane
(Estimatedj A^. ^-corrected to 0.66)
ft
3 (".: __^ ^ V
76 L '*
.--
_-- -- "^^ 74.
/ , XF2A-2. airplane
(FlfaHt data)
72 i /
fUl-oLrf--*- Terminal •^ Entry
70
w
mm NATIONAL ADVISORY
COMMITTEE F0» AERONAUTICS
/0 /S
Altitude , H, ft
20 25 30 x /O3
'gtsre /7 •- Comjoari-son oF e&tr'mo/ed vario+i'or\ ar\cf-F/fgrrt vaHaHon o-F ter-mfnq/ /Vfcrcn number with cr/t/'tude for severa/ cr/rp/arieö.
> o >
> o po
o
en

Bsawao (Bta<n) Biülnt, B. P. .
AUTHOB(S)
IWVBMNi Aarodynanlco (2) IsfCTlON. Hlngo and Airfoils (6) JcBOSS meaaiOSiBrag, Acrodynanlo (31080); Co=giro3Dl-
blllty - Aarodynanioo (2bl00); Hlngo - Brag - Ef- foct of coqprooalvo loads (99161.2)
A1iu° 7887 «HG. AG&KY NUM2E1
ACB-L5331
AM3J.TITU1 A slcplo cathod for ootlcatlng tomlnol velocity including offoct of acngrcaol- . • billty on drag '
FOtxsw. tint,
aaGWATCJO AGENCY. national Advisory Co=ilttoo for Aoronautlco, Kaohingtffl",, D. C. TOANSlATlOtt.
f£ATU2£S
grapho, drggo couNJur D.8.
LANGUAGE I tablos
Anlyolo of trlnd-tcnnol data of aovoral dlffaront alrplano ocqpcnontG nhlah waro obtained nsar vlng critical spocd bao rsonltcd lit a'generalized drag curvo that provided cotlr:ito of drag rloo oauaod by ocaproat lblllty. Terolnal voloolty cay bo found fron c ofcar» baod on tnlo ourvo vnon wing critical opsod, ulag loading, and a lov-opocd drag ooofflolcat of alrplanoaro fcnoun. Kotnod la not applicable to airplanes that utilise loo aspect ratio wlago and largo airaoptoca.
USE: Eoflnooto for oopleo of tnlo roport —ait bo oddrooocd to: D.A.C.A., Washington, D. C.
T-l KO, AQ MAlHSa COMMAKO ^Q VeCKhKAl UNDEÄ >«DKjm FBU>, OX», USAAf <&>,