national aeronautics and space administration ames ... · national aeronautics and space...
TRANSCRIPT

National Aeronautics andSpace Administration
Ames Research Center
Dryden Flight Research FacilityP.O. Box 273Edwards, California 93523-0273
XAR/93-159 November 15, 1993
TO: All Holders of NASA TM-104272
FROM: Chief, XAR/Reports and Presentation Branch
SUBJECT: Errata Sheet for NASA TM-104272
Please change the subject document, titled
Preliminary Analysis for a Mach 8 CrossflowTransition Experiment on the Pegasus Space Booster
by Leslie Gong, W. Lance Richards,Richard C. Monaghan, and Robert D. Quinn as indicated below.
REMOVE INSERT
Page 10 Page 10
Gregory A. Shell

National Aeronautics andSpace Administration
NASA Technical Memorandum 104272
Preliminary Analysis for a Mach 8 Crossflow Transition Experiment on the Pegasus
®
Space Booster
Leslie Gong, W. Lance Richards, Richard C. Monaghan, and Robert D. Quinn
November 1993

National Aeronautics andSpace Administration
Dryden Flight Research FacilityEdwards, California 93523-0273
1993
NASA Technical Memorandum 104272
Preliminary Analysis for a Mach 8 Crossflow Transition Experiment on the Pegasus
®
Space Booster
Leslie Gong, W. Lance Richards, Richard C. Monaghan, and Robert D. QuinnNASA Dryden Flight Research Facility Edwards, California

PRELIMINARY ANALYSIS FOR A MACH 8 CROSSFLOW TRANSITION EXPERIMENTON THE PEGASUS® SPACE BOOSTER
LESLIE GONG, W. LANCE RICHARDS,RICHARD C. MONAGHAN, AND ROBERT D. QUINN
AEROSPACE ENGINEERSNASA DRYDEN FLIGHT RESEARCH FACILITY
P.O. BOX 273EDWARDS, CA 93523-0273
ABSTRACT
A boundary-layer transition experiment is proposed for a future flight mission of the air-launched Pegasus® space booster. Theflight experiment requires attaching a glove assembly to the wing of the first-stage booster. The glove design consists of a springand hook attachment system which allows for thermal growth of a steel 4130 skin. This paper presents results from one- and two-dimensional thermal analyses of the initial design. These analyses were performed to ensure the integrity of the wing and todefine optimal materials for use in the glove. Results obtained from the thermal analysis using turbulent flow conditions showeda maximum temperature of approximately 305 °C (581 °F) and a chordwise temperature gradient of less than 8.9 °C/cm(40.5 °F/in.) for the critical areas in the upper glove skin. The temperatures obtained from these thermal analyses are well withinthe required temperature limits of the glove.
NOMENCLATURE
CTE Coefficient of thermal expansion,
specific heat,
E modulus of elasticity, GPa (Msi)
FS fuselage station, cm (in.)
k thermal conductivity,
LE leading edge
LTA Lockheed Thermal Analyzer
q heat flux,
T temperature, °C (°F)
radiation heat sink, °C (°F)
TE trailing edge
X distance measured aft from glove leading edge, cm (in.)
y lateral coordinate measured to the right from vehicle centerline, cm (in.)
z vertical coordinate measured up from vehicle thrust line, cm (in.)
® Pegasus is a registered trademark of Orbital Sciences Corporation, Fairfax, Virginia.
µcmcm °C----------------- µin.
in.°F-------------
CpJ
kg K------------- Btu
lb °F-------------
Wm K----------- Btu
hr ft °F--------------------
W
m2------- Btu
ft2 sec------------------
T∞
1

angle of attack, deg
ultimate stress, MPa (ksi)
yield stress, MPa (ksi)
density,
INTRODUCTION
The Pegasus® space booster is a three-staged rocket which is air launched from a B-52 aircraft to introduce small payloads intolow Earth orbit. To understand and predict crossflow transition under hypersonic flight conditions where ground test informationis unavailable, a piggyback flight experiment is proposed for the Pegasus® [1]. A cost-effective flight test technique for conductingsuch experiments involves designing and building a temporary test structure, called a glove, and installing it over part of theexisting wing. This technique avoids the need for major modifications to the primary load-carrying wing structure and simplifiesthe many systems required for flight test. A thermal analysis was performed to define the optimal materials for use in the glovedesign and to predict the glove temperature distributions for the proposed crossflow transition experiment. This paper describesthe preliminary glove design and presents results from one- and two-dimensional thermal analyses.
BACKGROUND
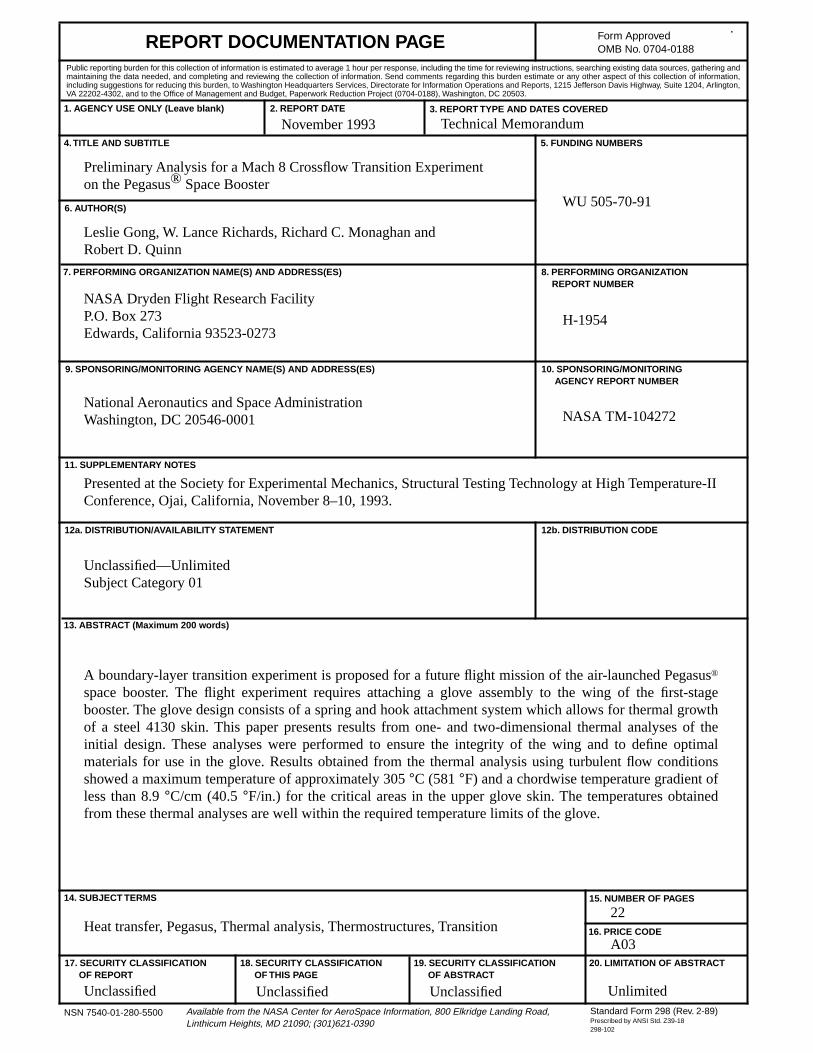
Figure 1 shows the physical dimensions of the rocket and the proposed glove location. The overall length of the Pegasus® boosteris approximately 14.9 m (49 ft) with a wingspan of 6.7 m (22 ft). The cylindrical fuselage of the rocket is approximately 1.3 m (4.2ft) in diameter. The wing has a clipped delta planform with a 45° leading-edge sweep angle.
At an altitude of 13,000 m (42,000 ft) and Mach 0.8, the booster separates from the B-52 aircraft, descends for 5 sec, ignites,and burns for approximately 80 sec. At first-stage burnout, the booster has accelerated to Mach 8 at an altitude of approximately61,000 m (200,000 ft). The booster follows a fixed trajectory which is predetermined for a particular payload insertion. Figure 2shows the Pegasus® space booster mounted under the wing of the B-52 aircraft. Trajectory information from previous flights areprovided in references 2 and 3.
GLOVE DESIGN
This section describes the preliminary design of the glove, including the definition of the skin materials, edge-fairing details,leading-edge attachment, and skin-attachment mechanism. Additional details of the overall glove requirements are given inreference 1.
Structural design requirements
The outside dimensions of the test surface and the fairings were defined to meet the aerodynamic experiment requirements [1].The metallic portion of the test surface has a plan view area of 0.985 m2 (10.6 ft2). Aside from the usual flight loads envelope,the structural design requirements included a waviness criterion not to exceed 0.008 cm (0.003 in.) over a 5.1 cm (2 in.) lengththroughout the flight envelope; a requirement to minimize any step discontinuities at the inboard edge of the test surface,especially near the leading edge, and the requirement to have a thermally conductive skin. Such a skin was needed, sothermocouples mounted on the inside skin surface would sense heating changes caused by boundary-layer transition. Note thatweight was not a primary design consideration, and the structure was not optimized in this regard.
Test surface design
The structural requirements resulted in a design with a relatively thick metallic outer skin and a large leading-edge heat sink(figure 3). The test skin is laid over a balsa support surface. This preshaped support is glued to the wing of the Pegasus®.
Figure 4 shows the test skin attached to the balsa-contoured surface using a series of springs spaced on 6.35-cm (2.5-in.)centers. These springs hold the skin securely to the surface but also allow it to expand thermally with only a small resistance dueto sliding friction. Each spring is attached to the test skin by a 0.152-cm (0.06-in.) diameter wire loop which is brazed to the skin.A hook engages this loop, and a preload is applied through the spring to react against aerodynamic forces. Insulation placedinside the hook cavity reduces thermal radiation from the skin.
ασu
σy
ρ kg
m3-------
lb
in3-------
2

The skin is attached rigidly to the Pegasus® wing at its inboard leading edge (figure 5). The test glove leading edge is constrainedto movement parallel to the Pegasus® wing leading edge by a series of slotted attachments. The glove is free to thermally expandaft and spanwise parallel to the leading edge.
Fairing design
Figure 6 shows an aerodynamic fairing used to blend the test surface into the existing wing. Figure 7 shows cross sections atlocations A-A and B-B and details of the inboard and outboard fairing. This fairing is made in two parts. A hot sectionapproximately 6 in. wide interfaces with the test surface. This section consists of fibrous silica insulation which was developed foruse as part of the space shuttle thermal protection system. The final blending into the wing is done with a foam fiberglasssandwich. An ablative coating similar to that used on the Pegasus® wing is applied over the fiberglass and extends over theinterface with the ceramic. The fairing on the inboard side is flush with the test surface. On the aft and outboard fairings, the testsurface overlays the fairing to allow for thermal expansion.
Material selection
Several requirements were identified in the glove material selection process which significantly affected the prediction ofcrossflow transition. Boundary-layer transition is highly sensitive to glove shape changes during the flight experiment; therefore,the shape of the glove must be structurally stable. Local buckling or excessive thermal expansion might compromise the desiredresults of the experiment. Several materials were considered for the glove. These candidates are presented in tables 1(a) and1(b) as a matrix of thermal and mechanical properties. Other factors, such as availability, machineability, and general practicalapplications, were also considered.
Steel 4130 was tentatively selected as the most logical candidate for the glove design. However, because of the great impact thatthe thermal characteristics have on the temperatures, a one-dimensional thermal model was constructed to compare the affectsof these temperatures on a steel glove with those of an aluminum or a copper glove. The thermal performance of these candidatematerials is described next.
A one-dimensional thermal model of an initial glove design concept was constructed to calculate temperatures at the leadingedge for aluminum, copper, and steel. This initial concept consisted of a metallic skin bonded to fiberglass. In turn, this skin andfiberglass were bonded to a foam layer [1]. The foam layer is then bonded directly to the graphite-epoxy skin of the Pegasus®
wing.
Figure 8 shows a sketch of this preliminary model. The model consisted of 14 nodes and included aerodynamic heating to theouter skin and radiation to space. The metallic skin was divided into eight layers with each layer having a thickness of 0.16 cm(0.063 in.). This figure also shows layers which represent the epoxy, fiberglass, and foam. The outer surface emittance wasestimated to be 0.80, and radiation was to a heat sink temperature of –46 °C (–50 °F).
Three thermal analyses for aluminum, copper, and steel were performed using a finite-difference-based program called theLockheed Thermal Analyzer (LTA) (Lockheed Corporation, Burbank, California). Figure 9 shows the three outer skin temperaturetime histories. Aluminum and copper resulted in the highest and lowest peak temperatures, respectively. Aluminum waseliminated as a viable material because of the high skin temperature predictions. The peak temperature difference between thecopper and the steel skin analyses was only 19.2 °C (34.6 °F) on the outer skin. The temperature differences between copperand steel were small. Since copper is not a very practical structural material, selection of steel for the glove appears verified.
INPUT TO THERMAL ANALYSES
Thermal analyses were required to ensure that none of the maximum operating temperatures of the glove materials wereexceeded. This section describes the procedure used to calculate appropriate parameters used as input to the one- and two-dimensional thermal analyses. The flight profile and aerodynamic heating are described next.
Flight profile
The F-2 flight trajectory [2] was used as input to calculate the heating rates used for the thermal analysis of the metallic skin.Figure 10 shows the parameters of Mach number, altitude, and angle-of-attack time histories. To date, the F-2 trajectory producedthe highest heating rates of the four Pegasus® launches [2, 3]. A preliminary thermal analysis showed that the F-2 mission issignificantly higher and, therefore, represents the “worst case” heating condition for the glove design.
3

Aerodynamic heating
Aerothermal heating rates were calculated using an in-house aerodynamic heating program called THEOSKIN. Time histories ofvelocity, angle of attack, and altitude were used as input parameters. This program calculates surface temperatures, heat transfercoefficients, heating rates, skin friction, and surface static pressures at discrete locations. A cross section of the outer mold lineof the glove was used to determine a wedge angle and the surface locations of the node points from the thermal model. Thesesurface locations were required to determine flow distances and expansion angles needed for heating calculations.
This program permits use of different theories for calculating heat transfer. These theories can be applied for each location ofinterest for laminar or turbulent flow conditions in addition to flows with transition. Transition can be input as a function of Reynoldsnumber and local Mach number or of time. At the leading edge, the Fay and Riddell Method was used to calculate the stagnationpoint heating rates with sweep [4]. Swept cylinder theory was used to determine local flow conditions. Heating rate distributionsaround the leading edge used the Lees theory [5]. On the glove skin aft of the leading edge, local flow conditions were calculatedfor an attached flow using the oblique shock theory [6]. The heat transfer coefficients were calculated using Eckert's ReferenceEnthalpy Method [7, 8]. This method was used in calculating the heating rates for laminar and turbulent flow conditions for theupper and lower surface of the glove. Real gas properties of air were used in all calculations [9].
RESULTS AND DISCUSSION
The aerodynamic heating results were used as input to the one- and two-dimensional analyses. These analyses are describednext.
One-dimensional thermal analysis
A preliminary one-dimensional model was used to determine if the spring and hook assembly would have an appreciable affecton the skin temperature calculations and, therefore, be required in the two-dimensional thermal analysis. Figure 11 shows twothermal skin models. Model 1 is the skin model without the spring and hook assembly and consists of six conduction resistors,six capacitor nodes, and one external radiation resistor. Model 2 is the skin model with the spring and hook assembly and iscomprised of 19 conduction resistors, 16 capacitor nodes, and 1 external radiation resistor. The aerodynamic heating is appliedto the external skin nodes as shown.
Figure 12 shows the skin temperatures of models 1 and 2. As shown, the temperature differences between the two models arenegligible. The maximum difference between the calculated skin temperatures with and without the spring and hook assemblywas 4.4 °C (8 °F). Based on the results of the one-dimensional analysis, the spring and hook assembly was neglected in the two-dimensional model of the glove. This simplification in the thermal model did not significantly affect the results of the two-dimensional analysis.
Two-dimensional thermal analysis
A drawing of the two-dimensional model is shown in figure 13. This model consists of 123 conduction resistors, 75 capacitornodes, and 22 external radiation resistors. Aerodynamic heating was applied to each of the 22 external surface nodes. The outersurface emittance was estimated to be 0.8, and the external radiation was to a sink temperature of –46 °C (–50 °F). The two-dimensional thermal model of the glove was used to determine the optimum thickness of the metallic skin for minimumtemperature, minimum weight, and structural integrity.
Figure 14 shows the outer mold line of the metallic glove and the locations of the thermal model nodes. Table 2 lists the distancesof the nodes from the leading edge together with the overall skin thicknesses at each surface node location.
Figures 15, 16, and 17 show the results of the two-dimensional analysis. These figures show results of the temperature timehistories for seven locations on the glove from X = 3.33 cm (1.31 in.) to X = 79.32 cm (31.23 in.). Figure 15 shows the resultsobtained when the boundary-layer flow was assumed to be all laminar. The maximum temperature for this calculation was 128 °C(262 °F), and the maximum temperature gradient was 15.1 °C/cm (69 °F/in.) between X = 3.33 cm (1.31 in.) and X = 4.88 cm(1.92 in.) at 79 sec.
Figure 16 presents the calculated temperature time histories, assuming an all turbulent boundary layer. The maximumtemperature obtained was 305 °C (581 °F), and the maximum temperature gradient occurred between X = 6.48 cm (2.55 in.) andX = 11.63 cm (4.58 in.) and was 26.9 °C/cm (123 °F/in.).
4

Figure 17 shows the temperature time histories calculated with boundary-layer transition. The boundary layer was all laminar forlocations from X = 3.33 cm (1.31 in.) through X = 11.63 cm (4.58 in.). For X locations of 28.80, 54.00, and 79.32 cm (11.34, 21.26,and 31.23 in.), these calculations were initially turbulent and transitioned to laminar flow at 40, 45, and 50 sec, respectively. Themaximum temperature obtained was 131 °C (268 °F), and the maximum temperature gradient occurred between X = 3.33 cm(1.31 in.) and X = 4.88 cm (1.92 in.) and was 15.1 °C/cm (69 °F/in.).
CONCLUSIONS
Thermal analyses were performed for the preliminary design of the Pegasus® Glove Experiment. These analyses helped in thematerial selection for the glove as well as to predict the glove temperature distributions resulting from the Mach 8 flight trajectory.Results from several models were presented, including a one-dimensional model of the leading edge, a spring and hook thermalmodel, and a two-dimensional thermal model of the entire glove. The leading-edge thermal analysis results verified that steel wasa more suitable metal than either aluminum or copper. The spring and hook analysis results showed that the heat transfer throughthe spring and hook hardware did not appreciably affect the steel skin temperatures. For critical portions of the flight between55 and 75 sec, the temperature difference between the skin temperature with and without the spring and hook was less than1.8 percent.
The two-dimensional thermal analysis results showed that the glove design presented in this paper meets the requirements ofthe proposed crossflow transition experiment. By refining the leading-edge and glove skin thicknesses of the leading edge andskin, the peak upper surface temperature was maintained below 305 °C (581 °F). Temperature gradients in the thinnest skinsections were no more than 8.9 °C/cm (40.5 °F/in.) for the three flow conditions examined.
REFERENCES
1. Bertelrud, Arild, Kolodziej, Paul, Noffz, Greg K., and Godil, Afzal, “Plans for In-Flight Measurement of Hypersonic CrossflowTransition on the Pegasus® Launch Vehicle,” AIAA-92-4104, Aug. 1992.
2. Noffz, Gregory K., Curry, Robert E., Haering, Edward A., Jr., and Kolodziej, Paul, Aerothermal Test Results From the FirstFlight of the Pegasus® Air-Launched Space Booster, NASA TM-4330, 1991.
3. Noffz, Gregory K., Moes, Timothy R., Haering, Edward A., Jr., and Kolodziej, Paul, Aerothermal Test Results From the SecondFlight of the Pegasus® Booster, NASA TM-4391, 1992.
4. Fay, J.A. and Riddell, F.R., “Theory of Stagnation Point Heat Transfer in Dissociated Air,” J. Aeronaut. Sci., vol. 25, no. 2,Feb. 1958, pp. 73–85, 121.
5. Lees, Lester, “Laminar Heat Transfer Over Blunt-Nosed Bodies at Hypersonic Flight Speeds,” Jet Propulsion, vol. 26, no. 4,Apr. 1956, pp. 259–269, 274.
6. Ames Research Staff, Equations, Tables, and Charts for Compressible Flow, NACA report 1135, 1953.
7. Eckert, Ernst R.G., Survey of Boundary Layer Heat Transfer at High Velocities and High Temperatures, WADC TR-59-624,Wright-Patterson AFB, Ohio, 1960.
8. Zoby, E.V., Moss, J.N., and Sutton, K., “Approximate Convective-Heating Equations for Hypersonic Flows,” J. Spacecraft andRockets, vol. 18, no. 1, Jan./Feb. 1981, pp. 64–70.
9. Hansen, C. Frederick, Approximations for the Thermodynamic and Transport Properties of High-Temperature Air, NASATR R-50, 1959.
5

Table 1. Physical properties of candidate materials.
(a) SI units.
TMInconel X is a registered trademark of the International Nickel Company, Huntington, West Virginia.TMRené 41 is a registered trademark of Teledyne Allvac/Vasco Marketing, Monroe, North Carolina.
Material Physical properties Mechanical properties
Strength at 25 °C Strength at 200 °C
E,GPa
Aluminum
2024-T4 130 2768 879 2434 23.2 427 310 324 241 73
6061-T6 168 2713 963 2612 23.6 310 276 241 207 69
Copper 99.95
Hard 391 8941 376 3369 16.6 345 310 – – – – – – 123
Soft 391 8941 376 3369 16.6 221 76 – – – – – – – – –
Nickel
Inconel XTM 11.8 8304 439 3650 12.1 1069 690 1007 627 214
René 41TM 11.8 8249 334 2763 11.9 1172 896 1103 876 207
Steel
1018 51.9 7861 485 3818 12.1 379 248 – – – – – – 207
4130 43.3 7833 477 3739 11.3 655 517 627 448 207
301,4(SS) 17.3 7916 439 3480 16.6 517 207 414 179 200
Titanium
6Al-4V 7.3 4429 502 2225 8.8 896 827 696 579 114
5Al-2.5Sn 8.0 4484 544 2440 9.4 827 779 604 561 107
k ,
WmK---------
ρ,
kg
m3-------
Cp,
jkgK-----------
ρCp,
kJ
M3K-----------
CTE ,
µcmcm °C-----------------
σu ,
MPa
σy ,
MPa
σu ,
MPa
σy ,
MPa
6

7
Table 1. Concluded.
(b) English units.
Material Physical properties Mechanical properties
Strength at 75 °F Strength at 400 °F
Aluminum
2024-T4 75 0.100 0.210 0.021 12.9 62 45 47 35 10.6
6061-T6 97 0.098 0.230 0.021 13.1 45 40 35 30 10.0
Copper 99.95
Hard 226 0.323 0.090 0.029 9.2 50 45 – – – – – – 17.8
Soft 226 0.323 0.090 0.029 9.2 32 11 – – – – – – – – –
Nickel
Inconel XTM 6.8 0.300 0.105 0.032 6.7 155 100 146 91 31.0
René 41TM 6.8 0.298 0.080 0.024 6.63 170 130 160 127 30.0
Steel
1018 30 0.284 0.116 0.033 6.7 55 36 – – – – – – 30.0
4130 25 0.283 0.114 0.032 6.3 95 75 91 65 30.0
301,4(SS) 10 0.286 0.105 0.030 9.2 75 30 60 26 29.0
Titanium
6Al-4V 4.2 0.160 0.120 0.019 4.9 130 120 101 84 16.5
5Al-2.5Sn 4.6 0.162 0.130 0.021 5.2 120 113 88 81 15.5
k ,
Btuhr ft °F--------------------
ρ,
lb
in3-------
Cp ,
Btulb °F-------------
ρCp,
Btu
in3 °F
----------------
CTE ,
µin.in. °F---------------
σu ,
ksi
σy ,
ksi
σu ,
ksi
σy ,
ksi
E ,
Msi

Outer nodenumber
Steel skinthickness,
Distance from gloveleading edge,
cm cm
82 0.229 34.47
83 0.229 22.96
84 0.229 12.34
85 0.635 6.48
86 0.635 4.88
87 0.635 3.33
1 0.953 2.11
2 0.935 1.27
3 1.070 0.58
4 1.220 0.15
5 1.270 0.00
6 1.220 0.15
7 1.070 0.58
8 0.935 1.27
9 0.935 2.11
127 0.635 3.33
126 0.635 4.88
125 0.635 6.48
124 0.229 11.63
123 0.229 28.80
122 0.229 54.00
121 0.229 79.32
Outer nodenumber
Steel skinthickness,
Distance from gloveleading edge,
in. in.
82 0.090 13.57
83 0.090 9.04
84 0.090 4.86
85 0.250 2.55
86 0.250 1.92
87 0.250 1.31
1 0.375 0.83
2 0.375 0.50
3 0.421 0.23
4 0.481 0.06
5 0.500 0.00
6 0.481 0.06
7 0.421 0.23
8 0.375 0.50
9 0.375 0.83
127 0.250 1.31
126 0.250 1.92
125 0.250 2.55
124 0.090 4.58
123 0.090 11.34
122 0.090 21.26
121 0.090 31.23
Table 2. Skin thicknesses and locations for the two-dimensional thermal model.
(a) SI units. (b) English units.
8

Fig. 1. Pegasus® launch configuration and proposed glove location.
670.56 cm (264.0 in.)
0 508.00 (200)
1016.00 (400)
1524.00 (600)
1778.00 (700)
1270.00 (500)
762.00 (300)
254.00 (100)
FS, cm (in.)
z, cm (in.)
0y,
cm (in.)
FS = 1551.18 cm (610.7 in.)
930438
Payload
bay
Third
stage
Second
stageFirst stage
FS = 939.80 cm (370.0 in.)
FS = 464.82 cm (183.0 in.)
FS = 47.24 cm (18.6 in.)
254.00 (100)
254.00 (100)
Glove location
0
–254.00 (–100)
–254.00 (–100)
9

Fig. 2. Pegasus® space booster mounted under the wing of a B-52 aircraft.
Fig. 3. Leading-edge glove structure.
Steel skinBraze joint
Machined steel leading edge
Graphite-epoxy overlay
Wood core
Steel fitting
Pegasus wing
Local attachment
930439Wood core
10

Fig. 4. Spring and hook skin attachment assembly.
A
Washers
Spring
Wood
Glove surface Hook
Bond line soft adhesive
Nut and washer removed
Seal
Teflon sheet Soft insulationWire loop
Wave spring
2.54 cm(1 in.)
1.27 cm(0.5 in.)
Plastic sleeve
3.18 cm(1.25 in.)
3.18 cm(1.25 in.)
A
Section A-A930440
Pegasus wing
11
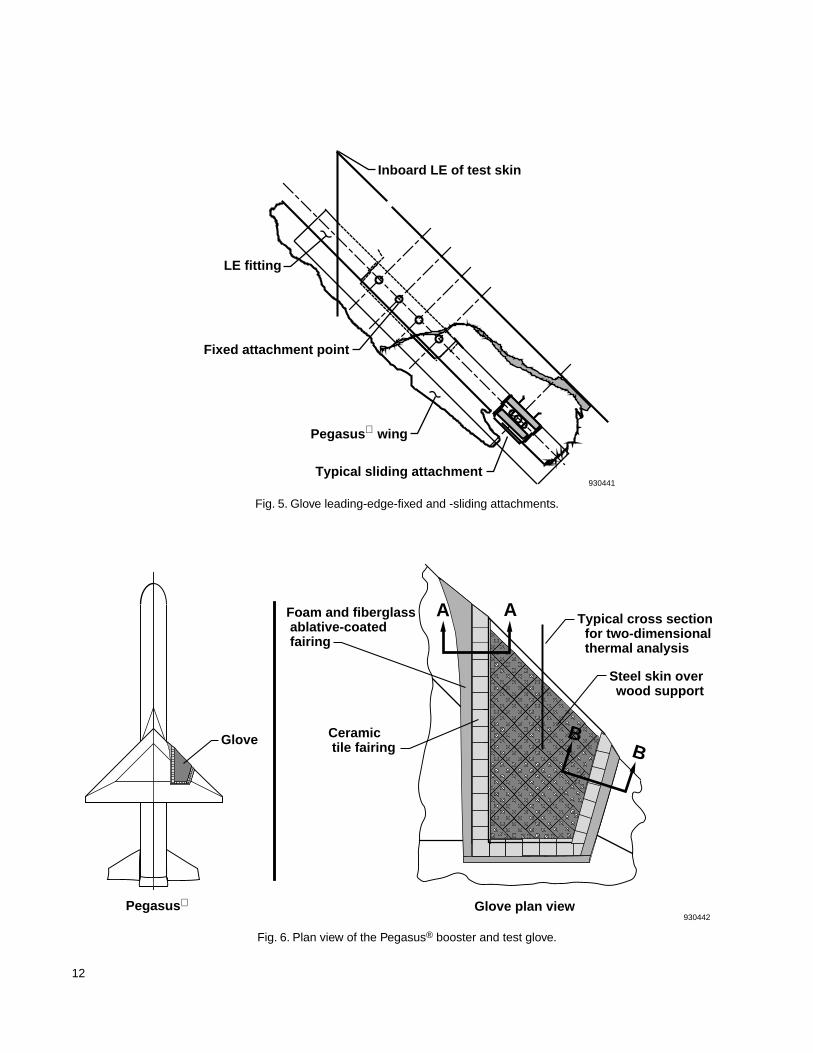
Fig. 5. Glove leading-edge-fixed and -sliding attachments.
Fig. 6. Plan view of the Pegasus® booster and test glove.
Typical sliding attachment
LE fitting
Fixed attachment point
Inboard LE of test skin
930441
Pegasus wing
Ceramic tile fairing
Foam and fiberglass ablative-coated fairing
Steel skin over wood support
Typical cross section for two-dimensional thermal analysis
Glove plan viewPegasus
Glove
A A
BB
930442
12

Fig. 7. Test skin edge fairings.
Fig. 8. One-dimensional LTA model used to predict leading-edge skin temperatures.
Step
Location A-A: Inboard edge
Foam and fiberglass
Coated tile Wood
Steel skinAblative coating
Flush joint
Location B-B: Aft and outboard edge
Steel skin
Foam and fiberglass
Ablative coating
Coated tile
Wood
930443
Pegasus wing
Pegasus wing
14
13
12
11
10
9
8
1
2
3
4
5
7
8
R6
R5
R4
R3
R2
R1
R7
R8
R9
R10
R11
R12
R13
Foam
Epoxy
Fiberglass
Epoxy
Metallic skin
(0.063 in.) Typical
T∞R16
20
0.160 cm
0.018 cm (0.007 in.)
q, W/m2
0.025 cm (0.010 in.)
0.635 cm (0.250 in.)
930444
13

Fig. 9. Comparison of outer skin temperatures for three different materials.
Fig. 10. Flight trajectory parameters of Mach number, angle-of-attack, and altitude.
300
930445
250
200
150
100
50
0
– 50
– 1000 10 20 30 40 50
Time, sec60 70 80 90 100
– 100
0
100
200
300
500
400
Aluminum Copper Steel
Temperature, °C
Temperature, °F
M
110Time from launch, sec
930446
1009080706050403020100– 10
8
6
4
2
0
9
7
5
3
1
70 x103
Altitu
de, m
60
50
20
10
0
Burnout
Separation
IgnitionLaunch
Mach number Altitude, m (ft)
25
Deg 15
5
– 5
20
10
0
30
35
α, deg
Altitu
de, (ft)
200
150
100
50
0
40
30
250 x103
14

Fig. 11. One-dimensional thermal models of the glove skin with and without the spring and hook assembly.
Fig. 12. Comparison of surface temperatures with and without the spring and hook assembly.
1
2
3
4
5
20q, W/m2
6
Model 1, without spring and hook
16
15
13
12
T
R20
20
2 3
8 9
7
4
5
14
1
∞R20
Model 2, with spring and hook
T∞
930447
q, W/m2
– 100
0
100
200
300
400
500
600
806040 Time, sec
200-100
0
100
200
300
400Model 1Model 2
Temperature, °F
930448
Temperature, °C
15

Fig. 13. Two-dimensional thermal model of the Pegasus® glove.
Fig. 14. Outer mold line of the metallic glove and locations of the thermal model nodes.
343332
30
T301
∞
R301R302R304R305R307
R308
R309
R310
R311
R312
R313
R314R315 R317 R318 R319 R320 R321 R322
8283101102
84
175166
858688167168
878990169
211
29
312
21
514 23
22134
6 15
716
25
817
3627189 127
129130173
R316
1101928
R306
126128171172
125
170
124
174
123176
122177
121178
31
R303
930449
26
24
35
20
121122
123
124
8483 82
930450
5
67
89
125
126
127
43
21 87
8685
16

Fig. 15. Predicted surface temperatures using all laminar flow conditions.
Fig. 16. Predicted surface temperatures using all turbulent flow conditions.
250
200
150
100
50
0
– 50
0
Temperature, °C
400
300
200
100
0
Temperature, °F
10 20 30 40 50 Time, sec
60 70 80 90 100930451
124127126 125
123 122121
127, X = 3.33 cm (1.31 in.) 126, X = 4.88 cm (1.92 in.) 125, X = 6.48 cm (2.55 in.) 124, X = 11.63 cm (4.58 in.) 123, X = 28.80 cm (11.34 in.) 122, X = 54.00 cm (21.26 in.) 121, X = 79.32 cm (31.23 in.)
Node number
– 100
– 150
– 100
350
300
250
200
150
100
50
0
0– 50
Temperature, °C
127, X = 3.33 cm (1.31 in.) 126, X = 4.88 cm (1.92 in.) 125, X = 6.48 cm (2.55 in.) 124, X = 11.63 cm (4.58 in.) 123, X = 28.80 cm (11.34 in.) 122, X = 54.00 cm (21.26 in.) 121, X = 79.32 cm (31.23 in.)
400
300
200
100
0
Temperature, °F
10 20 30 40 50 Time, sec
60 70 80 90 100
930452
124
127
126
125
123 122
121
500
Node number 600
17

Fig. 17. Predicted surface temperatures using flow with transition.
250
200
150
100
50
0
– 500
Temperature, °C
400
300
200
100
0
Temperature, °F
10 20 30 40 50 Time, sec
60 70 80 90 100
930473
125
124
126122
127
121123
Turbulent
Laminar
127, X = 3.33 cm (1.31 in.) 126, X = 4.88 cm (1.92 in.) 125, X = 6.48 cm (2.55 in.) 124, X = 11.63 cm (4.58 in.) 123, X = 28.80 cm (11.34 in.) 122, X = 54.00 cm (21.26 in.) 121, X = 79.32 cm (31.23 in.)
Node number
18
REPORT DOCUMENTATION PAGE Form ApprovedOMB No. 0704-0188
1. AGENCY USE ONLY (Leave blank) 2. REPORT DATE 3. REPORT TYPE AND DATES COVERED
4. TITLE AND SUBTITLE 5. FUNDING NUMBERS
6. AUTHOR(S)
8. PERFORMING ORGANIZATION REPORT NUMBER
7. PERFORMING ORGANIZATION NAME(S) AND ADDRESS(ES)
9. SPONSORING/MONITORING AGENCY NAME(S) AND ADDRESS(ES) 10. SPONSORING/MONITORING AGENCY REPORT NUMBER
11. SUPPLEMENTARY NOTES
12a. DISTRIBUTION/AVAILABILITY STATEMENT 12b. DISTRIBUTION CODE
13. ABSTRACT (Maximum 200 words)
14. SUBJECT TERMS 15. NUMBER OF PAGES
16. PRICE CODE
17. SECURITY CLASSIFICATION OF REPORT
18. SECURITY CLASSIFICATION OF THIS PAGE
19. SECURITY CLASSIFICATION OF ABSTRACT
20. LIMITATION OF ABSTRACT
NSN 7540-01-280-5500 Standard Form 298 (Rev. 2-89)Prescribed by ANSI Std. Z39-18298-102
Public reporting burden for this collection of information is estimated to average 1 hour per response, including the time for reviewing instructions, searching existing data sources, gathering andmaintaining the data needed, and completing and reviewing the collection of information. Send comments regarding this burden estimate or any other aspect of this collection of information,including suggestions for reducing this burden, to Washington Headquarters Services, Directorate for Information Operations and Reports, 1215 Jefferson Davis Highway, Suite 1204, Arlington,VA 22202-4302, and to the Office of Management and Budget, Paperwork Reduction Project (0704-0188), Washington, DC 20503.
.
Preliminary Analysis for a Mach 8 Crossflow Transition Experimenton the Pegasus® Space Booster
WU 505-70-91
Leslie Gong, W. Lance Richards, Richard C. Monaghan andRobert D. Quinn
NASA Dryden Flight Research FacilityP.O. Box 273Edwards, California 93523-0273
H-1954
National Aeronautics and Space AdministrationWashington, DC 20546-0001 NASA TM-104272
A boundary-layer transition experiment is proposed for a future flight mission of the air-launched Pegasus®
space booster. The flight experiment requires attaching a glove assembly to the wing of the first-stagebooster. The glove design consists of a spring and hook attachment system which allows for thermal growthof a steel 4130 skin. This paper presents results from one- and two-dimensional thermal analyses of theinitial design. These analyses were performed to ensure the integrity of the wing and to define optimalmaterials for use in the glove. Results obtained from the thermal analysis using turbulent flow conditionsshowed a maximum temperature of approximately 305 °C (581 °F) and a chordwise temperature gradient ofless than 8.9 °C/cm (40.5 °F/in.) for the critical areas in the upper glove skin. The temperatures obtainedfrom these thermal analyses are well within the required temperature limits of the glove.
Heat transfer, Pegasus, Thermal analysis, Thermostructures, TransitionA03
22
Unclassified Unclassified Unclassified Unlimited
November 1993 Technical Memorandum
Available from the NASA Center for AeroSpace Information, 800 Elkridge Landing Road, Linthicum Heights, MD 21090; (301)621-0390
Presented at the Society for Experimental Mechanics, Structural Testing Technology at High Temperature-IIConference, Ojai, California, November 8–10, 1993.
Unclassified—UnlimitedSubject Category 01