national air quality forecast capability: operational … · national air quality forecast...
TRANSCRIPT
National Air Quality Forecast Capability: Operational Fine Particulate
matter (PM2.5) forecast guidance
Ivanka Stajner1, Pius Lee2, Jeff McQueen3, Ariel Stein2, James Wilczak4,Phil Dickerson5 , Sikchya Upadhayay1,6
1 NOAA NWS/STI2 NOAA ARL3 NOAA NWS/NCEP4 NOAA ESRL5 EPA6 Syneren Technologies
with contributions from the entire NAQFC Implementation Team
National Air Quality Conference, Austin, TX January 25, 2018

2
Background• Ongoing implementation of NOAA/NWS National Air Quality (AQ) Forecast Capability
operationally to provide graphical and numerical guidance, as hourly gridded pollutant concentrations, to help prevent loss of life and adverse health impacts from exposure to poor AQ• Exposure to fine particulate matter and ozone pollution leads to premature deaths:
50,000+ annually in the US (Science, 2005; recently updated to 100,000 deaths; Fann, 2011, Risk Analysis)
• Direct impact on reducing loss of life: AQ forecasts have been shown to reduce hospital admissions due to poor air quality (Neidell, 2009, J. of Human Resources )
NOAAdevelop & evaluate
models; provide operational AQ
predictions
State and local agencies
provide emissions, monitoring data, AQI forecasts
• NOAA’s AQ forecasting leverages partnerships with EPA and state and local agencies
EPAmaintain national
emissions, monitoring data; disseminate/interpret
AQ forecasts

Maintaining prediction accuracy for lowered warning threshold and under changing pollutant emissions
National Air Quality Forecast CapabilityOperational predictions at http://airquality.weather.gov
over expanding domains since 2004
3
Linked numerical prediction systemOperationally integrated on NCEP’s supercomputer• NOAA/EPA Community Multiscale Air Quality (CMAQ)
model• NOAA/NCEP North American Mesoscale Forecast
System (NAM) weather prediction
Observational Input: • EPA emissions inventory, AirNow for bias correction• NESDIS fire locations
Gridded forecast guidance products 2x daily nationwide
• At airquality.weather.gov and ftp-servers (12km resolution, hourly for 48 hours).
• On EPA servers
Verification, near-real time:• Ground-level AirNow observations of
surface ozone and PM2.5Customer outreach/feedback• State & Local AQ forecasters
coordinated with EPA• Public and Private Sector AQ
constituents
0.99 0.98 0.97 0.97 0.97
0.8
0.9
1
4/1/2017 5/1/2017 5/31/2017 6/30/2017 7/30/2017 8/29/2017
Fraction correct of daily maximum of 8h average wrt 70 ppb threshold
Ozone and PM2.5
PM2.5
CONUS, wrt 70 ppb ThresholdOperational ozone
Ozone

National Air Quality Forecast CapabilityOperational predictions at http://airquality.weather.gov
Smoke and dust
HYSPLIT model with NAM meteorology for transport, dispersion and deposition• Smoke: daily, nationwide• Dust: 2x per day, CONUSSatellite products developed for verification
Emission sources• Smoke: NESDIS detects
wildfire locations from satellite imagery. Emissions estimated by USFS BlueSky system.
• Dust: Source regions with emission potential are from MODIS deep blue climatology for 2003-2006. Emissions are modulated by wind and soil moisture.
Smoke
Dust
4

Recent Updates
5
CMAQ system update in February 2016
6
• Lateral boundary conditions from global dust predictions
• Increased vertical resolution from 22 to 35 layers in CMAQ v4.6
• Analog forecast technique for PM2.5 bias correction
First public release of raw model predictions and bias-corrected PM2.5 predictions

NGAC simulation of Saharan dust layer transport
• Provides dust lateral boundary conditions for CMAQ• Global-regional prediction linkage• Increased number of model levels to better align CMAQ and global model levels

Impact of NGAC LBCs on CMAQ predictions of PM2.5
8
CMAQ with default LBCs
CMAQ with NGAC LBCs
Whole domainJuly 1 – Aug 3
MB= -2.82Y=1.627+0.583*X R=0.42
MB= -0.88Y=3.365+0.600*X R=0.44
South of 38°N, East of -105°WJuly 1 – Aug 3
MB= -4.54Y=2.169+.442*X R=0.37
MB= -1.76Y=2.770+.617*X R=0.41
Whole domainJuly 18– July 30
MB= -2.79Y=2.059+0.520*X R=0.31
MB= -0.33Y=2.584+0.795*X R=0.37
South of 38°N, East of -105°WJuly 18– July 30
MB= -4.79Y=2.804+.342*X R=0.27
MB= -0.46Y=-0.415+.980*X R=0.41
Time series of PM2.5 from EPA AIRNOW observations (black dot), CMAQ baseline run using static Lateral Boundary Conditions (LBCs) (green dot) and CMAQ experimental run using NGAC LBCs (blue square) at Miami, FL (top panel) and Kenner, LA (bottom panel).
ObservedCMAQ defaultCMAQ with NGAC LBCs
ObservedCMAQ defaultCMAQ with NGAC LBCs
Credit: Youhua Tang

Seasonal Bias in PM2.5 prediction
The bias in the total mass of PM2.5 is dominated by overpredictions of unspecified PM in the winter and by underpredictions of carbon aerosols in the summer. (Foley et. al., Incremental testing of the Community Multiscale Air Quality (CMAQ) modeling system version 4.7, Geosci. Model Dev., 3, 205-226, 2010)
Saylor et. al. found same type of seasonal speciation biases in the CMAQ v4.6 for IMPROVE sites.
Mean (star), median (triangle), and inter-quartile ranges of model bias (model value – observed value) for multiple fine-particle species measured at CSN sites in the 12km domain. The number of model/observation pairs for each species is shown above the x-axis.
9

Bias correction for PM2.5 predictions
10
Unsystematic component of the RMSE (top panel) and systematic component of RMSE (bottom panel) using hourly values for the month of November evaluated at the 518 AIRNow PM2.5 sites.
Raw: Hourly AIRNow data available in real-time
PERS: Persistence forecast
7-day: 7-day running mean subtraction
KF: Kalman-filter approach
ANKF: Analog forecast technique followed by Kalman filter approach
AN: Analog Forecast technique
KF-AN: Kalman-filter approach followed by Analog forecast technique
•Quality control of the observations is essential•Five different post-processing techniques were tested
I. Djalalova, L. Delle Monache, and J. Wilczak: PM2.5 analog forecast and Kalman filter post-processing for the Community Multiscale Air Quality (CMAQ) model, Atmospheric Environment, Volume 108, May2015, pp.76–87.

2016 Update: Raw and bias-corrected PM2.5 predictions
11
Winter(Jan 2015)
Western US Eastern US ObservationsPrevious model2016 model updateAN Bias correction of 2016 updated model
Regional mean for each of 48 prediction hours
Summer(July 2015)

Updates to air quality predictions implemented in June 2017
• Community Multi-scale Air Quality (CMAQ) model v5.0.2• US Forecast Service BlueSky smoke emissions system v3.5.1
• Fuel Characteristic Classification System version 2 (FCCS2), which includes a more detailed description of the fuel loadings with additional plant type categories.
• Improved fuel consumption model and fire emission production system (FEPS).
• Explicit fuel load map for Alaska (HYSPLIT only)
• Addition of 24-hour analysis cycle to include wildfire emissions at the time when they are observed
• Bias-correction post-processing for PM2.5 forecast guidance updated to use the Kalman Filter Analog (KFAN) technique
• Point source emissions to projections for 2017• Dust related aerosol species at the CMAQ lateral boundaries to use the
NEMS Global Aerosol Component (NGAC) v2 forecasts• Meteorology from NAM version 4 since March 2017
12
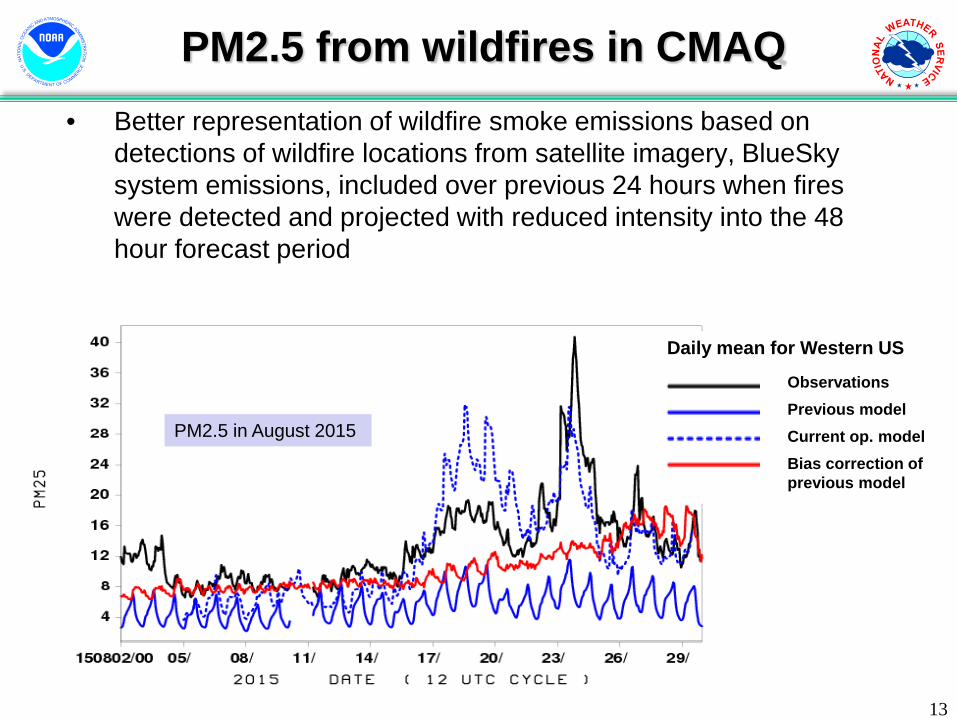
PM2.5 from wildfires in CMAQ• Better representation of wildfire smoke emissions based on
detections of wildfire locations from satellite imagery, BlueSkysystem emissions, included over previous 24 hours when fires were detected and projected with reduced intensity into the 48 hour forecast period
13
ObservationsPrevious modelCurrent op. model Bias correction of previous model
Daily mean for Western US
PM2.5 in August 2015

Representation of wildfires –NW U.S. example on August 23, 2015
14
• Wildfires are strongly impacting air quality in the region• Observed daily maximum of hourly PM2.5 exceeds 55 µg/m3and even 100 µg/m3
• Operational system predicts values below 25 µg/m3 for many of these monitors• Updated system in testing predicts values much closer observed
Previous CMAQ 4.7 Updated CMAQ 5.0.2
µg/m3
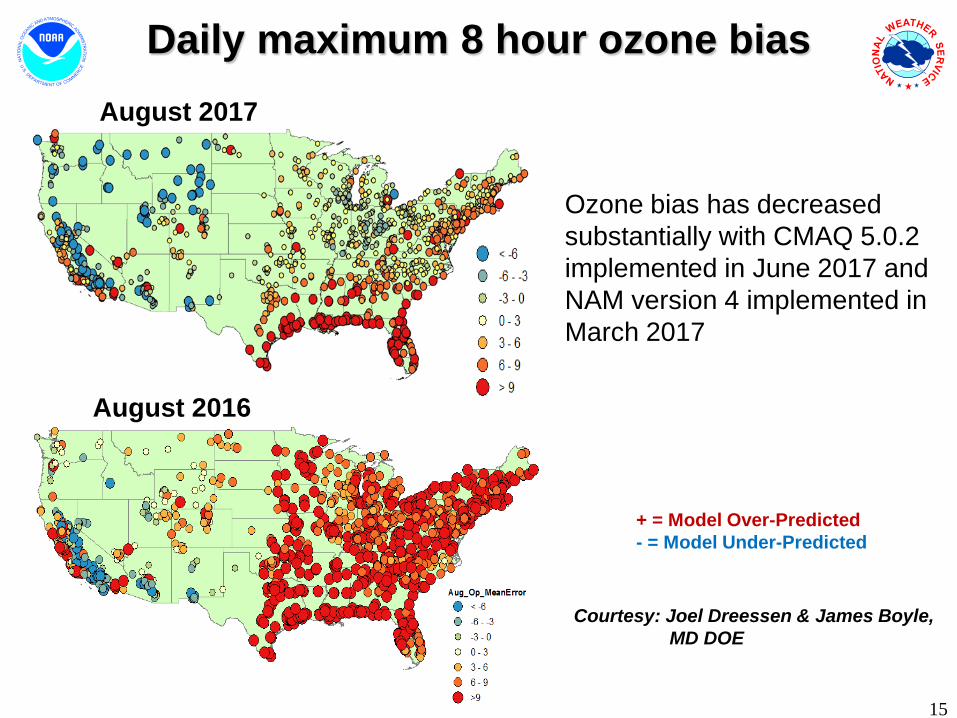
Daily maximum 8 hour ozone bias
Ozone bias has decreased substantially with CMAQ 5.0.2 implemented in June 2017 and NAM version 4 implemented in March 2017
Courtesy: Joel Dreessen & James Boyle, MD DOE
+ = Model Over-Predicted- = Model Under-Predicted
2017 data is preliminary and subject to change15
August 2016
August 2017

Statistical performance of PM2.5for May 2017
Eastern U.S. Western U.S.
Mean PM2.5 by forecast hour
µg/m
3
µg/m
3
16
ObservationsPrevious operational modelBias correction for previous model Current operational model Bias correction for current model
I. Djalalova, L. Delle Monache, and J. Wilczak: PM2.5 analog forecast and Kalman filter post-processing for the Community Multiscale Air Quality (CMAQ) model, Atmospheric Environment, Volume 108, May 2015, pp.76–87.
Huang et al., Improving NOAA NAQFC PM2.5 predictions with a bias correction approach, Weather and Forecasting, 2016.

BlueSky Evaluation
HYSPLIT with previous BlueSky
HYSPLIT with updated BlueSky
Comparing previous operational smoke predictions with those using updated BlueSky for May 2016
Improved skill scores in May from large Ft. McMurray fires for currently operational HYSPLIT with updated BlueSky
Operational HYSPLITHYSPLIT with updated BlueSky

Testing in Progress
18

Testing in progress• Emissions updates: testing
of oil and gas updates, testing of NEI 2014
• Ozone bias correction
• Extension of predictions to 72 hours
• Wildfire emissions: hourly from BlueSky, ECCC emissions
19
Western U.S. – July 2017
8h a
vera
ged
ozon
e [p
pb]
Observations
Operational model predictions
Testing of bias corrected predictions
Example PM diurnal profile for mixed forest
Testing of hourly changes in emission amounts and plume rise.

Ozone bias correction performance
20
CMAQ 8h Ozone Max
Bias Corrected 8h Ozone Max
Corrects under-prediction over California valleys but reduced ozone near fires East of San Francisco
Sept 2, 2017

Testing of predictions for 72 hoursevaluation for CONUS
21
Performance of predictions for days 1, 2 & 3 over CONUS for August 10-19, 2017 Pollutant Prediction day obs Bias RMSE corr, r
Daily max. of 8h average ozone
[ppb] (N=27300)
D1 39.0 2.58 9.65 0.75
D2 2.23 9.78 0.74
D3 1.76 10.14 0.71
O3 PM2.5
Daily average PM2.5 [ug/m3]
(N=18560)
D1 10.61 1.55 10.32 0.59
D2 0.92 9.88 0.58
D3 0.76 10.28 0.53
Stat
istic
s fo
r all
hour
s

Testing predictions for 72 hours evaluation for Pacific Southwest
22
O3 PM2.5
Day1,2,3 Performance over Pacific Southwest (region 9) for August 10-19, 2017 Pollutant Obs Bias RMSE corr, r
Daily max of 8h ozone (N= 4620) D1 49.7 -0.30 11.15 0.77
D2 -0.72 11.40 0.77
D3 -1.53 11.91 0.75
Daily average of PM2.5 (N= 2875) D1 11.6 1.98 10.52 0.46
D2 0.03 8.65 0.40
D3 0.53 9.59 0.38
Stat
istic
s fo
r all
hour
s

Emissions updates: oil and gas sector
23
2014 Energy Information Administration on Shale Plays
Adjustment factor applied to NEI2011 oil and gas area source sector
Testing of State-specific scaling for Oil_n_Gas area source• July 11-21 sensitivity run
confirmed that Marcellus area O3 increased
• Under-prediction in O3 in the Marcellus area was reduced
• However the over-prediction in O3 elsewhere was exacerbated

Partnering with AQ Forecasters
Focus group, State/local AQ forecasters:
• Participate in real-time developmental testing of new capabilities, e.g. aerosol predictions
• Provide feedback on reliability, utility of test products
• Local episodes/case studies emphasis
• Regular meetings; working together with EPA’s AIRNow and NOAA
• Feedback is essential for refining/improving coordination
Examples of AQ forecaster feedback after emissions update in 2012:• In Maryland, NOAA ozone predictions have
improved since 2011: significant improvement in false alarm ratio (FAR) with some decrease in probability of detection (POD). (Laura Landry, Maryland Department of the Environment)
Evaluation in June 2017:• Received recommendation to implement
system upgrade as proposed from AQ forecasters from Virginia, Connecticut, North Carolina, Texas, Washington and Maryland.
24
Based on forecaster needs currently testing extension of ozone and PM2.5 predictions from 48h to 72h

Web services
Examples of ozone, smoke and dust predictions in web enabled map servicehttps://idpgis.ncep.noaa.gov/arcgis/rest/services/NWS_Forecasts_Guidance_Warnings
25
1 hr surface dust
8 hr average ozone
1 hr surface smoke
Summary and plans
US national AQ forecasting capability:• Ozone prediction nationwide; updated to CMAQ version 5.0.2 and new Bluesky
• Smoke prediction nationwide; updated with newer BlueSky system
• Dust prediction for CONUS sources
• PM2.5 predictions; include wildfire and dust emissions, dust LBCs from global predictions; refinement of bias correction using KFAN approach
Current testing and plans:• Extension of CMAQ predictions to 72 hours
• Emissions updates (NEI 2014 including oil and gas sources)
• Ozone bias correction
• Wildfire smoke inputs: hourly evolution from BlueSky for CONUS and ECCC for Canada
• Update display, dissemination and web presence for PM2.5 predictions
• Finer resolution and inline with meteorology (longer term)
26

Acknowledgments:AQF implementation team members
Special thanks to previous NOAA and EPA team members who contributed to the system development
NOAA/NWS/OSTI Ivanka Stajner NAQFC ManagerNWS/AFSO Jannie Ferrell Outreach, FeedbackNWS/OD Cynthia Jones Data CommunicationsNWS/OSTI/MDL David Ruth NDGD Product DevelopmentNWS/OSTI Sikchya Upadhayay Program SupportNESDIS/NCDC Alan Hall Product ArchivingNWS/NCEP
Jeff McQueen, Jianping Huang, AQF model interface development, testing, & integrationJun Wang, *Sarah Lu Global dust aerosol and feedback testing *Jack Kain, *Eric Rogers, NAM coordination*Hui-Ya ChuangHo-Chun Huang Smoke and dust product testing and integrationRebecca Cosgrove, Steven Earle NCO transition and systems testingAndrew Orrison HPC coordination and AQF webdrawer
NOAA/OAR/ARLPius Lee, Daniel Tong, Tianfeng Chai CMAQ development, adaptation of AQ simulations for AQFLi Pan, Hyun-Cheol Kim, Youhua TangAriel Stein HYSPLIT adaptations
NESDIS/STAR Shobha Kondragunta Smoke and dust verification product development
NESDIS/OSDPD Liqun Ma Production of smoke and dust verification products,
Mark Ruminski , John Simko HMS product integration with smoke forecast tool
EPA/OAQPS partners:
Chet Wayland, Phil Dickerson, Brad Johns, John White AIRNow development, coordination with NAQFC
* Guest Contributors27

Operational AQ forecast guidance atairquality.weather.gov
New web site: https://www.weather.gov/sti/stimodeling_airquality
Ozone productsNationwide since 2010
Dust ProductsImplemented 2012
PM2.5 productsImplemented 2016
28
Smoke ProductsNationwide since 2010

Backup
29

Improvements in ozone predictions in Eastern U.S.
Previously operational
Current operational Current operational CMAQ V5.0.2showed a great improvement over previously operational model for August 18, 2016 case
µg/m3
30
ObservationsOld operational modelState-NOx adjustment with new NAMGrid NOx adjustment with new NAMNew operational model with no NOx adjustment and new NAM

Statistical performance for Ozone(Aug 2016)
31
Eastern U.S. Western U.S.
Fraction correct
Mean
ObservationsOld operational modelState-NOx adjustment with new NAMGrid NOx adjustment with new NAMNew operational model with no NOx adjustment and new NAM

La Tuna Fire in California (September 2017)
Current operational PM2.5 captured the La Tuna fire in Verdugo Mountains in Los Angeles, California which caused more than 300 homes to be evacuated.
32

Next Generation of AQ display/distribution on the Web
33
• Uses a PostgreSQL Database with PostGISextensions to manage data
• Open Geospatial Consortium (OGC) Web Mapping Service (WMS)
• Possible expansion of NWS XML/SOAP Services to include Air Quality Data
• Uses Open Layers with a ESRI Map Background
• Very Interactive – zoom and roam/data interrogation
• Faster data refresh• Mobile device support
Benefits/Improvements