national association of farm broadcasting - ttu · community and is often the emcee at grower...
TRANSCRIPT

National Association of Farm Broadcasting

Harvesting the Power of Farm Broadcasting
Table of Contents
Chapter One . . . . . . . . . . . . . . . . . . . . . . . . . . . . . . . . . . . . . . . . . . . . . . . . . . . . . . . . . . . . . . . . . . . . . . . . . . . . . 1 The History of Farm BroadcastingChapter Two . . . . . . . . . . . . . . . . . . . . . . . . . . . . . . . . . . . . . . . . . . . . . . . . . . . . . . . . . . . . . . . . . . . . . . . . . . . . . 3 The Role of a Farm BroadcasterChapter Three . . . . . . . . . . . . . . . . . . . . . . . . . . . . . . . . . . . . . . . . . . . . . . . . . . . . . . . . . . . . . . . . . . . . . . . . . . . 4 Basic Radio FactsChapter Four . . . . . . . . . . . . . . . . . . . . . . . . . . . . . . . . . . . . . . . . . . . . . . . . . . . . . . . . . . . . . . . . . . . . . . . . . . . . . 7 PromotionsChapter Five . . . . . . . . . . . . . . . . . . . . . . . . . . . . . . . . . . . . . . . . . . . . . . . . . . . . . . . . . . . . . . . . . . . . . . . . . . . .10 Writing for RadioChapter Six . . . . . . . . . . . . . . . . . . . . . . . . . . . . . . . . . . . . . . . . . . . . . . . . . . . . . . . . . . . . . . . . . . . . . . . . . . . . .12 The Farmer Demographic & Farm SegmentsChapter Seven . . . . . . . . . . . . . . . . . . . . . . . . . . . . . . . . . . . . . . . . . . . . . . . . . . . . . . . . . . . . . . . . . . . . . . . . . .15 Purpose of Advertising & The Decision Making ProcessChapter Eight . . . . . . . . . . . . . . . . . . . . . . . . . . . . . . . . . . . . . . . . . . . . . . . . . . . . . . . . . . . . . . . . . . . . . . . . . . 17 Defining The Market & Awareness BuildingChapter Nine . . . . . . . . . . . . . . . . . . . . . . . . . . . . . . . . . . . . . . . . . . . . . . . . . . . . . . . . . . . . . . . . . . . . . . . . . . .19 Media Use by FarmersChapter Ten . . . . . . . . . . . . . . . . . . . . . . . . . . . . . . . . . . . . . . . . . . . . . . . . . . . . . . . . . . . . . . . . . . . . . . . . . . . . .22 Farm Media Research StudiesChapter Eleven . . . . . . . . . . . . . . . . . . . . . . . . . . . . . . . . . . . . . . . . . . . . . . . . . . . . . . . . . . . . . . . . . . . . . . . . 27 Preparing a Media PlanChapter Twelve . . . . . . . . . . . . . . . . . . . . . . . . . . . . . . . . . . . . . . . . . . . . . . . . . . . . . . . . . . . . . . . . . . . . . . . . .36 Resource Guide for Planning and Executing Agricultural Radio Media Buys

1National Association of Farm Broadcasting
Chapter 1The History of Farm Broadcasting
The Beginning of Farm Radio
Broadcasting information to farmers started just after the invention of the AM radio. WHA in Madison, Wisconsin began broadcasting weather reports in January 1921. Two months later, James A. Bush, a Tuscola, Illinois grain dealer, put WDZ on the air to bring five minute grain market reports to his grain dealers and farmers. A few months later, KDKA in Pittsburgh, Pennsylvania put Nelson Gilpin, assistant editor of the National Stockman & Farmer, on the air to report markets. By 1922, the USDA reported that 36 stations had been licensed by the Commerce Department, and 35 of the 36 had been approved to broadcast USDA markets. In the 1920s, numerous stations were licensed and built to broadcast to the farm and rural areas of the country.
An example of the desire to initiate farm broadcasting is KFEQ, which was first licensed in 1923 to broadcast from Oak, Nebraska and later relocated to St. Joseph, Missouri in 1926. This move was facilitated and encouraged by the St. Joseph Stockyards and the St. Joseph Grain Exchange. KFEQ was one of the first stations to
initiate live remote broadcasts three times daily directly from the St. Joseph Stockyards and four times daily from the St. Joseph Grain Exchange. Farm radio was much more efficient and reliable than the telegraph or the telephone to distribute the market information to the area grain elevators and farmers.
Roots of the NAFB
The first full-time farm broadcaster was Frank Mullen with KDKA. He started after graduating from college in 1923. Mullen extended his broadcasting career in 1926 to NBC to found the first network farm program, “The National Farm Service Home Hour.” Mullen eventually retired as
Learning Objectives:• Describe how farm broadcasting got its start .• Identify important figures in farm broadcasting, such as the first farm broadcaster .• Describe how the NAFB grew into its present state .• Explain the functions of the NAFB .
Dix Harper WIOU, Kokomo, IN in 1948

2 Harvesting the Power of Farm Broadcasting
Activities/Discussion QuestionsDivide into small groups:
• Have each group research and come up with a farm broadcasting timeline starting in 1920 .
• As a class, make a large timeline and have each group contribute .
• Discuss the importance and impact of each event on the timeline .
executive vice president of NBC.
The 1930s saw more stations hiring full-time farm reporters. The USDA and land-grant college extension personnel were on the air with farm information. The idea for a national association for farm broadcasters grew out of a 1943 meeting of the Institute for Education by Radio in Columbus, Ohio. Farm broadcaster Larry Haeg called a meeting of 35 who attended the show and the idea for a national association was born. World War II interrupted the process, but in May 1944, the organization was officially formed and named the National Association of Radio Farm Directors (NARFD). The 1950’s brought awareness that members must generate advertising revenue for their stations to insure their employment, commercials started to be accepted in farm programs, and the farm broadcast service improved. In the 1950s, television stations were being built in increasing numbers and farm broadcasting took to the television screen. In 1955, NARFD became the National Association of Television and Radio Farm Directors (NATRFD) and 137 new farm broadcasters joined to bring the total membership to 500. The name changed in 1964 to the National Association of Farm Broadcasters, or NAFB. In 2005, the name was adjusted to National Association of Farm Broadcasting to be more inclusive of its diverse members. The NAFB has evolved into a dynamic trade organization with the following functions:
1. Market and promote farm broadcasting to the agricultural advertising community. Farm advertising revenue is the only economic support to provide this service to agriculture. NAFB has a sustaining effort to commission research to measure media use among farmers and ranchers as the total agricultural communications industry continues to evolve.
2. Provide a structure for farm broadcasting news distribution through the National Farm Broadcast News Service as well as other professional farm broadcast special events and services.
Ken Root broadcasting from the 2009 NAFB Convention

3National Association of Farm Broadcasting
Being a Farm Broadcaster
The farm broadcaster, or farm director, is the center of agricultural knowledge at any radio or television station. Farm broadcasters are established communicators in and for the agricultural community. They often serve a dual role in communicating not only to farmers, but also relating the agricultural perspective on food and environmental issues to the consumer. They communicate the news of agricultural science, technology, food safety, and environmental conservation and security.
Farm broadcasters are knowledgeable about both the agricultural issues that are important in their geography as well as the informational priorities of the entire agricultural community. The local farm broadcaster is highly visible in the agricultural community and is often the emcee at grower meetings and other commodity events. Farm broadcasters are also active communicators with consumer educational events sponsored by agricultural commodity organizations such as the local or state beef council, pork council, or others. Farm broadcasters are uniquely positioned to be advocates for agricultural producers and the products they produce for the world. Research conducted in 2008 documented that 44% of listeners in rural America could name their farm broadcaster.
The farm broadcaster is the point person within the station or network and plays a key role in providing marketing and promotional opportunities for agricultural advertising clients. Farm broadcasters facilitate many programming and sales promotions at their stations or networks and interact with their station or network sales representatives and agricultural advertisers. Farm broadcasters attend and broadcast from numerous field days, demonstration plot tours, farm shows, fairs, and other local, state and national agricultural conferences and convention events. The farm broadcaster is often the only local communications link between the agri-marketer and the farmer or rancher and is respected for his or her knowledge and communication skills.
Most professional farm broadcasters are members of the Broadcast Council of the National Association of Farm Broadcasting. In order to be a Broadcast Council member and receive the right for them and their employer to display and use the official NAFB logo, a farm broadcaster must demonstrate a certain level of commitment to the farm broadcasting profession. They must personally voice audio or video on a daily or weekly basis designed to serve agricultural audiences and must be employed by a commercial broadcast entity.
Chapter 2The Role of a Farm Broadcaster
Activities/Discussion Questions• Ask a local farm broadcaster to guest lecture to the class .
• Have students individually prepare a list of five questions to ask the broadcaster and have each student ask at least one question .
• Students should take enough notes so that they will be prepared to write a two page paper on the role of a farm broadcaster .
Learning Objectives:• Identify the roles of a farm broadcaster .• Explain the role a farm broadcaster plays within a station or network operation .• Recognize the requirements for membership in the NAFB .

4 Harvesting the Power of Farm Broadcasting
FormatsAM – Amplitude Modulation
We will not attempt to address the electronic parameters or the technical components of an AM radio station other than to state that the physical capability of an AM station to deliver a geographical coverage area is determined by the frequency (position on the dial) and the generator’s power wattage. Ground conductivity of the transmitter site is also an important factor in determining the coverage area. The authority to operate a station at a given frequency and power is strictly regulated by the Federal Communications Commission (FCC). In general, the lower the frequency of the dial position, the less wattage of power is required to cover a given area of geography.
Example: KYYZ, 560 on the dial, with 5000 watts of power and a non-directional antenna covers an area almost the size of Iowa; however, if it had 1590 as a dial position and 1000 watts of power, expect the coverage to be inside a 50 mile radius. After sunset, AM signals can “skip” when the upper atmosphere cools as the long wave length of the signal can be received in extended geography. There are several FCC regulated classes of AM stations with a wide range of potential geographic coverage. Every station has a unique coverage pattern.
FM – Frequency Modulation
The variable for FM stations is antenna height above average terrain and power wattage. FM signals rely upon line of sight signal reception. It is the height of the transmitting antenna and the wattage of generated power that determines the
coverage area. The frequency position has little, if any, bearing on the station’s coverage area. The FCC authorizes and regulates the transmitter tower height and location. Example: A Class C FM station with the antenna at the top of a 1000-foot tower and generating 100,000 watts can expect a coverage radius of about 75 miles.
Programming
The most common format of an AM farm broadcast station is news talk and is often based on news, entertainment and sports. The second most common format for either AM or FM stations that provide farm broadcasting is country.
Farmers listen to every station format, and they are very aware of when farm programming is broadcast. They have their favorite station regardless of format, especially when an NAFB farm broadcaster is delivering the agricultural information. Farm programming is delivered in a variety of ways tailored to the specific station’s format. Many stations continue to devote one hour or more to farm programming blocks
Chapter 3Basic Radio Facts
Learning Objectives:• Provide a definition of AM and FM radio .• Describe different formats used for farm broadcasting stations .• Describe different types of farm programming .
A broadcaster interviews a Minnesota FFA member at the National FFA Convention

5National Association of Farm Broadcasting
segmented into various program features such as weather, market news, commentary and agricultural news. Many independent farm broadcast stations as well as station affiliates of NAFB farm broadcast networks provide a program menu of two to four minute farm market and farm news reports numerous times daily. Farmer listening patterns are learned habits that have been established and sustained over long periods of time. There is a predictable expectancy by the farm listener to his radio station or stations. Farm programming segments of 30 minutes or more in early morning and mid-day time periods are an indicator of the commitment of the station to farm programming and the economic value of the farm audience to the station’s economic viability.
Farm Networks and Farm Radio StationsBy Gene Millard, NAFB EMERITUS
The primary driving factor of whether a station employs a farm broadcaster is economic. The considerations would include the value of the farm audience and its advertisers contributing to the total economic strength of the station; the value of the commodities produced in the primary coverage area; potential for farm advertising revenue; a local sales person(s) qualified to service the agricultural audience; a farm broadcaster capable of facilitating relationships that can build revenue; and the potential for advertising revenue to be enhanced from local, regional and/or national agricultural advertisers. When all of the above factors translate into a positive valuation, many stations find it desirable, profitable and sustainable for the long term to employ a person dedicated to farm broadcasting. The reality is that radio broadcasting is business and must have a breadth of relationships to return a reasonable return on investment.
There are literally thousands of radio stations that have a segment of their audience focused on agricultural issues, but if that segment is a minor part of their total audience or revenue profile, then sometimes the station simply cannot justify a staff position to focus on farm programming or marketing. Many stations
with limited geographic coverage simply do not have enough agricultural economic value within their individual coverage area to be an attractive advertising investment for a regional or national agricultural marketer, thus limiting their revenue resource opportunity. This vast array of stations provides opportunity for an NAFB network to provide farm programming content and a variable amount of marketing or revenue assistance. There are no two networks that are alike. Networks design their affiliate agreements in various ways to reach a complimentary relationship between the network and the affiliated station. For example, some networks purely barter for commercial time on the affiliated network station, some networks barter commercial time only within their provided network programming, some networks provide some type of compensation to affiliated stations, and some networks work closely with affiliated stations to assist the stations in their local agricultural marketing revenue efforts. The network and the affiliated station must receive an acceptable value for the relationship to be sustained.
Primary Strengths of an Individual Station to Employ a Dedicated Farm Broadcaster
1. The opportunity to be totally engaged with the local/regional agricultural community to provide communications to and for all agriculture producer organizations, associations and marketers.
Many farm radio networks provide a menu of ag news and market programs to a diverse list of affiliated stations

6 Harvesting the Power of Farm Broadcasting
2. Provide extensive educational and marketing assistance to the station’s sales staff to enhance local and regional revenues.
3. Be the dependable, reliable, credible source of information that impacts the lives and sustainability of the producers within the station’s listening area. A true farm broadcaster is much more than a commodity market screen reader; there is a personal relationship that evolves by being relevant to the target audience.
4. Provide leadership in communicating agricultural issues to the “non farm”/consumer audience. For example: When a radical group attacks mainstream agriculture, the local farm broadcaster can be valuable as a proactive and positive participant to spread the message of animal agriculture.
Primary Strengths of a Farm Network
1. The ability to deliver farm programming in a format that can be inserted into local programming at no or minimal cash cost to the
Activities/Discussion Questions• Arrange student tours of a local radio or television station .
• Divide students into groups and send the groups to different stations if permissible .
• Have students take notes on each station’s audience, music interests, shows, and the formats used by each station .
• Have each group present what they learned to the class .
station.
2. The ability to utilize various modes of technology to deliver programming to the stations in a manner that is low cost and low labor to the station. For example, direct satellite feeds integrate into the station’s automated system, or programs can be downloaded from a website when it is convenient for the station. Network programming delivery has evolved significantly in the current deployment of digital technologies and is being employed in a variety of ways.
3. A network can leverage the combined geographic areas of its affiliates into a viable marketing area for regional or national marketers and advertisers to generate revenue for the network.
4. The network may be capable to employ multiple farm broadcasters where each individual farm broadcaster may focus on specific segments of agriculture either by commodity or geographic area of the network.
Farm networks and individual farm stations each have their own strengths and weaknesses. The farm network has the challenge of trying to be everywhere in a wide geography and limited ability to be engaged on a personal level with local producer organizations, associations or local advertisers/marketers.
Farm broadcasters provide the best agricultural information to the listeners in their particular geography

7National Association of Farm Broadcasting
What are Promotions?
Promotions are a great way to create awareness about a product in combination with or without traditional advertising. Promotions add value to the advertising dollar. In this chapter, three radio stations and/or networks explain the promotions they have conducted with advertisers.
Many of the farm broadcasters at NAFB radio stations and networks have developed unique ideas for farm promotions that generate revenue. Opportunities include events like May Beef Month, June Dairy Month or National Ag Week with listener prize giveaways and trivia contests, special sponsored news reports, or paid remotes featuring area farmers and/or agribusinesses. Several NAFB stations also organize farm lunch promotions during spring planting, provide paid reports during harvest or have even developed annual tractor rides in their area that generate sponsorship opportunities.
Examples of PromotionsNorthland Ford Truck Giveaway – WNAX, Yankton, SD
WNAX Radio in Yankton, South Dakota annually conducts the WNAX/Northland Ford Truck Giveaway. The Northland Ford dealers provide a new pickup truck for the annual giveaway in return for a set amount of promotional plugs. During September through early January remote broadcasts are sold to livestock auction barns and other businesses in which listeners can sign up to win one of 57 keys that may start the truck. Those finalists must attend the live final giveaway at the Dakota Farm Show in Vermillion the first week of January.
In the spring WNAX also organizes a “Seed a Section” contest. The station partners with a seed company to run a listener promotion. During each weekday of the four week promotion, the station highlights a different hybrid or variety that is announced several times a day during farm programming. If, at the end of the day, a listener is a selected caller and can name the seed of the day
Chapter 4Promotions
Learning Objectives:• Describe what a promotion is and how it can benefit a station .• Explain what co-op advertising is and how it works .
Promotions can be a fun way to promote a station or a product(Photo courtesy of Michelle Rook, WNAX)
Promotions can help with station recognition and loyalty

8 Harvesting the Power of Farm Broadcasting
they win 20 acres of seed. At the end of the four weeks the station has given away a whole section of seed.
Information provided by Michelle Rook of WNAX
Harvest Lunch – Red River Farm Network (Minnesota and North Dakota)
Lunch is delivered to the field (spring planting, fall harvest, or anytime) twice a week for five weeks. Farmers are invited to call in and register with the receptionist. Lunch consists of 10 Subway sandwiches and a 12 pack of Pepsi. Monday and Wednesday mornings at 7:30, a name is drawn and the winner is called. The broadcaster chats on the air with
the winner about their harvest progress and gets directions to the winner’s field/farm. Tuesdays and Thursdays (the following day) the lunch is delivered to them at the field (or their farmstead). Subway has the sandwiches and condiments prepared to pick up an hour before. Sponsors are Farm Credit Services and Subway. Farm Credit Services is notified of the winners and often had an FCS officer join the station in the field. FCS often shot photos and used them in their newsletters. This promotion generated excellent revenue, prize cost was very modest and the public relations value exceptional.
Information provided by John Vasichek of Red River Farm Network
Farm Babe Buckets – Wisconsin Farm Report (Madison, WI)
The primary sponsor for this promotion was Kwik Trip convenience stores—known for their milk in a bag and fresh produce. The station picked different Kwik Trip locations to appear at for two hours during afternoon drive time. They would announce the location for that day only shortly before arriving. If people purchased a bag of milk, they were provided with a “Farm Babe Bucket” full of gift certificates and other assorted prizes. They had a limited number of buckets, which were sponsored by a local farm supply store. They were small, eight quart buckets so anyone could use them to water animals or wash windows. Several sponsors were involved with providing merchandise for the buckets.
The promotion was a great money maker with high visibility. People were lined up around the block before the station arrived to get their buckets – sometimes the store locations would actually be out of bagged milk before the station arrived. This was really visual for the clients involved and fun to see how fast an audience can respond.
Information provided by Pam Jahnke (a.k.a. The Farm Babe), Wisconsin Farm Report
There are many other great promotions that have been developed at NAFB member stations and networks all over the country. Contact your local NAFB farm broadcaster for more information.
Creating a good promotion can be challenging, but the results can be rewarding
Co-op advertising can be a cost-effective way to help promote a business

9National Association of Farm Broadcasting
Activities/Discussion QuestionsDivide into groups and complete the following tasks:
• Develop an idea for a new promotion and a plan to carry it out that would work for a local agricultural dealer and station in your area .
• Present your idea to the class using a presentation that includes a sample of your ideas, such as a poster, commercial, or flyer .
• Brainstorm about how co-op advertising might work for agricultural dealers in your area and what suppliers or distributors they might work with to develop co-op advertising .
Co-op Advertising
Co-op advertising is a method to help share the cost of advertising with a manufacturer, supplier, wholesaler or distributor, where the manufacturer pays for part of the advertising. Co-op advertising is a great way to help offset the costs of advertising while still adequately promoting the business.
In exchange for paying for a portion of the ad, the manufacturer or supplier requires the ad to mention its product or business. When a grocery store advertises a certain brand of food, when a tire store features a famous tire in its ads, or when a carpet company features a certain carpet brand, you’re seeing co-op advertising at work.
This method of advertising is very lucrative for business owners because it allows them to reduce the cost of their current advertising or even advertise more. Plus, the manufacturer’s or supplier’s product is being further promoted.
The supplier usually has restrictions on certain words or phrases that might be included. Usually these rules are very simple and straightforward.
To get started with co-op advertising, first ask the suppliers if they have a co-op advertising program. Get a copy of the rules and follow them closely. If the rules are not followed, many suppliers will not cover their portion of the ad. Next, meet with a media sales representative. They will help create an ad that promotes the business and the supplier’s product. Keep excellent records. The media representative will send invoices that accurately detail when the ads ran and which ads were co-op. Finally, make sure the company gets reimbursed. The supplier or manufacturer usually has a form to complete.
Source: National Federation of Independent Business
Working with manufacturers to create and promote products with co-op advertising can pay off

10 Harvesting the Power of Farm Broadcasting
Writing for Radio
Writing for radio is slightly different from writing for newspapers or magazines; however, accuracy, conciseness, good storytelling and writing directly to your audience are still priorities. The first factor to consider before writing a radio script is the audience. Who will primarily listen to the radio station or network? Write the story so the primary audience can understand it. If the station’s audience does not typically have an agricultural background, additional explanation may be needed for terminology that the ag audience may consider common knowledge.
Radio reporting is fairly straightforward. Writing your script is very similar to writing for a print story. The difference is that your copy must be much simpler, and instead of quotes from your sources, you will use sound bites, which are portions of an interview edited out to tell the story.
Accuracy Above All
Just like any other form of reporting, there is no substitute for accuracy in radio. As a reporter, your job is to be as accurate as possible. Use the following techniques to improve accuracy:
• Double check your notes. If certain facts seem odd, call a different source to verify
• Read information back to your interview sources. They could have misspoke
• Read your story, then go back through your notes to make sure your copy matches your notes. We often mistype numbers or get information mixed up
• Once you have written your story, it is acceptable to ask your source to look over the
script to check for accuracy• If you are unable to verify information
yourself, attribute the information to the source that gave it to you
Gathering Information
Interviews are one of the most important way to gather information. Before you conduct an interview, it is crucial to prepare.
If you are unfamiliar with the subject, seek out information ahead of time through Internet searches, press releases or telephone calls. Learn about the interviewee’s experience on the subject. Then, make a list of questions. Make sure the interviewee understands the interview will be recorded and played on-air.
At the interview, ask open-ended questions so the subject may elaborate on the information they provide. Plus, open-ended questions yield better sound bites. Give the interviewee time to think and respond to your questions. Do not interrupt their answers. Once you have finished asking your questions, ask the subject if he or she would like to add anything else. Often, your best sound bites come from this question. Finally, double check your facts with the source.
Aside from interviews, there are numerous other locations to gather information. Your source’s or their organization’s website should offer figures and background details. In addition, search engines, news sites, databases, government reports, telephone books, wire copy and local newspapers can be excellent sources.
Information on government or educational
Chapter 5Writing for Radio
Learning Objectives:• Explain how writing for radio differs from other types of writing .• Explain the most important factors when writing for radio .• Describe ways to make radio writing more effective .

11National Association of Farm Broadcasting
websites is generally credible and unbiased. If you use information from other locations on the web, double check the information to ensure accuracy. In the Internet age, anyone can publish information, factual or not. In addition, check the date at the bottom of the web page. If no date appears, you should be leery of using the information as it may be outdated.
Radio Copy
Unlike print, radio cannot be re-read. There is no video to reinforce the image. There are no DVRs in radio. If the listener does not get the message the first time, there may not be a second chance to tell the story. Good, simple, clean copy is essential. Always use the K.I.S.S. method—keep it simple, stupid.
At the same time, descriptive words are important to radio reporting. You must help the listener visualize the story.
Use sound bites that help the listener understand the story or gain a better grasp of the source’s opinion. If possible, avoid using the source to quote statistics. Instead, use them to provide explanation and insight.
For example, instead of writing the following:SMITH: WHEAT PRICES FELL BY 32 CENTS YESTERDAY.
REPORTER: SMITH ATTRIBUTES THE DROP IN PRICES TO AN OVER SUPPLY OF WHEAT WORLD-WIDE.
Try this:REPORTER: WHEAT PRICES FELL BY 32 CENTS YESTERDAY. AG ECONOMIST JOHN SMITH PROVIDES AN EXPLANATION FOR THE DROP IN PRICES.
SMITH: I THINK THERE IS TOO MUCH WHEAT AVAILABLE IN THE WORLD RIGHT NOW, AND FLOUR MILLS SIMPLY ARE NOT BUYING WHEAT. IT’S A SIMPLE MATTER OF SUPPLY AND DEMAND.
Follow the inverted pyramid style when writing for radio. Lead with the most important information and follow with other supporting facts. You must immediately grab the listener’s attention so they will keep listening as it is very easy for a radio listener to change stations. Radio scripts are generally short.
Good radio writing goes back to knowing the audience. Would your audience most likely respond to a lead about the increasing price of food, or would your audience prefer to hear about weather conditions that impact the crop?
An example of a script targeted at wheat producers is as follows:
REPORTER: GOOD MORNING. WHEAT PRICES CONTINUE TO DROP ACROSS THE UNITED STATES. WHEAT CLOSED YESTERDAY AROUND THREE DOLLARS, AND ANALYSTS EXPECT THE TREND TO CONTINUE. AG ECONOMIST JOHN SMITH TELLS US WHY.
SMITH: I THINK THERE IS TOO MUCH WHEAT AVAILABLE IN THE WORLD RIGHT NOW, AND FLOUR MILLS SIMPLY ARE NOT BUYING WHEAT. IT’S A SIMPLE MATTER OF SUPPLY AND DEMAND.
REPORTER: TO ADD TO THE ISSUE, THE HIGH PLAINS IS SEEING A VERY GOOD WHEAT HARVEST THIS YEAR, FURTHER ADDING TO THE WHEAT THAT IS ALREADY IN SUPPLY.
YOUR GRAIN AND LIVESTOCK MARKET UPDATE IS NEXT.
Activities/Discussion Questions• Have students write a short radio script over an ag topic provided by the instructor .
• Students should research the topic and provide accurate information .
• Have the students read their script to the class .

12 Harvesting the Power of Farm Broadcasting
Farmer Demographics
The average age of farm operators increased from 55.3 in 2002 to 57.1 in 2007. Technology development and rapid adoption of new practices has been a driving force in shrinking the number of commercial farm units while increasing the total output. The average age of farmers has stabilized over the past 10 years after a gradual increase for the past 50 years. While the farmer or rancher’s physical maturity is a factor, it also describes the years of experience and depth of knowledge that has been acquired up to now. That experience and knowledge is required to remain viable in the 21st century.
An older member of the farm family probably recalls the depression of the 1930s, the post WWII boom, and the stresses of the 1950s and 60s. The 1970s were years of sharp inflation of land values and commodity prices, followed by the sharp deflation of values in the 1980s. There was general improvement in the economic health of production agriculture through the mid 1990s. In 1997, agriculture marked the start of another economic slide and the coming of the loan deficiency payment (LDP) years in the late 1990s and into the new century. The continual and dramatic economic swings have intensified the need for risk management in all sectors of production agriculture. There is no longer a typical or average farm with a house, a barn and a wife that stays home with the kids.
The number of farms as defined by the U.S. Census peaked at 6.8 million in 1932, by 1990 the number decreased to 2.2 million, and by 1997 the total number of farms declined to 1.9 million. The
number of total farms increased to 2.1 million by 2001, and to 2.2 million by 2007; however, you must look at the number in each gross income class to see the significant shifts that are taking place. The largest increase is in the number of small farms (less than $40,000 gross income) and an increase in the number of large farms (in the $250,000+ income category). The profit margin from farming has been under continual pressure; therefore many farm operators have opted for off farm income to support their lifestyle while others have aggressively expanded their farming operations with rapid adoption of new technologies in crop and livestock production that provided opportunity to grow production units without adding additional labor. The defining characteristic of each segment provides opportunities for agri-marketers. Farmers are home grown, in that they rarely relocated to a different county or state from where they grew up.
The capital requirement to enter farming or ranching inhibits a young person from simply
Chapter 6The Farmer Demographic & Farm Segments
Learning Objectives:• Describe what demographics are indicative of a typical farmer .• Report basic information about farms, such as typical increases and decreases, profit margins, and how farms are established .• Explain the differences between the three different farm segments (large commercial farm opera-tions, commercial farms, and lifestyle farms) .
The demographics of farmers and farm families are important when trying to pinpoint advertising and marketing

13National Association of Farm Broadcasting
starting up without the assistance of either family or a forward-thinking retiring farmer mentor. There is a lot of truth to the adage that if you want to get started in farming, the best way is to inherit it or marry it. Of course, there are examples of those who have succeeded through their own initiative and successful equity building. It’s important to keep in mind that to be in the full time commercial farmer group and generate a household income sufficient to sustain a modest or reasonable life style could require a minimum of $2 million of capital investment.
Historically agricultural producers earn less than a five percent average return on their capital investment. The business structure of commercial farms continues to evolve to accommodate the inter-generational transition of the farm to meet the financial and business requirements to be a successful and viable business. Family farms are often legally structure as family corporations such as C-Corporations, LLCs, or partnerships as extended family members join to participate in the farm’s operation. Research conducted in 2005 states that the average number of households per farm is 2.2. It also states that on farms with operators under age 40, the number of decision makers averages 2.8 per farm. While the number of commercial farm units is declining, the number of households, persons and decision makers per farm is increasing. Farm broadcasting serves these multiple decision makers and communicates effectively to this demographic target.
Farm Segments
The 2007 Census of Agriculture counted 2,204,792 farms in the U.S., however the definition of what it takes to qualify as a farm is only $1,000 in gross sales of agricultural production. Former Senator Bob Dole is quoted as saying (in jest): “The reason that farms are defined in this manner is to assure that there will be more farmers than employees at the United States Department of Agriculture.”
Statistics released in 2007 tell us there are only 116,286 farms with more than $500,000 in gross sales, plus another 240,873 that have gross sales between $100,000 and $499,999. The remaining 1.8 million farms have less than $100,000 in gross sales per year. Here, we categorize farm characteristics into three segments.
Large Commercial Farm Operations
(More than $500,000 gross income)
• Early adopters of new technologies• Capital intensive• Buys in volume and expects discounts• Utilizes outside consultants for accounting,
crop scouting and marketing services• Demands service from equipment dealers• Utilizes equipment leases and financing• Heavy consumers of information and media• Utilizes Internet for in-depth information and
product price information• Values relationships with professionals who
provide financing, insurance and legal services
Commercial Farms
($100,000-$500,000 gross income)
• Diversified in crops and/or livestock• Traditional media consumption of radio, print
and television• Holds a high equity ownership in farming
operation• Purchases with cash or uses traditional sources
for financingDifferent farm segments can drastically impact the delivery of a message

14 Harvesting the Power of Farm Broadcasting
• Invests in value-added opportunities• Values relationship with dealers and suppliers• Prefers to purchase equipment rather than
lease• Adopts technology to reduce labor
requirement• Owns more equipment per acre• Uses Internet for e-mail and information
gathering• Does not use price as the only consideration in
making a purchase• Purchases equipment or services to make job
easier• Values community relationships• May be nearing retirement (over age 65)• May be a young farmer beginning his farming
career (age 21-35)
Lifestyle Farms
(Under $100,000 gross farm income)
This segment represents a very powerful buying group but is perhaps the most diverse and largest number of people in the agricultural community. The USDA Census of Agriculture database established the income parameters for each class of farm based on farm income and not necessarily household income. While many farmers producing over $100,000 in gross farm income consider their primary occupation as a farmer they likely have supplemental off-farm family income to sustain their standard of living.
• Likely to raise livestock, especially cattle, sheep, or horses
• Often produces specialty niche crops or
Activities/Discussion Questions• Arrange for the class to take a tour of a local farm and meet with the owners .
• Have students prepare a report over what they learned at the farm, especially the difficulties present .
• As a class, discuss why it would be important for a farm broadcaster to be knowledgeable about farming and farm operations .
contract production of livestock• Generates off-farm income• Purchases with cash• Purchases equipment to enjoy as well as use
for utility• Values family, community and heritage• Values dealers and dealer services• Uses proven technologies• Uses the services of veterinarians and custom
applicators• Willing to pay for time saving equipment or
services• Less reliant on media for risk management
information
Farm segments can help you understand what farmers produce and how best to advertise to your market

15National Association of Farm Broadcasting
Chapter 7Purpose of Advertising & The Decision Making Process
Learning Objectives:• Explain the purpose of advertising .• Explain how advertising can be judged to be effective .• Describe how to properly utilize radio advertising .• Explain how producers use experience to judge advertising .• Describe testimonials and how they work .
Purpose of Advertising
The purpose of advertising has been debated for many years. However, in the pure form, the purpose of advertising is to create a favorable awareness for a product or service that stimulates or initiates a positive and intended action to generate sales for the advertiser’s product or service.
Effective advertising intrudes into the mental process of the prospect and exerts an influence filtered through the prospect’s experience. The desired result of this advertising is a movement toward a decision favorable to the advertiser. There must be a repetitive intrusion into the mind before the prospect will retain the necessary information to be convinced the advertised product or service fulfills his or her needs and then takes action to purchase.
The primary senses for consuming advertising are sight and sound. Each contributes to the thought process with various levels of informational or emotional impact, depending upon the creative production or concept developed by the advertiser.
The audio sense is very interesting to explore. The human voice is perhaps the most powerful and multi-dimensional communication vehicle for both information and emotional expression. Radio, which exists solely as an auditory stimulus, is a media that has the capability to extend the power of the human voice to wide distribution but remain personalized in reception. A broadcaster can be one-on-one to everyone.
Radio advertising can be used to communicate
urgency and do it with an emotional appeal. “Sale ends next week,” or “Insect alert, buy and apply your crop protection product NOW!”
Radio advertising creativity can also appeal to the intellectual gathering of data. Testimonials from satisfied customers build the confidence of the prospect. The emotional conductivity of radio is very strong and can instill high levels of recall when properly executed. Radio has been called “the theater of the mind” as you hear, absorb, filter and relate words and sound to create your own personal image. The human imagination can be nurtured with the audio presence of radio’s intrusive delivery.
Decision Making Process
To effectively influence a prospect to use or purchase the agri-marketer’s products or services, it is important to understand some of the process a prospect goes through in the decision making process.
Experience
Most decisions heavily rely upon past experience. Experience is a terrific teacher, and the vivid memory of past decisions is always in the mix of making future choices to stay with a product or service that met or exceeded expectations. There is always a reference point for comparison with the evaluation of any new product or service. This new information is continually being filtered through the prospect’s experience in their mind. Is the new product really “new and improved”? Will a decision to change increase profit potential, improve efficiencies of the operation, or improve the family’s lifestyle? These questions should be

16 Harvesting the Power of Farm Broadcasting
considered in developing the creative message in marketing any agricultural product or service.
Information Gather & Awareness Building
Farm and ranch operators are heavy consumers of information from many sources. They not only rely on their own experience, but also seek the experience of other influence groups. Farmers hold a sense of pride in their operation and openly share their experience with their neighbors. While most spend very little time in a coffee shop or lounging around the local co-op, there will rarely be a time when there is not an opportunity to learn from their neighbors. “Why did their neighbor’s field look so good (or so bad)?” “How do you like that new combine or tractor?” “How did your demonstration plot turn out?” In marketing terms we would call these testimonials.
Person to person communication is the most powerful medium. Many are eventually influenced by positive testimonials, but negative experiences travel at the speed of light. Testimonials can be utilized effectively in delivering a marketer’s advertising message in print or radio. Testimonial advertising can be very useful to establish credibility to the advertiser’s message with the target.
The effective communication power and credibility of the person-to-person voice can be an effective tool in utilizing the sensory system of the audio listener.
The voice of the farm broadcaster has won trust from the producer who relates to the broadcaster on a daily basis. Often this relationship has
been solidified over years of acquaintanceship and personal contact. The success and proven technique that is employed in good farm broadcasting makes farm radio a one-on-one delivery system for both information and entertainment. Farm radio broadcasting is totally different. The style is personal in delivery and reception. Listeners trust the farm broadcaster.
Suppliers, dealers, and field representatives are valuable sources of information for agriculture producers and can often influence their buying habits. Dealers and company field representatives are a part of the producer’s community and consume media in a very similar manner to the producer. Dealers may often hear what another competitive dealer is offering as the testimonials from producers through radio advertising.
Activities/Discussion QuestionsDivide the class into groups .
• Have students create a radio advertisement for an agricultural product in your area .
◊ Consider the following: Who is the target audience, what must be done to appeal to this audience, and what testimonials would be most appropriate?
◊ Where does the farm broadcaster fit into the decision making process of a producer regarding advertising?
• Present the completed advertisement to the class .
The trust people feel for their farm broadcaster can have a big impact in an advertising campaign

17National Association of Farm Broadcasting
Chapter 8Defining the Market & Awareness Building
Learning Objectives:• Recognize target areas for an agricultural marketer .• Describe factors used in determining targets for an agricultural marketer’s message .• Explain how to create and build awareness .• Describe various media used to deliver messages .• Identify types of people who may exert an influence on targets .
Defining the Market
Each crop and livestock enterprise has areas of geographic concentration and can be identified by utilizing the U.S. Census of Agriculture. Individual state statistical information is updated regularly. While it may be easy to rank a commodity such as corn or soybeans by state, there are many smaller production areas that may be just as important for a marketer. Crop acres and livestock numbers are tabulated on a county-by-county basis in all states.
There are many factors to consider in determining the target geography for an agricultural marketer’s message. They include, but are not limited to:
• Distribution of the product or service• Product sales potential in terms of acres for
seed, crop protection products, livestock type for animal health product application, or others
• Specific geographic adaptation or regulatory approval zones*
• Company marketing goals and objectives• Competitive position or market share in a
competitive market area• Strategy to support sales
*Crop protection products requiring regulatory approval by the EPA, USDA or a state department of natural resources are often given restrictions for product use for specific geographic areas where environmental conditions may permit or prohibit their use.
The agricultural marketplace is very dynamic
in terms of adoption of new products and technologies, and it aggressively consumes information to evaluate the values for their specific farming operation. For example, biotechnology manufacturers and marketers of crop production biotechnologies are developing and marketing new and improved products that producers are integrating into their farming operations. This is a very capital intensive process, and the investment by producers represents hundreds of millions of dollars for agricultural marketers. Farm broadcasting offers the unique ability to communicate the values of these new technologies to deliver the marketers advertising communications.
Awareness Building
The first mission for advertising is to create or build awareness. It’s logical to assume that behavior is not altered until there is a conscious awareness of a new or different opportunity. Business purchases or investments are especially sensitive to credible information and may require more frequency to effectively impact the purchase decision as compared to a consumer product.
To be motivated to explore the opportunity to purchase a $100,000 tractor is significantly different from choosing between McDonald’s or Burger King. Today’s advertising communication message is delivered through more mediums than ever and is far more intrusive than the old reliable outdoor billboards. To reach the farmer, you must understand his daily lifestyle and how and why he allocates and prioritizes his time for media use. The daily need to be informed on the factors that affect his economic health is a very high priority in

18 Harvesting the Power of Farm Broadcasting
a business that is influenced by so many variables. Farmers listen intently to weather reports, market prices and analysis of market conditions and trends. Media consumption of information may be used for immediate decisions or may be utilized to plan future decisions, including the purchased products or services. Risk management considerations are ever present. The farmer operates in an extremely volatile environment and weighs each decision on the scale of upside potential versus downside risk. Farmers also have an extended family (wife, father, son, daughter, brother, etc) which often exerts an influence on purchase decisions that affect the business plan and lifestyle priorities. Others, including bankers, commodity consultants, suppliers, dealers and neighbors also exert an influence.
These influencers often share media priorities and media consumption for mutual business or lifestyle purposes. Media options to reach all these individuals may not be as difficult as it appears. They all have a common desire for credible information to make value-based decisions and are therefore attracted to the same media sources with various levels of consumption intensity. The primary medium to be addressed in this text is farm radio. However, television, magazine, and Internet are also components in the farmer’s or rancher’s media consumption.
A new aspect of awareness building that deserves consideration is social media. Social media is free and occupies a significant portion of the current public consciousness. Services such as Twitter and Facebook can help one company or individual push information to hundreds or thousands of individuals beyond their immediate reach, usually utilizing other people to
spread the informational along in a viral fashion.
Some communications professionals are hesitant to use social media because information is difficult or impossible to withdraw once placed online, but correct usage can be a low-cost and effective way to increase attention. Some organizations seek to increase public awareness of agriculture through the usage of social media, and other organizations aid farmers and other individuals in becoming more aware of and comfortable with social media. Some organizations help farmers become more accustomed to posting on social media websites and creating Internet presences for themselves and their operations. As social media and the Internet continue to evolve, it is important for agriculture communication professionals to stay caught up with the current trends.
Each medium is extensively consumed and each provides a conduit for information and entertainment as well as marketing and advertising communications. Farm radio is perhaps the most personal, widely available and deeply embedded in the agriculture producer’s business and personal lifestyle.
Activities/Discussion Questions• As a class, define the market(s) in your area .
• What is the message an agricultural marketer would use? Is it on target in your area?
• How could the message be altered to better fit the market?
• What types of media are used in your area?
• How could farm radio be better utilized to create awareness?
Determining which media farmers use the most can help with advertising and marketing

19National Association of Farm Broadcasting
Chapter 9Media Use By Farmers
Learning Objectives:• Describe how often producers choose to listen to farm radio .• Explain the role of farm radio broadcasters in agricultural communities .• Identify other types of media and how they are used by farmers .
Farm Radio
The 2008 NAFB Wave Study, a three-wave survey designed to measure media use among agricultural producers, found that radio is the most used source of daily agribusiness information, with 29% of producers tuning in daily. Radio is also seen as the leading daily source of unaided, top-of-mind agribusiness information and is the highest used medium among young producers.
Producers depend on ag media, especially radio, to obtain information about topics such as weather, markets, ag news, ag commentary, and local events. There is a trust factor that is unique to the personality of radio as a medium--farm radio listeners know and trust their farm broadcasters. Sixty-six and a half percent of all producers listen to a specific farm broadcaster, while 68.9% of younger producers choose to listen to a specific farm broadcaster. Producer listening overall remains very strong, with producers listening 5.52 days perk week on average, or 6.36 days for listeners that live on the farm, and they listen to the radio 2.9 hours per day, with 1.3 of those hours devoted to agricultural information.
‘Radio days’ in the tractor are now even longer with the usage of GPS technology, and radio remains the preferred medium across all seasons—the three-wave study showed that radio was preferred even over television in winter, spring, and fall.
Farm Radio Broadcasters
The vast majority of full-time professional farm broadcasters are members of the National Association of Farm Broadcasting, widely known as NAFB. The history of this organization and the
evolution of farm broadcasting are discussed in an Chapter 1. NAFB broadcasters use the unique strengths of audio technology to communicate with the farm and agricultural community. Farm broadcasters are a daily part of the fabric of the agricultural community at the local and regional level. The Farm broadcaster is a narrowcast specialist, knowledgeable about agricultural issues, informational priorities and local production and agribusiness conditions. Radio farm broadcasting is perhaps the only remaining local agricultural medium that delivers news to producers on a daily basis. Farm broadcasters are very visible at local, state, and national events and have a personal relationship with both their audience of agricultural producers as well as the business community.
Television
Television offers the advantage of using both sight and sound to deliver its message. Farm programming on television is broadcast primarily in the early morning hours and weekends; however, farmers are also consumers of other television programming for weather, news and
Farm radio is as important as ever for many farmers

20 Harvesting the Power of Farm Broadcasting
entertainment. While rating services such as A.C. Nielsen offer viewer ratings for television programs and day parts, the research is conducted to learn audience ratings by age and sex and does not address a demographic as specific as farmers. The probability of farmers being in the researched sample would be no greater than their numerical number as a percentage of the total population, which is less than five percent. Television ratings are conducted in areas called Designated Market Areas (DMAs) which are determined by the clustering of counties that have over 50% audience viewing from a specific city’s television station or stations. The television station’s home county is always in its DMA. The closest measure to estimate the farmer ratings of a television station’s programming would be to assume that the farmer’s viewing preference is similar to others of the same age and sex. Remember that the average age of farmers is 58; therefore, it is probably more accurate to use ratings for 35-64 age men than any other demographic to reach an estimate of farmers’ viewing. While a significant expense, most agricultural companies do not invest nearly as many dollars in the production costs of commercials as do other companies.
Satellite television dominates the farm television category, with 61.6% of producers using satellite television, 29.2% relying on antenna television and only 11.5% having access to cable television. Television programs focused on agricultural and rural topics have a loyal audience across all types of television access.
The PMA
Each station or the combined affiliated stations of a NAFB network may be defined as a Primary Market Coverage Area (PMA). A PMA may be smaller than the total signal coverage area of a station or combination of network-affiliated stations. The state and county selection for a PMA is determined by each station or network and the counties included in this geography are listed on each subscriber’s AMR ratings report.
The crop acres or livestock numbers in any given geography are significant factors in determining
the relative value of a station or network coverage area. Targeted farm advertising is quite different from consumer advertising in that the market in crop acres or livestock population has a very significant impact on the value of that specific market area. AMR ratings can give an indication of the efficiency of a station or network to reach a certain targeted crop or livestock count in a specific geography. Farms are highly variable in acre size, and in many states the geographic size of a county is also highly variable.
Therefore, to simply define a corn, soybean or cotton market by ranking counties in a state may not be as useful as determining the actual total acreage delivered by the radio stations and/or networks serving the targeted area. Radio station signals are not confined to county or state boundary lines. The total acreage and total farmers listening is a combination to determine the value of a farm station or network’s delivery area. The agricultural marketer may determine specific weighted geographies for specific marketing considerations that can be aligned with the best PMAs to be most effective in reaching the marketer’s objectives.
Print Media
Printed materials & magazines have been a traditional source of in-depth information on subjects that are of specific interest to the producer. Farm publications have evolved to increasingly specialized and targeted producer groups by demographics in both editorial
Understanding which types of media farmers use most can help you convey your message more effectively

21National Association of Farm Broadcasting
content as well as delivery to specific producers. There has been an evolution in the direction of general farm publications to an increased number of specific publications or editions to reach a specific producer demographic. An advantage of publications is they are long lasting and can be reviewed.
However, younger producers spend less time with print media, reading for only 1.9 hours per week as compared to the 2.4 hours per week spent reading by producers over 50.
Internet
The Internet is a growing source for in-depth information for agricultural producers. Farmers and ranchers are embracing this technology rapidly; however the access to high speed connections in rural areas continues to be an inhibiting factor to intensive or extended use of this new informational source.
More than half (65%) of producers now have internet access. Internet is the second most used source of daily agribusiness information behind radio, being used 22.5% of the time. Almost half (44.2%) of producers have access to high-speed Internet, with 22.3% still using dial-up Internet. However, 31% have no connection at all.
Producers use the Internet to search for topics and check e-mail, but also to access farm information and up-to-date weather information. Farm radio listeners who have high-speed Internet access are active online—75.2% go to websites as a source of daily agribusiness information, and 51.5% have sought information from a website after hearing ag information or programs on the radio.
Activities/Discussion QuestionsStudents need to individually find and listen to a farm broadcast or another example of farm-related media and use it to answer the following questions:
• Why is the chosen medium important to agricultural producers?
• What are some key points from the information conveyed?
• How would it affect producers if that type of medium was cut off? Examples should consider the topic of the item selected .
Younger farmers and those with higher income are more likely to have higher internet usage, and internet usage is becoming increasingly fragmented, with no specific sites or categories being most important to farmers.
Convergence
With smartphones such as the iPhone, Droid, and Blackberry offering access to the Internet even when in the tractor, the usage of radio, the Internet, and cell phone internet are viable 365 days a year.
Farmers use many kinds of media to receive messages daily

22 Harvesting the Power of Farm Broadcasting
Summary of Farm Media Research Studies
The common thread to be seen throughout all of the research presented in this chapter is that while communication technologies and the structure of farms and ranches have been continuously evolving and changing to meet business conditions, the desire for up-to-date information and a personal relationship between farm broadcasters and agricultural producers has been very consistent. Farm radio is easy to consume and is available in homes as well as in the mobile environment. Agricultural producers see radio as a true wireless technology that is accessible everywhere. Farm radio is intrusive and is free for listeners. Farm radio provides a positive environment and relationship that delivers the messages of individual advertisers in an atmosphere surrounded by credibility and believability.
Detailed market news and weather information on farm-directed programming creates a focused environment for commercial communication that is far more effective than an advertiser’s message being positioned in an entertainment environment.
Farm broadcasting, as a medium, is perhaps the most compatible with new technologies in creating awareness for agribusiness websites and e-commerce opportunities. Farm broadcasting stations and networks have aggressively developed their own presence on the Internet and provide valuable promotional links to information they broadcast as well as additional information, events,
and links to other agricultural organizations and websites. The frequency of promotion of a farm radio station’s website during their broadcasts can dramatically increase the traffic to the site for more in depth information or promotional opportunities.
The first quantitative farm radio listener ratings started in 1980 with research conducted by Doane Research, based in St. Louis, Missouri, and utilized the national Doane panel for the sampling base. The Doane Farmer Radio ratings reports provided a significant amount of quantitative measurement; however, the sample size did not allow the reports to display more than a rating for Class I farms. This sample size did not include enough respondents of a specific commodity production segment to generate a statistically accurate measurement for specific demographic groups beyond the Class I ($40,000+ income) farmer segment. The next farm radio ratings generation was conducted by NRECA using telephone survey methodology and a much larger sample size, which allowed for the segmentation of ratings based upon producer commodity segments as well as all Class I+ farmers. Ag Media Research (AMR) has been the successor to NRECA as the only firm that has developed the methodology and the computer software to enable subscribers to measure radio communication connectivity. This enhanced system provides agricultural advertisers and their agencies a valuable tool in formulating media plans. The AMR research provides average quarter hours from listening as well as average quarter hour farmer rating in hourly day-parts from 5 a.m. until 7 p.m. It also provides average ratings for segmented day parts. This not only
Chapter 10Farm Media Research Studies
Learning Objectives:• Describe radio usage and listening trends of farmers .• Describe current media usage of producers .• Predict future media consumption patterns of producers .• Identify information producers seek to obtain from media sources .• Identify what times of day producers pay closer attention to the radio .

23National Association of Farm Broadcasting
assists in the selection of the station or farm network with the most farmer listeners, but also provides guidance in day part selection for the most efficient delivery for each station or network being considered for an advertising schedule. More on how to use AMR as a media planning tool follows in a later chapter.
Media Use and Trends
The following pages are summaries of research studies that have been conducted over the past several years by industry recognized research firms. These research studies have been provided to the agricultural marketing community by the financial support of the stations and networks that are members of the National Association of Farm Broadcasting.
Brief Summaries of Selected Farm Media Research Studies Featured in this Chapter
2008 Media Use Research
This research, conducted by the NAFB in 2008, surveyed Class 1A farmers ($100,000+ in agricultural sales) to determine their media usage habits.
2005 Media Use Research
This research study focused on the changing structure of agricultural production and farm radio usage, as well as the use of Internet by agricultural producers.
2004 Media Use Research
The 2004 Media Use Research was conducted by Ag Marketing Research (AMR). The major focus to this media use study was to determine the seasonal use trends and to confirm the values that producers have for farm broadcasting.
2004 Rural Lifestyle Research
This test research was commissioned to better understand the media use of this growing segment of the rural/agricultural population.
2003 Media Use Research
The 2003 Media Use Research was conducted
by AMR in three separate intercepts at major agricultural events. This research was segmented into three distinct commodity groups to determine the divergence or similarity of these major producer segments in their use and values for farm broadcasting.
2008 Media Use Research
This study, a Wave Study, was conducted by Ag Media Research (AMR) and sponsored by the NAFB. A total of 2,412 telephone interviews were completed in three waves of approximately 800 interviews each. Waves were conducted in February, April, and September of 2008 to account for the seasonal nature of agriculture.
The research study determined the following:
Internet Use
• Internet access had greatly increased in the past 10 years
• However, almost a third (31%) reported having no Internet connection
• Slightly less than half (44.2%) had a high speed connection
• Fragmentation was occurring in website usage – no individual sites or categories were most important to farmers
• Age and income were deciding factors – higher income families and younger farmers (49 and younger) were more likely to use the Internet
More farmers are using the Internet and other new media

24 Harvesting the Power of Farm Broadcasting
Print Media Use
• Magazine use was strong, but recall was concentrated in only a few publications
• The top four farm publication entities were recalled by the majority (78.3%) of respondents
• About half (54.4%) of the respondents mentioned the most frequently named publication
• Overall time spent reading publications was similar to 10 years ago
• Seasonal reading amounts had changed; highest readership was in winter, and dropped off sharply in the fall
• Younger farmers (49 and younger) spent less time reading farm publications than those age 50 and up
• Producers averaged reading 3.4 publications per month, but over a third (36%) read two or fewer publications a month
Radio Use
• The younger generation of farmers relied more on their farm broadcasters for specific information
• In all seasons, younger farmers spent less time with magazines and television than older farmers and more time listening to radio
• Several groups listened to a specific farm broadcaster more often: younger farmers, those with higher incomes, and corn/soybean producers
• Weather, markets, and farm news were the primary radio programs of choice
Television Use
• Satellite television was in more than half (61.6%) of Class 1A farm homes, having increased from 47.3% a decade earlier
• Only 11.5% of farmers received their television from cable
• Slightly less than a third (29.2%) were still using a standard antenna
• The viewing patterns of farmers who watched television for farm information had changed dramatically
• The majority (88.9%) watched a specific channel for farm news
Most-Used Daily Sources
• Radio and television continued to be the leading media channels for daily information
• Radio was utilized by 62% of respondents, followed by television at 59.7% of respondents and websites at 45%
• Cell phone text messaging was used by only 14.2% of respondents
2005 Media Use Research
For this study, surveys were conducted in 12 midwestern states of only Class 1+ farmers.
• Farmers said the station they listen to provided the agricultural news, markets, and weather information they wanted
• Farm radio was a very important medium to get the information they needed
• Structural shifts have created multiple households in farming operations
• The majority listened to one or two stations during the day
• Slightly more than a third (39.1%) had some access to a high-speed Internet connection, while 22.5% had their own dial-up, 22.9% had their own high speed Internet, 22.9% did not have Internet access, and 13.8% had access but did not use it
• Two-thirds of the respondents identified they get specific information from a farm broadcaster
• About two-thirds (67.7%) of that group could name the farm broadcaster they get their information from
• Audio use from the Internet (streaming audio) was low, with only 20% of respondents utilizing this medium

25National Association of Farm Broadcasting
2004 Media Use Research
This information was gathered from the three AMR Intercept Study waves and a telephone sample of 500 Class I+ producers in 12 Midwest states.
• 54.1% of producers stated they increased their radio listening habits during the planting season
• 50.2% stated they increasedradio listening during harvest
• 32.2% stated they have increased their radio listening compared to five years ago
• 92.7% said that farm radio interviews of other producers were “interesting”
• 85.4% said that these interviews with other producers, such as harvest reports, were “useful”
• 90.2% have some kind of Internet access and visit an average of 4.9 websites per week
• Cattle producers listen 5.83 days per week• Corn/soybean producers listen 6.44 days per
week• Class 1+ farmers in 12 states listen 5.87 days
per week, compared to 6.1 days per week in 1999
• The overall average was seven hours and 25 minutes per week listening to farm radio broadcasting (compared to five hours and 30 minutes in 1999)
• 20.55 hours per week were spent listening to radio overall (compared to 20.3 hours in 1999)
• Radio use increased (while all other media use decreased) during the planting and harvesting seasons
2004 Rural Lifestyle Research
This research was conducted by AMR as commissioned by the NAFB in June-August of 2004. Two hundred telephone interviews were completed by persons that met the following
criteria: (1) lived on one or more acres of land, (2) in a normal year would have less than $40,000 in sales of agricultural products, (3) produce animals, crops and/or plants with a value of over $1,000, or (4) spend $1,000 or more on animal care, fence, seed and fertilizer, equipment, and fuel.
Results:
• Rural lifestyle farms are increasing in number (15% increase from 1997-2002 in the 29 county area of NE Iowa that was surveyed)
• Rural lifestyle farm residents are heavy users of radio Monday-Sunday.
• Almost all (93.6%) tune in to radio• Rural lifestyle farm residents prefer certain
radio formats: 71.5% prefer news/talk, and 65.5% prefer country
• Rural lifestyle farm residents mirror Class 1 farmers in program content preference: 87% prefer weather forecasts, 70.5% market reports, and 49% news that affects agriculture.
• The average rural lifestyle farm household is 2.6 persons
• About a quarter (23%) of rural lifestyle farm households have an income of over $75,000
• Men and women have virtually the same radio preferences, and both are heavy users of radio
Research is conducted to provide more accurate information to the agricultural communications industry

26 Harvesting the Power of Farm Broadcasting
2003 AMR Intercept Study Waves 1, 2, and 3 Combined
This is a combination of compilation of survey data gathered at the Beltwide Cotton Conference, National Cattleman’s Beef Association Convention and Commodity Classic in 2003.
Regarding the use of radio for various programs, 44.5% of overall respondents utilized radio to listen to crop or market reports every day, with 27.3% listening nearly every day. A large percentage (84.7%) listened to weather every day, with 10.4% listening nearly every day. Almost half (44.2%) listened to farm news daily, with 29.9% listening nearly every day. The majority (82.5%) stated there were times when they paid closer attention to the radio; for 65.6% this was to listen to weather, 55.5% listened more closely to markets, 42.9% listened more closely to farm news, and 11.4% listened more closely to sports.
Activities/Discussion QuestionsDivide into small groups and assign a research study to each group .
• Using the research provided, construct charges, graphs or images to describe results of each research study .
• After completion, compare similarities or differences between the studies .
• Did the studies produce similar results?
• What were they trying to find out?
When asked which media source they would choose if they were only allowed to access daily information from one kind of source, 35.4% chose radio, 21.8% chose DTN, 18.8% chose Internet, 14% chose television, 5.5% chose newspapers, 3.6% chose magazines, and 1% chose direct mail.
When considering how their use of other media had changed because of the Internet, 34.7% stated they spent less time with television, 26.3% spent less time with magazines, 32.8% spent less time reading direct mail, and 17.2% spent less time listening to the radio.
However, 75.6% of respondents reported no change in radio listening habits, 64.6% had no change in magazine reading habits, and 58.8% spent the same amount of time watching television.
Other Relevant Information on Farmer Demographics
Most (73.1%) respondents owned an ATV, with 37.3% owning Honda, 9.7% owning Yamaha, 11.7% owning Kawasaki, 13.3% owning Polaris, and 1.9% owning Arctic Cat. Regarding light trucks (3/4 ton or less) for use on their farm or ranch, 24.7% owned five or more, 14.9% owned four, 18.2% owned three, 21.4% owned two, 17.5% owned one, and 3.2% owned none. Almost half (41.9%) of respondents said their newest truck was Ford by make, while 29.9% had purchased a Chevrolet, 14.9% a GMC, 14% a Dodge, and 1.3% some other make of vehicle.
Personally interviewing farmers can provide better information than other avenues

27National Association of Farm Broadcasting
Chapter 11Preparing a Media Plan
Learning Objectives:• Describe the initial steps one should take to familiarize oneself with a new market .• Identify key pieces of information used to prepare a budget .• Identify factors used when determining a target and geography .• Discuss ways to determine effective timing .• Explain the significance of Ag Media Research (AMR) reports .• Describe Quick Reports .• Describe how to establish a media plan and discuss media negotiation .
By Mel Dolinky, a 20-year veteran media planner and media director whose experience includes several leading national
agricultural agencies.
Learning the Market
When starting on a new plan it is important to familiarize yourself with the market. An easy way to start this process is to get to know the sales representatives of the respective mediums available for your audience. The function of selling commercial time is usually handled either by a station or network sales representative organization. A listing of the major radio stations, networks and representative firms is included in the annual NAFB directory. Once you have established a relationship with these people, it will be much easier to discuss everything from specific spot costs to more complex programming opportunities. If you are starting a new position you may even consider scheduling a week or so to meet with your sales reps. Most reps have a general information presentation they are ready to give at the drop of a hat. They will be glad to begin building a relationship with you and your client. Keep a good rapport with your reps when possible. You will be glad you did.
There are many research tools available to start analyzing media options. The ongoing Ag Media Research (AMR) radio study measures stations’ listenership levels and compares them on factors such as farming enterprise and geography. Other available information for the media planner includes reports on market share for chemicals and seed by Maritz, Association of Equipment
Manufacturers Report (AEM) on equipment market share and purchase information, Doane reports on acreage and chemical usage, and the USDA Census of Agriculture which is conducted every four years and is available online at www.usda.gov. Also, many manufacturers have substantial databases on the agricultural market. Some of these reports are proprietary, and some (like the Census) are available to the public. Your employer will probably have many resources for you to begin with. From there you can begin building your files and learning your markets.
Budgeting
There are many schools of thought on budgeting. Some media planners prefer to take a client objective and come back to them with what it will cost to accomplish the goal. This is called zero-based budgeting. This is an efficient way of doing a media plan if the client is large and thinks big, but most clients have a predetermined budget and it is usually smaller than what it will take to achieve an objective.
The recommended budgeting method is to get a solid budget amount from the client and work to best achieve the client’s objective. In today’s world of smaller budgets and higher accountability, there is no time to invest in excessive plans that can’t be implemented. The client’s marketing objectives is another key piece of information to get. What is the sales goal? How much awareness is needed? From this you need to determine how many customers will have to be reached to accomplish the goal. (Each agency has its formula to do this.)

28 Harvesting the Power of Farm Broadcasting
In general terms, if building awareness is the goal, the focus of the plan will have a longer timeline with steady frequency. If the client objective is to build sales, then a shorter time frame with much higher frequency will be necessary. After your input and initial analysis, you can determine if the budget is sufficient to reach the goal. Be careful in saying immediately that it is too little. People who can find creative ways to stretch budgets are rewarded greatly in this industry.
Think of a small budget as a challenge to you as a professional If the budget ends up being $10,000 (just for reference), bring your client an option of bare bones coverage for $8,500, good coverage for $9,500 and surpassing their goals for $10,500. Be flexible in your budgeting. The key to being a successful media planner is to be ready for any changes. If you have a volatile client, plan and negotiate the best you can and keep talking in concrete terms of how many potential customers you can reach with budgets. A good media plan is complete with justified data and rationale to support your recommendation. Avoid emotional arguments of the minimum amount of money the client should spend to make it worthwhile in your opinion.
Who Is The Target?
In order to begin a plan, two factors should be agreed upon by both client and agency.
1. The target audience
2. The prioritized market geography
The target audience is merely a definition of who you are trying to reach. This means agreeing with the client on the type of farmer to be targeted. This would include crops raised and/or livestock inventoried or sold. In other words, are you looking to reach soybean growers or corn farmers? Cotton growers or fruit growers? Are you interested in hog farmers or cattle raisers? Dairy farmers or chicken ranchers? Size of operation is also important. Are you targeting the 100+ acre grower, 200+ acre grower, or 500+ acre grower, or the Class I or IA farmer? It is important to define these factors because the media research available to you is sophisticated enough to allow you to break out the results based on some or all of these factors. NAFB also has research studies examining factors on media use and media preference of farmers. If you are going to work in ag media, become an expert in these studies, and ask your local NAFB contact for them. As mentioned, location is critical. While consumer-oriented radio is focused on DMAs, ag radio is not. You have a much more defined and exact opportunity. Determining where the growers of the crops or owners of the livestock of your target audience live is not difficult. Getting it correct is critical.
Effectively and efficiently invest your client’s money to reach the right people with the right message with the optimum frequency, and you will enjoy a positive relationship with your agency and your clients.
Geographic Considerations
If your client is not sure what geography is important, you can make recommendations, but be sure to get agreement among all parties on the selected geography. The target geography is usually determined on a county basis as are many ag media buys. Check the Census of Agriculture for county identification and acreage of your target crop or livestock. Determine which counties are the key producing ones. Get an agreement on the relative ranking of importance of the various states and counties that may be high in production or inventory of your target enterprise. Remember
Getting to know the local farm broadcasters is a good idea

29National Association of Farm Broadcasting
it is possible for a state or group of counties with a lower total acreage than a neighboring state or group of counties to be of greater importance due to weather, soil, existing market share, cultural practices, sales potential, distribution outlets, or other marketing factors. Some clients may have already identified key counties, but it won’t hurt to run your own analysis to compare the counties you think are important with the list provided to you. The determination of target counties is arguably the single most important factor to get agreement on to allow for the most effective spending of radio dollars. Because radio is such a local vehicle when examined from the farmer’s perspective, proper selection of target geography is a must. Keep in mind there is a significant amount of research available indicating the reasons farmers listen to radio and what type of information they are listening for, and much of this information, such as weather, market prices, and legislation is of a local nature. Consult the NAFB to get copies of this research.
Eleven Questions About Timing
Another crucial factor that needs common agreement between the client and the agency is timing.
1. When is the smartest time to advertise to your target?
2. What are you trying to accomplish with the advertising?
3. Is it brand awareness?
4. Brand preference?
5. Product news?
6. Price announcements?
7. Special deals?
8. Insect or weed treatment?
9. Are you trying to change a cultural practice?
10. Why are you advertising?
11. Is it corporate awareness or brand awareness?
Keep in mind, it takes a certain amount of time for any campaign to become effective. What you are trying to accomplish can have an effect on timing. To a degree, the shorter the lead-time you are working with, the greater the frequency and reach level of media it may take to be effective. Also keep in mind just how your radio campaign is expected to work in conjunction with any other media you may be recommending. It is helpful to get an indication of what the client expects the media to accomplish. If you don’t know what it is that you are trying to accomplish, how will you know if you have been successful?
AMR Reports
The Ag Media Research SM (AMRSM) project is conducted each year, measuring listenership levels for ag radio. It is to the agricultural market what Arbitron is to the consumer market, only it provides more specific and targeted data. Arbitron deals only with age and gender categories. AMR deals with farming enterprise. In the even numbered years, the Midwest states are surveyed and in odd numbered years, the states outside the Midwest are measured.
AMR Methodology
The methodology used involves an unaided recall gathered by telephone interviewing. Calls are made in the evenings and farmers are identified as being the decision makers in regard to farm buying decisions. Participants must operate a farm or farms generating more than $40,000 in sales.
Ag Media Research can provide useful information about potential listeners

30 Harvesting the Power of Farm Broadcasting
The respondents are then asked to identify which stations they listened to between the hours of 5 a.m. and 7 p.m. on the day of the survey and the previous day. The data is collected in 15-minute increments by the half hour. The farmers identify the stations by call letters and/or other identifying information. The counties surveyed are determined by the participating station or network. They pay for the study so you don’t have to. By selecting the counties to be surveyed, each station/network is in essence telling you what it considers its best or core coverage area. You can then manipulate the data as you see fit; however, you must have a minimum of 100 in the sampled demographic to generate a ratings report. If more than one participant selects a given county, the number of interviews conducted in that county increases, thereby increasing the sample size and accuracy. Ratings are weighted based on the total population of Class 1+ farmers according to USDA Census data, compared to the total number of interviews completed in each county. This makes for a much more targeted and accurate survey than one based on having the respondents fill out a diary over a set period of time. To determine commodities, the respondents are asked if in the previous year they produced the following acreage or livestock levels:
• 200+ acres of cotton• 100+ acres of corn• 100+ acres of sorghum• 100+ wheat acres• 50+ acres of soybeans• 50+ acres of hay• any rice• any sugar beets• any sunflowers• any tobacco• 25+ head of beef cattle• 200+ head of hogs• 25+ head of dairy cattle• Or if they are a horse-owner family (starting in
2002)
In order for a station call letter to be listed in a report, that station’s call letters must be mentioned by at least three different respondents.
Basic Definitions
Ratings results are reported as Average Quarter Hour Rating (AQH Rating), Average Quarter Hour Share (AQH Share), and CUME Rating. The Average Quarter Hour Persons (AQH Persons) and CUME Persons are calculated to get these ratings. The definitions of these terms are:
AQH Persons: The average number of Class 1+ farmers ($40,000 plus in farm sales) listening to a particular station for at least five minutes in a quarter hour within a specific day part. Unduplicated AQH Persons for all affiliates mentioned are used for networks.
AQH Rating: The AQH Class 1+ farmers expressed as a percentage of all Class 1+ farmers being measured.
AQH Share: The AQH Class 1+ farmers expressed as a percentage of the total radio listening by all Class 1+ farmers being measured.
CUME Persons: Total number of different Class 1+ farmers who listen to a station or network’s affiliates for at least five minutes in a day part; also called the unduplicated audience. Unduplicated CUME Persons for all affiliates mentioned are used for networks.
CUME Rating: The CUME Class 1+ farmers expressed as a percentage of the population of all Class 1+ farmers being surveyed. Ratings represent unduplicated listening to stations and groups of stations in specific hours or day parts. Ratings do not represent listening to specific programs or specific farm broadcasters. Network ratings represent farmers listening to all affiliates and include those not listening to network programming. The AMR program will give you reports for hourly time periods between 5 a.m. and 7 p.m. Monday through Friday. You can also generate quick reports that include the following time periods:
• 5 a.m. – 7 p.m.

31National Association of Farm Broadcasting
• 5 a.m. – 8 a.m.• 8 a.m. –11 a.m.• 11 a.m. - 1 p.m.• 1 p.m. – 5 p.m.
Also included in the AMR package is a reach and frequency program.
Primary Market Areas (PMA)
AMR provides you with listenership data that can be configured and printed in a virtually limitless number of ways. The two primary categories are the Primary Marketing Area and state/county selections. Both can also be saved and named as Custom Areas.
The survey is conducted on a county basis. All finished reports must have at least 100 completed interviews to ensure the data being examined are statistically valid. In order to be listed in a report, a station must be mentioned by at least three different respondents. A station not receiving three mentions is included in all totals and network ratings if it is a network affiliate, but is not printed in any reports. Respondents not listening to radio at all are included in the study and calculations. The counties to be studied are determined by each participating broadcaster. If more than one participant selects a given county, the total calls made into that county is included in determining the ratings for that county. This allows each participant to benefit from an increased sample size.
A Primary Marketing Area, therefore, is an
indication of where the participant believes its strength lies. This is usually a smaller geography than the total signal area. Viewing the ratings for the PMA will give the buyer an indication of where that strength is, and how the competition compares in those selected counties. You would not expect to see the PMAs of competing stations to have identical geographic boundaries. The image below shows the AMR screen created when the PMA is selected for a given station (KFEQ AM in this case.) Note that the station is shown in the drop down box, the enterprise selected (soybean producers) is shown in its drop down box, the number of surveys completed in this PMA (259) is shown, and the counties surveyed are shown (see next page).
Once the station is selected, the enterprise is determined, and the PMA category is selected, the report can be created by clicking on the “Create” button. You can then choose what specific report you want to view or print. These include the participants, interviews, programming, and for networks, a listing of affiliates. You can request an Hourly Report showing ratings, shares and cumes by hour, or a Quick Report which details five key day parts. The Quick, Hourly and County reports can also be viewed, saved and printed.
Knowing which counties have been surveyed is important, but it is also important to know how the interviews were distributed over the selected counties. The responses are weighted based on the total population of Class 1+ farmers ($40,000+ in farm sales), according to the US Census of Agriculture in effect at the time the survey is conducted, compared to the total number of interviews completed in each county. It is also a good idea to compare the distribution of surveys to your target geography to see if there is a correlation between the two. If the vast majority of surveys of a PMA are with farmers located in counties that are not in your target, you need to know this.
The Quick Report
As mentioned, the Quick Report shows the data for five key dayparts. This allows you to compare
Primary Market Areas can show where a station is strongest

32 Harvesting the Power of Farm Broadcasting
Surveyed Counties for Station Primary Marketing Area
PMA Quick Report
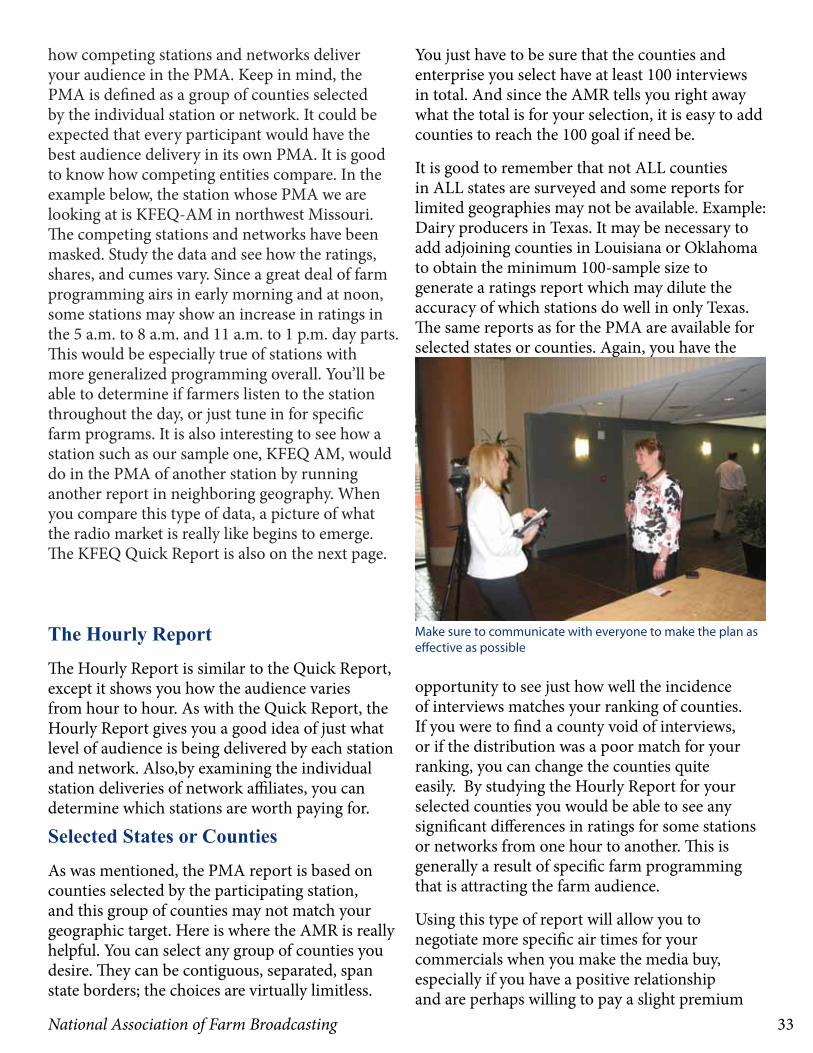
33National Association of Farm Broadcasting
how competing stations and networks deliver your audience in the PMA. Keep in mind, the PMA is defined as a group of counties selected by the individual station or network. It could be expected that every participant would have the best audience delivery in its own PMA. It is good to know how competing entities compare. In the example below, the station whose PMA we are looking at is KFEQ-AM in northwest Missouri. The competing stations and networks have been masked. Study the data and see how the ratings, shares, and cumes vary. Since a great deal of farm programming airs in early morning and at noon, some stations may show an increase in ratings in the 5 a.m. to 8 a.m. and 11 a.m. to 1 p.m. day parts. This would be especially true of stations with more generalized programming overall. You’ll be able to determine if farmers listen to the station throughout the day, or just tune in for specific farm programs. It is also interesting to see how a station such as our sample one, KFEQ AM, would do in the PMA of another station by running another report in neighboring geography. When you compare this type of data, a picture of what the radio market is really like begins to emerge. The KFEQ Quick Report is also on the next page.
The Hourly Report
The Hourly Report is similar to the Quick Report, except it shows you how the audience varies from hour to hour. As with the Quick Report, the Hourly Report gives you a good idea of just what level of audience is being delivered by each station and network. Also,by examining the individual station deliveries of network affiliates, you can determine which stations are worth paying for.
Selected States or Counties
As was mentioned, the PMA report is based on counties selected by the participating station, and this group of counties may not match your geographic target. Here is where the AMR is really helpful. You can select any group of counties you desire. They can be contiguous, separated, span state borders; the choices are virtually limitless.
You just have to be sure that the counties and enterprise you select have at least 100 interviews in total. And since the AMR tells you right away what the total is for your selection, it is easy to add counties to reach the 100 goal if need be.
It is good to remember that not ALL counties in ALL states are surveyed and some reports for limited geographies may not be available. Example: Dairy producers in Texas. It may be necessary to add adjoining counties in Louisiana or Oklahoma to obtain the minimum 100-sample size to generate a ratings report which may dilute the accuracy of which stations do well in only Texas. The same reports as for the PMA are available for selected states or counties. Again, you have the
opportunity to see just how well the incidence of interviews matches your ranking of counties. If you were to find a county void of interviews, or if the distribution was a poor match for your ranking, you can change the counties quite easily. By studying the Hourly Report for your selected counties you would be able to see any significant differences in ratings for some stations or networks from one hour to another. This is generally a result of specific farm programming that is attracting the farm audience.
Using this type of report will allow you to negotiate more specific air times for your commercials when you make the media buy, especially if you have a positive relationship and are perhaps willing to pay a slight premium
Make sure to communicate with everyone to make the plan as effective as possible

34 Harvesting the Power of Farm Broadcasting
for the premium position. Examining how individual stations that are affiliates of ag networks perform will give you the information you need to negotiate with the networks on which stations you want to pay for. There are no two networks that are structured exactly the same; therefore, it may be possible to negotiate some geographical or priority stations. If a network with 18 affiliates in your target geography has a significant percentage of its audience on four stations, you may be able to negotiate costs for buying just those stations. It’s all up to you and your relationship.
Next Steps
Once you have analyzed the AMR data you can match your initial station/network choices with your target audience and geography determination. Contact the sales reps and
organizations of these stations and networks. As mentioned earlier, a listing of these organizations is in the online NAFB Directory and is updated every year. Since you are in the very early stages of developing your media plan, when you call the media reps, let them know this. Inquire about any special programming opportunities that might be available. These could run the gamut from market reports, to in-field remotes, to specially created farm programming. Use your talents as a buyer to work with the reps. Keep in mind that if you do your job correctly, the client-agency-rep triangle will be a win-win situation. And, if your client wins, you win. Since this is an initial stage, you are letting the reps know there is a possible income opportunity for them on the horizon. They will
work with you if you do things right. You don’t have to divulge any confidential information, or be overly specific, but the more information you can give them to work with, the better they can do their jobs. This is also the opportunity to get an idea of initial (non-negotiated) costs. So it would help if you knew whether you plan to run 60 or 30 second spots, or want to discuss a longer commercial block of time. It will also be helpful if you have an idea of when you plan to run your flights since inventory of available time can be a factor.
Finalizing the Plan
Using the Reach and Frequency program supplied by AMR, you can determine just what can be accomplished, the initial list of which stations/networks you plan to use, the proper number of ads to reach your frequency goal, and how much it could cost. It would be extremely unlikely that you will have the budget to purchase a schedule that delivers maximum reach and excessive frequency; therefore, you must establish a minimum frequency standard to execute a successful campaign. While the minimum standard frequency for awareness may be three times per week, it is far more desirable to execute a radio schedule that delivers an average frequency of six times or more per week. A six times per week average frequency may require a 15 times to 25 times per week schedule to make optimum use of the reach capacity of the station or network. You’ll also have an idea of how radio will work with any other media you might be planning to use. You can look at the performance of different combinations of stations and networks to begin to fine tune your selection. At this stage, you can also get a picture of how much media weight you want to assign to each vehicle you are using. This would all be based on just what you want to accomplish and what your media and marketing goals and objectives are.
Analysis of Results
It is important in today’s tight budgeted world to be able to measure the results of your media plan. It is equally as important for you as a media professional to work with your client
Media plans can help increase effectiveness

35National Association of Farm Broadcasting
and predetermine the parameters of how your efforts will be evaluated. As discussed earlier, most advertising/sales objectives are going to be based on raising awareness or an increase in sales. It is imperative that you know how this will be determined. Will there be follow up awareness research? If so, for example, where will this take place (geographically) and to whom in the target audience will they be talking? If a sales goal is the objective, how much of an increase is desired? How long will the client expect the results to last? Sales often spike after an aggressive advertising campaign, then return to a more normal level. Don’t be afraid of having your work evaluated. A successful campaign relies on the strategic planning of the position, the quality of the creative, where and how the message is delivered and how often it is heard.
Negotiations
Once you have gotten an agreement on a budget and general direction for your media plan, you
can get into the final stages of the planning/buying process— negotiating. There are many styles that people have used in media negotiating over the years. The style you use will probably be based on your own personality and approach to media, but no matter what method you use, keep in mind that knowledge is power. The more you know how various stations/networks perform, the better you can negotiate. If you know that only a few stations of a network’s list of affiliates deliver a significant audience in your target geography, you have a basis for negotiation. If you know that station A delivers twice the audience of station B, you have the basis for negotiation. If you know that station C has a similar audience delivery to station D and is priced at half the cost, you have the basis for negotiation. Money talks in the value added arena. Broadcasters are dependent on advertising revenue to provide the programming that delivers value for their audience and clients. Ask about special reports, commodity convention reports, harvest reports, and other features that include extra free promotional announcements that include sponsor identification mentions. These can also range from commercial positioning to on-air interviews; do what your creativity can develop. Don’t expect to get something for nothing. If you spend, you get. As you get more involved with agricultural media you’ll realize how much more detailed information is available to you than to other types of media planners and buyers. You’ll also realize how you can create your own target geography and audience, then match and compare media reach and cost for delivering your audience. By just following some basic techniques, you can maximize your media dollars efficiency and effectiveness, and all clients appreciate that approach to investing their media dollars.
Activities/Discussion Questions• Have students study the characteristics of your area . What kind of audience would they be targeting?
• Provide students with a list of stations in your area and have them discuss which would be the best fit for advertising to their audience .
• Have students prepare a report on which station they would choose when preparing a media plan for a certain group of farmers .
Be sure that your media plan has measurable results .

36 Harvesting the Power of Farm Broadcasting
Produced for the NAFB by Ted Haller
Farm radio is best described as information which is broadcast on the radio on a regularly scheduled basis which provides farmers, producers, growers and ranchers with data that is important in the operation of their business—both daily and long term.
Over the years this information has evolved primarily into three areas:
• Market Reports – Track the ups and downs of the commodities relevant to the geography served by the radio station
• Weather Reports – On farm radio stations, weather reports usually take the form of a more in-depth analysis of weather conditions as they relate to both immediate and long term farming and ranching operations
• Farm News – Information on both a local and national basis pertaining to agricultural issues such as farm legislation, international issues, and local agricultural conditions and issues
The length and frequency of these reports varies by station and network, yet the typical configuration looks something like this:
• Morning Farm Reports – normally between 5 a.m and 7 a.m Monday through Friday, anywhere from two to 30 minutes in length (some stations have Saturday reports) which recap market information, farm news and the day’s upcoming events
• Market Reports – normally on the hour from 9:30 a.m. until the markets close in the early afternoon, Monday through Friday, usually two to five minutes in length
• Noon Farm Reports – usually between 11:30 a.m. and 1 p.m., Monday through Friday, recaps markets and the day’s developing agricultural news.
While the above is a typical configuration, a handful of stations broadcast continuous farm and agricultural information throughout the day. You will want to get a current broadcast schedule from the stations and networks you are considering. Please note networks are more complicated due to feed versus carry of programs. A network may broadcast 20 or more reports a day, but the individual affiliates may be selective as to which reports they decide to air. Upon investigation you may discover that several reports are carried by 90% or more of the affiliates, making these positions more desirable.
The Role of NAFB in Farm Broadcasting
The National Association of Farm Broadcasting (NAFB) is a professional organization dedicated to agricultural broadcast journalism. In order for a farm radio broadcaster to become an NAFB member, the broadcaster must meet a set of strict criteria regarding their broadcast employment. While NAFB members may be on other mediums such as television or the Internet, radio NAFB membership is the vast majority of the organization’s makeup.
NAFB reports air on radio stations and network affiliates which account for more than a 60% share of farmer and rancher listening in the areas where farmer listening is documented. The NAFB’s news service, as well as the reporting efforts of the individual farm broadcasters, is the backbone of America’s agricultural information link in radio. For a more in-depth look at the NAFB, you can
Chapter 12Resource Guide for Planning and Executing Agricultural Radio Media Buys
Learning Objectives:• Identify what elements make up a typical farm radio broadcast .• Explain how NAFB plays a role in farm broadcasting .• Describe how to find the proper station on which to buy advertising .

37National Association of Farm Broadcasting
visit the website at www.nafb.com.
There have been four main ingredients that create farm radio and NAFB:
• Signal strength of the station – You have to be able to cover the ag market which, for the most part, lives outside the metro area. Dial position and signal power play a key role in this fact. There are some exceptions due to being located in a particularly important agricultural county, although a station’s dial position and signal power are key to anything else. See Chapter 3 for more information on signal strength.
• Format of the station – You have to have a format that is compatible to the most common farmer/rancher demo of men ages 45-64 (but the farm wife is just as important; so the demo could be expanded to adults ages 45-65). You are not going to go from Frank Zappa to the market reports and maintain either audience. Historically, the two most common formats are news/talk, followed at a distance by country. This makes sense when you compare the farmer/rancher demos to other adults in their age group. There have been exceptions, but those stations were successful because they put on a significant block of ag programming for half an hour to an hour. This allows listeners to tune in on a regular basis and, to a degree, negates the station’s normal format and becomes a program destination similar to television.
• Ag programming and/or NAFB presence – You have to have the programming to cluster the farmer/rancher audience beyond the normal format skews for their respective demo. Imagine a station in your market that is not the best in your area, but at 6:08 every Monday through Friday morning, that station will tell you what your competitors are paying for their media in your key markets. Imagine they would also re-cap a summary of the value added programs that your competitors were able to negotiate in your clients top sales areas. Would you not listen to that type of information on the radio if this makes your
job better? That’s what the NAFB market reports and farm news are trying to do for the farmers/ranchers that are in their listening area. Granted, in this day and age farmers/ranchers have multiple outlets for access to that information, but as of today’s technology, the radio is still the most user-friendly for providing daily farm news, market reports, and ag weather on a consistent basis.
• Agricultural concentration and acreage within the station’s primary signal pattern – This is almost a chicken and egg situation in terms of which comes first. Without an ag target, there is no need for the station to devote programming time on a non-potential target within their listening constituency. The most common issue is just the reverse in that a powerhouse station reaches a significant amount of farmers/ranchers but without the NAFB programming, the ag audience does not cluster well for a spot schedule and would have to be approached more like consumer radio which tends to be more fragmented.
So we are really looking for a farm radio station that is the following:
• Low on the dial with lots of power, such as 650 on the dial at 5,000 watts or more
• A compatible format such as news/talk or country, or targeted at men and women ages 45 and up.
Be sure to keep the differences in farm and consumer radio in mind

38 Harvesting the Power of Farm Broadcasting
• An NAFB member reporting farm news and information, or at a minimum a dedicated ag reporter with a regular schedule of programming
• Located in the middle of the best farm and ranch geography in the United States or has the signal strength to cover such an area if the station is located in a more metro area
The Difference Between Buying Farm and Consumer Radio
While different from consumer radio buying, farm radio buying shares similarities with specific demographic radio buys found in the consumer market. This being said, let’s look at an example of how a farm radio buy and a consumer radio buy for the same market compare and contrast.
• Buy 1: Target = men 35-64 (This is the closest to a farmer demographic)
• Buy 2: Target = 250+ corn producers
For Media Buy #1
We begin by pulling an Arbitron Ranker for our demo – Men 35-64 – by day part. Normally we would have a set of goals for the market such as Gross Rating Point (GRP) levels, reach and frequency objectives, and a budget established on the estimated cost per point (CPP).
We would also be considering value-added opportunities from the stations or station groups in the market, such as on-air product sampling
and placement, remotes, on-air giveaways, trip packages, and contests to stretch the media impact of our schedule.
Typically we would also look at the age cell concentration within the overall target by radio stations for the 35-44, 45-54, and 55-64 age cells. The analysis will be indicative of format skews by age cell with the younger demos 34-44 going to more of the hot formats and the older cell 55-64 going toward the easier formats.
This sets up the balancing act of selecting stations that reach all age cells within the target. It is possible the listening preferences of a 36-year-old do not have much in common with the listening patterns and format choices of a 63-year-old. We will most likely buy a minimum of three to five stations with a strong number of spots to achieve our GRP goals and balances.
It would not be uncommon to have as many as 150 spots per week spread over five or more stations to achieve our goals and impact. The only thing that might skew the buy is a particularly strong station(s) that control the majority of the men in the market or a particularly strong value-added promotion or tie-in from a station or ownership group in the market.
For Media Buy #2
We face a totally different set of challenges. First there is no Arbitron Ranker for 250+ acre corn producers. We could run an Arbitron on the closest demo match to our corn target, which would likely be one of men ages 35-64, but there is an actual rating service for radio, specifically designed to measure farmer and rancher listening, called AMR.
AMR was created over a two-year research period in the early 1990s out of a need for better accountability of farm radio and NAFB to deliver a significant audience above and beyond normal radio buying. Statistically the AMR radio ratings are more accurate against their respective demo than other syndicated audience research for broadcast ratings. This is primarily due to the random sample size of the farmer/rancher target
Using the correct research can make a big difference in ag markets

39National Association of Farm Broadcasting
and the methodology involved.
AMR is based on a telephone interview for day of and day after unaided recall of listening. This type of research is more current than diary-based and has a tendency in radio to provide a very accurate
indication of what is known as the P1 listener, due to the unaided methodology. P1 listeners represent the primary listener group to that station and account for the majority of the station’s audience profile. If AMR has a weakness, it could be in the methodology of day of/day after recall, which has a tendency to understate listenership of the non-P1 audience – which is better than overstating any audience ratings. Sample sizes are required to have a minimum of 100 interviews
prior to developing any ratings data, although most areas contain many more interviews. The 100 sample requirement minimizes sampling error providing a maximum of only +/- 10% error at the 95% confidence level. See the first table for more detail.
The Arbitron men 35-64 is considerably different when compared to the farmer ratings:
• The top actual farmer stations are not the top men 35-64 stations
• The #2 local farm station does not even appear in the Arbitron ratings for men 35-64
• There is no network consolidation in Arbitron,
so networks could be totally missed if you were relying on Arbitron
• Because farmers represent less than three percent of the population, they will not be accurately sampled within a general men 35-64 survey making an Arbitron type approach unstable in predicting actual farmer delivery. Go back to our earlier example of a local station – not the strongest in your market – which at regular time periods reported what
your competitors were paying for media time. You would have more incentive to listen than the general population within your age skews, but your profession of media buyer preferences would have no bearing on the Arbitron ratings because media buyers represent such a small percentage of the population. See the second table for more information.
Significant Differences Between Arbitron Men 35-64 Ratings and AMR Ratings for 250+ Corn Producers in the same geography and time period
in Spring 2006 .ARB TSA Counties AMR in TSA Counties
Station % Men 35 - 64 % 250+ Corn ProducersLocal Farm Station 1 11 .2% 16 .0%Local Farm Station 2 0 .0% 13 .7%
Regional Farm Station 3 5 .3% 17 .9%Farm Network 1 N/A 43 .1%Farm Network 2 N/A 16 .0%Farm Network 3 N/A 9 .5%
Further Illustration of Arbitron and AMR data for top two men 35-64 radio stations and their farmer ratings .
ARB TSA Counties AMR in TSA CountiesStation % Men 35 - 64 % 250+ Corn Producers
Top Local Station 22 .5% 0 .9%Second Top Station 18 .7% 3 .2%

40 Harvesting the Power of Farm Broadcasting
In summary, AMR, where available, is your best directional choice to select stations to reach farmers. Beyond AMR, your next best choice is format and the presence of farm reports and/or NAFB broadcasters. Arbitron County by County reports could serve as directional tools for station coverage, but are not accurate in detailing farmer listening or ratings.
AMR Ratings
Using the AMR software (which is a free service), we selected the counties that are in the radio Total Survey Area (TSA). We simply entered those 11 counties which make up the TSA market and then selected corn producers for the commodity and then created the report. This provided us with a sample of 322 corn producer interview samples. That translates to a maximum error of +/- 5.6% at the 95% confidence level for this particular sample – and in the world of research, is an excellent sampling.
Farm Radio as Part of the Media Mix
While farm radio can be a strong medium by itself, it is more common to use farm radio in conjunction with other media in a mix. Farm radio does have regional skews and is noticeably stronger in certain geographies depending upon signal strength of NAFB stations, number of NAFB stations, and number of NAFB networks.
In reviewing the range of normal farm radio reach, the strongest states can deliver reach in the 60% plus level, while states with fewer NAFB stations and networks can be in the 30% reach range. Again, compared to consumer radio, these are still strong numbers particularly when you consider that most markets are only served by one NAFB station or network station. Please consult your AMR to get more detailed reach perspective by geography. (Source: AMR 2006 All Us Surveys)
Farm radio and/or NAFB radio reach estimates correspond to radio reach in the consumer market with one exception – it takes fewer stations or networks to get to the maximum reach number in farm than in consumer. Also, you are talking broad reach with NAFB radio covering a state as
opposed to only a metro or TSA Arbitron market.
Comparing farm radio to other mediums gets a little tricky; however, historical media usage studies – some proprietary and others public – indicate the following patterns.
Print in the form of farm magazines and farm newspapers is your best reach medium for the farm market. Historically, buying several print vehicles such as two farm magazines and a farm newspaper will maximize your reach potential at the 90%+ level. Readership of the ad is lower but still impressive in the 40-50% range from just three insertions in a typical row-crop state. Specialty crops such as cotton have different but similar curves due to more crop specific choices in addition to farm magazines and farm newspapers.
Historically, print would offer the following:
• Single farm magazine or farm newspaper: 40-60% reach
• Any two, such as a magazine plus a newspaper, or two magazines: 70-85% reach
• Any combo of three = 80-94% reach• Any combo of four or more = 85-95% reach
Television reach potential is relative to the time periods and programs that are purchased. Television, unlike farm radio, offers more broad coverage of the market, and in the process reaches more of everyone – including farmers. Television reach is a function of historical persons viewing television – ratings which are then translated into individual program ratings from share of viewing. A typical farm TV buy concentrates on local and farm news programs and may also include some sports.
Historically, the following reach by time periods could be expected from television:
• Early morning from 5 a.m. to 9 a.m. = 20-35% reach
• Noon news = 25-40% reach• Early news from 5 p.m. to 6 p.m. = 30-50%
reach• Late news from 10 – 10:30 p.m. = 40-70%

41National Association of Farm Broadcasting
reachA combination of all the above time periods could yield a television reach in the 70-85% range for a given designated market area, provided enough rating points and spots were purchased to hit the key positions.
With farm radio, you have a medium that most likely will provide less reach potential than magazines and TV, but has other strengths and reasons to have it included in the media mix:
• Increased frequency when combined with print and to a lesser degree, television
• Cost efficiency compared to other media choices
• Localized coverage with a specific message to target key counties, acreage, or livestock
• Less lead time than with the other media• Potentially lower production costs –
particularly when compared to TV• Value-added opportunities not offered by print
or TV such as interviews or remotes from field events
These values offset the two major weaknesses of radio. Coverage and impact of the creative message are the two primary obstacles to radio, but are less of a factor in farm radio due to the concentrated listening patterns and larger ratings of farm radio programs.
Note: The previous historical reach estimates for the various media are based on the reach data of various national and regional media surveys over the last 10 years.
Building a Farm Radio Schedule/Plan
We get the call from the client at 2 p.m. on a Wednesday afternoon that radio needs to be on the air the next Monday for the following areas:
• The whole state of Iowa• Twelve counties in Illinois:
◊ McClean, La Salle, Kankakee, Iroquois, Tazwell, Vermillion, Lee, Whiteside, Knox, Macoupin, Effingham, and Jasper
• Six counties in Nebraska:◊ Lancaster, Fillmore, Clay, Hamilton, Saline,
and Gage• Eastern Washington (in the Spokane area)
What Are The First Steps?
• See if AMR is available for our target counties• Check the NAFB Directory to see which
stations and networks are listed for our target counties
• If possible, secure Arbitron County by County as a back-up and to indicate true station county penetration for those non-AMR rated areas
• Map our target counties so we can visually picture potential radio coverage needs
• Consult SRDS as well as www.srds.com (if you are a subscriber) for stations and/or network listings, as well as programming and station formats – if you have the hard-copy version, SRDS maps can also be useful
• Contact station and network representatives for their properties located in your target geographies for availability and other objective information you would like – not just sales materials and hype
• Check the radio locator Web site www.radio-locator.com and search for your target geography
With experience you should be able to turn this type of project in several hours and with lots of experience you could have your station and network selection within less than an hour. The true work then becomes negotiating your schedules relative to programming details.
Building the Schedule
While it can be difficult to find the right stations and networks – the real tough part is the schedule. Radio is harder to buy than television, in that you have more definition in programming in TV in ½ hour and 1-hour increments. The key to buying farm radio is determining how much is enough. In the old days, as well as today, you see radio schedules with only two spots per day Monday

42 Harvesting the Power of Farm Broadcasting
through Friday for a total spot level of 10 per week. This would rarely if ever be done in the consumer world. The logic is in covering one morning farm report and one noon farm report per day.
This can have some impact if the following are true:
• Turn-over is low, meaning the programs you have selected have a very high composition of the same farmers listening every day
• You have the best position in the commercial pod – first spot and preferably the only spot
• You have a decent commercial with some call to action or interest level
The Ideal Weekly Schedule
• Cover as many key farm reports in prime listening times as possible with the given budget
• In the event of multiple farm stations and networks covering the same geography:
Activities/Discussion Questions• Record several farm radio broadcasts . Have students listen to the broadcasts and determine what category they fit into and note any advertisements .
• Have students discuss how the advertisements fit into the broadcast and how they target farm radio listeners in your area .
• Have students discuss what difficulties would be encountered in buying radio in your area if only Arbitron research was available for use .
• Buy as deep as possible if it is cost effective and generates the reach and frequency you need to get the job done – ideally the more the better – until you reach a point of diminishing returns (remember in consumer radio we are most always on multiple stations to get the job done).
• If you must choose one over the other, examine:
• Head to head county coverage• Ratings if available• Programming choices and when the spots will
actually air• Cost relative to delivery• Field incentives, interview options, etc.
Summary
• Farm radio is different, yet still must be approached with a radio discipline in media planning
• NAFB is your best first stop for station and network information
• Fine tune your schedule based on individual station and network ratings and programming, and make sure you use enough spots to get the job done
If you follow the basics of this document, you should be able to develop effective and targeted farm radio campaigns which can be a valuable part of your overall media mix.
Make sure you plan your schedule accordingly where budget and reach are concerned

43National Association of Farm Broadcasting
SummaryFarm Radio plays an important role in the daily lives of farmers and ranchers as they assimilate the information they need to make daily decisions. The key to the relationship between farmers and ranchers and their farm radio station is the FARM BROADCASTER.
By utilizing the highly targeted appeal of farm radio with its documentation for high time spent and frequency of listening, advertisers can also achieve high levels of reach and frequency for their brand of products.
Farm broadcasting can be instrumental in directing farmers and ranchers to the advertiser’s website as this communications technology continues to evolve. Farm radio and the Internet are at the core of future agricultural communications.
Farm radio offers numerous opportunities for creative interaction and frequency of advertising message dissemination. Program sponsorships, commercial adjacencies to targeted programming, event sponsorship participation, retail promotions, remote broadcasts, and internet promotion all deliver added value.
Farm radio is one of the most effective mediums serving the agricultural community as farmers and ranchers are more likely to be heavy users of radio than any other traditional medium. Radio is one of the few mediums that is a mobile, daily companion to farmers and ranchers and that is why the AMR Ag Media research shows that 93% of farmers listen to radio an average of 5.9 days each week for more than 3 hours each day. Farm radio allows advertisers to leverage the connection between farm broadcasters and their listeners with flexible, geographically targeted radio broadcasting.
“There has always been and continues to be a very unique relationship between farmers and ranchers and their farm broadcaster. The risk variable nature of the business of production agriculture, and the mobile work day environment, have built this unique and strong bond for farm broadcast information streaming. It’s current, it’s believable, it’s available and the advertiser’s message is intrusive. Farmers and Ranchers and farm broadcasters have established and nurtured a mutual TRUST over the 70-year heritage of farm broadcasting service.”
Gene Millard, Former Director of Marketing
National Association of Farm Broadcasters.

44 Harvesting the Power of Farm Broadcasting
CreditsThose who contributed to the text:
Chuck Zimmerman, Zimm Comm New Media, L.L.C
Dix Harper, NAFB Emeritus, historian
Gene Millard, NAFB Emeritus, Millard Family Farms Inc. St. Joseph, MO
Hugh Whaley, Broadhead & Co.
Jeremy Povenmire, Povenmire AgriMarketing, Independence, MO
Dr. Jim Evans, University of Illinois, Retired
John Block, former U.S. Secretaryy of Agriculture
John Vasichek, Owner, Red River Network, Grand Forks, ND
Ken Root
Laura Henue, Charleston|Orwig
Lyle E. Orwig, Chief Executive Officer, Charleston|Orwig Inc. Marketing and Communications
Mel Dolinky
Michelle Rook, farm broadcaster, WNAX, Yankton, SD
Pam Jahnke, farm broadcaster, WTDY/Q106, Madison, WI
Ron Hayes, Oklahoma Farm Report
Taylor Brown, Northern Broadcasting System
Ted Haller, Teddy Media
Texas Tech University Department of Agricultural Education & Communications