national biodiversity assessment and estuary biodiversity...
TRANSCRIPT
National Biodiversity Assessment and Estuary Biodiversity Plan: key products and uses
Chantel Petersen
ANCHORe n v i r o n m e n t a l

Acknowledgements
ANCHORe n v i r o n m e n t a l

Introduction ±300 estuaries were included from the temperate (cool and
warm) and sub-tropical regions
Main objectives: Ecosystem threat status Protection levels which estuaries should be assigned full or partial protected
area status
Identification was based on: Species data (fish and birds) Habitat types Ecosystem types
The Estuary Functional Zone of each estuary was mapped –similar to ecological support areas to determine the extent of systems - Spatial proxy & Management boundary

Spatial Extent and habitat 5 m MSL topographical contour
(1: 10 000) used
Prioritisation was based on the available habitat
Different habitat types intertidal salt marsh,
supratidal salt marsh, reeds and sedges, channel (water surface area, sand & mud banks)
The species data in the Estuary Botanical Database updated- 84 to 288 species in 256 estuaries
Spread sheet
openwater
floodplain
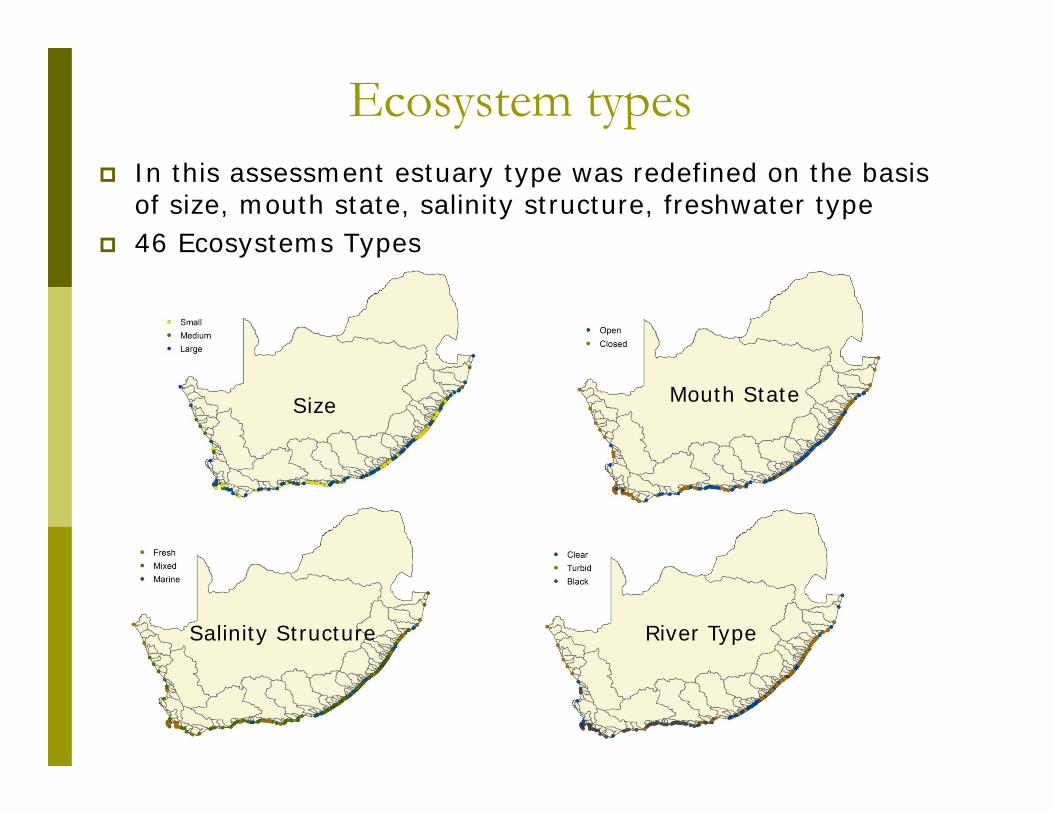
Ecosystem types In this assessment estuary type was redefined on the basis
of size, mouth state, salinity structure, freshwater type 46 Ecosystems Types
Size
Salinity Structure
Mouth State
River Type

Estuary condition mapping
The threats on estuary biodiversity were identified Threats were summarised as:
Flow modification Pollution (e.g. agriculture, waste water treatment works
(WWTW), industrial, sediment) Exploitation (fish and invertebrates) Habitat destruction (within estuarine functional zone) Climate change
These translates into estuary condition – estuary health assessments
Mapping based on desktop assessments of the functional zones, expert opinion and available data
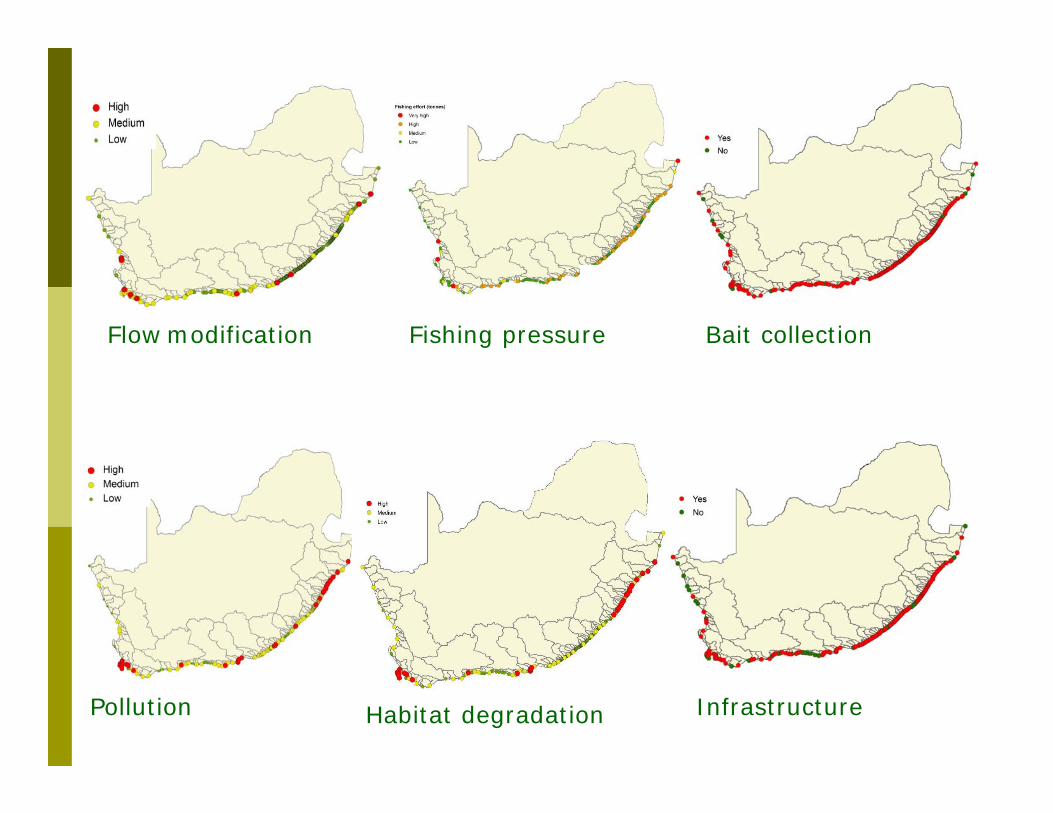
Flow modification Bait collection
Pollution Infrastructure
Fishing pressure
Habitat degradation

Estuary Health

Ecosystem Threat Status Degree to which our ecosystems are still intact (% area), or losing vital aspects
of their structure and functioning (degradation of ecosystem processes and the abundance, community composition or species richness of associated biota)
Ecosystem type and pressures identified – condition assessed
Proportion of each ecosystem type (good) evaluated against a series of thresholds
Threshold 1: defines cut-off for critically endangered or biodiversity target (20%) – formally protected
Threshold 2: defines cut-off for endangered ecosystems (biodiversity target+15%) – warning bell
Threshold 3: defines cut-off for vulnerable ecosystems (set at 60%) – likely to have lost some structure and functioning

Ecosystem threat status
18
1 1
26
0
5
10
15
20
25
30
Critically endangered
Endangered Vulnerable Least threatened
Num
ber o
f eco
syst
em t
ypes
Ecosystem Threat Status based on the NBA 2011 classification presented as number of ecosystems types.
Ecosystem Threat Status based on the NBA 2011 classification presented as percentage area of ecosystems types.

Ecosystem Threat Status
46 Ecosystems Types
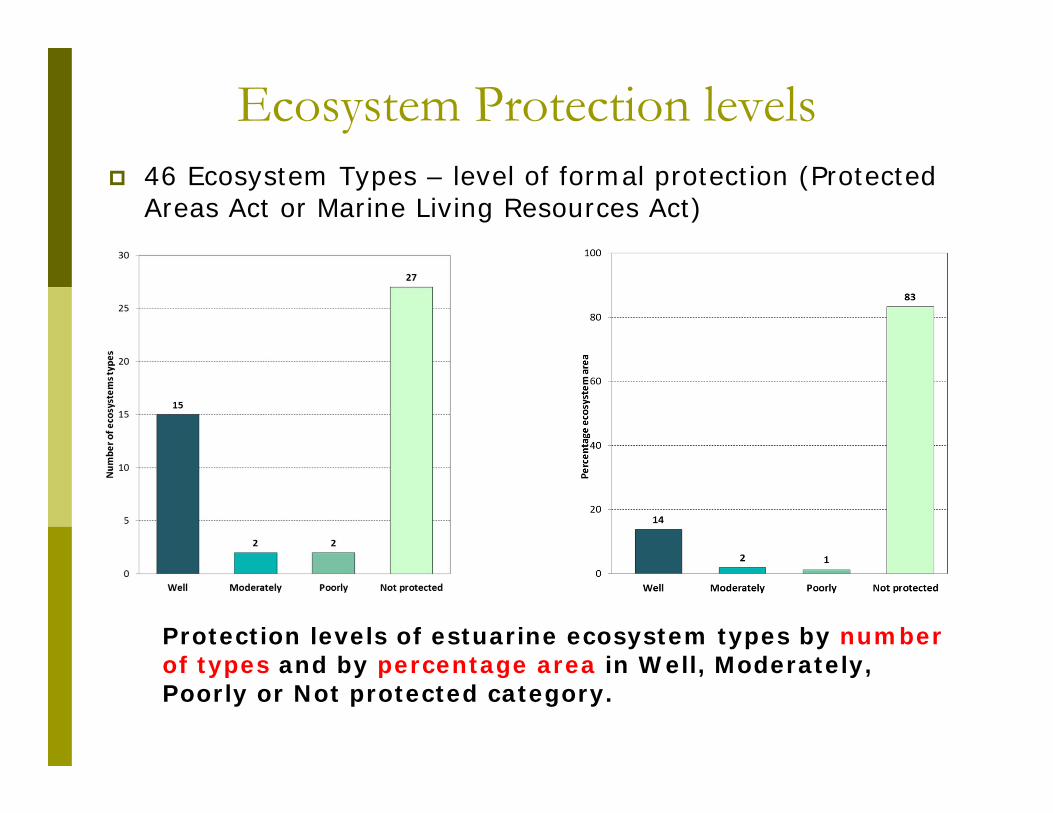
Ecosystem Protection levels 46 Ecosystem Types – level of formal protection (Protected
Areas Act or Marine Living Resources Act)
Protection levels of estuarine ecosystem types by number of types and by percentage area in Well, Moderately, Poorly or Not protected category.

Priority estuaries for biodiversity conservation (Turpie, J.K., Wilson, G. and Van Niekerk, L. 2012) Habitat targets
Population targets for estuary dependant Fish & Birds
50% of the population of red data & overexploited/collapsed species
40% of the population of exploited species
30% of the population of all other species
Estuarine habitatTotal area (ha)
within the planning domainTarget
(% of area)Supratidal salt marsh 7051 20%Intertidal salt marsh 4310 20%Reeds and sedges 11 806 20%Swamp forest 4843 All occurrences of > 5haMangroves 2111 All occurrences of > 5haSand/mud banks 4017 20%Submerged macrophytes 1327 20%Open water area 55 284 20%Rocks 96 No targetTotal estuarine area 90 844 20%

121 estuaries were identified
This amounts to about 40% of estuaries and 80% of estuarine area
58 estuaries require full protection (20%) while 63 estuaries require partial protection (22%)
Fully protected and partially protected estuaries can be considered Estuarine Protected Areas
All other estuaries should be designated Estuarine Management Areas
All estuaries require a Management Plan, and these plans should be guided by the results of this assessment
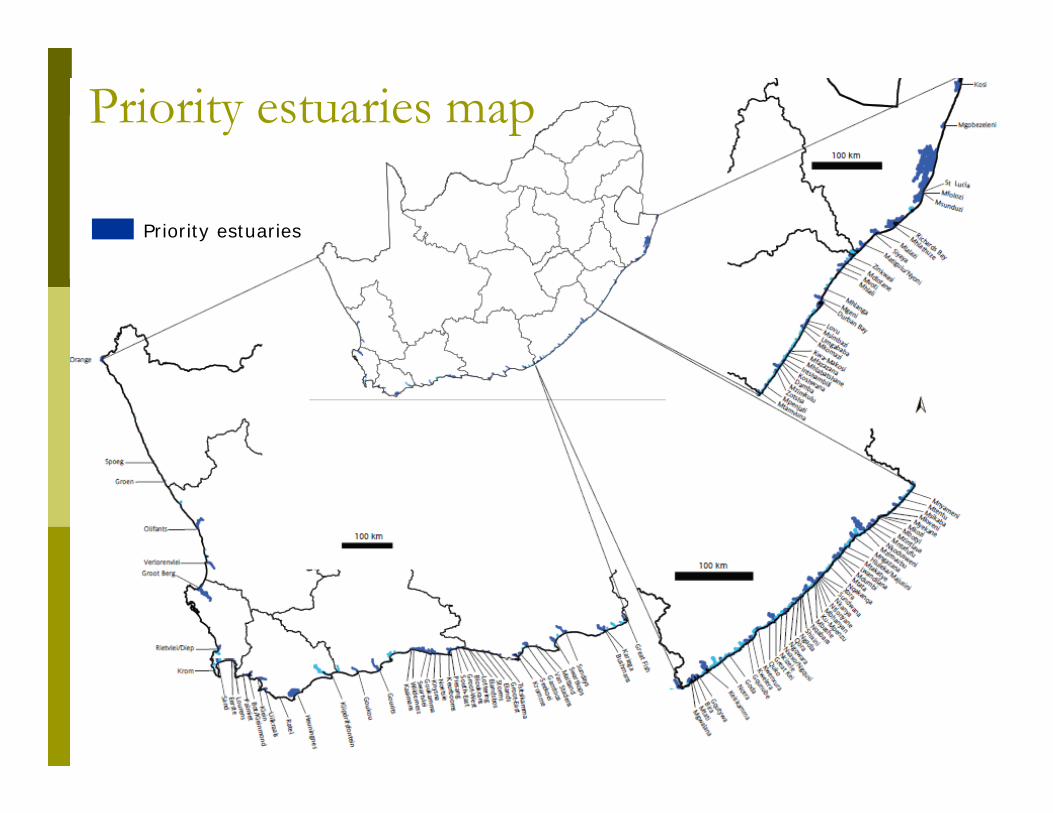
Priority estuaries map
Priority estuaries
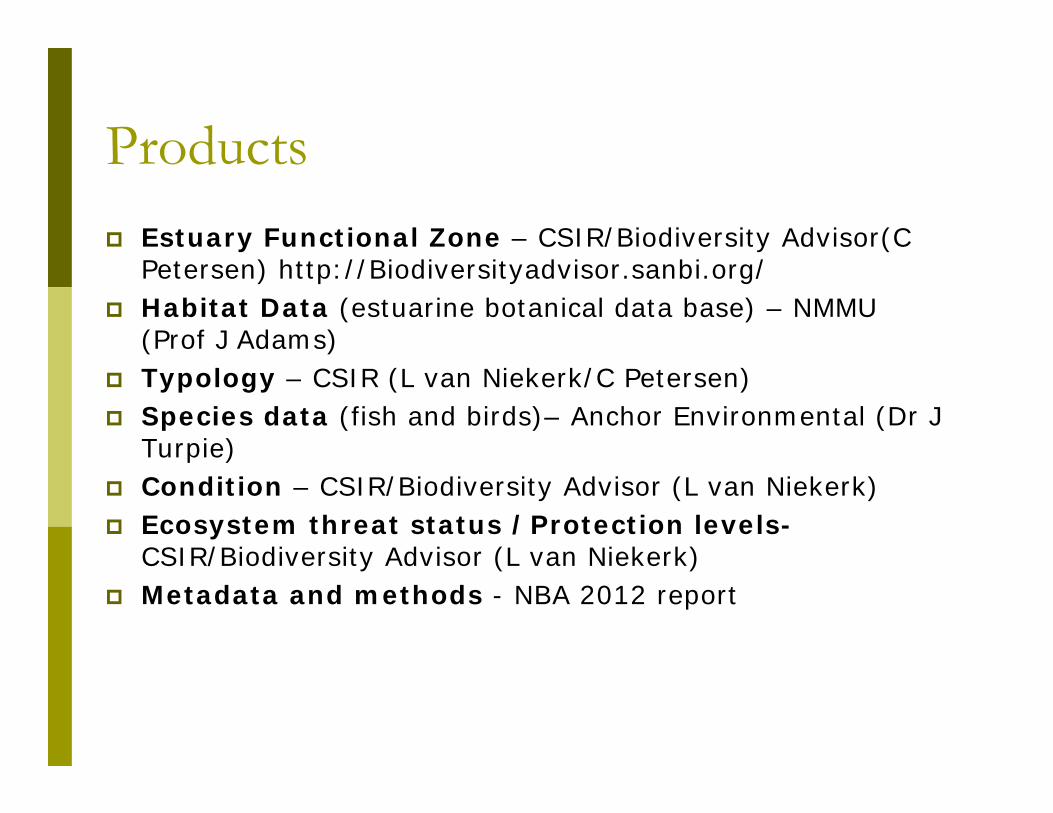
Products Estuary Functional Zone – CSIR/Biodiversity Advisor(C
Petersen) http://Biodiversityadvisor.sanbi.org/ Habitat Data (estuarine botanical data base) – NMMU
(Prof J Adams) Typology – CSIR (L van Niekerk/C Petersen) Species data (fish and birds)– Anchor Environmental (Dr J
Turpie) Condition – CSIR/Biodiversity Advisor (L van Niekerk) Ecosystem threat status /Protection levels-
CSIR/Biodiversity Advisor (L van Niekerk) Metadata and methods - NBA 2012 report
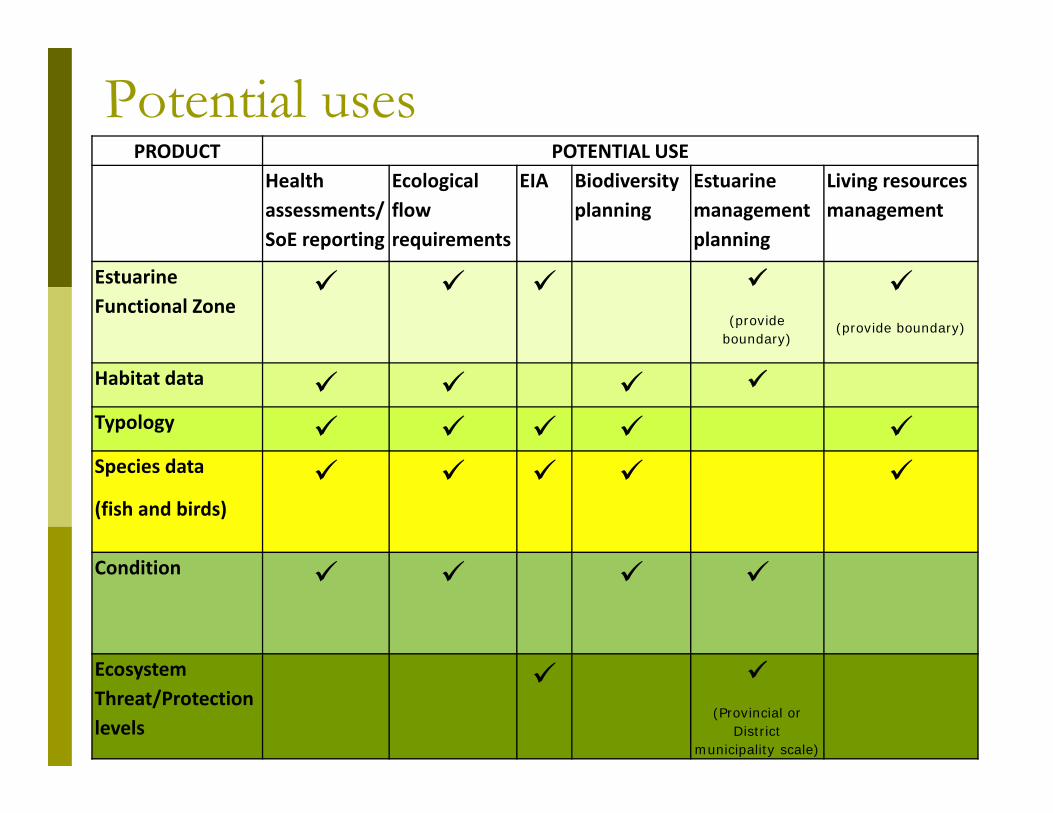
Potential usesPRODUCT POTENTIAL USE
Health assessments/SoE reporting
Ecological flow requirements
EIA Biodiversity planning
Estuarine management planning
Living resources management
Estuarine Functional Zone
(provide
boundary)
(provide boundary)
Habitat data
Typology Species data
(fish and birds)
Condition
Ecosystem Threat/Protection levels
(Provincial or
District municipality scale)

Information Gaps Hydrology for all estuaries in SA on a watershed scale
3-D mapping - topographical and bathymetrical surveys
Updated GIS spatial (mapping) of the habitat data for all
estuaries of SA
Value of estuaries (Goods & Services)
Sediment data
Stock status of estuarine dependant species
Pollution data
Land-use data
Invertebrate data
Invasive Species

References Van Niekerk, L. & Turpie, J.K. (eds). 2012. National Biodiversity
Assessment 2011: Technical Report. Volume 3: Estuary Component. CSIR Report Number CSIR/NRE/ECOS/ER/2011/0045/B. Council for Scientific and Industrial Research, Stellenbosch.
Turpie, J.K., Wilson, G. and Van Niekerk, L. 2012. National Biodiversity Assessment 2011: National Estuary Biodiversity Plan for South Africa. Anchor Environmental Consulting, Cape Town. Report produced for the Council for Scientific and Industrial Research and the South African National Biodiversity Institute.