national bureau of economic research … · and keep academically talented teachers? evidence from...
TRANSCRIPT
NBER WORKING PAPER SERIES
DO FINANCIAL INCENTIVES HELP LOW-PERFORMING SCHOOLS ATTRACTAND KEEP ACADEMICALLY TALENTED TEACHERS? EVIDENCE FROM CALIFORNIA
Jennifer L. SteeleRichard J. Murnane
John B. Willett
Working Paper 14780http://www.nber.org/papers/w14780
NATIONAL BUREAU OF ECONOMIC RESEARCH1050 Massachusetts Avenue
Cambridge, MA 02138March 2009
We would like to thank the William and Flora Hewlett Foundation and the Spencer Foundation DissertationFellowship for each funding portions of this research. We are also grateful to the California StudentAid Commission (CSAC), the California Commission on Teacher Credentialing (CCTC), and theCalifornia State University Chancellor's Office (CSUCO) for providing the data, and particularly toKaren Vogel-Henderson, Catalina Mistler, Steve Caldwell, and Paula Rockwell at the CSAC; DaleJanssen, Marjorie Suckow, and Erin Duff at the CCTC; and Sabine Ghobriel, Daba Asemebo, andBeverly Young of the CSUCO. In addition, we appreciate the insights into the Governor’s TeachingFellowship provided by Ellen Curtis-Pierce, Philip Curtis, Anita Flemington, and Debby Ford. Portionsof this study were presented at the 2007 Fall Conference of the Association of Public Policy Analysisand Management, the 2008 Annual Meeting of the American Economic Association, the 2008 AnnualMeeting of the American Educational Research Association, and the 2008 Fall Education Meetingof the National Bureau of Economic Research. We thank Bridget Terry Long, Brian Jacob, GuidoImbens, and Caroline Hoxby for comments on earlier drafts. The views expressed herein are thoseof the authors and do not represent those of the project sponsors, the RAND Corporation, any of itssponsors, or the National Bureau of Economic Research.
NBER working papers are circulated for discussion and comment purposes. They have not been peer-reviewed or been subject to the review by the NBER Board of Directors that accompanies officialNBER publications.
© 2009 by Jennifer L. Steele, Richard J. Murnane, and John B. Willett. All rights reserved. Short sectionsof text, not to exceed two paragraphs, may be quoted without explicit permission provided that fullcredit, including © notice, is given to the source.
Do Financial Incentives Help Low-Performing Schools Attract and Keep Academically TalentedTeachers? Evidence from CaliforniaJennifer L. Steele, Richard J. Murnane, and John B. WillettNBER Working Paper No. 14780March 2009JEL No. I2,I22,I28
ABSTRACT
This study capitalizes on a natural experiment that occurred in California between 2000 and 2002.In those years, the state offered a competitively allocated $20,000 incentive called the Governor's TeachingFellowship (GTF) aimed at attracting academically talented, novice teachers to low-performing schoolsand retaining them in those schools for at least four years. Taking advantage of data on the career historiesof 27,106 individuals who pursued California teaching licenses between 1998 and 2003, we use aninstrumental variables strategy to estimate the unbiased impact of the GTF on the decisions of recipientsto begin working in low-performing schools within two years after licensure program enrollment.We estimate that GTF recipients would have been less likely to teach in low-performing schools thanobservably similar counterparts had the GTF not existed, but that acquiring a GTF increased theirprobability of doing so by 28 percentage points. Examining retention patterns, we find that 75 percentof both GTF recipients and non-recipients who began working in low-performing schools remainedin such schools for at least four years.
Jennifer L. SteeleRAND Corporation1200 South Hayes StreetArlington, VA [email protected]
Richard J. MurnaneGraduate School of EducationHarvard University6 Appian Way - Gutman 469Cambridge, MA 02138and [email protected]
John B. WillettGraduate School of EducationHarvard University6 Appian Way - Gutman 412Cambridge, MA [email protected]
2
I. Introduction
Targeted financial incentives are a popular policy strategy for attracting talented
professionals to public-service jobs. The incentives exist in a number of forms. For example,
conditional scholarships are financial awards that reduce the cost of professional training. In
return for the award, recipients commit themselves to work in public service jobs for a specific
period of time after graduation.1 Loan forgiveness programs are similar, but differ in the timing
of the benefits. Individuals take out loans to pay for training, and a portion of the loan is forgiven
for each year of service in a public service job (Kirshtein, Berger, Benatar, & Rhodes, 2004).
Others incentives, including signing bonuses, retention bonuses, and housing incentives, directly
increase workers’ compensation (Johnson, 2005). The justification for targeted incentives is that
they use public (or charitable) funds to correct the market failures that arise when compensation
for public service jobs does not reflect the benefits those jobs provide to society.
Targeted financial incentives can be found in a variety of professions including law,
medicine, nursing, teaching, and military service. In law, for example, loan forgiveness and
conditional scholarship plans are available from federal and state governments as well as from
individual law schools to reward employment as a prosecutor, public defender, or legal aid
provider to low-income individuals . As rising higher education costs outpace inflation, some
law schools have increased the debt-reduction incentives they offer. Harvard Law School, for
instance, recently announced that it would supplement its existing loan forgiveness program with
a conditional scholarship for third-year students planning public-interest careers . In medicine,
the American Association of Medical Colleges reports that at least 44 states offer medical
education incentives for doctors who agree to work in remote or economically disadvantaged
areas that have difficulty retaining physicians. 1 Failure to complete the commitment converts the awards into loans that must be repaid.
3
Targeted incentives are also popular in the teaching profession to counter the pervasive
pattern that poor, minority, and low-achieving students are disproportionately taught by teachers
with weak academic backgrounds and little experience and training (Becker, 1952; Clotfelter,
Ladd, & Vigdor, 2005; Decker, Mayer, & Glazerman, 2004; Lankford, Loeb, & Wyckoff, 2002).
They are also used to attract talent to subject areas such as computer science and chemistry in
which demand exceeds supply at prevailing salaries (Jacobson, 2006; Johnson, 2005; Kirshtein et
al., 2004). As of 2004, twenty-five states were implementing loan forgiveness or scholarship
programs aimed at staffing shortage subject areas, and twelve states were managing loan
forgiveness or scholarship programs designed to attract teachers to hard-to-staff schools
(Johnson, 2005). Recruitment and retention incentives for teachers have also become more
prevalent at the federal level. Legislation in 1998 allowed up to $5,000 of an individual’s federal
Stafford Loans to be forgiven at the end of a five-year teaching spell in a low-income school.
With the Taxpayer-Teacher Protection Act of 2004, Congress temporarily raised the maximum
Stafford Loan forgiveness allowance to $17,500 for teachers of mathematics, science, or special
education (U.S. Department of Education, 2004), and passage of the Higher Education
Reconciliation Act of 2005 made the increase permanent (Spellings, 2006).
Despite the popularity of targeted incentives in law, medicine, and education, little is
known about their effectiveness in attracting skilled professionals to public service jobs and in
keeping them in these jobs long enough to make real contributions (Glazerman et al., 2006;
Jacobson, 2006; Kirshtein et al., 2004; Snipes, Quint, Rappaport, & Schofield, 2006). One
informative study makes use of data from a natural experiment on teacher retention bonuses in
North Carolina. Using a difference-in-differences analytic strategy, Clotfelter, Glennie, Ladd,
and Vigdor (2008) found that a $1,800-per-year retention bonus—which targeted licensed
4
mathematics, science, and special education teachers working in high-poverty or academically
failing secondary schools—reduced eligible teachers' turnover rates by 17 percent, or 5
percentage points. In the first year of implementation, 2001-02, the bonus was worth between 4
and 5 percent of an average teacher's salary in the state, which suggests that even modest
financial incentives may influence teachers' decisions to remain in hard-to-staff schools.
The most rigorous research on the impact of education-based incentives comes from a
study in which Field (2009) examined data from a controlled, randomized financial aid
experiment conducted at NYU Law School from 1998 through 2001. She found that students
who received a conditional scholarship had a 36- to 45-percent higher rate of first job placement
in public interest law than those who received a financially equivalent loan forgiveness package.
Field concluded that psychological debt aversion may explain why conditional scholarships had
a greater impact on the job choices of law students than financially equivalent loan forgiveness
programs. However, Field's study did not address the absolute effectiveness of either type of
program.
A Natural Experiment in California
This study examines the impact of the California Governor’s Teaching Fellowship, a
$20,000 conditional scholarship designed to attract academically talented, newly licensed
teachers to schools in the bottom half of the state's Academic Performance Index2 (API) and
retain them in low-performing schools for at least four years. Only prospective teachers who
were enrolled in accredited, post-baccalaureate teacher licensure programs in 2000-01 or 2001-
2 A school's ranking on the Academic Performance Index is a function of students' performance on the Statewide Testing and Reporting (STAR) program of annual standardized tests (California Education Code, Section 69612-69615.6, 2000).
5
02 were eligible to apply. The fellowship was “merit-based” (California State University Office
of the Chancellor, 2002, p. 5) and competitive, targeting “the ‘best and brightest’ of California’s
full-time preservice teaching candidates” (p. 7). Applicants submitted undergraduate and
graduate school transcripts, letters of recommendation, a resume, and a personal essay, and were
interviewed by telephone. In 2000-01, the state awarded 249 fellowships, and 245 recipients
accepted the awards. In the program’s second year, 2001-02, the state awarded 947 fellowships,
of which 945 were accepted. The following year, the program was discontinued due to high
overhead costs and statewide budget constraints (California Legislative Analyst's Office, 2002).
The full amount of the fellowships was paid at the time that the awards were issued, and
recipients who did not fulfill their four-year commitments to teach in low-performing schools
after becoming licensed were required to repay $5,000 per year of service not completed.3 By
effectively granting teachers $5,000 for each year of qualifying service, the fellowship offered a
15.1 percent annual premium over the 2000-01 average starting salary of $33,121 for California
teachers (American Federation of Teachers, 2002).
Of importance to our study, the GTF intervention was a financially attractive add-on to a
longstanding loan forgiveness program for California’s teacher-licensure candidates, the
Assumption Program of Loans for Education (APLE). The baseline APLE contract forgives
between $11,000 and $19,000 of student loans4 in exchange for four years of service in shortage
subject areas or hard-to-staff schools, including low-income, low-performing, rural, and poorly
3 As of April 2008, 864 out of the 1,190 GTF recipients who ultimately accepted the award (73%) had completed their service commitment or repaid the state. Another 223 (19%) had repaid at least part of the award, and the remainder were still completing the service commitment or were on leave from a qualifying teaching position. 4 Teachers of mathematics, science, or special education qualify for an additional $1,000 per year, and teachers of those three subjects working in schools with API rankings in the bottom 20% can earn yet another $1,000 annually. Thus, the largest possible award over four years is $19,000.
6
staffed schools.5 Because the APLE program tracks the teaching jobs of its contract recipients for
up to four years after they earn teaching licenses, we use a dataset of individuals who received
APLE contracts in the academic years from 1998-99 through 2002-03 to estimate the effects of
GTF availability on the employment decisions of newly licensed, academically talented teachers.
Since the 1998-99 academic year, when the APLE program expanded from 400 to 4,500
the number of loan forgiveness contracts offered per year, these contracts have been widely
available to California teacher-licensure candidates, and APLE recipients have constituted a very
large subset of teachers pursuing first-time teaching licenses in the state. Between the 1999-00
and 2002-03 academic years, the number of standard, in-state APLE contracts awarded each year
exceeded the number of first-time, in-state teaching licenses by an annual average of 2,612, or 86
percent (Burke & Errett, 2000, 2001, 2002, 2003; California Student Aid Commission, 2004).
This is possible because, while the standard APLE contracts are targeted (with a few exceptions)
at teachers without prior licenses, some may nevertheless have held prior emergency credentials.
It is also possible because not all APLE recipients went on to earn their licenses. Even among
those who did earn licenses, not all recipients entered qualifying teaching positions. In our
analytic sample of APLE recipients from 1998-99 through 2002-03, only 71 percent reported that
they taught in public schools in California within the next two years. This suggests that many
licensure candidates pursue APLE contracts without a decisive plan to fulfill the teaching
commitment specified in the contract. This pattern may be due to the relative ease of contract
attainment. The two-page APLE application can be quickly completed by hand. Recipients are
5 APLE's designated shortage subject areas fluctuate but have included mathematics, science, bilingual education, reading specialist, special education, and foreign language. The qualifying school categories include low-income school (where at least 30% of the students qualify for free/reduced lunch or public assistance), very low-performing schools (scoring in the bottom 20% of the state), rural schools, or schools with a large share of emergency-credentialed teachers (California Student Aid Commission, 2004).
7
chosen by their licensure programs, and as the APLE program have expanded, these programs
have had to work aggressively to award all the contracts allocated to them (California Student
Aid Commission, 2005). The APLE program is critically important for this study because it is
the only dataset that tracks the school-level employment choices of a large subset of novice
California teachers in the four years after they became licensed teachers.
Research Questions
This study exploits a statewide policy discontinuity—the sudden arrival and subsequent
disappearance of the GTF—to obtain unbiased estimates of the award’s causal impact on the
early-career decisions of its recipients. In particular, we ask: to what extent did receiving a GTF
increase the probability that an academically talented novice teacher took a job in a low-
performing school?
Our second question is descriptive rather than causal. It concerns the retention rates of
GTF recipients versus non-recipients in low-performing schools. Specifically, we ask:
Conditional on beginning to teach in a low-performing school, how much longer did GTF
recipients remain in the set of low-performing schools, as compared to non-recipients?
II. Research Design
Datasets
Our dataset includes information merged from three agencies: the California Student Aid
Commission (CSAC), which administers the APLE program, the California Commission on
Teacher Credentialing (CCTC), which issues teaching licenses, and the California State
University Chancellor’s Office (CSUCO), which administered the Governor’s Teaching
8
Fellowship program. It contains annual panel data on 29,358 teacher-licensure candidates who
received APLE contracts between the 1998-99 and 2002-03 academic years. The dataset tracks
individuals’ school placements longitudinally through the completion of their fourth teaching
year, the full payoff of their student loans, or the 2004-05 academic year—whichever occurred
first. In addition, the data describe which APLE recipients received GTF awards during the two
years of fellowship availability. We find that 725 of the 1,196 GTF recipients (61 percent)
appear in the database of APLE recipients. During the time that both awards were offered, an
APLE contract was far easier to obtain than a GTF and permitted recipients to work in a broader
variety of high-need schools and subject areas (see footnote 5) than the GTF. Thus, it is
reasonable to assume that the 39 percent of GTF recipients who do not appear in the APLE
database did not have enough undergraduate or graduate school student loans to justify their
pursuit of APLE contracts.6 This assumption limits the generalizability of our results to teacher
licensure candidates who have outstanding student loans.
To reflect the information publicly available to newly licensed teachers at the time of
their job searches, the Academic Performance Index rankings that we use to classify schools as
low-performing come from two years prior to the year of qualifying employment.7 However,
because California did not introduce the API ranking system until 1999, API rankings from 1999
are used to classify schools in which teachers worked prior to and during 2000-01.
6 It is also possible that errors in coding social security numbers prevented some matches of GTF files, test score files, and APLE files, though the people conducting the match spot-checked the name matches at our request. 7 Rankings from two years prior to the employment year were used because licensure candidates typically begin seeking employment during spring and summer of the school year before they begin teaching. At that point, the available school rankings are based on students’ test scores from the previous year. For instance, a teacher newly employed in a low-performing school in 2002-03 would have pursued that job in the spring or summer of 2001-02, when the available school rankings would have been based on students' test scores in 2000-01. In each GTF year, the state made available a list of eligible low-performing schools based on the most recently published test scores and school rankings. As long as their schools appeared on the most recent list of low-performing schools, teachers were not penalized if the schools’ rankings had risen by the time they began working there.
9
Sample
As noted, our analysis is limited to teacher licensure candidates who received APLE
contracts between 1998-99 and 2002-03. This five-year window includes two years immediately
prior to GTF availability, two years during which the GTF was offered, and one year following
GTF availability. From that subset of 29,358 APLE recipients, we exclude 479 individuals who
were enrolled in district- or county-based licensure programs, since the GTF required enrollment
in traditional licensure programs administered by higher education institutions. We further
exclude 1,382 individuals with missing gender codes, 343 due to missing licensure test scores,
and 48 due to missing age indicators. This leaves us with an analytic sample of 27,106 licensure
candidates, of whom 718 (2.65 percent) were GTF recipients.
Measures
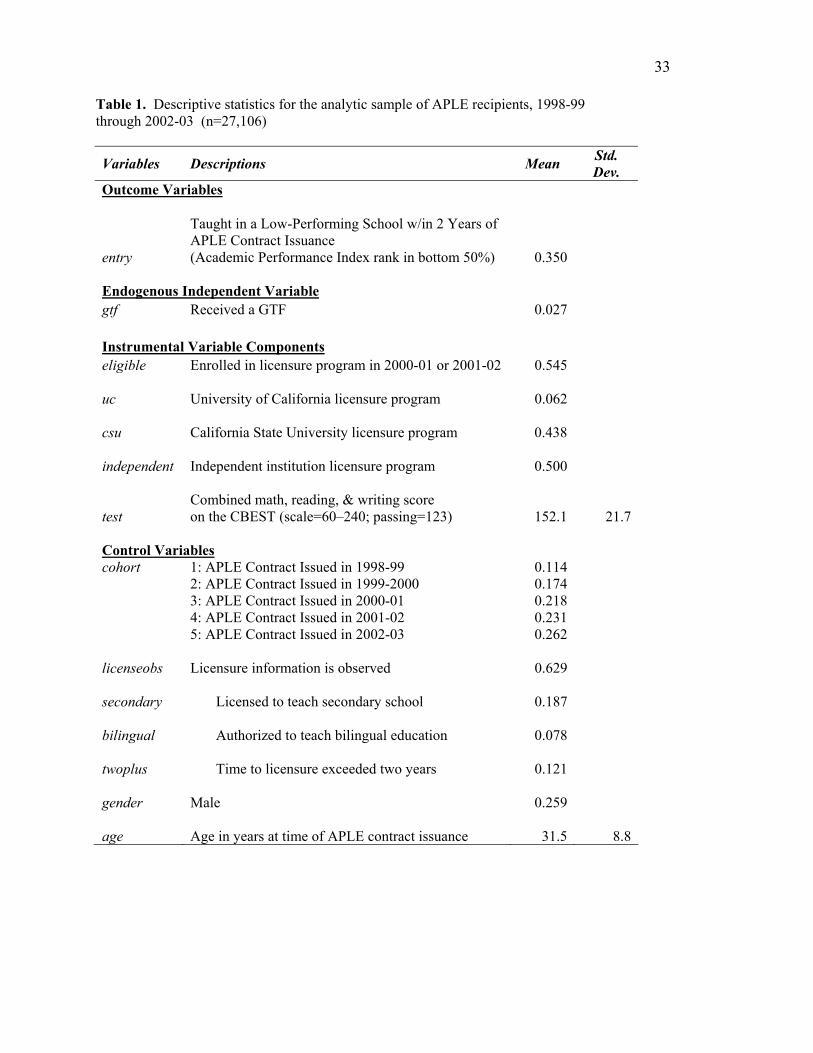
Table 1 presents descriptive statistics for the sample. The outcome variable that addresses
the first research question, entry, is time-invariant and dichotomous; it describes entry into a
teaching job in a low-performing school within two years after receiving an APLE contract.8 The
endogenous predictor of interest, gtf, is also dichotomous; it describes whether an individual
received a GTF award and is coded 1 for 2.65 percent of the sample. The exogenous variable,
eligible, is a dichotomous indicator coded 1 if the individual was enrolled in a licensure program
during either year of GTF availability (2000-01 or 2001-02), and 0 if enrolled exclusively in the
two years prior to GTF availability (1998-99 or 1999-2000) or the year after (2002-03). In the
8 57.4 percent of the sample reported entering a teaching position within two years, while 35 percent reported entering a low-performing school.
10
sample, 54.5 percent of individuals were enrolled during GTF program years, while 19.4 percent
were enrolled in licensure programs exclusively in the years prior to GTF availability, and 26.2
percent began their enrollment in the first post-GTF year.9
<Insert Table 1>
The dataset also includes selected academic background variables. Test is the individual’s
highest combined licensure test score in reading, mathematics, and writing as measured by the
California Basic Educational Skills Test (CBEST). Possible CBEST scores range from 20 to 80
per section, and the minimum combined passing score is 123. In the sample, test has a mean of
152.1, a range from 60 to 232, and a standard deviation of 21.7. The distribution has a modest
right skew of 0.58 and shows no apparent ceiling effect.
Our other academic background variables include a set of dichotomous indicators of
licensure-program institution type. Of APLE recipients in the sample, 6.2 attended University of
California programs; 43.8 percent attended California State University programs, and 50 percent
attended programs at independent colleges and universities. The latter category includes several
large, vocationally oriented institutions such as National University, Azusa Pacific University,
and Chapman University, as well as a few private liberal arts colleges such as the University of
Southern California and Claremont McKenna. By way of comparison, the distribution of
teachers who earned their first-time California licenses in 2006-07 included 9.4 percent from the
9 We determine each individual’s enrollment period starting from the year in which that person received an APLE contract, and ending with the individual’s next credential year. Because licensure programs are encouraged to promote APLE widely among their licensure candidates (California Student Aid Commission, 2005), we assume that the APLE contract year corresponds to the first enrollment year. This assumption is consistent with credential dates and dates of GTF receipt in the dataset.
11
University of California; 44.2 percent from the California State system; and 46.4 percent from
independent programs, suggesting that University of California licensure candidates are
modestly underrepresented in the APLE dataset (Clark & Suckow, 2008).
We code the year that individuals received their APLE contracts chronologically from 1
to 5 and use this control variable, cohort, to capture any secular linear trend in the probability of
entering the set of low-performing schools. During the period under study, the California
legislature expanded the number of APLE contracts that were issued, raising it from 4,500 in
1998-99 to 7,500 in 2002-03. The distribution of cohort values in the sample that are displayed
in Table 1 therefore reflects the APLE program’s expansion over time. 10
We also control for characteristics of the teaching licenses the APLE recipients pursued.
Secondary is a dichotomous predictor coded 1 if the individual earned a license to teach
secondary school, and zero otherwise. Bilingual is a dichotomous indicator of whether the
individual obtained a Bilingual Cross-Cultural Language and Development (BCLAD)
authorization, which is a supplement to the main teaching license and indicates that the
individual is fluent in at least two languages. Because the dataset tracks employment only
through 2004-05, our analysis examines the probability of beginning to teach in a low-income
school within two years after receiving an APLE contract. This time frame takes into account the
fact that the majority of traditional licensure programs in California can be completed with one
year of full-time, post-baccalaureate enrollment, and the modal time to licensure in the sample is
one academic year. However, because 12.1 percent of APLE recipients in the sample obtained
their first teaching licenses more than two years after receiving APLE contracts, we identify
10 The GTF enrollment-year indicator, eligible, does not perfectly correspond with cohort because some individuals were enrolled in their licensure programs for multiple years. In our analytical sample, 17.4 percent of GTF-eligible individuals are members of APLE cohorts 1 or 2.
12
these individuals using a dichotomous control variable, twoplus.11 Finally, because these
licensure variables are missing for 37.1 percent of the analytic sample (some of whom obtained
first licenses within that time), we create a missingness indicator, licensobs, to interact with these
licensure variables in the main analysis. It is coded 1 if the licensure information is observed, and
0 if it is missing.
The analytic dataset also includes a gender variable, as well as a variable indicating age
at the time of APLE contract issuance—both of which we include in the analysis. However, we
do not include race/ethnicity covariates due to very low race/ethnicity self-reporting rates in the
years prior to and concurrent with GTF availability.
Analytic Methods
Our objective is to estimate the causal impact of the GTF award on the decisions of
newly licensed teachers to enter and remain in low-performing schools. The linear probability
model hypothesized to describe this relationship is given in Equation 1: 12
(1)
where Xi is a vector of exogenous control variables for individual i, including APLE cohort year,
licensure and demographic information, and academic background. The parameter of interest is
β1, which represents the effect of receiving the GTF on the probability that individual i will enter
a low-performing school.
11 We retain them in the main analysis because a small proportion did teach in low-performing schools within two years, and because licensure date is missing for some individuals. Removing them from the analysis does not have a notable impact on the IV estimate of the GTF effect or on its standard error. 12 See Angrist and Pischke (2009, pp. 94-99) for a rationale for the use of the linear probability model. We find that fitting a probit model instead does not substantively alter our results.
iiii Xgtfentry εβββ +++= )()( 210
13
Because GTF awards were not randomly assigned, those who applied for and received
the awards may have differed systematically from non-recipients in unobserved ways. An
ordinary least squares (OLS) estimate of β1 is therefore vulnerable to selection bias, though the
direction of the bias is not self-evident because there are two unobserved selection processes in
the assignment of the GTF. Licensure candidates must first choose to apply for the GTF, and the
selection committee must then choose GTF recipients from among the pool of applicants. It is
plausible (though not certain) that individuals who applied for the GTF would have had stronger
predispositions to teach in low-performing schools than those who did not apply, suggesting that
an OLS estimate of the GTF effect would overstate the fellowship’s causal impact. However, it
is also plausible that an OLS estimate would understate the causal impact of the GTF. The reason
is that the GTF selection committee, which had access to applicants’ undergraduate and graduate
transcripts, as well as their resumes, writing samples, phone interviews, and recommendation
letters, may have chosen applicants with the most promising labor market prospects both within
and outside of teaching.13 Given that our dataset does not include the rich collection of
information that was available to the selection committee, GTF recipients may have been less
likely, on average, than observably similar non-recipients in our dataset to teach in low-
performing schools in the absence of the incentive.
Fortunately, the availability of the GTF in 2000-01 and 2001-02, but in no other
academic years, provides an exogenous policy discontinuity leading to a natural experiment in
fellowship eligibility that we use to identify the causal impact of the GTF on its recipients. We
capitalize on this discontinuity and implement an instrumental variable (IV) strategy (Angrist,
13 The first and only GTF annual report notes that Year 1 GTF recipients were chosen from “over 600” applicants, meaning that the applicant acceptance rate was lower than 41.6 percent (California State University Office of the Chancellor, 2002). Though the number of applicants in Year 2 is not available, and the number of fellowships offered that year was four times larger, selection committee members recalled that the number of applicants increased proportionally, yielding a similar, if not lower, acceptance rate.

14
2006), in which we use the dichotomous indicator of a licensure candidate’s enrollment during
GTF availability, eligible, as our principal instrument. The GTF eligibility indicator meets the
criteria for an effective instrument, provided that it has a monotonic relationship to the
endogenous predictor, gtf; it is not subject to reverse causation from the endogenous predictor;
and it meets the “exclusion restriction,” meaning that, conditional on covariates in the model, it
is related to the dependent variable, Yi , only through its relationship to gtf (Angrist & Pischke,
2009, p. 117).
Logically, the first condition is satisfied because only those participants who were
enrolled during the GTF years could receive a GTF, forcing the relationship to be positive. (We
discuss the empirical strength of the relationship below.) To meet condition 2, we must establish
that individuals’ preferences for teaching in low-performing schools did not actually drive their
decisions to enroll in teacher licensure programs in GTF years. It appears that this threat is
minimal because the GTF was short-lived and, according to selection committee members, it was
not well publicized. Our search of Google News Archives and LexisNexis Academic
corroborated this assertion: We found only 25 newspaper references to the GTF across the state
between August 1999 and January 2003, and approximately half were either passing references
to the award or short announcements congratulating local award winners. In addition, two stories
contained in-depth reporting about teacher shortages with references to the GTF, but none
focused primarily on the GTF. Moreover, the GTF was not publicly announced until mid-
November of the first implementation year, at a time when the December/January deadlines for
admission to more competitive licensure programs in the subsequent year were fast approaching.
In compliance with the third condition, the exclusion restriction, we control for any
additional relationship between enrollment in a GTF year and the probability of teaching in a
15
low-performing school by including the main effect of the linear APLE cohort term in the fitted
regression model. This term is intended to capture the effect of any secular trend in the
probability of entering a low-performing school during the period under study.
Our instrumental variables methodology is similar to that used by Imbens & van der
Klaaw (1995) to study a change in military service requirements in the Netherlands. The first-
stage model is given by Equation 2:
(2)
In this equation, receipt of a GTF is a function of the main effect of eligible and the two-way
interaction of eligible with Ai, where Ai is a vector of observable academic background traits
including licensure test scores and licensure institution type—UC, CSU, or independent. We thus
treat both eligibility and its differential effect on academically talented licensure candidates as
instruments. Covariates include the main effects of vectors Ai and Ki, where the latter includes
participant gender and age, as well as information about the teaching license, including the
variables secondary, bilingual, twoplus, as well as the missingness indicator licenseobs and its
interaction with the latter three licensure terms. Ki also includes a linear term indicating APLE
cohort year.
Finally, the second-stage IV equation is previously described in Equation 1, with X
representing the vectors of individual characteristics Ai and Ki. However, in the second-stage
model, the fitted values of igtf from the first stage (which are strictly a function of the
exogenous instruments and covariates) replace its endogenous observed values. Following the
advice of Angrist and Pischke (2009), the first and second stage models are fitted using two-
stage least squares.14
14 See Angrist and Pischke (2009, chapter 4).
iiiiii KAAeligibleeligiblegtf δγγγγγ +++++= )()()*()( 43210
16
Our second research question asks whether GTF recipients who began teaching in low-
performing schools remained in those schools longer than their counterparts who did not receive
the GTF. It is important to note that the decision to begin teaching in a low-performing school
can be understood as a function of not only GTF receipt (the unbiased effect of which we attempt
to estimate in response to question 1) but also of unobserved factors. In the self-selected subset
of entrants to low-performing schools, these unobserved factors cannot be assumed to be
independent of the question 1 instruments.15 Consequently, we are unable to estimate the causal
impact of the GTF on the probability of leaving the set of low-performing schools in a given
teaching year. The relationship we estimate between receipt of the GTF and retention in the set
of low-performing schools should instead be understood as descriptive.
We estimate this descriptive relationship between receipt of a GTF and persistence in
low-performing schools using discrete time survival analysis (Singer & Willett, 2003). This
method requires us to separate the sub-sample of participants who entered a teaching position in
a low-performing school and reformat their longitudinal retention data into person-period format.
In a person-period dataset, each teacher contributes multiple rows to the dataset—one per year of
his or her career in a low-performing school. The time-varying outcome variable exitij is coded 1
if the ith teacher leaves the set of low-performing schools by the end of each teaching year j. A
teacher is said to experience the exit event in year j if she teaches in a low-performing school in
year j but not in year j+1. Once a teacher exits, she is removed from the “risk set” in subsequent
periods and contributes no more rows to the person-period dataset. 15 To consider a hypothetical example, imagine that the unmarried proportion of GTF recipients entering low-performing schools was higher than the unmarried proportion of non-recipients entering low-performing schools. Because question 1 attempts to estimate the average behavior of GTF recipients relative to their unobserved average behavior in the GTF’s absence, this kind of heterogeneous treatment effect would not confound our estimates of the GTF’s local average treatment effect on its recipients. However, it would confound any estimate of the GTF’s causal effect on retention in low-performing schools, because in the subset of entrants to low-performing schools, receipt of a GTF would be correlated with an unobserved variable—marital status—which might also affect retention behavior.
17
With up to four years of employment data for each APLE recipient, it is possible to
determine only whether individuals exited the set of low-performing schools by the end of their
first, second, and third teaching years. Those who taught four years are said to be “right-
censored” (Singer & Willett, 2003, p. 319) because there is no indication of how long they taught
beyond year four or whether they “survived” to teach in year five. There are two other types of
right-censoring in this dataset. Teachers whose student loans were fully repaid before they
completed four years of service are right-censored in their final teaching year, as are those who
were teaching in 2004-05—the final year of employment records in the dataset—and had not
fulfilled their four-year obligations by the end of that year.
OLS regression estimates from a linear probability model allow us to investigate the
“risk” or hazard (i.e., the conditional probability) of exit from low-performing schools in the
subsample of those who entered such schools as a function of predictors in the person-period
dataset (Singer & Willett, 2003). The hazard probability of exit from the set of low-performing
for individual i in teaching year j is thus given by Equation 3:
(3)
where ijexit is the probability that individual i will leave the set of low-performing schools by
the end of teaching year j; vectors Ai and Ki are defined as above; and gtfi is the endogenous,
observed GTF-award indicator for individual i. Given that the analysis in Equation 4, is time-
varying, Ti1, Ti2, and Ti3, are dichotomous variables representing teaching years 1, 2, and 3
respectively, and their coefficients, α1 through α3, represent the fitted probabilities of leaving the
set of low-performing schools by the end of each year, holding constant the other terms in the
model. The descriptive parameter of interest is 1λ , which expresses the time-invariant difference
in exit risks between GTF recipients and non-recipients.
ijiiiiiiij KAgtfTTTexit ζλλλααα ++++++= )()()()()()( 321332211
18
III. Findings
First Stage: Characteristics of GTF Recipients
Because the GTF was targeted at teacher licensure candidates with strong academic
backgrounds, we expect the effect of enrollment in a GTF year on the probability of receiving a
GTF to differ by individuals’ academic characteristics. We validated the usefulness of this
approach by discussing the GTF selection process with the former director of the GTF program
and three former members of the twelve-person GTF selection committee. These interviews
revealed that, while priorities varied among the selection committee members, there was a
common desire to choose candidates with strong academic backgrounds (especially as measured
by grades and course work) as well as candidates whose skills or demographic characteristics
were underrepresented in the teacher labor market.
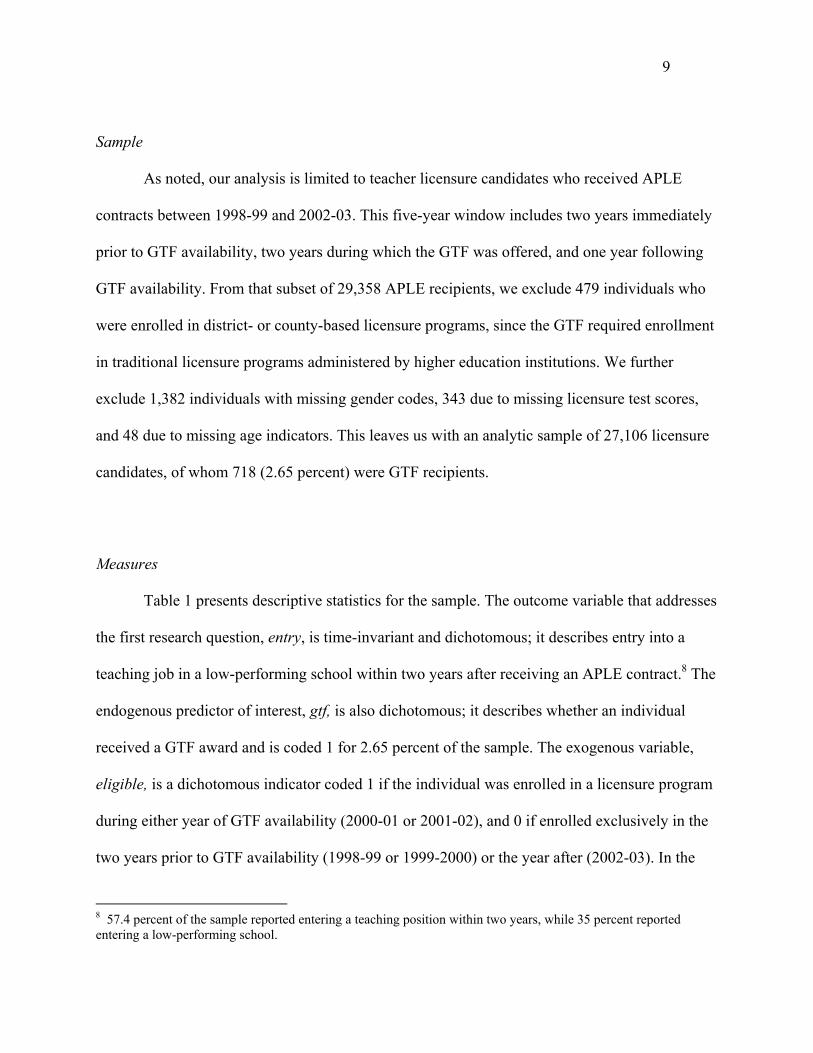
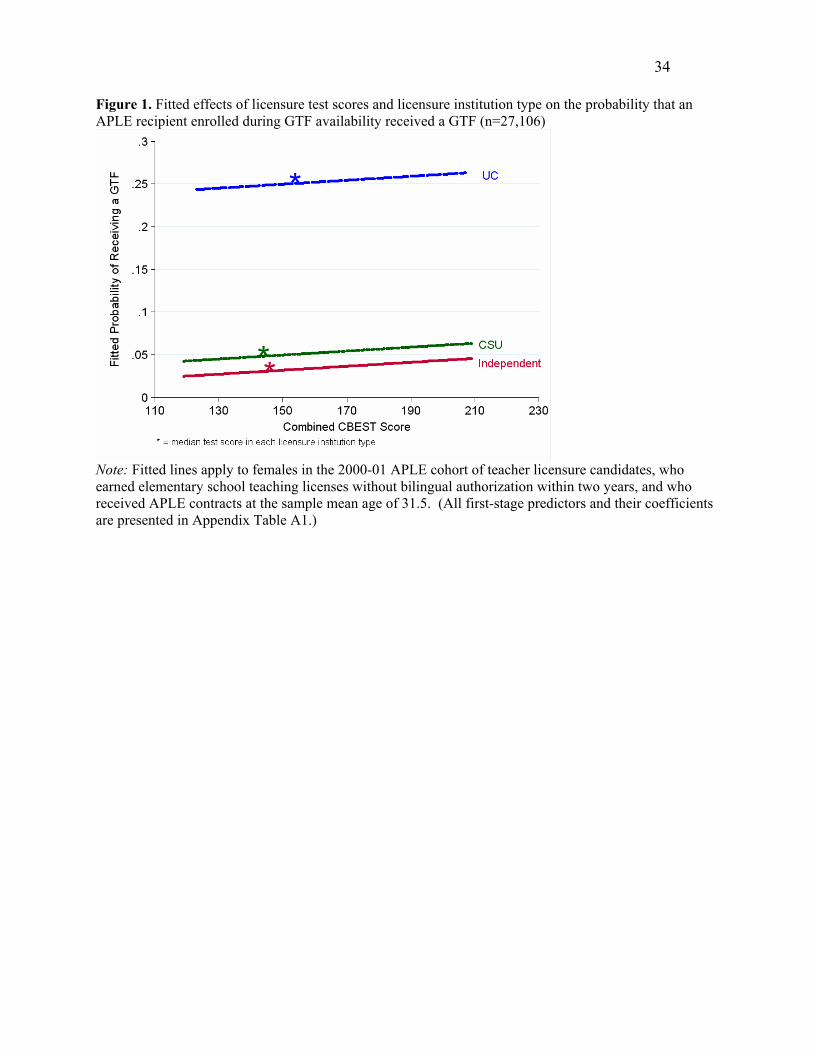
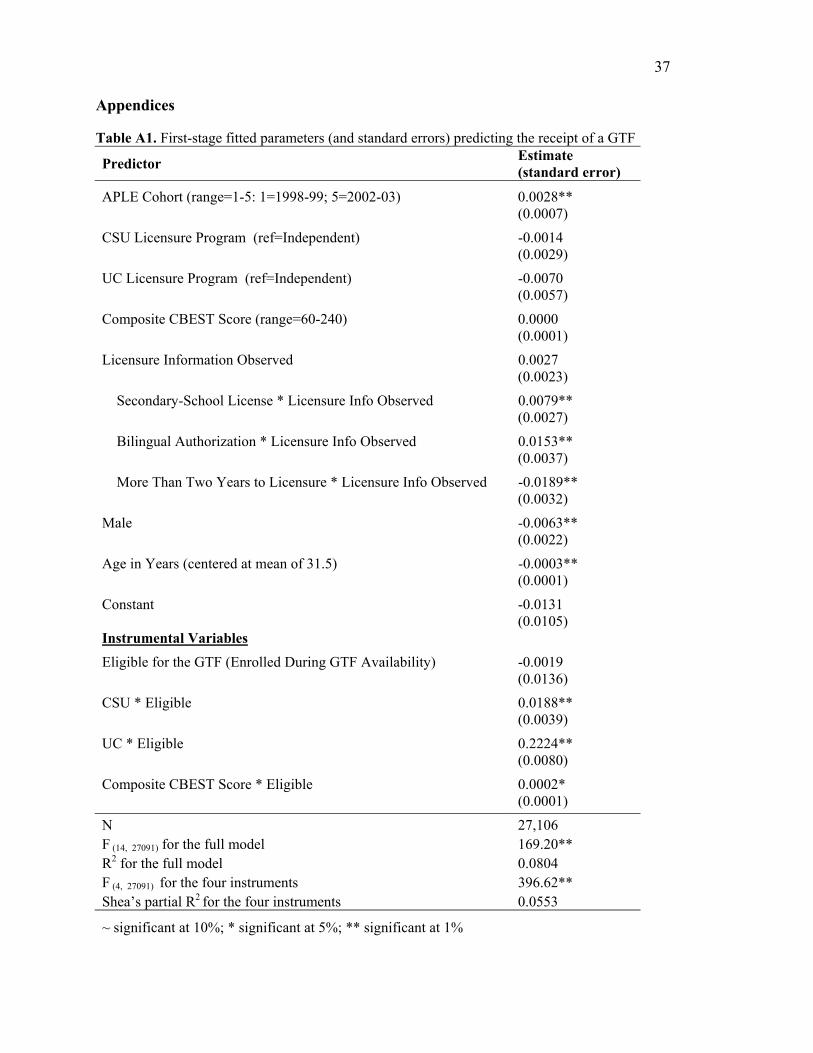
These impressions are consistent with the results of our first-stage model, which
estimates the differential impact of enrollment in a GTF year on licensure candidates with
different academic backgrounds as measured by our dataset. Figure 1 illustrates the fitted effect
of enrollment in a GTF year on the probability of receiving a GTF as a function of CBEST
licensure test scores and licensure institution type (UC, CSU, or independent). The
corresponding first-stage parameter estimates are shown in Appendix Table A1.
<Insert Figure 1>
The most striking feature of the figure is the difference between the probability of
receiving a GTF for licensure candidates who were enrolled in a University of California (UC)
19
program in GTF years versus those who were enrolled in a California State University (CSU) or
independent program. The fitted trend lines apply to 31-year old female elementary school
teachers who received APLE contracts in 2000-01 (cohort 3) and were not authorized to teach
bilingual education. At any given licensure test score, the fitted probability of receiving a GTF
for a licensure candidate at UC institution is 20.4 percentage points higher than the probability
for a CSU licensure candidate and 22.2 percentage points higher than for a licensure candidate at
an independent college or university. The difference in fitted probabilities between UC licensure
candidates and the other two groups is statistically significant (p<.001), while the fitted
probabilities for candidates at CSU and independent institutions are not distinguishable from
each other at the 5-percent alpha level. When we asked GTF committee members whether their
preference for UC students was deliberate, they indicated that it was not. However, they
speculated that these students may have demonstrated especially strong academic credentials.
Though licensure test scores were not available to the GTF selection committee, we also
find a positive relationship between composite licensure test scores and the probability of
receiving a GTF.16 For example, holding all else constant, a licensure candidate with a CBEST
score of 193 (the sample 95th percentile) has a 1 percentage-point higher probability of receiving
a GTF than her counterpart scoring at the sample median of 148 (p<.001).
The coefficients associated with secondary-school licensure and bilingual teaching
authorization are also positively and significantly related to receiving a GTF, though due to their
partial missingness, we use these covariates and their interactions with the missingness indicator,
licenseobs, as controls rather than instruments. These estimates are consistent with committee
members’ self-reported preference for candidates with strong content-area knowledge and for
16 The slope of the relationship is not noticeably different when we use only math, reading, or writing scores instead of composite scores as an indicator of academic skills.
20
skills, such as a bilingualism, that were believed to be in short supply among teachers in many
low-performing schools.
The F statistic associated with the four instruments is 396.62 (DFn=4, DFd=27,091;
Fcritical (p=.001) =4.618), which is well above the heuristic minimum F statistic of 10 for strong
instruments (Bound, Jaeger, & Baker, 1995). In addition, the partial R2 attributable to the four
instruments is .0553, meaning that they jointly account for over half of the variance explained by
the first-stage model (full R2=0.0804).
Question 1: Effect of the GTF on New Teachers’ Entry into Low-Performing Schools
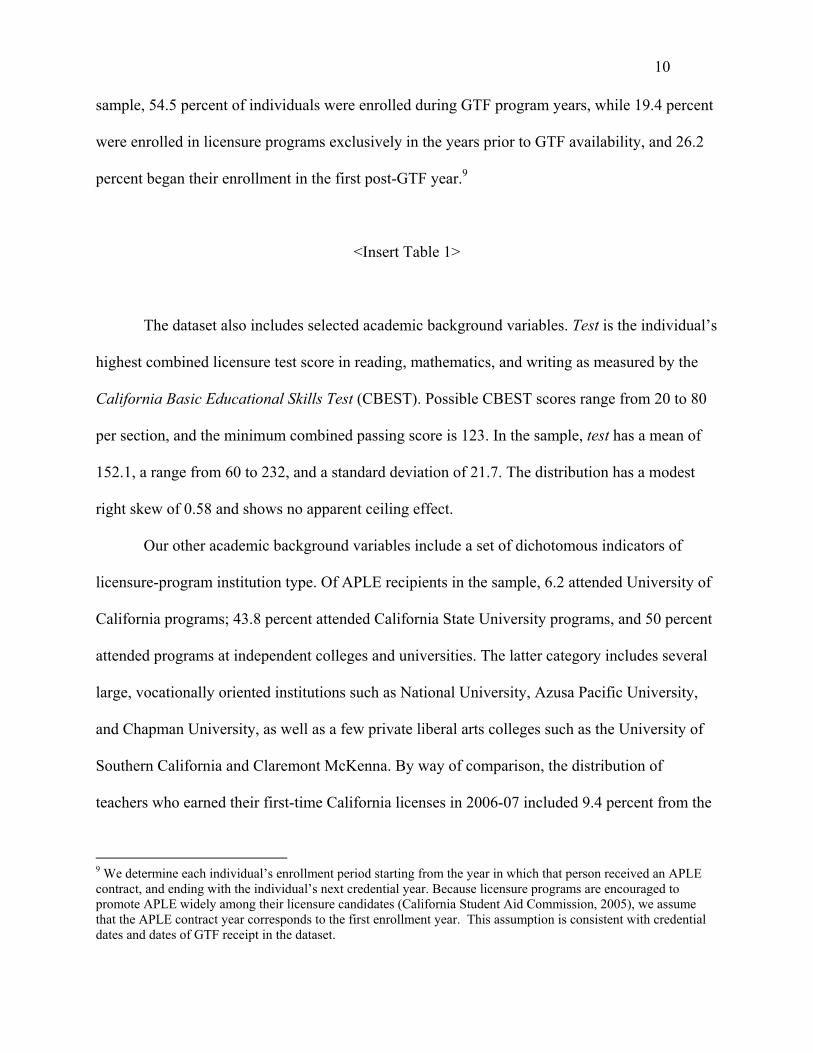
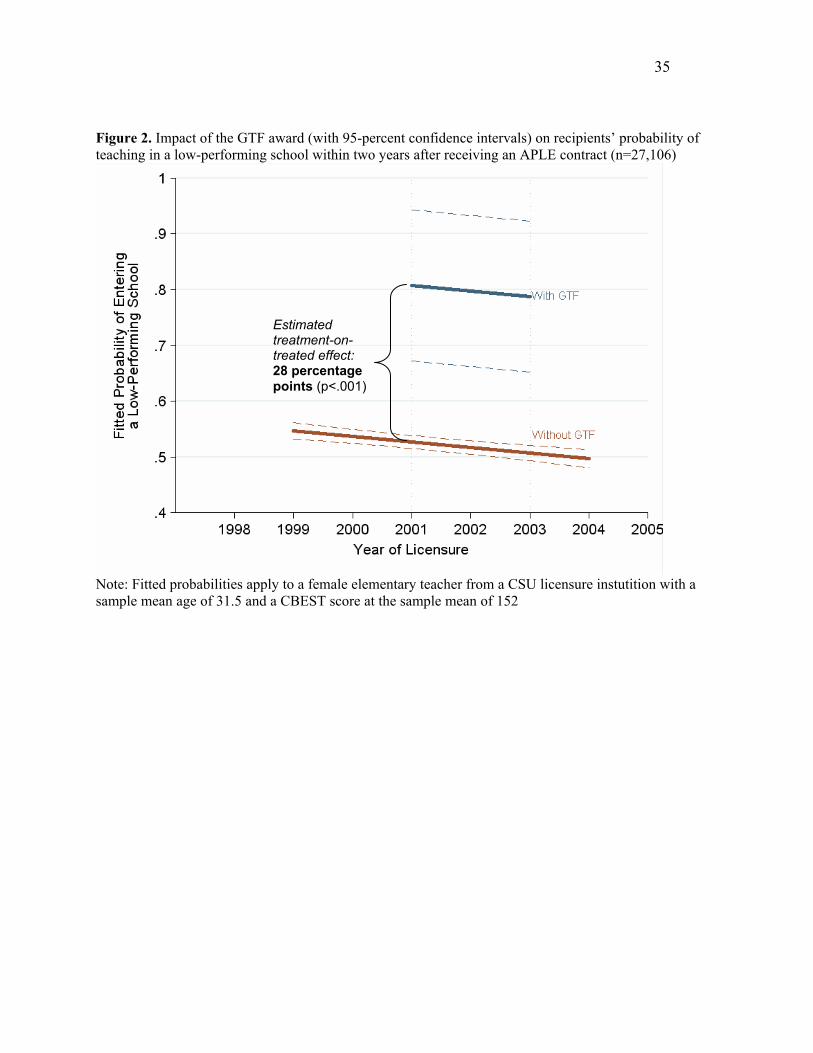
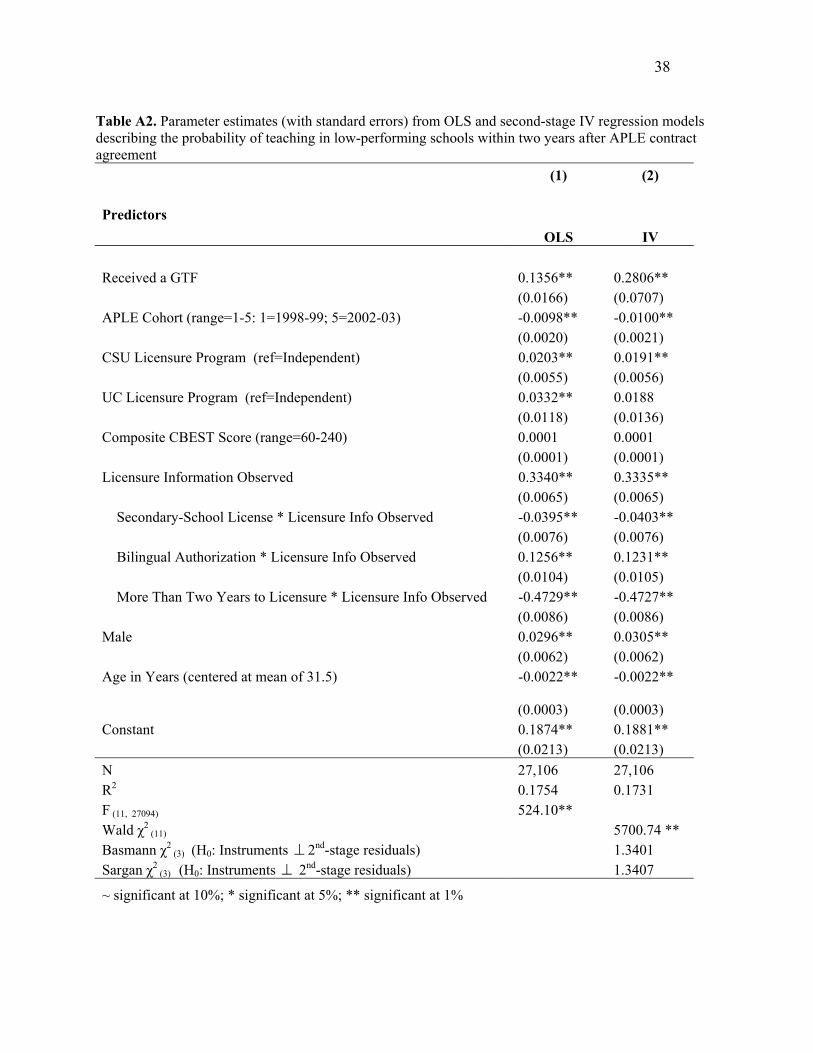
Using the IV strategy described above, we estimate that the GTF award increased by
28.06 percentage points the probability that its recipients taught in low-performing school within
two years of receiving APLE contracts. Figure 2 illustrates this estimated effect. The upper trend
line, plotted between licensure years 2001 and 2003, represents the fitted entry probabilities of
the GTF recipients, and the dotted lines represent the 95 percent confidence interval around the
estimate, ranging from an effect of 14.5 to 41.6 percentage points. The longer, solid line (also
bracketed by its 95 percent confidence interval) represents the fitted counterfactual—the
expected probability that teachers with observably similar academic backgrounds to the GTF
recipients would have taken teaching positions in low performing schools had they not received
the GTF. Another way of stating our central finding is that for every seven GTF recipients who
began working in a low performing school, two would not have done so in the absence of the
incentive.
<Insert Figure 2>
21
To gain a better understanding of possible unobserved differences between GTF
recipients and non-recipients in the sample, we compare the unbiased IV estimate of the GTF’s
effect to an endogenous OLS estimate that simply compares the probability of entry to low-
performing schools among GTF recipients and non-recipients, controlling for the aforementioned
vectors of covariates. As noted above, if GTF recipients were more predisposed than other
licensure candidates to take jobs in low-performing schools, we would expect the OLS estimate
to be larger than the IV estimate, indicating an upward bias. Alternatively, given that the
selection committee had access to a comprehensive range of information about GTF applicants,
they may have chosen fellowship recipients with especially high opportunity costs and a broader
range of employment options even than their observably similar counterparts, particularly as
measured by the narrower set of academic background indicators in our dataset. To the extent
that the committee’s selection process—a potential source of negative bias in the OLS
estimate—outweighs any positive bias due to self-selection in the applicant pool, the OLS
estimate of the GTF effect will be smaller than the unbiased IV estimate. Downward bias is of
special concern due to longstanding evidence that disadvantaged schools make hiring decisions
later in the summer than their more advantaged counterparts, leading them to lose out on top
candidates (Levin & Quinn, 2003; Wise, Darling-Hammond, & Berry, 1987).
The coefficients for both models are presented in Appendix Table A2. Consistent with
our latter hypothesis, we find downward bias in the endogenous OLS estimate. Controlling for
the other terms in the model, GTF recipients’ fitted probability of entering a low-performing
school is only 13.56 percentage points higher than that of non-recipients. This difference from
the IV estimate suggests that the GTF program succeeded in choosing recipients who, in the
22
absence of the fellowship, would have been less likely than other APLE recipients to begin
working in low-performing schools.
Sensitivity Analyses and Test of the Exclusion Restriction
Since the first cohort of GTF recipients began entering the labor market in 2001, around
the onset of the dot-com collapse, one potential threat to the validity of our results is that this
economic shift might have differentially affected academically talented individuals enrolled in
licensure programs in GTF versus pre-GTF years. To test the sensitivity of the IV estimate to the
time trend, we constrained the analysis to include only APLE cohorts 1 through 4 (those who
received APLE contracts before and during the years of GTF availability) and alternately, only
APLE cohorts 3 through 5 (those who received APLE contracts during and after the years of
GTF availability). In the former specification, the fitted IV estimate of the GTF effect is virtually
unchanged at 0.276 (p=0.02), and in the latter case, its magnitude increases only modestly to
0.322 (p=0.001). Because the estimates are relatively stable in direction, significance, and
magnitude even with these cohort restrictions, we conclude that the five-year linear cohort trend
displayed in Figure 2 appropriately controls for secular economic trends in California during the
five years under study.
In addition, because we provide four instruments for a single endogenous predictor, we
can take advantage of the model’s overidentification to test empirically the null hypothesis that
our instruments meet the exclusion restriction described above. Using the Basmann test (1960),
we are unable to reject the null hypothesis (χ2=1.34; df=3; p=0.65). This result suggests that
neither enrollment in a GTF year, nor the differential effect of that enrollment on individuals
with various academic backgrounds, has an independent effect on entry into a low-performing
23
school except by randomly assigning licensure candidates to GTF eligibility. In other words, our
IV estimates appear to be independent of any secular labor market trend.
Question 2: Persistence in Low-Performing Schools among GTF Recipients and Non-Recipients
Our second research question concerns the length of time GTF recipients versus non-
recipients stayed in the set of low-performing schools, conditional on having begun to teach in
such schools. To address this question, we model the conditional hazard of exiting from the set
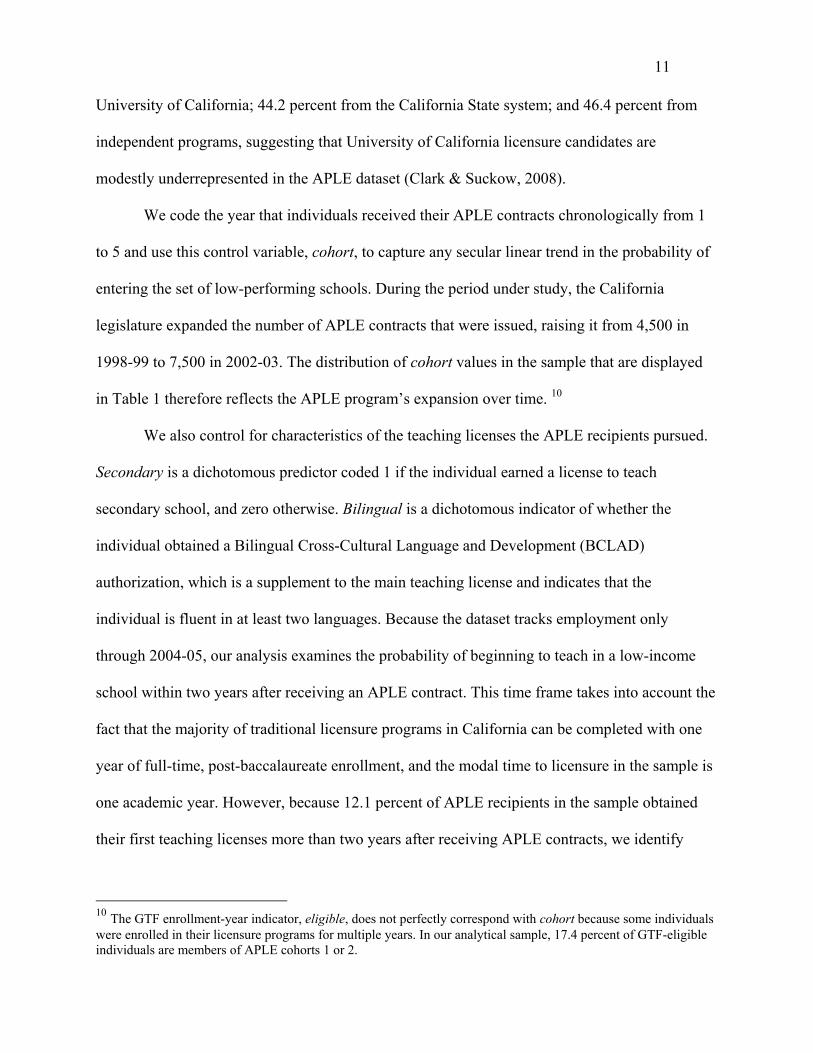
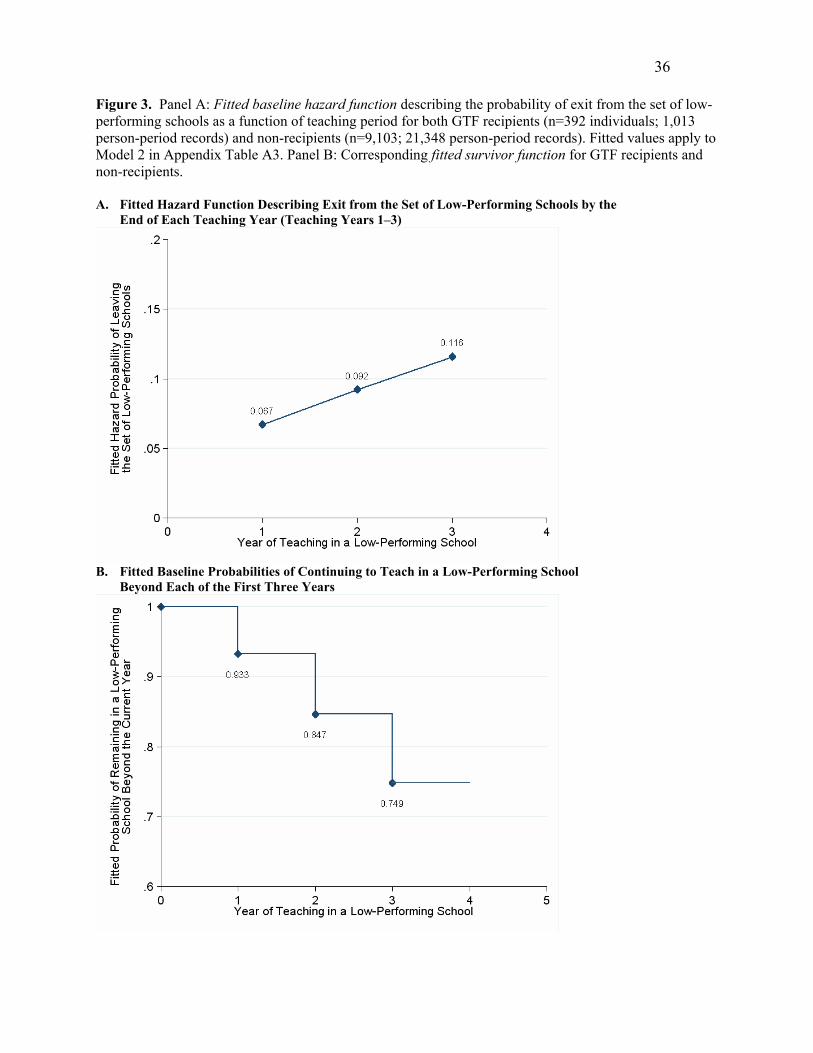
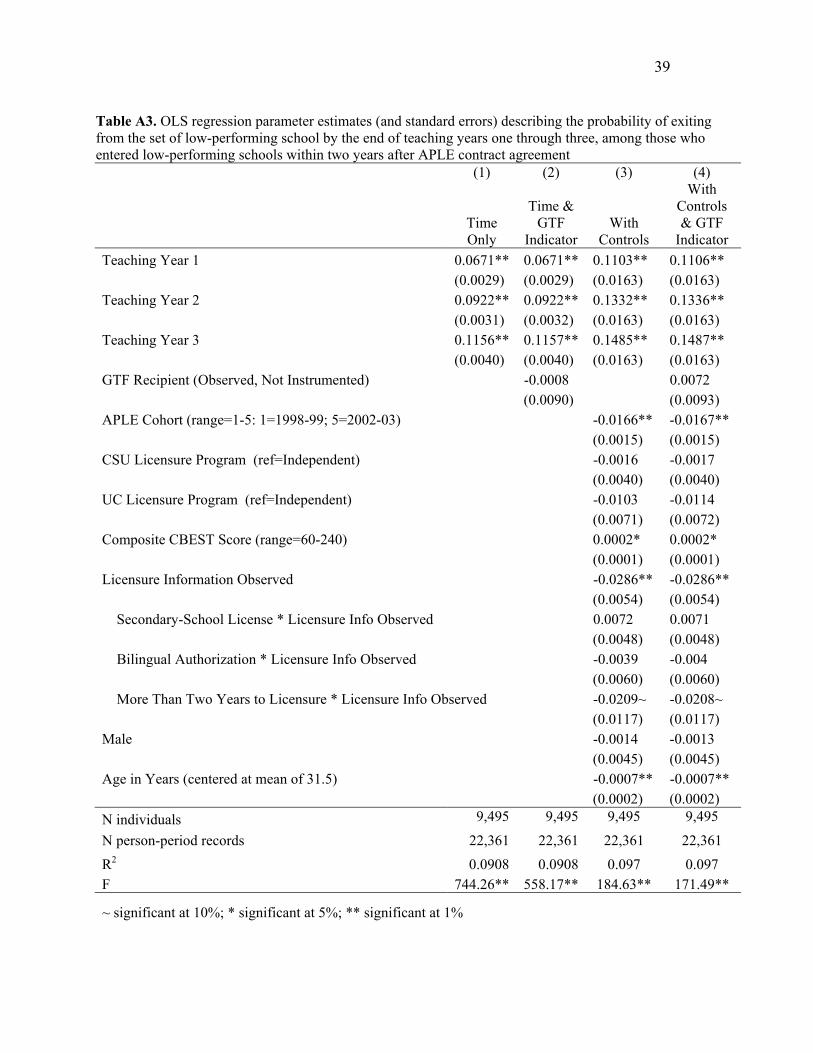
of low-performing schools by the end of each of the first three teaching years. Figure 3 depicts
both the fitted baseline hazard and survivor functions for the 9,495 licensure candidates who
began teaching in the set of low-performing schools within two years after receiving APLE
contracts. Panel A illustrates that, on average, the teachers' fitted hazard probability of leaving
the set of low-performing schools was lowest in the first teaching year, at 0.064, and highest in
the third teaching year, at 0.116. The parameter estimates that we use to generate this plot are
based on Models 1 of Appendix Table A3.
<Insert Figure 3>
A surprising feature of this hazard function is its positive trajectory, indicating that
teachers’ probabilities of exit from low-performing schools increased rather than decreased in
each teaching year, conditional on having “survived” beyond the previous years. While most
models of teacher attrition show new teachers to be at greatest risk of exit in their first two years
on the job (Feng, 2006; Grissmer & Kirby, 1997; Ingersoll, 2003; Murnane, Singer, Willett,
Kemple, & Olsen, 1991; Reed, Rueben, & Barbour, 2006), the pattern shown here could be
attributable to our definition of exit (i.e., leaving all low-performing schools in California rather
than just their initial schools) and to our sample characteristics. Specifically, members of our
24
analytic sample had invested in and completed pre-service teacher preparation programs, and
their APLE contracts may have served as a baseline incentive to persist in their jobs.
As we show in the fitted survivor function in Panel B, an estimated 75.5 percent of
entrants to low-performing schools remained in the set of low-performing schools beyond year
three and persisted into year four. Because APLE tracks its recipients only through their fourth
teaching year, we are unable to say how many left the set of low-performing schools after their
agreements ended at the conclusion of year four.
Because GTF recipients who did not complete their four-year commitments would have
had to repay the state $5000 for each year of unfulfilled commitment, they had an incentive to
stay in low-performing schools longer than non-recipients, all else being equal. However, using
the descriptive discrete-time hazard model described in Equation 4 above, we find no difference
in the hazard probabilities of exit for GTF recipients and non-recipients. In fact, the fitted hazard
and survivor functions are so similar for the two groups that the fitted plots for the full analytic
sample in Figure 3 apply equally well to GTF recipients and non-recipients alone. This is evident
from the fitted coefficients in Model 2 of Appendix Table A3, which are virtually identical to the
coefficients in Model 1, while the coefficient for the endogenous GTF indicator is
indistinguishable from zero.
Because this analysis is strictly descriptive, it is possible that the GTF recipients who
began teaching in low-performing schools differed in unobserved ways from non-recipients who
did so. As a result, we cannot conclude from this retention analysis that the GTF influenced
retention rates either positively or negatively. However, our entry analysis indicates that GTF
recipients in the sample had lower predispositions than non-recipients to teach in low-performing
schools in the absence of the fellowship. If we were to assume no selection bias upon entry into
25
low-performing schools, then we would assume that the GTF recipients who entered these
schools had weaker predispositions to teach there, on average, than their non-recipient
counterparts. This would imply a higher risk of exit in any given teaching year, though that
increased risk could be offset or overridden by the additional $5000 annual benefit of staying.
Again assuming no selection bias at the point of entry to low-performing schools, the lack of
difference in hazard and survivor functions between GTF recipients and non-recipients is
consistent with a scenario in which the GTF’s $5000 annual retention incentive offsets
recipients’ lower baseline inclination to stay.
IV. Discussion
The ideal approach to our research question would be to estimate the effect of the GTF
program on all academically talented individuals who were enrolled in licensure programs in the
GTF years by comparing their employment behavior to all similar licensure candidates enrolled
in pre- and post-GTF years. Unfortunately, California does not collect longitudinal data on the
school-level employment decisions of licensure candidates.17 The APLE dataset provides a
useful alternative because it permits us to observe up to four years of school-level employment
decisions for a very large subset of licensure candidates who were enrolled in the GTF years or
in the years before or after the program was in effect. In this sense, it approximates the ideal
dataset, but because it is a subset, it also has some limitations.
An obvious limitation is that we can only examine the employment decisions of licensure
candidates who received APLE contracts. This poses a potential threat to external validity
because APLE recipients are a self-selected subset whose eventual loan forgiveness payments
17 While the California State Teachers’ Retirement System (CalSTRS) does record teachers’ employment histories, it tracks their employment only at the district level and thus does not indicate which teachers worked in low-performing schools in a given year.

26
are contingent upon teaching in shortage subject areas or hard-to-staff schools. However, the
APLE program is large enough to represent a broad subset of first-time licensure candidates in
California. One notable caveat to this statement is that individuals in teacher licensure programs
who had no educational debt would have had no incentive to apply for APLE contracts. Thus, the
set of APLE contract recipients may under-represent the number of newly licensed teachers from
relatively affluent families. (Consistent with this interpretation, we note above that University of
California licensure candidates are somewhat underrepresented in the APLE dataset relative to
their representation in the population of newly licensed teachers.) Also, APLE recipients’ pre-
existing loan forgiveness contracts make it impossible to estimate a first-dollar effect of the GTF.
However, the existence of loan forgiveness provisions in federal Perkins and Stafford Loans and
in numerous state policies suggests that it is not uncommon for teacher recruitment and retention
incentives to supplement one another in this way.
Magnitude and Cost of the GTF Effect
An important policy question is whether the GTF program’s estimated impact on
teachers’ career decisions is large enough to justify the cost to the taxpayers of California. We
have estimated that for every seven teachers who received the GTF, two decided to teach in a
low performing school who would not otherwise have done so. Since people who did not receive
APLE contracts and people who were omitted from our analytic sample due to missing data may
be systematically different from people in our sample, we generalize only to APLE recipients,
2.65 percent of whom received GTFs in our sample. Based on fitted results from our entry
analysis, we estimate that 28.06 percent of these individuals, or 203 novice teachers, entered
low-performing schools who would not otherwise have done so. And based on the descriptive
27
retention analysis, we estimate that 189 persisted into the second teaching year, 172 into the third
year, and 152 into the fourth year. In other words, in our analytic sample, we estimate that the
GTF staffed 716 one-year, full-time teaching slots in low-performing schools with academically
talented teachers who would not otherwise have taught in such schools.
But how much did this benefit cost the state of California? Excluding administrative and
overhead costs and restricting our analysis just to the value of the awards themselves, California
spent $14.5 million on GTF award payments of $20,000 each to the 725 recipients in our dataset.
Of that, we estimate that roughly $480,000 has been repaid by recipients who did not complete
their teaching requirements, which, ignoring collection costs and foregone interest, leaves $14.02
million in net award payments. For that money, the state recruited 203 teachers to low-
performing schools, who, within the next four years, staffed 716 one-year teaching positions in
those schools. This suggests that California paid roughly $69,100 in recruitment costs for each
person whose entry decision it influenced, and $19,600 in recruitment costs for every one-year
teaching position the GTF staffed with an academically talented teacher.
Conclusion
The governor’s Teaching Fellowship was an interesting policy initiative with the worthy
goal of attracting more academically talented teachers to the most needy schools. Ultimately,
whether programs like the GTF represent wise expenditures depends on the cost effectiveness of
alternative policy interventions. In their examination of the North Carolina teacher retention
bonus, Clotfelter, Ladd, and Vigdor (2008) found that a modest $1800 incentive reduced
teachers’ turnover rates by 5 percentage points, or 17 percent. In contrast, the GTF had a notable
recruitment effect on the treated, but we observe no difference in retention rates of recipients and
28
non-recipients. However, it is difficult to directly compare the consequences of the two
incentives because the North Carolina bonus did not include a recruitment component, and our
causal estimates of the GTF effect apply only to its recruitment component. In addition, the
North Carolina bonus did not target teachers based on their academic backgrounds or on other
indicators of skill, and it had a stronger effect on experienced teachers than on novices (Clotfelter
et al., 2008). Novice teachers have less investment in the teaching profession in terms of time,
expertise, and seniority than their more experienced colleagues. Therefore, to a greater extent
than experienced teachers, they may weigh employment options both within and outside of
teaching when considering whether to leave a low-performing school. An annual retention bonus
in the $1,800 to $5,000 range may better compensate for differences in working conditions
between two schools than for the broader range of forgone labor market opportunities outside of
teaching. And the potential for bonuses to offset non-teaching career options may be especially
weak for academically talented novices, who are likely to have higher opportunity costs than the
average teacher (Goldhaber & Player, 2005; Murnane, Singer, Willett, Kemple, & Olsen, 1991).
Academic talent has long been shown to predict teachers’ ability to increase student
achievement, and thus from a policy perspective, the goal of distributing academically talented
teachers more equitably remains important. On the other hand, academic talent explains only a
small percentage of the variation in teachers’ effectiveness in raising student achievement (Boyd,
Grossman, Lankford, Loeb, & Wyckoff, 2005; Kane & Staiger, 2005). Consequently, it is worth
exploring ways to target incentives more precisely, perhaps with a recruitment incentive aimed at
attracting academically talented teachers to high-need schools, coupled with a structured
retention incentive based on multiple measures of classroom effectiveness.
29
Retention incentives might also be expanded beyond monetary support. Selection
committee members suggested that if the GTF had included ongoing networking or professional
development opportunities, it is possible that recipients’ sense of commitment to the award and
its purpose might have been strengthened. Alternative licensure programs like Teach for
America (TFA) provide not only a fast-track entry into teaching, but also external recognition, a
strong sense of group identity, and ongoing opportunities for networking and professional
support. And TFA’s recruitment efforts appear relatively efficient: The organization spent
$6,379 per teacher they recruited into their 2007-08 cohort (Teach for America, 2008). However,
the TFA model is not designed to emphasize teacher retention—rather, the organization portrays
teaching as a starter career and seeks to incubate future leaders in business, law, medicine, and
public policy who are sensitive to education issues (Teach for America, 2006). Although 61
percent of TFA recruits remain in the teaching profession beyond the end of their two-year
commitments, by comparison, we estimate that 85 percent of GTF recipients remained in low-
performing schools beyond the second year, despite their high first-year turnover rate, and that
75 percent fulfilled their four-year commitments. (Granted, the teachers in our sample received
an additional incentive from the APLE program, and we cannot estimate what proportion left
low-performing schools when their four-year commitments ended.) Designers of the GTF have
told us that they focused on traditionally licensed teachers and required four years of service
partly to distinguish the program from TFA as demanding a longer-term career commitment.
However, the fact that GTF recipients had completed full licensure programs would not
necessarily have obviated their need for professional development and networking opportunities.
Given the importance of providing high-quality teachers to disadvantaged students and
the costliness of programs like the GTF, it is also important that policies be designed in ways that
30
make it possible to evaluate their impact rigorously. In the case of the GTF, this might have been
facilitated by ranking all applicants and later comparing career outcomes of individuals ranked
on either side of the award cut score. It would also be useful to create a database that tracks the
school-level employment histories of all teachers in California and not just those who received
APLE contracts. This could be achieved if the State Teachers Retirement System, which
currently tracks teachers’ employment histories at the district level, were to record (and make
available to researchers) teachers’ school-level assignments.
Due to the small amount of rigorous research on recruitment and retention incentives, it is
difficult to say whether the GTF’s recruitment effect was expensive relative to other recruitment
efforts, or relative to other policies that specifically target academically talented teachers.
Moreover, because the GTF was short-lived, it is not possible to learn whether long-term effects
would have differed from short-term effects. Future research may help determine whether
alternative interventions, including efforts to improve working conditions in low-performing
schools, might have as large an impact but carry a smaller price tag.
31
References
American Federation of Teachers. (2002). Table III-1: Actual average beginning teacher salaries, 2000-01 and 2001-02. Retrieved December 14, 2006, from http://www.aft.org/salary/2002/download/Table_III-1.pdf
Angrist, J. D. (2006). Instrumental variables methods in experimental criminological research: What, why, and how. Journal of Experimental Criminology, 2(23-44).
Angrist, J. D., & Pischke, J.-S. (2009). Mostly harmless econometrics: An empiricist's companion. Princeton, NJ: Princeton University Press.
Basmann, R. L. (1960). On finite sample distributions of generalized classical linear identifiability test statistics. Journal of the American Statistical Association, 55, 650-659.
Bound, J., Jaeger, D. A., & Baker, R. (1995). Problems with instrumental variables estimation when the correlation between the instruments and the endogenous explanatory variable is weak. Journal of the American Statistical Association, 90, 443-450.
Boyd, D., Grossman, P., Lankford, H., Loeb, S., & Wyckoff, J. (2005). How changes in entry requirements alter the teacher workforce and affect student achievement (No. No. 11844). Cambridge, MA: National Bureau of Economic Research.
California Education Code, Section 69612-69615.6. (2000). Retrieved Dec. 7, 2006, from http://www.leginfo.ca.gov/cgi-bin/waisgate?WAISdocID=513042124+0+0+0&WAISaction=retrieve
California Legislative Analyst's Office. (2002). Analysis of the 2002-03 budget bill. Retrieved September 5, 2005, from http://www.lao.ca.gov/analysis_2002/education/ed_29_6610_anl02.htm
California State University Office of the Chancellor. (2002). The 2000-2001 annual report of the Governor's Teaching Fellowship program. Long Beach, CA: Author.
California Student Aid Commission. (2004). APLE 2002-03 report to the legislature. Rancho Cordova, CA: Author.
California Student Aid Commission. (2005). 2005-2006 Assumption Program of Loans for Education coordinator's guide and forms. Rancho Cordova, CA: Author.
Clark, T., & Suckow, M. (2008). Teacher supply in California: A report ot the Legislature: Annual Report 2006-07. Sacramento: California Commission on Teacher Credentialing.
Clotfelter, C. T., Glennie, E., Ladd, H. F., & Vigdor, J. L. (2008, Jan. 6). Would higher salaries keep teachers in high-poverty schools? Evidence from a policy intervention in North Carolina. Paper presented at the Annual Meeting of the American Economic Association, New Orleans, LA.

32
Field, E. (2009). Educational debt burden and career choice: Evidence from a financial aid experiment at NYU Law School. American Economic Journal: Applied Economics, 1(1), 1-21.
Goldhaber, D., & Player, D. (2005). What different benchmarks suggest about how financially attractive it is to teach in public schools. Journal of Education Finance, 30(3), 211-230.
Imbens, G., & van der Klaauw, W. (1995). Evaluating the cost of conscription in the Netherlands. Journal of Business and Economic Statistics, 13(2), 207-215.
Jacobson, L. (2006, Sept. 27). Teacher-pay incentives popular but unproven. Education Week, pp. 1, 20.
Johnson, J. (2005). State financial incentive policies for recruiting and retaining effective new teachers in hard-to-staff schools. Retrieved October 20, 2006, from http://www.ecs.org/clearinghouse/61/61/6161.htm
Kane, T. J., & Staiger, D. O. (2005). Using imperfect information to identify effective teachers. Cambridge, MA: National Bureau of Economic Research.
Kirshtein, R. J., Berger, A. R., Benatar, E., & Rhodes, D. (2004). Workforce contingent financial aid: How states link financial aid to employment. Indianapolis, IN: Lumina Foundation for Education.
Levin, J., & Quinn, M. (2003). Missed opportunities: How we keep high-quality teachers out of urban classrooms. New York: The New Teacher Project.
Murnane, R. J., Singer, J. D., Willett, J. B., Kemple, J. J., & Olsen, R. J. (1991). Who will teach? Policies that matter. Cambridge, MA: Harvard University Press.
Singer, J. D., & Willett, J. B. (2003). Applied longitudinal data analysis: Modeling change and event occurrence. Oxford: Oxford University Press.
Spellings, M. (2006). Key policy letters signed by the Education Secretary or Deputy Secretary. Retrieved Jan. 20, 2007, from http://www.ed.gov/policy/highered/guid/secletter/060301a.html
Teach for America. (2006). Teach for America -- Our alumni. Retrieved Oct. 10, 2008, from http://www.teachforamerica.org/alumni/index.htm
Teach for America. (2008). 2007 Annual Report. New York: Author.
U.S. Department of Education. (2004). Enactment of the "Taxpayer-Teacher Protection Act of 2004". Retrieved May 20, 2006, from http://www.ifap.ed.gov/dpcletters/GEN0414.html
Wise, A. E., Darling-Hammond, L., & Berry, B. (1987). Effective teacher selection: From
recruitment to selection. Santa Monica, CA: RAND Corporation.
33
Table 1. Descriptive statistics for the analytic sample of APLE recipients, 1998-99 through 2002-03 (n=27,106)
Variables Descriptions Mean Std. Dev.
Outcome Variables
entry
Taught in a Low-Performing School w/in 2 Years of APLE Contract Issuance (Academic Performance Index rank in bottom 50%) 0.350
Endogenous Independent Variable gtf Received a GTF 0.027 Instrumental Variable Components eligible Enrolled in licensure program in 2000-01 or 2001-02 0.545 uc University of California licensure program 0.062 csu California State University licensure program 0.438 independent Independent institution licensure program 0.500
test Combined math, reading, & writing score on the CBEST (scale=60–240; passing=123) 152.1 21.7
Control Variables cohort 1: APLE Contract Issued in 1998-99 0.114 2: APLE Contract Issued in 1999-2000 0.174 3: APLE Contract Issued in 2000-01 0.218 4: APLE Contract Issued in 2001-02 0.231 5: APLE Contract Issued in 2002-03 0.262 licenseobs Licensure information is observed 0.629 secondary Licensed to teach secondary school 0.187 bilingual Authorized to teach bilingual education 0.078 twoplus Time to licensure exceeded two years 0.121 gender Male 0.259 age Age in years at time of APLE contract issuance 31.5 8.8
34
Figure 1. Fitted effects of licensure test scores and licensure institution type on the probability that an APLE recipient enrolled during GTF availability received a GTF (n=27,106)
Note: Fitted lines apply to females in the 2000-01 APLE cohort of teacher licensure candidates, who earned elementary school teaching licenses without bilingual authorization within two years, and who received APLE contracts at the sample mean age of 31.5. (All first-stage predictors and their coefficients are presented in Appendix Table A1.)
35
Figure 2. Impact of the GTF award (with 95-percent confidence intervals) on recipients’ probability of teaching in a low-performing school within two years after receiving an APLE contract (n=27,106)
Note: Fitted probabilities apply to a female elementary teacher from a CSU licensure instutition with a sample mean age of 31.5 and a CBEST score at the sample mean of 152
Estimated treatment-on-treated effect: 28 percentage points (p<.001)
36
Figure 3. Panel A: Fitted baseline hazard function describing the probability of exit from the set of low-performing schools as a function of teaching period for both GTF recipients (n=392 individuals; 1,013 person-period records) and non-recipients (n=9,103; 21,348 person-period records). Fitted values apply to Model 2 in Appendix Table A3. Panel B: Corresponding fitted survivor function for GTF recipients and non-recipients. A. Fitted Hazard Function Describing Exit from the Set of Low-Performing Schools by the
End of Each Teaching Year (Teaching Years 1–3)
B. Fitted Baseline Probabilities of Continuing to Teach in a Low-Performing School
Beyond Each of the First Three Years
37
Appendices Table A1. First-stage fitted parameters (and standard errors) predicting the receipt of a GTF
Predictor Estimate (standard error)
APLE Cohort (range=1-5: 1=1998-99; 5=2002-03) 0.0028** (0.0007) CSU Licensure Program (ref=Independent) -0.0014 (0.0029) UC Licensure Program (ref=Independent) -0.0070 (0.0057) Composite CBEST Score (range=60-240) 0.0000 (0.0001) Licensure Information Observed 0.0027 (0.0023) Secondary-School License * Licensure Info Observed 0.0079** (0.0027) Bilingual Authorization * Licensure Info Observed 0.0153** (0.0037) More Than Two Years to Licensure * Licensure Info Observed -0.0189** (0.0032) Male -0.0063** (0.0022) Age in Years (centered at mean of 31.5) -0.0003** (0.0001) Constant -0.0131 (0.0105) Instrumental Variables Eligible for the GTF (Enrolled During GTF Availability) -0.0019 (0.0136) CSU * Eligible 0.0188** (0.0039) UC * Eligible 0.2224** (0.0080) Composite CBEST Score * Eligible 0.0002* (0.0001) N 27,106 F (14, 27091) for the full model 169.20** R2 for the full model 0.0804 F (4, 27091) for the four instruments 396.62** Shea’s partial R2 for the four instruments 0.0553
~ significant at 10%; * significant at 5%; ** significant at 1%
38
Table A2. Parameter estimates (with standard errors) from OLS and second-stage IV regression models describing the probability of teaching in low-performing schools within two years after APLE contract agreement (1) (2)
Predictors OLS IV
Received a GTF 0.1356** 0.2806** (0.0166) (0.0707) APLE Cohort (range=1-5: 1=1998-99; 5=2002-03) -0.0098** -0.0100** (0.0020) (0.0021) CSU Licensure Program (ref=Independent) 0.0203** 0.0191** (0.0055) (0.0056) UC Licensure Program (ref=Independent) 0.0332** 0.0188 (0.0118) (0.0136) Composite CBEST Score (range=60-240) 0.0001 0.0001 (0.0001) (0.0001) Licensure Information Observed 0.3340** 0.3335** (0.0065) (0.0065) Secondary-School License * Licensure Info Observed -0.0395** -0.0403** (0.0076) (0.0076) Bilingual Authorization * Licensure Info Observed 0.1256** 0.1231** (0.0104) (0.0105) More Than Two Years to Licensure * Licensure Info Observed -0.4729** -0.4727** (0.0086) (0.0086) Male 0.0296** 0.0305** (0.0062) (0.0062) Age in Years (centered at mean of 31.5) -0.0022** -0.0022**
(0.0003) (0.0003) Constant 0.1874** 0.1881** (0.0213) (0.0213) N 27,106 27,106 R2 0.1754 0.1731 F (11, 27094) 524.10** Wald χ2
(11) 5700.74 ** Basmann χ2
(3) (H0: Instruments ⊥ 2nd-stage residuals) 1.3401 Sargan χ2
(3) (H0: Instruments ⊥ 2nd-stage residuals) 1.3407
~ significant at 10%; * significant at 5%; ** significant at 1%
39
Table A3. OLS regression parameter estimates (and standard errors) describing the probability of exiting from the set of low-performing school by the end of teaching years one through three, among those who entered low-performing schools within two years after APLE contract agreement (1) (2) (3) (4)
Time Only
Time & GTF
Indicator With
Controls
With Controls & GTF
Indicator Teaching Year 1 0.0671** 0.0671** 0.1103** 0.1106** (0.0029) (0.0029) (0.0163) (0.0163) Teaching Year 2 0.0922** 0.0922** 0.1332** 0.1336** (0.0031) (0.0032) (0.0163) (0.0163) Teaching Year 3 0.1156** 0.1157** 0.1485** 0.1487** (0.0040) (0.0040) (0.0163) (0.0163) GTF Recipient (Observed, Not Instrumented) -0.0008 0.0072 (0.0090) (0.0093) APLE Cohort (range=1-5: 1=1998-99; 5=2002-03) -0.0166** -0.0167** (0.0015) (0.0015) CSU Licensure Program (ref=Independent) -0.0016 -0.0017 (0.0040) (0.0040) UC Licensure Program (ref=Independent) -0.0103 -0.0114 (0.0071) (0.0072) Composite CBEST Score (range=60-240) 0.0002* 0.0002* (0.0001) (0.0001) Licensure Information Observed -0.0286** -0.0286** (0.0054) (0.0054) Secondary-School License * Licensure Info Observed 0.0072 0.0071 (0.0048) (0.0048) Bilingual Authorization * Licensure Info Observed -0.0039 -0.004 (0.0060) (0.0060) More Than Two Years to Licensure * Licensure Info Observed -0.0209~ -0.0208~ (0.0117) (0.0117) Male -0.0014 -0.0013 (0.0045) (0.0045) Age in Years (centered at mean of 31.5) -0.0007** -0.0007** (0.0002) (0.0002) N individuals 9,495 9,495 9,495 9,495
N person-period records 22,361 22,361 22,361 22,361 R2 0.0908 0.0908 0.097 0.097 F 744.26** 558.17** 184.63** 171.49**
~ significant at 10%; * significant at 5%; ** significant at 1%