national child and youth well-being index (cwi) · pdf file.3. the national child and youth...
TRANSCRIPT

.1.
2012 NATIONAL Child and Youth
Well-Being Index (CWI)
.2.
The Foundation for Child Development (FCD) The Foundation for Child Development (FCD) is a national, private philanthropy dedicated to the principle that all families should have the social and material resources to raise their children to be healthy, educated, and productive members of their communities.
FCD seeks to understand children, particularly the disadvantaged, and to promote their well-being. We believe that families, schools, nonprofit organizations, businesses, and government at all levels share complementary responsibilities in the critical task of raising new generations of children.
Kenneth C. Land, Project Coordinator Kenneth C. Land, Ph.D., is the John Franklin Crowell Professor of Sociology and Demography at Duke University. He has conducted extensive research on contemporary social trends and quality-of life measurement, social problems, demography, criminology, organizations, and mathematical and statistical models and methods for the study of social and demographic processes. He is the co-author or co-editor of six books, more than 100 research articles, and numerous book chapters. Dr. Land has been elected a Fellow of the American Statistical Association, the Sociological Research Association, the American Association for the Advancement of Science, the International Society for Quality-of-Life Studies, and the American Society of Criminology.

.1.
Executive Summary
I. Overview
Each year, the Foundation for Child Development (FCD) and the Child and Youth Well-Being Index Project at Duke University issue a comprehensive measure of how children are faring in the United States. The resultant NATIONAL Child and Youth Well-Being Index (CWI) is based on a composite of 28 Key Indicators of well-being that are grouped into seven Quality-of-Life/Well-Being Domains. These Domains are: Family Economic Well-Being, Safe/Risky Behavior, Social Relationships, Emotional/Spiritual Well-Being, Community Engagement, Educational Attainment, and Health. The CWI tracks changes in these Domains and Indicators, and in the value of the overall Index, compared to 1975 base year values.
This year, for the first time ever, the CWI report focuses on the analysis of changes over the past ten years in particular, giving us an assessment of how American children fared during the first decade of the new century. The report puts this analysis in the context of the broader CWI, which shows how children’s quality of life has changed over the last 36 years.
Thus, this year’s report includes:
• Estimates of trends in child well-being over the past decade—including percentage changes in the CWI, its seven Domain Indices, and individual Key Indicators from 2001–2011;
• Calculated values of the CWI for each of the years from the base year of the Index, 1975–2009;
• An updated estimate of the CWI for 2010 based on observed values of Key Indicators that have become available since last year’s report; and
• An initial estimate of the CWI for 2011 based on the observed values of Key Indicators available at this time plus projected values of the remaining Indicators.
II. Major Findings: Trends in the CWI, 2001-2011 • Family Economic Well-Being has deteriorated:
Despite large, consistent improvements for families in the 1990s, 2001–2011 has been a decade of decline in Family Economic Well-Being. The last decade has seen a significant rise in poverty, a fall in median income, and a fall in secure parental employment. This shows that economic insecurity is now spreading widely across middle-class and low-income families alike.
• In addition, the report found that, on average, all improvements made over the past 36 years in the economic well-being of families with children under the age of 18 have been lost. This decline is not only a result of the Great Recession: Family Economic Well-Being reached a historic, 26 year high in 2000, but then the trend began to reverse—well before the recession.
• Poverty is up. The likelihood of a child in the U.S. living in a family with an income below the official poverty line has been higher for nine of the last ten years than it was in 1975. Though we made important progress in reducing childhood poverty in the 1990s, we have steadily lost ground since then. Over the past decade, the percent of children living in families below the poverty line has increased from 15.6 percent in 2001 to 21.4 percent in 2011. One-third of this increase in child poverty occurred between 2001 and 2007—before the Great Recession.

.2.
• Health and Emotional/Spiritual Well-Being declined. The Health and Emotional/Spiritual Well-Being Domains also deteriorated during the 2001–2011 period, due primarily to increases in childhood obesity rates and declines in religious participation.
• Risky behaviors are down: The likelihood of teenagers participating in risky behavior has consistently decreased across the past decade. This Domain includes a dramatic reduction in the likelihood of teenagers being victims or perpetrators of violent crime, as well as substantial decreases in teenage childbearing, cigarette smoking, and binge drinking.
• Violent Crime is down: The rate of teenagers who were victims of violent crime decreased from 55.5 per 1,000 in 2001 to 20.87 per 1,000 in 2011. The rate of teenagers who were violent crime offenders also decreased, from 19.3 per 1,000 in 2001 to 6.3 per 1,000 in 2011. It is important to note that these findings are for teenagers who were young before our recent period of economic decline.
• Bachelor’s degrees are up. The percentage of young adults obtaining a Bachelor’s degree by age 29 has increased from 28.6 percent in 2001 to 32.2 percent in 2001. These are trends we hope to maintain when the current generation of young children reaches their late teens and early twenties.
• Composite CWI: While the overall CWI did not show any statistically significant improvement, it ceased to deteriorate in 2010 and 2011. Safety from violent crime and an increase in the Social and Emotional Well-Being Domain served to counterbalance the decline in the Family Economic Well-Being Domain. As a result, based on our initial estimate of the CWI for 2011 and our updated estimate for 2010, the overall composite Index increased from its recent low of 101.93 in 2009 to 102.50 in 2010 and 103.33 in 2011.
• Median family income is down: Families with children ages 0–18 have sustained a large decline in median family income, which is down from $62,796 in 2001 to $55,918 in 2011—a drop of $6,300 (in real dollars).
• Secure employment is down: Parents today are less likely to be securely employed than they were in 2001. While 79 percent of children in 2001 were living in a household with at least one parent employed full time, that percentage was 71 percent in 2011.
• PreK enrollment progress has stalled. Despite solid improvement in the 1990s, we have failed to sustain a pattern of growth in PreK enrollment in this past decade. The percent of children ages 3–4 enrolled in PreKindergarten has changed little, from 52.4 in 2001 to 54 in 2011.
• Educational Attainment progress is slow. In the year 2000, (the closest year to 2001 for which data were available), only 29 percent of children in the 4th grade were reading at grade level. By 2011, that number had grown modestly, to 34 percent. If this slow rate of improvement in reading scores continues, it would take more than three decades—35 years—to reach the point where even 50 percent of our young children are reading proficiently.
• Health insurance coverage has increased only slightly. Over the last decade, the overall percentage of children living without health insurance has changed little. We have consistently been unable to cover nearly one in ten children. Modest increases in coverage for children over the past decade have been due exclusively to an expansion of publicly funded programs, including Medicaid and CHIP, that continue to compensate for declines in private sector coverage.

.3.
The NATIONAL Child and Youth Well-Being Index (CWI), 1975 – 2011
I. The NATIONAL Child and Youth Well-Being
Index (CWI): A Brief Overview
The NATIONAL Child and Youth Well-Being Index (CWI) is an evidence-based composite measure of trends over time in the quality of life of America’s children from birth up to age 18 (up to the 18th birthday)1. The CWI tracks changes in the well-being of children annually compared to 1975 base year values.
The CWI is designed to address the following questions:
• On average, how did child and youth well-being in the U.S. change since 1975?
• Did child well-being improve or deteriorate?
• By approximately how much?
• In which Domains of well-being?
The CWI, a composite index based on data from 28 Key Indicators, is computed and updated annually. Observed data on 22 of the 28 Key Indicators are currently available for the year 2010, and observations on 10 of the 28 Key Indicators are available for 2011.2 The remaining Indicators are projected by use of statistical time series models. Accordingly, this year’s report includes the calculated values of the CWI for the years 1975-2009, an update of the CWI estimate for 2010, and an initial estimate of the CWI for 2011.
The objective of the Child and Youth Well-Being Index (CWI) is to give a view of changes over time in the overall well-being of children and youth in the United States. The composite Index, an equally-weighted average of the seven Well-Being Domains, provides a sense of the direction of change in overall well-being, as compared to the 1975 base year of the Indicators. For this reason, the focus of the Index is not primarily on specific Indicators, but rather on the way in which they interact and change over time. As a composite index of changes over time, the most important information to be found in the NATIONAL CWI is in the direction of change in Indicators and Domains: Are the Indices up and thus indicative of overall improvements? Down and thus indicative of deterioration? Flat and thus indicative of little or no change?
Answers to questions of this genre depend on the time frame applied. In this year’s report we analyze:
• estimates for a decade-long period —comparing the most recent years with 2001, and
• estimates for the long-term trend—comparing the most recent years to 1975 base year values.
Children and youth live unique lives and each experiences a range of social conditions. The Index is comprised of Key Indicators associated with different stages of the first two decades of life. Different Indicators capture children and youth at different stages of the life course. During the early childhood years, for
1 Or, as stated using Census/demographic notation, ages 0-17 at last birthday. Some of the Key Indicators in the CWI use slightly higher or slightly lower upper bounds, because of the age intervals in which the Indicators are reported. Our analyses, however, have found that the main focus of the CWI—the measurement of trends over time—is not greatly affected by these small differences in upper age boundaries.
2 Table A-1 in Appendix A identifies the specific Key Indicators that are projected for 2010 and 2011.

.4.
8 The labels “place in community” and “community connectedness” also have been used for this domain.
9 Since some youth are delayed in completing the requirements for high school diplomas or General Education Equivalent (GED) degrees, an age interval with a higher age limit is used for this Key Indicator series.
10 The upper age limit of 19 is used for this indicator, as the data series for this Key Indicator is not available for an upper age limit of 18.
11 Similarly to the use of a higher age limit for the high school diploma Key Indicator, a higher age limit is used for this series, as an index of trends in commitment to, and participation in, higher education institutions.
12 Since the legal voting age for presidential elections is 18 we use ages 18- 20 to represent trends in youth voting behavior.
3 All of these Key Indicators either are well-being indicators that measure outcomes for children and youth or proxy indicators of the same. For instance, data are not available on direct measure of the poverty status of children but rather on the poverty status of families that have children up to age 18. It is not strained, however, to infer that, if such a family has an income falling below the poverty line, then a child living in that family has a poverty-level economic well-being. Thus, the poverty status of the family is used as a proxy for the poverty status of the child.
4 The label “material well-being” has also been used for this domain.5 The label “safety/behavioral concerns” has also been used for this domain.6 The upper age limit of 19 is used for this indicator, as the data series for
this Key Indicator are not available for ages 12-18 separately.7 The upper age limit of 19 is used for suicide (see Emotional/Spiritual
Domain, #1), mortality (see Health Domain, #3), and obesity (see Health Domain, #6) rates as these data series are not available for an upper age limit of 18.
Social Relationships Domain1. Rate of Children in Families Headed by a Single
Parent (All Families with Children Ages 0-18)2. Rate of Children Who Have Moved within the Last
Year (Ages 0-18)
Emotional/Spiritual Well-Being Domain:1. Suicide Rate (Ages 10-19)7 2. Rate of Weekly Religious Attendance (Grade 12)3. Percent Who Report Religion as Being Very
Important (Grade 12)
Community Engagement Domain8 1. Rate of Persons Who Have Received a High School
Diploma (Ages 18-24)9 2. Rate of Youth Not Working and Not in School
(Ages 16-19)10
3. Rate of PreKindergarten Enrollment (Ages 3-4)4. Rate of Persons Who Have Received a Bachelor’s
Degree (Ages 25-29)11
5. Rate of Voting in Presidential Elections (Ages 18-20)12
Educational Attainment Domain1. Reading Test Scores (Averages of Ages 9, 13, and 17)2. Mathematics Test Scores (Average of Ages 9, 13,
and 17)
Health Domain1. Infant Mortality Rate2. Low Birth Weight Rate3. Mortality Rate (Ages 1-19)4. Rate of Children with Very Good or Excellent Health
(Ages 0-18 as reported by parents)5. Rate of Children with Activity Limitations
(Ages 0-18 as reported) 6. Rate of Obese Children and Adolescents (Ages 6-19)
example, PreKindergarten enrollment is an indicator of early schooling participation, and the violent crime victimization rate is indicative for ages 12-17. The overall NATIONAL CWI includes the following 28 Key Indicators organized into seven Domains of Well-Being that have been found in many social science studies to be related to an overall sense of subjective well-being or satisfaction with life. Each Domain represents an important area that affects well-being/quality of life: Family Economic Well-Being, Safe/Risky Behavior, Social Relationships, Emotional/Spiritual Well-Being, Community Engagement (participation in educational, economic, and political institutions), Educational Attainment, and Health.
Appendix A briefly describes the Methods of Index Construction for the CWI. Sources for time series data on the Key Indicators are presented in Appendix B3:
Family Economic Well-Being Domain4 1. Poverty Rate (All Families with Children Ages 0-18) 2. Secure Parental Employment Rate (All Families
with Children Ages 0-18)3. Median Annual Income (All Families with Children
Ages 0-18)4. Rate of Children with Health Insurance (All
Families with Children Ages 0-18)
Safe/Risky Behavior Domain5 1. Teenage Birth Rate (Ages 10-17)2. Rate of Violent Crime Victimization (Ages 12-19)6 3. Rate of Violent Crime Offenders (Ages 12-17)4. Rate of Cigarette Smoking (Grade 12)5. Rate of Binge Alcohol Drinking (Grade 12)6. Rate of Illicit Drug Use (Grade 12)

.5.
13 The specific annual numerical values of the overall CWI, from which Figure 1 is constructed, are provided in Appendix C.
would indicate, on average across all Key Indicators and Domains, a two percent improvement in well-being compared to the values of the Indicators and Domains in 1975, whereas an Index value of 97 would indicate a deterioration of 3 percent.
Trends in the overall, composite CWI give a sense of changes in child and youth well-being both in the short-term (that is, the last few years) and the long-term (since the base year 1975). The latter time frame yields a historical perspective in the sense that values of the Index for the late-1970s and early-1980s pertain to individuals who were children at that time but are part of today’s parental cohorts.
II.A. Changes in Domains and Key Indicators,
1975-2011 Each year, we report the updated values of the overall Child and Youth Well-Being Index (CWI) through the most recent year. Figure 1 charts annual percentage changes since 1975 in the overall composite CWI with the value of the CWI in the base year 1975 set equal to 100.13 All Key Indicators and Domain Indices of the CWI are oriented in such a way that a numerical value of the Index above 100 indicates an estimated improvement in overall child and youth well-being as compared to 1975 base year values. For example, an Index value of 102 in a year subsequent to 1975 thus
Year
85
90
95
100
105
110
Perc
ent o
f Bas
e Ye
ar
1975
1977
1979
1981
1983
1985
1987
1989
1991
1993
1995
1997
1999
2001
2003
2005
2007
2009
2011
Figure 1: Child Well-Being Index, 1975-2011
II. Annual Update of the Overall NATIONAL CWI

.6.
14 Six of the 28 Key Indicators are projected for 2010; Table A-1 in Appendix A identifies these.
15 Eighteen of the 28 Key Indicators are projected for 2011; Table A-1 in Appendix A identifies these.
Long-Term Changes in the CWI, 1975-2010: Comparisons by Time PeriodAn analysis of the CWI by five-year time periods over the 35 years from 1975 to 2010 helps to clarify the pattern of trends.
Starting Ending Change Index Index During Period Value Value Period
1975 – 1980 100.00 99.59 -0.41% 1980 – 1985 99.59 93.92 -5.67% 1985 – 1990 93.92 94.06 +0.14% 1990 – 1995 94.06 93.22 -0.84% 1995 – 2000 93.22 101.20 +7.98% 2000 – 2005 101.20 101.96 +0.76% 2005 – 2010 101.96 102.50 +0.54%
In brief:
• The CWI showed relative stability in overall child and youth well-being in the five years from 1975 to 1980 followed by a sharp decline from 1980 to 1985.
• This was followed by further deterioration through the mid-1990s.
• The last half of the 1990s saw a strong recovery of the CWI to, or above, its 1975 value of 100.
• In the most recent ten-year period from 2000 to 2010, the Index improved slightly while exhibiting fluctuations up and down.
Appendix D describes corresponding long-term trends and changes in the seven Domain Indices of the CWI and its 28 Key Indicators.
Values of the CWI for the Past Four Years, 2008-2011The past four years were a turbulent time, with the impacts of the Great Recession in 2008-2009 and the slow recovery in 2010-2011. For the four most recent years, Figure 1 shows that:
• The CWI decreased by 0.25 percent from 2007 to a value of 102.83 in 2008.
• With a value of 101.93 for 2009, the last year for which data are available for almost all 28 Key Indicators, the CWI showed a further decrease of 0.9 percent from 2008.
• For 2010, the partially projected14 CWI increased to 102.5.
• This is followed by a primarily projected15 increase to 103.33 in 2011.
In sum, the overall composite CWI has ceased to deteriorate. These recent annual numerical changes in the CWI are not statistically significant, but indicate that the declines of 2008-2009 did not continue in the two most recent years.

.7.
II.B. Changes in Domains and Key Indicators in
the Past Decade, 2001-2011 This section focuses on changes in the CWI, its seven Well-Being Domains, and Key Indicators over the past 10 years from 2001 to 2011. We use 2001 as the base year for this section, rather than 1975, to show the changes in the overall CWI, the Domains, and the Indicators across the last decade.
We chose to focus on the past decade as it is both the dawn of the 21st century and a decade marked by the attacks of September 11, 2001. As always with the CWI, we seek to determine answers to questions such as: How were our children doing in the past decade? How has their well-being been impacted by the events of recent years? Also, in this time frame, are things getting better? Worse? How could current policies better set our children on the path to success in the near future?
These changes are presented in two graphical displays:
• Figure 2a displays a dashboard view of the percent changes in the overall CWI and in each of the seven Domain-specific Indices from 2001 to 2011. To interpret the graphs and the changes in the Indices shown, note that the CWI, its Domains and Indicators measure percentage changes from base year values. In addition, the Key Indicators of the CWI are oriented so that positive percentage changes in the CWI and its Domain Indices indicate improvements in well-being and negative changes indicate deteriorations. Accordingly, the boxes in Figure 2a are highlighted in green if the respective Index shows a percentage increase from 2001 to 2011 and in red if the Index shows a percentage decrease.
• Figure 2b shows corresponding decade-long percentage changes in the rates of each of the 28 Key Indicators of the CWI.
Note: To provide details on changes in specific Indicators in the CWI for a comparable time period, Figure 2b shows percentage changes in the rates for all 28 Key Indicators from 2001 to 2011. A bar to the left indicates that there was a decline in the indicator, whereas a bar to the right indicates an increase. Three of the four Family Economic Well-Being Indicators show deterioration. There were declines in all of the 2011 rates of risky behaviors compared to the 2001 rates, as shown in Figure 2b. The indicators of involvement in community institutions all show improvements for 2011 compared to 2001; however, these improvements are very small (essentially flat) for the Preschool enrollment rate and of only modest size for the high school completion and not working/in school indicators. Voting in presidential elections spiked in 2004 and 2008. Indicators in the other Domains show mixtures of improvements and deteriorations.
Family Economic Well-Being:
-13.53%
Overall Child Well-Being Index:
+5.28%
Community Engagement:
+13.21%
Safe/Risky Behavior:
+39.13%Educational Attainment:
+1.74%
Social Relationships:
+7.53%Emotional/Spiritual Well-Being:
-9.39%Health:
-1.74%
Figure 2a: Percentage Changes in the CWI and Its Component Domains of Well-Being, 2001-2011, With Charts Showing Year-To-Year Changes
Note 1: The base year for the percentage changes in the �igure is 2001 = 100. Note 2: The Key Indicators of the CWI are oriented so that positive percentage changes in the CWI and its domain indices indicate improvements in well-being and negative changes indicate deteriorations. Note 3: The boxes in the �igure are highlighted in green if the respective index shows a percentage increase from 2001 to 2011 and in red if the index shows a percentage decrease from this base year.

.8.
-80 -60 -40 -20 0 20 40 60
Family Economic Well-BeingPovertyMedian Annual IncomeSecure Parental EmploymentHealth Insurance
Safe/Risky BehaviorTeenage BirthSmokingDrinkingIllicit Drug UseViolent Crime VictimizationViolent Crime Offenders
Social RelationshipsSingle Parent FamiliesResidential Mobility
Emotional Well-BeingSuicideChurch AttendanceReligion Importance
Community EngagementHigh School CompletionNot Working/In SchoolCollege DegreePreschool EnrollmentVoting
Educational AttainmentReadingMath
HealthVery Good or Excellent HealthActivity LimitationsLow Birth WeightInfant MortalityMortality (Ages 1-19)Overweight
Figure 2b: Percentage Changes in the Rates of the Key Indicators of the CWI, 2001-2011
Note: To provide details on changes in speci�ic indicators in the CWI for a comparable time period, Figure 2b shows percentage changes in the rates for all 28 Key Indicators from 2001 to 2011. A bar to the left indicates that there was a decline in the indicator, whereas a bar to the right indicates an increase. Three of the four Family Economic Well-Being Indicators show deterioration. There were declines in all of the 2011 rates of risky behaviors compared to the 2001 rates, as shown in Figure 2b. Involvement in community institutions, such as school and work, all increased, and voting in presidential elections spiked in 2004 and 2008. Indicators in the other domains show mixtures of improvements and deteriorations.

.9.
0
10
20
30
40
50
60
70
80
90
100
Perc
ent
Year
Figure 2e. Rates of Children in Families with Health Insurance, 2001-2011
Percent of Children Ages 0-17 Living in Families with Any Form of Health Insurance Percent of Children Living in Families with Private Health Insurance Percent of Children Living in Families with Public Health Insurance
• Additional Figures 2c-2h show percentage changes from 2001-2011 for selected Key Indicators.
These figures show that between 2001 and 2011:
• The overall CWI increased by 5.28 percent (Figure 2a)—from 2001 to 2011.
• There was a decline of 13.53 percent in the Family Economic Well-Being Domain Index from 2001 to 2011 (Figure 2a). The decline in this Domain Index is due to substantial increases in the poverty rate for families with children ages 0-18 and substantial decreases in median family income for these families as well as decreases in the secure parental employment rate (Figure 2b). Figure 2c shows the increase in the percent of children living in families below the poverty line from 15.8 in 2001 to 21.4 in 2011, and the decrease in the percent of children living in families with secure parental employment from 79 in 2001 to 71 in 2011. Decreases in median income for all families with children ages 0-17 (from $62,796 in 2001 to $55,918 in 2011) are reflected in Figure 2d, as are breakdowns of female- and male-headed single-parent families. The rate of children with health insurance has shown only modest increases over the past decade from 88.7 percent in 2001 to 90.6 percent in 2011 (Figure 2e).
• The Safe/Risky Behavior Domain Index increased by 39.13 percent (Figure 2a). The increase in this Domain Index was led by large declines in violent crime victimization and offending rates; there also were substantial decreases in the rates of teenage childbearing, cigarette smoking, and binge alcohol drinking (Figure 2b). The one Key Indicator in this Domain that deteriorated during this decade is the use of illicit drugs, mainly marijuana, as beliefs in dangerousness of use of marijuana declined and the general society’s perspective on the use of marijuana softened.16 Figure 2f highlights
see “great risk” in regular use of marijuana goes up the prevalence of its use goes down and, conversely, as the percentage who see “great risk” goes down the prevalence of us goes up.
16 Research by the Monitoring the Future Project at the University of Michigan (http://monitoringthefuture.org/), which is the source of the Key Indicators used in the CWI for cigarette smoking, binge drinking, and illicit drug use, has long-established that as the percentage of youth who
0
10
20
30
40
50
60
70
80
90
Perc
ent
Year
Figure 2c. Poverty and Secure Parental Employment Rates, 2001-2011
Percent of Children Ages 0-17 Living in Families below the Poverty Line
Percent of Children Ages 0-17 Living in Families with Secure Parental Employment
0
10,000
20,000
30,000
40,000
50,000
60,000
70,000
Am
ount
in 2
010
Dol
lars
Figure 2d. Median Family Income in Families with Children in 2010 Dollars, 2001-2011
Median Income for All Families with Children Ages 0-17
Median Income for Female-Headed Single-Parent Families with Children Ages
Year
Median Income for Male-Headed Single-Parent Families with Children Ages 0-17
0
10
20
30
40
50
60
70
80
90
Rat
e pe
r 1,0
00 P
opul
atio
n
Year Figure 2f. Violent Crime Victimization and Offender Rates, 2001-2011
Violent Crime Victimization, Ages 12-19 Violent Crime Offenders, Ages 12-17, as Perceived by the Victims
.10.
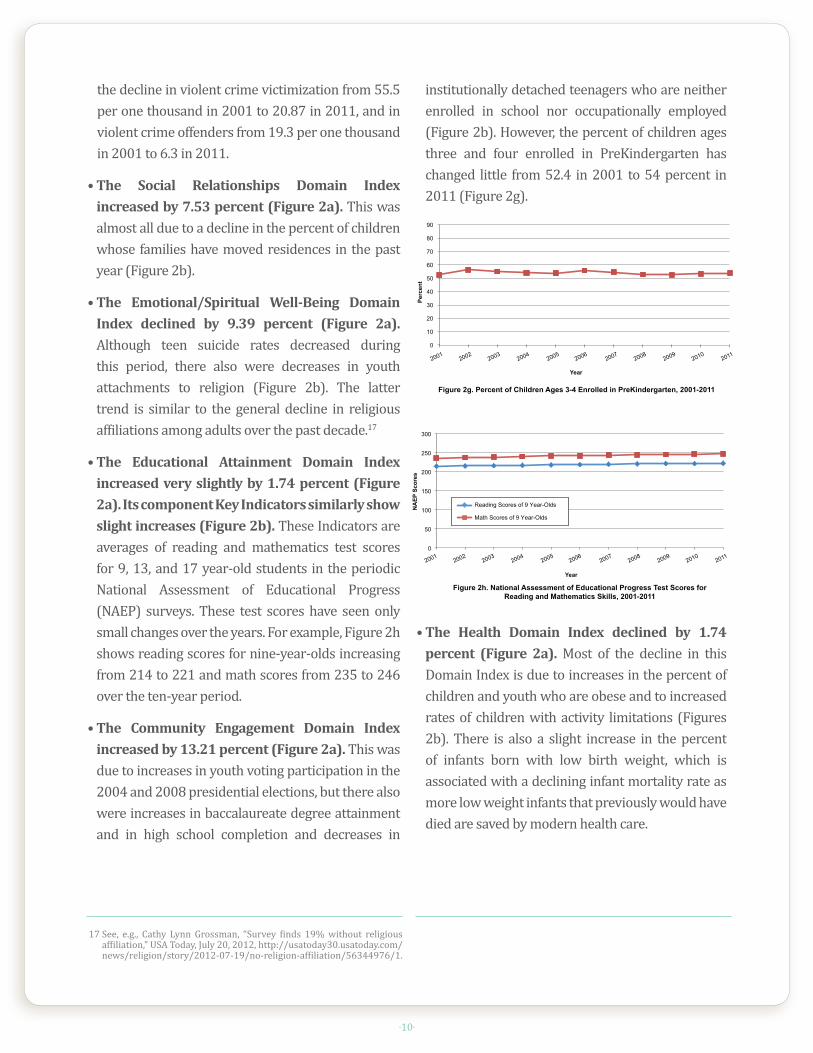
institutionally detached teenagers who are neither enrolled in school nor occupationally employed (Figure 2b). However, the percent of children ages three and four enrolled in PreKindergarten has changed little from 52.4 in 2001 to 54 percent in 2011 (Figure 2g).
• The Health Domain Index declined by 1.74 percent (Figure 2a). Most of the decline in this Domain Index is due to increases in the percent of children and youth who are obese and to increased rates of children with activity limitations (Figures 2b). There is also a slight increase in the percent of infants born with low birth weight, which is associated with a declining infant mortality rate as more low weight infants that previously would have died are saved by modern health care.
the decline in violent crime victimization from 55.5 per one thousand in 2001 to 20.87 in 2011, and in violent crime offenders from 19.3 per one thousand in 2001 to 6.3 in 2011.
• The Social Relationships Domain Index increased by 7.53 percent (Figure 2a). This was almost all due to a decline in the percent of children whose families have moved residences in the past year (Figure 2b).
• The Emotional/Spiritual Well-Being Domain Index declined by 9.39 percent (Figure 2a). Although teen suicide rates decreased during this period, there also were decreases in youth attachments to religion (Figure 2b). The latter trend is similar to the general decline in religious affiliations among adults over the past decade.17
• The Educational Attainment Domain Index increased very slightly by 1.74 percent (Figure 2a). Its component Key Indicators similarly show slight increases (Figure 2b). These Indicators are averages of reading and mathematics test scores for 9, 13, and 17 year-old students in the periodic National Assessment of Educational Progress (NAEP) surveys. These test scores have seen only small changes over the years. For example, Figure 2h shows reading scores for nine-year-olds increasing from 214 to 221 and math scores from 235 to 246 over the ten-year period.
• The Community Engagement Domain Index increased by 13.21 percent (Figure 2a). This was due to increases in youth voting participation in the 2004 and 2008 presidential elections, but there also were increases in baccalaureate degree attainment and in high school completion and decreases in
17 See, e.g., Cathy Lynn Grossman, “Survey finds 19% without religious affiliation,” USA Today, July 20, 2012, http://usatoday30.usatoday.com/news/religion/story/2012-07-19/no-religion-affiliation/56344976/1.
0
10
20
30
40
50
60
70
80
90
Perc
ent
Year
Figure 2g. Percent of Children Ages 3-4 Enrolled in PreKindergarten, 2001-2011
0
50
100
150
200
250
300
NA
EP S
core
s
Year Figure 2h. National Assessment of Educational Progress Test Scores for
Reading and Mathematics Skills, 2001-2011
Reading Scores of 9 Year-Olds
Math Scores of 9 Year-Olds

.11.
Figure 3 charts changes in the Family Economic Well-Being Domain Index for the years 1975-2011.
Figure 3. Family Economic Well Being Domain, 1975-2011
50
60
70
80
90
100
110
120
130
140
150
1975
1977
1979
1981
1983
1985
1987
1989
1991
1993
1995
1997
1999
2001
2003
2005
2007
2009
2011
Year
Perc
ent o
f Bas
e Ye
arpast decade (2001-2011). We examine both the Family Economic Well-Being Domain Index and each of its four Key Indicators (the poverty rate, the secure parental employment rate, median annual family income, and the rate of children with health insurance) measured for all families with children ages 0-18.
III. Changes in the Family Economic Well-Being
Key Indicators There are large declines in the Family Economic Well-Being Domain Index in the past decade, and especially since 2006 (as shown in Figures 2a and 2b). For this reason, this section will examine in more detail these trends in the both long-term (1975-2011) and the

.12.
Figure 4a contains the charts of trends since 1975 in the poverty rate (the percent of children living in families with incomes below the official poverty line) and the secure parental employment rate (the percent of children living in families with at least one parent employed full-time, year-round) from 1975 to 2011.19
The trend in the child poverty rate across the decade from 2001 to 2011 was up, and the long-term trend is that the likelihood of a child in the U.S. living in a family with an income below the official poverty line has been higher in the last nine years than it was in 1975 – and this includes the five years 2003 through 2007 before the Great Recession.
In the past decade, the increases in the poverty rate have been large, rising from 15.8 percent in 2001 to 16.9 percent in 2006 to 21.5 percent in 2010 followed by 21.4 percent in 2011. The rate for 2010 is close to that of 1993, 22 percent, which also occurred after an economic recession, and was the highest level for this Key Indicator time series in all of the years from 1975 to 2011.
For the years 2001 to 2011, the specific values exhibited in Figure 3 are:
2001 – 111.792002 – 110.142003 – 108.112004 – 108.542005 – 109.032006 – 109.002007 – 108.172008 – 105.712009 – 101.012010 – 98.112011 – 97.78
Since these values are indexed to the 1975 base year value of 100, this means that all of the improvements in material well-being of families with children under the age of 18 over the past 36 years, as measured by the four Indicators in the Index for this Domain, have disappeared.18 And the trend across the decade from 2001 to 2011 is substantially down on the order of 14 percentage points.
We next examine in detail the decade-long and long-term trends in each of the four Key Indicators in the Family Economic Well-Being Index.
19 Data on the poverty rate are observed through 2011 and those for the secure parental employment rate are observed through 2010 and projected for 2011.
18 Similar periods of decline in the Family Economic Well-Being Domain Index occurred in 1981-1982 and in 1991-1995 due to the impacts of the 1981-1982 and 1990-1991 economic recessions, respectively.

.13.
Figure 4a. Poverty and Secure Parental Employment Rates, 1975-2011
0
10
20
30
40
50
60
70
80
90
1975
1977
1979
1981
1983
1985
1987
1989
1991
1993
1995
1997
1999
2001
2003
2005
2007
2009
2011
Year
Perc
ent Percent of Children Ages 0-17 Living in Families with
Secure Parental EmploymentPercent of Children Aes 0-17 Living in Families Belowthe Poverty Line
Figure 4b charts trends since 1975 in median family incomes for families with children ages 18 or younger in constant 2010 dollars for all such families (the third Key Indicator in the Family Economic Well-Being Domain) and separately for female-headed and male-headed single-parent families. For all families with children, the trend since 2001 is down, and the declines since 2007 have been substantial. Specifically, the median family income for families with children (in 2010 dollars) was $62,796 in 2001, $62,238 in 2007, $57,313 in 2010, and $55,918 in 2011. This compares to $52,473 in the 1975 base year, indicating a slight long-term increase even after the recent period of declines.
By comparison, the trend over the past decade in the secure parental employment rate is down from 79 percent in 2001 to 71 percent in 2011. The 71 percent in 2011 is above the 66 percent of the base year 1975, but, even though families with children ages 18 or younger in 2010 and 2011 are more likely than in 1975 to have at least one parent employed full-time and year-round (due largely to the increases in female labor force participation rates over the past four decades), they also are more likely to have annual incomes that are below the official poverty line.

.14.
Figure 4b Median Family Income in Families with Children in 2010 Dollars, 1975-2011
10,000
15,000
20,000
25,000
30,000
35,000
40,000
45,000
50,000
55,000
60,000
65,000
1975
1977
1979
1981
1983
1985
1987
1989
1991
1993
1995
1997
1999
2001
2003
2005
2007
2009
2011
Year
Am
ount
in 2
010
Dol
lars
Median Income for All Families with Children Ages 0-17Median Income for Male-Headed Single-Parent Families with Children Ages 0-17Median Income for Female-Headed Single-Parent Families with Children Ages 0-17
being of children—trends in which the economic domain seeks to measure. Data on this Indicator series are available back to 1987 rather than the base year of 1975. Figure 4c also shows the trends in two forms of health insurance coverage, private and public. Observed values for these series are available through 2011.
The chart for the overall health insurance coverage series shows increases in the past decade from 88.7 percent in 2001 to 90.25 percent in 2010 and to 90.6 percent in 2011, due to an expansion of publicly supported health insurance programs for children. These values for the last two years also are up from the 1987 base year value of 87.1 percent. In brief, both the last decade and long-term trends in health insurance coverage for children are slightly up. However, consistent expansions in publicly funded programs over the last decade have occurred in the context of similar levels of decline in private sector coverage. Even so, 9.4 percent of children remain without health insurance coverage.
The charts for families headed by single parents show that the largest declines in recent years initially were among those with male heads, as the Great Recession’s impacts on employment in 2008-2009 was concentrated among the construction and manufacturing sectors of the economy in which males are more likely to be employed. The median income for male-headed families with children in 2010 was $36,290 and is projected to further decline by $304 to $35,986 in 2011, well below the 1975 base year value of $43,361. For female-headed families with children, by contrast, the median income declined by $1,101 from 2009 ($25,588) to $24,487 in 2010 and is projected to decline another $300 to $24,187 in 2011, but this still is above its base year value of $20,211.
Figure 4c shows charts of trends for the fourth Key Indicator of the Family Economic Well-Being Domain, the percent of children living in families with some form of health insurance. This is an important indicator of children’s access to health care, and therefore of the material well-

.15.
Figure 4c. Rates of Children Living in Families with Health Insurance, 1987-2011
0
10
20
30
40
50
60
70
80
90
100
19871988
19891990
19911992
19931994
19951996
19971998
19992000
20012002
20032004
20052006
20072008
20092010
2011
Year
Perc
ent
Percent of Children Ages 0-17 Living in Families with Any Form of Health Insurance Percent of Children Ages 0-17 Living in Families with Private Health Insurance Percent of Children Ages 0-17 Living in Families with Public Health Insurance
parental employment rate (a 9 percent decline from 2006 to 2011). For the most recent changes from 2010 to 2011, the decline in the Family Economic Well-Being Index shown in Figure 3 is due primarily to a continuing decline in median family income.
In summary, these figures for the four Key Indicators of the Family Economic Well-Being Domain point to the strong negative impacts since 2006 of the poverty rate (a 27 percent increase from 16.9 percent in 2006 to 21.4 percent in 2011), median family income (a 10 percent decline from 2006 to 2011), and the secure

.16.
Figure 5. Violent Crime Victimization and Offender Rates, 1975-2011
0
20
40
60
80
100
120
140
1975
1977
1979
1981
1983
1985
1987
1989
1991
1993
1995
1997
1999
2001
2003
2005
2007
2009
2011
Year
Rat
e pe
r 1,0
00 P
opul
atio
n
Violent Crime Victimization, Ages 12-19
Violent Crime Offenders, Ages 12-17, as Perceived by the Victims
Violent Crime Victimization and OffendersIn Section II the important impact of improvements in the Safe/Risky Behavior Domain Index on the overall NATIONAL CWI was cited. Two Key Indicators in the Safe/Risky Behavior Domain are the violent crime victimization rates for adolescents and teenagers ages 12-19 and violent offending rates for ages 12-17, data that come from the annual National Crime Victimization Surveys. Figure 5 exhibits the annual rates for these two Key Indicators from 1975 to 2011.
IV. Important Trends in Other Key Indicators As noted in Section II, some of the NATIONAL Child and Youth Well-Being Index (CWI) Domains and Key Indicators have shown improvements, with respect to both long-term and decade-long trends. We now focus on some of these.
.17.
The sharpest part of the declines in these rates over the past two decades occurred in the 1993-2001 period, but the declines continued at a slower pace in the years 2002-2011. Trends in these two Key Indicator series also show that economic recessions are associated with upturns in the rates. There was an upturn in both rates in 1981, associated with the 1981-1982 recession, as well as an upturn in 1991, associated with the 1990-1991 recession, that continued to 1993 for the offender series and to 1994 for the victim series. There was also an upturn in the victim series in 2007, but not in the offender series, associated with the Great Recession.21
There is no consensus on the explanation of these violent crime victimization and offending trends. Impacting factors that criminologists and child researchers have mentioned include improved policing techniques and incarceration policies; the growth of prevention programs that increase awareness of violent crime offending among both children and adults; the advent and increasing availability of cellphones, which make it easier to record and report violent incidents to adults and police authorities; the increasing use of medications to treat depression and other psychiatric problems; and the increasing effectiveness of programs and services for victims and perpetrators of violent crimes.22
Another likely factor is the substantial changes in the lifestyles of children and youth in American society across the past two decades—towards closer monitoring by parents and programming of after-school activities, which reduce exposure to the risk of violent crime victimization or offending. Also, as will be shown below, since 1993-1994, there
The two violent crime series in Figure 5 show the following:
1) The violent crime victimization series oscillates at or just above 80 persons per 1,000 (ages 12-19) from 1975 to 1986, then begins an upward trend to a peak of 121.25 per 1,000 in 1994. This is followed by a decline that continues to the most recent years with a value of 26.90 in 2010 and a projected value of 20.87 in 2011.
2) The violent crime offenders series for ages 12-17 (this is based on estimated ages of the offenders reported by the victims) similarly shows an oscillation in the mid-30s per 1,000 until 1989, then begins an upward trend to a peak at 51.9 in 1993, followed by a similar long-term decline to 11.20 in 2009 and projections of 8.8 in 2010 and 6.3 in 2011.
In brief, these numbers indicate that the violent crime victimization rate in 2011 for ages 12-19—which includes incidents of domestic abuse in the form of violence for those ages20—has declined to about 25 percent of the 1975 base year rate and 17 percent of its peak in 1994. Further, the violent crime offending rate for the corresponding age group in 2011 is about 20 percent of the 1975 base year rate and 12 percent of its peak in 1993.
Within the historical period of the National Crime Victimization Survey, 1975-2011, this is an unprecedented success story of social agencies—including parents, families, schools, communities, juvenile agencies and courts, and, not least, the children and youth themselves—in increasing the physical safety of children and youth in American society.
21 In our 2010 and 2011 Child Well-Being Index (CWI) Reports, we had projected that these two series would show increases associated with the Great Recession and the slow economic recovery in 2010 and 2011. But this has not as yet shown up in the data. In most cases, our time series projections are quite accurate. Accordingly, this is a puzzle to be solved, and we think the answer is related to changes in lifestyles of children and youth and trends in Community Engagement indicators discussed below.
22 See Erica Goode, “Fewer Children Are Found Exposed to Violent Crime,” New York Times, September 19, 2012.
20 The National Crime Victimization Survey data do not include incidents of violence, including child abuse and neglect, for children less than 12 years of age.

.18.
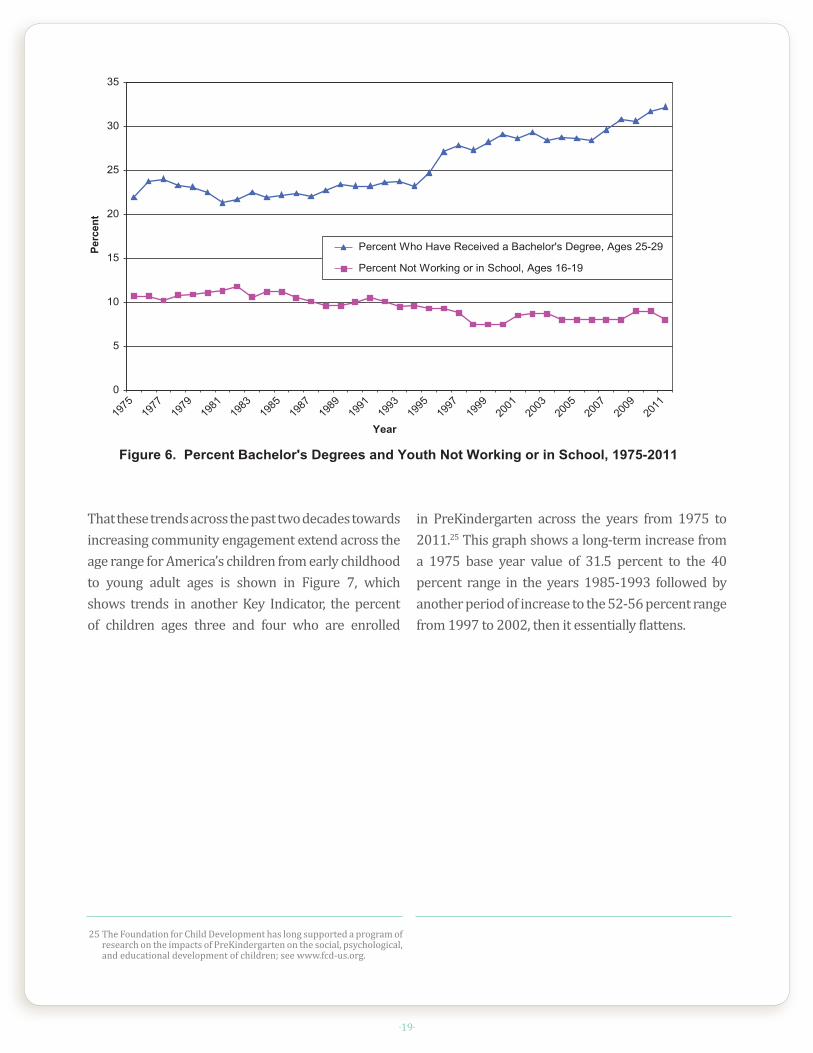
in mainstream social institutions that serve to counterbalance the declines in the Family Economic Well-Being Domain. We call attention to two of these in Figure 6, the percent of teenagers ages 16-19 who are not working (employed) or not in school and the percent of young adults, ages 25-29, who have received a Bachelor’s degree.
The two series in Figure 6 show the following: 1) the percentage of young adults ages 25-29 who have completed a Bachelor’s degree oscillates in the 20 to 23 percent range from 1975 to 1994 after which it increases to the 28 percent level by 1999 and stays there until 2006 and then begins another increase to 32.2 percent in 2011; and 2) the percentage of youth ages 16 to 19 who are not institutionally connected to the mainstream social institutions of school or the economy, that is, not working and not enrolled in school begins at 10.7 percent in the 1975 base year, stays pretty much in the 10 to 11 percent range to 1994, and then begins a decrease to the 7.5 to 9 percent range, and ends up at 8 percent in 2011. In other words, this series essentially flattened in the 2001-2011 decade.
In brief, the long term trends in both series are in the direction of increasing community engagement through mainstream institutional affiliations. Both series also show negative impacts of the 1981-1982 and 1990-1991 economic recessions in that the percentage of the population ages 25-29 with Bachelor’s degrees declines slightly in the years following these recessions and the percentage of youth ages 16-19 not working or not in school increases in 1982 and 1991 as these recessions wore on. The same is true for the Great Recession of 2008-2009 in that the Bachelor’s degree series shows a slight decline in 2009 and the teenage non-work/school enrollment series shows an upturn in 2009 and 2010.
have been long-term trends towards increasing community engagement—in the form of higher rates of participation in mainstream schooling and work institutions—on the part of children, youth, and young adults in American society. The strong temporal concordance of these trends with the decreases in the violent crime trends suggest a connection between the declines in the violent crime series and increases in non-violent behavioral forms, as institutional engagements both reduce exposure to the risk of violent crime in non-programmed activities and promote social bonding.23 In addition, since the mid-1990s, there has been a steady diffusion and expansion of non-programmed participation in the use of electronic devices, game playing, texting, and other electronic media. These activities are more likely to occur indoors, thus reducing the risk of exposure to violent crime victimization.
Among Key Indicators in the Safe/Risky Behavior Domain, long-term declines since the early 1990s have also occurred in the teenage (ages 10-17) birth rate series and in the cigarette smoking and binge drinking series (prior month prevalence rates for both). It is possible that the same forces—closer monitoring, programming of after-school activities, increased rates of participation in mainstream community institutions, and the use of electronic devices in non-programmed periods—are at work in these declines. However, increases in the use of electronic devices in non-programmed periods have led to concerns about negative outcomes such as Internet-mediated bullying behaviors and Internet Addiction Disorder (as well as more generally, electronic media) among children and youth.24 These trends merit additional monitoring and study.
Community Engagement IndicatorsIn addition to increased safety from violent crime, there have been increased rates of engagement
restricts opportunities for delinquent/criminal activities and increases the commitment or “stakes in conformity” of individuals through the rational investment they have in conventional society and the risks incurred by engaging in deviant behavior.
24 See Tony Dokoupil, “Is the Onslaught Making Us Crazy?” Newsweek, July 16, 2012.
23 A key element of the social control theory of delinquency and crime (Travis Hirschi, 1969, The Causes of Delinquency, Berkeley: University of California Press) is involvement in conventional activities. This dimension of control theory is based on the common sense observation that “idle hands are the devil’s workshop,” and that being busily engaged in conventional activities in mainstream social institutions such as school or the economy both
.19.
Figure 6. Percent Bachelor's Degrees and Youth Not Working or in School, 1975-2011
0
5
10
15
20
25
30
35
1975
1977
1979
1981
1983
1985
1987
1989
1991
1993
1995
1997
1999
2001
2003
2005
2007
2009
2011
Year
Perc
ent
Percent Who Have Received a Bachelor's Degree, Ages 25-29
Percent Not Working or in School, Ages 16-19
in PreKindergarten across the years from 1975 to 2011.25 This graph shows a long-term increase from a 1975 base year value of 31.5 percent to the 40 percent range in the years 1985-1993 followed by another period of increase to the 52-56 percent range from 1997 to 2002, then it essentially flattens.
That these trends across the past two decades towards increasing community engagement extend across the age range for America’s children from early childhood to young adult ages is shown in Figure 7, which shows trends in another Key Indicator, the percent of children ages three and four who are enrolled
25 The Foundation for Child Development has long supported a program of research on the impacts of PreKindergarten on the social, psychological, and educational development of children; see www.fcd-us.org.

.20.
Figure 7. Percent of Children Ages 3-4 Enrolled in Pre-Kindergarten, 1975-2011
0
10
20
30
40
50
60
70
80
90
1975
1977
1979
1981
1983
1985
1987
1989
1991
1993
1995
1997
1999
2001
2003
2005
2007
2009
2011
Year
Perc
ent
2011. The trend in the series over the 2001-2011 decade shows the negative impacts of the 2001-2002 and 2008-2009 recessions; the result is that the rate in 2010 (53.2 percent), which is the last year of observed data, is only slightly above the 2001 level (52.4 percent). Due to this stagnation it may be decades before the PreKindergarten enrollment rate approaches even three-quarters of all three- and four-year-old children.
As for the not working/not in school and Bachelor’s degree Indicator series in Figure 6, the percent in PreKindergarten enrollment Indicator series in Figure 7 also exhibits declines associated with the 1981-1982, 1990-1991, and 2008-2009 economic recessions. Despite the cutbacks in public budgets at local community and state levels for PreKindergarten programs in the wake of the Great Recession, enrollment rates have begun to rebound in 2010 and

.21.
Acknowledgements and Contact Information The Foundation for Child Development Child and Youth Well-Being Index Project at Duke University is coordinated by Kenneth C. Land, Ph.D., John Franklin Crowell Professor, Department of Sociology and Center for Population Health and Aging, P.O. Box 90088, Duke University, Durham, NC 27708-0088 (e-mail: [email protected]). Other researchers involved in the project include Vicki L. Lamb, Ph.D. (North Carolina Central University and Duke University), and Qiang Fu, M.A. (Duke University). The Project is supported by grants from the Foundation for Child Development (http://www.fcd-us.org/). We especially acknowledge the support and encouragement of Deborah A. Phillips, Ph.D., President, and Mark Bogosian, Communications Officer, Foundation for Child Development. We also thank Kristin A. Moore, Ph.D. and Brett Brown, Ph.D. of Child Trends, Inc. (http://www.childtrends.org), Donald Hernandez, Ph.D. of the City University of New York, and the FCD-CWI Advisory Board for invaluable advice and assistance in this project.
On the Web: More information about the CWI, its construction, and the scientific papers and publications on which it is based can be found online at:
http://www.soc.duke.edu/~cwi/ and http://fcd-us.org/our-work/child-well-being-index-cwi

.22.
The 28 indexed Key Indicator time series then are grouped into the seven Domains of Well-Being by equal weighting to compute the Domain-Specific Index values for each year. The seven Domain-Specific Indices then are grouped into an equally-weighted Child and Youth Well-Being Index value for each year. The CWI Project uses an equal-weighting strategy for constructing its composite Indices for two reasons. First, it is the simplest and most transparent strategy and can easily be replicated by others. Second, statistical research done in conjunction with the CWI Project has demonstrated that, in the absence of a clear ordering of the Indicators of a composite Index by their relative importance to the composite and on which there is a high degree of consensus in the population, an equal weighting strategy is privileged in the sense that it will achieve the greatest level of agreement among the members of the population. In statistical terminology, the equal-weighting method is a minimax estimator.28
Since it builds on the subjective well-being empirical research base in its identification of Domains of well-being to be measured and the assignment of Indicators to the Domains, the CWI can be viewed as a well-being-evidence-based measure of trends in averages of the social conditions encountered by children and youth in the United States across recent decades.
Conceptual Foundation
The NATIONAL Child and Youth Well-Being Index (CWI) is based on more than four decades of research on social indicators and well-being/quality-of-life research on children, youth, and adults. This research has established that overall well-being/life quality is multidimensional. This research is the foundation on which the CWI is based.27
Methods of Construction
Annual time series data (from vital statistics and sample surveys) were assembled on 28 national-level Indicators in seven Quality-of-Life Domains: Family Economic Well-Being, Safe/Risky Behavior, Social Relationships, Emotional/Spiritual Well-Being, Community Engagement, Educational Attainment, and Health. These seven Domains of quality of life have been well-established as recurring time after time in more than three decades of empirical research in numerous subjective well-being studies. They also have been found, in one form or another, in studies of the well-being of children and youth.
To calculate the CWI, each of the time series of the Indicators is indexed by a base year (1975). The base year value of the Indicator is assigned a value of 100 and subsequent values of the Indicator are taken as percentage changes in the CWI. The directions of the Indicators are oriented so that a value greater than 100 in subsequent years means the social condition measured has improved, while a value less than 100 in subsequent years means the social condition has deteriorated.
Appendix A
Conceptual Foundation, Methods of Construction, and Indicator List for the NATIONAL CWI
Children: Developing and Improving the Child and Youth Well-Being Index. New York: Springer.
28 See Hagerty Michael R. and Kenneth C. Land 2007 “ConstructiSummary Indices of Quality of Life: A Model for the Effect of Heterogeneous Importance Weights,” Sociological Methods and Research, 35(May):455-496.
27 See Land, K. C., Lamb, V. L., and Mustillo, S. K., 2001, “Child and Youth Well-Being in the United States, 1975-1998: Some Findings from a New Index.” Social Indicators Research, 56, (December):241-320; Land, K. C., Lamb, V. L., Meadows, S. O., and Taylor, A., 2007, “Measuring Trends in Child Well-Being: An Evidence-Based Approach,” Social Indicators Research, 80 (January):105-132; Land, K. C. (ed.), 2012, The Well-Being of America’s

.23.
Educational Attainment Domain1. Reading Test Scores (Ages 9, 13, and 17)e
2. Mathematics Test Scores (Ages 9, 13, and 17)e
Health Domain1. Infant Mortality Rateb
2. Low Birth Weight Rateb
3. Mortality Rate (Ages 1-19)c
4. Rate of Children with Very Good or Excellent Health (as reported by parents)b
5. Rate of Children with Activity Limitations (as reported by parents)b
6. Rate of Obese Children and Adolescents (Ages 6-19)b
Family Economic Well-Being Domain1. Poverty Rate (All Families with Children)2. Secure Parental Employment Rateb
3. Median Annual Income (All Families with Children)b
4. Rate of Children with Health Insurance
Safe/Risky Behavior Domain1. Teenage Birth Rate (Ages 10-17)b
2. Rate of Violent Crime Victimization (Ages 12-19)b
3. Rate of Violent Crime Offenders (Ages 12-17)c
4. Rate of Cigarette Smoking (Grade 12)5. Rate of Binge Alcohol Drinking (Grade 12) 6. Rate of Illicit Drug Use (Grade 12)
Social Relationships Domain1. Rate of Children in Families Headed by a
Single Parent2. Rate of Children Who Have Moved within the
Last Year (Ages 1-18)
Emotional/Spiritual Well-Being Domain:1. Suicide Rate (Ages 10-19)c
2. Rate of Weekly Religious Attendance (Grade 12)b
3. Percent Who Report Religion as Being Very Important (Grade 12)b
Community Engagement Domain1. Rate of Persons Who Have Received a High School
Diploma (Ages 18-24)b
2. Rate of Youth Not Working and Not in School (Ages 16-19)
3. Rate of PreKindergarten Enrollment (Ages 3-4)b
4. Rate of Persons Who Have Received a Bachelor’s Degree (Ages 25-29)
5. Rate of Voting in Presidential Elections (Ages 18-20)d
d 2009 to 2011 data are held constant at the 2008 value until 2012 data are available
e Reported data for 2008; Projected for 2009-2011
Notes: a Unless otherwise noted, indicators refer to children ages 0-18.b Projected for 2011.c Projected for 2010 and 2011.
Table A-1.
Twenty-Eight Key Indicators of the NATIONAL Child and Youth Well-Being Index (CWI)a

.24.
Appendix B
Sources of Data for the NATIONAL CWI Child Poverty US Bureau of the Census, March Population Survey, Current Population Reports,
Consumer Income, Series P-60, Washington, D.C.: US Bureau of the Census. http://www.census.gov/hhes/www/poverty/data/historical/hstpov3.xls 1975-present
Secure Parental Employment
US Bureau of the Census, March Current Population Survey, Washington, D.C.: US Bureau of the Census. Available from Forum on Child and Family Statistics, http://www.childstats.gov/americaschildren/tables/econ2.asp?popup=true 1980-present. Special tabulation from CPS CD 1975-1979.
Median Annual Income
US Bureau of the Census, March Current Population Survey, Historical Income Tables – Families, Washington, D.C.: US Bureau of the Census. http://www.census.gov/hhes/www/income/data/historical/families/2010/F09AR_2010.xls 1975-present.
Health Insurance US Bureau of the Census, Housing and Household Economic Statistics Division, unpublished tabulations from the March Current Populations Surveys, Washington, DC: US Bureau of the Census. Special tabulation by Federal Intra-agency Forum http://www.census.gov/hhes/www/cpstables/032011/health/h08_000.htm1987–present.
Infant Mortality CDC, National Center for Health Statistics, National Vital Statistics System, Monthly Vital Statistics Report (v25-v46), National Vital Statistics Report (v47-v49): Hyattsville, MD: NCHS. http://www.cdc.gov/nchs/data/nvsr/nvsr58/nvsr58_01.pdf 1975-present.
Low Birth Weight CDC, National Center for Health Statistics, National Vital Statistics System, Report of Final Natality Statistics, Monthly Vital Statistics Reports (1975-1996), National Vital Statistics Reports (1997-present). Hyattsville, MD: NCHS. http://www.cdc.gov/nchs/data/nvsr/nvsr59/nvsr59_04.pdf
Child and Adolescent Mortality
CDC, National Center for Health Statistics, National Vital Statistics System, Leading Causes of Death. http://www.cdc.gov/nchs/data/nvsr/nvsr59/nvsr59_04.pdf 1975–present.
Subjective Health and Activity Limitations
CDC, National Center for Health Statistics, National Health Interview Survey, Hyattsville, MD: National Center for Health Statistics. www.cdc.gov/nchs Available from Forum on Child and Family Statistics, http://www.childstats.gov/ 1984–present.
Obesity CDC, National Center for Health Statistics, Health United States, 2003 and National Health and Nutrition Examination Survey (NHANES), Hyattsville, MD. http://www.cdc.gov/obesity/data/index.html 1975-present.
Teen Births CDC, National Center for Health Statistics, National Vital Statistics System. Monthly Vital Statistics Reports (1975-1996), National Vital Statistics Reports (1997-present). Hyattsville, MD: National Center for Health Statistics. http://www.cdc.gov/nchs/data/nvsr/nvsr60/nvsr60_02.pdf
Crime Victimization US Department of Justice, Bureau of Justice Statistics, National Crime Victimization Survey and FBI Supplementary Homicide Reports. Available from Sourcebook of Criminal Justice Statistics Online, http://bjs.ojp.usdoj.gov/content/pub/pdf/cv10.pdf 1975-present.
Violent Crime Offenders
US Department of Justice, Bureau of Justice Statistics, National Crime Victimization Survey. http://www.ojp.usdoj.gov/bjs/ 1975-present.
.25.
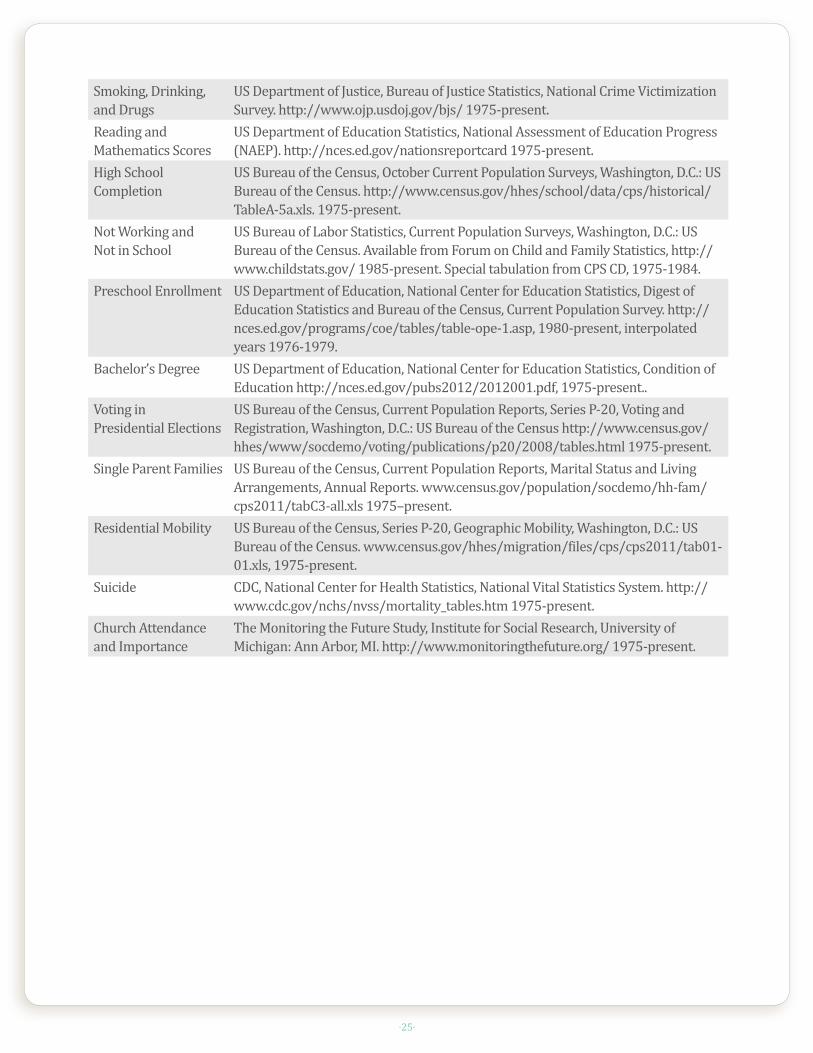
Smoking, Drinking, and Drugs
US Department of Justice, Bureau of Justice Statistics, National Crime Victimization Survey. http://www.ojp.usdoj.gov/bjs/ 1975-present.
Reading and Mathematics Scores
US Department of Education Statistics, National Assessment of Education Progress (NAEP). http://nces.ed.gov/nationsreportcard 1975-present.
High School Completion
US Bureau of the Census, October Current Population Surveys, Washington, D.C.: US Bureau of the Census. http://www.census.gov/hhes/school/data/cps/historical/TableA-5a.xls. 1975-present.
Not Working and Not in School
US Bureau of Labor Statistics, Current Population Surveys, Washington, D.C.: US Bureau of the Census. Available from Forum on Child and Family Statistics, http://www.childstats.gov/ 1985-present. Special tabulation from CPS CD, 1975-1984.
Preschool Enrollment US Department of Education, National Center for Education Statistics, Digest of Education Statistics and Bureau of the Census, Current Population Survey. http://nces.ed.gov/programs/coe/tables/table-ope-1.asp, 1980-present, interpolated years 1976-1979.
Bachelor’s Degree US Department of Education, National Center for Education Statistics, Condition of Education http://nces.ed.gov/pubs2012/2012001.pdf, 1975-present..
Voting in Presidential Elections
US Bureau of the Census, Current Population Reports, Series P-20, Voting and Registration, Washington, D.C.: US Bureau of the Census http://www.census.gov/hhes/www/socdemo/voting/publications/p20/2008/tables.html 1975-present.
Single Parent Families US Bureau of the Census, Current Population Reports, Marital Status and Living Arrangements, Annual Reports. www.census.gov/population/socdemo/hh-fam/cps2011/tabC3-all.xls 1975–present.
Residential Mobility US Bureau of the Census, Series P-20, Geographic Mobility, Washington, D.C.: US Bureau of the Census. www.census.gov/hhes/migration/files/cps/cps2011/tab01-01.xls, 1975-present.
Suicide CDC, National Center for Health Statistics, National Vital Statistics System. http://www.cdc.gov/nchs/nvss/mortality_tables.htm 1975-present.
Church Attendance and Importance
The Monitoring the Future Study, Institute for Social Research, University of Michigan: Ann Arbor, MI. http://www.monitoringthefuture.org/ 1975-present.

.26.
Appendix C
NATIONAL CWI Values, 1975-200929, with an Updated Estimate for 201030 and an Initial Estimate for 201131
Year CWI Change in CWI1975 100.00 0.001976 100.75 0.751977 98.93 -1.821978 99.26 0.321979 99.97 0.711980 99.59 -0.371981 97.37 -2.231982 96.02 -1.351983 96.55 0.531984 96.43 -0.111985 93.92 -2.511986 95.14 1.221987 93.98 -1.151988 94.00 0.011989 94.52 0.521990 94.06 -0.461991 92.97 -1.091992 92.87 -0.101993 91.50 -1.371994 91.37 -0.141995 93.22 1.851996 93.87 0.651997 94.29 0.421998 96.92 2.631999 99.34 2.422000 101.20 1.852001 101.26 0.062002 102.40 1.152003 101.44 -0.972004 100.91 -0.532005 101.96 1.052006 103.06 1.102007 103.09 0.022008 102.83 -0.252009 101.93 -0.902010 102.50 0.562011 103.33 0.83
29 Numerical values of the CWI for earlier years are calculated and reported in each annual CWI Report. These values may have slight numerical differences from Annual Report to Annual Report due to the following factors:1. Updates in the numerical values of some of the Key Indicator time series: For instance, in the 2012 annual report, the childhood obesity time series is
updated with newly-released CDC statistics. Similarly, each year, the median family income series is updated with the most recent inflation-adjusted data from the U.S. Census Bureau. And recent vital statistics, such as teenage birth and mortality rates, are retrieved each year from preliminary reports issued by the CDC. When the CDC issues final reports one year later, vital statistics are usually adjusted by CDC and our indicators are updated accordingly.
2. Changes in the time series statistics: For instance, in the 2011 annual report, we adjusted the activity limitation series so that the age intervals of respondents (0-17) are consistent from 1975 to 2009 and updated the corresponding data from 2004 to 2009.
3. Data on the voting (ages 18-24), math scores and reading scores series are available only every four years. When new data become available, the projected indicators of these series are updated by accordingly.
30 As of release date, six Key Indicators were projected for 2010; see Table A-1 in Appendix A.31 As of release date, 18 Key Indicators were projected for 2011; see Table A-1 in Appendix A.
Statistical Significance of Changes in the CWIIn studying the year-to-year or period-to-period changes in the CWI time series, questions of statistical significance sometimes are raised. That is, given that the CWI has changed by, say, xx percent, from one year to another or from one time period to another, the question is: Is the xx change statistically significant? One approach to addressing this question is to study the time series fluctuations in the CWI from year-to-year, estimate a standard deviation or error of fluctuations in the time series, and then assess the size of a year-to-year or period-to-period change relative to the estimated standard deviation of the series. To operationalize this procedure, the expected value of the CWI for each year must be calculated. These values then can be subtracted from the observed values, squared, and divided by the length of the time series to estimate the variance. The square root of the estimated variance then can be taken as an estimate of the standard deviation of the CWI series taken as a time series.
We have applied this method, using a three-point moving average of the CWI values centered on each year t as the expected value of the CWI for year t. The resulting estimated standard deviation of the CWI time series compared to expected values based on three-point centered moving averages is 0.5. This implies that a year-to-year or period-to-period change in the CWI that is smaller than about 1.0 is not a statistically significant change.

.27.
Appendix D
The NATIONAL CWI: Long-Term Changes in the Domains and Key Indicators, 1975-2011 Corresponding to Figure 1 of Section II.A, Figure 1a shows long-term percentage changes from 1975 base year values of 100 in the seven Well-Being Domains of the CWI. In the following discussion, we describe the long-term changes through 2011.
50
60
70
80
90
100
110
120
130
140
150
160
1975
1976
1977
1978
1979
1980
1981
1982
1983
1984
1985
1986
1987
1988
1989
1990
1991
1992
1993
1994
1995
1996
1997
1998
1999
2000
2001
2002
2003
2004
2005
2006
2007
2008
2009
2010
2011
Per
cent
of B
ase
Yea
r
Year
Figure 1a. Domain-Specific Summary Indices, 1975-2011
Family Economic Well-beingSafe/Risky BehaviorSocial RelationshipsEmotional/Spiritual Well-beingCommunity EngagementEducational AttainmentHealth

.28.
• while eight of the 28 Key Indicators deteriorated: - children in families below the poverty line,- children in single parent families, - low birth weight, - activity limitation reported by parents,- obesity, - suicide, - religion importance, and- weekly religious attendance.
Since 1975:
• Figure 1a shows that, compared to the 1975 base year, two of the Domain-specific Indices of Well-Being show large increases: - safe/risky behavior, and- community engagement,
• while a third Domain Index shows a slight increase:- educational attainment,
• and four of the Domain Indices of Well-Being declined: - family economic well-being,- health, - social relationships, and- emotional/spiritual well-being.
• Compared to the 1975 base year, 20 of the 28 specific Key Indicators improved: - median family income, - health insurance, - secure parental employment, - residential mobility,- infant mortality, - child and adolescent mortality, - very good or excellent health reported by parents, - smoking, - drinking, - drug use,- teenage birth,- violent crime victimization, - violent crime offenders, - high school completion, - not working or in school, - college degree, - PreKindergarten enrollment,- voting, - reading, and - math.

.29.
295 Madison Avenue, 40th Floor New York, NY 10017 (212) 867-5777 phone (212) 867-5844 fax
www.fcd-us.org