national culture: understanding the impact of cross
TRANSCRIPT

Dissertations and Theses
10-2014
National Culture: Understanding the Impact of Cross-culture on National Culture: Understanding the Impact of Cross-culture on
Airline Pilots' Safety Performance in the Middle-East and North Airline Pilots' Safety Performance in the Middle-East and North
Africa (MENA) Region Africa (MENA) Region
Shareef Abdulla Kaddas Al-Romaithi Embry-Riddle Aeronautical University - Daytona Beach
Follow this and additional works at: https://commons.erau.edu/edt
Part of the Aviation Safety and Security Commons
Scholarly Commons Citation Scholarly Commons Citation Al-Romaithi, Shareef Abdulla Kaddas, "National Culture: Understanding the Impact of Cross-culture on Airline Pilots' Safety Performance in the Middle-East and North Africa (MENA) Region" (2014). Dissertations and Theses. 152. https://commons.erau.edu/edt/152
This Dissertation - Open Access is brought to you for free and open access by Scholarly Commons. It has been accepted for inclusion in Dissertations and Theses by an authorized administrator of Scholarly Commons. For more information, please contact [email protected].

NATIONAL CULTURE: UNDERSTANDING THE IMPACT OF CROSS-
CULTURE ON AIRLINE PILOTS’ SAFETY PERFORMANCE IN
THE MIDDLE-EAST AND NORTH AFRICA (MENA) REGION
by
Shareef Abdulla Kaddas Al-Romaithi
A Dissertation Submitted to the College of Aviation in Partial
Fulfillment of the Requirements for the Degree of
Doctor of Philosophy in Aviation
Embry-Riddle Aeronautical University
Daytona Beach, Florida
October 2014


iii
ABSTRACT
Researcher: Shareef Abdulla Kaddas Al-Romaithi
Title: NATIONAL CULTURE: UNDERSTANDING THE IMPACT OF
CROSS-CULTURE ON AIRLINE PILOTS’ SAFETY PERFORMANCE
IN THE MIDDLE-EAST AND NORTH AFRICA (MENA) REGION
Institution: Embry-Riddle Aeronautical University
Degree: Doctor of Philosophy in Aviation
Year: 2014
The continuous expansion of Middle Eastern airlines has created a pilot shortage. Since
the local pilot population in the Middle East is relatively small, airlines have been relying
on foreign pilots to satisfy their operational requirements. Consequently, pilots with
diverse cultural perspectives have been operating together. In order to manage this
cultural diversity and ensure safe operations, airlines have been applying a number of
training and operational strategies such as Crew Resource Management (CRM) with
emphasis on adherence to Standard Operating Procedures (SOP). However, CRM was
designed and implemented by North Americans as a solution for human factor intricacies
among North American pilots, and thus, CRM is not culturally calibrated to
accommodate pilots from other regions in the world.
The analyses of Flight Operational Quality Assurance (FOQA) information
acquired from a Middle Eastern airline aided in understanding the influences of cultural
diversity on airline operations. This analysis helped in understanding the impact of cross-
culture among airline pilots on three relevant unsafe performance events: hard landings,
unstable approaches, and pilot deviations.
iv
The study was conducted using a descriptive comparative method to analyze the
relationship between unsafe performance events and captain / first officer nationality
combinations during flights where performance events were recorded. The flight data
were retrieved from an unchanged flight data-recording environment yielding robust
detailed data that was combined with administrative demographic data.
Tests of associations were used to understand the relationship between unsafe
performance events and nationality combinations. These associations were illustrated
through multi-dimensional chi-square tests. A comparison of cross-cultural and
homogeneous flight deck crew combinations from unsafe performance events was
examined. Additional analyses were conducted to predict group membership through
discriminant analysis and multinomial logistic regression.
Several Spearman’s r correlation tests were conducted to assess the influence of
intervening demographic variables on the association between nationality combinations
and unsafe performance events. While cause-and-effect relationships between variables
could not be determined in this research design, association variations between variables
were made evident. ANCOVA statistical tests were conducted to control for the effect
of: age of captains / first officers, airport destinations, and eligibility to command the
flight on the relationship between nationality combination and unsafe performance
events.
The Spearman’s rank correlation test indicated significant weak correlation
between destination airport and unsafe performance events, as well as, eligibility to
command the flight and unsafe performance events. A 7 by 7 multi-dimensional
chi-square test indicated that there was a relationship between certain pilot nationality

v
combinations and unsafe performance events categories for pilot deviations and all
unsafe performance events together. Moreover, the discriminant analysis test results
showed that there was a significant effect of some nationality combinations on unsafe
performance events.
Results obtained from the analyses buttress the literature that certain cultural traits
and beliefs influence pilots’ behavior and attitudes and may jeopardize safety levels.
CRM skills may be weakened as a result of heterogeneous nationality combinations. It is
recommended to conduct further research on current CRM training concepts in order to
improve its effectiveness among cross-cultural crewmembers.

vi
© 2014 Shareef Abdulla Kaddas Al-Romaithi
All Rights Reserved

vii
DEDICATION
I would like to dedicate this work to the late president of the UAE, H. H. Sheikh
Zayed bin Sultan Al-Nahyan, whose visions and passion for education are an inspiration
to this day.
“The true wealth of a nation lies in its youth, one that is equipped with education and
knowledge and which provides the means for building the nation and
strengthening its principles to achieve progress on all levels”
H. H. Sheikh Zayed bin Sultan Al-Nayhan
viii
ACKNOWLEDGEMENTS
First and most importantly, I would like to thank Allah for his blessings and for
giving me the will to achieve my goals and complete my Ph.D. By his grace I was able
to conclude my degree.
I would like to express my appreciation and gratitude to my conscientious
committee, Dr. Tim Brady, Dr. MaryJo Smith, Professor John Sabel, and Dr. Antonio
Cortés. Their patience and expert guidance throughout the research made it possible for
me to reach where I am now. A note of recognition and thanks must be extended to my
friend and mentor, Dr. MaryJo Smith, whose unwavering support, encouragement, and
persistence for perfection were of valuable resources.
I would like to express my appreciation to all my professors and classmates who
made this degree enjoyable. I could not have done it without their support. Additionally,
I would like to express my sincerest thanks to the College of Aviation and all the team
members at Hunt library. Their hard work and continuous support made it possible for
me to achieve my goals.
I especially thank all the team members at Air MENA who helped me in
gathering the data and made this research possible. I would like to thank my family for
their support throughout my career at Embry-Riddle. A big thank you to my niece, Ward,
who was always there for me. Finally, I would like to thank my father, Abdulla Kaddas
Al-Romaithi, who taught me how to challenge my self and follow me dreams.

ix
TABLE OF CONTENTS
Page
Signature Page ................................................................................................................... ii
Abstract .............................................................................................................................. iii
Dedication ......................................................................................................................... vii
Acknowledgements .......................................................................................................... viii
List of Tables .....................................................................................................................xv
List of Figures ................................................................................................................. xvi
Chapter I Introduction ……………………………………………………………… 1
The UAE ..........................................................................................1
Aviation in the UAE ........................................................................1
General Civil Aviation Authority (GCAA). ........................3
Nationals versus Expatriates ................................................3
Pilot Shortage in the UAE................................................................5
Commercial Aviation Safety ............................................................6
Pilot Error.............................................................................6
The Middle East and North African Region (MENA).....................7
Selected Airline ..............................................................................11
Significance of the Study ...............................................................12
Statement of the Problem ...............................................................12
Purpose Statement ..........................................................................13
Research Questions ........................................................................13
Hypotheses .....................................................................................14

x
Limitations .....................................................................................15
Delimitations and Assumptions .....................................................15
Definition of Terms........................................................................16
List of Acronyms ...........................................................................19
Chapter II Review of the Relevant Literature ...........................................................23
Human Factors in Aviation ............................................................23
CRM: Improving Pilot Performance ..............................................24
Evolution of CRM..........................................................................24
Second Generation CRM - 1986 ....................................................25
Third Generation CRM - 1993 .......................................................25
Fourth Generation CRM - 1994 .....................................................25
AQP....................................................................................25
CRM: Transition to the Flight Deck ..................................26
Input - Process - Outcome (IPO) Model ............................27
Input Factors ......................................................................28
Process Factors...................................................................29
Outcomes ...........................................................................30
Fifth Generation CRM: Error management - 1996 ........................30
Sixth Generation: TEM - 2001 ......................................................31
Error versus Violation ........................................................31
Hazard ................................................................................32
Risk ....................................................................................34
Threats....................................................................35

xi
Errors......................................................................36
Flight Operational Quality Assurance (FOQA) .............................38
Pilot Deviations ..................................................................40
Air Safety Reports (ASR) ..............................................................42
Non-Technical Skills .....................................................................42
Culture............................................................................................43
Cross-Culture and Effectiveness of CRM..........................45
Cross-Culture and Adaptation to Aircraft Automation ......47
Cross-Culture and Variations in Communication Styles ...50
Safety Culture ................................................................................54
National Culture .................................................................56
Professional Culture ...........................................................60
Organizational Culture .......................................................61
Cross-Cultural Management ..........................................................62
Nuclear Power Plant ..........................................................63
Maritime .............................................................................65
Health Care ........................................................................67
Oil and Gas ........................................................................68
Flight Management Attitudes and Safety Survey
(FMASS) ............................................................................70
Summary ........................................................................................73
IPO .....................................................................................73
AQP....................................................................................74
xii
FOQA .................................................................................74
TEM ...................................................................................74
Culture................................................................................75
Chapter III Methodology ..........................................................................................77
Research Approach and Design .....................................................77
Population/Sample .........................................................................78
Generalizability ..............................................................................81
Sources of the Data ........................................................................81
Data Collection Device ..................................................................82
Measures ........................................................................................83
Treatment of the Data ....................................................................84
Assumption Checks ...........................................................88
Descriptive Statistics ..........................................................90
Inferential Statistics ...........................................................90
Research Question and Hypothesis Testing .......................90
H1 ...........................................................................90
H2 ...........................................................................91
H3 ...........................................................................91
H4 ...........................................................................92
H5 ...........................................................................92
H6 ...........................................................................92
Summary ........................................................................................95
Chapter IV Results ...................................................................................................97

xiii
Descriptive Statistics ......................................................................97
Unsafe Performance Events ...............................................97
Events by Aircraft Type .....................................................99
Events by Severity ...........................................................100
Events by Airport .............................................................102
Nationalities .....................................................................102
Pilots' Age ........................................................................107
Nationality Combinations and Unsafe Performance Events ........108
Inferential Statistics .....................................................................110
Hypothesis 1.....................................................................110
Hypothesis 2.....................................................................112
Hypothesis 3.....................................................................113
Hypothesis 4.....................................................................114
Hypothesis 5.....................................................................115
Hypothesis 6.....................................................................118
Chapter V Discussion, Conclusions, and Recommendations .................................124
Discussion ....................................................................................124
Population and Sample ....................................................125
Hypothesis Testing...........................................................125
H1 .........................................................................126
H2 .........................................................................127
H3 .........................................................................128
H4 .........................................................................128
xiv
H5 .........................................................................129
H6 .........................................................................129
Research Questions ..............................................130
Conclusion ...................................................................................130
Recommendations ........................................................................136
Recommendations for Future Research .......................................140
References ........................................................................................................................144
Appendices
A Permission to Conduct Research .............................................................163
B Air Safety Report (ASR) ..........................................................................165
C Tables .......................................................................................................168
D Figures......................................................................................................188

xv
LIST OF TABLES
Page
Table
1 Labor Force by Nationality ......................................................................................4
2 Threat and Error in Various Flight Phases .............................................................38
3 Unsafe Performance Events by Aircraft Type .....................................................100
4 Type of Event by Severity Level .........................................................................101
5 Distribution Among Pilot Nationality Combinations ..........................................106
6 Frequency of Age Categories ...............................................................................107
7 Frequency of Hard Landing Events by Nationality Combinations ......................108
8 Airport Destination by Unsafe Performance Event .............................................112
9 Eligibility of Pilot to Land at Destination Airport ...............................................114
10 Nationality Combinations by Unsafe Performance Events .................................115
11 Nationality Combinations Associated with Unsafe Performance Events ............120
12 Discriminant Analysis Classification Results for Unsafe Performance Events...121
13 Logistic Regression Classification Results for Unsafe Performance Events .......123
14 High PDI or IDV Dimensions by Nationality Combinations ..............................136

xvi
LIST OF FIGURES
Page
Figure
1 Wide Body Fleet Expansion Plans of Middle Eastern Carriers ...............................2
2 National Employment by Sector ..............................................................................5
3 Distribution of Error Types ......................................................................................7
4 Accidents per Phase of Flight ..................................................................................8
5 Categories of Accidents in 2011 ..............................................................................9
6 Rate of Gear-Up / Gear Collapse by Region ...........................................................9
7 Rate of Runway Excursions by Region .................................................................10
8 Rate of Hard Landings by Region .........................................................................10
9 Rate of Tail Strikes by Region ...............................................................................11
10 IPO Model ..............................................................................................................27
11 The SHELL Model ................................................................................................33
12 The Swiss Cheese Model .......................................................................................35
13 Egalitarian Versus Hierarchal Societies.................................................................50
14 Number of Duplicated and Non-duplicated Unsafe Performance Events by
Captains..................................................................................................................79
15 Number of Duplicated and Non-duplicated Unsafe Performance Events by First
Officers ..................................................................................................................80
16 Frequency of Unsafe Performance Events Type for Unstable Approaches ..........98
17 Frequency of Unsafe Performance Events Type for Pilot Deviations ...................99
18 Frequency and Severity Levels of Unsafe Performance Events ..........................101
xvii
19 Top 10 Nationality Combinations for Captain_First Officer ...............................105
20 Frequency of Unstable Approaches for Pilots Nationality Combinations ...........109
21 Frequency of Pilot Deviations for Pilots Nationality Combinations ...................110
22 Discriminant Functions Territorial Map ..............................................................122
23 Arrival and Departure Patterns at Hub.................................................................132
24 Seventh Generation CRM ....................................................................................139

1
CHAPTER I
INTRODUCTION
The purpose of this dissertation is to determine if cross-cultural flight deck crew
composition is related to increased error levels. Flight Operational Quality Assurance
(FOQA) information was analyzed with special emphasis on pilots’ national cultures.
The data were retrieved from an airline in the United Arab Emirates (UAE). Principles of
aircrew performances and aircraft operations, such as Crew Resource Management
(CRM) and Standard Operating Procedures (SOP), have been taken into consideration in
this study when defining errors and deviations committed by pilots.
The UAE
Stretched across the southeastern tip of the Arabian Peninsula, the UAE’s
geographical location is considered an economic passage between the West and East
(Zoubir, 1999). Since the discovery of oil in the 1950s, the UAE has experienced an era
of economic development transforming it into a prominent hub for international
commerce, trade, and tourism (Zoubir, 1999). In 2000, the UAE was estimated to have
10% of the world oil reserves (Al Abed & Hellyer, 2001). Endowed with considerable
oil reserves and being aware of declining natural resources, the UAE government has
diversified its economic strengths through investments in various industries, such as air
transportation (Verpermann, Wald, & Gleich, 2008).
Aviation in the UAE
The UAE has established itself as a global competitor in the aviation sector.
Airlines in the UAE transported over 56 million passengers and 3 million tons of
airfreight in 2009 (Oxford Economics, 2009). The aviation sector supports the UAE’s

2
economy by generating more than U.S. $39.47 billion, which is 14.7% of UAE’s Gross
Domestic Product (Jones, 2012). Furthermore, the aviation sector provides over 224,000
jobs in the UAE with an average annual salary of U.S. $86,000 (Oxford Economics,
2009).
In 2008, aircraft orders by operators in the UAE and other Middle Eastern
countries were valued at $40 billion (Vespermann et al., 2008). These expansion
strategies would enable Middle Eastern carriers to increase their network and flight
frequencies across the globe. The wide body aircraft orders placed in 2008, as illustrated
in Figure 1, show the expansion commitment among Middle Eastern carriers.
Figure 1. Wide body fleet expansion plans of Middle Eastern carriers. Adapted from
“Aviation Growth in the Middle East - Impacts on Incumbent Players and Potential
Strategic Reactions,” by Vespermann et al., 2008, Journal of Transport Geography,
16(16), 388-394. Copyright 2008 by Elsevier.

3
General Civil Aviation Authority (GCAA). In parallel with the European Joint
Aviation Requirements (JAR), the GCAA has been structured to govern and regulate
aviation activities in the UAE (GCAA, 2013b). The GCAA is aimed at establishing and
maintaining standardized safety performances among local operators (GCAA, 2013a).
Required operational standards and safety levels are defined by the GCAA through
published regulations that address minimum operational requirements and procedures
(GCAA, 2013a).
Nationals versus Expatriates. As of July 2012, the population in the UAE
reached 5,314,317 (Central Intelligence Agency, 2012). However, only 19% of the total
population in the UAE are nationals, while 81% of the total population in the UAE is
comprised of a wide array of nationalities, predominantly Asians, commonly referred to
as expatriates (Central Intelligence Agency, 2012). NatWest International Personal
Banking Quality of Life Index ranked the UAE as the third favorite place to live among
expatriates due to its tax-free environment, job opportunities, and overall quality of life
(Ferguson, 2013).
Expatriates account for most of the population in Middle Eastern countries, such
as the UAE, comprising nearly 84% of the total population (United Nations [UN], 2005).
In contrast, while expatriates dominate the Middle East, the majority of the European
population is comprised of nationals. The highest percentage of expatriates in Europe is
Luxembourg at 30%, followed by Switzerland at 20% (UN, 2005).
The critical imbalance between nationals and expatriates in the UAE has created a
diverse work environment in all sectors. A comparison between nationals and expatriates
4
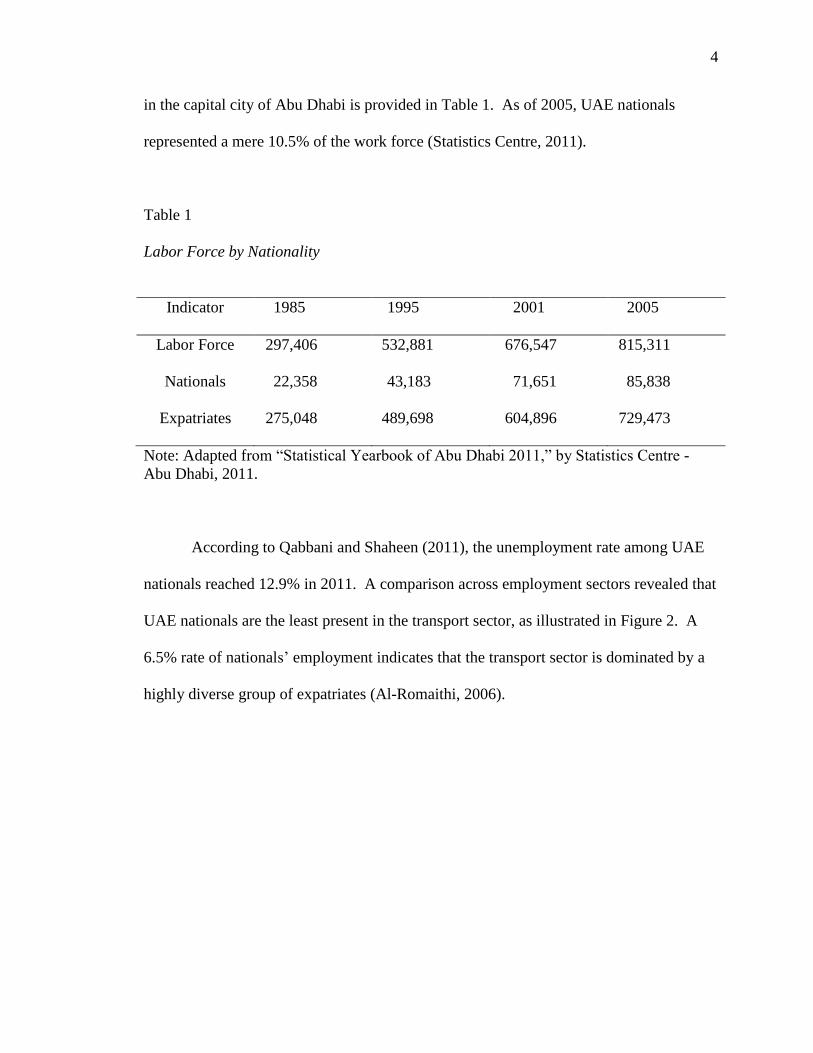
in the capital city of Abu Dhabi is provided in Table 1. As of 2005, UAE nationals
represented a mere 10.5% of the work force (Statistics Centre, 2011).
Table 1
Labor Force by Nationality
Indicator 1985 1995 2001 2005
Labor Force 297,406 532,881 676,547 815,311
Nationals 22,358 43,183 71,651 85,838
Expatriates 275,048 489,698 604,896 729,473
Note: Adapted from “Statistical Yearbook of Abu Dhabi 2011,” by Statistics Centre -
Abu Dhabi, 2011.
According to Qabbani and Shaheen (2011), the unemployment rate among UAE
nationals reached 12.9% in 2011. A comparison across employment sectors revealed that
UAE nationals are the least present in the transport sector, as illustrated in Figure 2. A
6.5% rate of nationals’ employment indicates that the transport sector is dominated by a
highly diverse group of expatriates (Al-Romaithi, 2006).

5
Figure 2. National employment by sector. Adapted from “Emiratization Efforts in the
UAE: Impediments to a Serious Vision,” by National Bank of Dubai, 2005. Copyright
2005 by National Bank of Dubai.
Pilot Shortage in the UAE
Airlines in the UAE have transformed the country into a global nexus and an
integral hub for international operations (Vespermann et al., 2008). However, due to the
shortage of national pilots, carriers in the UAE have been relying on foreign pilots.
According to Captain Khaled Al Ali, Director of Licensing at the GCAA, the total
number of registered pilots in the UAE was 9,480 in 2012; 700 of these pilots were UAE
nationals (A. Khaled, personal communication, October 21, 2012).
National pilots and aircraft ground engineers at Emirates Airlines represent
approximately 12% of the airline’s total work force (International UAE, 2011).
Furthermore, airline operators in the UAE are expanding rapidly and pilot training
programs in the region are not providing airlines with the required number of qualified
national pilots (Carbary, 2011). In order to meet its large order of 144 aircraft, Emirates
Airlines planned to hire more than 700 pilots from several countries beginning in 2010
and extending for 18 months (Sambidge, 2010). By 2020, the number of pilots in the
UAE is expected to increase by 75% (Glass, 2008).
6
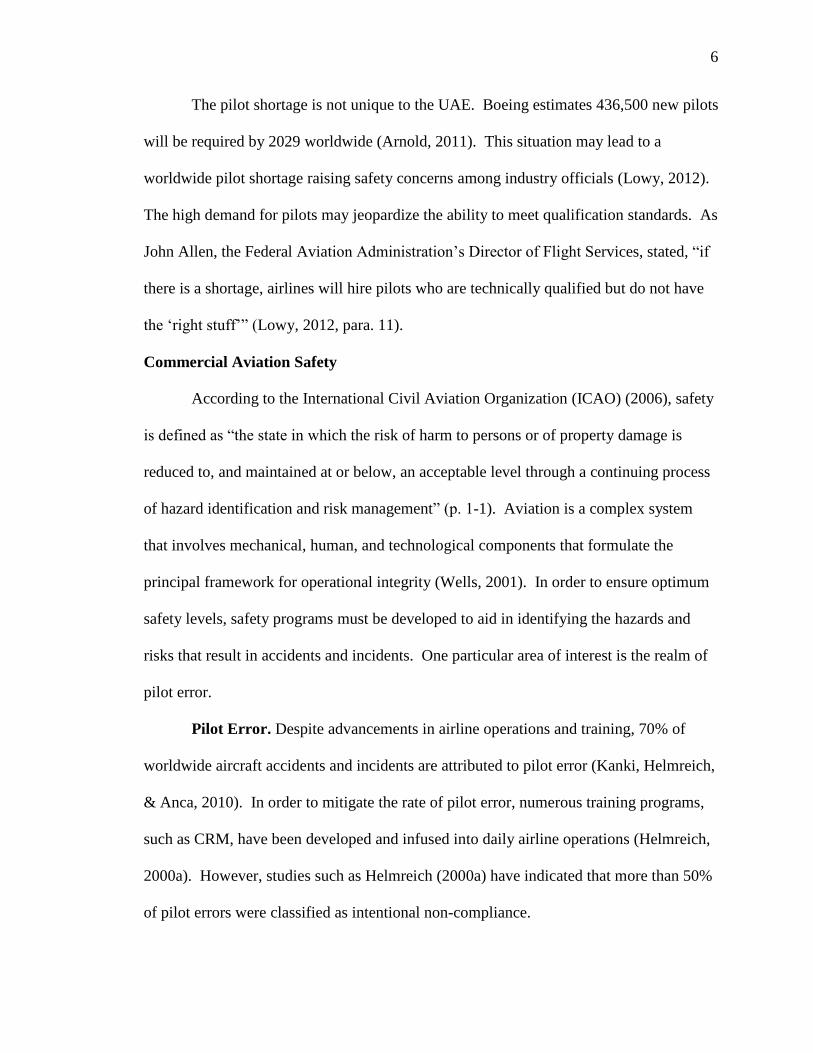
The pilot shortage is not unique to the UAE. Boeing estimates 436,500 new pilots
will be required by 2029 worldwide (Arnold, 2011). This situation may lead to a
worldwide pilot shortage raising safety concerns among industry officials (Lowy, 2012).
The high demand for pilots may jeopardize the ability to meet qualification standards. As
John Allen, the Federal Aviation Administration’s Director of Flight Services, stated, “if
there is a shortage, airlines will hire pilots who are technically qualified but do not have
the ‘right stuff’” (Lowy, 2012, para. 11).
Commercial Aviation Safety
According to the International Civil Aviation Organization (ICAO) (2006), safety
is defined as “the state in which the risk of harm to persons or of property damage is
reduced to, and maintained at or below, an acceptable level through a continuing process
of hazard identification and risk management” (p. 1-1). Aviation is a complex system
that involves mechanical, human, and technological components that formulate the
principal framework for operational integrity (Wells, 2001). In order to ensure optimum
safety levels, safety programs must be developed to aid in identifying the hazards and
risks that result in accidents and incidents. One particular area of interest is the realm of
pilot error.
Pilot Error. Despite advancements in airline operations and training, 70% of
worldwide aircraft accidents and incidents are attributed to pilot error (Kanki, Helmreich,
& Anca, 2010). In order to mitigate the rate of pilot error, numerous training programs,
such as CRM, have been developed and infused into daily airline operations (Helmreich,
2000a). However, studies such as Helmreich (2000a) have indicated that more than 50%
of pilot errors were classified as intentional non-compliance.

7
The number of intentional non-compliance errors is alarming, making it
imperative to identify and evaluate the driving factors behind these pilot behaviors and
attitudes, as illustrated in Figure 3. Due to the differences in norms and beliefs among
pilots, national cultural variation is of particular concern as operational standards may be
influenced.
Figure 3. Distribution of error types. Adapted from “Culture and Error in Space:
Implications from Analog Environments,” by R. L. Helmreich, 2000a, Aviation, Space,
and Environmental Medicine, 79(9-11), 133-139. Copyright 2000 by the University of
Texas at Austin.
The Middle East and North African Region (MENA)
The International Air Transport Association (IATA) has categorized aircraft
accidents and incidents into various phases of flight. According to an IATA (2012)
safety report for the MENA region, a total of 92 aircraft accidents occurred in 2011, 46 of
which occurred during the landing phase. Judging by the high number of landing events
compared to the other categories in Figure 4, landing can be viewed as the most critical
phase of flight.

8
Figure 4. Accidents per phase of flight. Adapted from “Safety Report 2011,” by
International Air Transport Association, 2012.
Among commercial international carriers, accidents that occurred in 2011 have
been classified into different categories, such as runway excursion, hard landing, and tail
strike as depicted in Figure 5. Gear-up landing / gear collapse (18%) and runway
excursions (19%) contributed the highest percentage of occurrences in 2011 in the
MENA region (IATA, 2012). The MENA region experienced higher rates of accidents in
these two categories than other regions, as illustrated in Figures 6 and 7. Flight crew
errors involved in the aforementioned accidents include lack of adherence to SOP, poor
decision-making processes, and poor flying skills (IATA, 2012).
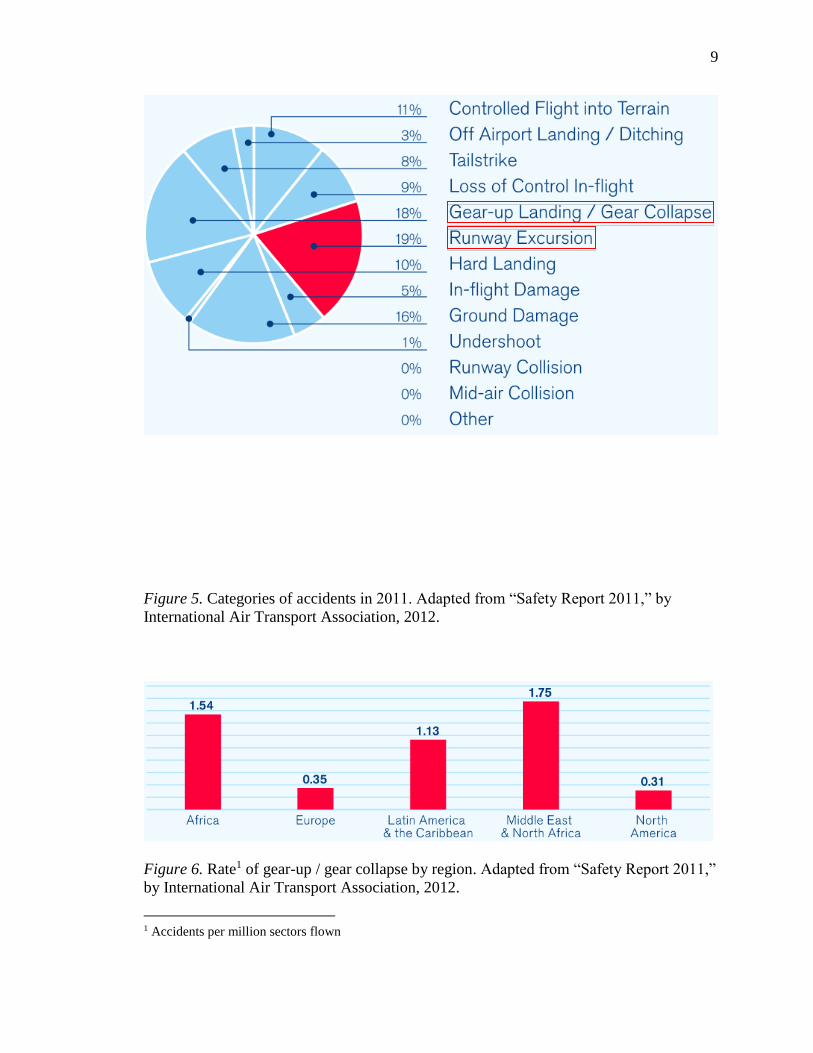
9
Figure 5. Categories of accidents in 2011. Adapted from “Safety Report 2011,” by
International Air Transport Association, 2012.
Figure 6. Rate1 of gear-up / gear collapse by region. Adapted from “Safety Report 2011,”
by International Air Transport Association, 2012.
1 Accidents per million sectors flown

10
Figure 7. Rate2 of runway excursion by region. Adapted from “Safety Report 2011,” by
International Air Transport Association, 2012.
In 2009, the number of accidents among commercial carriers in the MENA region
decreased by 17% compared to previous years, though the MENA region experienced
significantly higher rates of hard landings and tail strikes compared to other regions as
depicted in Figures 8 and 9 (IATA, 2010). Contributing factors that led to these incidents
included failure to execute a go-around after destabilization during the final approach
phase and poor automation skills (IATA, 2010).
2 Accidents per million sectors flown

11
Figure 8. Rate2 of hard landings by region. Adapted from “Safety Report 2009,” by
International Air Transport Association, 2010.
Figure 9. Rate3of tail strikes by region. Adapted from “Safety Report 2009,” by
International Air Transport Association, 2010.
The rates from Figures 8 and 9 are important as they link contributing factors with
operational deficiencies present among pilots. These rates are associated with operational
deficiencies due to pilots’ poor automation skills and incorrect operational procedures
during destabilized approaches (IATA, 2010). This linkage requires a deep
understanding of operational requirements and mitigating actions that are developed
through systematic and procedural approaches in standardization processes. Although
the events that have occurred in the MENA region involved aircraft registered in the
MENA region, pilots with different nationalities operated these aircraft. Thus, cross-
cultural influences may have played a role in the aforementioned events.
Selected Airline
3 Accidents per million sectors flown

12
Due to the sensitivity of the data gathered and in order to protect the identity of
the airline that provided the data, this study will refer to the selected airline as Air
MENA. Since its inaugural flight, Air MENA has developed into a globally recognized
airline serving 86 international destinations utilizing a highly advanced mixed fleet of
Airbus and Boeing aircraft (Corporate Communications, 2012). The work force at Air
Mena is comprised of 10,000 multi-national skilled employees (Corporate
Communications, 2012).
Significance of the Study
Airline operations in the Middle East, and particularly in the UAE, are constantly
expanding. According to ICAO (2013), airports in the UAE handled 212,074 departures
for three local carriers in 2010. Since the employment rate of UAE nationals in the
aviation sector is noticeably low, carriers are highly dependent on expatriate pilots. As a
result, while interacting with crewmembers from various cultures, flight deck crew may
not perform to their full potential during critical phases of the flight due to differences in
attitudes and beliefs (Moran, Harris, & Moran, 2011). George’s (2010) study has
revealed that human error contributes to more than half of the incidents and accidents
experienced by airline operators. By analyzing the cultural differences present among
airline pilots and the impact of these differences on operational safety, this dissertation
aims to determine the need for a Cross-Cultural Awareness and Action Program
(CCAAP) that would improve pilot safety performance.
Statement of the Problem
Airlines registered in the MENA region account for the highest ratio of accidents
when compared to other regions. The low number of qualified national pilots in the

13
Middle East compels airlines registered in the MENA region to rely on cross-cultural
flight crews. This reliance creates a vast cross-cultural environment on the flight deck of
Middle Eastern airlines. Hiring pilots from various cultural backgrounds introduces
various attitudes, behaviors, and beliefs into the organization that could inadvertently
jeopardize operational safety and may result in flight deck mismanagement.
Purpose Statement
The purpose of this dissertation is to determine if cross-cultural flight deck crew
composition is related to increased error levels. Data from an airline in the UAE was
utilized to analyze the influence of cross-cultural pilots on operational safety.
The airline industry is highly diversified, extremely safety-sensitive, and
technologically driven. Due to the complexities of air transportation, airlines have
implemented fundamental training programs to attain and maintain safe operations
including CRM, threat and error management (TEM), and SOP (Salas, Bowers, & Edens,
2001). Continuous improvements to these programs have been made as the industry
strives to improve the safety of air travel. In order to understand the influence of cross-
cultural crew environment on pilot performance, it is crucial to study these programs and
explore their impact on daily operations (Salas, Bowers, & Edens, 2001).
Research Questions
One research question will be addressed in this study to identify possible
relationships between cross-cultural crews and safety performance. The research
question focuses on three flight events: Hard Landings, Unstable Approaches, and Pilot
Deviations during various flight phases.
14
To what extent can we predict an unsafe performance event based on the
nationality combination of pilots?
Hypotheses
This dissertation aims to analyze six null hypotheses. Three hypotheses compare
cross-cultural and homogeneous flight deck crews in terms of safety performance with
regard to Hard Landings, Unstable Approaches, and Pilot Deviations during various
flight phases. Three other hypotheses assess the influence of intervening demographic
variables on the association between nationality combinations and unsafe performance
events.
1. There was no significant effect of the covariate age on the relationship
between nationality combinations of captains / first officers and unsafe
performance events.
2. There was no significant effect of the covariate airport destination on the
relationship between nationality combinations of captains / first officers and
unsafe performance events.
3. There was no significant effect of the covariate eligibility to command the
flight on the relationship between nationality combinations of captains / first
officers and unsafe performance events.
4. There was no significant association between the frequency of homogeneous
and heterogeneous cross-cultural nationality combinations of captains / first
officers on unsafe performance events.
5. There was no significant association between the frequency of the nationality
combinations of captains / first officers on unsafe performance events.
15
6. There was no significant association between cross-cultural (pilot nationality)
group memberships on unsafe performance events.
Limitations
This dissertation analyzed a data set obtained from an airline in the UAE. The
data provided are factual and objective, and the data do not explain why something
happened, just that it did. These data were captured by the flight data monitoring system
due to exceedances in preset operational limitations. Due to the sensitivity of the data
gathered from the selected airline, the data was thoroughly de-identified and treated as
proprietary. No information was revealed that would jeopardize the identity of the airline
and pilots involved with the study. Data that specifically identify individuals or the
airline have been omitted; these data include, but are not limited to, aircraft registration,
staff numbers, and pilot names.
Delimitations and Assumptions
It was assumed that pilots operate at or above the minimum proficiency levels as
mandated by the civil aviation authorities. As such, it was assumed that pilots employed
by other airlines in the region attain the same minimum proficiency levels by undergoing
similar training programs.
Despite the large number of airlines in the MENA region, data was retrieved from
only one airline. However, the shortage of pilots was common among carriers in this
region. These carriers depended on expatriate pilots for their recruitment processes.
Hence, it was assumed that other airlines in the region had a similar cross-cultural
environment.

16
Flight events involved in the gathered data are assumed to be normal flights
without any instructors, examiners, or evaluators who may have influenced pilots’
performances. Also, pilots with dual national heritage (Chinese-American) were
included in only a single nationality category. These pilots were assumed to have
behaved according to their primary national culture as defined by Helmreich (1999). For
example, a Chinese-American would be considered an American.
Definitions of Terms
AQP Advanced Qualification Program. A new training initiative that
allows airlines to develop tailored training curriculums aimed at
improving training and flight safety (Federal Aviation
Administration [FAA], 2006a).
ASR Air Safety Report. Safety reports used by pilots to file operational
deviations under normal and abnormal flight conditions
(Operations Manual Part A, 2012a, Chapter 11.6.2.).
CRM Crew Resource Management. “The effective use of all available
resources: human resources, hardware, and information” (FAA,
2004a, p. 2).
Cross-Culture A flight deck crew composed of a captain and first officer from at
least two different cultural backgrounds (Helmreich, 2000a).
Culture “Shared values (what is important) and beliefs (how things work)
that interact with an organization’s structure and control systems to
produce behavioral norms (the way we do things around here)”
(Reason, 1998, p. 294).

17
Error “An action or inaction that leads to a deviation from crew or
organizational intentions or expectations” (Klinect, Wilhelm, &
Helmreich, 1999, p. 3).
FOQA Flight Operational Quality Assurance. A safety program that
enables airlines to routinely collect flight data for analysis
purposes. This program can help airlines reduce potential risks
and minimize pilot errors (FAA, 2013).
Hazard “Any existing or potential condition that can lead to injury, illness,
or death; damage to or loss of a system, equipment, or property; or
damage to the environment. A hazard is a condition that might
cause an accident or incident” (FAA, 2010, Appendix 1, p. 6).
Individualism versus Collectivism A cultural dimension that refers to two types
of societies: an individualistic society where individuals are
concerned with their own interests and collectivistic society where
individuals are concerned with the interests of others over self
interests (Hofstede, Hofstede, & Minkov, 2010).
Masculinity versus Femininity A cultural dimension that refers to two types of
societies: a masculine society where individuals are more assertive,
competitive, and reward-oriented, and a feminine society where
individuals are more modest, caring, and cooperative (Strauch,
2010).
National Culture Attitudes, behaviors, and values based on heritage
(Helmreich, 1999).
18
Risk “The composite of predicted severity (how bad) and likelihood
(how probable) of the potential effect of a hazard in its worst
credible (reasonable or believable) system state” (FAA, 2010,
Appendix 1, p. 8).
Organizational Culture Attitudes, behaviors, and values that are influenced by
different organizational groups (Stolzer, Halford, & Goglia, 2008).
Pilot Deviations Actions or inactions by pilots that deviate from airline
procedures and regulations (FAA, 2009).
Power Distance A cultural dimension that measures hierarchal degrees in
societies. Inequality between senior and junior crewmembers may
be viewed differently in various societies; thus, attitudes and
behaviors are influenced accordingly (Hofstede et al., 2010).
Professional Culture Attitudes, behaviors, and values that are influenced by
professions (Stolzer et al., 2008).
SHELL Software-Hardware-Environment-Liveware-Liveware. Is a model
that describes the operational relation between five human factors -
related links: software, hardware, environment, liveware, and
liveware (Stolzer et al., 2008).
Threats “Events or errors that occur beyond the influence of the flight
crew, increase operational complexity, and which must be
managed to maintain margins of safety” (Bradley, 2010, p. 4).
19
Violation “Deliberate - but not necessarily reprehensible - deviations from
those practices deemed necessary to maintain the safe operation of
a potentially hazardous system” (Reason, 2009, p. 195).
Uncertainty Avoidance A cultural dimension that measures the degree of
discomfort among individuals with regards to uncertainty and
ambiguity (Strauch, 2010).
List of Acronyms
AAL Above Aerodrome Level
AES Arrival / Engine Shutdown
AIMS Airline Information Management System
AQP Advanced Qualification Program
APR Approach
ASR Air Safety Report
ATC Air Traffic Control
C3RM Cross-Cultural Crew Resource Management
CAP Cultural Action Program
CAT Cultural Awareness Training
CCAAP Cross-Cultural Awareness and Action Program
CIS Commonwealth of Independent States
CMAQ Cockpit Management Attitudes Questionnaire
CRM Crew Resource Management
CRP Culture Re-Qualification Program
CRZ Cruise

20
DST Descent
DV Dependent Variable
ECL En Route Climb
EFQM European Foundation for Quality Management
ESD Engine Start / Depart
FAA Federal Aviation Administration
FDM Flight Data Monitoring
FLC Flight Close
FLP Flight Planning
FMAQ Flight Management Attitude Questionnaire
FMASS Flight Management Attitudes and Safety Survey
FOQA Flight Operational Quality Assurance
G Gravity
GCAA General Civil Aviation Authority
GDS Ground Servicing
GOA Go-Around
GSM Global System for Mobile
IATA International Airport Transport Association
ICAO International Civil Aviation Organization
ICE Integrated Culture Evaluation
ICL Initial Climb
IDV Individualism versus Collectivism
IPO Input-Process-Output

21
IV Independent Variable
JAR Joint Aviation Requirements
LND Landing
MENA Middle East and North Africa
MAS Masculinity versus Femininity
NBD National Bank of Dubai
NDB Non-Directional Beacon
NTSB National Transportation Safety Board
PD Power Distance
PRF Pre-Flight
PSF Post-Flight
RTO Rejected Take-Off
SHELL Software-Hardware-Environment-Liveware-Liveware
SMM Safety Management Manual
SMS Safety Management System
SOP Standard Operating Procedures
SPSS Statistical Package for the Social Sciences
TEM Threat and Error Management
TOF Take-Off
TXI Taxi-In
TXO Taxi-Out
UAE United Arab Emirates
UAI Uncertainty Avoidance Index

22
UN United Nations
VLS Lowest Selectable Speed
VREF Landing Reference Speed
VOR Very-High-Frequency Omni-Range Navigation Equipment
23
CHAPTER II
REVIEW OF THE RELEVANT LITERATURE
A genuine cross-cultural experience is ubiquitous in the daily operations of most
organizations (Solomon & Schell, 2009). To achieve required operational standards in
any organization, the organization must become culturally adept by understanding the
different values, beliefs, and behaviors expressed by cross-cultural work forces (Solomon
& Schell, 2009).
Human Factors in Aviation
Aviation pioneers have focused on enhancing aircraft technologies and aircraft
design to increase operational safety and improve pilot efficiency (Roscoe, 1980). From
World War I until the present day, the air transportation system has experienced
remarkable changes that have resulted in operational improvements (Brady, 2000). The
proliferation of new computerized aircraft systems has increased safety levels by
reducing pilots’ workload through the introduction of advanced flight instruments (Tsang
& Vidulich, 2003). Moreover, safety levels have continued to improve as a result of
enhanced aviation regulations in such areas as pilot training, licensing, and aircraft
maintenance programs (Wells & Rodrigues, 2004).
Undoubtedly, the use of technological improvements has revolutionized air
transportation by reducing accident rates and providing operational flexibility for pilots.
Nevertheless, new types of accidents and incidents have emerged that have raised safety
concerns with regard to pilot performance (Tsang & Vidulich, 2003). To gain a better
understanding of various operational deficiencies, Tsang and Vidulich (2003) conducted
several studies on pilots’ interactions and behaviors. One of their studies revealed that

24
accidents and incidents were a result of errors due to “interpersonal rather than technical
deficiencies” (Tsang & Vidulich, 2003, p. 477). In order to mitigate these errors, a
training program, known as CRM, has been implemented by airlines.
CRM: Improving Pilot Performance
In an effort to reduce pilot error and improve overall performance on the flight
deck, a new training program was designed in 1980 to enable pilots to effectively utilize
their resources (Helmreich, Merritt, & Wilhelm, 1999). As defined in Advisory Circular
120-51E, CRM is “the effective use of all available resources: human resources,
hardware, and information” (FAA, 2004a, p. 2). To achieve efficiency and effectiveness
from CRM training, operators incorporate comprehensive SOP in a teamwork-based
curriculum (FAA, 2004a). Special emphasis is placed on skills and behaviors that enable
crewmembers to be effective team members (FAA, 2004a).
Evolution of CRM
In the early 1980s, CRM training was focused on the negative behavior of
subordinate crewmembers and encouraged captains to perform with a team-oriented
attitude rather than with a dictatorial managerial style (Tsang & Vidulich, 2003). Certain
interpersonal behaviors between pilots that promoted teamwork and cooperation were
reinforced through class exercises (Merritt & Helmreich, 1997). Results from extensive
studies provided impetus to the airlines’ training departments to review and evaluate their
current training curricula (Merritt & Helmreich, 1997). As a result, CRM became an
integral part of pilot training in the classroom and simulator (Kanki et al., 2010).

25
Second Generation CRM - 1986
Airline focus on CRM led to further developments in pilot training. Additional
training elements, such as team building, situational awareness, and stress management
strengthened the CRM program. The notion of synergy and teamwork ideologies was
further reinforced by changing the name from cockpit resource management to crew
resource management (Helmreich et al., 1999). However, training exercises at the time
did not relate specifically to aviation activities, which may have negatively influenced the
pilots’ acceptance of the program (Kanki et al., 2010).
Third Generation CRM - 1993
A new CRM concept emerged that allowed further improvements in pilot
performance. Aviation-related factors, such as organizational culture and human factors,
were infused into the third generation of the training program (Helmreich et al., 1999).
Moreover, CRM training was extended to check airmen, cabin crew, maintenance
personnel, and dispatchers (Kanki et al., 2010). However, further developments in CRM
were required to understand the factors behind human errors.
Fourth Generation CRM - 1994
Major changes were introduced to the fourth generation that allowed airlines to
develop individualized training programs known as an Advanced Qualification Programs
(AQP) (FAA, 2006a). Inclusion of AQP in an airline’s training program provides a
proficiency-based curriculum that targets pilot error (Tsang & Vidulich, 2003).
AQP. The FAA has developed a new training initiative that aims at improving
airlines’ training programs by allowing each individual airline to develop tailored
curricula (FAA, 2006a). These curricula are based upon the proficiency levels of each

26
airline’s pilots rather than mere compliance with required flight and ground training
hours (FAA, 2006a). Through the implementation of an AQP, airlines are capable of
improving proficiency levels through continuous evaluation of crew performance (FAA,
2006a). Seven characteristics distinguish AQP from other safety programs (Farrow,
2006):
1. Implementation of an AQP is voluntary;
2. An AQP requires utilization of innovative and evaluative methodologies;
3. An AQP may be integrated with an existing training program;
4. Qualification criteria will be based upon individual and team performance;
5. Data collection and analysis will be used to validate proficiency levels;
6. Training will be developed according to training requirements; and
7. An AQP will involve continuous development and maintenance to meet
training requirements.
CRM: Transition to the Flight Deck. CRM training programs have undergone
extensive changes as they have matured in various airlines’ training programs. Pilots’
behaviors and attitudes have evolved as well (Helmreich, Chidester, Foushee, Gregorich,
& Wilhelm, 1990). However, the potential of CRM has not been fully realized. Certain
pilots have continued to exhibit nonconformist attitudes toward the new training
curricula. The pilots’ acceptance of changes and new training programs is highly
important when seeking improvements in safety levels. Because of the cultural
differences found in international airlines, these airlines have considered national culture
training into their CRM programs to stress the importance of cultural harmony within

27
their organization (Helmreich et al., 1999). International airlines with major cultural
variations recognize the importance of cross-cultural training programs (Mjøs, 2004).
Input - Process - Outcome (IPO) Model. An input-process-outcome (IPO)
model delineates the effectiveness of teamwork among crewmembers by providing a list
of factors influencing crew performance at various stages (Tsang & Vidulich, 2003).
These factors reflect crewmembers’ characteristics as they are influenced by a set of
attitudes, competencies, and skills (Salas, Wilson, Burke, & Burke, 2006). Since
crewmembers’ performance is group-based, their success depends on team coordination
and overall standardization among members. Figure 10 provides a general model of
inputs, processes, and outcomes upon which operational safety is dependent. The authors
noted that factors such as pilots’ professional culture, communication, and individual
attitudes, are interlinked and affect overall safety levels (Kanki et al., 2010).
Figure 10. IPO Model. Adapted from “Crew Resource Management,” by B. G. Kanki,
R. L. Helmreich, & J. Anca, 2010. Copyright 2010 by Elsevier Inc.

28
Input Factors. The input segment is categorized into seven main components
that reflect crewmembers’ attitudes and behaviors based upon group interactions. These
attitudes and behaviors may impact crewmembers’ performance (Kanki et al., 2010):
1. Individual aptitudes: refers to the proficiency levels of crewmembers. Pilots
and cabin crew must demonstrate certain levels of proficiency to meet airline
and authority requirements.
2. Physical condition: refers to the physical and health status of crewmembers.
Crewmembers must undergo rigid annual medical checks.
3. Crew composition: refers to the total number of crewmembers and their
gender distribution. All flights require a minimum number of crewmembers;
this number varies depending on the length of the flight. For example, flights
exceeding 14 hours require four pilots (Operations Manual Part A, 2012e).
4. Organizational: refers to the policies that control operational variables, such as
management-worker relations.
5. Regulatory: refers to the rules and operational limitations that formulate the
regulatory influences in an organization. Regulatory examples include
maximum duty hours and minimum crew compositions.
6. Cultural: refers to the quality of interaction between crewmembers that can be
influenced by cross-culture as a result of variations in attitudes and behaviors.
7. Environmental: refers to the surrounding factors such as organizational,
regulatory, and cultural influences to create a work environment deemed
necessary for operational requirements.

29
Since these seven components are considered internal and external factors, they
define multi-dimensional characteristics that have a pervasive effect on crewmembers’
performance. Each component forms an important operational layer that conceptualizes
crew proficiency levels and determines operational safety (Kanki et al., 2010).
Process Factors. During the process stage, crewmembers integrate their
knowledge and skills to perform their duties according to predetermined standards.
During this stage, many of the tasks performed are considered non-technical skills and
include factors such as communications, decision-making process, workload
management, teamwork, and situational awareness (Tsang & Vidulich, 2003). Though
highly dependent on input factors, the process factors form the fundamentals required by
crewmembers to achieve safe operations. Effective teamwork and cooperative skills
form the foundation of process factors. Thus, the awareness of cultural differences
among pilots on the flight deck is vital for effective usage of non-technical skills. There
are six components involved in the process stage (Kanki et al., 2010):
1. Crew formation and management: refers to how workload is divided among
crewmembers in a manageable and resourceful manner.
2. Aircraft flight control: refers to aircraft components, such as ailerons and
elevators, which receive inputs from the pilots to perform certain tasks.
3. Communication skills: refers to the interaction between pilots and air traffic
control, between captain and first officer, and between pilots and cabin crew.
4. Decision processes: refers to decisions and actions taken by crewmembers
during normal or abnormal flight situations.

30
5. Situational awareness: refers to the crewmembers’ ability to recognize and act
upon operational requirements.
6. Operating procedures: refers to the standard procedures set forth by the
airline. These procedures must ensure certain operational requirements.
Outcomes. Due to technical advancements in the commercial aviation sector,
accident rates are already low, making it difficult to use accident rates as measures of
effective outcomes. In order to achieve optimal outcomes, airlines must maintain,
monitor, and promote safe operations through a hazard identification and risk assessment
process. This process has been integrated with safety programs, such as FOQA, and is
fundamental to the development of a safety management system (SMS) (Stolzer et al.,
2008).
Fifth Generation CRM: Error Management - 1996
The underpinning notion of the fifth generation of CRM is that human error is
inevitable and the consequences of these human errors can only be minimized
(McCartney, 2005). Avoiding, trapping, or mitigating errors form the foundations of fifth
generation CRM (Kanki et al., 2010). Error identification lies deep within an
organization’s IPO model. CRM provides an error management methodology that adopts
a non-punitive approach to aid in identifying the nature and source of errors (Helmreich
et al., 1999). Over time, CRM has been defined by the following characteristics; CRM:
1. Inculcates a comprehensive system of applying human factors concepts to
improve crew performance;
2. Embraces all operational personnel;
3. Blends into all forms of aircrew training;

31
4. Concentrates on crewmembers’ attitudes, behaviors, and impact on safety;
5. Uses the crew as the unit of training;
6. Requires the active participation of all crewmembers; and
7. Provides an opportunity for individuals and crews to examine their own
behavior, and to make decisions on how to improve flight deck teamwork
(FAA, 2004a, p. 6).
Sixth Generation: TEM - 2001
As CRM evolved through five generations, it became apparent to researchers and
airline operators that identifying errors alone is not sufficient for a successful CRM
program (Kanki et al., 2010). Recognizing and assessing threats became valuable
components of CRM, which enhanced situational awareness and decision-making skills
among crewmembers (Kanki et al., 2010).
Error versus Violation. Prior to adopting a non-punitive environment, an
organization must clearly define and distinguish between error and violation. Error is
defined as “an action or inaction that leads to a deviation from crew or organizational
intentions or expectations” (Klinect et al., 1999, p. 3). Error can appear in three different
forms: (a) initial and impromptu, (b) threat-related, and (c) as a component of the chain
of errors (Klinect, 2005).
Violation is defined as “deliberate - but not necessarily reprehensible - deviations
from those practices deemed necessary to maintain the safe operation of a potentially
hazardous system” (Reason, 2009, p. 195). Reason (2009) classified violations as
follows:

32
1. Routine Violations: Following a path with the least amount of effort provides
convenience although it does not abide by the operator’s requirements and SOPs.
Designing simplified systems and procedures can eliminate these violations.
2. Exceptional Violations: In some circumstances, violations are inevitable due to
present conditions. This type of violation is known as system double-binds and is
highly dependent on surrounding conditions (Reason, 2009). For example, a crew
may elect to commit a violation in order to rectify a particular situation despite the
level of risks it may present.
Hazard. The FAA defines hazard as “any existing or potential condition that can
lead to injury, illness, or death; damage to or loss of a system, equipment, or property; or
damage to the environment. A hazard is a condition that might cause an accident or
incident” (FAA, 2010, Appendix 1, p. 6). Examples of common hazards are pilot fatigue
and improper use of checklists.
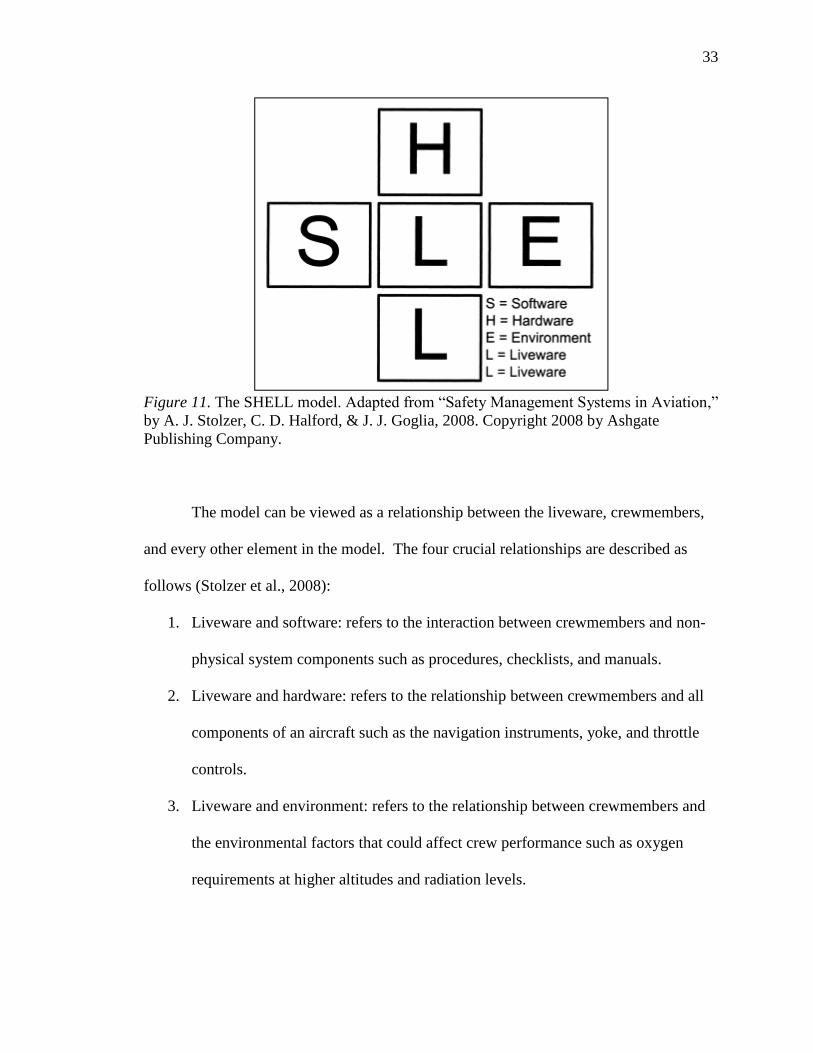
Various models aid in understanding and analyzing hazards. One of these models
is the Software-Hardware-Environment-Liveware-Liveware (SHELL) model as depicted
in Figure 11. This model provides systematic data pertaining to operations from a human
factor perspective and encompasses the following elements: software, hardware,
environment, liveware, and liveware (Stolzer et al., 2008). These elements are comprised
of human factor interventions that identify various interactions occurring on the flight
deck (Wise, Hopkin, & Garland, 2010).
33
Figure 11. The SHELL model. Adapted from “Safety Management Systems in Aviation,”
by A. J. Stolzer, C. D. Halford, & J. J. Goglia, 2008. Copyright 2008 by Ashgate
Publishing Company.
The model can be viewed as a relationship between the liveware, crewmembers,
and every other element in the model. The four crucial relationships are described as
follows (Stolzer et al., 2008):
1. Liveware and software: refers to the interaction between crewmembers and non-
physical system components such as procedures, checklists, and manuals.
2. Liveware and hardware: refers to the relationship between crewmembers and all
components of an aircraft such as the navigation instruments, yoke, and throttle
controls.
3. Liveware and environment: refers to the relationship between crewmembers and
the environmental factors that could affect crew performance such as oxygen
requirements at higher altitudes and radiation levels.
34
4. Liveware and liveware: refers to the interaction between crewmembers and other
individuals directly related to operational requirements such as cabin
crewmembers, air traffic controllers, and ground engineers (Stolzer et al., 2008).
Risk. According to the FAA, risk is defined as “the composite of predicted
severity (how bad) and likelihood (how probable) of the potential effect of a hazard in its
worst credible (reasonable or believable) system state” (FAA, 2010, Appendix 1, p. 8). A
pilot who continues flying the final approach despite the large cumulonimbus cell ahead
faces a number of risks such as aircraft stall, poor aircraft performance, or possibly a
crash.
Since human error is a leading factor for operational risk, exploring the sources of
risks are vital for future safe operations. Threats and errors have been viewed as the main
sources of risks in daily operations. The accumulation of threats and errors may lead to
irreversible and undesirable outcomes. Figure 12 is a graphic illustration of the Swiss
cheese model. Each cheese layer represents safeguards and defenses against
organizational weaknesses and risks that are represented by holes in each layer (Reason,
1997). As the number of weaknesses and risks increases, the chance of an accident or
incident becomes higher.

35
Figure 12. The Swiss cheese model. Adapted from “Managing the Risk of
Organizational Accidents,” by J. Reason, 1997. Copyright 1997 by Ashgate Publishing
Company.
Although the Swiss cheese model has been widely used in professional training
programs, its depiction of organizations and human interactions limits the model’s use.
The model does not address the complex relationship between latent conditions and
active failures, which confines its graphical description to a linear fashion (Dekker,
2006b). The simplicity behind the model’s graphical illustration fails to explain the chain
of events that may have led to weakness in safety levels and eventually mishaps
(Hollnagel & Woods, 2006).
Threats. Daily airline operations are faced with numerous threats that are defined
as “events or errors that occur beyond the influence of the flight crew, increase
operational complexity, and which must be managed to maintain margins of safety”
(Bradley, 2010, p. 4). Early identification of threats can prevent breakdowns of
safeguards and defenses. The two main types of threats are:

36
1. Internal Threats: Elements that occur on the flight deck and are directly
related to pilots’ behaviors and attitudes are considered internal threats.
Examples of internal threats include lack of rest, fatigue/stress due to work
overload, poor communication, or lack of cooperation between pilots due to
cultural variations (Klinect, 2005).
2. External Threats: Elements that occur outside the flight deck environment,
such as meteorological conditions, high terrain, air traffic control congestion,
or engine failure are considered external threats (Klinect, 2005). External
threats pose the highest level of operational risks during the most critical flight
phases: takeoff and landing (Klinect et al., 1999).
Errors. An increase in the number of internal and/or external threats results in a
higher risk of pilot error. James (2011) divides these errors into four categories:
1. Operational Decision Errors: This type of error is highly dependent on the
decision-making, situational awareness, and workload capabilities of the pilots.
For example, failure to perform a go-around during a destabilized approach is a
serious error that could lead to irreversible consequences.
2. Communication Errors: Misinterpretation or omission of air traffic control
calls may lead to the risk of undesirable altitude deviations and possibly a
TCAS event. Also, communication errors between pilots, between pilots and
cabin crew, and between pilots and ground staff may lead to incidents and
accidents.
3. Procedural Errors: Performing SOP incorrectly during any phase of the flight
may result in accidents or incidents.

37
4. Handling Errors: Undesired aircraft state caused by low proficiency levels and
weak situational awareness.
TEM can be accomplished through an understanding of sequential threats and
errors leading to operational deficiencies (Thomas, 2004). In order to identify these
deficiencies, it is important for the leaders of organizations to understand the hazards,
risks, and consequences these deficiencies pose to daily operations. Airline operations
present a wide array of hazards and risks that could jeopardize operational safety.
Managing threats and errors is a critical process that involves a combination of
experience and rigorous training (James, 2011). Once threats have been identified, pilots
must perform proficiently to avoid errors. Avoiding error can be accomplished through
strict adherence to SOP, the use of effective communication between crewmembers,
adhering to an effective decision-making process, and maintaining high proficiency
levels. If errors have been committed, they must be trapped before multiple errors
accumulate and lead to consequential events (James, 2011). Trapping errors can be
accomplished by continuous crosschecking and monitoring of aircraft systems, weather,
and other related factors, such as communication. If errors have penetrated through the
safeguards and system defenses, then the errors can be mitigated by changing the course
of action, for example, executing a go-around or diverting to an alternative airport
(James, 2011).
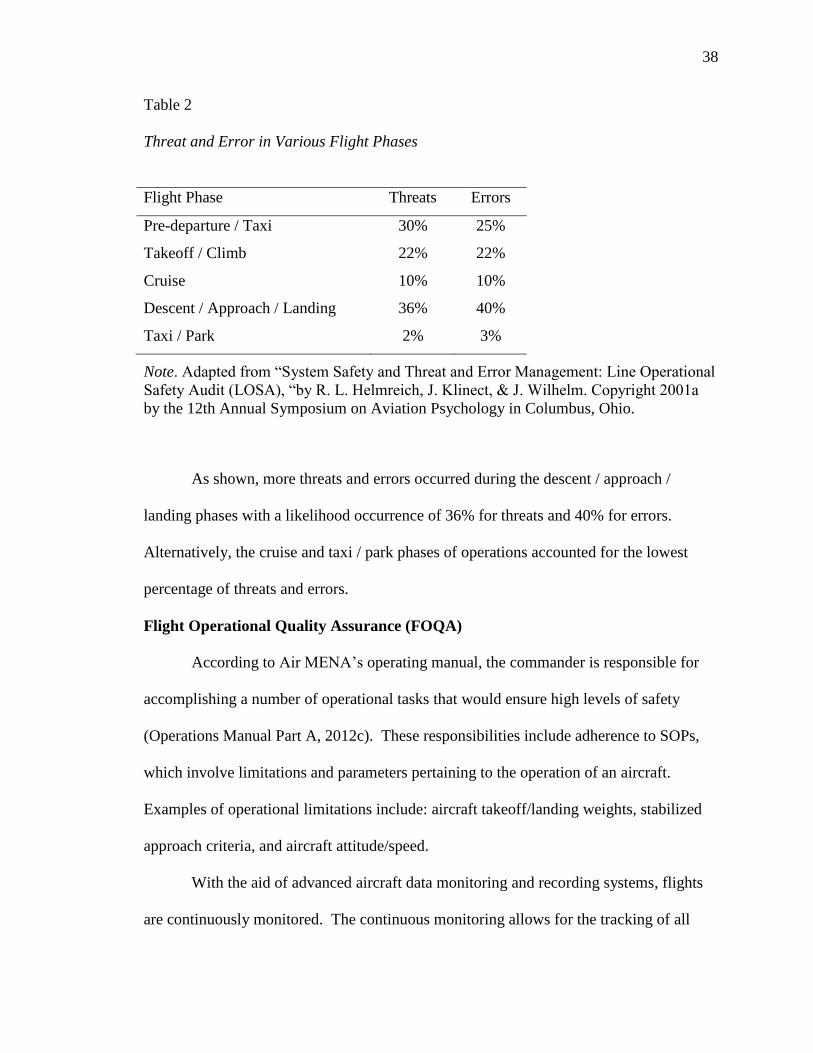
According to a study conducted by the University of Texas at Austin, threats and
errors are more likely to occur during descent / approach / landing phases due to the high
workload experienced by the pilots (Klinect et al., 1999). Table 2 provides the likelihood
of threat and error occurrences per flight phase.
38
Table 2
Threat and Error in Various Flight Phases
Flight Phase Threats Errors
Pre-departure / Taxi 30% 25%
Takeoff / Climb 22% 22%
Cruise 10% 10%
Descent / Approach / Landing 36% 40%
Taxi / Park 2% 3%
Note. Adapted from “System Safety and Threat and Error Management: Line Operational
Safety Audit (LOSA), “by R. L. Helmreich, J. Klinect, & J. Wilhelm. Copyright 2001a
by the 12th Annual Symposium on Aviation Psychology in Columbus, Ohio.
As shown, more threats and errors occurred during the descent / approach /
landing phases with a likelihood occurrence of 36% for threats and 40% for errors.
Alternatively, the cruise and taxi / park phases of operations accounted for the lowest
percentage of threats and errors.
Flight Operational Quality Assurance (FOQA)
According to Air MENA’s operating manual, the commander is responsible for
accomplishing a number of operational tasks that would ensure high levels of safety
(Operations Manual Part A, 2012c). These responsibilities include adherence to SOPs,
which involve limitations and parameters pertaining to the operation of an aircraft.
Examples of operational limitations include: aircraft takeoff/landing weights, stabilized
approach criteria, and aircraft attitude/speed.
With the aid of advanced aircraft data monitoring and recording systems, flights
are continuously monitored. The continuous monitoring allows for the tracking of all

39
aircraft systems in which an exceedance was detected during the course of the flight.
These technologies have improved aviation safety by evolving the flight investigation
techniques from a reactive approach to proactive and predictive approaches (Stolzer et
al., 2008). These approaches form the basis of a safety program known as FOQA.
According to ICAO, “FOQA is a proactive and non-punitive programme for gathering
and analyzing data recorded during routine flights to improve flight crew performance,
operating procedures, flight training, air traffic control procedures, air navigation
services, or aircraft maintenance and design ” (ICAO, 2006, p. 16-3). Although FOQA is
a voluntary safety program for U.S. based airlines, once an airline decides to implement
it, then the program is not voluntary for pilots (FAA, 2004b). In contrast, ICAO Annex 6
requires all airlines to implement FOQA programs (ICAO, 2006).
FOQA offers an objective approach toward flight data collection and analysis set
forth by each airline known as Flight Data Monitoring (FDM) (Stolzer et al., 2008).
Airlines develop policies, processes, and procedures upon which their daily operations
are based. FDM systems are utilized to monitor standard levels and identify areas of
operational risks (Flight Data Monitoring System, 2012). The primary function of the
system is to monitor flight operations, record pilot deviations, and flag any flight
deviations that exceed operational limitations and policies. This system provides each
airline’s safety department the capability to identify possible trends and mitigate risks
experienced during flights as a result of deficiencies among pilots, communication skills
with air traffic control (ATC), and/or weak SOPs (Flight Data Monitoring System, 2012).
The FDM system records and processes flagged pilot deviations, such as hard
landings and unstable approaches, according to pre-selected parameters that are in

40
accordance with the airline’s SOPs (Flight Data Monitoring System, 2012). Flight events
are categorized under three severity levels: minor, major, and critical. Depending on the
extent of the deviation, a severity level would be assigned. For example, flying at a
speed of 260 knots instead of the limit of 250 knots when the aircraft is below 5,000 feet
would trigger a minor event since the exceedance level is not severe. On the other hand,
flying an unstable approach due to an incorrect aircraft configuration below 1,000 feet
would generate a major or critical event.
Pilot Deviations. According to the FAA (2009), pilot deviations are actions or
inactions that disagree with SOPs and published regulations. Three areas of pilot
deviations were analyzed: hard landings, unstable approaches, and general pilot
deviations in various flight phases.
According to Air MENA, nine published stabilized approach criteria must be
achieved by 1,000 feet in either instrument or visual metrological conditions; otherwise, a
go-around must be conducted (Operations Manual Part A, 2012d, Chapter 8.3.20.17.2,
pp. 117-118). Additional approach criteria include:
1. The airplane is on the correct path;
2. Pitch is within +10o and -0o;
3. Bank is no more than 7o;
4. Speed is within target speed +10 knots and Landing Reference Speed (VREF)
/ Lowest Selectable Speed (VLS), excluding minor deviations due to gusty
conditions on final approach;
5. The airplane is in the correct and briefed landing configuration;

41
6. Sink rate is not more than 1,000 feet per minute, or a rate of descent
appropriate to aircraft type and configuration, or as required by the approach
procedure;
7. Power setting is appropriate for the airplane configuration and is not below the
minimum power for approach as defined by the aircraft operating manual.
Significant changes are only permitted for gust compensation;
8. All briefings and checklists have been completed; and
9. ILS approaches shall be flown within one dot of glide slope and localizer.
During non-precision approaches the course deviation must stay within ½ dot
or 2.5 degrees for very-high-frequency omni-range navigation equipment
(VOR) approaches and 5 degrees for a non-directional beacon (NDB)
approaches.
In terms of hard landings, the FDM system defines this event as excessive vertical
loads exerted on the main landing gear (Flight Data Monitoring System, 2012). The unit
used for this event is Gravity (G) and each aircraft type has different lateral load limits
that are pre-defined in the FDM system. Hard landings may result in high loads on the
main landing gear that could damage aircraft structures (Aigoin, 2012). Other negative
outcomes associated with hard landings include pilot-induced oscillations, loss-of-
control, and lateral excursions. By reviewing FDM systems, certain aircraft parameters
associated with hard landings, such as aircraft weight, vertical speed, and vertical
acceleration, could be identified (Aigoin, 2012). Besides unstable approaches and hard
landings, additional pilot deviations will be reviewed, such as speed exceedances,
excessive bank angles, and overweight landing.
42
Air Safety Reports (ASR)
Air MENA maintains a positive safety reporting culture where crewmembers
report their errors and experiences through safety report forms. These forms are
reviewed and analyzed by safety investigators at the safety department. Depending on
the severity of events, recommendations are made to the Training and Flight Operations
departments to provide additional training and implement required operational changes.
A number of events require crewmembers to file a report, such as (Operations Manual
Part A, 2012a, Chapter 11.6.2, pp. 16-18):
1. An emergency is declared;
2. A runway or taxiway incursion/excursion;
3. Go-around below 1,000 feet above ground level;
4. A bird strike or wildlife strike; or
5. Aircraft evacuation.
Unfortunately, the reporting system at Air MENA identifies the name and staff
numbers of the involved crewmembers. Since the reports are identified among the
departments, pilots may view this as a punitive system and feel that filing an ASR may
jeopardize their jobs. A sample of an ASR is attached in Appendix B.
Non-Technical Skills
Since the 1980s, CRM has been studied from a developmental point of view,
taking into consideration human error, hazards, risks, and TEM (Kanki et al., 2010).
When analyzing pilots’ behaviors and attitudes, it is necessary to explore their non-
technical CRM skills. Non-technical skills are defined as “the cognitive and social skills

43
of flight crewmembers on the flight deck, not directly related to aircraft control, system
management, and standard operating procedures” (Flin et al., 2003, p. 96).
Non-technical skills include: communication, situational awareness, decision-
making, leadership, and teamwork (Kanki et al., 2010). Incorporation of non-technical
skills into CRM training is viewed as a positive move toward the understanding of
attitudinal and behavioral implications by crewmembers (Powell & Hill, 2006).
Incorporating CRM training as an error countermeasure alone will not result in
behavioral changes on the flight deck (Helmreich & Wilhelm, 1998). Despite the
remarkable evolution that CRM has undergone, it still lacks a crucial cultural dimension
that provides a clear two-way communication between superiors and subordinates
(Edkins & Pfister, 2003). When viewed from a cultural perspective, a first officer may be
hesitant to point out an error to his/her captain out of respect. A study by Kanki et al.,
(2010) concluded that culture, and particularly national culture, impacts CRM training
and impedes its transfer to the flight deck. Inclusion of non-technical skills in CRM
training is a preliminary approach to understanding safety culture and its influence on
pilots’ performance (Edkins & Pfister, 2003). Presumably, pilots will become more
aware of cultural influences by combining non-technical skills training with CRM
training.
Culture
High risk organizations, such as airlines, nuclear power plants, hospitals, and
maritime, are highly dependent on the reliability of human performances and the
effectiveness of their interactions (Haber & Shurberg, 2002). High risk organizations
involved in these industries have implemented multiple defense systems comprised of a

44
combination of human input and computerized systems to reduce the chances of injuries
and loss of human life (Powell & Hill, 2006). Nevertheless, between 80% and 90% of
accidents and incidents are attributed to unsafe behaviors among employees (Cox, Jones,
& Rycraft, 2004).
Unsafe behaviors are a result of weaknesses in several primary non-technical
skills that include: communication, decision-making, leadership, and workload
management (Mjøs, 2004). Studies have demonstrated that these non-technical skills are
highly influenced by cultural variations among employees (Mjøs, 2004). Culture is
defined as “the collective programming of the mind that distinguishes the members of
one group or category of people from another” (Hofstede, 2001, p. 9).
A homogeneous culture is a culture “in which the shared meanings are similar and
little variation in beliefs exists; that is, the culture has one dominant way of thinking and
acting” (Hahn, 2010, para. 10). Because homogeneous cultures share similar beliefs and
values, the degree of consensus among their societies is stronger than a cross-cultural
society (Hahn, 2010).
Hahn defines cross-culture (heterogeneous) as a culture “in which numerous
population groups have specific and distinct values and understandings” (2010, para. 10),
and has numerous values and beliefs that shape the ideologies of a diverse society (Hahn,
2010). As such, cross-cultures tend to be less congruent than homogeneous cultures
because they involve diversified attitudes and beliefs.
According to Barinaga (2007), homogeneous and cross-cultural work forces
approach and perform organizational tasks differently. It has been shown that complex
interactions among group members, such as pilots and ATC, are less effective in cross-

45
cultural groups than in homogeneous groups (Barinaga, 2007). Variations in
performances may be due to the differences in communication and behavioral skills that
form the basis of non-technical skills (Barinaga, 2007).
Individuals and groups in organizations are influenced by the different values,
beliefs, and norms that are entrenched in their behaviors and attitudes (Stolzer et al.,
2008). Fostering a cross-cultural environment without an effective organizational safety
culture that trains personnel to bridge cultural differences may lead to weaknesses and
breakdowns of the organization’s safeguards and defense systems (Haber & Shurberg,
2002).
Organizations often learn from one another when addressing safety measures
(Drogoul, Kinnersly, Roelen, & Kirwan, 2007). However, it is crucial for organizations
to have a clear understanding of their own safety requirements as these requirements vary
depending on the type of operations involved (Drogoul et al., 2007). Airlines operate
globally and their operations involve cross-cultural interactions among employees. Thus,
behavior-based interventions provide effective strategies when designing regulations and
standard operating procedures (Cox et al., 2004). These interventions explain human
factor deficiencies that influence operational safety, one of which is culture (Cox et al.,
2004).
Cross-Culture and Effectiveness of CRM. Airlines have adopted CRM training
as a booster for non-technical skills among airline pilots (Salas et al., 2001). However,
the notion that CRM is not influenced by culture is false (Wise et al., 2010). CRM was
designed and implemented by North Americans as a solution for human factor intricacies
among North American pilots, and thus, CRM is not culturally calibrated to
46
accommodate pilots from other regions in the world (Wise et al., 2010). Traditional
CRM programs had Western cultural “imprints” and thus clashed with values held by
other national cultures (Helmreich & Merritt, 2000). For example, the concept that co-
pilots should be assertive and question decisions made by captains has not transferred
positively in many countries due to cultural attributes that restrict these behaviors
between subordinates and superiors (Helmreich & Merritt, 2000).
Helmreich (2000b) stated that global airlines should adopt CRM training as an
approach to manage and mitigate threat and error on the flight deck. Indeed, CRM
programs are designed to train pilots for non-technical skills that would aid them in
decision-making processes (Harris & Muir, 2005). However, there have been numerous
controversies concerning CRM’s acceptance among airline pilots and its positive transfer
from the classroom to the flight deck (Helmreich & Merritt, 2000). Salas, Wilson, Burke,
and Burke (2006) conducted reviews on several studies that evaluated the effectiveness of
CRM training. These studies focused on two underpinning questions that provided
learning and behavioral evidence from CRM training (Salas, Wilson, Burke, & Burke,
2006, pp. 401-402):
1. Do trainees learn from CRM training?
2. Do trainees apply the learned CRM behaviors?
Inconsistencies in the results indicate that CRM is influenced by culture
(Helmreich & Merritt, 2000). Performing tasks safely in a cross-cultural flight deck
depends on effective utilization of automation systems and efficient communication
skills, particularly during flight phases that involve high workload, such as approach and
landing (Mjøs, 2004). Consequently, a culturally influenced flight deck environment has

47
led to further implications in important operational facets including communication skills
and crewmembers’ effective interaction with the aircraft’s automation systems (Yang,
2005; Sherman, Helmreich, & Merritt, 1997). A high number of the studies reviewed
indicated positive and negative effects of CRM training (Salas, Wilson, Burke, & Burke,
2006).
Cross-Culture and Adaptation to Aircraft Automation. The end of the 1960s
marked a new era for the airline industry, particularly with regard to aircraft technology
(Wise et al., 2010). Supported by a strong economy and market expansions, air travel
growth was at an all-time high (Wise et al., 2010). Recognizing the poor safety records,
and human imperfections and errors, manufacturers developed advanced automated
aircraft systems to meet industry standards (Edkins & Pfister, 2003). Safety levels
improved considerably and transformed airlines into an advanced computerized type of
operation (Wise et al., 2010). The decrease in accident rates was not only due to the
introduction of automation, but also due to enhanced power plant reliability, better
meteorological forecasting, higher fidelity simulators, tightened training standards, and
other initiatives that all contributed to increased safety levels (Wise et al., 2010).
While safety records have improved since the introduction of automation on the
flight deck, accidents attributed to human error have reached a plateau at approximately
70% since the 1970s (Hansman, 2001). The nature of error, however, has transferred
from poor piloting skills to improper use of automation (Dekker, 2006b). Studies have
shown that 50% of aircraft accidents and incidents are a result of flight deck design
(Kinnersley & Roelen, 2007). Pilots did not adapt well to automated aircraft and,

48
therefore, these advanced support systems have become traps (Kinnersley & Roelen,
2007). Hansman (2001) identified two causes behind pilots’ difficulties in adaptation:
1. Flying habits are difficult to change. Transitioning from non-glass to glass
flight decks can be demanding, particularly for experienced pilots with
thousands of hours on conventional airplanes; and
2. All automated aircraft systems are displayed in English, where English is a
second language for many pilots.
Further studies have revealed a third weak link between pilots and automation.
Pilots tend to use 20% of the features in aircraft automation not only because of habitual
restrictions and language barriers alone, but because of cross-cultural attributes and
beliefs as well (Helmreich, 2008). Pilots’ reliance on automation systems varies by pilot
nationality (Sherman, Helmreich, & Merritt, 1997).
A study by the European Coordination Centre for Research and Documentation in
Social Sciences revealed that different cultures interacted with aircraft automation in
various ways (Sherman et al., 1997). Pilots from individualistic and egalitarian nations,
such as the United States and Ireland, can manage the automation system without
difficulties, but would rather manually fly the airplane (Strauch, 2010). Alternatively,
pilots from hierarchical nations, such as China and Taiwan, manage the automation
system with difficulties, but would rather rely on them, because they trust the system
more than themselves (Sherman et al., 1997). Pilots from hierarchical nations also tend
to strictly adhere to set procedures and rules; therefore, they depend on automation
systems (Strauch, 2010). Unexpected deviations may confuse pilots from hierarchical
nations and lead to poor decision-making (Sherman et al., 1997). A recent example of
49
this complication is the crash of Asiana Flight 214 in San Francisco in July 2013, where
the auto-throttle did not operate as expected and may have led to confusion on various
auto-flight modes (Croft, 2013).
Misuse and disuse of automation systems are two primary causes that may
degrade operational safety (Lee & See, 2004). Misuse refers to inappropriate reliance on,
and usage of, the automation system while disuse refers to insufficient usage and distrust
of the automation system (Lee & See, 2004). Misuse and disuse are both side effects of
automation for cross-cultural crewmembers (Strauch, 2010)
Societies are often categorized according to certain traits and beliefs that
differentiate them from one another (Hofstede, 2001). Hierarchical societies accept
inequality and behave with a collectivist mindset (Moran et al., 2011). Individuals from
these societies are often reticent and reserved, yet success-oriented (Moran et al., 2011).
On the other hand, egalitarian societies are dominated by individualistic ideologies
(Moran et al., 2011). Egalitarians are often short-term-oriented and can work in groups
(Hofstede, 2001). The aforementioned differences between societies have a direct impact
on pilots’ willingness to interact with automation systems (Sherman et al., 1997). Figure
13 lists some of the egalitarian and hierarchical societies.

50
Figure 13. Egalitarian versus hierarchal societies. Adapted from “Managing Across
Cultures,” by C. M. Solomon & M. S. Schell, 2009. Copyright 2009 by McGraw-Hill
books.
Cross-Culture and Variations in Communication Styles. Communication is
defined as a multi-dimensional process of exchanging information between individuals
via verbal and non-verbal methods (Barak, 2011). Cross-cultural communication can
present challenges and barriers due to differences in beliefs, values, and languages
(Solomon & Schell, 2009). Language diversity plays a prominent role in creating
operational challenges in a cross-cultural environment (Thomas, 2008). Ineffective
communication due to language barriers may lead to poor situational awareness and

51
lower confidence levels among crewmembers (Lichacz, 2008). Although English is the
primary language in international businesses and organizations, it is often used as a
second language, which creates a number of disadvantages (Thomas, 2008):
1. Mental exhaustion;
2. Fluency in a second language may create an impression of competency in
other aspects;
3. First-language speakers tend to slow down their rate of speech and simplify
their sentences in response to second-language speakers; and
4. Second-language speakers may pretend to understand first-language speakers
to avoid embarrassment.
Cross-cultural communication is constrained by the cultural inputs provided by
the speaker (Hofstede et al., 2010). These inputs are implemented unintentionally and are
a byproduct of cultural influences (Solomon & Schell, 2009). In order to gain effective
communication in a cross-culture environment, it is important to understand the different
communication styles:
1. Direct versus indirect: the idea of speaking one’s mind in a clear and concise
manner is considered a direct style (Solomon & Schell, 2009). In contrast, the
context of the message in an indirect communication relies on the tone of the
voice and non-verbal communication (Solomon & Schell, 2009). Non-verbal
communication may create additional barriers to cross-cultural
communication due to uncommon body language, movements, gestures, and
postures (Barak, 2011). Nevertheless, nonverbal communication provides a
52
higher level of trust (Barak, 2011). For example, a pat on the back is an
indication of satisfaction and a job well done.
2. High context versus low context: individuals with a high context style tend to
demand a comprehensive explanation with explicit details concerning the
information being exchanged, whereas low context individuals expect only the
information needed to complete a certain task (Yang, 2005). Any additional
information may lead to confusion and time wasted (Yang, 2005). For
example, pilots may provide long briefings that include irrelevant information,
which may lead to confusion. On the other hand, a concise briefing that
includes only information relevant to a certain procedure may be more
efficient and lead to a better understanding.
Not surprisingly, members of a cross-cultural organization tend to adapt to
variations in communication styles (Barak, 2011). More often than not, a positive work
environment is maintained as a result of cross-cultural harmony (Barak, 2011). But to
what extent would these members alter their communication styles? Communication
differences may be perceived incorrectly and provoke an undesired work atmosphere
(Barak, 2011).
A study conducted by Pekerti and Thomas (2003) examined communication
behaviors between 48 Anglo-European New Zealanders and 48 Asians, primarily from
China. Each New Zealander was paired with an Asian participant to rank crimes
according to severity levels in 15 minutes. To complete the task, participants used
communication styles adapted from their own culture to interact with other nationalities
(Pekerti & Thomas, 2003). It was concluded that individuals in a cross-cultural
53
interaction tend to exaggerate their cultural behaviors in an effort to clarify their
intentions (Pekerti & Thomas, 2003).
Another study was conducted in 2003 to compare communication skills between
three groups: American crewmembers, Chinese crewmembers, and cross-cultural
crewmembers (Salas, Wilson, Burke, Wightman, & Howse, 2006). The evaluation of the
three groups suggested that homogeneous members communicated better and made fewer
errors than heterogeneous members (Salas, Wilson, Burke, Wightman, & Howse, 2006).
Furthermore, Mjøs (2004) stated that cross-cultural interactions may negatively influence
work performance, particularly when tasks are accomplished by means of effective
communication, such as workload coordination and management.
Due to the existence of a cross-cultural work force on the flight deck with a
multitude of linguistic abilities, ICAO has set the English language as the international
language in aviation (Tiewtrakul & Fletcher, 2010). This standardization, known as
Aviation English, involves specific phraseologies to simplify the communication process
and eliminate potential errors between pilots, and between pilots and air traffic
controllers (Alderson, 2009). According to the regulations outlined by the GCAA,
“pilots who are required to use the radio telephone aboard an aircraft shall demonstrate
the ability to speak and understand the English language” (GCAA, 2013b, p. 1-B-2).
As more international airlines are sharing the skies, Aviation English skills are
becoming an integral part of a pilot’s life (Sharkey, 2012). Communication problems
still degrade safety levels, despite English being the required language of operation
(Tiewtrakul & Fletcher, 2010). Since cross-culture has a strong influence on
communication skills, airlines with a diverse international pilot population must dedicate

54
special attention toward standardizing their pilots by providing Aviation English training
courses.
Safety Culture
Amid the rapid growth of economic globalization, industries have become
dependent on cross-cultural work forces, and it is unrealistic for an organization to
maintain homogeneous cultures within its work environment (Thomas, 2008). A
dependency on a diverse work force has evolved the nature of the work force and created
a complex environment in which an organization must perform (Wiegmann, Zhang,
von Thaden, Sharma, & Gibbons, 2004). Toward this end, culture has been viewed as the
primary influence of an individual’s attitude and behavior that directly influences his/her
performance (Griswold, 2013).
Organizations must understand cross-cultural concepts and recognize their
influences on safety (Kelly & Patankar, 2004). “Lacking knowledge of what other
cultures do, it is difficult to notice what one’s own culture does not do” (Hutchins,
Holder, & Pérez, 2002, p. 12). Understanding the differences between individuals’
attitudes and behaviors when developing an organizational structure provides the
foundation for a positive operational management (Hofstede et al., 2010).
Evaluating the types of pilot errors committed in a cross-cultural environment and
examining potential training programs that may improve the performance of cross-
cultural crewmembers are considered proactive interventions that form the basis of
healthy safety cultures (Helmreich, 2008). The Health and Safety Commission in the
United Kingdom defined safety culture as (Health and Safety Executive, 2009):
55
The safety culture of an organization is the product of individual and group
values, attitudes, perceptions, competencies, and patterns of behavior that
determine the commitment to, and the style and proficiency of, an organization’s
health and safety management. Organizations with a positive safety culture are
characterized by communications founded on mutual trust, by shared perceptions
of the importance of safety and by confidence in the efficacy of preventive
measures. (pp. 39-40)
Achieving a positive safety culture is a complex task. Commitment to high safety
standards and effective operations must be initiated from the highest point of an
organization’s structure. Therefore, establishing and maintaining a positive safety culture
begins with the organization’s management (Kelly & Patankar, 2004). A positive safety
culture requires the involvement and empowerment of employees as integral participants
of the organization (Snyder, 2007).
The absence of a healthy safety culture may lead to subcultures within an
organization (Gadd & Collins, 2002). The development of subcultures is a result of
existing variations in risk levels and working conditions in an organization (Gadd &
Collins, 2002). This development is not considered detrimental to operational safety;
however, subcultures must be identified and engineered to satisfy organizational safety
requirements (Antonsen, 2009). Kelly and Patankar (2004) stated that a positive safety
culture enables organizations to establish:
1. Better communication among their employees;
2. Higher levels of assertiveness; and
3. Higher levels of employee-management trust. (p. 72)
56
“The assessment of safety culture may provide leading indicators of the level of
safety that exists in an organization and may be used to benchmark organizational safety
performance” (Mariscal, Herrero, & Otero, 2012, p. 1237). Three underpinning cultural
groupings have been viewed as influential to airline operations: national, professional,
and organizational (Helmreich, Wilhelm, Klinect, & Merritt, 2001). The following
section describes these three cultural groupings and discusses how each cultural grouping
can impact operational safety.
National Culture. Behaviors, attitudes, and values based on national heritage
define national culture (Helmreich, 1999). National culture, like any other type of
culture, forms a range of diversity within an organization. The diversity within an
organization is influenced by complex socio-cultural factors; therefore, diverse
organizations are hindered by stereotypical and inflexible attitudes (Moran et al., 2011).
These attitudes weaken the organization’s defense systems by affecting major operational
components such as interaction and communication among team members (Moran et al.,
2011).
Despite culture variations, pilots from across the globe are expected to aviate,
communicate, and perform as an effective crewmember in any region of the world
(Mumaw & Holder, 2002). However, airplanes are not manufactured to accommodate
culture variations. Mumaw and Holder (2002) stated that individuals from various
geographical regions interact and perform differently. Crewmembers with diverse
national cultures communicate with various styles and behave according to certain
attributes that have implications on operational safety (Helmreich, 2000b). Furthermore,
situational awareness of cross-cultural crewmembers may be compromised due to

57
ineffective communication as a result of language differences and behavior variations
(Lichacz, 2008).
Given the objectives of this study, culture can be viewed as the actions performed
or omitted by commercial pilots as a result of norms, values, and beliefs adopted from
their cultural backgrounds. Examining the effects of national culture on flight deck
behavior can be a challenging task. However, a four-dimensional culture model
developed by Hofstede in the 1960s and 1970s forms a reliable methodology to assess
cultural influences (Helmreich, 2000b). A dimension is defined by Hofstede et al.,
(2010) as “an aspect of a culture that can be measured relative to other cultures” (p. 31).
The following four dimensions form the basis of their cultural model:
1. Power Distance (PD): Inequality between subordinates and superiors is viewed
differently by various cultures. Consequently, societies accept and handle
power distribution accordingly (Hofstede et al., 2010). In societies with high
levels of PD, a subordinate does not question the decisions made by his/her
superior and accepts the superior’s course of action (Helmreich, 2000b).
This type of behavior on the flight deck is reflected by polarized relations
between the subordinate and superior (Hofstede, 2001). This relationship leads
to lack of assertiveness by subordinates. Brazil, Philippines, and Taiwan are
examples of countries that have high PD scores.
Organizations with high PD have centralized decision structures and
authoritative management that creates inequality among the employees
(Hofstede, 2001). Organizations with low PD refer to flat organizational
structures with direct and open communication between managers and
58
employees (Hofstede, 2001). Denmark, Norway, and the United States are
examples of countries that have low PD scores.
The impact of PD on flight deck behavior was noted as one of the
factors that led to the crash of a Japanese cargo aircraft in 1977 (Strauch,
2010). The crew composition of this flight consisted of one American captain,
one Japanese first officer, and one Japanese flight engineer. Investigations
revealed that the captain was intoxicated and blood tests showed a blood
alcohol level of 0.29% (Strauch, 2010). The bus driver who transported the
crewmembers to the airport noticed the captain’s behavior and alerted his
dispatcher. Also, the first officer and flight engineer noticed the captain’s
behavior and were aware of his intoxication. However, neither of the Japanese
crew attempted to confront the captain (Strauch, 2010). Since Japan scores
high on PD, the crew may have avoided confronting their superior because that
would have caused humiliation and hierarchal degradation (Strauch, 2010).
2. Individualism versus Collectivism (IDV): This dimension refers to the degree
to which certain goals are pursued to achieve personal interests compared to a
group to which that individual belongs (Hofstede, 2001). Societies can be
divided into two categories: individualistic and collectivistic (Strauch, 2010).
In an individualistic society, individuals are inclined towards their own
interests and taking care of themselves and immediate family/organization
members (Hofstede et al., 2010). On the other hand, in a collectivistic society,
the interest of group members is considered a priority over individual interests
(Hofstede et al., 2010). Communication skills among members of a

59
collectivistic society are more easily achieved since they attain a sense of team
orientation (Helmreich, 2000b).
An example of IDV was noted in the crash of Avianca flight 52 in
1990, from Medellin to John F. Kennedy airport in New York. The crew did
not declare a mayday regarding their critical fuel situation, as they did not feel
comfortable being positioned ahead of the other traffic (Salas, Wilson, Burke,
Wightman, & Howse, 2006).
3. Masculinity versus Femininity (MAS): Members of a masculine society tend to
be more assertive, ambitious, competitive, and reward-oriented (Strauch,
2010). In contrast, members of a feminine society are expected to behave with
modesty and interpersonal concern (Hofstede et al., 2010). In a feminine
society, men and women are expected to behave similarly with modest and
tender attitudes (Hofstede et al., 2010). “Masculinity stands for a society in
which social gender roles are clearly distinct: Men are supposed to be
assertive, tough, and focused on material success; women are supposed to be
more modest, tender, and concerned with the quality of life” (Hofstede, 2001,
p. 297).
4. Uncertainty Avoidance Index (UAI): Societies tolerate future ambiguities and
uncertainties differently (Strauch, 2010). An individual not having control of
the future may develop a sense of distress and fear (Hofstede et al., 2010).
Crewmembers with a high level of uncertainty will not deviate from
procedures since they provide a sense of familiarity and comfort (Strauch,
2010). On the other hand, crewmembers from societies with low UAI are
60
more likely to be relaxed and deviate from procedures with no sense of alarm
or discomfort (Hofstede et al., 2010).
This dimension is reflected in the investigation of a Colombian aircraft
that crashed on approach to New York. Avianca Flight 52 flew from Medellin
to John F. Kennedy airport and was piloted by two Colombian pilots who
failed to inform air traffic control of their fuel emergency (Strauch, 2010).
Despite their low fuel status, they failed to consider alternative airports, which
may have been influenced by their high uncertainty levels and unfamiliarity of
the area (Strauch, 2010). Appendix C - Table C1 lists the dimensional scores
for different nationalities involved in this study.
Professional Culture. Every profession develops certain attitudes and behaviors
that are expressed by members of the profession (Helmreich & Merritt, 2000). Pilot
uniforms and airline badges are physical characteristics from which pilots develop a
strong sense of professional culture (Helmreich, 2008). These characteristics may create
negative cultural aspects reflected by a sense of invulnerability, or, positive culture
aspects reflected by good work ethics (Helmreich & Merritt, 2003).
Negative professional culture poses a threat to operational safety as pilots fail to
recognize their limitations while rejecting CRM concepts and ideologies (Helmreich &
Wilhelm, 1998). An example of negative professional culture is a pilot who refuses
assistance from a team member and prefers to work alone to maintain his/her high level
of self-esteem and pride. Professional culture can lead to further safety implications due
to disregarding health conditions, fatigue, and reluctance to admit error (Helmreich &

61
Merritt, 2003). Alternatively, a positive professional culture is reflected by a sense of
pride and an overwhelming interest for the job.
Most pilots tend to have a high degree of pride for their profession and an affinity
for their organizational position (Helmreich & Merritt, 2000). Pilots with a positive
professional culture will demonstrate desirable leadership skills, establish clear
communication, adhere to procedures, and obey regulations (Helmreich & Merritt, 2003).
Organizational Culture. Organizational culture is an ensemble of complex
cultural elements, infusing myriad beliefs, norms, and attitudes shared and expressed by
members of an organization (Wise et al., 2010). Organizational culture can be viewed as
a socially constructed system in which members of its organization are distinguished
from members of other organizations (Hofstede et al., 2010). Despite the presence of
cultural differences, organizations tend to integrate their cultural diversity with common
practices that shape the organizational culture by defining their own values and beliefs
(Wise et al., 2010). Sexton and Klinect (2001) defined organizational culture as “the
shared way members have learned to think, perceive, and behave in relation to
organizational issues, tasks, and problems” (p. 7).
Organizations are structured in ways that directly impact the types of cultures
existing within their boundaries (Daft, 2007). In order to achieve the desired operational
requirements, organizations must encourage adaptability and responsiveness toward
certain aspects, such as regulatory obligations, that necessitate the implementation of
safety programs (Daft, 2007). These obligations can be achieved in various ways that
dictate the type of organizational culture created (Haber & Shurberg, 2002).
Management’s involvement and commitment to operational obligations are an integral

62
factor in determining the organizational culture developed and the overall safety climate
(Choudhry, Fang, & Mohamed, 2007).
Moreover, organizational culture impacts the safety performance of an
organization by shaping its members’ perceptions about the importance of safety
(Hayward, 1997). Besides management’s commitment to safety, an organization’s
communication style has a strong impact on members’ attitudes toward safety
(Helmreich, 1999). Hayward (1997) identified three types of organizational
communication styles:
1. Pathological: Information is treated with political sensitivity and
resembles power. As a result, communication becomes ineffective and
creates undesirable outcomes (Hayward, 1997).
2. Bureaucratic: Minimal line of communication is provided between
management and employees with a rigid relationship among team
members (Daft, 2007). Bureaucratic organizations experience challenges
when dealing with emergencies and change (Hayward, 1997).
3. Informative: An open line of communication between management and
employees is established with a sense of equality (Daft, 2007). Members
of an informative organization are empowered by partaking in decision-
making processes (Hayward, 1997).
Cross-Cultural Management
Globalization has revolutionized international markets and transformed the
methods of conducting business into unlimited boundaries of worldwide connectivity and
cultural diversity in organizations (Dong & Liu, 2010). While the inclusion of cross-

63
cultures in international organizations has been viewed as a positive change, it has led to
undesirable states within organizations (Dong & Liu, 2010). The attitudes and behaviors
of cross-cultural work forces may be influenced by globalization, particularly at high-risk
industries, such as health care, maritime, nuclear power plants, and oil and gas
(Youngdahl, Ramaswamy, & Dash, 2010).
Consequently, new organizational strategies have been created in order to develop
and maintain high levels of safety standards among cross-cultural work forces (Dong &
Liu, 2010). According to Dong and Liu (2010), a cross-cultural team within an
organization may lead to internal conflicts between team members that may degrade
operational safety and performance. The following sections discuss cross-cultural
implications in four high-risk industries: nuclear power, maritime, health care, and oil
and gas.
Nuclear Power Plant. Cross-cultural studies have become a focus and primary
concern among high-risk industries, particularly after the Chernobyl accident in 1986
(Mariscal et al., 2012). The concept of safety culture emerged as a result of the
Chernobyl accident (Meshkati, 1998). Reactor number four at the Ukrainian power plant
exploded, releasing contaminants and fission products into the atmosphere (Zhang,
Wiegmann, von Thaden, Sharma, & Mitchell, 2002). The contaminants spread over
Scandinavian and West European countries, increasing the risk of cancer (Zhang et al.,
2002). Although several events led to the Chernobyl accident, a poor safety culture was
identified as a contributing factor (Zhang et al., 2002).
In light of an investigation of the Chernobyl disaster, several organizational
deficiencies were identified as contributing factors to the accident. A review of the

64
findings revealed major design flaws of the reactor that affected power level controls
during critical operational phases (Schmid, 2011). Certain procedures led to power
surges and rapid shut downs of the reactor (Schmid, 2011). Soviet nuclear scientists were
aware of the reactor’s design flaws and failed to act upon operational complaints with a
complete disregard of any possibilities that the reactor may explode (Schmid, 2011).
The final report concluded that a poor safety culture at the Ukrainian power plant
was due to ineffective communication between members of the organization that resulted
in an unclear understanding of responsibilities and poor cooperation between work
members (Schmid, 2011). Despite the unfortunate events at Chernobyl, beneficial
operational concepts emerged to develop positive safety attitudes and behaviors,
including improvements in leadership principles and values through effective
communication styles (Mariscal et al., 2012).
The European Foundation for Quality Management (EFQM) conducted a study on
positive safety attitudes and behaviors (Mariscal et al., 2012). Their study aimed at
increasing efficiency and strengthening operational quality in private and public
organizations (Mariscal et al., 2012). An EFQM model was developed to evaluate the
operations of safety management at organizations through a self-assessment process
(Mariscal et al., 2012).
Mariscal et al. (2012) discussed the use of the EFQM model to evaluate a Spanish
nuclear power plant. The findings from the self-assessment highlighted required
improvements in safety procedures and implementations. The following list includes
some of the required improvements (Mariscal et al., 2012):
1. Safety roles must be defined for all work grades;

65
2. Dissemination of information and knowledge between senior and junior staff
must improve to ensure continuity of effective operations;
3. Improvements in communications between management and workers to
highlight nuclear safety; and
4. Reduce work overload to increase improvement opportunities.
Towards this end, findings from the Chernobyl accident and the EFQM model
share a common operational requirement: communication. Lee and Harrison (2000)
encapsulated the importance of communication by means of identifying roles and
responsibilities through effective communication between members of an organization.
Also, they found that establishing a shared perception of the importance of safety and
developing a proactive attitude toward safety measures would shape a positive safety
culture (Lee & Harrison, 2000).
Maritime. Cross-cultural conflicts are particularly visible in the maritime
industry where a single ship may include a crew composition of multiple nationalities and
cultures (Horck, 2008). Maritime operations require extensive teamwork efforts and
good communication skills between team members on the ship and at port (Horck, 2008).
With cross-cultural crewmembers, ship owners are faced with degraded quality of work
due to poor communication skills between ship crewmembers and port officers that could
lead to misunderstandings (Horck, 2008).
In 2007, a Hong Kong-registered vessel named Cosco Busan struck a pier in San
Francisco (Coury, Ellingstad, & Kolly, 2010). According to the National Transportation
Safety Board (NTSB) (2009), cross-culture was a primary contributor to the accident.
The captain of the vessel, a Chinese national, and the Pilot who navigated the vessel to

66
the harbor, an American national, both had more than 20 years of experience (Strauch,
2010). However, due to cultural and language differences between the captain and Pilot,
a clear line of authority was lost and it was unclear who was in charge of the vessel
(National Transportation Safety Board, 2009). The captain did not review or monitor the
Pilot’s navigation to the harbor; instead, he transferred his authority to the Pilot by
relying on the Pilot’s navigation (Strauch, 2010). By doing so, the captain neglected to
observe the Pilot’s navigational procedures and assumed the correct actions were taken.
The following is a statement given by the captain during an interview (NTSB, 2009,
pp. 67-68):
Normally as a captain I would welcome the Pilot with my open arms, enthusiastic,
and I would show my hospitality in offering him if he need any food or coffee or
tea … it seems the Pilot coming on board was with cold face, doesn’t want to talk.
I don’t know if he had a hard day before or because he was unhappy because I
was a Chinese.
Certainly, culture played a major role in influencing the captain’s behavior by
delegating his authority to the Pilot when the captain was in charge of the vessel (Strauch,
2010). According to Hofstede (2001), Chinese society is hierarchal, which is influenced
by formal authorities and scores high on PD. Although the captain was in charge of the
vessel, he may have been intimidated by the Pilot’s assertive attitude and behavior, which
led him to believe that the Pilot was in charge (NTSB, 2009). Tension between the
captain and the Pilot may have arisen because of language differences. The captain was
not a native English speaker; therefore, he could have had difficulties interacting with the
Pilot (NTSB, 2009).

67
Health Care. The medical industry is evolving into a diversified work force
where demographic compositions of physicians and patients are continuously
diversifying (Meeuwesen, Brink-Muinen, & Hofstede, 2009). According to Betancourt
(2003), cross-culture between physicians may lead to stereotyping and discriminatory
treatment of patients, resulting in patients’ dissatisfaction and deteriorating health
conditions. It has been deemed critical in the medical sector to train physicians in how to
effectively communicate and interact in a cross-cultural environment (Betancourt &
Cervantes, 2009).
Meeuwesen et al. (2009) conducted a study to analyze how physicians behaved
with patients from nationalities different from their own. Patients’ nationalities included
ten European countries: Belgium, Estonia, Germany, Great Britain, The Netherlands,
Poland, Romania, Spain, Sweden, and Switzerland. Their study was based on Hofstede’s
national dimensions and was categorized into four components (Meeuwesen et al., 2009):
1. Context variables: patients with a high PD index experienced normal medical
encounters with their physicians and information shared by the physician was
made in a professional manner. Patients from individualistic countries and
with low PD experienced flexible relations with their physicians, but were
given delayed diagnoses by following a wait-and-see approach. Furthermore,
consultations in wealthier countries were longer and patients recovered more
quickly.
2. Physicians’ verbal behavior: physicians with a high PD index demonstrated a
gregarious social behavior with affective communication skills. Physicians
with a high UAI index focused primarily on psychosocial conversations with
68
their patients. Individualistic physicians conducted less counseling and asked
few questions, while physicians with a high MAS index socialized more and
deviated from the patient’s health issues.
3. Patients’ verbal behavior: patients with a low PD index communicated less
formally with their physicians. On the other hand, patients with a low MAS
index shared a lot of information with their physicians, focusing primarily on
psychosocial conversations.
4. Communication styles: Physicians and patients with a high PD index behaved
according to their expected roles and shared less information. On the
contrary, physicians and patients with a low PD index demonstrated flexible
communication styles. Physicians and patients with a high UAI experienced
more eye contact during their conversation. Moreover, patients with a low
MAS index conversed professionally with their physicians and asked
numerous questions.
Physicians must recognize and acknowledge the influences of cross-culture on
their practice to ensure fair treatments (Rothschild, 1998). Identifying cultural
differences would aid physicians in developing a culturally-sensitive approach toward
communicating and interacting with their patients (Rothschild, 1998). Effective
communication between physicians and patients would lead to increased accuracy of
diagnosis and improved physician-patient relations that are based on trust and positive
sharing of information (Betancourt & Cervantes, 2009).
Oil and Gas. The nature of oil and gas operations is complex and involves
challenges with technological changes and productivity requirements (Mearns & Yule,
69
2009). Due to the diversified work force in the oil and gas sector, companies must
maintain a positive safety culture to ensure operational safety (Fitzgerald, 2005). More
often than not, these sites are located in less-developed areas where local work forces are
unfamiliar with appropriate health and safety measures (Mearns & Yule, 2009). In 2001,
the government of Norway shared its concerns over degraded safety performances in the
oil and gas sector and identified cross-culture as a primary challenge that must be
investigated (Høivik, Moen, Mearns, & Haukelid, 2009).
One particular example of degraded safety performances in the oil and gas sector
is the Piper Alpha accident in 1988 that caused the death of 167 men and billions of
dollars in losses (Paté-Cornell, 1993). Piper Alpha received and distributed daily oil and
gas productions to other platforms in the area. During the distribution stage to other
platforms, a disturbance occurred that led to a flange leak (Paté-Cornell, 1993). Released
vapors initiated several explosions that resulted in damages to oil lines, causing fire
(Paté-Cornell, 1993).
One of the condensate pumps on Piper Alpha was undergoing maintenance
procedures. In order to initiate the pump’s overhaul procedures, the day shift crew
removed the pressure safety valve and sealed it with a disk cover (Gordon, 1998). The
crew failed to follow proper procedures and did not tag the seal properly. Furthermore,
the day shift crew did not share information with the night shift crew with regard to the
maintenance procedures that they had already started. The night shift crew started their
work normally and pressurized the pipe under maintenance that may have led to the
initial leak (Gordon, 1998). Clearly, a series of procedural flaws and communication
failures led to the explosions on Piper Alpha (Gordon, 1998).

70
While the accident was a result of a number of events, investigations revealed
that a combination of human errors and poor decisions were contributing factors (Ginn,
2004). The organization attained a negative safety culture because management
prioritized productivity over safety and dedicated insufficient attention to maintenance
and inspection procedures (Paté-Cornell, 1993).
Conclusions from the Piper Alpha accident emphasize the importance of
organizational culture and its impact on operational safety (Fitzgerald, 2005). Numerous
regulations and procedures have been put in place since the Piper Alpha accident to
increase operational safety (Ginn, 2004). Management must demonstrate its commitment
to high safety standards through a positive safety policy that allows open communication
and provides continuous safety training programs (Haber & Shurberg, 2002).
Flight Management Attitudes and Safety Survey (FMASS). Bridging cross-
cultural gaps and achieving coherency among crewmembers are of immense importance
to operational safety and success. Several approaches have been utilized by
organizations to identify the link between safety attitudes and pilot performance with
regards to acceptance of CRM concepts in a cross-cultural work force (Merritt, 1998).
Studies on safety-related attitudes began in the 1980s using a questionnaire known as the
Cockpit Management Attitudes Questionnaire (CMAQ) (Sexton, Wilhelm, Helmreich,
Merritt, & Klinect, 2001). CMAQ included limited questions that identified safety-
related attitudes and behaviors among airline pilots (Sexton et al., 2001). Since then,
researchers have made extensive progress in this field and updated the attitude
questionnaire to incorporate Hofstede’s dimensions of national culture (Sexton et al.,
2001). An updated version of CMAQ, known as Flight Management Attitude

71
Questionnaire (FMAQ), was designed to address national, professional, and
organizational cultures and identify their effects on cross-cultural pilot performances
(Sexton et al., 2001).
Further progress was achieved to link pilot attitudes with performance by
associating essential FMAQ items with safety-related outcomes. The Flight Management
Attitudes and Safety Survey (FMASS) was developed and included four scales with a set
of questions related to each scale (Sexton et al., 2001):
1. Safety culture:
a. The managers in the flight operations listen to us and care about our
concerns.
b. My suggestions about safety would be acted upon if I express them to
management.
c. Management will never compromise safety concerns for profitability.
d. I am encouraged by my supervisors and coworkers to report any
unsafe conditions I observe.
e. I know the proper channels to report my safety concerns.
f. I am satisfied with chief pilot and assistant chief pilot availability.
2. Job attitudes:
a. I am proud to work for this organization.
b. Pilot morale is high.
c. Senior management (VP and above) at this airline are doing a good
job.
d. Working here is like being part of a large family.

72
e. I like my job.
f. Pilots trust senior management at this airline.
3. Teamwork:
a. Teamwork with other cockpit crewmembers.
b. Teamwork with gate agents.
c. Teamwork with ramp personnel.
d. Teamwork with flight attendants.
e. Teamwork with dispatch.
f. Teamwork with maintenance.
g. Teamwork with crew scheduling.
4. Stress recognition:
a. I am more likely to make judgment errors in abnormal or emergency
situations.
b. My decision-making ability is as good in emergencies as in routine
flying conditions.
c. I am less effective when stressed or fatigued.
d. My performance is not adversely affected by working with an
inexperienced or less capable crewmember.
e. Personal problems can adversely affect performance.
f. A truly professional crewmember can leave personal problems behind
when flying. (p. 4).
Merritt (2000) recognized that a safe flight is contingent upon the pilots’
behaviors and attitudes in a cross-cultural environment. Although the flight deck is

73
governed by formidable procedures and regulations, pilots must perform in dynamic
work settings and interact with diverse crewmembers that may alter their attitudes and
behavior (Gross, 2006). The aforementioned FMASS scales will aid in understanding
cross-cultural effects on operations and engineering a safety culture that would aid in
steering the organization toward required operational standards (Mjøs, 2004). “Without
an understanding of its own cultures, organizations cannot mount effective programs to
optimize them” (Helmreich, 2008, p. 8).
Once a clear understanding of cross-culture is achieved, appropriate training
programs must be implemented to synchronize interactions among cross-cultural
crewmembers (Smith, Singal, & Lamb, 2007). Training programs and operational
strategies must be developed in a manner that would add value to the organization by
empowering employees and anchoring positive safety commitments by management
(Mittal, 2012).
Summary
The review of the relevant literature demonstrated the evolution of CRM through
six generations where new concepts have emerged to improve threat and error
management (Kanki et al., 2010). Despite the improvements in CRM training, pilot error
remains inevitable (McCartney, 2005). A study by Tsang and Vidulich (2003) revealed
that the majority of aircraft accidents and incidents were a result of non-technical pilot
errors. Improvements in non-technical skills among pilots involve an understanding of
their attitudes and behaviors from a cultural perspective (Powell & Hill, 2006).
IPO. Several performance and training models have been implemented to aid in
improving safety levels. One of these models is the IPO model that examines internal

74
and external factors influencing crewmembers’ performance during various operational
phases. Crewmembers are evaluated on non-technical characteristics, such as culture,
communication skills, and attitudes (Kanki et al., 2010). Besides non-technical
characteristics, the IPO model examines organizational influences, such as policies,
regulations, and managerial relations with employees. Implementing an IPO model
provides a full evaluation of the organization where operational deficiencies are
identified.
AQP. Operational deficiencies may be rectified through an AQP, where training
curricula are tailored for crewmembers (FAA, 2006a). Implementation of an AQP is
voluntary; however, it is recommended as it provides continuous improvements on
operational requirements. These improvements are based upon analytical findings
obtained from training data, which may provide proactive solutions to aid in improving
training standards.
FOQA. Data collection and analysis can be accomplished through a FOQA
program. Depending on each airlines’ policies and procedures, data monitoring vary to
accommodate regulatory and operational requirements. Implementation of a FOQA
program helps in identifying pilot deviations that may pose risk to flight safety. These
identifications provide possible operational trends and proactive solutions to mitigate
risks. In order to obtain full analyses of present deficiencies, airlines promote a positive
safety reporting culture. Through safety reports, crewmembers provide qualitative
information that may aid in better understanding current deficiencies.
TEM. Identifying operational deficiencies and developing tailored training
curricula are insufficient to meet operational requirements. It is also important to
75
understand and assess operational threats and errors, as they mostly occur during critical
flight phases, such as descent, approach, and landing. TEM concludes CRM’s evolution
to date; through the sixth generation culture has not been taken into account to
accommodate cross-cultural crewmembers.
Culture. Wise et al. (2010) stated that culture influences CRM and affects its
positive transfer to pilots. CRM training does not involve cultural aspects (Wise et al.,
2010). In their review, Helmreich and Merritt (2000) concluded that CRM is only a tool
used to optimize operations and improve safety levels. Additional studies have revealed
that cross-culture can also impact pilots’ adaptation to aircraft automation and impede
communication skills among diverse crewmembers (Helmreich, 2008; Solomon &
Schell, 2009).
Despite operating procedures set forth by the airlines, pilots with different
cultures interact with aircraft automation in various ways. Misuse and disuse of aircraft
systems may lead to poor team coordination on the flight deck that may lead to degraded
operational safety. Such degradation of operational safety is not recognized by CRM.
Communication skills can also present challenges among cross-cultural
crewmembers. Ineffective communication due to language diversity may lead to poor
performance on the flight deck (Thomas, 2008). Mental exhaustion, misunderstanding,
and tension among crewmembers are all possible consequences of language diversity. As
a result, cross-cultural crewmembers tend to rely on SOP, checklists, and company
policies without achieving a complete understanding amongst each other.
CRM training must be culturally calibrated by understanding pilots’ attitudes,
norms, and beliefs (Powell & Hill, 2006). Three distinct, yet intertwined, types of

76
cultures influence airline operations: national, professional, and organizational cultures
(Helmreich et al., 2001b). Inside these cultures are certain traits and beliefs that
influence pilots’ behaviors and attitudes, and which may jeopardize operational
performance levels. Understanding the aforementioned types of cultures and how they
influence operational safety form the basis of a proactive approach toward a positive
safety culture.
Understanding the influence of national, professional, and organizational cultures
on crewmembers is an important and complex task. Neglecting the impact of these
cultures may lead to degraded operational performance and organizational implications.
Taking a proactive stance and recognizing the effects of cross-culture on operations is an
initial step toward mitigating and managing the effects of cross-culture. Air MENA is a
cross-cultural organization with over 100 nationalities working together. Achieving
cultural coherency at Air MENA is an important step that must be initiated with a
positive managerial interaction.
Cultural coherency may be achieved by re-establishing CRM concepts.
Integrating cross-cultural ideologies in CRM training would result in universally accepted
training programs and would include CCAAP training. The addition of cross-cultural
training would bridge the gaps among cross-cultural crewmembers to improve flight deck
relations and flight operations.

77
CHAPTER III
METHODOLOGY
This chapter reviews the methodology utilized to analyze the relationship among
pilot nationalities with respect to unsafe performance events related to Hard Landings,
Unstable Approaches, and Pilot Deviations during various flight phases. A review of the
pilot population at Air MENA revealed a culturally diverse work force with a
considerable number of nationalities working together. Consequently, a detailed analysis
of flight events was undertaken to examine the influence of culture combination of
captain and first officer on performance. Flight events from May 2011 to January 2013
formed the basis of this study, which provided in-depth analysis of flight parameters,
flight deviations, and pilots’ errors.
Research Approach and Design
The research design used for this study was an archival design utilizing existing
organizational records (Vogt, Gardner, & Haettele, 2012). A descriptive comparative
method was adapted to analyze the relationship between unsafe performance events and
captain / first officer nationality combinations during flights where performance events
were recorded. The flight data were retrieved from an unchanged flight data-recording
environment yielding robust detailed data that was combined with administrative
demographic data.
Tests of associations were used to understand the relationship between unsafe
performance events and nationality combinations. Tests of associations were aimed at
determining the nature and degree of relationships between variables (Black, 1999).
These associations were illustrated through multi-dimensional chi-square tests. A

78
comparison of cross-cultural and homogeneous flight deck crew combinations from
unsafe performance events was examined. Additional analyses were conducted to predict
group membership through discriminant analysis and multinomial logistic regression.
Several Spearman’s r correlation tests were conducted to assess the influence of
intervening demographic variables on the association between nationality combinations
and unsafe performance events. While cause-and-effect relationships between variables
could not be determined in this research design, association variations between variables
were made evident.
The data used in this study were flight data events gathered from Air MENA. The
unsafe performance events examined in this study were Hard Landings, Unstable
Approaches, and Pilot Deviations that occurred during various flight phases.
Population/Sample
The population for the study was unsafe performance events for Air MENA
between May 2011 and January 2013. These unsafe performance events were only pilot
related events. All other events were eliminated from the data set. Purposive sampling
ensured that data selection targeted crew based events that would aid in exploring the
hypotheses (Babbie, 2010). The population contained 1,863 unsafe performance events
from a total of 1,149 pilots: 536 captains and 613 first officers. The purposive sample
contained 1,088 unsafe performance events that met the hypotheses: Harding Landings,
Unstable Approaches, and Pilot Deviations and included 915 pilots: 428 captains and 487
first officers.
The Aerobytes program, a FDM software used at Air MENA, cannot determine
whether several unsafe events took place on the same flight in the provided data.

79
Therefore, each unsafe performance event was allocated a unique event identification
number and each event was treated as an independent incident for data analyses.
Some events were performed by the same captain / first officer combination on
different flights. The data set contained 660 events (61%) with duplicated captain ID
numbers; from the duplicated captain ID cases, less than 37% of captains were duplicated
more than twice in the dataset. For first officer, 601 events (55%) contained first officer
ID number duplications, and from the duplicated first officer ID cases, less than 29% of
first officers were duplicated more than twice in the dataset. Figures 14 and 15 indicate
the number of duplicated and un-duplicated unsafe performance events for captains and
first officers.
Figure 14. Number of duplicated and non-duplicated unsafe performance events by
captains.

80
Figure 15. Number of duplicated and non-duplicated unsafe performance events by first
officers.
All valid data on unsafe performance events were included; any corrupted data
due to server inconsistencies were excluded. All pilots in the study had completed at
least one mandatory operator proficiency check, ensuring that both captains and first
officers were current on Air MENA’s flight operating standards. Therefore, any unsafe
performance events were not due to inconsistent or insufficient training of pilots.
The sample contained 97 different pilot nationalities. To reduce the number of
pilot nationality combinations used in the data analyses, pilot nationalities were classified
into 7 continent categories: Africa, Asia / Pacific, Commonwealth of Independent States
(CIS), Europe, Latin America / the Caribbean, Middle-East / North Africa (MENA), and
North America (IATA, 2012). Therefore, the number of captain / first officer
nationalities (continents) combinations was reduced to 49.

81
Generalizability
While this study analyzed data gathered from one airline, it was crucial to assess
its generalizability among other airlines in the MENA region. Three components were
reviewed to ensure the study’s generalizability:
1. Data Collection: The software used to gather data, Aerobytes, is used by 11
operators within the MENA region (Aerobytes, 2014).
2. Pilot Nationalities: The shortage of pilots in the MENA region is a strong
indicator of an international recruitment process. According to Shaw-Smith
(2013), Boeing estimates the need for 40,000 pilots in the MENA region between
2013 and 2032. The pilot training facilities in the region train approximately 130
pilots per facility per year (Shaw-Smith, 2013). This shortage is already
reflecting on MENA operators; the second-largest airline operating out of Dubai
International Airport has a work force from 85 countries (Gale, 2011).
3. Fleet: According to Anna Aero (2013), three major airlines in the MENA region
have a total fleet of 285 aircraft that consist of Airbus and Boeing aircraft.
Sources of the Data
Flight data events were recorded by the Aerobytes FDM program and gathered
from the safety department at Air MENA. The population data gathered included all
unsafe performance events that were categorized by types of events and phases of events.
The purposive sample of unsafe performance events included three categories to
investigate the research hypotheses: Hard Landings, Unstable Approaches, and Pilot
Deviations. Demographical data, such as age and nationality, were also collected from
the administrative database of Air MENA. The nationality combinations of captain and

82
first officer pilots in one event were the main predictor variables in the study, with unsafe
performance events as the dependent variable.
The entire data set were compiled from Air MENA. In order to protect the
identity of the pilots and the airline involved in the events, a thorough de-identification
process was conducted. Identifying information such as pilot names, staff numbers,
flight number, and aircraft registrations were omitted from the data set. The quantitative
data included event name, departure airports, arrival airports, fleet, severity of the event,
phase of the flight, pilots’ age, and nationalities of captains and first officers.
Data Collection Device
The FOQA information was gathered from Aerobytes, which is the FDM software
used by Air MENA. Quick Access Recorders and Flight Data Recorders are devices
installed in every aircraft at Air MENA. These recording devices process the incoming
data and download the data to the safety department’s database via two methods (Flight
Data Monitoring System, 2012):
1. Automatically using Global System for Mobile (GSM) communications. By
securing a communication network between each aircraft and the server, flight
data can be transmitted efficiently to the safety department. This process
occurs automatically after every landing.
2. Manually using data collection cards.
Pilots’ ages and nationalities were gathered from the Airline Information
Management System (AIMS) database. The researcher integrated Aerobytes and AIMS
data; for each flight event, the pilots’ age and nationality were added. The final data were
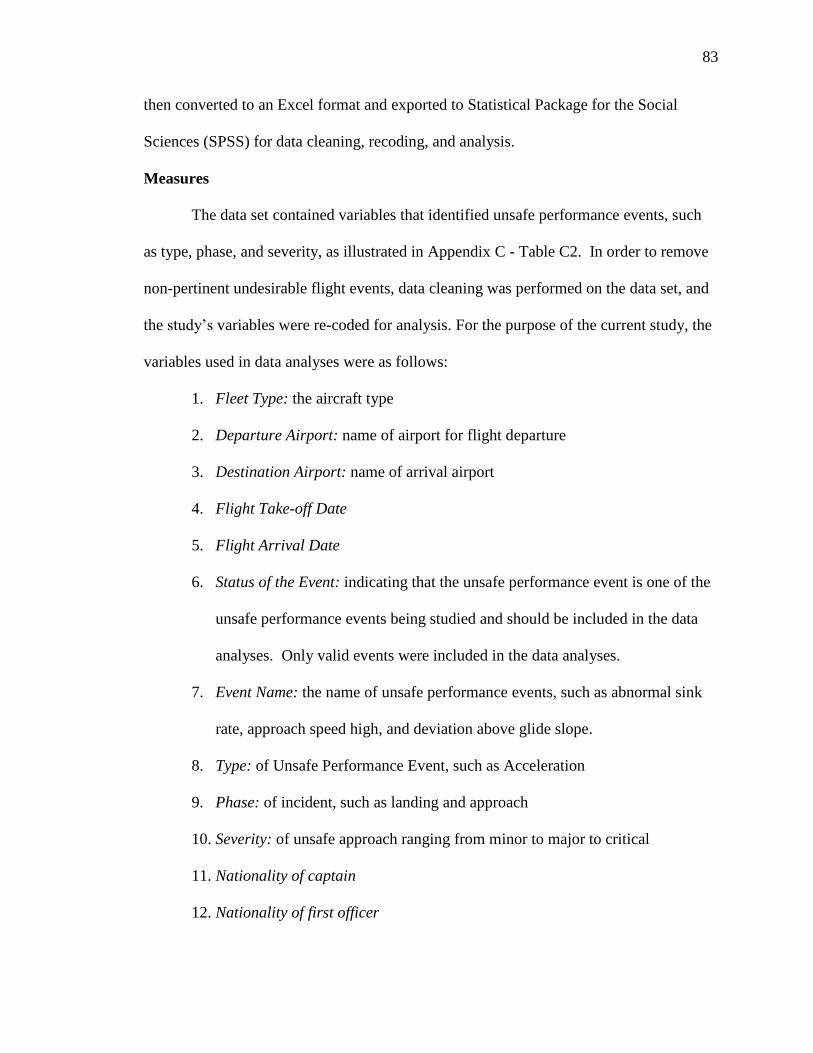
83
then converted to an Excel format and exported to Statistical Package for the Social
Sciences (SPSS) for data cleaning, recoding, and analysis.
Measures
The data set contained variables that identified unsafe performance events, such
as type, phase, and severity, as illustrated in Appendix C - Table C2. In order to remove
non-pertinent undesirable flight events, data cleaning was performed on the data set, and
the study’s variables were re-coded for analysis. For the purpose of the current study, the
variables used in data analyses were as follows:
1. Fleet Type: the aircraft type
2. Departure Airport: name of airport for flight departure
3. Destination Airport: name of arrival airport
4. Flight Take-off Date
5. Flight Arrival Date
6. Status of the Event: indicating that the unsafe performance event is one of the
unsafe performance events being studied and should be included in the data
analyses. Only valid events were included in the data analyses.
7. Event Name: the name of unsafe performance events, such as abnormal sink
rate, approach speed high, and deviation above glide slope.
8. Type: of Unsafe Performance Event, such as Acceleration
9. Phase: of incident, such as landing and approach
10. Severity: of unsafe approach ranging from minor to major to critical
11. Nationality of captain
12. Nationality of first officer

84
13. Age of captain
14. Age of first officer
Treatment of the Data
The data collected from the Aerobytes FDM program were categorical; therefore,
variables were created for the nominal data. The data were categorized and meaningful
value labels were created.
Cleaning and re-coding of the data took place prior to data analyses. The data
cleaning process began by eliminating all unsafe performance events that could not be
categorized under one of the following unsafe performance events: Hard Landing,
Unstable Approach, and Pilot Deviation. For the purpose of this study, unsafe
performance events pertaining to the following categories were eliminated from data
analyses: Turbulence, Long Landing, Short Landing, Technical, Go Around,
Performance, Windshear, GPWS, CFIT, and TCAS. From a total of 1,863 unsafe
performance events obtained from the Aerobytes FDM program, 775 events were
excluded from data analyses and 1,088 events were included in the data analysis.
The variable, unsafe performance events, was categorized as: Hard Landings = 1,
Unstable Approaches = 2, and Pilot Deviation = 3. Appendix C - Table C3 displays the
unsafe performance events classified into the three events categories.
The sample was divided by rank: captain or first officer. The captain and first
officer nationalities were recoded into one of the seven continents: 1 = Africa,
2 = Asia / Pacific, 3 = CIS, 4 = Europe, 5 = Latin America / the Caribbean, 6 = MENA,
and 7 = North America. Appendix C - Table C4 displays a breakdown of nationalities
within continent. For testing the research hypotheses, 49 nationality continent

85
combinations between captain and first officer were generated in SPSS; there are seven
continent nationalities for captains and seven continent nationalities for first officers.
The 7 by 7 continent nationality combinations were used in chi-square analyses.
The continent nationality combinations included cross-cultural and homogeneous
combinations, which were generated using 49 dummy variables in SPSS. When the
nationality combination was true, the value was coded as 1 = yes; when the nationality
combination was false, the value was coded as 0 = no. For example: nationality
combination 1 was captain = Africa and first officer = Africa or nationality combination
2 was captain = Africa and first officer = Asia / Pacific.
In addition, a dichotomous variable ‘nationality combination type’ was generated
to differentiate between the homogeneous nationality combinations and the
heterogeneous cross-cultural nationality combinations of captain / first officer. For the
seven homogeneous continent nationality combinations, such as Africa_ Africa, a value
of 1 was assigned. For the 42 heterogeneous cross-cultural nationality combinations, a
value of 2 was assigned.
The ratio variable, number of unsafe performance events committed per
(continent) nationality combination of captain / first officer, was created. The total
number of unsafe performance events was calculated for each of the (continent)
nationality combinations. For example, the total number of unsafe performance events
committed by the nationality combination of captain / first officer listed, such as
Africa_Africa and Africa_CIS. This ratio was used in the analyses to show the
nationality combination that had the largest ratio of unsafe performance events;
descriptive data were used to identify which specific country nationality combination of

86
captain / first officer committed most / least unsafe performance events, such as
British_Africa.
Age of captains / first officers (measured in years) was a continuous variable and
analyses were conducted to determine the association of age with unsafe performance
events to identify its influence on the overall findings on nationality combinations.
Additional recoding of the continuous variable age was conducted to determine which, if
any, specific age category of captains / first officers was an intervening variable to the
association between nationality combination and unsafe performance events. A
categorical variable was generated for age that had three levels: younger age, average
age, and older age. The average age category accounted for 68% and was created as the
mean plus or minus one standard deviation. The younger age category included pilots
whose age was less than 1 standard deviation from the mean, representing 16% of the
sample. The older age category included pilots whose age was greater than 1 standard
deviation above the mean, representing 16% of the sample.
Other variables used in data analyses were categorically recoded. Re-coding of
the following nominal data is illustrated in Appendix C - Tables C2: fleet type, departure
airport, event name, type, severity, and phase.
Destination airports and eligibility to command the flight were included in the
analyses to eliminate their influence on the associations between nationality combinations
of captain / first officer and unsafe performance events. There were 87 different
destination airports in the dataset, coded from 1 to 87. Destination airports are
categorized as illustrated in Appendix C - Table C5. Based on the destination airports

87
recorded in the dataset, the eligibility of captain and first officer to command variable
was created (Operations Manual Part A, 2012b).
1. Category A: Captains or first officers are eligible to command the flight; the
category includes 52 airport destinations. Airports under Category A must
satisfy all of the following requirements:
An approved instrument approach procedure;
At least one runway with no performance limited procedure for takeoff
and / or landing;
Published circling minima not higher than 1,000ft above aerodrome level
(AAL); and
Night operations capability.
2. Category B: Only captains are eligible to command the flight; the category
includes 31 airport destinations. Airports under Category B do not satisfy the
Category A requirements or require considerations such as:
Non-standard approach aids and or approach patterns;
Unusual local weather conditions;
Unusual characteristics or performance limitations; and
Any other relevant considerations including obstructions, physical layout,
and lighting.
3. Category C: Only captains are eligible to command the flight and first officers
must have received the same simulator training; the category includes four
airports. Prior to operating to Category C airports, the captain must visit the

88
aerodromes as an observer and / or undertake instructions in a flight simulator.
The operator should certify this instruction.
Assumption Checks. Assumption checks were performed on all of the variables
in the data set to ensure that the data are not problematic for further data analyses. The
data are nominal data; therefore, assumption checks for normal distribution and linearity
of the data are not necessary. The following assumption checks were conducted:
1. Sample size was appropriate for the data analyses conducted in the study. The
sample size was greater than 50 participants and is more than 8 times the number
of independent variables (Brace, Kemp, & Snelgar, 2009).
2. Homoscedasticity: This assumption was not violated as indicated in the Normal
P-P Plot of Regression Standardized Residual graph shown in Appendix D -
Figure D1. As shown in the graph, the data was normally distributed. The Scatter
plot shown in Appendix D - Figure D2 also indicated that this assumption was not
violated, as there was pattern to the data.
3. Multicollinearity: This assumption was not violated as a linear relationship in the
dependent variable was not indicated by the VIF Collinearity Statistics, where
VIF level for all variables were less than 4. The table of coefficients is illustrated
in Appendix C - Table C6.
4. Outliers: This assumption is not violated and it appears that 3.5% of the records
are outliers. The Casewise Diagnostics Table in Appendix C - Table C7 shows
that 96.5% of the records lie within 2 standard deviations above or below the
mean. The remaining 3.5% of the records are considered outliers, because they
are above 2 standard deviations. According to Rovai, Baker, and Ponton (2012),

89
since outliers are less than 5% of the data, they do not need to be removed from
the data set, as they do not have an impact on the overall analysis.
5. The data met the criteria for conducting the chi-square test in that the variables
were measured on a nominal level of measurement. Data were collected on more
than two variables, the categorization of each of the variables was mutually
exclusive, and every observation was independent of every other observation
(Brace et al., 2009). The chi-square assumption that less than 20% of the cases
have to have an expected frequency of less than 5 has been met by the data. The
chi-square was useful as it calculated the expected frequencies for each data cell
and compared the expected frequencies with observed frequencies (Tabachnick &
Fidell, 2001). If the observed and expected frequencies were shown to be
significantly different then, the results would show that the distributions of
observations across the data cells were not due to randomness, but that there was
a significant difference between nationality groups on unsafe performance. Given
that existing variables were measured and not manipulated, a causal relationship
between unsafe performance events and nationality combination could not be
determined; instead only an association between the frequencies of groups could
be established.
Therefore, the data met the criteria to conduct the descriptive and inferential
statistical tests. These tests are discussed in the following sections. Assumption checks
for the different descriptive and inferential tests are addressed and outlined below in the
data analyses section.

90
Descriptive Statistics. Descriptive statistics were calculated to summarize the
data in this study, providing an overview and understanding of what the data outcomes
were as a whole. For nominal data, it is meaningless to calculate all measures of central
tendency and variability; the data were not measured on a scale but rather in categories
(Howitt & Cramer, 2011). Instead, descriptive analyses were restricted to reporting the
mode, frequencies, and range.
Inferential Statistics. Inferential data analyses consisted of two parts. First, data
analyses were performed to determine the effects of intervening variables on unsafe
performance events using tests of correlations. Second, data analyses were conducted to
answer the research hypotheses regarding the relationship between nationality
combinations of captains / first officers and unsafe performance events.
Research Question and Hypotheses Testing. This study sought to answer the
following research question: To what extent can we predict an unsafe performance event
based on the nationality combination of pilots? In order to answer this question, six
hypotheses were investigated. The purpose of hypothesis testing in research is to
determine the likelihood that a population parameter is true.
H1. The null hypothesis was that there was no significant effect of the covariate
age on the relationship between nationality combinations of captains / first officers and
unsafe performance events. In order to determine the degree of relationship between
unsafe performance events and age, a Spearman’s r test was conducted. This test
provided the measure of strength and direction of any potential relationships between
unsafe performance events and these intervening variables. The Spearman’s r correlation
test was ideal for non-parametric variables (Brace et al., 2009). In addition, an
91
ANCOVA statistical test was conducted to control for the effect of age of captains / first
officers on the relationship between nationality combination and unsafe performance
events using the scaled variable, number of unsafe performance events per (continent)
nationality combination, and unsafe performance event (Hard Landings, Unstable
Approaches, and Pilot Deviation).
H2. The null hypothesis was that there was no significant effect of the covariate
airport destination on the relationship between nationality combinations of captains / first
officers and unsafe performance events. In order to determine the degree of relationship
between unsafe performance events and destination airport, a Spearman’s r test was
conducted. In addition, an ANCOVA statistical test was conducted to control for the
effect of airport destination on the relationship between nationality combination and
unsafe performance events using the scaled variable, number of unsafe performance
events per (continent) nationality combination, and unsafe performance event (Hard
Landings, Unstable Approaches, and Pilot Deviation.
H3. The null hypothesis was that there was no significant effect of the covariate
eligibility to command the flight on the relationship between nationality combinations of
captains / first officers and unsafe performance events. In order to determine the degree
of relationship between unsafe performance events and eligibility to command the flight,
a Spearman’s r test was conducted. In addition, an ANCOVA statistical test was
conducted to control for the effect of eligibility to command the flight on the relationship
between nationality combination and unsafe performance events using the scaled
variable, number of unsafe performance events per (continent) nationality combination,

92
and unsafe performance event (Hard Landings, Unstable Approaches, and Pilot
Deviation).
H4. The null hypothesis was that there was no significant association between the
frequency of homogeneous and the heterogeneous cross-cultural nationality combinations
of captains / first officers on unsafe performance events. The association between
nationality combinations of captains / first officers and unsafe performance events was
investigated through a 2 by 3 multi-dimensional chi-square statistical test. The aim was
to check whether the frequency of homogeneous nationality combinations differed from
the frequency of heterogeneous cross-cultural nationality combinations of captains/first
officers on unsafe performance events.
In SPSS, the type of nationality combination was coded as: 1 = homogeneous and
2 = heterogeneous. Unsafe performance events were coded as follows: 1 = Hard
Landings, 2 = Unstable Approaches, and 3 = Pilot Deviation. The chi-square test was
ideal for nominal data as it analyzed frequencies. The results on the chi-square alone
could not explain the pattern of the results nor could they determine group membership.
The unstandardized residuals provided insight for which combinations contribute to the
over chi-square results.
H5. The null hypothesis was that there was no significant association between the
frequency of the nationality combinations of captains / first officers on unsafe
performance events. Using the 7 continent nationality combinations of captain and of
first officer a 7 by 7 multi-dimensional chi-square was conducted.
H6. The null hypothesis was that there was no significant association between
cross-cultural (pilot nationality) group memberships on unsafe performance events.

93
Discriminant analysis was used to predict category membership from the nationality
combinations. This analysis was used to predict which of the 49 nationality combination
categories were more likely to commit unsafe performance events.
Discriminant analysis was useful because it could be used in an attempt to predict
category membership (Tabachnick & Fidell, 2001). The analysis looks to find the effect
of the Independent Variable (IV) on the Dependent Variable (DV) and in finding a
significant effect of one of the IVs then a partial prediction of participants DV could be
made. In this case, discriminant analysis was used to predict which nationality
combination membership was likely to commit an unsafe performance event.
In addition, a multinomial logistic regression was used to analyze relationships
between a non-metric dependent variable and a dichotomous independent variable
(Pampel, 2000). Multinomial logistic regression compared multiple groups through a
combination of binary logistic regressions. The group comparisons were equivalent to
the comparisons for a dummy-coded dependent variable.
A multinomial logistic regression was performed to identify which nationality
combinations predicted unsafe performance events categories, an ideal test for nominal
data. The main function of the regression was (a) to describe the relationship between
nationality combinations and unsafe performance categories, and (b) to identify which
combinations best predicted an unsafe performance outcome. As with the Discriminant
Analysis, the 49 nationality combinations of captain and first officer were used as
predictor variables, with the unsafe performance events categories as the dependent
variable.

94
This statistical technique was useful as it computed the probability that pilots
were a member of one of the three groups: Hard Landings, Unstable Approaches, or Pilot
Deviation. This approach indicated the probability that a particular nationality
combination had or had not committed an unsafe performance event on the flight. In
SPSS, predicted group membership was compared to actual group membership to obtain
a measure of classification accuracy (Brace et al., 2009).
The data used in this research fulfilled the requirements needed to conduct this
statistical test, as multinomial logistic regression analysis requires that the dependent
variable be non-metric; that is, nominal or dichotomous variables. The analysis also
required that the IV be metric or dichotomous (Howitt & Cramer, 2011). Multinomial
logistic regression does not make any assumptions of linearity, homogeneity of variance,
and normality for the independent variables. In an event where the data does not satisfy
these assumptions, this technique was preferred over discriminant analysis in order to
predict group membership (Tabachnick & Fidell, 2001).
In SPSS, the overall test of relationship among the independent and dependent
variables was based on the reduction in the likelihood values for a model that does and
one that does not contain any independent variables. This technique was an extension of
the chi-square analyses. Multinomial logistic regression is often referred to as a
chi-square model, as it follows chi-square distribution (Hosmer, Lemeshow, &
Sturdivant, 2013). The level of significance in the final chi-square model presented
provides the evidence for the presence of a relationship between the different nationality
combinations and the type of unsafe performance events.
95
While multinomial logistic regression indicated the strength of the relationship
between IV and DV, the associations presented do not show the accuracy or errors
associated with the chi-square model (Tabachnick & Fidell, 2001). The benchmark that
was used to characterize a multinomial logistic regression model as useful was 25%
improvement over the rate of accuracy achievable by chance alone (Pampel, 2000).
Summary
This research study analyzed the extent to which unsafe performance events can
be predicted based upon pilot nationalities operating at a Middle Eastern airline. Six null
hypotheses involving various operational conditions were investigated by using different
statistical methods. Although the data were gathered from a single airline, the
generalizability of the study was confirmed by reviewing the type of operations at other
airlines in the region.
Aerobytes, a flight monitoring software used by Air MENA, was the source of
data. Data collection was restricted for flight events between May 2011 and January
2013. This restriction was due to the validity of the data available during the collection
period.
A descriptive comparative method was adapted to analyze the relationship
between the combination of pilot nationalities and unsafe performance events. The study
included 1,088 unsafe performance events and 915 pilots from 97 nationalities. Due to
the complexity of the gathered data, pilot nationalities were coded into 7 continents:
Africa, Asia / Pacific, CIS, Europe, Latin America / the Caribbean, MENA, and
North America. Additional codes were generated to create categories for other variables,
such as destination airports, fleet, and unsafe performance events.
96
Several statistical tests were used to analyze the null hypotheses. An ANCOVA
was used to test for three covariates: pilots’ age, airport destination, and eligibility to
command the flight. The ANCOVA tests were an important phase as they reviewed the
effect of the aforementioned covariates on the relationship between nationality
combinations and unsafe performance events. In addition to ANCOVA, a Spearman’s r
test was used to test for the relationship between the covariates and unsafe performance
events.
A 2 by 3 multi-dimensional chi-square statistical test was used to analyze the
association between the frequency of homogeneous and heterogeneous cross-cultural
nationality combinations. In order to test for the association between the frequencies of
the nationality combinations of captains / first officers on unsafe performance events a
7 by 7 multi-dimensional chi-square statistical test was conducted. And finally, a
discriminant analysis and logistic regression were utilized to test the association between
cross-cultural (pilot nationality) group memberships on unsafe performance events.

97
CHAPTER IV
RESULTS
This study explored the relationship between nationality combinations of captains
and first officers and unsafe performance events. The nationality combinations of pilots
(continent combinations) at Air MENA were used in data analyses to determine the
frequency of unsafe performance events (Hard Landings, Unstable Approaches, and Pilot
Deviations) committed. The associations, and group membership with regard to these
variables were explored, and confounding factors were investigated.
Descriptive Statistics
Flight data events were recorded by the Aerobytes FDM program and gathered
from the safety department at Air MENA. The majority of events in the dataset had
flights that had departed from or had their last destination as the Hub airport; 60% of
flights were departures from the Hub, 37% of the flights were arrivals to the Hub.
Unsafe Performance Events. From a total of 1,088 unsafe performance events,
there were a total of 13 Hard Landing incidents, 286 Unstable Approaches incidents, and
789 Pilot Deviation incidents. Unsafe performance events occurred in three flight
phases: ‘Air’ (47%), ‘Landing & Approach’ (42%), and Ground (11%). All 13 Hard
Landings occurred in the Landing & Approach phase of flight. Figure 16 indicates the
type of unsafe performance for ‘Unstable Approach’ events. As shown, the most
common type of event was ‘Late land flap (height AAL)’ (22%), followed by ‘Approach
Speed High (<500ft)’ (16%) and ‘High rate of descent (<1000ft)’ (13%).

98
Figure 16. Frequency of unsafe performance events type for unstable approaches.
Figure 17 indicates the type of unsafe performance events for ‘Pilot Deviation.’
The most common type of event was ‘Dual Side Stick Input (Pitch)’ (29%), followed by
‘High-speed Below 5,000’ on Descent’ (9%) and ‘Dual Side Stick Input (Roll)’ (7%).

99
Figure 17. Frequency of unsafe performance events type for pilot deviations.
Events by Aircraft Type. The aircraft type where most unsafe performance
events were committed was A320 (50%), of which 80% of these events were Pilot
Deviation. The A330 had 28.1% of all unsafe performance events followed by the A340
(13.1%) and then the B777 (8%), as illustrated in Table 3.
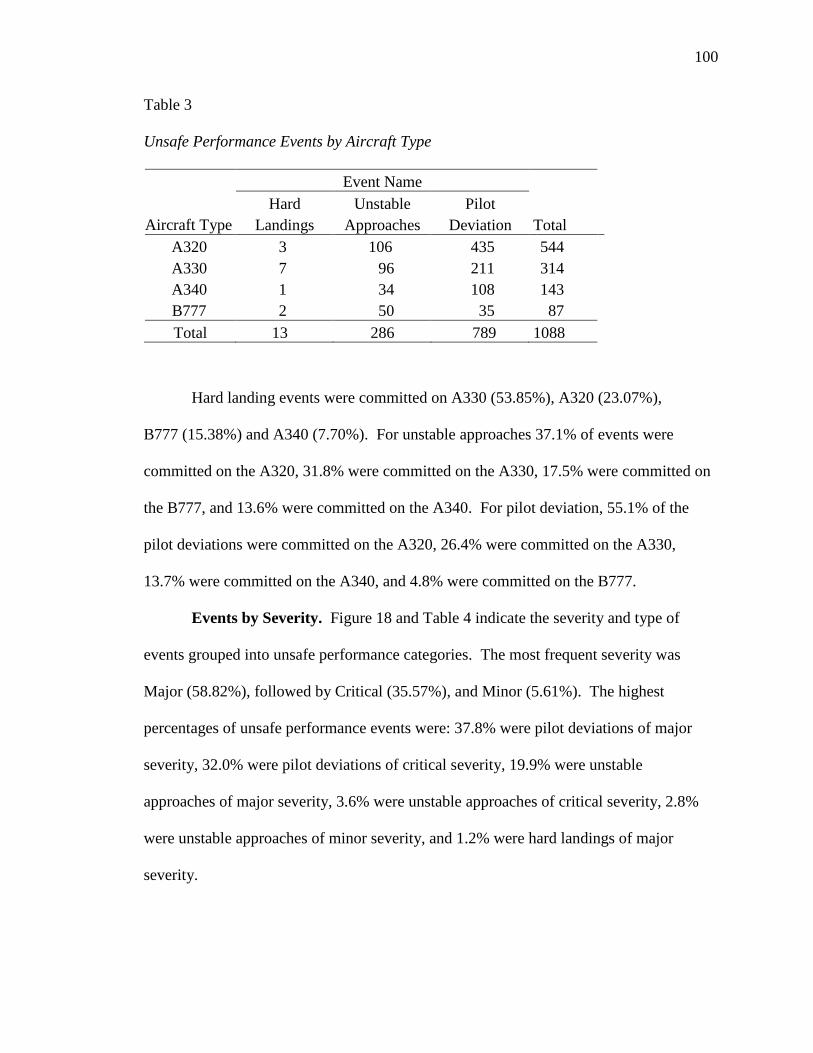
100
Table 3
Unsafe Performance Events by Aircraft Type
Aircraft Type
Event Name
Total
Hard
Landings
Unstable
Approaches
Pilot
Deviation
A320 3 106 435 544
A330 7 96 211 314
A340 1 34 108 143
B777 2 50 35 87
Total 13 286 789 1088
Hard landing events were committed on A330 (53.85%), A320 (23.07%),
B777 (15.38%) and A340 (7.70%). For unstable approaches 37.1% of events were
committed on the A320, 31.8% were committed on the A330, 17.5% were committed on
the B777, and 13.6% were committed on the A340. For pilot deviation, 55.1% of the
pilot deviations were committed on the A320, 26.4% were committed on the A330,
13.7% were committed on the A340, and 4.8% were committed on the B777.
Events by Severity. Figure 18 and Table 4 indicate the severity and type of
events grouped into unsafe performance categories. The most frequent severity was
Major (58.82%), followed by Critical (35.57%), and Minor (5.61%). The highest
percentages of unsafe performance events were: 37.8% were pilot deviations of major
severity, 32.0% were pilot deviations of critical severity, 19.9% were unstable
approaches of major severity, 3.6% were unstable approaches of critical severity, 2.8%
were unstable approaches of minor severity, and 1.2% were hard landings of major
severity.
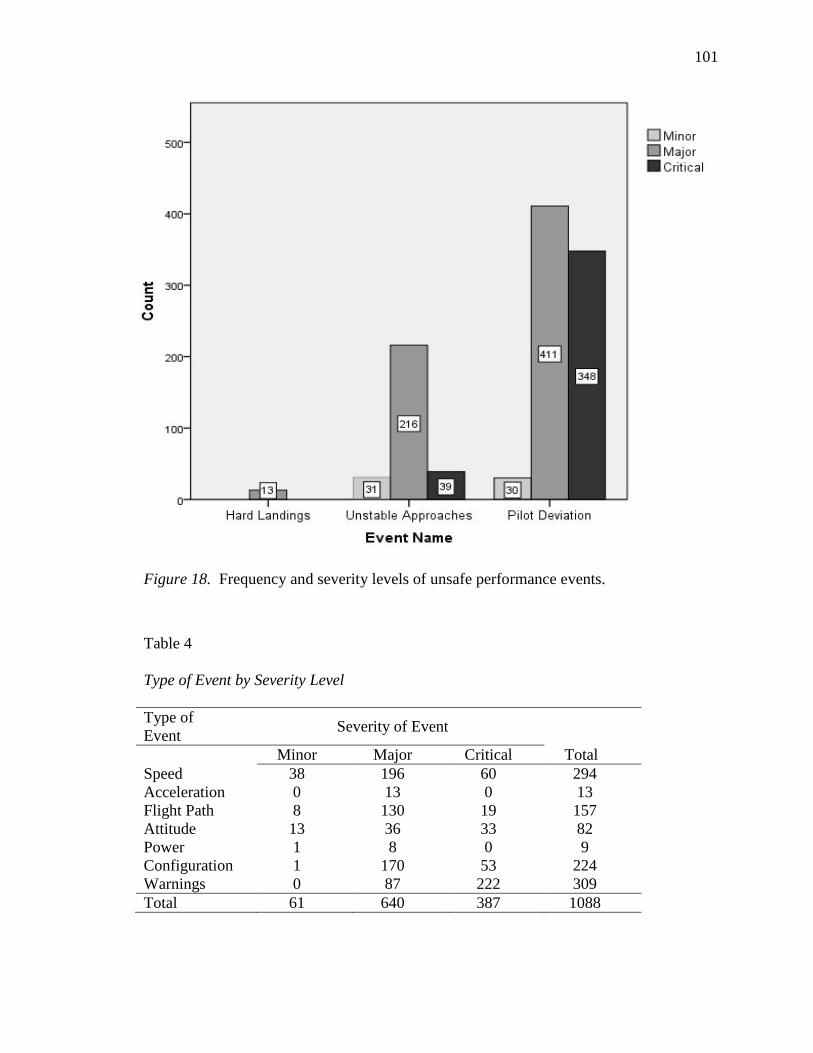
101
Figure 18. Frequency and severity levels of unsafe performance events.
Table 4
Type of Event by Severity Level
Type of
Event Severity of Event
Minor Major Critical Total
Speed 38 196 60 294
Acceleration 0 13 0 13
Flight Path 8 130 19 157
Attitude 13 36 33 82
Power 1 8 0 9
Configuration 1 170 53 224
Warnings 0 87 222 309
Total 61 640 387 1088

102
Events by Airport. Hard Landing events occurred mostly at Amman airport
(15.38%) and Kathmandu airport (15.38%) as the final destination airport; the remaining
69.24% of Hard Landing events occurred at Addis Ababa, Adelaide, Brisbane, Geneva,
Hong Kong, Istanbul, Lahore, Shanghai, and Riyadh (7.69% each). The Hub airport
accounted for 20.6% of the unstable approaches. The top five airports with the most
unstable approaches, excluding the Hub airport, are: Seychelles (17%), Damascus (12%),
John F. Kennedy (10%), Amman (7%), and Khartoum (6%). The Hub airport also
accounted for 43.09% of the pilot deviations. The top five airports with the most pilot
deviations, excluding the Hub airport, are: Kuwait and Lahore (22% each), Muscat
(19%), Amman (18%), and Doha (17%).
Nationalities. The sample’s demographics are split into nationalities. The
captains’ nationalities were from:
Europe (38.14%),
o British (8.64%), German (6.16%), French (5.33%), Italian
(4.32%), Irish (1.84%), Greek (1.38%), Belgian and Cypriot
(1.19% each), Austrian, Swiss, and Turkish (1.1% each), Croatian
(0.92%), Spanish and Swedish (0.74% each), Bulgarian,
Hungarian, Maltese, and Serbian & Montenegrin (0.46% each),
Bosnian & Herzegovina (0.28%), and Dutch, Slovenian, and
Yugoslavian (0.09% each).
Asia / Pacific (21.42%),
Malaysian (7.9%), Indian (2.11%), New Zealander (1.84%), South
Korean (1.64%), Filipino (1.6%), Sri Lankan (1.2%), Singaporean
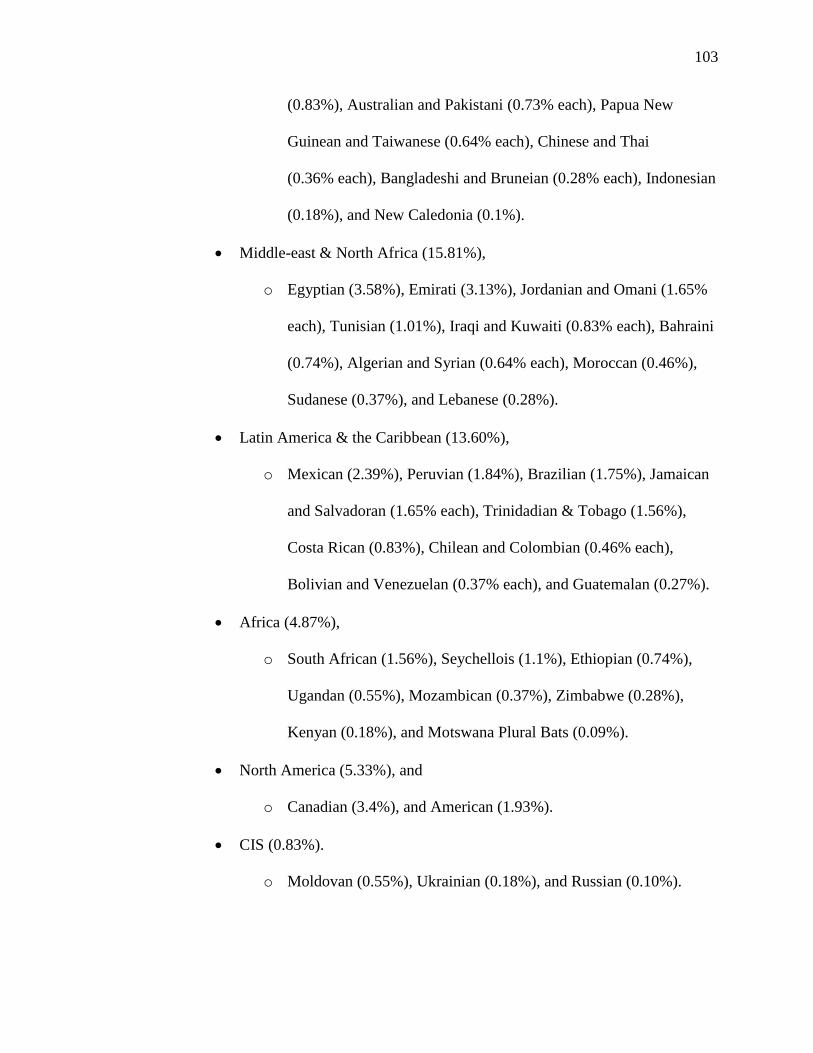
103
(0.83%), Australian and Pakistani (0.73% each), Papua New
Guinean and Taiwanese (0.64% each), Chinese and Thai
(0.36% each), Bangladeshi and Bruneian (0.28% each), Indonesian
(0.18%), and New Caledonia (0.1%).
Middle-east & North Africa (15.81%),
o Egyptian (3.58%), Emirati (3.13%), Jordanian and Omani (1.65%
each), Tunisian (1.01%), Iraqi and Kuwaiti (0.83% each), Bahraini
(0.74%), Algerian and Syrian (0.64% each), Moroccan (0.46%),
Sudanese (0.37%), and Lebanese (0.28%).
Latin America & the Caribbean (13.60%),
o Mexican (2.39%), Peruvian (1.84%), Brazilian (1.75%), Jamaican
and Salvadoran (1.65% each), Trinidadian & Tobago (1.56%),
Costa Rican (0.83%), Chilean and Colombian (0.46% each),
Bolivian and Venezuelan (0.37% each), and Guatemalan (0.27%).
Africa (4.87%),
o South African (1.56%), Seychellois (1.1%), Ethiopian (0.74%),
Ugandan (0.55%), Mozambican (0.37%), Zimbabwe (0.28%),
Kenyan (0.18%), and Motswana Plural Bats (0.09%).
North America (5.33%), and
o Canadian (3.4%), and American (1.93%).
CIS (0.83%).
o Moldovan (0.55%), Ukrainian (0.18%), and Russian (0.10%).
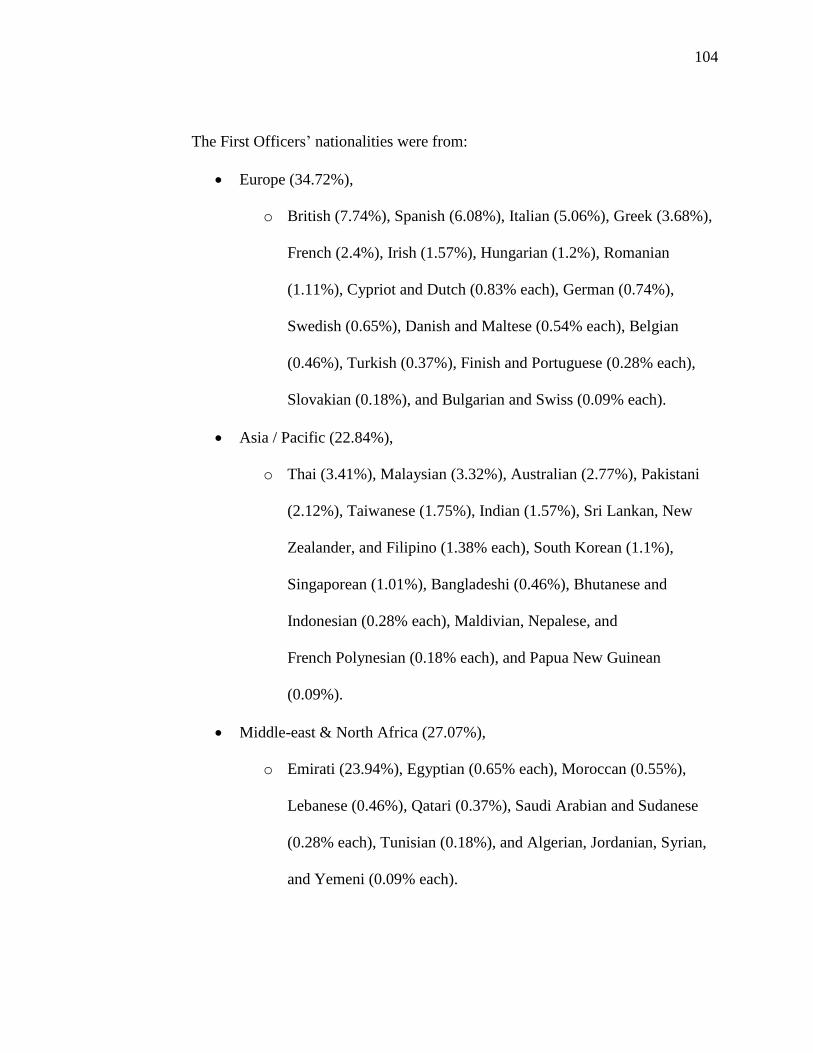
104
The First Officers’ nationalities were from:
Europe (34.72%),
o British (7.74%), Spanish (6.08%), Italian (5.06%), Greek (3.68%),
French (2.4%), Irish (1.57%), Hungarian (1.2%), Romanian
(1.11%), Cypriot and Dutch (0.83% each), German (0.74%),
Swedish (0.65%), Danish and Maltese (0.54% each), Belgian
(0.46%), Turkish (0.37%), Finish and Portuguese (0.28% each),
Slovakian (0.18%), and Bulgarian and Swiss (0.09% each).
Asia / Pacific (22.84%),
o Thai (3.41%), Malaysian (3.32%), Australian (2.77%), Pakistani
(2.12%), Taiwanese (1.75%), Indian (1.57%), Sri Lankan, New
Zealander, and Filipino (1.38% each), South Korean (1.1%),
Singaporean (1.01%), Bangladeshi (0.46%), Bhutanese and
Indonesian (0.28% each), Maldivian, Nepalese, and
French Polynesian (0.18% each), and Papua New Guinean
(0.09%).
Middle-east & North Africa (27.07%),
o Emirati (23.94%), Egyptian (0.65% each), Moroccan (0.55%),
Lebanese (0.46%), Qatari (0.37%), Saudi Arabian and Sudanese
(0.28% each), Tunisian (0.18%), and Algerian, Jordanian, Syrian,
and Yemeni (0.09% each).

105
Latin America & the Caribbean (8.83%),
o Mexican (3.32%), Brazilian (1.66%), Jamaican (0.91%),
Trinidadian & Tobago (0.74%), Salvadoran (0.65%), Colombian
(0.55%), Peruvian (0.37%), Argentinean, Dominican, and
Venezuelan (0.18% each), and Chilean (0.09%).
Africa (4.14%), and
o South African (1.93%), Seychellois (1.29%), Cote d Lvoire,
Ethiopian, Mauritian, and Senegalese (0.18% each), and Malian
and Uganda (0.10% each).
North America (2.4%).
o American (2.12%), and Canadian (0.28%),
As illustrated in Figure 19, the top 10 nationality combinations for
Captain_First Officer (grouped into continents) is Europe_Europe (14%), followed by
Europe_Middle-east & North Africa (10%).
Figure 19. Top 10 nationality combinations for Captain_First Officer.

106
Table 5 indicates the descriptive information for nationality combinations,
including the percent. No nationality combinations between captain and first officer
existed for the following combinations: Africa_CIS, Asia / Pacific_CIS, CIS_Africa,
CIS_CIS, CIS_Latin America & the Caribbean, CIS_North America, Europe_CIS, Latin
America & the Caribbean_CIS, Middle-east & North Africa_CIS, North America_ CIS,
and North America_North America.
Table 5
Distribution Among Pilot Nationality Combinations
Captain Nationality Combinations
First Officer
Nationality
Combinations
Africa Asia /
Pacific CIS Europe
Latin
America
& the
Caribbean
MENA North
America Total
Africa 0.3% 1.1% --- 1.7% 0.5% 0.2% 0.5% 4.2%
Asia / Pacific
1.3% 6.5% 0.1% 7.6% 2.8% 3.1% 1.5% 22.8%
CIS --- --- --- --- --- --- --- ---
Europe 1.8% 6.9% 0.2% 14.0% 4.8% 5.3% 1.7% 34.7%
Latin
America &
the Caribbean
0.3% 1.8% --- 3.0% 1.4% 1.1% 0.4% 8.8%
MENA 1.7% 3.7% 0.6% 10.3% 4.1% 5.2% 1.4% 27.0%
North
America
0.1% 1.2% --- 0.7% 0.1% 0.3% --- 2.4%
Total 5.5% 21.3% 0.8% 38.2% 13.6% 15.2% 5.3% 100%

107
Pilots’ Age. The age range for captains was between 29 and 64 years of age
(mean age = 47, median and mode = 46, S.D. = 7.4). First officers’ age ranged between
21 and 61 years (mean age = 36, median = 35, mode = 29, S.D. = 8). Three age
categories were generated for both captains and first officers: younger age, average age,
and older age. The average age category was created as the mean plus or minus one
standard deviation. The younger age category included pilots whose age was less than 1
standard deviation below the mean, and the older age category included pilots whose age
was greater than 1 standard deviation above the mean. Table 6 illustrates the frequency
of age groups for captains (39 years and under, 40-54 years, and 55 years and over) and
for first officers (28 years and under, 29-44 years, and 45 years and above).
Table 6
Frequency of Age Categories
Captains’ Age Categories Frequency Percent
39 Years and under 192 17.6
40-54 Years 713 65.5
55 Years and over 183 16.8
Total 1088 100.0
First Officers’ Age Categories Frequency Percent
28 Years and under 221 20.3
29-44 Years 705 64.8
45 Years and above 162 14.9
Total 1088 100.0

108
Nationality Combinations and Unsafe Performance Events
All Hard Landing events were due to ‘Abnormal Vertical G with Flap.’ Table 7
indicates the nationality combination of Captain_First Officer for ‘Hard Landing’ events.
For Unstable Approach events, as indicated in Figure 20, the nationality combination
with the largest percentage was Europe_Europe (13.64%); followed by the nationality
combination of Europe_Middle-East & North Africa (9.44%), Europe_Asia/Pacific
(9.44%), and Asia / Pacific_Europe (9.10%).
Table 7
Frequency of Hard Landing Events by Nationality combinations
Nationality Combination (Continent) Frequency of
Events Percentage
Latin America & the Caribbean_Europe 3 23.08
Asia/Pacific_ Asia/Pacific 2 15.38
Europe_Europe 2 15.38
Europe_Middle-east & North Africa 2 15.38
Africa_Europe 1 7.69
Europe_Asia/Pacific 1 7.69
Europe_Latin America & the Caribbean 1 7.69
Middle-east & North Africa_Africa 1 7.69
Total 13 100.00

109
Figure 20. Frequency of unstable approaches for pilots nationality combinations.
Moreover, Figure 21 indicates that the most common nationality combination for
Captain_First Officer where unsafe performance events took place for the Pilot Deviation
events was Europe_Europe (14%); followed by ‘Europe_Middle-east & North Africa’
(11%) and ‘Europe_Asia /Pacific’ (7%).

110
Figure 21. Frequency of pilot deviations for pilots nationality combinations.
Inferential Statistics
Hypothesis 1. The null hypothesis was that there was no significant effect of the
covariate age on the relationship between nationality combinations of captains / first
officers and unsafe performance events. A Spearman’s rank correlation and an ANCOVA
statistical test were conducted to test hypothesis 1.
A Spearman’s rank correlation test was employed on the full dataset to determine
the degree of relationship between unsafe performance events (Hard Landings, Unstable
Approaches and Pilot Deviation) and age (three age categories) to test the null

111
hypothesis. The findings showed that there was not a significant correlation between
unsafe performance events and age of captains: rs(1088) = -.013, p = .665, where
rs2 = .000169. Therefore, the null hypothesis failed to be rejected. However, the findings
showed that there was a significant but very weak correlation between unsafe
performance events and age of first officers: rs(1088) = -.09, p = .003, where rs2 = .0081.
Therefore, the null hypothesis was rejected.
A between subjects ANCOVA was conducted on the full dataset to investigate the
effect of nationality type (homogeneous or heterogeneous) on unsafe performance events
while controlling for the variable: age of pilots. Prior to conducting the ANCOVA test,
the following assumption checks were made (Brace et al., 2009):
1. A covariate should be chosen on the basis of existing theory and research.
2. A covariate should ideally be measured using a scale at ratio, interval, or
ordinal level (if nominal, then the variable has to be a dichotomous variable).
3. Ideally, a covariate should be measured before the experimental manipulation
takes place.
4. A covariate should be measured reliably.
5. The relationship between a covariate and the dependent variable must be
linear.
6. There should be homogeneity of regression.
The findings showed that the data violated the homogeneity of regression
assumption for first officers’ age, F(1, 1082) = 12.405, p < .000. Therefore, the
ANCOVA was not conducted.

112
Hypothesis 2. The null hypothesis was that there was no significant effect of the
covariate airport destination on the relationship between nationality combinations of
captains / first officers and unsafe performance events. A Spearman’s rank correlation
and an ANCOVA statistical tests were conducted.
A Spearman’s rank correlation test was employed to determine the degree of
relationship between unsafe performance events (Hard Landings, Unstable Approaches,
and Pilot Deviation) and destination airport. The variable destination airport was recoded
into a dichotomous variable where the Hub was recoded to 1 and all other destination
airports were recoded to 0. This recoding enabled the data to meet the assumption checks.
The Hub airport was 36.67% of the total number of destination airports. The findings
showed that there was a significant weak correlation between destination airport and
unsafe performance events rs(1088) = .219, p < 0.001, where rs2 = .048. Therefore, the
null hypothesis was rejected. Table 8 lists the frequency of unsafe performance events at
the Hub airport versus spoke airports.
Table 8
Airport Destination by Unsafe Performance Event
Event Name
Destination Hard
Landings
Unstable
Approaches
Pilot
Deviation Total
Spoke Destinations 13 227 449 689
Hub 0 59 340 399
Total 13 286 789 1088

113
A between subjects ANCOVA was conducted to investigate the effect of
nationality type (homogeneous or heterogeneous) on unsafe performance events while
controlling for the variable: destination airport (dichotomous variable). The findings
showed that there was not a significant difference between unsafe performance events
and nationality combinations when taking airport destination into account,
F(1, 1083) = 2.76, p = .097. The null hypothesis failed to be rejected; therefore, there
was no difference between unsafe performance events and nationality combinations when
taking airport destination into account.
Hypothesis 3. The null hypothesis was there was no significant effect of the
covariate eligibility to command the flight on the relationship between nationality
combinations of captains / first officers and unsafe performance events. A Spearman’s
rank correlation and an ANCOVA statistical test were conducted.
A Spearman’s rank correlation test was employed to determine the degree of
relationship between unsafe performance events (Hard Landings, Unstable Approaches,
and Pilot Deviation) and eligibility to command the flight. There was a significant weak
correlation between eligibility to command the flight and unsafe performance events
rs(1088) = -.304, p < 0.001, where rs2 = .092. Therefore, the null hypothesis was
rejected. Table 9 provides a distribution by event name for pilots’ eligibility to land at
the destination airport.
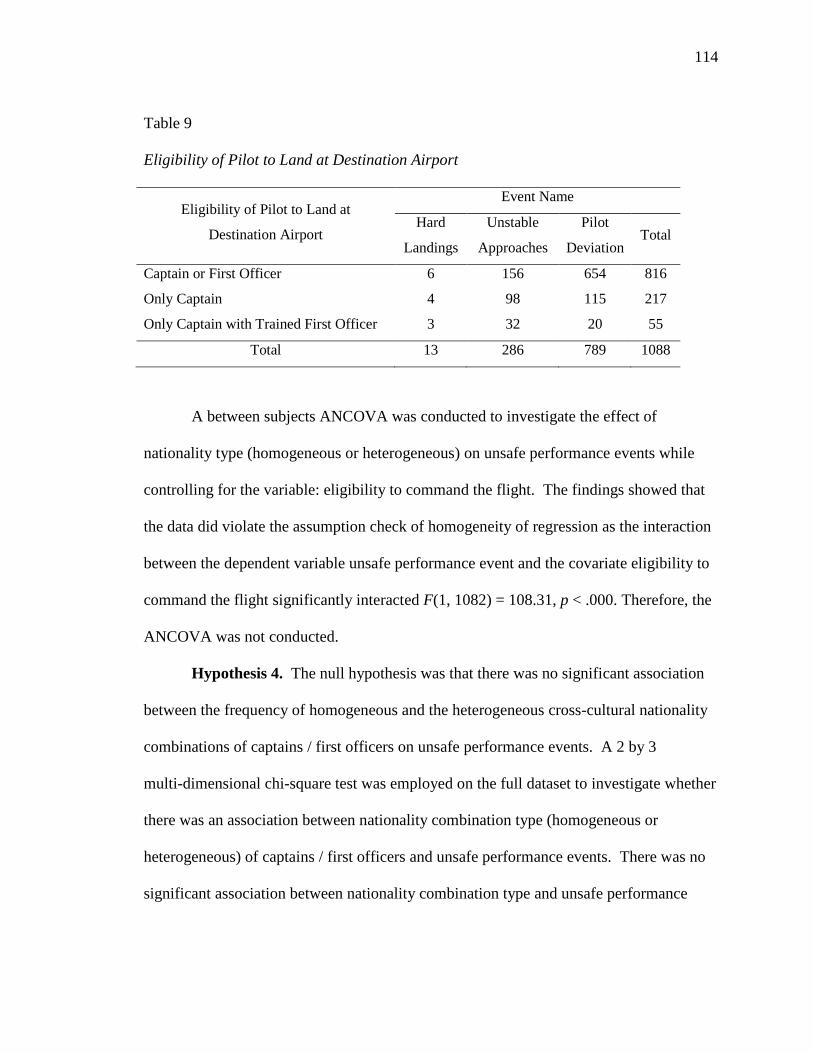
114
Table 9
Eligibility of Pilot to Land at Destination Airport
Eligibility of Pilot to Land at
Destination Airport
Event Name
Hard
Landings
Unstable
Approaches
Pilot
Deviation Total
Captain or First Officer 6 156 654 816
Only Captain 4 98 115 217
Only Captain with Trained First Officer 3 32 20 55
Total 13 286 789 1088
A between subjects ANCOVA was conducted to investigate the effect of
nationality type (homogeneous or heterogeneous) on unsafe performance events while
controlling for the variable: eligibility to command the flight. The findings showed that
the data did violate the assumption check of homogeneity of regression as the interaction
between the dependent variable unsafe performance event and the covariate eligibility to
command the flight significantly interacted F(1, 1082) = 108.31, p < .000. Therefore, the
ANCOVA was not conducted.
Hypothesis 4. The null hypothesis was that there was no significant association
between the frequency of homogeneous and the heterogeneous cross-cultural nationality
combinations of captains / first officers on unsafe performance events. A 2 by 3
multi-dimensional chi-square test was employed on the full dataset to investigate whether
there was an association between nationality combination type (homogeneous or
heterogeneous) of captains / first officers and unsafe performance events. There was no
significant association between nationality combination type and unsafe performance

115
events, χ2 = 3.032, df = 2, p = 0.22. Therefore, the null hypothesis failed to be rejected, as
shown in Table 10.
Table 10
Nationality Combinations by Unsafe Performance Events
Event Name
Nationality Combinations Hard
Landings
Unstable
Approaches
Pilot
Deviation Total
Heterogeneous 9 219 561 789
Homogeneous 4 67 226 297
Total 13 286 787 1086
Hypothesis 5. The null hypothesis was that there was no significant association
between the frequencies of the nationality combinations of captains / first officers on
unsafe performance events. A 7 by 7 multi-dimensional chi-square test was conducted to
investigate which nationality combinations were associated with each unsafe
performance events category. The chi-square results were:
Hard landings: χ2 = 24.27, df = 16, p = .084, failed to reject the null
hypothesis,
Unstable approaches: χ2 = 27.71, df = 30, p = .586, failed to reject the null
hypothesis,
Pilot deviations: χ2 = 58.72, df = 30, p = .001, rejected the null hypothesis,
and
Total: χ2 = 54.12, df = 30, p = .004, rejected the null hypothesis.
The unstandardized residuals provided below indicate the pilots’ nationality
combinations that most contributed to the chi-square result:

116
Hard landings
o Captain - Asia/Pacific with First Officer - Europe: Residual = -2.3
Unstable Approaches
o Captain - Europe with First Officer - MENA: Residual = 6.0
o Captain - Europe with First Officer - Europe: Residual = -4.5
o Captain - Latin America & the Caribbean with
First Officer - Asia / Pacific: Residual = -3.9
o Captain - Latin America & the Caribbean with First Officer - Europe:
Residual = 3.5
o Captain - Asia/Pacific with First Officer - North America: Residual = 3.0
o Captain - MENA with First Officer - MENA: Residual = -2.8
o Captain - Europe with First Officer - North America: Residual = -2.7
o Captain - Africa with First Officer - Europe: Residual = 2.5
o Captain - Asia/Pacific with First Officer - MENA: Residual = -2.4
o Captain - Latin America & the Caribbean with First Officer - MENA:
Residual = 2.0
Pilot Deviations
o Captain - Asia / Pacific with First Officer - MENA: Residual = -19.7
o Captain - Asia / Pacific with First Officer - Asia / Pacific: Residual = 15.3
o Captain - MENA with First Officer - MENA: Residual = 13.5
o Captain - Europe with First Officer - Asia / Pacific: Residual = -13.3
o Captain - Europe with First Officer - Europe: Residual = 11.9
o Captain - Europe with First Officer - MENA: Residual = -5.6
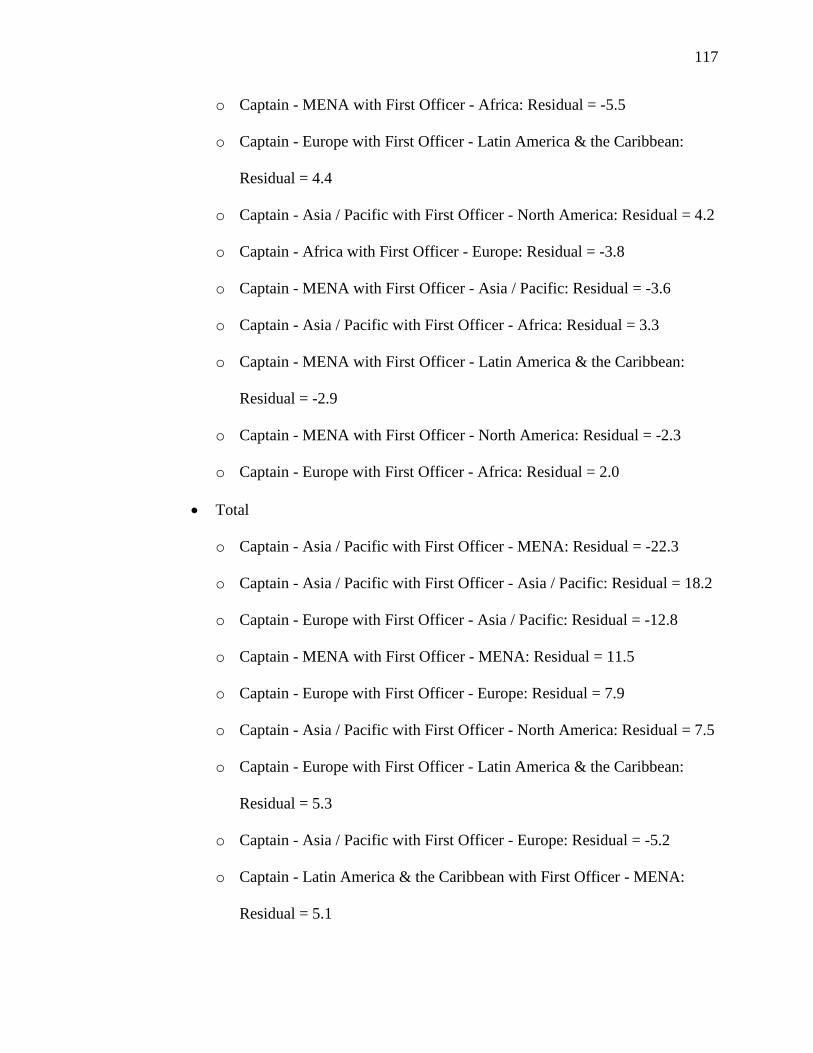
117
o Captain - MENA with First Officer - Africa: Residual = -5.5
o Captain - Europe with First Officer - Latin America & the Caribbean:
Residual = 4.4
o Captain - Asia / Pacific with First Officer - North America: Residual = 4.2
o Captain - Africa with First Officer - Europe: Residual = -3.8
o Captain - MENA with First Officer - Asia / Pacific: Residual = -3.6
o Captain - Asia / Pacific with First Officer - Africa: Residual = 3.3
o Captain - MENA with First Officer - Latin America & the Caribbean:
Residual = -2.9
o Captain - MENA with First Officer - North America: Residual = -2.3
o Captain - Europe with First Officer - Africa: Residual = 2.0
Total
o Captain - Asia / Pacific with First Officer - MENA: Residual = -22.3
o Captain - Asia / Pacific with First Officer - Asia / Pacific: Residual = 18.2
o Captain - Europe with First Officer - Asia / Pacific: Residual = -12.8
o Captain - MENA with First Officer - MENA: Residual = 11.5
o Captain - Europe with First Officer - Europe: Residual = 7.9
o Captain - Asia / Pacific with First Officer - North America: Residual = 7.5
o Captain - Europe with First Officer - Latin America & the Caribbean:
Residual = 5.3
o Captain - Asia / Pacific with First Officer - Europe: Residual = -5.2
o Captain - Latin America & the Caribbean with First Officer - MENA:
Residual = 5.1
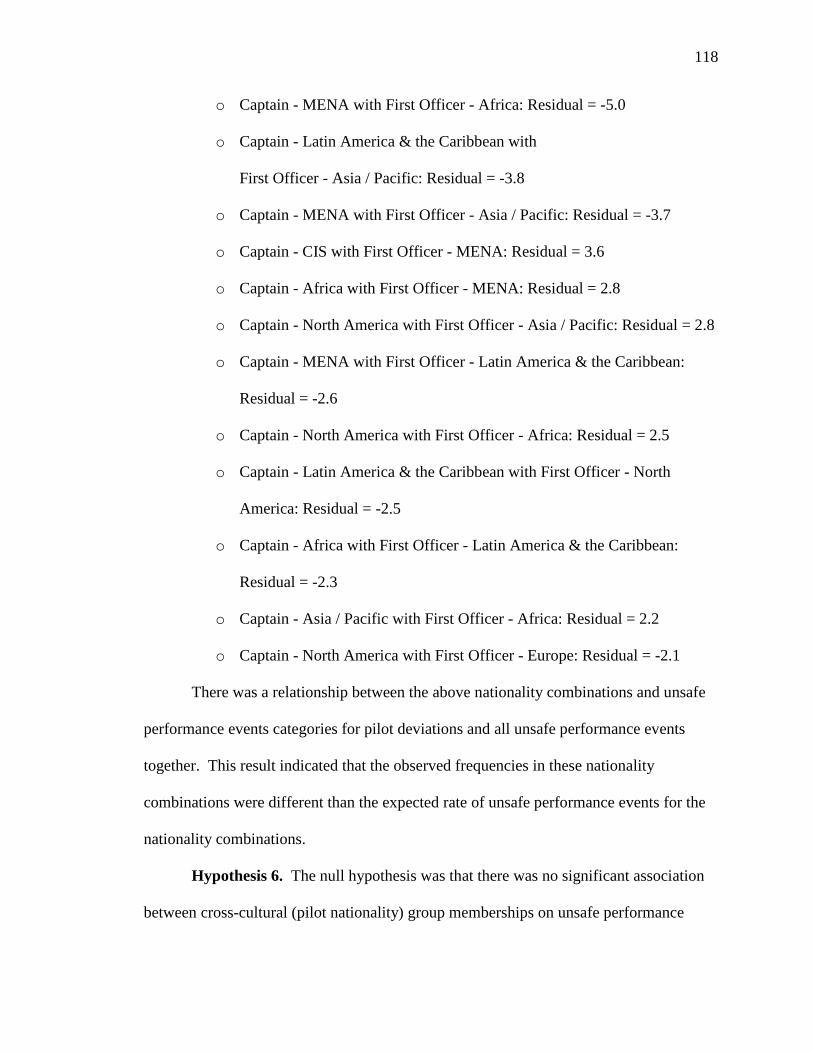
118
o Captain - MENA with First Officer - Africa: Residual = -5.0
o Captain - Latin America & the Caribbean with
First Officer - Asia / Pacific: Residual = -3.8
o Captain - MENA with First Officer - Asia / Pacific: Residual = -3.7
o Captain - CIS with First Officer - MENA: Residual = 3.6
o Captain - Africa with First Officer - MENA: Residual = 2.8
o Captain - North America with First Officer - Asia / Pacific: Residual = 2.8
o Captain - MENA with First Officer - Latin America & the Caribbean:
Residual = -2.6
o Captain - North America with First Officer - Africa: Residual = 2.5
o Captain - Latin America & the Caribbean with First Officer - North
America: Residual = -2.5
o Captain - Africa with First Officer - Latin America & the Caribbean:
Residual = -2.3
o Captain - Asia / Pacific with First Officer - Africa: Residual = 2.2
o Captain - North America with First Officer - Europe: Residual = -2.1
There was a relationship between the above nationality combinations and unsafe
performance events categories for pilot deviations and all unsafe performance events
together. This result indicated that the observed frequencies in these nationality
combinations were different than the expected rate of unsafe performance events for the
nationality combinations.
Hypothesis 6. The null hypothesis was that there was no significant association
between cross-cultural (pilot nationality) group memberships on unsafe performance

119
events. A discriminant analysis was conducted to review the association between cross-
cultural group memberships and unsafe performance events. “The rationale behind
discriminant analysis is to make use of existing data pertaining to group membership and
relevant predictor variables to create a formula that will accurately predict group
membership” (George & Mallery, 2000, p. 316). The results showed that there was a
significant effect of some nationality combinations on unsafe performance events.
Table 11 lists the nationality combinations that have a significant association with unsafe
performance events.
From the captain and first officer nationality combinations, the predicted group
memberships for unsafe performance events are explained using Functions 1 and 2. The
eigenvalues obtained for Functions 1 and 2 are 0.081 and 0.031, respectively, and the
canonical correlation values for Functions 1 and 2 are .273 and .174 respectively.
The group memberships among the nationality combinations that committed
unsafe events are defined by the inclusion of the pairs within the discriminant analysis
functions. The null hypothesis was rejected; therefore, there was a significant association
between unsafe performance events and cross-cultural (pilot nationality) group
memberships. Table 12 indicates the classification results for the three unsafe
performance events, describing the original group memberships versus the predicted
group memberships. Overall, 73% of the original group cases were correctly classified;
100% of the pilot deviation events were correctly predicted, whereas only 7.7% of the
hard landings, and 1.7% of the unstable approaches were correctly predicted. The only
correctly predicted group memberships for hard landings and unstable approaches were
for the nationality combinations that were found in Table 11. Figure 22 is a Territorial

120
Map for the Discriminant Functions indicating where the nationality combinations were
more likely to appear.
Table 11
Nationality Combinations Associated with Unsafe Performance Events
Captains First Officers Function
1
Function
2
MENA Africa 2.27 .63
Latin America & the Caribbean Europe -.82 -2.11
MENA MENA 3.36 8.67
MENA North America 1.10 -.35
Asia / Pacific MENA .48 1.24
Africa Europe 2.05 .06
Africa MENA 1.72 -.79
Asia / Pacific Latin America & the Caribbean .99 2.54
Asia / Pacific Asia / Pacific 3.36 8.67
Africa North America .78 .74
Asia / Pacific Europe .49 -.11
Europe Asia / Pacific 2.28 -.17
Asia / Pacific North America 6.76 -9.13
CIS Asia / Pacific -.73 -1.90
Europe Europe 3.36 8.67
(Constant) -.485 .001
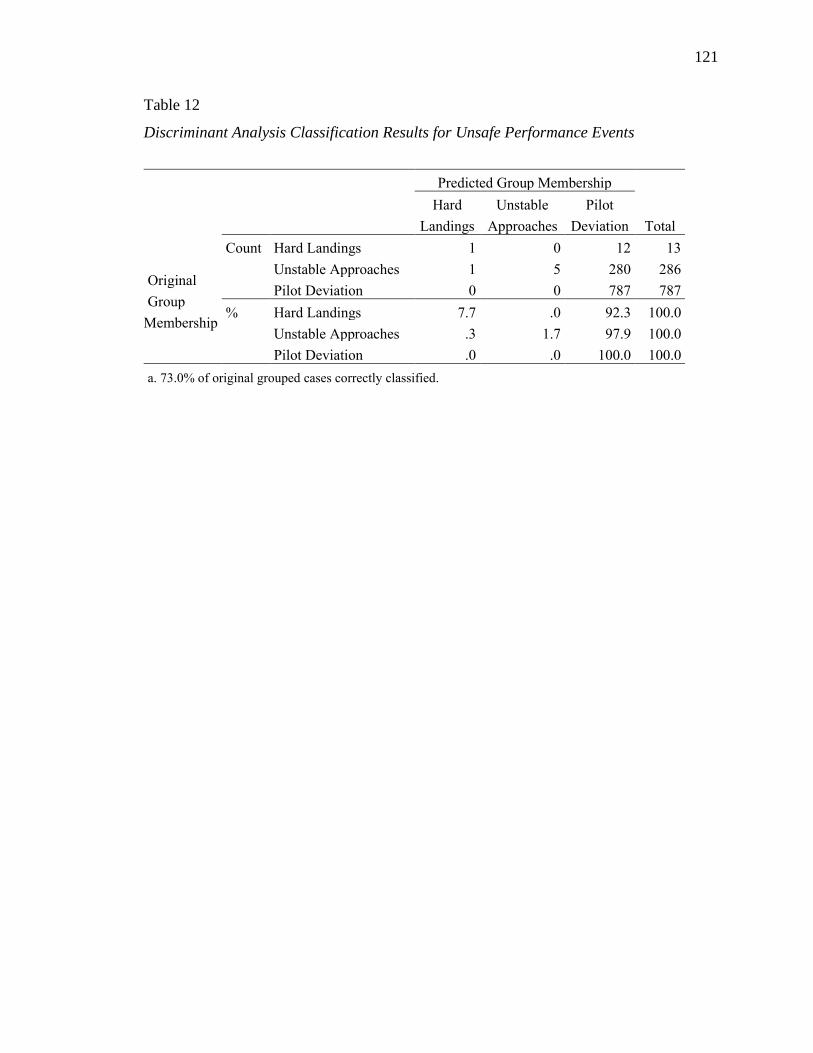
121
Table 12
Discriminant Analysis Classification Results for Unsafe Performance Events
Predicted Group Membership
Total
Hard
Landings
Unstable
Approaches
Pilot
Deviation
Original
Group
Membership
Count Hard Landings 1 0 12 13
Unstable Approaches 1 5 280 286
Pilot Deviation 0 0 787 787
% Hard Landings 7.7 .0 92.3 100.0
Unstable Approaches .3 1.7 97.9 100.0
Pilot Deviation .0 .0 100.0 100.0
a. 73.0% of original grouped cases correctly classified.

122
Figure 22. Discriminant functions territorial map.

123
A Logistic Regression analysis was conducted and, based on the regression
model, the output predicted 100% of the 787 pilot deviation events, as seen in Table 13.
This result supports the output obtained from the Discriminant Analysis and corroborates
the association between unsafe performance events and cross-cultural (pilot nationality)
group memberships. The null hypothesis was rejected; therefore, there was a significant
association between unsafe performance events and cross-cultural (pilot nationality)
group memberships.
Table 13
Logistic Regression Classification Results for Unsafe Performance Events
Observed
Predicted Group Membership
Total
Hard
Landings
Unstable
Approaches
Pilot
Deviation
Hard Landings 1 0 12 13
Unstable Approaches 1 0 285 286
Pilot Deviation 0 0 787 787
Overall Percentage 0.2 0 99.8 100.0

124
CHAPTER V
DISCUSSION, CONCLUSIONS, AND RECOMMENDATIONS
The purpose of this dissertation was to determine if cross-cultural flight deck crew
composition is related to increased error levels. Data from an airline in the UAE was
utilized to analyze the influence of cross-cultural pilots on operational safety.
The airline industry is highly diversified, extremely safety-sensitive, and
technologically driven. Due to the complexities of air transportation, airlines have
implemented fundamental training programs to attain and maintain safe operations
including CRM, TEM, and SOPs (Salas, Bowers, & Edens, 2001). Continuous
improvements to these programs have been made as the industry strives to improve the
safety of air travel. In order to understand the influence of cross-cultural crew
environment on pilot performance, it is crucial to study these programs and explore their
impact on daily operations (Salas, Bowers, & Edens, 2001). This section includes a
summary of the results for the analyses conducted, followed by the conclusions and
recommendations for future research and practices.
Discussion
The research design used for this study was an archival design utilizing existing
organizational records (Vogt, Gardner, & Haettele, 2012). An investigation was
conducted into the association between unsafe performance events and captain / first
officer nationality combinations during a flight where performance events were recorded.
The flight data were retrieved from an unchanged flight data-recording environment
yielding robust detailed data that was combined with administrative demographic data.
125
Population and Sample. The population for the study was unsafe performance
events for Air MENA between May 2011 and January 2013. These unsafe performance
events were only pilot related events. All other events were eliminated from the data set.
Purposive sampling ensured that data selection targeted crew based events that would aid
in exploring the hypotheses (Babbie, 2010). The population contained 1,863 unsafe
performance events from a total of 1,149 pilots: 536 captains and 613 first officers. The
purposive sample contained 1,088 unsafe performance events that met the hypotheses:
Harding Landings, Unstable Approaches, and Pilot Deviations and included 915 pilots:
428 captains and 487 first officers.
The Aerobytes program, the FDM software used at Air MENA, cannot provide
the data to determine whether several unsafe events took place on the same flight in the
provided data. Therefore, each unsafe performance event was allocated a unique event
identification number and each event was treated as an independent incident for data
analyses.
Some events were performed by the same captain / first officer combination on
different flights. The data set contained 660 events (61%) with duplicated captain ID
numbers. From the duplicated captain ID cases, less than 37% of captains were
duplicated more than twice in the dataset. For first officer, 601 events (55%) contained
first officer ID number duplications, and from the duplicated first officer ID cases, less
than 29% of first officers were duplicated more than twice in the dataset.
Hypothesis Testing. This study sought to answer the following research
question: To what extent can we predict an unsafe performance event based on the
nationality combination of pilots? In order to answer this question, six hypotheses were

126
investigated. The purpose of hypothesis testing in research is to determine the likelihood
that a population parameter is true. The null hypothesis was the alternative hypothesis to
what was proposed as true.
H1. The null hypothesis was that there was no significant effect of the covariate
age on the relationship between nationality combinations of captains / first officers and
unsafe performance events. In order to determine the degree of relationship between
unsafe performance events and age, a Spearman’s r test was conducted. This test
provided the measure of strength and direction of any potential relationships between
unsafe performance events and these intervening variables. The Spearman’s r correlation
test was ideal for non-parametric variables (Brace et al., 2009). The findings showed that
there was not a significant correlation between unsafe performance events and age of
captains. However, the findings showed that for the first officers’ age, there was a very
weak statistically significant relationship between nationality combinations of pilots and
unsafe performance events. The relationship did not have practical significance, because
it accounted for less than 1% of the variance. This effect may have been due to the wider
age range of first officers, or the lowest age of the first officers group (21 years). Age is a
proxy variable for experience. Due to the younger age of first officers in the data set
(mean, median, and mode), the total experience level among pilots can be posited to be
lower; therefore, the first officers were more susceptible to operational errors than ‘older’
captains who had more experience.
In addition, an ANCOVA statistical test was conducted to control for the effect of
age of captains / first officers on the relationship between nationality combination and
unsafe performance events using the scaled variable, number of unsafe performance
127
events per (continent) nationality combination, and unsafe performance event. The
findings showed that the data violated the homogeneity of regression assumption for first
officers’ age. Therefore, the ANCOVA was not conducted.
H2. The null hypothesis was that there was no significant effect of the covariate
airport destination on the relationship between nationality combinations of captains / first
officers and unsafe performance events. In order to determine the degree of relationship
between unsafe performance events and destination airport, a Spearman’s r test was
conducted. A Spearman’s rank test indicated a weak relationship between airport
destination and unsafe performance events accounting for less than 5% of the variance,
where 36.67% of the events occurred at the Hub (59 unstable approaches and 340 pilot
deviations). The high number of events at the Hub may have occurred as a result of
various factors not related to the cross-culture of the crewmembers, such as poor air
traffic management, late night or early morning arrival times, training flights, and the
relaxed flight deck environment when flying to their Hub that is developed as a result of
familiarity of their base and the sense of ‘arriving home.’
In addition, an ANCOVA statistical test was conducted to control for the effect of
airport destination on the relationship between nationality combination and unsafe
performance events using the scaled variable, number of unsafe performance events per
(continent) nationality combination, and unsafe performance event (Hard Landings,
Unstable Approaches, and Pilot Deviation). The findings showed that there was not a
significant difference between unsafe performance events and nationality combinations
when taking airport destination into account.

128
H3. The null hypothesis was that there was no significant effect of the covariate
eligibility to command the flight on the relationship between nationality combinations of
captains / first officers and unsafe performance events. In order to determine the degree
of relationship between unsafe performance events and eligibility to command the flight,
a Spearman’s r test was conducted. There was a significant effect of the eligibility to
command the flight on the relationship between nationality combinations and unsafe
performance events that accounted for 9% of the variance. In fact, 75% of the events
occurred when either the captain or first officer was eligible to command the flight: six
hard landings, 156 unstable approaches, and 654 pilot deviations. These results may have
occurred due to low first officer experience as discussed for H1, training flights
conducted with cadet pilots or new joiners, ATC, other CRM skills (workload
management, situational awareness, communication skills, teamwork, briefing, etc.)
lapses, or the influence of national culture.
In addition, an ANCOVA statistical test was conducted to control for the effect of
eligibility to command the flight on the relationship between nationality combination and
unsafe performance events using the scaled variable, number of unsafe performance
events per (continent) nationality combination, and unsafe performance event. The
findings showed that the data violated the assumption check of homogeneity of
regression. Therefore, the ANCOVA was not conducted.
H4. The null hypothesis was that there was no significant association between the
frequency of homogeneous and the heterogeneous cross-cultural nationality combinations
of captains / first officers on unsafe performance events. The association between
nationality combinations of captains / first officers and unsafe performance events was

129
investigated through a 2 by 3 multi-dimensional chi-square statistical test. The aim was
to check whether the frequency of homogeneous nationality combinations differed from
the frequency of heterogeneous cross-cultural nationality combinations of captains/first
officers on unsafe performance events.
There was no significant association between the frequency of homogeneous and
the heterogeneous cross-cultural nationality combinations of captains / first officers on
unsafe performance events. However, heterogeneous crewmembers triggered 72.65% of
the unsafe performance events: nine hard landings, 219 unstable approaches, and 561
pilot deviations.
H5. The null hypothesis was that there was no significant association between the
frequencies of the nationality combinations of captains / first officers on unsafe
performance events. Using the 7 continent nationality combinations of captain and first
officer, a 7 by 7 multi-dimensional chi-square was conducted. There was no significant
difference for hard landings or unstable approaches; there was a significant association
for pilot deviations and all unsafe performance events in total. For the significant unsafe
performance events, nationality combinations that included either the captain or first
officer were from Asia / Pacific, Europe, and MENA. These nationality combinations
appeared consistently among the top occurrences for unsafe performance events.
H6. The null hypothesis was that there was no significant association between
cross-cultural (pilot nationality) group memberships on unsafe performance events.
Discriminant analysis was used to predict category membership from the nationality
combinations. This analysis was used to predict which of the 49 nationality combination
categories were more likely to commit unsafe performance events. All of the pilot

130
deviations were correctly predicted using 15 captain / first officer nationality
combinations. Therefore, only pilot deviations were reliably predicted by the
Discriminant Analysis and Logistic Regression.
The discriminant analysis and logistic regression showed that there was a
significant effect of some cross-cultural group memberships on unsafe performance
events. Nationality combinations of Asia / Pacific, Europe, and MENA appeared
consistently, corroborating the findings from hypothesis 5.
Research Questions. One research question was addressed in this study to
identify possible relationships between cross-cultural crewmembers and unsafe
performance events.
To what extent can we predict an unsafe performance event based on the
nationality combination of pilots?
Only pilot deviations could be reliably predicted using the 15 captain / first officer
nationality combinations. Hard landings had too few events (only 13 events). The
nationality combinations for unstable approaches were not significantly correlated and
were not included in the analyses. Therefore, unstable approaches could not be reliably
predicted.
Conclusion
The results of this study indicated that captains’ age does not have a statistically
significant effect on unsafe performance events. However, the findings showed that there
was a significant but weak relationship between unsafe performance events and age of
first officers. This weak relationship may have been due to the younger age range among
first officers, which equates to lower experience levels compared to captains.

131
Additionally, Air MENA facilitates a cadet pilot program where a majority of the cadets
joining are below the age of 20 years. Upon completion of the cadet pilot program, these
pilots are still in the range of 20 - 22 years old with approximately 250 hours of total
flight time. This conclusion is supported by the fact that 50% of the unsafe performance
events are committed on the narrow body fleet, the initial aircraft type for new first
officers; 80% of the events are due to pilot deviations. The inexperience of these pilots
illustrates that the lack of precise aircraft handling skills may lead to excessive deviations
of aircraft controls. Moreover, their low experience levels may suggest that their CRM
skills were less developed, and therefore; it was difficult to deal with crewmembers’
cultural differences.
The results of this study indicated that there was a significant weak correlation
between unsafe performance events and destination airport. The Hub accounted for
36.67% of the total number of destination airports where unsafe performance events
occurred. This result supports the previous conclusions, as a majority of the ‘low
experienced’ pilots tend to perform the landings at the Hub due to familiarity. The Hub is
known for unstandardized air traffic management, where pilots are usually provided with
extensive radar vectors in addition to altitude and speed constraints during the final
phases of the flight. As a result, workload is increased during critical phases of the flight.
If alternative approach procedures are not adequately briefed prior to commencing the
descent phase, when ATC changes the expected approach, the pilot may not be prepared
on multiple different levels (technical or non-technical), and therefore, could exceed an
aircraft or SOP threshold.
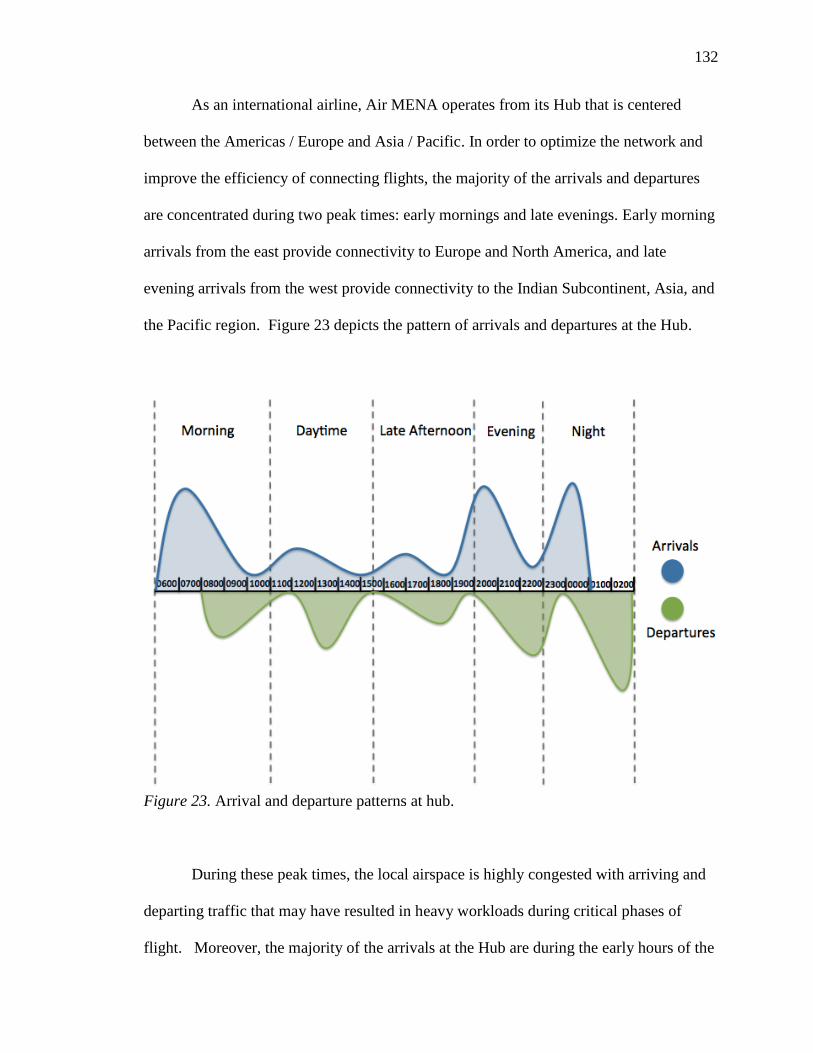
132
As an international airline, Air MENA operates from its Hub that is centered
between the Americas / Europe and Asia / Pacific. In order to optimize the network and
improve the efficiency of connecting flights, the majority of the arrivals and departures
are concentrated during two peak times: early mornings and late evenings. Early morning
arrivals from the east provide connectivity to Europe and North America, and late
evening arrivals from the west provide connectivity to the Indian Subcontinent, Asia, and
the Pacific region. Figure 23 depicts the pattern of arrivals and departures at the Hub.
Figure 23. Arrival and departure patterns at hub.
During these peak times, the local airspace is highly congested with arriving and
departing traffic that may have resulted in heavy workloads during critical phases of
flight. Moreover, the majority of the arrivals at the Hub are during the early hours of the

133
morning, between 06:00 and 08:00. Since these flights are conducted throughout the
night, fatigue could have contributed to low performance level resulting in an unsafe
performance event.
The results of this study indicated that there was a significant relationship
between unsafe performance events and eligibility to command the flight. In fact, 75% of
the unsafe performance events occurred at destination airports where captains and first
officers were eligible to command the flights. This result further indicates that the unsafe
performance events were influenced by the national culture of the crew.
Although the 2 by 3 multi-dimensional chi-square test indicated that there was no
significant association between unsafe performance events and nationality combinations,
the frequency of events by nationality combination types varied considerably. In fact,
heterogeneous nationality combinations accounted for 72.65% of the unsafe performance
events. Heterogeneous pilot combinations accounted for nine hard landings, 219 unstable
approaches, and 561 pilot deviations, compared to homogeneous nationality
combinations that accounted for four hard landings, 67 unstable approaches, and 226
pilot deviations. Of the 15 nationality combinations that were significant, two were
homogeneous and 13 were heterogeneous. The majority of these combinations presented
nationalities with high PDI and IDV dimensions.
The aforementioned results buttress the literature that certain cultural traits and
beliefs influence pilots’ behavior and attitudes and may jeopardize safety levels (Wise et
al., 2010). Defense systems, such as checklists and SOPs, may be weakened as a result
of heterogeneous nationality combinations. Additionally, heterogeneous nationality
combinations may have experienced poor teamwork, communication skills, workload

134
management, or SOP applications during critical phases of the flight. Consequently,
cross-cultural crewmembers may have experienced mental exhaustion and tension as a
result of misunderstanding, poor communication, excessive workload on one
crewmember, or not paying attention to the flight controls.
The results of this study indicated that there were significant associations between
unsafe performance events and the frequencies of nationality combinations of captains /
first officers. Also, there was a significant association between unsafe performance
events and cross-cultural group memberships. As explained in the literature, Hofstede’s
cultural dimensions expose the traits and attitudes for each national culture. Nationality
combinations of Asia / Pacific, Europe, and MENA appeared consistently in the unsafe
performance events. Aligning these nationality combinations with Hofstede’s cultural
dimensions reveals that Asia / Pacific and MENA score high in PDI, whereas Europe
scores high in IDV. Nationality combinations with extreme PDI and IDV scores can
jeopardize safety levels as a result of authoritarian characteristics and weak
communication between crewmembers to avoid loss of ‘face’ and shame.
Nationalities with a high PDI dimension tend to be from Asian nations such as
China, South Korea, and Japan. A recent example of an accident that involved
nationality combinations with a high PDI dimension is Asiana Flight 214 in San
Francisco in July 2013, where both South Korean pilots exerted high authoritarian
behaviors (Croft, 2013). Whereas, nations with a low IDV score, such as Colombia,
Brazil, and Guatemala, tend to fulfill obligations to family / team members rather than
focusing on oneself. An example of an accident that involved a low IDV score is the
crash of Avianca flight 52 in 1990, from Medellin to John F. Kennedy airport in New

135
York. The crew did not declare a mayday regarding their critical fuel situation, as they
did not feel comfortable being positioned ahead of the other traffic (Salas, Wilson, Burke,
Wightman, & Howse, 2006).
In summary, the analyses of the data gathered identified three significant aspects
of the operations at Air MENA.
A majority of the unsafe performance events occurred at the Hub where
captains and first officers can command the flight. This result is a strong
indication that these events were due to low experience levels by the first
officers who have little experience in dealing with the CRM skills that can be
highly influenced by national culture, along with aircraft handling and
technical knowledge that are still being perfected.
Heterogeneous nationality combinations resulted in more unsafe performance
events than homogeneous nationality combinations. This result corroborates
with the literature reviews’ discussion of the cross-cultural implications and
its effect on safety performance.
Nationality combinations with high PDI and IDV scores significantly
contributed to unsafe performance events in the data set; Table 14 lists the top
three nationality combinations committing unsafe performance events by
captains and first officers with high PDI or IDV. Their authoritarian
characteristics and individualistic attitudes may jeopardize the overall safety
of the flight. From the discriminant analysis group membership categories,
captains and first officers from these three continents accounted for 46.67%
and 66.67%, respectively, of the unsafe performance events.

136
Table 14
High PDI or IDV Dimensions by Nationality Combinations
Asia /
Pacific Europe MENA Total
Captain 21.3% 38.2% 15.2% 74.7%
First Officer 22.8% 34.7% 27.0% 84.5%
Recommendations
Based on the results of this study, it was revealed that there is a significant
association between unsafe performance events and first officers’ age. Due to the first
officers’ young age range, their experience level is considered to be low. As cadet pilots,
they graduate from flight school with approximately 250 hours, which may contribute to
the association between first officers’ age and unsafe performance events. Air MENA’s
cadet program should be reviewed to allow young cadets to gain more experience before
operating on a jet aircraft.
Increasing the age requirement for cadets alone would not solve the issue;
Air MENA should consider collaboration with neighboring operators with turboprop
aircraft. Integrating turboprop operations into the cadet program would enable cadet
pilots to gain more experience and improve their flying skills prior to operating on a jet
aircraft. Allowing cadets to operate on turboprops would improve their transition to the
jet aircraft by providing more hands-on-flying opportunities while being exposed to
varying flight conditions, such as weather, terrain, ATC influences, language / accent
barriers, etc.

137
The Hub airport contributed to 36.67% of the unsafe performance events.
Coincidentally, captains and first officers are eligible to command the flight to the Hub
airport. In addition to the fact that first officers have been at the controls, two other
important factors must be taken into consideration. First, the Hub airport is known for
having increased workload due to unstandardized air traffic management, particularly
during peak hours by providing numerous radar vectors and altitude / speed constraints
during critical phases of the flight. It is recommended that Air MENA collaborate with
the Hub’s Air Traffic Management to develop a structured and standardized arrival and
departure procedures that would minimize ATC’s instructions during critical phases of
the flight. This standardization would reduce the workload on pilots and allow them to
properly manage their flight. As a result, errors committed by pilots and ATC should be
minimized.
Second, since Air MENA’s arrivals are either early mornings or late evenings,
pilots are exposed to continuous variations in flight schedules. Given the nature of Air
MENA’s global network, pilots are exposed to multiple time zone changes. It is
recommended that Air MENA conduct a fatigue study to analyze the impact of flight
schedules and time zone changes on pilots. Fatigue, coupled with low experience levels,
poor ATC management, and cross-cultural crewmembers, may impact the overall safety
of Air MENA’s operations.
The pilot population at Air MENA during the study’s time period included 97
nationalities, the majority of which speak English as a second language. In order to
improve the communication skills among pilots, it is recommended that the GCAA
increase the standards of required English skills to attain a commercial pilot license. This

138
regulation improvement would facilitate better communication skills among pilots and
avoid misunderstandings during critical phases of the flight.
Dissemination of information may aid in increasing awareness and safety levels
among pilots. Unsafe performance events records may be presented to the pilots in a form
of safety bulletins, quarterly / annual reports, or destination specific safety factors that
pilots can review and brief before arrival at the given destination.
It is recommended that airlines adopt a new software that would function as a
complete source for crewmembers’ information that ranges from basic information, such
as date of birth and nationality, to committed events, flight patterns, and training records.
This software would provide airlines with an easier method of data collection that would
aid in identifying trends and operational deficiencies through reliable analyses.
The current CRM syllabus at Air MENA encompasses the standard training
elements with a focus on non-technical skills and TEM. Because CRM is not culturally
calibrated, it is recommended to develop a seventh generation for CRM that would
include CCAAP in its training curriculum. The seventh generation CRM, Cross-Cultural
Crew Resource Management, or C3RM, would provide the standard non-technical skills
and TEM training, while integrating CCAAP throughout the curriculum. Figure 24
depicts a flow chart of the seventh generation CRM. A brief explanation of each element
and the flow process are also depicted.
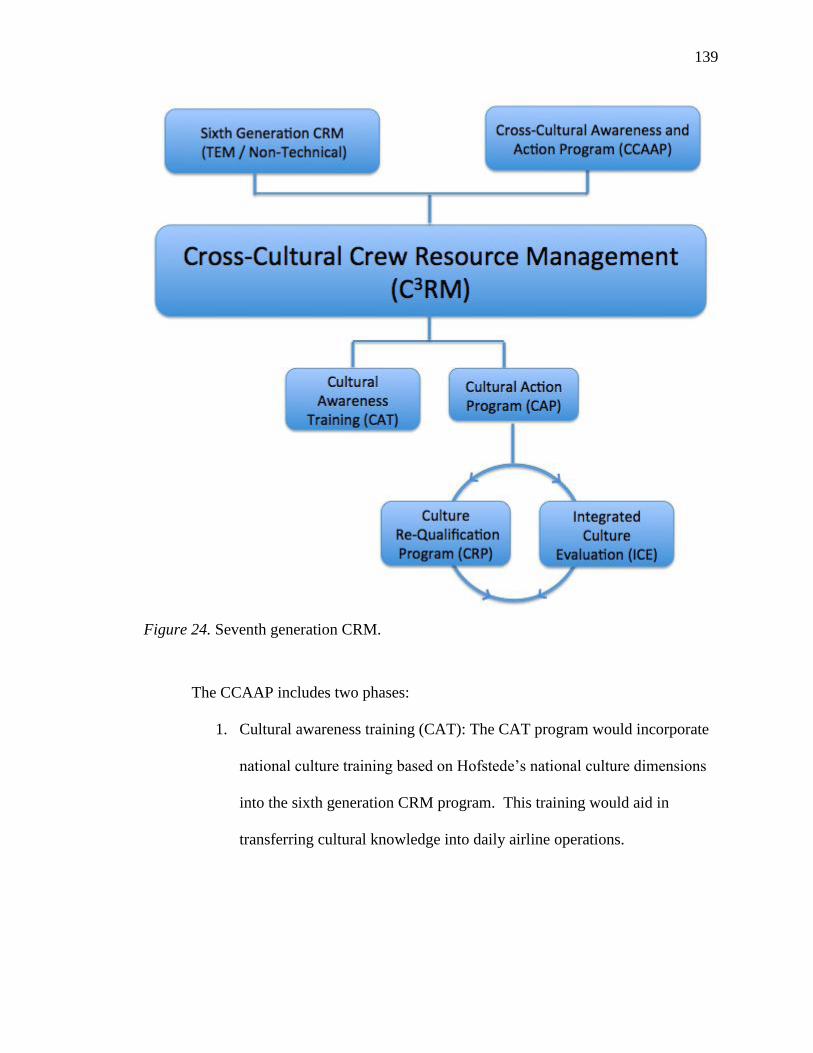
139
Figure 24. Seventh generation CRM.
The CCAAP includes two phases:
1. Cultural awareness training (CAT): The CAT program would incorporate
national culture training based on Hofstede’s national culture dimensions
into the sixth generation CRM program. This training would aid in
transferring cultural knowledge into daily airline operations.

140
2. Cultural action program (CAP): The CAP would involve the evaluation of
integrated cultural awareness training into normal line operations and
training.
a. The line operations phase would be known as Integrated Culture
Evaluation (ICE) and can be conducted in parallel with a Line
Operations Safety Audit (LOSA). “A LOSA is a formal process
that requires expert and highly trained observers to ride the jump
seat during regularly scheduled flights to collect safety-related data
on environmental conditions, operational complexity, and flight
crew performance” (FAA, 2006b, p. 2).
b. The training phase would be known as culture re-qualification
program (CRP) that would be conducted in parallel with an AQP.
Recommendations for Future Research. Future research should examine the
impact of additional covariates on the association between nationality combinations and
unsafe performance events. This approach would aid in providing an in-depth analysis of
the effects of external factors on the association between nationality combinations and
unsafe performance events. The following is a list of possible covariates that may be
explored further:
1. Flight Hours: obtaining the total number of flights hours before and after
joining the airline, and at the time of the unsafe performance event(s)
would depict a clear picture of the level of experience attained by each
pilot involved in unsafe performance events. Also, categorizing these
hours by fleet type would aid in conducting an in-depth analysis.

141
2. Training Records: obtaining training records for each pilot involved in
unsafe performance events would provide viable quantitative and
qualitative data that may be used for a more thorough analysis. Moreover,
future research should also review the type of commercial licenses
obtained (FAA or JAA), location of training, and if the pilot has instructor
credentials.
3. Fleet: incorporating fleet type as a covariate would provide essential
information about the level of operations conducted per fleet.
4. Arrival / Departure Times: reviewing arrival and departure times would
aid in understanding flight schedules and how they may affect fatigue
levels.
5. Repetition of events by pilots: identifying repeated unsafe performance
events and pilots who are continuously conducting unsafe performance
events would aid in identifying potential trends and operational
deficiencies.
Future research may also conduct a FMAQ that is designed to address national,
professional, and organizational cultures and identify their effects on cross-cultural pilot
performances (Sexton et al., 2001). In addition to FMAQ, conducting interviews with
pilots involved in unsafe performance events would provide important qualitative
information that would not be possible to attain from FOQA data. Interaction with the
human element involved in the study provides added value and strengthens the analyses.
Depending on the availability of a LOSA program, LOSA records may be integrated in
142
the analysis of FMAQ in order to identify possible operational deficiencies according to
various factors, such as fleet type, airport, and phase of flight.
Reviewing training records would aid in identifying possible trends and
deficiencies. Training records are a valuable source of information and should be
explored in future research. This approach would allow the operators to develop
operational defense systems through proactive and predictive safety strategies.
Collecting and managing pilots’ information, such as flight time, flight schedules,
and unsafe performance events, would aid in conducting more comprehensive analyses.
This approach would take into account additional variables that may influence unsafe
performance events. It is recommended that airlines incorporate such variables in future
research.
Future research should analyze flights that do not involve unsafe performance
events. This approach would allow a comprehensive analysis of nationality combinations
with and without unsafe performance events, while exploring various covariates.
Incorporation of flights without unsafe performance events would strengthen the analysis
by narrowing the type of nationality combinations that are prone to committing unsafe
performance events.
Finally, future research may also explore cross-cultural implications on cabin
crew, ground engineers, and turn-around supervisors’ safety performance levels. A
research study that encompasses cabin crew and ground staff would provide a stronger
picture of the overall operational status.
The safety of daily operations is often impacted by factors such as on-time
performance targets that would impose the ‘rush’ factor on different crewmembers.

143
Having cross-cultural crew in the flight deck, cabin, and on the ground presents
formidable challenges that many airlines face today.

144
REFERENCES
Aerobytes (2014). Company news. Retrieved from http://www.aerobytes.co.uk/news.htm
Aigoin, G. (2012). Characterising hard landings. Retrieved from
http://easa.europa.eu/essi/ecast/wp-content/uploads/2012/01/AIGOIN-
Characterising-hard-landings.pdf
Al Abed, I., & Hellyer, P. (2001). United Arab Emirates: A new perspective. London,
UK: Trident Press Ltd.
Alderson, J. C. (2009). Air safety, language assessment policy, and policy
implementation: The case of aviation English. Annual Review of Applied
Linguistics, 29, 168-187.
Al-Romaithi, S. A. K. (2006). An airline ab initio flight training program in the United
Arab Emirates (UAE): An analytical approach toward emiratization
(Unpublished master’s thesis). Embry-Riddle Aeronautical University, Daytona
Beach, Florida.
Anna Aero. (2013). The great ‘MEB3’ analysis: Emirates, Etihad, Qatar networks and
fleets compared. Retrieved from http://www.anna.aero/2011/02/23/the-great-
meb3-analysis/
Antonsen, A. (2009). Safety culture and the issue of power. Safety Science, 47, 183-191.
Arnold, T. (2011, November 15). 33,000 pilots to be recruited in the Middle East over 20
years. The National. Retrieved from http://www.thenational.ae/thenational
conversation/industry-insights/aviation/33-000-pilots-to-be-recruited-in-middle-
east-over-20-years
145
Babbie, E. (2010). The practice of social research (12th ed.). Belmont, CA: Wadsworth
Cengage Learning.
Barak, M. E. M. (2011). Managing diversity toward a globally inclusive workplace
(2nd ed.). Thousand Oaks, CA: Sage Publications.
Barinaga, E. (2007). ‘Cultural diversity’ at work: ‘National culture’ as a discourse
organizing an international project group. Human Relations, 60(2), 315.
Betancourt, J. R. (2003). Cross-cultural medical education: Conceptual approaches and
frameworks for evaluation. Journal of the Association of American Medical
Colleges, 78(6), 560-569.
Betancourt, J. R., & Cervantes, M. C. (2009). Cross-cultural medical education in the
United States: Key principles and experiences. Med Sci, 25, 471-478.
Black, T. (1999). Doing quantitative research in the social sciences: An integrated
approach to research design, measurement and statistics. Thousand Oaks, CA:
Sage Publications.
Brace, N., Kemp, R., & Snelgar, R. (2009). SPSS for psychologists (4th ed.). New York,
NY: Palgrave Macmillan.
Bradley, A. (2010). Developing an effective team approach to threat and error
management in an aviation organization. Retrieved from http://www.scribd.com
/doc/52880038/Developing-an-Effective-Team-Approach-to-Threat-and-Error-
Management-in-an-Aviation-Organization
Brady, T. (2000). The American aviation experience: A history. Carbondale, IL: Southern
Illinois University Press.

146
Carbary, S. (2011). Careers in aviation ready to take off. Retrieved from
file:///C:/Users/user/Desktop/Prospectus/References/careers-in-aviation-ready-to-
takeoff.htm
Central Intelligence Agency. (2012). The world factbook. Retrieved from
https://www.cia.gov/library/publications/the-world-factbook/geos/ae.html
Choudhry, R. M., Fang, D., & Mohamed, S. (2007). The nature of safety culture: A
survey of the state-of-the-art. Safety Science,45(10), 993-1012.
Corporate Communications. (2012, November 4). Air MENA ninth anniversary
[Electronic mailing list message].
Coury, B. G., Ellingstad, V. S., & Kolly, J. M. (2010). Transportation accident
investigation: The development of human factors research and practice. Reviews
of Human Factors and Ergonomics. Retrieved from Sage Journal online
database.
Cox, S., Jones, B., & Rycraft, H. (2004). Behavioral approaches to safety management
within UK reactor plants. Safety Science, 42, 825-839.
Croft, J. (2013). Asiana 214 pilot hints at autothrottle confusion. Retrieved from
http://www.aviationweek.com/Article.aspx?id=/article-xml/awx_07_09_2013_p0-
595503.xml
Daft, R. L. (2007). Organization theory and design (10th ed.). Mason, OH: South-
Western Cengage Learning.

147
Dekker, S. (2006a). Resilience engineering: Chronicling the emergence of confused
consensus. In E. Hollnagel, D. Woods, & N. Leveson (Eds.), Resilience
engineering. Concepts and precepts (pp. 77-92). Burlington, VT: Ashgate
Publishing Company.
Dekker, S. (2006b). The field guide to understanding human error. Burlington, VT:
Ashgate Publishing Company.
Dong, K., & Liu, Y. (2010). Cross-cultural management in China. Cross Cultural
Management: An International Journal, 17(3), 223-243.
Drogoul, F., Kinnersly, S., Roelen, A., & Kirwan, B. (2007). Safety in design - Can one
industry learn from another? Safety Science, 45, 129-153.
Edkins, G., & Pfister, P. (2003). Innovation and consolidation in aviation. Burlington,
VT: Ashgate Publishing Company.
Farrow, D. R. (2006, April). Advanced Qualification Program (AQP) 101. Presented at
the Shared Vision of Aviation Safety Conference, Denver, CO.
Federal Aviation Administration. (2004a). Crew resource management training.
[Advisory Circular 120-51E]. Retrieved from http://rgl.faa.gov/Regulatory_
and_Guidanc e_ Library/rgAdvisoryCircular.nsf/list/AC%20120-51E/$FILE/
AC120-51e.pdf
Federal Aviation Administration. (2004b). Flight Operational Quality Assurance.
Advisory Circular 120-82. Retrieved from http://rgl.faa.gov/Regulatory_and
_Guidance _Library/rgAdvisoryCircular.nsf/list/AC%20120-82/$FILE/AC120-
82.pdf

148
Federal Aviation Administration. (2006a). Advanced qualification program.
[Advisory Circular 120-54A]. Retrieved from http://rgl.faa.gov/Regulatory_and_
Guidance_Library/rgAdvisoryCircular.nsf/0/1ef8eee828670517862571a20064a40
b/$FIL E/AC%20120-54a.pdf
Federal Aviation Administration. (2006b). Line operations safety audits. [Advisory
Circular 120-90]. Retrieved from http://flightsafety.org/files/AC-20120-9011.pdf
Federal Aviation Administration. (2009). Airborne pilot deviations. Retrieved from
http://www.faasafety.gov/SPANS/noticeView.aspx?nid=2038
Federal Aviation Administration. (2010). Safety management systems for aviation service
providers. [Advisory Circular 120-92A]. Retrieved from http://rgl.faa.gov/
Regulatory_and_Guidance_Library/rgAdvisoryCircular.nsf/0/678110f11b843372
8625777d0068d732/$FILE/ac%20120-92a.pdf
Federal Aviation Administration. (2013). Flight operational quality assurance. Retrieved
from http://www.faa.gov/about/initiatives/atos/air_carrier/foqa/
Ferguson, C. (2013, August 25). UAE gets thumbs up as top expat location. Khaleej
Times. Retrieved from http://www.khaleejtimes.com
Fitzgerald, M. K. (2005). Safety performance improvement through culture change.
Process Safety Environment Protection, 83(B4), 324-330.
Flight Data Monitoring System & Operations Manual. (2012). Retrieved from Air
MENA.
Flin, R., Martin, L., Goeters, K., Hoermann, J., Amalberti, R., Valot, C., & Nijhuis, H.
(2003). Development of the NOTECHS (non-technical skills) systems for
assessing pilots’ CRM skills. Human Factors and Aerospace Safety, 3, 95-117.

149
Gadd, S., & Collins, A. M. (2002). Safety culture: A review of the literature. Health &
Safety Laboratory. Retrieved from http://www.hse.gov.uk/research/hsl_pdf/
2002/hsl02-25.pdf
Gale, I. (2011, May 19). 600 pilots needed in budget carrier flydubai’s expansion. The
National. Retrieved from http://www.thenational.ae/business/travel-tourism/600-
pilots-needed-in-budget-carrier-flydubais-expansion
General Civil Aviation Authority. (2013a). GCAA strategic plan 2011-2013.
Retrieved from http://www.gcaa.gov.ae/images/datafiles/StrategicPlan/
GCAA%20 STRATEGIC%20PLAN%202011-2013-English.pdf
General Civil Aviation Authority. (2013b). Operational regulations CAR- OPS:
Commercial & private air transportation (Aeroplanes). Retrieved from
http://www.gcaa.gov.ae/en/epublication/pages/cars.aspx?CertID=CARs
George, D., & Mallery, P. (2000). SPSS for windows step by step: A simple guide and
reference 9.0 update (2nd ed.). Needham Heights, MA: Allyn & Bacon.
George, F. (2010). Statistics point the way to safety. Business & Commercial Aviation,
106(9), 52. Retrieved September 29, 2011, from Proquest database.
Ginn, K. (2004, November 13). Error of doom; It was the worst disaster ever to hit the
offshore oil industry, with 167 men dying as giant fireballs tore through the Piper
Alpha platform. Could all this have been caused by a few rubber mats? Daily
Mail. Retrieved from ProQuest database.
Glass, A. (2008). GCC facing ‘serious’ pilot shortage. Retrieved from
http://www.arabianbusiness.com/gcc-facing-serious-pilot-shortage-52039.html

150
Gordon, R. P. E. (1998). The contribution of human factors to accidents in the offshore
oil industry. Reliability Engineering and System Safety, 61, 95-108.
Griswold, W. (2013). Cultures and societies in a changing world (4th ed.). Thousand
Oaks, CA: Sage Publications.
Gross, M. (2006). Outcomes and attitudes: Lessons learned from pilots. Canadian
Journal of Surgery, 49, 1.
Haber, S. B., & Shurberg, D. A. (2002). Assessing safety culture in an organizational
context. IEEE 7th Human Factors Meeting. Retrieved from ProQuest database.
Hahn, M. (2010). The cultural context of organizations. Retrieved from
http://ezinearticles.com/?The-Cultural-Context-of-Organizations&id=5402780
Hansman, R. J. (2001). Complexity in aircraft automation - A precursor for concerns in
human-automation systems. National Forum, 81(1), 30. Retrieved from ProQuest
database.
Harris, D., & Muir, H. C. (2005). Contemporary issues in human factors and aviation
safety. Burlington, VT: Ashgate Publishing Limited.
Hayward, B. (1997). Culture, CRM and aviation safety. The Australian Aviation
Psychology Association. Retrieved from ProQuest database.
Health and Safety Executive. (2009). Reducing error and influencing behavior. Retrieved
from http://www.hseni.gov.uk/hsg_48_reducing_error_and_influencing_
behaviour.pdf
Helmreich, R. L. (1999). Building safety on the three cultures of aviation. Proceedings
of the IATA Human Factors Seminar, Thailand.
151
Helmreich, R. L. (2000a). Culture and error in space: Implications from analog
environments. Aviation, Space, and Environmental Medicine, 71(9-11), 133-139.
Helmreich, R. L. (2000b). Resource management in aviation: Coping with culture and
error. SAS Training Symposium, Copenhagen, Denmark. Retrieved from ProQuest
Central database.
Helmreich, R. L. (2008). Culture, threat, and error: Assessing system safety. Safety
in Aviation: The Management Commitment. Proceedings of a Conference at the
meeting of Royal Aeronautical Society, UK.
Helmreich, R. L., Chidester, T. R., Foushee, H. C., Gregorich, S. E., & Wilhelm, J. A.
(1990). How effective is cockpit resource management training? Issues in
evaluating the impact of programs to enhance crew coordination. Flight Safety
Digest, 9(5), 1-17.
Helmreich, R. L., Klinect, J., & Wilhelm, J. (2001a). System safety and threat and error
management: Line Operational Safety Audit (LOSA). Paper Presented at the 12th
Annual Symposium on Aviation Psychology, Columbus, Ohio.
Helmreich, R. L., & Merritt, A. C. (2000). Safety and error management: The role of
crew resource management. Aviation Resource Management (pp. 107-119).
Austin, TX: University of Texas.
Helmreich, R. L., & Merritt, A. C. (2003). Culture at work in aviation and medicine.
Burlington, VT: Ashgate Publishing Company.
Helmreich, R. L., Merritt, A. C., & Wilhelm, J. A. (1999). The evolution of crew
resource management training in commercial aviation. The International Journal
of Aviation Psychology, 9(1), 19-32.
152
Helmreich, R. L., & Wilhelm, J. A. (1998). CRM and culture: National, professional,
organizational, safety. Proceedings of the Ninth International Symposium on
Aviation Psychology, Columbus, OH: The Ohio State University.
Helmreich, R. L., Wilhelm, J. A., Klinect, J. R., & Merritt, A. C. (2001). Culture, error,
and crew resource management. Improving Teamwork in Organizations
(pp. 305-331). Hillsdale, NJ: Erlbaum.
Hofstede, G. (2001). Culture’s consequences: Comparing values, behaviors, institutions,
and organizations across nations (2nd ed.). Thousand Oaks, CA: Sage
Publications.
Hofstede, G., Hofstede, G. J., & Minkov, M. (2010). Cultures and organizations:
Software of the mind (3rd ed.). New York, NY: McGraw-Hill.
Høivik, D., Moen, B. E., Mearns, K., & Haukelid, K. (2009). An explorative study of
health, safety and environment culture in a Norwegian petroleum company. Safety
Science, 47, 992-1001.
Hollnagel, E., & Woods, D. (2006). Epilogue: Resilience engineering precepts. In
E. Hollnagel, D. Woods, & N. Leveson (Eds.), Resilience engineering. Concepts
and precepts (pp. 347-358). Burlington, VT: Ashgate Publishing Company.
Horck, J. (2008). Cultural and gender diversities affecting the ship/port interface:
Maritime education and training efforts to bridge diversity gaps. Retrieved from
http://www.he-alert.org/documents/published/he00765.pdf
Hosmer, D., Lemeshow, S., & Sturdivant, R. (2013). Applied logistic regression
(3rd ed.). New York, NY: John Wiley and Sons.
153
Howitt, D., & Cramer, D. (2011). Introduction to SPSS statistics in psychology for
version 19 and earlier (5th ed.). Essex, UK: Pearson Education Limited.
Hutchins, E., Holder, B. E., & Pérez, R. A. (2002). Culture and flight deck operations.
Retrieved from ProQuest database.
International Air Transport Association. (2010). Safety Report 2009 (46th ed.).
Montreal, Canada: IATA.
International Air Transport Association. (2012). Safety Report 2011 (48th ed.).
Montreal, Canada: IATA.
International Civil Aviation Organization. (2006). Safety Management Manual (SMM)
(1st ed.) (Doc 9859 AN/460). Montréal, Canada: ICAO.
International Civil Aviation Organization. (2013). International airline and airport
statistics [ICAO database]. Retrieved from ICAO database.
International UAE: Airline jobs soar. (2011). Business and Economics: Personnel
Management, Occupations and Careers. Retrieved from ProQuest Central
database.
James, R. (2011). CRM training manual for pilots. Retrieved from Air MENA,
Flight Operations Department.
Jones, R. (2012). Aviation provides big lift for UAE economy. Retrieved from
http://www.thenational.ae/thenationalconversation/industry-insights/aviation/
aviation-provides-big-lift-for-uae-economy
Kanki, B. G., Helmreich, R. L., & Anca, J. (2010). Crew resource management
(2nd ed.). San Diego, CA: Elsevier Inc.

154
Kelly, T., & Patankar, M. S. (2004). Comparison of organizational safety cultures at two
aviation organizations. Safety Across High-Consequence Industries (pp. 71-76).
St. Louis, MO.
Kinnersley, S., & Roelen, A. (2007). The contribution of design to accidents. Safety
Science, 45(1-2), 31-60.
Klinect, J. R. (2005). Line operations safety audit: A cockpit observation methodology for
monitoring commercial airline safety performance (doctoral dissertation).
Retrieved from ProQuest database.
Klinect, J. R., Wilhelm, J. A., & Helmreich, R. L. (1999). Threat and error management:
Data from line operations safety audits. Proceedings of the Tenth International
Symposium on Aviation Psychology (pp. 683-688). Columbus, OH: The Ohio
State University.
Lee, T., & Harrison, K. (2000). Assessing safety culture in nuclear power stations. Safety
Science, 34, 61-97.
Lee, J. D., & See, K. A. (2004). Trust in automation: Designing for appropriate reliance.
The Journal of the Human Factors and Ergonomics Society, 46(1), 50-80.
Lichacz, F. M. J. (2008). A brief examination of how situation awareness and confidence
are affected in a simulated multinational coalition C2 headquarters. Proceedings
of the Human Factors and Ergonomics Society 52nd Annual Meeting. Retrieved
from ProQuest database.
Lowy, J. (2012). Possible pilot shortage raises safety concerns. Retrieved from
http://news.yahoo.com/possible-pilot-shortage-raises-safety-concerns-
221251529.html

155
Mariscal, M. A., Herrero, S. G., & Otero, A. T. (2012). Assessing safety culture in the
Spanish nuclear industry through the use of working groups. Safety Science, 50,
1237-1246.
McCartney, S. (2005, September 14). Reducing errors to make flights safer. The Wall
Street Journal Europe, p. A6.
Mearns, K., & Yule, S. (2009). The role of national culture in determining safety
performance: Challenges for the global oil and gas industry. Safety Science, 47,
777-785.
Meeuwesen, L., Brink-Muinen, A. V., & Hofstede, G. (2009). Can dimensions of
national culture predict cross-national differences in medical communication?
Patient Education and Counseling, 75, 58-66.
Merritt, A. C. (1998). Replicating Hofstede: A study of pilots in eighteen countries.
Proceedings of the Ninth International Symposium on Aviation Psychology
(pp. 667-672). Columbus, OH: The Ohio State University.
Merritt, A. C. (2000). Culture in the cockpit: Do Hofstede’s dimensions replicate?
Journal of Cross Cultural Psychology, 31(3), 283, 301.
Merritt, A. C., & Helmreich, R. L. (1997). CRM: I hate it, what is it? (Error, stress,
culture). Proceedings of the Orient Airlines Association Air Safety
Seminar (pp. 123-134). Jakarta, Indonesia: Association of Asia Pacific
Airlines.
Meshkati, N. (1998). Lessons of Chernobyl and beyond: Creation of the safety culture in
nuclear power plants. Proceedings of the Human Factors and Ergonomics Society
42nd Annual Meeting. Retrieved from ProQuest database.

156
Mittal, R. (2012). High performance work systems: A cross-cultural perspective. Journal
of International Business and Cultural Studies, 6, 1-10. Retrieved from ProQuest
database.
Mjøs, K. (2004). Basic cultural elements affecting the team function on the flight deck.
The International Journal of Aviation Psychology, 14(2), 151-169.
Moran, R. T., Harris, P. R., & Moran, S. V. (2011). Managing cultural differences:
Leadership skills and strategies for working in a global world (8th ed.).
Burlington, MA: Butterworth-Heinemann.
Mumaw, R. J., & Holder, B. E. (2002). What do cultural dimensions reveal about flight
deck operations? Proceedings of the Human Factors and Ergonomics Society
46th Annual Meeting. Retrieved from SAGE Journals online database.
National Bank of Dubai (NBD). (2005, January). Emiratization efforts in the UAE:
Impediments to a serious vision, 4(4). Retrieved from
http://www.nbd.com/NBD/NBD_CDA /CDA_Document_Library/
National Transportation Safety Board. (2009). Allision of Hong Kong-Registered
Containership M/V Cosco Busan with the Delta Tower of the San Francisco-
Oakland Bay Bridge. Retrieved from http://www.ntsb.gov/doclib/reports/2009
/MAR0901.pdf
Operations Manual Part A. (2012a). Air Safety Report - List of Reportable Occurrences.
Retrieved from Air MENA.
Operations Manual Part A. (2012b). Airport Categories. Retrieved from Air MENA.
Operations Manual Part A. (2012c). Flight Procedures. Retrieved from Air MENA.
Operations Manual Part A. (2012d). Stabilization Criteria. Retrieved from Air MENA.
157
Operations Manual Part A. (2012e). Ultra Long Flight Operations. Retrieved from
Air MENA.
Oxford Economics. (2009). Economic benefits from air transport in the UAE. Retrieved
from http://www.benefitsofaviation.aero/Documents/Benefits-of-Aviation-UAE-
2011.pdf
Pampel, F. (2000). Logistic regression: A primer. Thousand Oaks, CA: Sage
Publications.
Paté-Cornell, M. E. (1993). Learning from the Piper Alpha accident: A postmortem
analysis of technical and organizational factors. Risk Analysis, 13(2), 215-232.
Pekerti, A. A., & Thomas, D. C. (2003). Communication in intercultural interaction - An
empirical investigation of idiocentric and sociocentric communication styles.
Journal of Cross-Cultural Psychology, 34(2), 139-154.
Powell, S. M., & Hill, R. K. (2006). Home study program: My copilot is a nurse - using
crew resource management in the OR. Association of Operating Room Nurses.
AORN Journal, 83(1), 178-206.
Qabbani, B., & Shaheen, K. (2011). Unemployment rate for Emiratis stands at 13%.
Retrieved from http://www.thenational.ae/news/uae-news/unemployment-rate-
for-emiratis-stands-at-13
Reason, J. (1997). Managing the risks of organizational accidents. Burlington, VT:
Ashgate Publishing Company.
Reason, J. (1998). Achieving a safe culture: Theory and practice. Work & Stress, 12(3),
293-306. Department of Psychology, University of Manchester.
Reason, J. (2009). Human error. New York, NY: Cambridge University Press.

158
Roscoe, N. S. (1980). Aviation psychology. Ames, Iowa: State University Press.
Rothschild, S. K. (1998). Cross-cultural issues in primary care medicine. Disease-A-
Month, 44(7), 293-319.
Rovai, A. P., Baker, J. D., & Ponton, M. K. (2012). Social science research design and
statistics: A practitioner’s guide to research methods and IBM SPSS analysis.
Chesapeake, VA: Watertree Press LLC.
Salas, E., Bowers, C. A., & Edens, E. (2001). Improving teamwork in organizations:
Applications of resource management training. Mahwah, NJ: Lawrence Erlbaum
Associates.
Salas, E., Wilson, K. A., Burke, S., & Burke, C. S. (2006). Does crew resource
management training work? An update, an extension, and some critical needs.
Human Factors, 48, 2, 392-412.
Salas, E., Wilson, K. A., Burke, C. S., Wightman, D. C., & Howse, W. R. (2006). Crew
resource management training research, practice, and lessons learned. Reviews of
Human Factors and Ergonomics. Retrieved from SAGE Journals online database.
Sambidge, A. (2010). Emirates plans to recruit 700 new pilots by end - 2011. Retrieved
from http://www.arabianbusiness.com/emirates-plans-recruit-700-new-pilots-by-
end-2011-272142.html
Schmid, S. D. (2001). When safe enough is not good enough: Organizing safety at
Chernobyl. Bulleting of the Atomic Scientists, 67(2), 19-29.
Sexton, J. B., & Klinect, J. R. (2001). The link between safety attitudes and observed
performance in flight operations. Proceedings of the Eleventh International

159
Symposium on Aviation Psychology, pp.7-13. Columbus, OH: The Ohio State
University.
Sexton, J. B., Wilhelm, J. A., Helmreich, R. L., Merritt, A. C., & Klinect, J. R. (2001).
Flight management attitudes & safety survey. The University of Texas at Austin
Human Factors Research Project. Retrieved from ProQuest database.
Sharkey, J. (2012, May 22). English skills a concern as global aviation grows. New York
Times, p. B8.
Shaw-Smith, P. (2013, November 12). The global pilot shortage. Gulf Business.
Retrieved from http://gulfbusiness.com/2013/11/the-global-pilot-
shortage/#.Uwcqcq9DHIV
Sherman, P. J., Helmreich, R. L., & Merritt, A. C. (1997). National culture and flightdeck
automation: Results of a multi-nation survey. International Journal of Aviation
Psychology, 7(4), 311-329.
Smith, W. J., Singal, M., & Lamb, W. B. (2007). Corporate social orientation in Japan
and the USA: A cross-cultural comparison. International Journal of
Organizational Analysis, 15(3), 181. Retrieved from ProQuest database.
Snyder, G. H., Jr. (2007). In airline aviation. Flight Safety Foundation, 12-21.
Solomon, C. M., & Schell, M. S. (2009). Managing across cultures: The seven keys to
doing business with a global mindset. New York, NY: McGraw-Hill.
Statistics Centre - Abu Dhabi. (2011). Statistical yearbook of Abu Dhabi 2011. Retrieved
from http://www.scad.ae/Publications/YearBook/EBOOK_English_SYB_
2011.pdf

160
Stolzer, A. J., Halford, C. D., & Goglia, J. J. (2008). Safety management systems in
aviation. Burlington, VT: Ashgate.
Strauch, B. (2010). Can cultural differences lead to accidents? Team cultural differences
and sociotechnical system operations. The Journal of the Human Factors and
Ergonomics Society, 52(2), 246-263.
Tabachnick, B., & Fidell, L. (2001). Using multivariate statistics (4th ed.). New York,
NY: Harper Collins.
Thomas, D. C. (2008). Cross-cultural management: Essential concepts (2nd ed.).
Thousand Oaks, CA: Sage Publications.
Thomas, M. J. W. (2004). Predictors of threat and error management: Identification of
core nontechnical skills and implications for training systems design. The
International Journal of Aviation Psychology, 14(2), 207-231. Retrieved from
ProQuest database.
Tiewtrakul, T., & Fletcher, S. R. (2010). The challenge of regional accents for aviation
English language proficiency standards: A study of difficulties in understanding
in air traffic control - pilot communications. Ergonomics, 53(2), 229-239.
Tsang, P. S., & Vidulich, M. A. (2003). Principles and practice of aviation psychology.
Mahwah, NJ: Lawrence Erlbaum Associates, Inc.
United Nations. (2005). Population Division of the Department of Economic and Social
Affairs of the United Nations Secretariat. Retrieved from
http://esa.un.org/migration/index.asp?panel=1

161
Vespermann, J., Wald, A., & Gleich, R. (2008). Aviation growth in the Middle East -
Impacts on incumbent players and potential strategic reactions. Journal of
Transport Geography, 16(16), 388-394.
Vogt, W. P., Gardner, D. C., & Haettele, L. M. (2012). When to use what research
design. New York, NY: The Guilford Press.
Wells, A. T. (2001). Commercial aviation safety (3rd ed.). New York, NY: McGraw-Hill.
Wells, A. T., & Rodrigues, C. C. (2004). Commercial aviation safety (4th ed.). Fairfield,
NJ: McGraw-Hill.
Wiegmann, D. A., Zhang, H., von Thaden, T. L. V., Sharma, G., & Gibbons, A. M.
(2004). Safety culture: An integrative review. The International Journal of
Aviation Psychology, 14(2), 117-134.
Wise, J. A., Hopkin, V. D., & Garland, D. J. (2010). Handbook of aviation human
factors (2nd ed.). Boca Raton, FL: Taylor & Francis Group.
Yang, D. (2005). Culture matters to multinationals’ intellectual property businesses.
Journal of World Business, 40, 281-301.
Youngdahl, W. E., Ramaswamy, K., & Dash, K. C. (2010). Service offshoring: The
evolution of offshore operations. International Journal of Operations &
Production Management, 30(8), 798-820.
Zhang, H., Wiegmann, D. A., von Thaden, T. L. V., Sharma, G., & Mitchell, A. A.
(2002). Safety culture: A concept in chaos. Proceedings of the Human Factors
and Ergonomics Society Annual Meeting. Retrieved from SAGE Journal online
database.

162
Zoubir, Y. H. (1999). Doing business in the United Arab Emirates. Thunderbird
International Business Review, 41(2), 215-229. Retrieved from ProQuest Central
database.

163
APPENDIX A
Permission to Conduct Research

164

165
APPENDIX B
Air Safety Report (ASR)

166

167

168
APPENDIX C
Tables
C1 Hofstede’s Cultural Dimensions
C2 List of Variables
C3 Categories of Unsafe Performance Events
C4 List of Continents by Nationalities
C5 Destination Airports by Category
C6 Coefficients
C7 Casewise Diagnostics

169
Table C1
Hofstede’s Cultural Dimension
Country PDI IDV MAS UA ALGERIA 80 38 52 68 ARGENTINA 49 46 56 86 ARMENIA 66 37 45 85 AUSTRALIA 36 90 61 51 AUSTRIA 11 55 79 70 BAHRAIN 90 25 50 80 BANGLADESH 80 20 55 60 BELGIUM 65 75 54 91 BHUTAN 94 52 32 28 BOLIVIA 69 38 49 76 BOSNIA 73 33 40 80 BOTSWANA 60 35 40 50 BRAZIL 69 38 49 76 BRUNEI DARUSSALAM 104 26 50 36 BULGARIA 70 30 40 85 CANADA 39 80 52 48 CHILE 63 23 28 86 CHINA 80 20 66 30 COLOMBIA 67 13 64 80 COSTA RICA 35 15 21 86 COTE D IVOIRE 77 20 46 54 CROATIA 73 33 40 80 CYPRUS 66 37 45 85 DENMARK 18 74 16 23 DOMINICAN REP 65 30 65 45 EGYPT 80 38 52 68 EL SALVADOR 66 19 40 94 ETHIOPIA 70 20 65 55 FINLAND 33 63 26 59 FRANCE 68 71 43 86 FRENCH POLYNESIA 94 32 64 44 GERMANY 35 67 66 65 GREECE 60 35 57 112 GUATEMALA 95 6 37 101 HUNGARY 46 80 88 82 INDIA 77 48 56 40 INDONESIA 78 14 46 48 IRAN 58 41 43 59
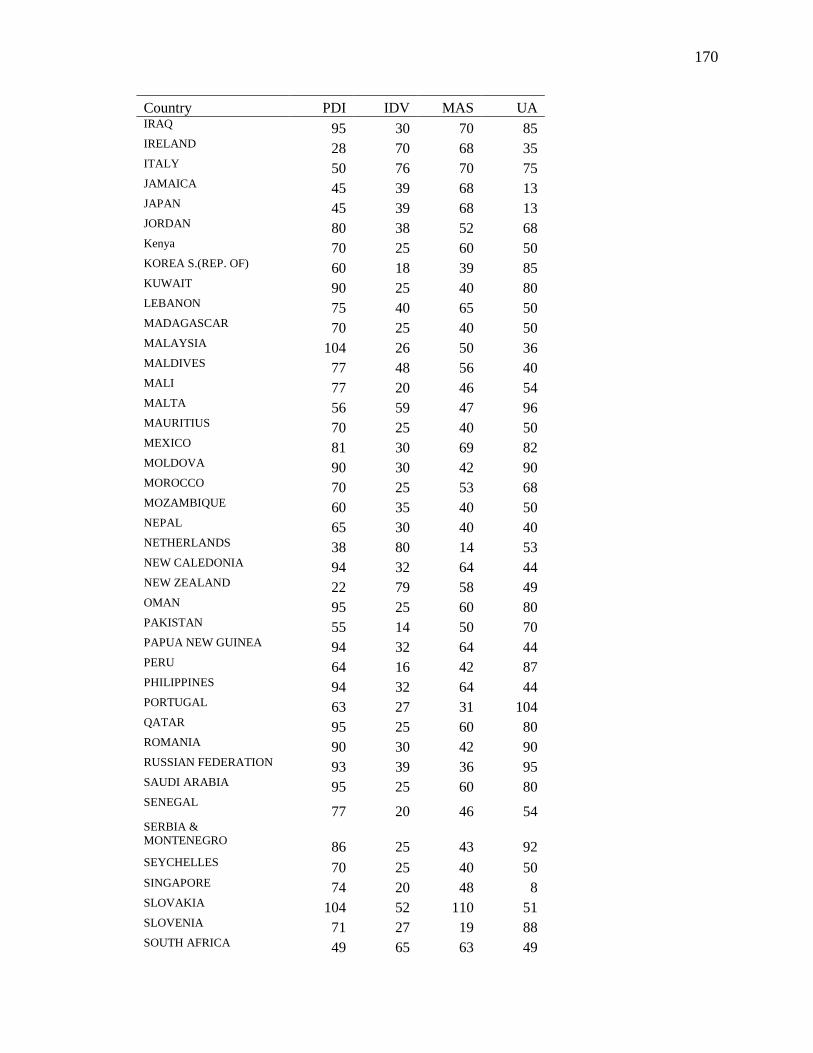
170
Country PDI IDV MAS UA IRAQ 95 30 70 85 IRELAND 28 70 68 35 ITALY 50 76 70 75 JAMAICA 45 39 68 13 JAPAN 45 39 68 13 JORDAN 80 38 52 68 Kenya 70 25 60 50 KOREA S.(REP. OF) 60 18 39 85 KUWAIT 90 25 40 80 LEBANON 75 40 65 50 MADAGASCAR 70 25 40 50 MALAYSIA 104 26 50 36 MALDIVES 77 48 56 40 MALI 77 20 46 54 MALTA 56 59 47 96 MAURITIUS 70 25 40 50 MEXICO 81 30 69 82 MOLDOVA 90 30 42 90 MOROCCO 70 25 53 68 MOZAMBIQUE 60 35 40 50 NEPAL 65 30 40 40 NETHERLANDS 38 80 14 53 NEW CALEDONIA 94 32 64 44 NEW ZEALAND 22 79 58 49 OMAN 95 25 60 80 PAKISTAN 55 14 50 70 PAPUA NEW GUINEA 94 32 64 44 PERU 64 16 42 87 PHILIPPINES 94 32 64 44 PORTUGAL 63 27 31 104 QATAR 95 25 60 80 ROMANIA 90 30 42 90 RUSSIAN FEDERATION 93 39 36 95 SAUDI ARABIA 95 25 60 80 SENEGAL
77 20 46 54 SERBIA &
MONTENEGRO 86 25 43 92
SEYCHELLES 70 25 40 50 SINGAPORE 74 20 48 8 SLOVAKIA 104 52 110 51 SLOVENIA 71 27 19 88 SOUTH AFRICA 49 65 63 49
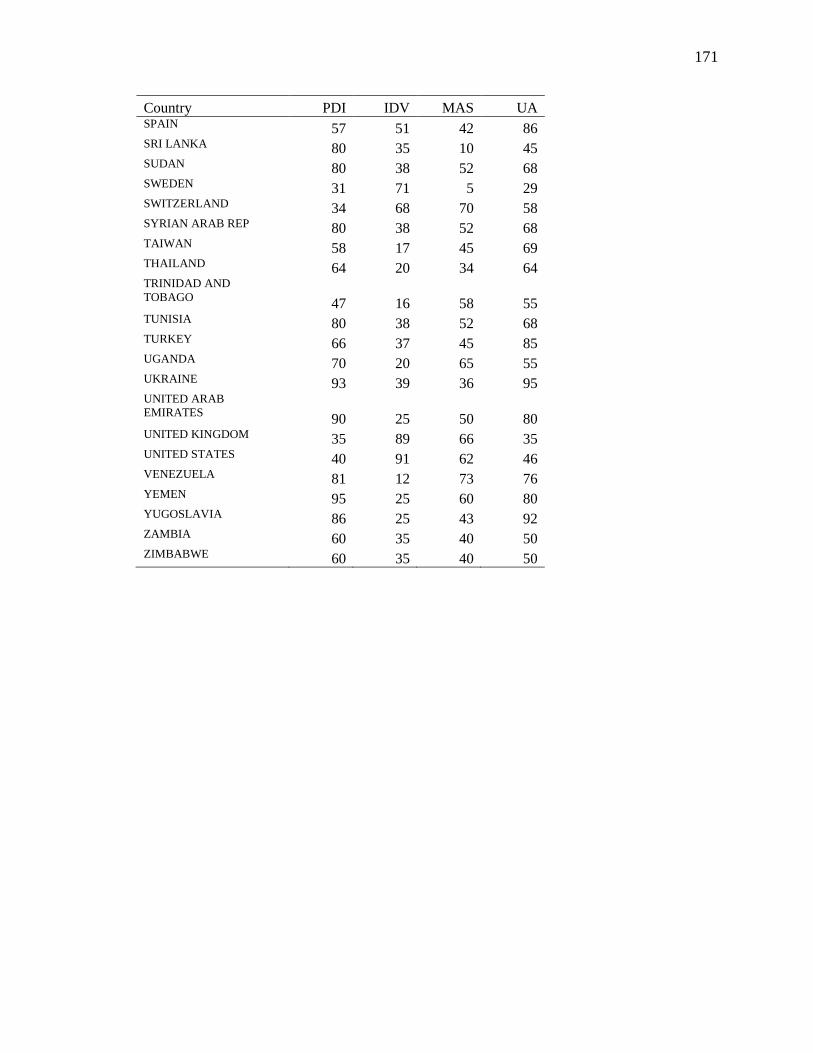
171
Country PDI IDV MAS UA SPAIN 57 51 42 86 SRI LANKA 80 35 10 45 SUDAN 80 38 52 68 SWEDEN 31 71 5 29 SWITZERLAND 34 68 70 58 SYRIAN ARAB REP 80 38 52 68 TAIWAN 58 17 45 69 THAILAND 64 20 34 64 TRINIDAD AND
TOBAGO 47 16 58 55
TUNISIA 80 38 52 68 TURKEY 66 37 45 85 UGANDA 70 20 65 55 UKRAINE 93 39 36 95 UNITED ARAB
EMIRATES 90 25 50 80
UNITED KINGDOM 35 89 66 35 UNITED STATES 40 91 62 46 VENEZUELA 81 12 73 76 YEMEN 95 25 60 80 YUGOSLAVIA 86 25 43 92 ZAMBIA 60 35 40 50 ZIMBABWE 60 35 40 50
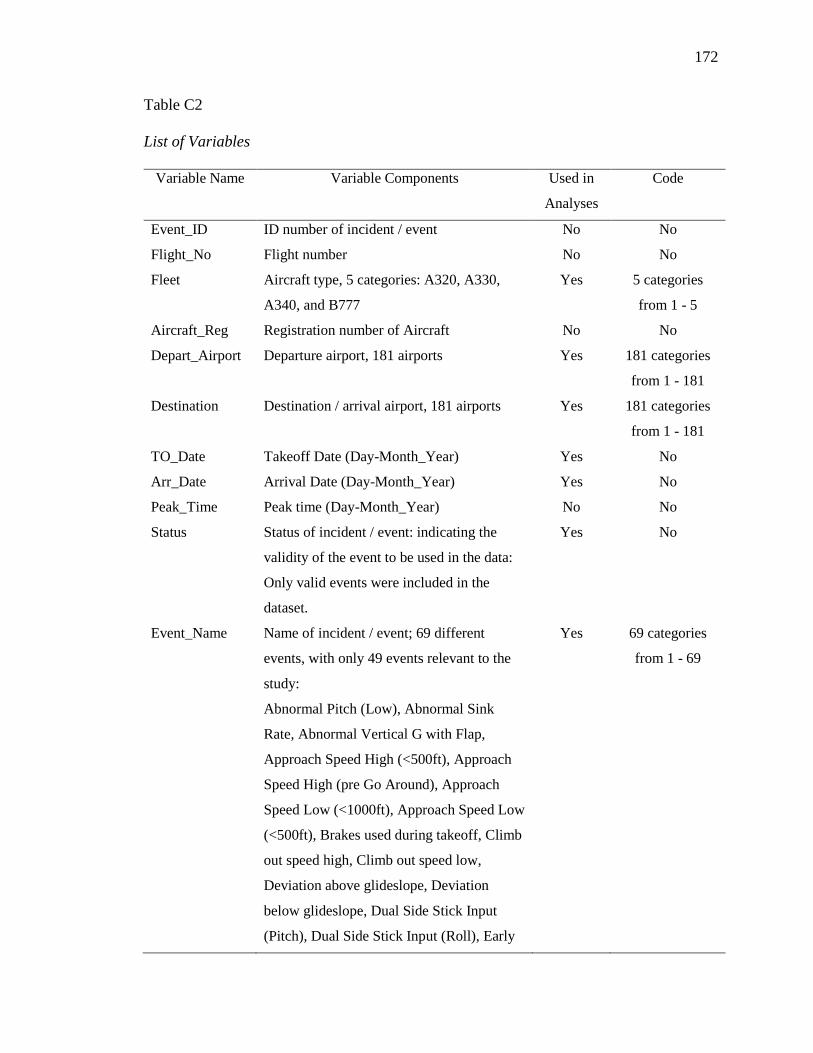
172
Table C2
List of Variables
Variable Name Variable Components Used in
Analyses
Code
Event_ID ID number of incident / event No No
Flight_No Flight number No No
Fleet Aircraft type, 5 categories: A320, A330,
A340, and B777
Yes 5 categories
from 1 - 5
Aircraft_Reg Registration number of Aircraft No No
Depart_Airport Departure airport, 181 airports Yes 181 categories
from 1 - 181
Destination Destination / arrival airport, 181 airports Yes 181 categories
from 1 - 181
TO_Date Takeoff Date (Day-Month_Year) Yes No
Arr_Date Arrival Date (Day-Month_Year) Yes No
Peak_Time Peak time (Day-Month_Year) No No
Status Status of incident / event: indicating the
validity of the event to be used in the data:
Only valid events were included in the
dataset.
Yes No
Event_Name Name of incident / event; 69 different
events, with only 49 events relevant to the
study:
Abnormal Pitch (Low), Abnormal Sink
Rate, Abnormal Vertical G with Flap,
Approach Speed High (<500ft), Approach
Speed High (pre Go Around), Approach
Speed Low (<1000ft), Approach Speed Low
(<500ft), Brakes used during takeoff, Climb
out speed high, Climb out speed low,
Deviation above glideslope, Deviation
below glideslope, Dual Side Stick Input
(Pitch), Dual Side Stick Input (Roll), Early
Yes 69 categories
from 1 - 69

173
Variable Name Variable Components Used in
Analyses
Code
config change after takeoff (height),
Excessive bank, Excessive bank after
takeoff (<1000ft), Excessive bank after
takeoff (<500ft), Excessive bank after
takeoff (<50ft), Excessive bank on approach
(<500ft), Excessive Bank on landing
(at touchdown), Excessive Bank on landing
(below Flare Ht), Flap Placard Speed
Exceeded, Gear Extension Speed Exceeded,
Gear Limiting Speed Exceeded, Gear
Retraction Speed Exceeded, GPWS
(GLIDESLOPE), GPWS (SINK RATE),
GPWS (TOO LOW FLAPS), High rate of
descent (<1000ft), High rate of descent
(<500ft), Late Initial Stabilisation
(Ht AAL), Late land flap (height AAL),
Late land gear, Late T/R Cancellation, Low
power on approach, Max operating altitude
exceeded, Overweight Landing, Pitch Low
(approach), Reverse Not Deployed After
Landing, Rough taxiing, Speed Brake not
armed for landing, Takeoff Weight Limit
Exceedance, Unstable approach (roll), and
Vmo/Mmo Exceeded.
Value_Name Specific kind of incident / event; 71
different categories: Airspeed - max vs
Vapp below 500 ft, Airspeed - max vs Vapp
pre-Go Around, Airspeed - max vs Vfe
(2 secs), Airspeed - max vs Vle (2 secs),
Airspeed - max vs Vlo ext (2 secs),
Airspeed - max vs Vlo ret (2 secs),
Airspeed - max vs Vref (500 to 50ft),
No No
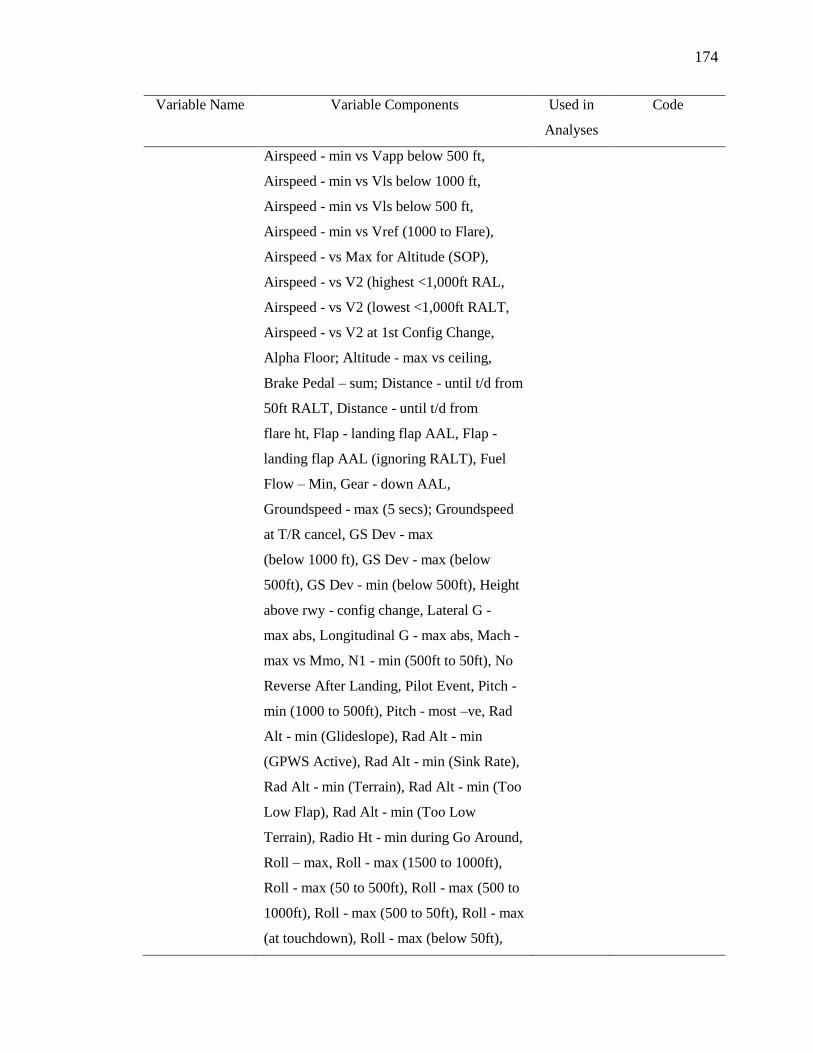
174
Variable Name Variable Components Used in
Analyses
Code
Airspeed - min vs Vapp below 500 ft,
Airspeed - min vs Vls below 1000 ft,
Airspeed - min vs Vls below 500 ft,
Airspeed - min vs Vref (1000 to Flare),
Airspeed - vs Max for Altitude (SOP),
Airspeed - vs V2 (highest <1,000ft RAL,
Airspeed - vs V2 (lowest <1,000ft RALT,
Airspeed - vs V2 at 1st Config Change,
Alpha Floor; Altitude - max vs ceiling,
Brake Pedal – sum; Distance - until t/d from
50ft RALT, Distance - until t/d from
flare ht, Flap - landing flap AAL, Flap -
landing flap AAL (ignoring RALT), Fuel
Flow – Min, Gear - down AAL,
Groundspeed - max (5 secs); Groundspeed
at T/R cancel, GS Dev - max
(below 1000 ft), GS Dev - max (below
500ft), GS Dev - min (below 500ft), Height
above rwy - config change, Lateral G -
max abs, Longitudinal G - max abs, Mach -
max vs Mmo, N1 - min (500ft to 50ft), No
Reverse After Landing, Pilot Event, Pitch -
min (1000 to 500ft), Pitch - most –ve, Rad
Alt - min (Glideslope), Rad Alt - min
(GPWS Active), Rad Alt - min (Sink Rate),
Rad Alt - min (Terrain), Rad Alt - min (Too
Low Flap), Rad Alt - min (Too Low
Terrain), Radio Ht - min during Go Around,
Roll – max, Roll - max (1500 to 1000ft),
Roll - max (50 to 500ft), Roll - max (500 to
1000ft), Roll - max (500 to 50ft), Roll - max
(at touchdown), Roll - max (below 50ft),
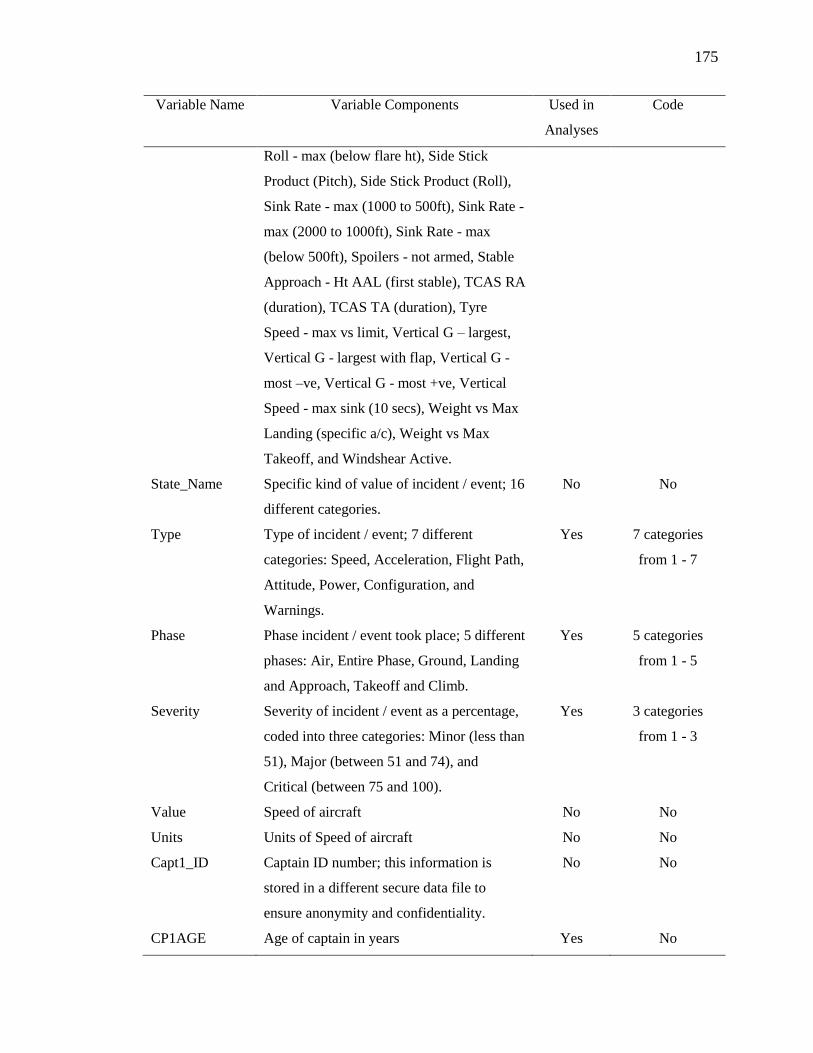
175
Variable Name Variable Components Used in
Analyses
Code
Roll - max (below flare ht), Side Stick
Product (Pitch), Side Stick Product (Roll),
Sink Rate - max (1000 to 500ft), Sink Rate -
max (2000 to 1000ft), Sink Rate - max
(below 500ft), Spoilers - not armed, Stable
Approach - Ht AAL (first stable), TCAS RA
(duration), TCAS TA (duration), Tyre
Speed - max vs limit, Vertical G – largest,
Vertical G - largest with flap, Vertical G -
most –ve, Vertical G - most +ve, Vertical
Speed - max sink (10 secs), Weight vs Max
Landing (specific a/c), Weight vs Max
Takeoff, and Windshear Active.
State_Name Specific kind of value of incident / event; 16
different categories.
No No
Type Type of incident / event; 7 different
categories: Speed, Acceleration, Flight Path,
Attitude, Power, Configuration, and
Warnings.
Yes 7 categories
from 1 - 7
Phase Phase incident / event took place; 5 different
phases: Air, Entire Phase, Ground, Landing
and Approach, Takeoff and Climb.
Yes 5 categories
from 1 - 5
Severity Severity of incident / event as a percentage,
coded into three categories: Minor (less than
51), Major (between 51 and 74), and
Critical (between 75 and 100).
Yes 3 categories
from 1 - 3
Value Speed of aircraft No No
Units Units of Speed of aircraft No No
Capt1_ID Captain ID number; this information is
stored in a different secure data file to
ensure anonymity and confidentiality.
No No
CP1AGE Age of captain in years Yes No

176
Variable Name Variable Components Used in
Analyses
Code
CP1NAT Nationality of captain Yes 7 continents
Capt1Country Country of captain No No
FO1_ID First officer ID number; this information is
stored in a different secure data file to
ensure anonymity and confidentiality.
No No
FO1AGE Age of First Officer in years Yes No
FO1NAT Nationality of first officer Yes 7 continents
FO1Country Country of first officer No No
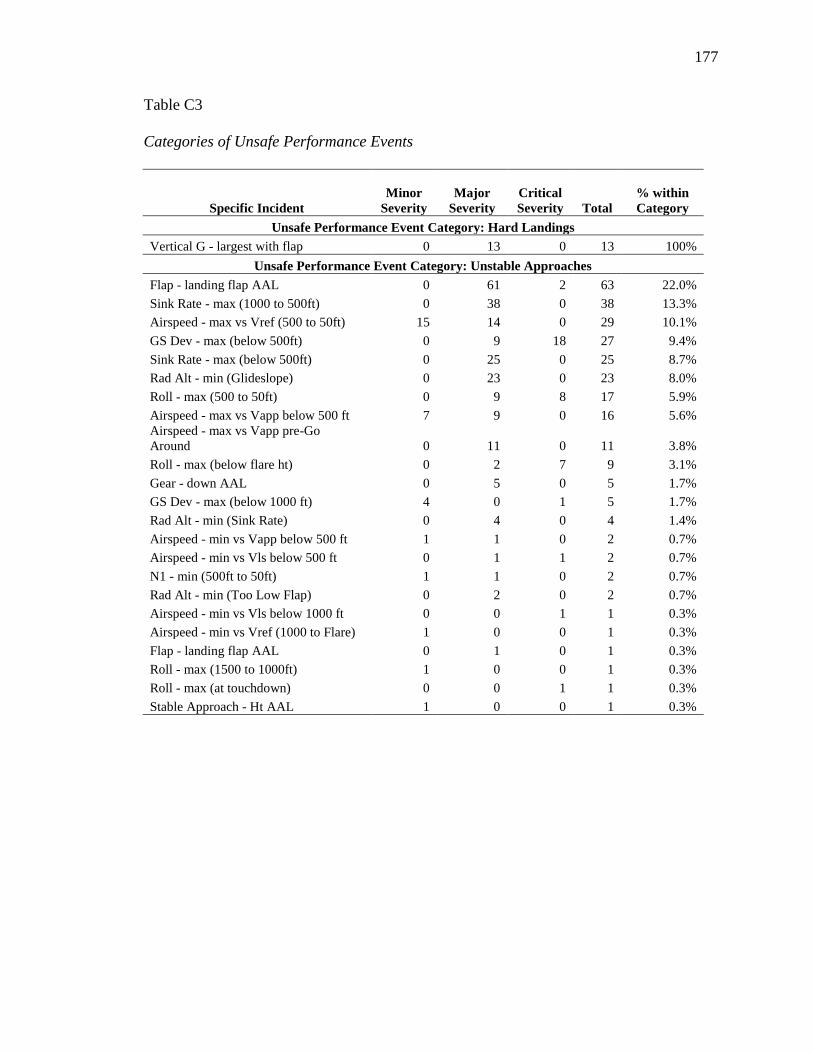
177
Table C3
Categories of Unsafe Performance Events
Specific Incident
Minor
Severity
Major
Severity
Critical
Severity Total
% within
Category
Unsafe Performance Event Category: Hard Landings
Vertical G - largest with flap 0 13 0 13 100%
Unsafe Performance Event Category: Unstable Approaches
Flap - landing flap AAL 0 61 2 63 22.0%
Sink Rate - max (1000 to 500ft) 0 38 0 38 13.3%
Airspeed - max vs Vref (500 to 50ft) 15 14 0 29 10.1%
GS Dev - max (below 500ft) 0 9 18 27 9.4%
Sink Rate - max (below 500ft) 0 25 0 25 8.7%
Rad Alt - min (Glideslope) 0 23 0 23 8.0%
Roll - max (500 to 50ft) 0 9 8 17 5.9%
Airspeed - max vs Vapp below 500 ft 7 9 0 16 5.6%
Airspeed - max vs Vapp pre-Go
Around 0 11 0 11 3.8%
Roll - max (below flare ht) 0 2 7 9 3.1%
Gear - down AAL 0 5 0 5 1.7%
GS Dev - max (below 1000 ft) 4 0 1 5 1.7%
Rad Alt - min (Sink Rate) 0 4 0 4 1.4%
Airspeed - min vs Vapp below 500 ft 1 1 0 2 0.7%
Airspeed - min vs Vls below 500 ft 0 1 1 2 0.7%
N1 - min (500ft to 50ft) 1 1 0 2 0.7%
Rad Alt - min (Too Low Flap) 0 2 0 2 0.7%
Airspeed - min vs Vls below 1000 ft 0 0 1 1 0.3%
Airspeed - min vs Vref (1000 to Flare) 1 0 0 1 0.3%
Flap - landing flap AAL 0 1 0 1 0.3%
Roll - max (1500 to 1000ft) 1 0 0 1 0.3%
Roll - max (at touchdown) 0 0 1 1 0.3%
Stable Approach - Ht AAL 1 0 0 1 0.3%

178
Specific Incident
Minor
Severity
Major
Severity
Critical
Severity Total
% within
Category
Unsafe Performance Event Category: Pilot Deviation
Sidestick Product (Pitch) 0 53 173 226 28.6%
Airspeed - vs Max for Altitude (SOP) 4 44 57 105 13.3%
Sidestick Product (Roll) 0 5 49 54 6.8%
No Reverse After Landing 0 0 50 50 6.3%
Airspeed - vs V2 0 46 0 46 5.8%
Spoilers - not armed 0 46 0 46 5.8%
Airspeed - max vs Vfe (2 secs) 0 40 0 40 5.1%
Airspeed - vs V2 4 36 0 40 5.1%
Roll - max 9 15 11 35 4.4%
Vertical Speed - max sink (10 secs) 0 33 0 33 4.2%
Groundspeed - max (5 secs) 5 21 0 26 3.3%
Sink Rate - max (2000 to 1000ft) 0 17 0 17 2.2%
Roll - max (50 to 500ft) 0 7 6 13 1.6%
Weight vs Max Landing (specific a/c) 0 11 0 11 1.4%
Brake Pedal - sum 3 6 0 9 1.1%
Groundspeed at T/R cancel 0 7 0 7 0.9%
Lateral G - max abs 0 6 0 6 0.8%
Longitudinal G - max abs 1 5 0 6 0.8%
Height above rwy - config change 1 3 0 4 0.5%
Airspeed - max vs Vlo ext (2 secs) 0 3 0 3 0.4%
Pitch - most -ve 2 1 0 3 0.4%
Altitude - max vs ceiling 0 2 0 2 0.3%
Mach - max vs Mmo 0 1 1 2 0.3%
Airspeed - vs V2 at 1st Config Change 0 1 0 1 0.1%
Pitch - min (1000 to 500ft) 1 0 0 1 0.1%
Roll - max (500 to 1000ft) 0 1 0 1 0.1%
Roll - max (below 50ft) 0 1 0 1 0.1%
Weight vs Max Takeoff 0 0 1 1 0.1%
Total by Severity 61 640 387 1088
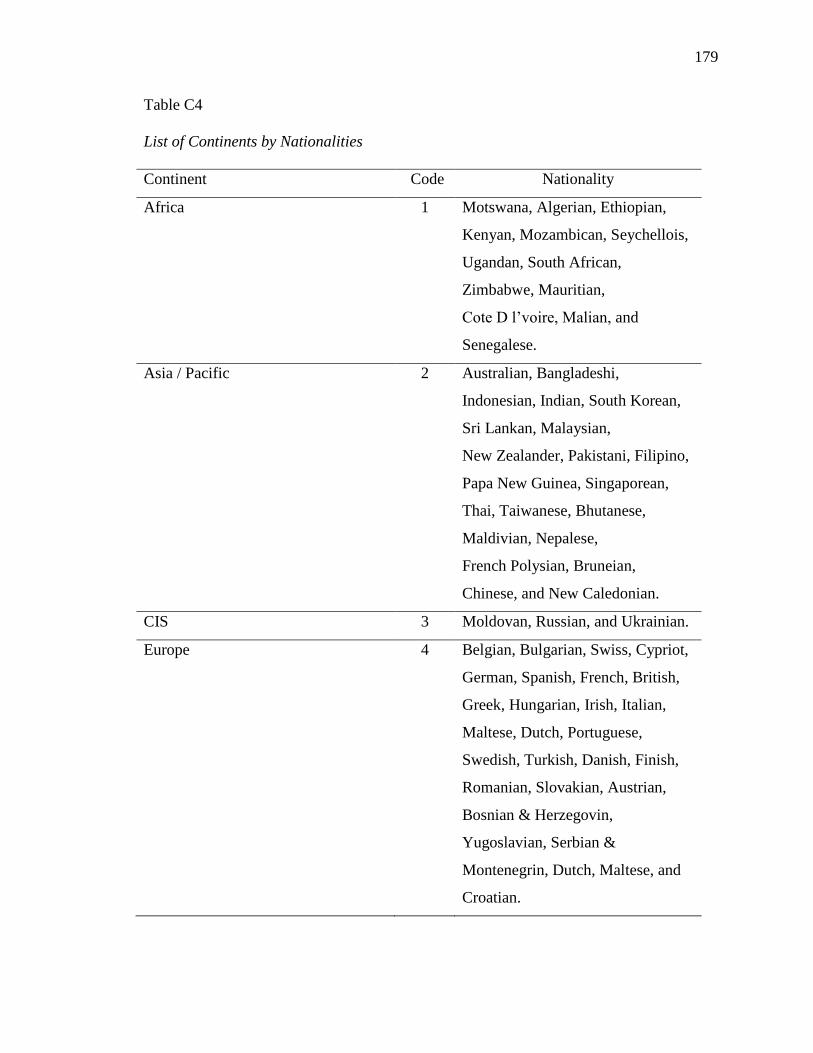
179
Table C4
List of Continents by Nationalities
Continent Code Nationality
Africa 1 Motswana, Algerian, Ethiopian,
Kenyan, Mozambican, Seychellois,
Ugandan, South African,
Zimbabwe, Mauritian,
Cote D l’voire, Malian, and
Senegalese.
Asia / Pacific 2 Australian, Bangladeshi,
Indonesian, Indian, South Korean,
Sri Lankan, Malaysian,
New Zealander, Pakistani, Filipino,
Papa New Guinea, Singaporean,
Thai, Taiwanese, Bhutanese,
Maldivian, Nepalese,
French Polysian, Bruneian,
Chinese, and New Caledonian.
CIS 3 Moldovan, Russian, and Ukrainian.
Europe 4 Belgian, Bulgarian, Swiss, Cypriot,
German, Spanish, French, British,
Greek, Hungarian, Irish, Italian,
Maltese, Dutch, Portuguese,
Swedish, Turkish, Danish, Finish,
Romanian, Slovakian, Austrian,
Bosnian & Herzegovin,
Yugoslavian, Serbian &
Montenegrin, Dutch, Maltese, and
Croatian.

180
Continent Code Nationality
Latin American & the Caribbean 5 Bolivian, Brazilian, Chilean,
Colombian, Costa Rican,
Guatemalan, Jamaican, Mexican,
Peruvian, Salvadorian,
Trinidad & Tobago, Venezuelan,
Argentinean, and Dominican.
Middle-East & North Africa 6 Emirati, Egyptian, Jordanian,
Lebanese, Moroccan, Sudanese,
Syrian, Tunisian, Qatari,
Saudi Arabian, Yemeni, Bahraini,
Iraqi, Kuwaiti, and Omani.
North America 7 Canadian and American

181
Table C5
Destination Airports by Category
Pilot Eligibility Category by Destination
A B C
Abu Dhabi Almaty Addis Ababa
Ahmedabad Amman (Queen Alia) Kathmandu
Alexandria (Borg El Arab) Astana Peshawar
Amsterdam Baghdad Seychelles
Athens Basrah
Bahrain Beirut
Bangalore Benghazi
Bangkok Calicut
Beijing Chicago
Belgrade Damascus
Berlin Tegel Djibouti
Brisbane Eldoret
Brussels Erbil
Bucharest Geneva
Cairo Guangzhou
Cape Town Hong Kong
Casablanca Islamabad
Chengdu Istanbul Sabiha Gokcen
Chennai Jakarta
Cochin Johannesburg
Colombo Karachi
Copenhagen Khartoum
Dammam Kuala Lumpur
Delhi Lagos
Dhaka Larnaca
Doha Manila
Dublin Mauritius
Dusseldorf Melbourne
Frankfurt Hahn Moscow Domodedovo
Frankfurt Main Mumbai
Ho Chi Minh N'Djamena
Hyderabad Nairobi
Istanbul Ataturk New York Kennedy Intl
Jeddah Sao Paulo
Kuwait Stuttgart
Lahore Tehran
London Heathrow Thessaloniki
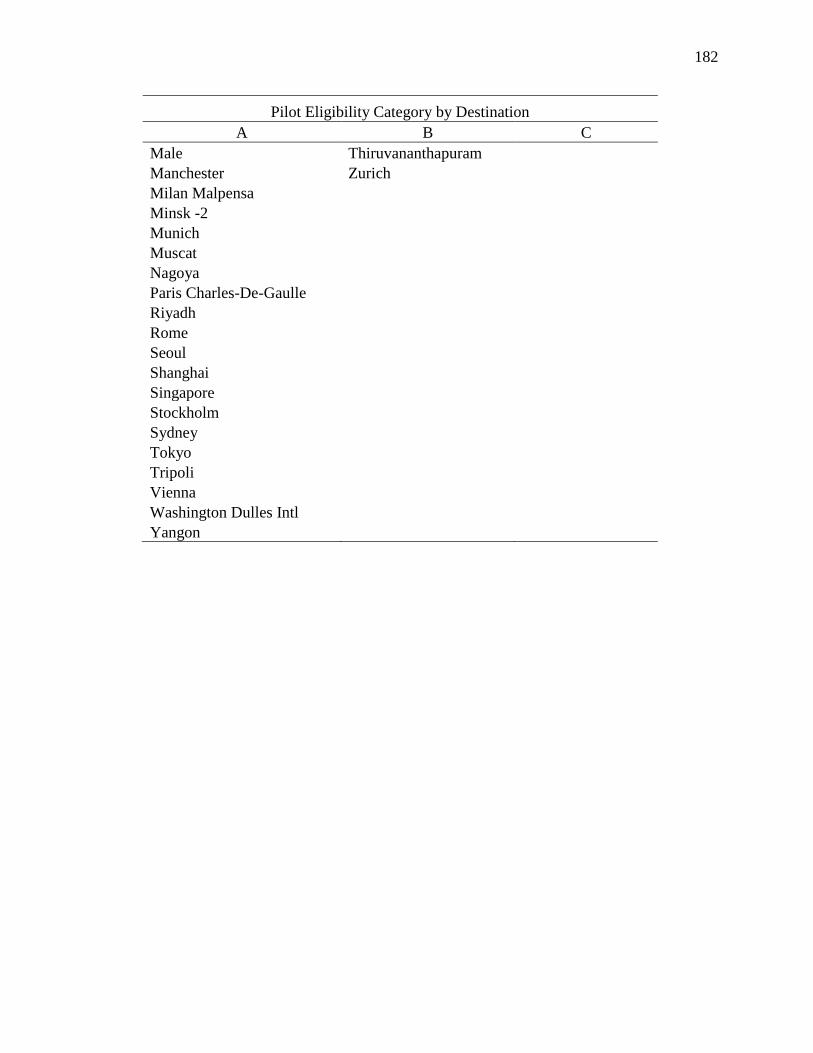
182
Pilot Eligibility Category by Destination
A B C
Male Thiruvananthapuram
Manchester Zurich
Milan Malpensa
Minsk -2
Munich
Muscat
Nagoya
Paris Charles-De-Gaulle
Riyadh
Rome
Seoul
Shanghai
Singapore
Stockholm
Sydney
Tokyo
Tripoli
Vienna
Washington Dulles Intl
Yangon

183
Table C6
Coefficients
Model Unstandardized
Coefficients
Standardized
Coefficients
t Sig. Collinearity Statistics
B Std. Error Beta Tolerance VIF
1
(Constant) 25.840 1.226 21.082 .000
V1NatCombination1_1
Continent Capt 1 FO 1
10.160 9.780 .029 1.039 .299 .987 1.014
V2NatCombination1_2
Continent Capt 1 FO 2
-3.261 4.046 -.023 -.806 .420 .922 1.085
V4NatCombination1_4
Continent Capt 1 FO 4
1.838 3.404 .016 .540 .589 .889 1.124
V5NatCombination1_5
Continent Capt 1 FO 5
-5.674 6.970 -.023 -.814 .416 .974 1.027
V6NatCombination1_6
Continent Capt 1 FO 6
-8.490 3.953 -.061 -2.148 .032 .918 1.090
V7NatCombination1_7
Continent Capt 1 FO 7
14.160 16.851 .023 .840 .401 .995 1.005
V8NatCombination2_1
Continent Capt 2 FO 1
3.293 4.509 .021 .730 .465 .937 1.067
V9NatCombination2_2
Continent Capt 2 FO 2
4.027 2.215 .058 1.818 .069 .741 1.350
V11NatCombination2_
4Continent Capt 2 FO 4
3.199 2.067 .051 1.548 .122 .703 1.423
V12NatCombination2_
5Continent Capt 2 FO 5
5.118 3.643 .040 1.405 .160 .903 1.107
V13NatCombination2_
6Continent Capt 2 FO 6
-3.278 2.718 -.036 -1.206 .228 .827 1.209
V14NatCombination2_
7Continent Capt 2 FO 7
1.826 4.509 .011 .405 .686 .937 1.067
V16NatCombination3_
2Continent Capt 3 FO 2
-21.840 16.851 -.036 -1.296 .195 .995 1.005
V18NatCombination3_
4Continent Capt 3 FO 4
-4.840 11.947 -.011 -.405 .685 .991 1.009
V20NatCombination3_
6Continent Capt 3 FO 6
-5.674 6.970 -.023 -.814 .416 .974 1.027
V22NatCombination4_
1Continent Capt 4 FO 1
-4.068 3.787 -.031 -1.074 .283 .911 1.098
V23NatCombination4_
2Continent Capt 4 FO 2
.433 2.041 .007 .212 .832 .696 1.437
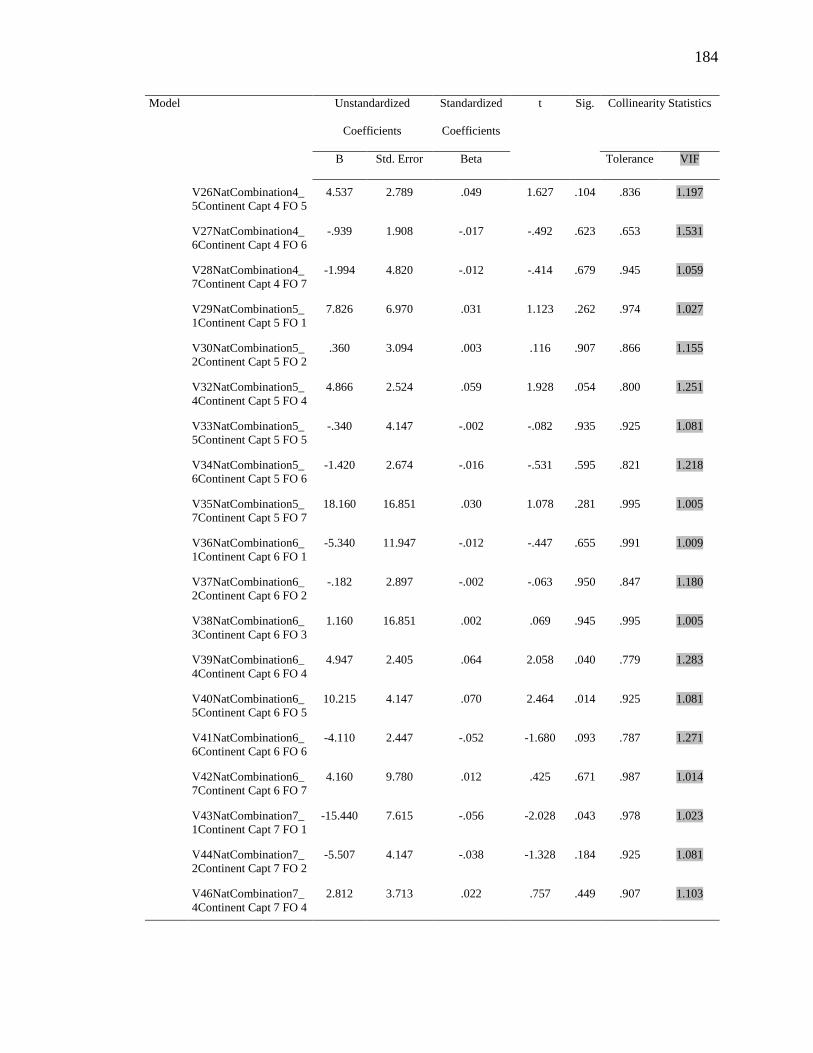
184
Model Unstandardized
Coefficients
Standardized
Coefficients
t Sig. Collinearity Statistics
B Std. Error Beta Tolerance VIF
V26NatCombination4_
5Continent Capt 4 FO 5
4.537 2.789 .049 1.627 .104 .836 1.197
V27NatCombination4_
6Continent Capt 4 FO 6
-.939 1.908 -.017 -.492 .623 .653 1.531
V28NatCombination4_
7Continent Capt 4 FO 7
-1.994 4.820 -.012 -.414 .679 .945 1.059
V29NatCombination5_
1Continent Capt 5 FO 1
7.826 6.970 .031 1.123 .262 .974 1.027
V30NatCombination5_
2Continent Capt 5 FO 2
.360 3.094 .003 .116 .907 .866 1.155
V32NatCombination5_
4Continent Capt 5 FO 4
4.866 2.524 .059 1.928 .054 .800 1.251
V33NatCombination5_
5Continent Capt 5 FO 5
-.340 4.147 -.002 -.082 .935 .925 1.081
V34NatCombination5_
6Continent Capt 5 FO 6
-1.420 2.674 -.016 -.531 .595 .821 1.218
V35NatCombination5_
7Continent Capt 5 FO 7
18.160 16.851 .030 1.078 .281 .995 1.005
V36NatCombination6_
1Continent Capt 6 FO 1
-5.340 11.947 -.012 -.447 .655 .991 1.009
V37NatCombination6_
2Continent Capt 6 FO 2
-.182 2.897 -.002 -.063 .950 .847 1.180
V38NatCombination6_
3Continent Capt 6 FO 3
1.160 16.851 .002 .069 .945 .995 1.005
V39NatCombination6_
4Continent Capt 6 FO 4
4.947 2.405 .064 2.058 .040 .779 1.283
V40NatCombination6_
5Continent Capt 6 FO 5
10.215 4.147 .070 2.464 .014 .925 1.081
V41NatCombination6_
6Continent Capt 6 FO 6
-4.110 2.447 -.052 -1.680 .093 .787 1.271
V42NatCombination6_
7Continent Capt 6 FO 7
4.160 9.780 .012 .425 .671 .987 1.014
V43NatCombination7_
1Continent Capt 7 FO 1
-15.440 7.615 -.056 -2.028 .043 .978 1.023
V44NatCombination7_
2Continent Capt 7 FO 2
-5.507 4.147 -.038 -1.328 .184 .925 1.081
V46NatCombination7_
4Continent Capt 7 FO 4
2.812 3.713 .022 .757 .449 .907 1.103

185
Model Unstandardized
Coefficients
Standardized
Coefficients
t Sig. Collinearity Statistics
B Std. Error Beta Tolerance VIF
V47NatCombination7_
5Continent Capt 7 FO 5
-3.269 6.469 -.014 -.505 .613 .969 1.032
V48NatCombination7_
6Continent Capt 7 FO 6
-2.785 4.147 -.019 -.672 .502 .925 1.081
a. Dependent Variable: Event_name_New Name of event / Incident

186
Table C7
Casewise Diagnostics
Case Number Std. Residual Event_name_New
Name of event /
Incident
Predicted
Value
Residual
6 2.236 62 24.42 37.580
22 2.029 59 24.90 34.098
205 2.029 59 24.90 34.098
290 2.162 62 25.66 36.341
318 2.236 62 24.42 37.580
354 2.207 62 24.90 37.098
359 2.126 62 26.27 35.726
380 2.346 62 22.58 39.421
459 2.347 62 22.56 39.437
476 2.139 59 23.06 35.944
537 2.215 59 21.77 37.227
591 2.126 62 26.27 35.726
611 2.218 59 21.73 37.270
626 2.152 62 25.84 36.160
668 2.509 68 25.84 42.160
693 2.029 59 24.90 34.098
708 2.396 62 21.73 40.270
773 2.207 62 24.90 37.098

187
Case Number Std. Residual Event_name_New
Name of event /
Incident
Predicted
Value
Residual
788 2.270 62 23.85 38.154
802 2.162 62 25.66 36.341
808 2.011 60 26.20 33.800
813 2.033 60 25.84 34.160
820 2.317 62 23.06 38.944
825 2.478 59 17.35 41.650
897 2.249 64 26.20 37.800
927 2.311 59 20.17 38.833
948 2.029 59 24.90 34.098
1010 2.378 69 29.04 39.961
1014 2.152 62 25.84 36.160
1040 2.033 60 25.84 34.160
1100 2.396 62 21.73 40.270
1147 2.207 62 24.90 37.098
1210 2.207 62 24.90 37.098
1287 2.624 69 24.90 44.098
1295 2.042 62 27.68 34.321
1299 2.007 60 26.27 33.726
1308 2.162 62 25.66 36.341
1314 2.396 62 21.73 40.270

188
APPENDIX D
Figures
D1 Normal P-P Plot of Regression Standardized Residual
D2 Scatterplot
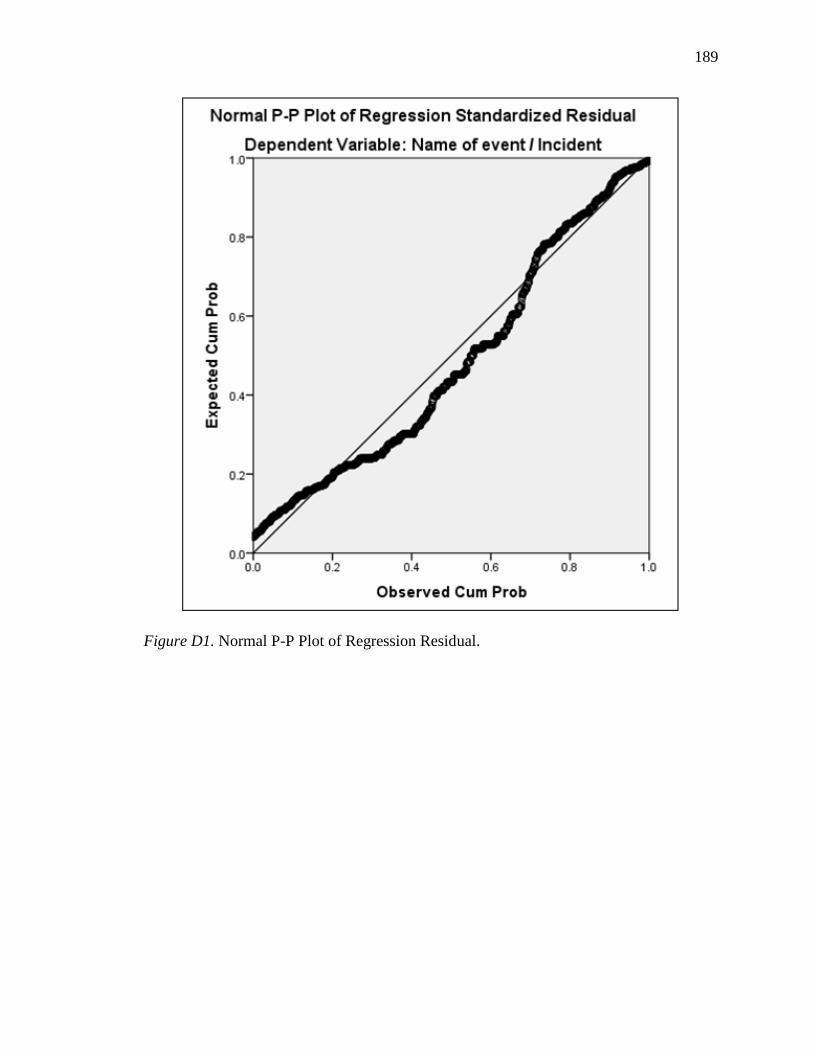
189
Figure D1. Normal P-P Plot of Regression Residual.
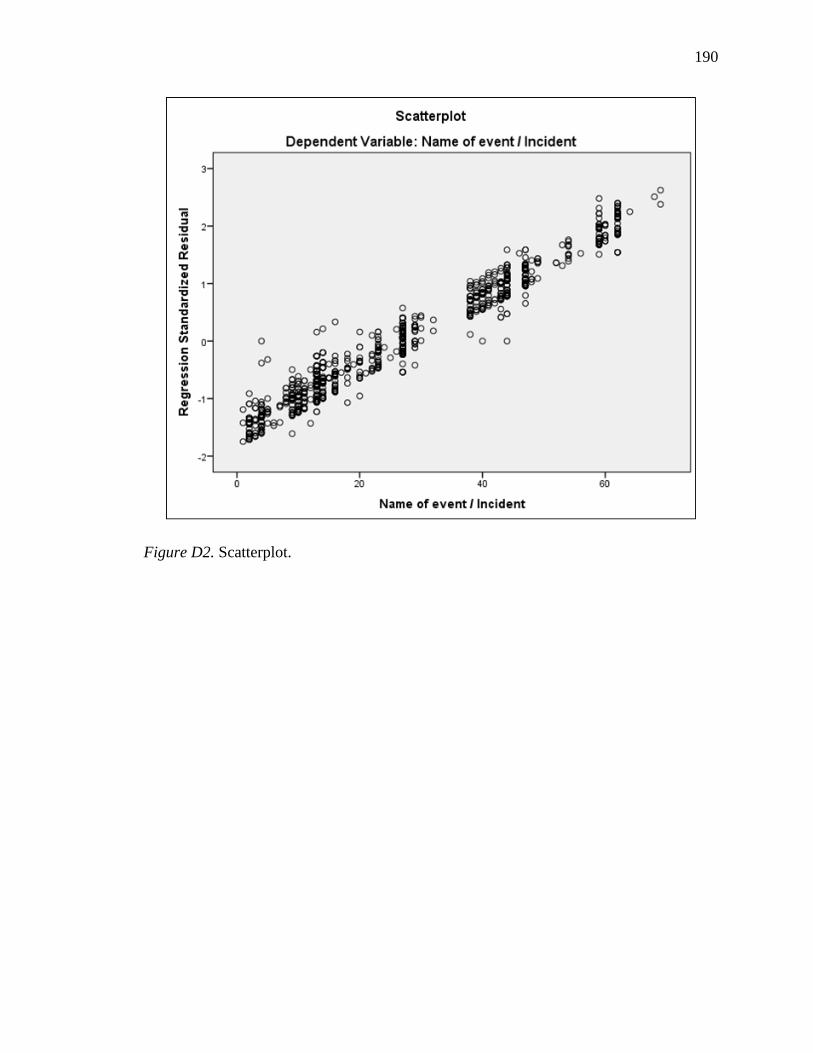
190
Figure D2. Scatterplot.