national energy technology laboratory library/research/energy analysis/coal... · exhibit 3-13 wax...
TRANSCRIPT

Cost and Performance Baseline for
Fossil Energy Plants
Volume 4: Coal-to-Liquids via Fischer-
Tropsch Synthesis
October 15, 2014
DOE/NETL-2011/1477
OFFICE OF FOSSIL ENERGY
National Energy Technology Laboratory

Cost and Performance Baseline for Fossil Energy Plants Volume 4: CTL via F-T Synthesis
Disclaimer
This report was prepared as an account of work sponsored by an agency of the United States
Government. Neither the United States Government nor any agency thereof, nor any of their
employees, makes any warranty, express or implied, or assumes any legal liability or
responsibility for the accuracy, completeness, or usefulness of any information, apparatus,
product, or process disclosed, or represents that its use would not infringe privately owned rights.
Reference therein to any specific commercial product, process, or service by trade name,
trademark, manufacturer, or otherwise does not necessarily constitute or imply its endorsement,
recommendation, or favoring by the United States Government or any agency thereof. The views
and opinions of authors expressed therein do not necessarily state or reflect those of the United
States Government or any agency thereof.

NETL Contact:
National Energy Technology Laboratory (NETL)
Morgan Summers, General Engineer
Office of Program Performance and Benefits
Prepared By:
Energy Sector Planning and Analysis (ESPA)
Vasant Shah, Norma J. Kuehn, Marc J. Turner
Sheldon J. Kramer
Consultant
This report was prepared by Energy Sector Planning and Analysis (ESPA) for the United States
Department of Energy (DOE), National Energy Technology Laboratory (NETL). This work was
completed under DOE NETL Contract Number DE-FE0004001. This work was performed
under ESPA Task 341.02.07.
The authors wish to acknowledge the excellent guidance, contributions, and cooperation of the
NETL staff, particularly:
Thomas J. Tarka, NETL, Team Lead, OSEAP
Kristin Gerdes, NETL, Office Director, OPPB
John Wimer, NETL, Office Director, SCC
DOE Contract Number DE-FE0004001

This page intentionally left blank.

Cost and Performance Baseline for Fossil Energy Plants Volume 4: CTL via F-T Synthesis
i
Table of Contents
Executive Summary .........................................................................................................................1 Plant Design & Constraints ..............................................................................................................1
Performance Results ........................................................................................................................3 Economic Results.............................................................................................................................3 Cost Sensitivity to Financing Structures and Capital Charge Factors .............................................5 1 Introduction ..........................................................................................................................7 1.1 Site Description ....................................................................................................................7
1.2 Design Coal ..........................................................................................................................8 1.3 Environmental Requirements...............................................................................................8 1.3.1 Carbon Dioxide ....................................................................................................................9 1.3.2 Mercury ..............................................................................................................................10 1.4 Raw Water Usage ..............................................................................................................10
1.5 Balance of Plant .................................................................................................................12 1.6 Economic Analysis ............................................................................................................13
1.6.1 Capital Costs ......................................................................................................................14 1.6.2 Production Costs and Expenses .........................................................................................15
1.6.3 Cost of Production of Liquid Fuels ....................................................................................16 2 Plant Configuration ............................................................................................................18 3 System Description ............................................................................................................20
3.1 Synthesis Gas Production ..................................................................................................21 3.1.1 Air Separation Unit ............................................................................................................27
3.1.2 Coal Drying ........................................................................................................................28 3.1.3 Gasifier ...............................................................................................................................29 3.1.4 Particulate Removal ...........................................................................................................29
3.1.5 Gas Scrubbing ....................................................................................................................30 3.1.6 Water Gas Shift through Acid Gas Removal .....................................................................30
3.1.7 CO2 Compression and Dehydration ...................................................................................33 3.1.8 Claus Unit ..........................................................................................................................33
3.1.9 Zinc Oxide .........................................................................................................................33 3.2 Fischer-Tropsch Synthesis .................................................................................................34 3.3 Product Recovery ...............................................................................................................44
3.4 Recycle Gas Loop ..............................................................................................................45 3.5 Product Upgrading .............................................................................................................45
3.5.1 Naphtha Hydrotreaters .......................................................................................................45 3.5.2 Middle Distillate Hydrotreaters .........................................................................................45 3.5.3 Wax Hydrocracking ...........................................................................................................46 3.6 Power Production ...............................................................................................................47
3.6.1 Combustion Turbine Generators ........................................................................................47 3.6.2 Steam Turbine Power Generation ......................................................................................49 3.6.3 Flare Stack .........................................................................................................................50
4 Performance Summary and Mass Balances .......................................................................51 4.1.1 Carbon Balance ..................................................................................................................53 4.1.2 Sulfur Balance ....................................................................................................................54 4.1.3 Water Balance ....................................................................................................................54 5 Cost Estimation Results .....................................................................................................56

Cost and Performance Baseline for Fossil Energy Plants Volume 4: CTL via F-T Synthesis
ii
5.1 Capital and Operating Costs ..............................................................................................56
5.2 Cost of Production .............................................................................................................69 5.3 Cost of Carbon Capture .....................................................................................................73 6 Conclusions and Recommendations ..................................................................................74
6.1 Conclusions ........................................................................................................................74 6.2 Recommendations for Further Study .................................................................................74 7 References ..........................................................................................................................75

Cost and Performance Baseline for Fossil Energy Plants Volume 4: CTL via F-T Synthesis
iii
List of Exhibits
Exhibit ES-1 Plant performance summary ..................................................................................... 3 Exhibit ES-2 Capital, operating cost, and COP summary .............................................................. 4
Exhibit ES-3 TOC ($1,000) with error bars.................................................................................... 5 Exhibit ES-4 Comparison of ECO bbl and EPD bbl ...................................................................... 6 Exhibit 1-1 Site ambient conditions ................................................................................................ 7 Exhibit 1-2 Site characteristics ....................................................................................................... 7 Exhibit 1-3 Design coal analysis – Illinois No. 6 ........................................................................... 8
Exhibit 1-4 BACT environmental design basis .............................................................................. 9 Exhibit 1-5 Standards of performance for electric utility steam-generating units built,
reconstructed, or modified after February 28, 2005................................................................ 9 Exhibit 1-6 Balance of plant design requirements ........................................................................ 12 Exhibit 1-7 Process and cooling water properties......................................................................... 13
Exhibit 1-8 Features of an AACE Class 4 cost estimate .............................................................. 14 Exhibit 1-9 Financial structure for fuels projects ......................................................................... 16
Exhibit 1-10 Financial assumptions for PSFM ............................................................................. 17 Exhibit 3-1 Coal-to-liquids process flow diagram (red items only in sequestration case) ........... 20
Exhibit 3-2 Block flow diagram of the gasification, syngas shift, and acid gas removal area
(sequestration only systems shown in red) ........................................................................... 22 Exhibit 3-3 Stream table for the gasification, syngas shift, and acid gas removal area – CO2
sequestration case .................................................................................................................. 23 Exhibit 3-4 Stream table for the gasification, syngas shift, and acid gas removal area – CO2 vent
case ........................................................................................................................................ 25 Exhibit 3-5 Typical ASU process schematic ............................................................................... 28 Exhibit 3-6 F-T reactor syngas operating parameters for both cases ............................................ 30
Exhibit 3-7 Rectisol process flow diagram example .................................................................... 32
Exhibit 3-8 Simplified representation of the F-T synthesis section .............................................. 35 Exhibit 3-9 Block flow diagram for the F-T synthesis and product upgrading area .................... 37 Exhibit 3-10 Stream table for the F-T synthesis and product upgrading area – CO2 sequestration
............................................................................................................................................... 38 Exhibit 3-11 Stream table for the F-T synthesis and product upgrading area – CO2 vent ........... 41 Exhibit 3-12 Diesel properties ...................................................................................................... 46
Exhibit 3-13 Wax hydrocracking model product yield distributions ............................................ 46 Exhibit 3-14 Block flow diagram for the fuel gas preparation and power generation area .......... 48 Exhibit 3-15 Fuel gas LHV comparison between turbine and F-T models .................................. 49 Exhibit 4-1 Plant performance summary – CO2 sequestration case ............................................. 52 Exhibit 4-2 Plant performance summary – CO2 vent case ........................................................... 53
Exhibit 4-3 Elemental carbon mass balance – CO2 sequestration case ........................................ 54
Exhibit 4-4 Elemental carbon mass balance – CO2 vent case ...................................................... 54
Exhibit 4-5 Water balance – CO2 sequestration case .................................................................... 55 Exhibit 4-6 Water balance – CO2 vent case .................................................................................. 55 Exhibit 5-1 Total plant cost summary with CO2 sequestration ..................................................... 57 Exhibit 5-2 Total operating and maintenance costs with CO2 sequestration ................................ 62 Exhibit 5-3 Total plant cost summary – CO2 vent ........................................................................ 63 Exhibit 5-4 Total operating and maintenance costs – CO2 vent ................................................... 68 Exhibit 5-5 Cost estimation results summary (CO2 sequestration) ............................................. 69

Cost and Performance Baseline for Fossil Energy Plants Volume 4: CTL via F-T Synthesis
iv
Exhibit 5-6 COP sensitivity to market price of electricity ............................................................ 70
Exhibit 5-7 Comparison of TOC per F-T bbl, ECO bbl, and EPD bbl ......................................... 71 Exhibit 5-8 FT-Liquids COP sensitivity to CCF .......................................................................... 72 Exhibit 5-9 Cost summary of CTL facility with and without CCS .............................................. 73

Cost and Performance Baseline for Fossil Energy Plants Volume 4: CTL via F-T Synthesis
v
Acronyms and Abbreviations
AEO Annual Energy Outlook
AGR Acid gas removal
ASTM formerly American Society for
Testing and Materials
ASU Air separation unit
ATR Autothermal reformer
API American Petroleum Institute
BACT Best available control technology
bbl barrel
BEC Bare erected cost
BFD Block flow diagram
BFW Boiler feed water
bpd barrel per day
Btu British thermal unit
Btu/hr British thermal unit per hour
Btu/kWh British thermal unit per kilowatt
hour
Btu/lb British thermal unit per pound
CBTL Coal and biomass to liquids
CBM Coal bed methane
CCF Capital charge factor
CCS Carbon capture and sequestration
CF Capacity factor
CFM Cubic feet per minute
CFR Code of Federal Regulations
CH4 Methane
cm Centimeter
CO Carbon monoxide
CO2 Carbon dioxide
COP Cost of production of liquid fuels
COR Contracting Officer's Representative
COS Carbonyl sulfide
CT Combustion turbine
CTG Combustion turbine-generator
CTL Coal-to-liquids
CWR Circulating water return
CWS Circulating water system
CWT Cold water temperature
DCA Direct contact aftercooler
DOE Department of Energy
ECO Equivalent crude oil
EIA Energy Information Administration
EOR Enhanced oil recovery
EPA Environmental Protection Agency
EPC Engineer/procure/construct
EPCM Engineering/procurement/
construction management
EPD Equivalent petroleum diesel
ESPA Energy Sector Planning and
Analysis
F-T, FT Fischer-Tropsch
ft Foot, Feet
FTL Fischer-Tropsch liquid
gal Gallon
GE General Electric
GHG Greenhouse gas
GJ Gigajoules
GJ/hr Gigajoules per hour
gpm Gallons per minute
GT Gas turbine
h, hr Hour
H2 Hydrogen
H2O Water
H2S Hydrogen sulfide
HAP Hazardous air pollutant
HCl Hydrochloric acid
Hg Mercury
HDPE High density polyethylene
HHV Higher heating value
hp Horsepower
HP High pressure
HRSG Heat recovery steam generator
HVAC Heating, ventilating, and air
conditioning
IGCC Integrated gasification combined
cycle
IOU Investor owned utility
IP Intermediate pressure
IRR Internal rate or return
IRROE Internal rate of return on equity
ISBL Inside battery limits
ISO International Standards
Organization
kg/hr Kilogram per hour
kJ Kilojoules
kJ/hr Kilojoules per hour
kJ/kg Kilojoules per kilogram
km Kilometer
kV Kilovolt
kW Kilowatt
kWe Kilowatts electric

Cost and Performance Baseline for Fossil Energy Plants Volume 4: CTL via F-T Synthesis
vi
kWh Kilowatt-hour
kWt Kilowatts thermal
lb Pound
lb/106Btu Pounds per million British thermal
units (also lb/MMBtu)
lb/hr Pounds per hour
lb/ft2 Pounds per square foot
lb/MMBtu Pounds per million British thermal
units (also lb/106Btu)
lb/MWh Pounds per megawatt hour
LHV Lower heating value
LNB Low NOx burner
LP Low pressure
lpm Liters per minute
m Meters
mg Milligram
m/min Meters per minute
m3/min Cubic meter per minute
MMBtu Million British thermal units (also
shown as 106 Btu)
MMBtu/hr Million British thermal units (also
shown as 106 Btu) per hour
MP Medium Pressure
MPa Megapascals
MWe Megawatts electric
MWh Megawatt-hour
MWt Megawatts thermal
N/A Not applicable
NETL National Energy Technology
Laboratory
NGCC Natural gas combined cycle
NH3 Ammonia
NOx Nitrogen oxides
NSPS New Source Performance Standards
OPPB Office of Program Performance and
Benefits
O&M Operation and maintenance
PM Particulate matter
PM10 Particulate matter measuring 10 μm
or less
POTW Publicly owned treatment works
ppm Parts per million
ppmv Parts per million volume
ppmvd Parts per million volume, dry
PSA Pressure swing adsorption
PSFM Power systems financial model
psia Pounds per square inch absolute
psid Pounds per square inch differential
psig Pounds per square inch gage
PT Product transport
RDS Research and Development
Solutions, LLC
RMA Raw material acquisition
RMT Raw material transport
ROE Return on equity
S# Stoichiometric number
SGC Synthesis gas cooler
SGS Sour gas shift
SO2 Sulfur dioxide
SOx Oxides of sulfur
STG Steam turbine generator
SWS Sour water stripper
TASC Total as-spent cost
TGTU Tail gas treating unit
TOC Total overnight cost
Tonne Metric ton (1,000 kg)
TPC Total plant cost
TPD Tons per day
TPH Tons per hour
TSS Total suspended solids
T&S Transport and storage
ULSD Ultra-low sulfur diesel
U.S. United States
USC Ultra-supercritical
VGO Vacuum gas oil
vol% Volume percent
WGS Water gas shift
wt% Weight percent
WTI West Texas Intermediate
WTW Well-to-Wheels
ZnO Zinc oxide
ZnS Zinc sulfide
$/bbl Dollars per barrel
μS/cm micro Siemens per cm, a measure of
conductivity
C Celsius
F Fahrenheit

Cost and Performance Baseline for Fossil Energy Plants Volume 4: CTL via F-T Synthesis
1
Executive Summary
Economic and national security concerns related to liquid fuels have revived national interest in
alternative liquid fuel sources. Coal-to-Fischer-Tropsch fuels production is a major technology
option for many states and for the Department of Energy (DOE). This report examines the
technical and economic feasibility of a commercial coal-to-liquids (CTL) facility in the Illinois
coal basin that nominally produces 50,000 barrels per day (bbl/day) F-T liquids using an iron-
based catalyst with an expected final product split of approximately 70:30 diesel/naphtha. The
facility employs dry-feed Shell-type gasification technology and Fischer-Tropsch (F-T/FT)
technology to produce commercial-grade diesel and naphtha liquids from medium-sulfur
bituminous coal.
A minimal amount of excess electrical power is also produced and assumed to be sold into the
power market to provide an operating credit in the cost estimation calculations.
The scope of this study includes:
- Development of a conceptual plant design
- Modeling and analysis of the process
- Capital cost estimate
- Economic viability assessment
Where incentives (e.g., loan guarantees) are available, this study concludes that a CTL facility is
economically competitive with crude oil prices as low as $107 per barrel1 – in the scenario where
CO2 is not sequestered – or $116 per barrel in the case where CO2 is sequestered for greenhouse
gas (GHG) impact mitigation1.
As removal of CO2 from the shifted gas is inherent to F-T operations, a large portion of the cost
of capture is already incorporated into the design of a typical F-T facility. The low incremental
cost of sequestration – about $9 per barrel of Equivalent Crude Oil, or $0.27 per gallon of
petroleum diesel equivalent fuel – demonstrates the relatively low costs of additional capture
requirement and compression.
If no incentives are available (using the commercial fuels financing structure), the CTL facility is
economically viable when the crude oil prices are $125 per barrel – in the scenario where CO2 is
not sequestered – or $134 per barrel in the case where CO2 is sequestered for GHG impact
mitigation1.
Plant Design & Constraints
The initial plant design used for this study was based on the April 2007 National Energy
Technology Laboratory (NETL) report, “Baseline Technical and Economic Assessment of a
Commercial Scale Fischer-Tropsch Liquids Facility.” [1] The work in this study built upon and
incorporated several design changes and improvements that were identified during that analysis
1The crude oil values listed above are based on Energy Information Administration (EIA) data of historic spot prices
from June 2009 through November 2013 for the various fuel types. These were used to develop correlations
between the various fuel prices and the West Texas Intermediate (WTI) crude oil price (Crude oil: Ultra-low sulfur
diesel is 1.25 and Naphtha:Diesel is 0.70). The correlations were used to estimate the Equivalent Crude Oil (ECO)
price. The ECO price is the minimum market price for crude oil at which the first-year COPs will be met.

Cost and Performance Baseline for Fossil Energy Plants Volume 4: CTL via F-T Synthesis
2
and through other work, such as the January 2009 NETL report, “Affordable, Low-Carbon
Diesel Fuel from Domestic Coal and Biomass.” [2] Design changes from the April 2007 study
include:
1. The gasifier system was changed from the ConocoPhillips E-Gas™ system to a dry-feed,
single-stage, entrained-flow system similar to a Shell Global Solutions commercial design.
2. The operations of the F-T liquids upgrading units were altered to achieve a product split
emphasizing diesel fuel production over naphtha (approximately 70:30). Specifically, the
wax hydrocracking unit was adjusted to provide the desired diesel yield.
3. The process configuration was changed to increase the amount of CO2 captured for storage
by adding a new water-gas shift (WGS) reactor prior to the combined cycle power generation
step to convert CO to CO2, and by employing a dual-stage Rectisol® unit upstream of the F-T
Synthesis loop for CO2 separation.
4. A second scenario was added in order to ascertain the incremental cost of CO2 sequestration.
In this scenario, the separated CO2 is vented to the atmosphere instead of compressing,
transporting, and storing it. The CO2 is still separated to prevent the build-up of inert CO2 in
the recycle loop and otherwise reduce equipment sizes, and consequently capital costs.
5. The system design incorporated low-cost efforts to reduce water usage.
The CTL plant design that was evaluated utilizes an iron-based catalyst and a low-temperature F-
T reactor. The concept includes a total of eight gasifiers that produce syngas, which is cleaned
and combined before being ducted to the F-T reactor.
Vapor products from the second-stage reactors (those leaving the F-T synthesis section) are sent
to a cyclone to prevent liquid carryover. They are then cooled and sent to a three-phase
separator. The hot condensate is sent to the product upgrading processes. The remaining vapors
are processed for CO2 removal, oxygenate removal, dehydration, and additional hydrocarbon
recovery. The majority of the resulting tail-gas vapor is recycled to the F-T reactor, with the
remainder being processed in the hydrogen recovery unit.
The remaining pre-fuel gas from the hydrogen recovery unit is mixed with the light gases
produced in the hydrocarbon upgrading sections and the off-gas from the wax stream. In the
case of the CO2 sequestration case, this fuel gas is shifted to maximize CO2 capture potential. In
both cases, a portion of the fuel gas is separated out for combustion in direct-fired heaters, which
allows for more steam from the heat recovery to be directed to electrical power production. An
additional portion of fuel gas is utilized for coal drying and the remainder is sent to the
combustion turbines.
The plant was designed with the goal to operate independent of the bulk electric power system
(i.e. the power grid) during steady-state operations – producing enough power for plant needs –
while minimizing the production of export power (export power was desired to be less than 10
percent of total electrical power production). The total amount of excess electrical power output
varies based on a combination of the internal heat requirements (consumption of fuel gas) and
facility heat sources (available for steam production) as well as on whether CO2 captured at the
facility is to be sequestered or merely vented to the atmosphere due to the large electrical load
associated with compression.

Cost and Performance Baseline for Fossil Energy Plants Volume 4: CTL via F-T Synthesis
3
The electrical power was produced via two sources and in the following ways: 1) the steam from
the F-T reactor and from the combustion turbine heat recovery unit were combined and utilized
in steam turbines, and 2) the aforementioned fuel gas by-product from the F-T process was
combusted in off-the-shelf GE turbines, which were sized specifically to the available fuel flow
in order to achieve the goal of minimizing the export power.
The sequestration case achieves the goal of producing less than 10 percent excess electricity (4.6
MWe); however, as the vent case was designed to have the same coal flow rate as the
sequestration case in order to maintain a liquids output of 50,000 bbl/day, it produces 97.1 MWe
and consequently does not meet the excess electricity production limit.
Performance Results
Total plant performance data are summarized in Exhibit ES-1. Both facilities were designed to
nominally produce 50,000 bpd of liquid fuels, but the CO2 vent case is slightly more thermally
efficient owing to the reduced parasitic load (the result of not having to compress the CO2).
Exhibit ES-1 Plant performance summary
CO2 Sequestration
Case CO2 Vent Case
As-received Coal Feed Rate, tonne/day (tpd) 19,056 (21,006) 19,056 (21,006)
Syngas feed rate, lb/hr 2,498,396 2,498,396
Fuel gas recycle rate, lb/hr 743,921 743,921
Diesel Production, bbl/day 35,230 (70.5%) 35,230 (70.5%)
Naphtha Production, bbl/day 14,762 (29.5%) 14,762 (29.5%)
Gross Plant Power, MWe 427 473
Net Plant Power for Export, MWe 4.7 97.1
Carbon Dioxide Captured, tonne/day (tpd) 23,954 (26,405) 23,196 (25,569)
Carbon Dioxide Sequestered, tonne/day (tpd) 23,954 (26,405) n/a
The CTL plant is capable of producing 35,230 bbl/day of commercial-grade diesel liquid
(70.5 percent) and 14,762 bbl/day of F-T naphtha liquids (29.5 percent). The naphtha would be
shipped to a refinery for further upgrading into commercial-grade end products or for use as a
feedstock for the chemicals industry.
Economic Results
The capital and operating costs, as well as the breakeven selling prices required for the project to
be economically viable (meeting a 20 percent Internal Rate of Return on Equity [IRROE]), are
summarized in Exhibit ES-2. As shown, a commercial-scale CTL facility will require
approximately $6.4 and $6.5 billion in total overnight cost for the CO2 vent case and CO2
sequestration cases, respectively, ranging between $127,996 and $130,662 per barrel of F-T
liquids daily production capacity ($/bbl/day). For comparison purposes, the TOC values are
shown in Exhibit ES-3 in thousands of dollars ($1,000) with error bars demonstrating the impact
of the +30%/-15% accuracy (see Section 1.6.1) in the available cost estimates for this study and
consistent with the screening study level of design engineering.

Cost and Performance Baseline for Fossil Energy Plants Volume 4: CTL via F-T Synthesis
4
The primary figure-of-merit in this report is the cost of production (COP) (a.k.a. required selling
price) expressed in $/bbl of product. The COP values were calculated using the Power Systems
Financial Model (PSFM) and estimated to be the value that yields a net present value of zero at a
given internal rate of return on equity (IRROE) for 30 years of operation based on the assumed
financial structure and escalations. The COP was assumed to escalate at three percent per year
for the thirty-year economic life of the plant. All costs are expressed in June 2011 dollars. Two
financial structures were assumed for calculating the figures-of-merit. These structures are based
on typical values for fuel projects with and without loan guarantees or government subsidies.
The results are listed in Exhibit ES-2.
Two additional figures-of-merit included in this study are the equivalent crude oil (ECO) price
and the equivalent petroleum diesel (EPD) price. These are the theoretical crude oil and
petroleum based diesel prices, based on historic data that would produce the calculated COP
values. Both of the equivalent prices take into account the differences in energy content between
the F-T and petroleum-derived fuels (explained further in Section 1.6.3). These results are also
listed in Exhibit ES-2.
For cases with loan guarantee incentives, the facility will be economically competitive with
traditional (or petroleum) means of fuel production when crude oil prices are between $107/bbl
and $116/bbl for the CO2 vent and sequestration cases, respectively. This equates to a
petroleum-diesel equivalent price of $3.18/gallon and $3.44/gallon (prices do not include federal
or state taxes) for the CO2 vent and sequestration cases, respectively. The fuel produced in the
sequestration case is more expensive due to the compression, transport, and storage costs, as
evidenced by the positive value for the incremental cost of CCS.
Exhibit ES-2 Capital, operating cost, and COP summary
CO2
Sequestration CO2 Vent
Incr. CCS Cost
Total Overnight Cost, $1000 6,532,052 6,398,760 133,292
Total Overnight Cost, ($/bbl/day) 130,662 127,996 2,666
Total As Spent Cost*, $1000 7,494,877 [7,715,660]
7,341,938 [7,558,216]
152,939 [157,444]
Total As Spent Cost*, ($/bbl/day) 149,922 [154,388] 146,862 [151,189] 3,060 [3,150]
Total annual fixed O&M, $1000 200,854 197,405 3,448
Total variable O&M (90% CF), $1000 130,076 127,370 2,706
Total annual fuel cost (90% CF), $1000 473,377 473,377 0
Total annual power credit (90% CF), $1000 -2,149 -44,844 42,695
COP F-T Diesel, $/bblFTD 133.2 [154.2] 123.1 [143.7] 10.1 [10.5]
COP F-T Naphtha, $/bblFTN 92.8 [107.4] 85.8 [100.1] 7.0 [7.3]
Equivalent Crude Oil Price*, $/bblECO 115.6 [133.8] 106.9 [124.7] 8.7 [9.1]
Equivalent Petroleum Diesel Price*, $/bblEPD 144.5 [167.2] 133.6 [155.8] 10.9 [11.4] * Values are shown for two financial structures. The first (lower) value is based on the loan guarantee finance structure. The second (higher/bracketed) value is based on the commercial fuels finance structure. All costs in June 2011 dollars.

Cost and Performance Baseline for Fossil Energy Plants Volume 4: CTL via F-T Synthesis
5
Exhibit ES-3 TOC ($1,000) with error bars
Source: NETL
Cost Sensitivity to Financing Structures and Capital Charge Factors
Two financial structures were examined in this study: the first structure, considered to be
representative of a commercial fuels project, is assumed to have no loan guarantees, while the
second structure assumed moderate government incentives – in the form of government loan
guarantees. Both scenarios face a high degree of market risk as the facilities involve a large
amount of capital that must be financed with revenues from a volatile commodity fuels market;
co-production of electricity via an integrated gasification combined cycle (IGCC) plant allows
for diversification of products which dampens the impact of the volatile fuels market. The COPs
for both structures are listed in Exhibit ES-2. The costs include a credit of $60/MWh for excess
power generated. The sensitivity of economic results to the power credit and different financing
structures is included in Section 5.2.
To achieve economic viability, a commercial-scale CTL facility equipped for CO2 sequestration
will require crude oil prices to be above $133.8/bbl (in the case with no incentives) and
$115.6/bbl (in the moderate incentives case) to obtain parity with petroleum derived diesel.
Exhibit ES-4 summarizes the results of the study, presenting the equivalent crude oil prices and
equivalent petroleum diesel prices for each scenario. The sequestration case with no loan
guarantees has the highest ECO price and EPD price ($133.8/bbl and $167.2/bbl, respectively).
The case that includes incentives and does not sequester CO2 has the lowest ECO price and EPD
$0
$1,000,000
$2,000,000
$3,000,000
$4,000,000
$5,000,000
$6,000,000
$7,000,000
$8,000,000
$9,000,000
Sequestration Venting
Tota
l Ove
r N
igh
t C
ost
, 10
00$
Delta = $133,292

Cost and Performance Baseline for Fossil Energy Plants Volume 4: CTL via F-T Synthesis
6
price ($106.9/bbl and $133.6/bbl, respectively) due primarily to the lower CCF, but also in part
to the increased power production, reduced auxiliary loads, and reduced capital cost resulting
from the exclusion of CO2 compression systems.
Exhibit ES-4 Comparison of ECO bbl and EPD bbl
Source: NETL
133.8124.7
115.6106.9
167.2155.9
144.5133.6
0
20
40
60
80
100
120
140
160
180
Sequestration Vent Sequestration Vent
No Incentives Incentives
$ p
er
bb
l
ECOEPD

Cost and Performance Baseline for Fossil Energy Plants Volume 4: CTL via F-T Synthesis
7
1 Introduction
The objective of this report is to assess the design and financial performance of a commercial-
scale coal-to-Fischer-Tropsch liquids plant using a dry-feed Shell Global Solutions-type
commercial gasifier with optimum carbon capture.
1.1 Site Description
All plants in this study are assumed to be located at a generic plant site in the Midwestern United
States, with ambient conditions and site characteristics as presented in Exhibit 1-1 and
Exhibit 1-2.
Exhibit 1-1 Site ambient conditions
Elevation, ft 0
Barometric Pressure, psia 14.7
Design Ambient Temperature, Dry Bulb, F 59
Design Ambient Temperature, Wet Bulb, F 51.5
Design Ambient Relative Humidity, % 60
Exhibit 1-2 Site characteristics
Location Greenfield, Midwestern United States
Topography Level
Size, acres 300
Transportation Rail, Road, Pipeline
Ash Disposal Off Site
Water Municipal (50%) / Groundwater (50%)
Access Landlocked, with access by railway and highway
CO2 Storage Delivered to plant boundary at 15.2 MPa (2,215 psia)
The following design parameters are considered site-specific and are not quantified for this
study. Allowances for normal conditions and construction are included in the cost estimates.
Flood plain considerations
Existing soil/site conditions
Water discharges and reuse
Rainfall/snowfall criteria
Seismic design
Buildings/enclosures
Fire protection
Local code height requirements
Noise regulations, and their impact on site and surrounding area

Cost and Performance Baseline for Fossil Energy Plants Volume 4: CTL via F-T Synthesis
8
1.2 Design Coal
The design coal assumed for this study is presented in Exhibit 1-3.
Exhibit 1-3 Design coal analysis – Illinois No. 6
Rank Bituminous
Seam Illinois No. 6 (Herrin)
Source Old Ben mine [3]
Proximate Analysis (weight %)a
As Received Dry
Moisture 11.12 0.00
Ash 9.70 10.91
Volatile Matter 34.99 39.37
Fixed Carbon 44.19 49.72
Total 100.00 100.00
Sulfur 2.51 2.82
HHV, kJ/kg 27,113 30,506
HHV, Btu/lb 11,666 13,126
LHV, kJ/kg 26,151 29,544
LHV, Btu/lb 11,252 12,712
Ultimate Analysis (weight %)
As Received Dry
Moisture 11.12 0.00
Carbon 63.75 71.72
Hydrogen 4.50 5.06
Nitrogen 1.25 1.41
Chlorine 0.29 0.33
Sulfur 2.51 2.82
Ash 9.70 10.91
Oxygenb 6.88 7.75
Total 100.00 100.00
Notes: a The proximate analysis assumes sulfur as volatile matter
b By difference
1.3 Environmental Requirements
The environmental control equipment used in the conceptual design conforms to best available
control technology (BACT) guidelines, which are summarized in Exhibit 1-4.

Cost and Performance Baseline for Fossil Energy Plants Volume 4: CTL via F-T Synthesis
9
Exhibit 1-4 BACT environmental design basis
Pollutant Environmental Design Basis
Control Technology Limit
Sulfur Oxides (SO2) Rectisol
®/Selexol/Econamine
Plus/Sulfinol-M + Claus Plant 99
+% or ≤ 0.050 lb/10
6Btu
Nitrogen Oxides (NOx) LNB and N2 Dilution primarily with humidification as needed
15 ppmvd (@ 15% O2)
Particulate Matter (PM) Cyclone/Barrier Filter/Wet Scrubber/AGR Absorber
0.006 lb/106Btu
Mercury (Hg) Activated Carbon Bed 95% removal
While the coal-to-liquids (CTL) process is considered a petrochemical complex, the regulations
on emissions considered in this study were for fossil-fuel-fired power plants. The current
regulation governing new fossil-fuel-fired power plants is the New Source Performance
Standards (NSPS) published in February 2006 and shown in Exhibit 1-5. These standards
supersede the previous performance standards established in 1978. [4] The new standards apply
to units with the capacity to generate greater than 73 MW of power by burning fossil fuels, as
well as cogeneration units that sell more than 25 MW of power and more than one-third of the
potential output capacity to any utility power distribution system. The rule also applies to
combined cycle, including integrated gasification combined cycle (IGCC) plants, and combined
heat and power combustion turbines that burn 75 percent or more synthetic-coal gas.
Exhibit 1-5 Standards of performance for electric utility steam-generating units built, reconstructed, or modified after February 28, 2005
Pollutant
New Units Reconstructed Units Modified Units
Emission Limit
% Reduction
Emission Limit
(lb/106Btu)
% Reduction
Emission Limit
(lb/106Btu)
% Reduction
PM 0.015 lb/106Btu 99.9 0.015 99.9 0.015 99.8
SO2 1.4 lb/MWh 95 0.15 95 0.15 90
NOx 1.0 lb/MWh N/A 0.11 N/A 0.15 N/A
The BACT emission limits assumed for this study exceed the emission requirements of the 2006
NSPS. It is possible that state and local requirements could supersede NSPS or BACT and
impose even more stringent requirements.
1.3.1 Carbon Dioxide
For both the sequestration and vent cases, the basis is an optimum removal based on carbon input
in the coal, and excluding carbon in the Fischer-Tropsch (F-T) product and the carbon that exits
the gasifier with the slag. CO2 is captured from the syngas leaving the gasifiers using the
Rectisol® process, from the vapor stream exiting the F-T reactor using a proprietary amine CO2-
removal system, and in the sequestration case only CO2 is captured from the fuel gas

Cost and Performance Baseline for Fossil Energy Plants Volume 4: CTL via F-T Synthesis
10
downstream of the water gas shift (WGS) unit using a proprietary amine system. The design
includes compression of the recovered CO2 to 2,215 psia for pipeline transport at the plant
boundary. The CO2 is transported 100 km (62 miles) via pipeline to a geologic sequestration
field for injection into a saline formation. The CO2 is transported and injected as a supercritical
fluid in order to avoid two-phase flow and achieve maximum efficiency. CO2 transport and
storage (T&S) performance specifications were independently estimated by the National Energy
Technology Laboratory (NETL). The T&S estimation methodology is explained in more detail
in the Quality Guidelines for Energy System Studies (QGESS) document “Carbon Dioxide
Transport and Storage Costs in NETL Studies.” [5]
1.3.2 Mercury
The mercury content in the Illinois No. 6 coal is reported as a mean value of 0.09 ppm (dry
basis), with a standard deviation of 0.06, based on 34 samples of coal shipped by Illinois mines.
Mercury capture from the syngas via activated carbon is assumed to be 95 percent, based on
experience at the Eastman Chemical plant. If additional capture is necessary, dual carbon beds
can be used to achieve greater than 99 percent mercury removal.
1.4 Raw Water Usage
Raw water makeup is assumed to be provided 50 percent by publicly owned treatment works
(POTW) and 50 percent from groundwater. The amount of raw water usage for an IGCC case
has been estimated in a previous study done for NETL. [5] In that study, raw water usage was
defined as the water metered from a raw water source and used in the plant processes for any and
all purposes, such as cooling tower makeup, condenser makeup, ash handling makeup, syngas
humidification, and quench system makeup. In that study, as in the current study, the plant is
equipped with an evaporative cooling tower, and all process blowdown streams are treated and
recycled to the cooling tower. This is the “lowest hanging fruit” on the water minimization
system.
Since the F-T plant differs from an IGCC plant, the technique for estimating water usage is
different and based on the following:
1. The power generation processes were modeled in the Aspen process simulation program,
which calculates the required cooling water load and stack water loss.
2. The Aspen model for the F-T synthesis area and the product upgrading area was used to
predict the required F-T cooling water load.
3. The total of the cooling tower blowdown and vaporization losses was predicted based on
the estimated cooling water circulation rate.
Other water minimization options are possible but were not factored into the present study. One
option to reduce the makeup water demand would be to add a reverse osmosis unit and treat the
cooling tower system blowdown streams and recycle them either to the cooling tower or steam
systems. However, most of the water loss is evaporative loss from the cooling towers. More air-
cooled heat exchangers could be added to reduce the load on the cooling tower and its
corresponding evaporative losses.
Another water minimization option includes recovering water from the coal dryer. The Shell-
based gasification process uses a dry-feed system, which is sensitive to the coal moisture content.

Cost and Performance Baseline for Fossil Energy Plants Volume 4: CTL via F-T Synthesis
11
Coal moisture consists of two parts: surface moisture and inherent moisture. For coal to flow
smoothly through the lock hoppers, the surface moisture must be removed. The Illinois No. 6
coal used in this study contains 11.12 percent total moisture on an as-received basis. It was
assumed that the coal must be dried to 5 percent moisture to allow for smooth flow through the
dry-feed system. The coal is simultaneously crushed and dried in the coal mill then delivered to
a surge hopper with an approximate 2-hour capacity. The drying medium is provided by
combining the off-gas from the Claus plant and a slipstream of clean syngas and passing them
through an incinerator. The incinerator flue gas, with an oxygen content of 6 volume percent, is
then used to dry the coal in the mill. The design does not include the recovery of water from the
coal drying system.

Cost and Performance Baseline for Fossil Energy Plants Volume 4: CTL via F-T Synthesis
12
1.5 Balance of Plant
Assumed balance of plant requirements are listed in Exhibit 1-6.
Exhibit 1-6 Balance of plant design requirements
Cooling system Recirculating, Evaporative Cooling Tower Cooling tower makeup water composition is available. [3]
Fuel and Other storage
Coal 30 days
Slag 30 days
Sulfur 30 days
Plant Distribution Voltage
Motors below 1 hp 110/220 volt
Motors 250 hp and below 480 volt
Motors above 250 hp 4,160 volt
Motors above 5,000 hp 13,800 volt
Steam and Gas Turbine generators 24,000 volt
Grid Interconnection voltage 345 kV
Water and Waste
Makeup Water Process water is available at a flow rate of 1,500 gpm. [3]
Feed water Process water treatment is included and will produce boiler feed quality water.
Process Wastewater Process wastewater and storm water that contacts equipment surfaces is collected and treated for recycle as slurry or quench makeup. Selected blowdown is discharged through a permitted discharge permit.
Sanitary Waste Disposal Design includes a packaged domestic sewage treatment plant with effluent discharged to the industrial wastewater treatment system. Sludge is hauled off site.
Water Discharge Most of the wastewater is recycled for plant needs. Blowdown is treated for chloride and metals, and discharged.
Solid Waste Slag is assumed to be a solid waste that is classified as non-hazardous. An offsite waste disposal site is assumed to have the capacity to accept waste generated throughout the life of the facility. Solid waste sent to disposal is at an assumed nominal fee per ton, even if the waste is hauled back to the mine. Solid waste generated that can be recycled or reused is assumed to have a zero cost to the technology.

Cost and Performance Baseline for Fossil Energy Plants Volume 4: CTL via F-T Synthesis
13
Process water and cooling water come from two different treatment facilities. The composition
and physical properties of each are shown in Exhibit 1-7.
Exhibit 1-7 Process and cooling water properties
Property Process Water Cooling Water
Total Dissolved Solids (TDS) 200 μS/cm 1250 μS/cm
Total Suspended Solids (TSS) N/A N/A
Hardness 100 mg/l as CaCO3 75 mg/l as CaCO3
Alkalinity 100 ppm 350 ppm
Sulfate 4 ppm 50 ppm
Chloride 10 ppm 200 ppm
Silica 30 mg/l 30 mg/l
Aluminum N/A N/A
Iron 0.25 mg/l 0.25 mg/l
Calcium 70 mg/l 25 mg/l
Magnesium 25 mg/l 45 mg/l
Phosphate 0.4 mg/l 6.0 mg/l (ortho)
Ammonia <1 mg/l 19 mg/l
Chlorine <0.1 mg/l <0.1 mg/l
pH 8.0 8.0
1.6 Economic Analysis
Estimates of capital cost, operating costs, and financial performance were updated using the best
available information and expressed in June 2011 dollars.
Capital cost and production cost estimates developed for the CTL plant were based on adjusted
vendor-furnished, actual cost data, or best possible projections (when necessary). The financial
performance of the facility was estimated using various costs, product prices, and financial
parameters to generate a cost of production (COP) value.
Detailed information pertaining to topics such as contracting strategy, EPC contractor services,
estimation of capital cost contingencies, owner’s costs, cost estimate scope, economic
assumptions, finance structures, cost of electricity, etc. are available in the April 2011 revision of
the QGESS document “Cost Estimation Methodology for NETL Assessment of Power Plant
Performance” [6] Select portions are repeated here for completeness.
Despite the application of process contingencies and other best efforts to realistically project the
cost of emerging technologies, it should be noted that such cost projections are often shown to be
optimistic when compared to actual costs. Accordingly, the "next commercial offering" cost
estimates in this report, while intended for plants that lie somewhere between first-of-a-kind
(FOAK) and nth-of-a-kind (NOAK) in the maturity spectrum, could be closer to NOAK plant
costs given the inherent "technology optimism" associated with projecting costs for emerging
technologies. Continuing research and development could result in technologies that are more
advanced than the emerging technologies assessed by this report, leading to costs that are lower
than those estimated herein.

Cost and Performance Baseline for Fossil Energy Plants Volume 4: CTL via F-T Synthesis
14
Detailed information regarding FOAK and NOAK can be found in the August 2013 revision of
the QGESS document “Technology Learning Curve (FOAK to NOAK)” [7]
1.6.1 Capital Costs
The cost estimation methodology is explained in more detail in Section 2.7 of “Cost and
Performance Baseline for Fossil Energy Power Plants, Volume 1: Bituminous Coal and Natural
Gas to Electricity.” [8]
Bare erected costs (BEC) comprises the cost of process equipment, on-site facilities and
infrastructure that support the plant (e.g., shops, offices, labs, road), and the direct and indirect
labor required for its construction and/or installation. The cost of EPC services and
contingencies are not included in BEC. BEC is an overnight cost expressed in base-year dollars.
Engineering, procurement, and construction costs (EPCC) comprise the BEC plus the cost of
services provided by the engineering, procurement and construction (EPC) contractor. EPC
services include: detailed design, contractor permitting (i.e., those permits that individual
contractors must obtain to perform their scopes of work, as opposed to project permitting, which
is not included here), and project/construction management costs. EPCC is an overnight cost
expressed in base-year dollars.
Total plant costs (TPC) comprise the EPCC plus project and process contingencies. TPC is an
overnight cost expressed in base-year dollars.
Total overnight capital costs (TOC) comprise the TPC plus all other overnight costs, including
owner’s costs. TOC is an “overnight” cost, expressed in base-year dollars and as such does not
include escalation during construction or interest during construction. The TOC for each plant
was calculated by adding owner’s costs to the total plant cost (TPC).
Total as-spent capital costs (TASC) are the sum of all capital expenditures as they are incurred
during the capital expenditure period including their escalation. TASC also includes interest
during construction. Accordingly, TASC is expressed in mixed, current-year dollars over the
capital expenditure period.
The capital costs have an estimated accuracy of +30/-15 percent, consistent with the screening
study level of design engineering applied to the two cases in the study. The accuracy reflects the
recommended practice 18R-97 guidelines of the AACE (formerly Association for the
Advancement of Cost Engineering International) for estimates intended for the purpose of a
“Feasibility Study” (AACE Class 4). [9] Exhibit 1-8 describes the characteristics of an AACE
Class 4 cost estimate. The value of the study lies not in the absolute accuracy of the individual
cases, but in the fact that both cases were evaluated under the same set of technical and economic
assumptions. The consistency of approach allows meaningful comparisons.
Exhibit 1-8 Features of an AACE Class 4 cost estimate
Project Definition
Typical Engineering Completed Expected Accuracy
1 to 15%
plant capacity, block schematics, indicated layout, process flow diagrams for main process
systems, and preliminary engineered process and utility
equipment lists
-15% to -30% on the low side, and +20% to +50% on the high side

Cost and Performance Baseline for Fossil Energy Plants Volume 4: CTL via F-T Synthesis
15
The costs are grouped according to a process/system oriented code of accounts. This type of
code-of-account structure has the advantage of grouping all reasonably allocable components of
a system or process so they are included in the specific system account. (This would not be the
case had a facility, area, or commodity account structure been chosen instead).
Process contingency was added to cost account items that were deemed to pose significant risk
due to lack of operating experience. Process contingency is intended to compensate for
uncertainty in cost estimates caused by performance uncertainties associated with the
development status of a technology. Process contingencies are applied to each plant section
based on its current technology status using guidelines in the AACE International Recommended
Practice 16R-90. [10]
Project contingency was added to the EPCC accounts to cover the cost of any additional
equipment or other costs that would result from a more detailed design. Project contingencies
are added to the summation of EPC and process contingency costs.
Both contingencies represent costs that are expected to occur. Each BEC account was evaluated
against the level of estimate detail and field experience to determine project contingency.
TOC values are expressed in June 2011 dollars. The estimate represents current commercial
offerings for the gasification and F-T technologies, or best possible projections for very near-term,
yet non-commercial, offerings. The estimates represent a complete fuels plant facility. The
boundary limit is defined as the total plant facility within the “fence line,” including the coal
receiving facilities, power generation facility, and water supply system. Costs were grouped
according to a process/system-oriented code of accounts.
1.6.2 Production Costs and Expenses
The production or operating and maintenance (O&M) costs described in this report section pertain
to charges associated with operating and maintaining the entire plant over its expected life.
O&M costs are determined on an annual basis for the first year of operation. Quantities for
major consumables such as fuel were taken from the heat and mass balance developed for this
application. Other consumables evaluated on the basis of the quantity required the use of
reference data. Operating labor costs were determined on the basis of the number of operators.
Maintenance costs were evaluated on the basis of requirements for each major plant section.
The O&M costs and expenses associated with the plant include:
Operating labor
Maintenance – material and labor
Administrative and support labor
Consumables
Fuel cost
Taxes and insurance
These costs and expenses are estimated on a reference basis and escalated to June 2011 dollars.
The costs assume normal operation and do not include the initial startup costs. The operating
labor, maintenance material and labor, and other labor-related costs were combined and then
divided into two components: fixed O&M costs, which are independent of liquids production,

Cost and Performance Baseline for Fossil Energy Plants Volume 4: CTL via F-T Synthesis
16
and variable O&M costs, which are proportional to liquids production. The variable O&M cost
estimate allocation is based on the plant capacity factor.
The other operating costs, consumables and fuel, are determined on a daily 100-percent
operating capacity basis and adjusted to an annual plant operation basis. The inputs for each
category of operating costs and expenses are identified in the succeeding subsections, along with
more specific discussion of the evaluation processes.
The petroleum equivalent diesel price is calculated by taking the cost of production for diesel in
$/bbl and multiplying this value by the ratio of the lower heating values of FT diesel and
petroleum diesel.
𝑃𝑒𝑡𝑟𝑜𝑙𝑒𝑢𝑚 𝐸𝑞𝑢𝑖𝑣𝑎𝑙𝑒𝑛𝑡 𝐷𝑖𝑒𝑠𝑒𝑙 𝑃𝑟𝑖𝑐𝑒 = (𝑃𝑒𝑡𝑟𝑜𝑙𝑒𝑢𝑚 𝐷𝑖𝑒𝑠𝑒𝑙 𝐿𝐻𝑉
𝐹𝑇 𝐷𝑖𝑒𝑠𝑒𝑙 𝐿𝐻𝑉) ∗ 𝐹𝑌 𝐶𝑂𝑃 𝐹𝑇 𝐷𝑖𝑒𝑠𝑒𝑙
The equivalent crude oil price is then calculated by multiplying the petroleum equivalent diesel
price by a factor of 0.80. The factor of 0.80 was calculated from data of historic spot prices
provided by the EIA from June 2009 through November 2013 for various fuel types.
𝐸𝑞𝑢𝑖𝑣𝑎𝑙𝑒𝑛𝑡 𝐶𝑟𝑢𝑑𝑒 𝑂𝑖𝑙 = 0.80 ∗ 𝑃𝑒𝑡𝑟𝑜𝑙𝑒𝑢𝑚 𝐸𝑞𝑢𝑖𝑣𝑎𝑙𝑒𝑛𝑡 𝐷𝑖𝑒𝑠𝑒𝑙 𝑃𝑟𝑖𝑐𝑒
This data was used to develop correlations between the various fuel prices and the WTI crude oil
price (Crude oil: Ultra-low sulfur diesel is 1.25 and Naphtha: Diesel is 0.70). The ECO price is
the theoretical crude oil price, based on historic data, which would produce the calculated COP.
1.6.3 Cost of Production of Liquid Fuels
The figure-of-merit in this report is the COP expressed in $/bbl. The COPs were calculated
using the Power Systems Financial Model (PSFM) which is a discounted cash flow model. [11]
The COP values is estimated to be the required revenue that yields a net present value of zero at
a given internal rate of return on equity (IRROE) for 30 years of operation based on the assumed
financial structure and escalations. COP is assumed to escalate at three percent per year for the
thirty-year economic life of the plant. All costs are expressed in June 2011 dollars.
The capital and operating costs for CO2 T&S were modeled based on the specifications in the
NETL QGESS: [5] In the sequestration case, the costs were combined with the plant capital and
operating costs to produce an overall COP.
There are two project financial structures: one is representative of commercial fuel projects and
the second is representative of a project with loan guarantees. The economic assumptions used
to estimate the COPs are shown in Exhibit 1-9 and Exhibit 1-10. [12,13]
Exhibit 1-9 Financial structure for fuels projects
Scenario Commercial Fuels Loan Guarantees
Percent Debt 50% 60%
Percent Equity 50% 40%
Debt Interest Rate 8.00% 4.56%
Internal Rate of Return on Equity (IRROE) 20% 20%
After Tax Weighted Cost of Capital 12.48% 9.70%
Capital Charge Factor (CCF) 0.218 0.170
Cost and Performance Baseline for Fossil Energy Plants Volume 4: CTL via F-T Synthesis
17
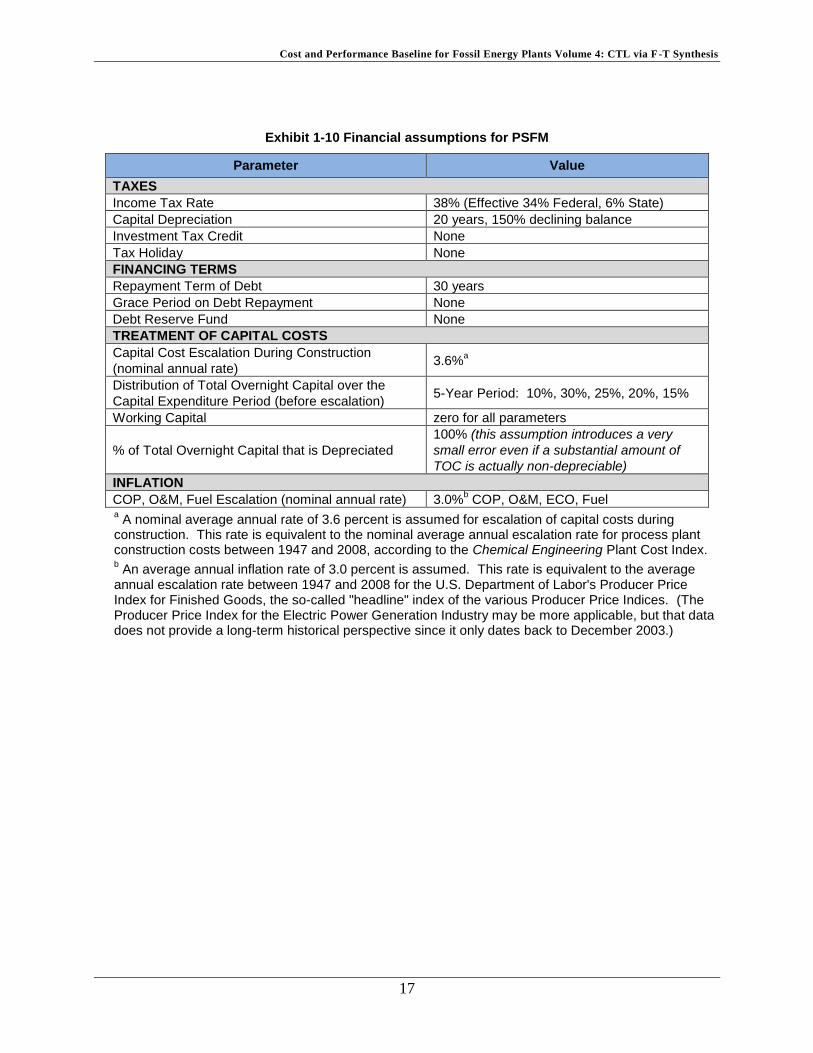
Exhibit 1-10 Financial assumptions for PSFM
Parameter Value
TAXES
Income Tax Rate 38% (Effective 34% Federal, 6% State)
Capital Depreciation 20 years, 150% declining balance
Investment Tax Credit None
Tax Holiday None
FINANCING TERMS
Repayment Term of Debt 30 years
Grace Period on Debt Repayment None
Debt Reserve Fund None
TREATMENT OF CAPITAL COSTS
Capital Cost Escalation During Construction
(nominal annual rate) 3.6%
a
Distribution of Total Overnight Capital over the
Capital Expenditure Period (before escalation) 5-Year Period: 10%, 30%, 25%, 20%, 15%
Working Capital zero for all parameters
% of Total Overnight Capital that is Depreciated
100% (this assumption introduces a very
small error even if a substantial amount of
TOC is actually non-depreciable)
INFLATION
COP, O&M, Fuel Escalation (nominal annual rate) 3.0%b COP, O&M, ECO, Fuel
a A nominal average annual rate of 3.6 percent is assumed for escalation of capital costs during
construction. This rate is equivalent to the nominal average annual escalation rate for process plant construction costs between 1947 and 2008, according to the Chemical Engineering Plant Cost Index. b An average annual inflation rate of 3.0 percent is assumed. This rate is equivalent to the average
annual escalation rate between 1947 and 2008 for the U.S. Department of Labor's Producer Price Index for Finished Goods, the so-called "headline" index of the various Producer Price Indices. (The Producer Price Index for the Electric Power Generation Industry may be more applicable, but that data does not provide a long-term historical perspective since it only dates back to December 2003.)

Cost and Performance Baseline for Fossil Energy Plants Volume 4: CTL via F-T Synthesis
18
2 Plant Configuration
The CTL process configuration chosen for this study is designed to
(1) Maximize the conversion of feedstocks to liquid transportation fuels, achieved
through recycling unreacted synthesis gas back to the reactor;
(2) Maximize diesel fuel as the primary liquid fuel product;
(3) Produce enough electrical power for the facility to be self-sufficient, but minimize
exported electrical power to a level no greater than 10 percent of the internal power
requirements for the CO2 sequestration case;
(4) Minimize the amount of CO2 and other greenhouse gases released to the atmosphere
during production of the fuel, in so far as plant performance or final product cost is
not significantly impacted.
The facility was designed to produce 50,000 bbl/day of F-T liquids using an iron-based catalyst
with an expected final product split of approximately 70:30 diesel/naphtha. This is in contrast to
the April 2007 study wherein F-T naphtha represented a more significant portion of the final
product, based on a desire to focus on gasoline production (via the upgrading of naphtha).
The production of additional diesel fuel in the current configuration requires that extra hydrogen
(compared to the previous design) be supplied to the diesel hydroprocessing units in the product
upgrading step. In addition, the wax hydrocracker model was redesigned to achieve higher
diesel fuel yields. The diesel produced in the facility is ready for delivery to end-use customers,
after the addition of the appropriate additives (additives are added at the distribution site). The
naphtha produced has been stabilized and can either be shipped to a refinery for further
upgrading to a commercial grade gasoline blendstock or sold as a chemical feedstock.
The plant achieves the goal of electrical power independence, in part, by recovering heat from
the Fischer-Tropsch synthesis reactors to produce steam, which is then used in a steam turbine
along with steam produced by syngas cooling and in the heat recovery steam generation unit. In
the CO2 sequestration case, the steam derived power represents 26 percent (29 percent in the CO2
vent case) of the electrical power generated in the CTL facility with the remaining 74 percent (71
percent in the CO2 vent case) being produced by the combustion of light gases recovered from
the reactor vapor overhead and the various product recovery and upgrading sections of the CTL
facility in the combustion turbines.
The final product slate of the facility is nominally:
35,230 bbl/day of F-T diesel fuel
14,762 bbl/day of stabilized (heteroatom, olefinic, and aromatic content is reduced) F-T
naphtha
The sequestration case produces 427.2 MWe of electrical power, 422.5 MWe of which is
used within the facility and 4.7 MWe of which is sold into the grid (1.1 percent of total
power production at a credit of $60/MWh. The vent case produces 472.8 MWe of
electrical power, 375.7 MWe of which is used within the facility and 97.1 MWe of which
is sold into the grid (20.5 percent of total power production) at a credit of $60/MWh.

Cost and Performance Baseline for Fossil Energy Plants Volume 4: CTL via F-T Synthesis
19
The sequestration case captures 26,405 tons/day of CO2 (2,200,423 lb/hr) and compresses
it to approximately 2,215 psia for pipeline transport from the facility to a geologic
formation 100 km (62 miles) away. The vent case vents 25,569 tons/day of CO2
(2,200,424 lb/hr) from the capture systems.

Cost and Performance Baseline for Fossil Energy Plants Volume 4: CTL via F-T Synthesis
20
3 System Description
The CTL plant design utilized in this report represents the culmination of “lessons learned” over
(a) the course of a number of years studying CTL facilities, (b) shifting environmental and
performance concerns, and (c) numerous sensitivity analyses to ascertain optimal process
performance.
A simplified process flow diagram of the major unit processes is provided in Exhibit 3-1 in order
to provide an overview of the CTL plant configuration. The CO2 vent case differs only in that it
does not include CO2 compression, water gas shift of the fuel gas, or CO2 capture from the fuel
gas.
Exhibit 3-1 Coal-to-liquids process flow diagram (red items only in sequestration case)
Source: NETL
Synthesis gas (syngas) is produced in a dry-feed Shell type gasifier. In order for the syngas to be
usable in an F-T synthesis reactor, it must be cleaned and treated. The major equipment used to
clean the syngas consists of a water-wash scrubber for particulate removal (which also has the
added benefit of removing some of the mercury), an activated carbon bed for mercury removal, a
WGS reactor2, a dual-stage Rectisol
® acid gas removal (AGR) system using a refrigerated
methanol solution for sulfur and CO2 removal3. A Claus plant is used to produce elemental
sulfur from the sulfur-containing gases captured in the AGR system.
2 Only a portion of the syngas is passed through the WGS reactor. The amount of syngas shifted is controlled to
obtain an overall H2:CO molar ratio between 1:1 and 1.1:1, as required for the F-T process.
3 CO2 is removed to reduce the volume of syngas, and therefore equipment sizes and capital expenditures. H2S and
COS are removed in order to protect the F-T catalyst.
Shell-based Gasifier,
Cooling Water Scrubber,
and Partial Water Gas
Shift
Air
Separation
Unit
CO2
Compression
Mercury
Removal
CO2
Removal
Combined
Cycle Power
Generation
WGS
Acid Gas
Treating and
Sulfur Recovery
Rectisol
Fischer-
Tropsch
Synthesis
Oxygen
Dry
Coal
Slag
Air
Oxygen to
Reformer
CO2
CO2 from
Rectisol
Export Power
Steam
to Power
Generation
Naphtha
Diesel Fuel
Sulfur
Oxygen
To CO2
Compression
or vented
Steam
Fuel gas
Vent
Tail Gas
Recycle
CO2
Removal
Hydrocarbon
Recovery
Product
Upgrading
Hydrogen
Recovery
FT Tail Gas Recycle
Hydrogen
CO2
F-T
Liquids
CO2
Light
Ends

Cost and Performance Baseline for Fossil Energy Plants Volume 4: CTL via F-T Synthesis
21
The clean syngas is then mixed with tail gas recycle from the hydrogen recovery unit and fed to
the low-temperature, slurry-phase, iron-based, F-T synthesis reactor, which converts the syngas
to saturated hydrocarbons. The majority of the hydrocarbon products (those with a carbon chain
length greater than four) are upgraded in the hydrocracking and hydrotreating units (Product
Upgrading in the flow diagram) to produce F-T diesel (70 percent by volume) and F-T naphtha
(30 percent by volume). The tail gas from the F-T unit, which includes unconverted CO and H2,
short chain hydrocarbons, and CO2 is processed in an amine unit for CO2 removal. This prevents
the buildup of CO2 in the recycle loop and reduces CO2 emissions from the facility (in the
scenario where captured CO2 is sequestered). A portion of the tail gas is then directly recycled to
the F-T reactor for maximum conversion of carbon to fuels, while the remainder is sent to: (a) a
combustion turbine and subsequent heat recovery steam generator (HRSG), (b) direct fired
heaters for coal drying, and (c) direct fired heaters for process heating needs.
The sequestration and vent cases differ in that:
1) In the sequestration case the CO2 streams from the syngas capture system (Rectisol®
), F-
T tail gas capture system (amine), and F-T fuel gas capture system (amine) are combined
and compressed, transported, and sequestered in a geologic formation.
2) In the vent case, there is no compression, transportation, or sequestration. The CO2 is
still captured in the syngas capture system and F-T tail gas capture system but not in the
F-T fuel gas capture system. The CO2 produced from the two capture systems is vented
into the atmosphere.
The steam produced by the recovery of heat in the F-T synthesis reactor, along with the steam
produced in the HRSG, is utilized in a steam turbine to produce power.
The combined output of the combustion and steam turbines is within 10 percent of total plant
electricity requirement for the CO2 capture case.
Individual process components are described in greater detail in the following sections.
3.1 Synthesis Gas Production
Exhibit 3-2 provides a simplified block flow diagram of the gasification and syngas cleanup
sections. The primary differences between the CO2 vent and sequestration cases are that: (a)
CO2 is captured in the CO2 vent case, but it is not compressed, but instead vented, (b) the CO2
vent case does not have water gas shift of the fuel gas or an amine CO2 capture system for the
fuel gas, and (c) the absence of these fuel gas treatment systems and CO2 compression results in
a lower auxiliary power requirement, as well as lower cooling water requirement for the facility,
therefore, the amount of power exported increases and the amount of water withdrawal
decreases. These differences are shown in the performance summaries provided in Exhibit 4-1
and Exhibit 4-2.

Cost and Performance Baseline for Fossil Energy Plants Volume 4: CTL via F-T Synthesis
22
Exhibit 3-2 Block flow diagram of the gasification, syngas shift, and acid gas removal area (sequestration only systems shown in red)
Source: NETL
Sour Water Stripper
1
Water
to Slurry & Blowdown
11
10
Clean Syngas to
F-T Synthesis
Dry
Coal
Slag
Note: Water from FT
area and TGCU
modeled but not shown
Mercury
Removal
14
Syngas
Raw Gas
Quench &
Cooling
Oxygen
ASUAir
5
Water
Scrubber
Rectisol®
Unit
Oxygen
Tail Gas to Gasifier
Claus
Plant
Note: Tail Gas boost compressor
modeled but not shown
Vent
Water-Gas Shift
Reactors
Coal
Dryer
Drying
Gas
Prep
9
2
Oxygen
To Claus Plant
20
6 Steam
CO2 Compressor
18Compressed CO2
13
Shift Steam
12 15
2Acid Gas
Dry-Feed
Gasifier
16
Sulfur
17
CO2 from F-T Synthesis
Gas Rectisol Unit and
from Fuel Gas Amine UnitFlue Gas
Fuel
Gas
8Coal

Cost and Performance Baseline for Fossil Energy Plants Volume 4: CTL via F-T Synthesis
23
Exhibit 3-3 Stream table for the gasification, syngas shift, and acid gas removal area – CO2 sequestration case
1 2 5 6 8 9 10 11 12
V-L Mole Fraction
Ar 0.0092 0.0318 0.0318 0.0000 0.0000 0.0000 0.0000 0.0067 0.0067
CH4 0.0000 0.0000 0.0000 0.0000 0.0000 0.0000 0.0000 0.0002 0.0002
CO 0.0000 0.0000 0.0000 0.0000 0.0000 0.0000 0.0000 0.4256 0.4256
CO2 0.0003 0.0000 0.0000 0.0000 0.0000 0.0000 0.0000 0.0190 0.0190
COS 0.0000 0.0000 0.0000 0.0000 0.0000 0.0000 0.0000 0.0005 0.0005
H2 0.0000 0.0000 0.0000 0.0000 0.0000 0.0000 0.0000 0.2034 0.2034
H2O 0.0099 0.0000 0.0000 1.0000 0.0000 1.0000 0.0000 0.3320 0.3320
HCl 0.0000 0.0000 0.0000 0.0000 0.0000 0.0000 0.0000 0.0002 0.0002
H2S 0.0000 0.0000 0.0000 0.0000 0.0000 0.0000 0.0000 0.0057 0.0057
N2 0.7732 0.0178 0.0178 0.0000 0.0000 0.0000 0.0000 0.0057 0.0057
NH3 0.0000 0.0000 0.0000 0.0000 0.0000 0.0000 0.0000 0.0010 0.0010
O2 0.2074 0.9504 0.9504 0.0000 0.0000 0.0000 0.0000 0.0000 0.0000
SO2 0.0000 0.0000 0.0000 0.0000 0.0000 0.0000 0.0000 0.0000 0.0000
Total 1.0000 1.0000 1.0000 1.0000 0.0000 1.0000 0.0000 1.0000 1.0000
V-L Flowrate (lbmol/hr) 210,973 845 40,525 9,376 0 6,298 0 218,718 185,910
V-L Flowrate (lb/hr) 1,522,014 27,189 1,304,136 168,908 0 113,459 0 4,336,854 3,686,326
Solids Flowrate (lb/hr) 0 0 0 0 1,750,518 1,637,058 175,324 0 0
Temperature (°F) 59 90 90 650 59 220 2,600 389 389
Pressure (psia) 14.70 125.00 125.00 740.00 14.70 14.70 615.00 575.00 575.00
Enthalpy (Btu/lb)A
30.23 26.67 26.67 3,063.97 --- 14,149.18 --- 1,043.28 1,043.28
Density (lb/ft3) 0.1 0.7 0.7 1.3 --- 0.0 --- 1.3 1.3
V-L Molecular Weight 28.857 32.181 32.181 18.015 --- 18.015 --- 19.829 19.829
A - Reference conditions are 32.02 F & 0.089 PSIA

Cost and Performance Baseline for Fossil Energy Plants Volume 4: CTL via F-T Synthesis
24
Exhibit 3-3 Stream table for the gasification, syngas shift, and acid gas removal area – CO2 sequestration case (continued)
13 14 15 16 17 18 19 20 35
V-L Mole Fraction
Ar 0.0000 0.0067 0.0063 0.0000 0.0000 0.0000 0.0000 0.0105 0.0000
CH4 0.0000 0.0002 0.0002 0.0000 0.0000 0.0000 0.0000 0.0003 0.4394
CO 0.0000 0.4256 0.3410 0.0000 0.0000 0.0000 0.0000 0.5602 0.0512
CO2 0.0000 0.0190 0.0764 1.0000 0.0000 1.0000 1.0000 0.0093 0.0008
COS 0.0000 0.0005 0.0004 0.0000 0.0000 0.0000 0.0000 0.0000 0.0000
H2 0.0000 0.2034 0.2495 0.0000 0.0000 0.0000 0.0000 0.4101 0.2001
H2O 1.0000 0.3320 0.3142 0.0000 0.0000 0.0000 0.0000 0.0000 0.0029
HCl 0.0000 0.0002 0.0002 0.0000 0.0000 0.0000 0.0000 0.0000 0.0000
H2S 0.0000 0.0057 0.0054 0.0000 0.0000 0.0000 0.0000 0.0000 0.0000
N2 0.0000 0.0057 0.0054 0.0000 0.0000 0.0000 0.0000 0.0096 0.3053
NH3 0.0000 0.0010 0.0010 0.0000 0.0000 0.0000 0.0000 0.0000 0.0003
O2 0.0000 0.0000 0.0000 0.0000 0.0000 0.0000 0.0000 0.0000 0.0000
SO2 0.0000 0.0000 0.0000 0.0000 0.0000 0.0000 0.0000 0.0000 0.0000
Total 1.0000 1.0000 1.0000 1.0000 0.0000 1.0000 1.0000 1.0000 1.0000
V-L Flowrate (lbmol/hr) 14,243 32,808 232,961 4,970 0 49,998 16,600 141,810 7,002
V-L Flowrate (lb/hr) 256,596 650,528 4,593,450 218,718 0 2,200,423 730,542 2,498,405 122,766
Solids Flowrate (lb/hr) 0 0 0 0 43,875 0 0 0 0
Temperature (°F) 550 389 401 80 359 121 60 95 385
Pressure (psia) 800.00 575.00 560.00 749.50 17.30 2,214.70 135.00 520.00 460.00
Enthalpy (Btu/lb)A
2,918.18 1,043.28 1,026.52 -43.00 --- -169.59 3.27 51.50 378.62
Density (lb/ft3) 1.6 1.3 1.2 8.7 329.1 41.7 1.1 1.5 0.9
V-L Molecular Weight 18.015 19.829 19.718 44.010 --- 44.010 44.010 17.618 17.533

Cost and Performance Baseline for Fossil Energy Plants Volume 4: CTL via F-T Synthesis
25
Exhibit 3-4 Stream table for the gasification, syngas shift, and acid gas removal area – CO2 vent case
1 2 3 6 8 9 10 11 12
V-L Mole Fraction
Ar 0.0092 0.0318 0.0318 0.0000 0.0000 0.0000 0.0000 0.0067 0.0067
CH4 0.0000 0.0000 0.0000 0.0000 0.0000 0.0000 0.0000 0.0002 0.0002
CO 0.0000 0.0000 0.0000 0.0000 0.0000 0.0000 0.0000 0.4256 0.4256
CO2 0.0003 0.0000 0.0000 0.0000 0.0000 0.0000 0.0000 0.0190 0.0190
COS 0.0000 0.0000 0.0000 0.0000 0.0000 0.0000 0.0000 0.0005 0.0005
H2 0.0000 0.0000 0.0000 0.0000 0.0000 0.0000 0.0000 0.2034 0.2034
H2O 0.0099 0.0000 0.0000 1.0000 0.0000 1.0000 0.0000 0.3320 0.3320
HCl 0.0000 0.0000 0.0000 0.0000 0.0000 0.0000 0.0000 0.0002 0.0002
H2S 0.0000 0.0000 0.0000 0.0000 0.0000 0.0000 0.0000 0.0057 0.0057
N2 0.7732 0.0178 0.0178 0.0000 0.0000 0.0000 0.0000 0.0057 0.0057
NH3 0.0000 0.0000 0.0000 0.0000 0.0000 0.0000 0.0000 0.0010 0.0010
O2 0.2074 0.9504 0.9504 0.0000 0.0000 0.0000 0.0000 0.0000 0.0000
SO2 0.0000 0.0000 0.0000 0.0000 0.0000 0.0000 0.0000 0.0000 0.0000
Total 1.0000 1.0000 1.0000 1.0000 0.0000 1.0000 0.0000 1.0000 1.0000
V-L Flowrate (lbmol/hr) 52,743 211 494 2,344 0 1,574 0 54,679 46,478
V-L Flowrate (lb/hr) 1,522,010 6,797 15,900 42,227 0 28,365 0 1,084,214 921,581
Solids Flowrate (lb/hr) 0 0 0 0 437,629 409,265 43,831 0 0
Temperature (°F) 59 90 90 650 59 220 2,600 389 389
Pressure (psia) 14.7 125.0 125.0 740.0 14.7 14.7 615.0 575.0 575.0
Enthalpy (Btu/lb)A
13.0 11.5 11.5 1,317.3 --- 6,083.1 --- 448.5 448.5
Density (lb/ft3) 0.076 0.687 0.687 1.257 --- 0.037 --- 1.277 1.277
A - Reference conditions are 32.02 F & 0.089 PSIA

Cost and Performance Baseline for Fossil Energy Plants Volume 4: CTL via F-T Synthesis
26
Exhibit 3-4 Stream table for the gasification, syngas shift, and acid gas removal area – CO2 vent case (continued)
13 14 15 16 17 18 20 35
V-L Mole Fraction
Ar 0.0000 0.0067 0.0063 0.0000 0.0000 0.0000 0.0105 0.0000
CH4 0.0000 0.0002 0.0002 0.0000 0.0000 0.0000 0.0003 0.5918
CO 0.0000 0.4256 0.3410 0.0000 0.0000 0.0000 0.5602 0.0396
CO2 0.0000 0.0190 0.0764 1.0000 0.0000 1.0000 0.0093 0.0026
COS 0.0000 0.0005 0.0004 0.0000 0.0000 0.0000 0.0000 0.0000
H2 0.0000 0.2034 0.2495 0.0000 0.0000 0.0000 0.4101 0.0479
H2O 1.0000 0.3320 0.3142 0.0000 0.0000 0.0000 0.0000 0.0011
HCl 0.0000 0.0002 0.0002 0.0000 0.0000 0.0000 0.0000 0.0000
H2S 0.0000 0.0057 0.0054 0.0000 0.0000 0.0000 0.0000 0.0000
N2 0.0000 0.0057 0.0054 0.0000 0.0000 0.0000 0.0096 0.3171
NH3 0.0000 0.0010 0.0010 0.0000 0.0000 0.0000 0.0000 0.0000
O2 0.0000 0.0000 0.0000 0.0000 0.0000 0.0000 0.0000 0.0000
SO2 0.0000 0.0000 0.0000 0.0000 0.0000 0.0000 0.0000 0.0000
Total 1.0000 1.0000 1.0000 1.0000 0.0000 1.0000 1.0000 1.0000
V-L Flowrate (lbmol/hr) 3,561 8,202 58,240 1,242 0 12,104 35,453 1,714
V-L Flowrate (lb/hr) 64,149 162,632 1,148,363 54,680 0 532,696 624,601 33,801
Solids Flowrate (lb/hr) 0 0 0 0 10,969 0 0 0
Temperature (°F) 550 389 401 80 359 121 95 385
Pressure (psia) 800.0 575.0 560.0 749.5 17.3 2,214.7 520.0 460.0
Enthalpy (Btu/lb)A
1,254.6 448.5 441.3 -18.5 --- -72.9 22.1 148.4
Density (lb/ft3) 1.597 1.277 1.217 9 329.101 41.660 1.528 0.999

Cost and Performance Baseline for Fossil Energy Plants Volume 4: CTL via F-T Synthesis
27
3.1.1 Air Separation Unit
The facility is equipped with a total of four air separation units (ASU) for the eight gasifier
trains. Each ASU, composed of two cold boxes, is designed to produce a nominal output of
15,182 tonne/day (16,739 tpd) of 95 mole percent O2. This O2 is used in the gasifier, F-T plant,
and Claus plant. The ASU is designed with two production trains. The air compressors are
powered by an electric motor. There is no direct integration between the ASU and the rest of the
facility. A process schematic of a typical ASU is shown in Exhibit 3-6
The air feed to the air separation unit is supplied from stand-alone air compressors. The filtered
air is compressed in centrifugal compressors, with intercooling between each stage. The air
stream is cooled and then fed to an adsorbent-based pre-purifier system.
Air from the stand-alone compressor is cooled and fed to an adsorbent-based pre-purifier system.
The adsorbent removes water, CO2, and C4+ saturated hydrocarbons in the air. After passing
through the adsorption beds, the air is filtered with a dust filter to remove any adsorbent fines
that may be present. Downstream of the dust filter a small stream of air is withdrawn to supply
the instrument air requirements of the ASU.
Regeneration of the adsorbent in the pre-purifiers is accomplished by passing a hot nitrogen
stream through the off-stream bed(s) in a direction countercurrent to the normal airflow. The
nitrogen is heated against extraction steam (1.7 MPa [250 psia]) in a shell and tube heat
exchanger. The regeneration nitrogen drives off the adsorbed contaminants. Following
regeneration, the heated bed is cooled to near normal operating temperature by passing a cool
nitrogen stream through the adsorbent beds. The bed is re-pressurized with air and placed on
stream so that the current on-stream bed(s) can be regenerated.
The air from the pre-purifier is then split into three streams. About 70 percent of the air is fed
directly to the cold box. About 25 to 30 percent of the air is compressed in an air booster
compressor. This boosted air is then cooled in an aftercooler against cooling water before it is
fed to the cold box. About 5 percent of the air is fed to a turbine-driven, single-stage, centrifugal
booster compressor. This stream is cooled in a shell and tube aftercooler against cooling water
before it is fed to the cold box.
All three air feeds are cooled in the cold box to cryogenic temperatures against returning product
oxygen and nitrogen streams in plate-and-fin heat exchangers. The large air stream is fed
directly to the first distillation column to begin the separation process. The second air stream is
liquefied against boiling liquid oxygen before it is fed to the distillation columns. The third,
small air stream is fed to the cryogenic expander to produce refrigeration to sustain the cryogenic
separation process. The work produced from the expansion is used to power the turbine booster
compressor.
Inside the cold box the air is separated into oxygen and nitrogen products. The oxygen product
is withdrawn from the distillation columns as a liquid and is pressurized in a cryogenic pump.
The pressurized liquid oxygen is then vaporized against the high-pressure air feed before being
warmed to ambient temperature. The gaseous oxygen exits the cold box and is split into two
streams. Essentially all of the gaseous oxygen is fed to the centrifugal compressor with
intercooling between each stage of compression. The compressed oxygen is then fed to the
gasification unit. The second oxygen stream is fed to the Claus plant, the autothermal reformers
in the F-T area, and to the autothermal reformer in the fuel gas cleanup area.

Cost and Performance Baseline for Fossil Energy Plants Volume 4: CTL via F-T Synthesis
28
Nitrogen is produced from the cold box at two pressure levels. Low-pressure nitrogen is split
into two streams. The majority of the low-pressure nitrogen is compressed and fed to the gas
turbine as diluent nitrogen. A small portion of the nitrogen is used as the regeneration gas for the
pre-purifiers and recombined with the diluent nitrogen. A high-pressure nitrogen stream is also
produced from the cold box and is further compressed before it is also supplied to the gas
turbine.
Exhibit 3-5 Typical ASU process schematic
Source: NETL
3.1.2 Coal Drying
The Shell-based gasification process uses a dry-feed system that is sensitive to the coal moisture
content. Coal moisture consists of two parts: surface moisture and inherent moisture. For coal to
flow smoothly through the lock hoppers, the surface moisture must be removed. The Illinois No.
6 coal used in this study contains approximately eleven weight-percent total moisture on an as-
received basis. It was assumed that the coal must be dried to approximately 5 percent moisture
to allow for smooth flow through the dry feed system.
The coal is simultaneously crushed and dried in the coal mill and then delivered to a surge
hopper, which has approximately a two-hour capacity. The drying medium is provided by
combining the off-gas from the Claus plant and a slipstream of F-T tail gas and passing them

Cost and Performance Baseline for Fossil Energy Plants Volume 4: CTL via F-T Synthesis
29
through an incinerator. The incinerator flue gas, with an oxygen content of 6 volume percent, is
used to dry the coal in the mill.
The coal is drawn from the surge hoppers and fed through a pressurized lock hopper system to a
dense phase pneumatic conveyor, which uses CO2 recovered from the syngas to convey the coal
to the gasifiers.
The equipment in the coal drying and grinding system is fabricated of materials appropriate for
the abrasive environment present in the system. The tanks and agitators are rubber lined. The
pumps are either rubber-lined or hardened metal to minimize erosion. Piping is fabricated of
high-density polyethylene (HDPE).
3.1.3 Gasifier
The gasifier is a dry-feed, single-stage, entrained-flow gasification system similar to a Shell
Global Solutions commercial design. The gasifier system includes high-temperature gas cooling
via syngas recycle, slag handling, and solid waste handling equipment. The gasifier also
includes a refractory-lined water wall that is protected by molten slag that solidifies on the
cooled walls.
The heat recovery from the gasifier is broken into two stages. The first stage 1) recovers high-
temperature heat in each gasifier train via a gasifier jacket, which cools the syngas by
maintaining the reaction temperature at 1,427°C (2,600°F). The second stage 2) reduces the
temperature of the product gas from the gasifier to 1,082°C (1,980°F) by mixing in recycled gas,
then to 399 °C (750°F) with water quench, which provides a portion of the water required for the
WGS reaction.
The gasification system consists of four gasifier trains with two gasifiers in each train, along with
one spare gasifier, for a total of nine dry-feed gasifiers. The spare gasifier is included to
maintain overall plant availability of 90 percent. The gasification plant section was modeled as
four copies of a single gasification train to enable direct comparison with baseline study case
models of similar size, and the results were combined to generate the required quantity of syngas
for the F-T facility.
These gasifiers, operate at 4.2 MPa (615 psia) and process a total of 19,056 tonne/day
(21,006 tpd) of as-received coal for both the CO2 sequestration and vent cases. Coal reacts with
oxygen and steam at a temperature of 1,427 °C (2,600 °F) to produce principally H2 and CO,
with little CO2 or CH4 formed.
3.1.4 Particulate Removal
After passing through the water quench, the syngas passes through a cyclone and a raw gas
candle filter system where a majority of the fine particles are removed and returned to the
gasifier with the coal fuel. The filter consists of an array of ceramic candle elements in a
pressure vessel. Fines produced by the gasification system are recirculated to extinction. The
ash that is not carried out with the gas forms slag and runs down the interior walls, exiting the
gasifier in liquid form. The slag is solidified in a quench tank for disposal. Lockhoppers reduce
the pressure of the solids from 4.2 MPa to atmospheric pressure 1.0 MPa (615 to 14.7 psia).
Following the water quench and particulate removal, the syngas is cooled to 232°C (450°F)
before going to the syngas scrubber by vaporizing high-pressure boiler feed water (BFW) and

Cost and Performance Baseline for Fossil Energy Plants Volume 4: CTL via F-T Synthesis
30
pre-heating intermediate-pressure BFW. The syngas scrubber removes residual particulate
matter further downstream.
3.1.5 Gas Scrubbing
The “sour” gas leaving the particulate filter system consists mostly of H2, CO, CO2, water vapor,
N2, and smaller quantities of CH4, COS, H2S, and NH3.
The quench scrubber washes the syngas in a counter-current flow in two packed beds. The
syngas leaves the scrubber saturated at a temperature of 193 °C (379 ºF). The quench scrubber
removes essentially all of the entrained particles, principally unconverted carbon, slag, and
metals. The bottoms from the scrubber are sent to the slag removal and handling system for
processing.
Sour water from the syngas scrubber is stripped of sour gas and treated for recycle or discharge.
The sour water stripper removes chlorides, NH3, and other impurities from the waste water
stream of the scrubber. The sour gas stripper consists of a sour drum that accumulates sour water
from the gas scrubber and condensate from synthesis gas coolers. Sour water from the drum
flows to the sour water stripper, which consists of a packed column with a steam-heated reboiler.
Sour gas is stripped from the liquid at about 250 °F and sent to the sulfur recovery unit.
Remaining water is sent to wastewater treatment.
3.1.6 Water Gas Shift through Acid Gas Removal
The required operating parameters of the F-T synthesis reactor are satisfied with the WGS and
AGR units. These parameters (H2:CO, H2O:CO, and stoichiometric number [S#]) are described
below and reported in Exhibit 3-6. The metrics apply to the total F-T reactor feed, which
includes the clean syngas, steam and recycle from the hydrocarbon recovery process.
Exhibit 3-6 F-T reactor syngas operating parameters for both cases
Parameter Value
S# 1 0.98
H2:CO 2
1.02
H2O:CO 3 1.80
1Synthesis gas metric at the inlet of the F-T reactor
2Ratio of hydrogen to carbon monoxide at the inlet of the F-T reactor
3Ratio of moisture to carbon monoxide at the inlet to the WGS units
The H2:CO ratio is simply calculated by dividing the moles of hydrogen by the moles of carbon
monoxide in the syngas stream. Due to the ability of the iron-based F-T catalyst to promote
water gas shift in situ enabling CO2 to be a source of carbon, the F-T reactor requires a relatively
low H2/CO molar ratio of 1:1 to 1.1:1.
The H2O:CO ratio was based on common practice and assures an atmosphere conducive to
shifting and provides a suitable moisture content at the WGS exit to prevent coking.

Cost and Performance Baseline for Fossil Energy Plants Volume 4: CTL via F-T Synthesis
31
The S# metric is calculated using the following equation:
𝑆# =(𝐻2 − 𝐶𝑂2)
(𝐶𝑂 + 𝐶𝑂2)⁄
In systems without significant water gas shift activity, the S# is targeted to values near 2 [14].
Since the iron-based catalyst promotes the WGS reaction, the S# is less than 2 in the study cases.
The process descriptions are provided in the following subsections.
3.1.6.1 Water Gas Shift
In order to achieve the desired H2:CO ratio of 1:1 at the reactor inlet, about 15 percent of the
syngas is routed through two WGS reactors in series. The WGS reactors convert most of the CO
to H2 and CO2 by reacting the CO with water over a fixed bed of catalyst via the water gas shift
reaction shown below.
𝑊𝑎𝑡𝑒𝑟 𝐺𝑎𝑠 𝑆ℎ𝑖𝑓𝑡: 𝐶𝑂 + 𝐻2𝑂 ↔ 𝐶𝑂2 + 𝐻2
Steam is injected prior to the first stage of WGS to adjust the H2O/CO molar ratio.
As water gas shift is a net exothermic process, the heat of reaction must be managed between
stages. The exiting temperature of the first stage is 470 °C (878 ºF), which is an increase over
the inlet temperature of 219 °C (426 ºF). The temperature is reduced by utilizing a heat
exchanger that reduces the temperature to 204 °C (400 ºF) by producing steam.
The temperature again rises to 254 °C (489 ºF) in the second stage of WGS. This heat is
recovered (the temperature is reduced to 230 °C (446 ºF)) by preheating the syngas exiting the
gas scrubber (described in Section 3.1.5) to 198 °C (389 °F) from 193 °C (379 °F) prior to
entering the first stage of WGS.
The two stages of WGS result in a 95.6 percent overall conversion of CO to CO2. The WGS
catalyst also serves to hydrolyze COS thus eliminating the need for a separate COS hydrolysis
reactor.
The shifted syngas rejoins the bypassed syngas and enters the low temperature cooling system,
where it is cooled to 35 °C (95 °F) prior to the mercury removal beds.
3.1.6.2 Mercury Removal
Mercury is removed by packed beds of sulfur-impregnated carbon similar to what has been used
at the Eastman Chemical gasification plant in Kingsport, Tennessee. A bed of sulfur-
impregnated carbon, with approximately a 20-second superficial gas residence time, can achieve
95 percent mercury removal in addition to removal of other volatile heavy metals, such as
arsenic. The spent carbon sorbent is discarded as a hazardous waste with a disposal cost of
$1,300/ton.
3.1.6.3 Acid Gas Removal
A feature of this plant configuration is that COS, H2S, and CO2 are removed from the syngas
within the same process system, the Rectisol® unit. The purpose of the Rectisol
® unit, which
utilizes a refrigerated methanol solvent, is to preferentially remove H2S and COS as a product
stream, and then to remove the remaining H2S and a majority of the CO2. This is achieved in the

Cost and Performance Baseline for Fossil Energy Plants Volume 4: CTL via F-T Synthesis
32
dual-stage Rectisol® unit. Since the Rectisol
® system removes COS, the COS hydrolysis pre-
treatment step is unnecessary and has been eliminated.
The use of methanol prevents formation of ice and hydrates at the low operating temperatures.
Cool, dry, particulate-free syngas enters the first absorber unit at approximately 100 ºF and
520 psia. The low operating temperatures are beneficial, because at these temperatures the
solvent carrying capacity for both CO2 and H2S becomes very high. (1) These features allow for
high separations of both CO2 and H2S.
The low temperature operation can lead to complicated flow schemes, as well as elevated plant
costs. (1) Therefore, Rectisol generally finds application only in relatively difficult gas treating
conditions where extremely high purities are required.
Shown below in Exhibit 3-7 is an example Rectisol process employed as the Texaco refinery, in
Wilmington, CA. (2) The unit was built by Linde A.G. of Munich and is part of a hydrogen
production train where vacuum residual oil is gasified to provide hydrogen for the refinery.
Exhibit 3-7 Rectisol process flow diagram example
Source: EPA
The feedgas (stream 1) is first cooled against the separation products, and is sent to the main
absorber where H2S and CO2 are removed in the bottom section of the tower. The sulfur-free gas
is washed in the top section of the main absorber to remove remaining CO2 (stream 2). The
bottom product from the main absorber contains all H2S, some CO2, and some H2. This stream is
flashed to recover H2 from the loaded methanol solvent. The H2 is pressurized and recycled to
the feedgas inlet. The bottoms product of the flash is sent to the H2S enrichment column to
remove additional CO2 to achieve the required H2S concentration. This is accomplished with the
stripping gas (stream 6), which is nitrogen obtained from the oxygen plant. The CO2 rich off gas
(stream 3b) is combined with the off gas from the cold stripper (stream 3a) and is the product
CO2 stream (stream 3), which is vented to the atmosphere or compressed (see Section 3.1.7).

Cost and Performance Baseline for Fossil Energy Plants Volume 4: CTL via F-T Synthesis
33
The bottom of the H2S enrichment column is sent to the warm stripper where the absorbed H2S
and CO2 are stripped and sent to the Claus plant (stream 4).
The stream of CO2-loaded methanol, leaving the CO2-absorption section of the main absorber
(middle section) after H2 flashing, is stripped with nitrogen in the cold stripper, and the overhead
(stream 3a) is combined with stream 3b, as discussed prior. The bottoms of the cold stripper,
partially stripped, cold methanol, is sent back to the main absorber. The methanol/water mixture
condensed from the feed gas is separated in the methanol water separation still to produce an
overhead methanol stream, which is recycled, and a bottoms waste water stream (stream 5).
The amine CO2 capture systems associated with the F-T tail gas and F-T fuel gas are discussed in
Section 3.2.
3.1.7 CO2 Compression and Dehydration
CO2 is generated at three pressure levels from the AGR process. In the CO2 vent case, this CO2
is vented to the atmosphere, while in the sequestration case the low pressure (LP) stream is
compressed from 0.15 MPa (22 psia) to 1.1 MPa (160 psia) and then combined with the medium
pressure (MP) stream. The high pressure (HP) stream is combined between compressor stages at
2.1 MPa (300 psia). The combined stream is compressed from 2.1 MPa (300 psia) to a
supercritical condition at 15.3 MPa (2,215 psia) using a multiple-stage, intercooled compressor.
During compression, the CO2 stream is dehydrated to a dewpoint of -40 ºC (-40 °F) with
triethyleneglycol. The raw CO2 stream from the Rectisol® process contains over 99 percent CO2
with the balance being primarily nitrogen and hydrogen, for modeling purposes it was treated as
100 percent CO2. The pure CO2 is transported via pipeline to a geologic sequestration site 100
km (62 miles).
3.1.8 Claus Unit
Acid gas from each Rectisol® stripper unit is routed to the associated Claus plant. The Claus
plant partially oxidizes the H2S in the acid gas to elemental sulfur. The rate of sulfur recovery is
approximately 43,875 lb/hr in both cases. This rate represents ~100 percent recovery.
Acid gas from the Rectisol® unit is preheated to 450 °F. A portion of the acid gas, along with all
of the sour water stripper overhead vapor and oxidant, is fed to the Claus furnace. In the furnace,
H2S is oxidized to SO2 using 95 percent oxygen. A furnace temperature greater than 2,450 °F
must be maintained in order to thermally decompose all of the NH3 present in the sour gas
stream.
Three preheaters and three sulfur converters are used to obtain a per-pass H2S conversion
efficiency of approximately 97.8 percent. In the furnace waste heat boiler, 650 psia steam is
generated. This steam is used to satisfy all Claus process preheating and reheating requirements
as well as to produce excess steam that is sent to the medium-pressure steam header. The sulfur
condensers produce 50 psig steam that goes to the low-pressure steam header.
3.1.9 Zinc Oxide
While the Rectisol® system is capable of reducing the sulfur levels to between 0.1 and 1.0 ppm,
which are sufficiently low for an F-T process using iron-based catalyst, the long term on-
specification operation of the Rectisol® unit cannot be guaranteed.

Cost and Performance Baseline for Fossil Energy Plants Volume 4: CTL via F-T Synthesis
34
Therefore, the treated, clean syngas is fed to a packed bed of solid zinc oxide (ZnO) to remove
any residual heteroatom content (i.e., sulfur) that makes it through the syngas treatment
processes. The zinc oxide is a final guard bed to protect the Fischer-Tropsch synthesis catalyst
and is capable of reducing the sulfur content of the sweet gas to the F-T feed to less than 1 ppb.
The cost of the addition of the required two ZnO beds to the process is insignificant compared to
the total plant cost. If the sulfur polishing step were not there during an upset in the Rectisol®
unit, the entire amount of F-T catalyst in the reactors might be poisoned and would have to be
replaced. The cost of the shutdown and lost production would far outweigh the cost of the sulfur
polishing unit. The addition of this unit is insurance in the same manner that spares are installed
for almost all liquid pumps.
3.2 Fischer-Tropsch Synthesis
The cleaned syngas is preheated and mixed with steam and recycled tail gas and fed to the
slurry-bed F-T hydrocarbon synthesis reactor (which operates at around 475oF and 300 psia).
The coal-derived syngas has a hydrogen-to-carbon monoxide (H2:CO) ratio of 0.73, prior to tail
gas recycle (1.02 post tail gas recycle), which is converted in the F-T reactor to straight chain
olefinic and aliphatic hydrocarbons with a H:C ratio of approximately 2.1. Use of an iron-based
F-T catalyst (as opposed to cobalt-based) is preferred when utilizing low H2:CO ratio syngas as
the iron-based catalyst also promotes WGS activity, which allows a portion of the WGS reaction
to occur in the reactor. This additional WGS activity within the reactor produces a liquid
product with a H:C ratio that is higher than the H2:CO ratio of the inlet syngas.
The F-T reactor consists of two parallel first-stage slurry beds that feed a common second-stage
slurry bed. The conceptual design of the F-T synthesis section is represented in Exhibit 3-8.
Unconverted synthesis gas is cooled between the first and second stages to 65.6oC (150
oF) to
remove water and a hot hydrocarbon condensate (which is sent to product recovery), and then re-
heated prior to entering the second stage. Each stage accomplishes approximately 61 percent
conversion of carbon monoxide (hydrogen is in excess) leading to a per-pass conversion of 85
percent of carbon monoxide. There is no direct recycle of unconverted synthesis gas back into
the second-stage reactor (the implementation of the recycle loop is discussed in a subsequent
section).
Reactor temperature is modulated by removing tremendous heat released by the Fischer-Tropsch
process through generation of 24.8 bar (360 psig) steam through bayonet tubes suspended from
an internal double tubesheet. The reactors operate at 21-22 bar (305-319 psia) and nominally
249oC (480
oF)
4.
Synthesis gas is introduced into the reactors through a cylindrical gas distributor and bubbles up
through the slurry phase. Fischer-Tropsch wax and catalyst make up the slurry phase, into which
the synthesis gas dissolves, contacts the catalyst, and is oligomerized, producing more Fischer-
Tropsch liquids. Streams of liquid wax are withdrawn from the reactors with a slurry valve,
which accomplishes the majority of the catalyst-wax separation.
4 The outlet temperature is set by the target that was yield in the systems model, with this choice being at the edge of
the operating window referred to as low temperature Fischer-Tropsch synthesis.

Cost and Performance Baseline for Fossil Energy Plants Volume 4: CTL via F-T Synthesis
35
Exhibit 3-8 Simplified representation of the F-T synthesis section
Source: NETL
Vapor is removed from the overhead of the first-stage reactor passing through a cyclone to
prevent liquid carryover. The vapor is cooled and sent to a three-phase separator. The hot
condensate (light liquid hydrocarbons) is recovered for further use. The water is sent to
treatment, and the remaining vapors are reheated and sent to the second-stage reactor.
A cyclone removes entrained catalyst particles from the vapor stream leaving the top of the F-T
reactor before being sent to a condenser for recovery of condensable hydrocarbon products,
which are then processed in hydrotreaters in the product upgrading section of the plant.
The remaining vapor stream – containing unreacted syngas, inerts, and light hydrocarbons
(predominantly methane, ethane, and propane) – is processed in an amine unit for CO2 removal
to prevent CO2 build up in the recycle loop and reduce equipment sizes. In the sequestration
case, the captured CO2 is sent to the gasification section for compression with CO2 from the
Rectisol® unit. In the vent case it is merely vented to the atmosphere. A portion of the vapor
stream is compressed for recycle to the F-T reactor while the rest of the gas is sent through a
hydrogen recovery process to separate out hydrogen that is used for hydrotreating the liquids.
The remaining gas is used as fuel gas.
The wax products are sent to hydrocyclones to accomplish the remaining catalyst-wax
separation. Subsequently, the resulting wax stream is degassed with the resulting vapor cooled
to remove additional condensate that is sent to product recovery and the residual vapor combined
with the tail gas for recycling. The liquid wax is sent to wax clarifying and fed to the
hydrocarbon recovery section.

Cost and Performance Baseline for Fossil Energy Plants Volume 4: CTL via F-T Synthesis
36
The catalyst that is separated from the bulk of the wax streams is recycled back to the Fischer-
Tropsch reactors. To maintain performance, a portion of the catalyst inventory of the reactors is
removed for disposal and replaced. Catalyst replacement rates are influenced by loss of catalyst
functional lifetime (activity and selectivity) and attrition losses. A composite lifetime
(mechanical and functional) of the catalyst in this system analysis is 0.78 years, meaning 0.015
percent of catalyst inventory is replaced per hour.
The catalyst-free liquid leaving the filter system is reduced in pressure and flashed. The vapor
stream is further cooled to 100 °F and flashed. The vapor stream from the second flash is used
as fuel for the gas turbine and the liquid from both flash drums is sent to the feed drum of the
product fractionators, along with the condensate recovered from the overhead vapor streams.
Exhibit 3-9 provides simplified block flow diagram of the F-T, product recovery, and product
upgrading areas. Exhibit 3-10 and Exhibit 3-11 show the temperature, pressure, flow, and
compositions of the process streams in the F-T area at the design coal feed rate for the CO2
sequestration and CO2 vent cases, respectively.

Cost and Performance Baseline for Fossil Energy Plants Volume 4: CTL via F-T Synthesis
37
Exhibit 3-9 Block flow diagram for the F-T synthesis and product upgrading area
Source: NETL
Clean Syngas
F-T
Reactor
Dehydration/
Compression
Hydrocarbon
Recovery
Wax
Hydrocracking
Naphtha
Hydrotreating
Distillate
Hydrotreating
Hydrogen
Recovery
23
27
28
29
30
31
32
Naphtha Pool
Diesel Pool
21
Steam
33
34
CO2 Removal
22
Aqueous
Oxygenates
F-T Liquids
CO2
ZnO
Polishing20
Tail Gas Recycle
24
To Fuel Gas Pool
To Fuel
Gas Pool
To Fuel Gas Pool
To Fuel
Gas Pool
To Fuel
Gas Pool
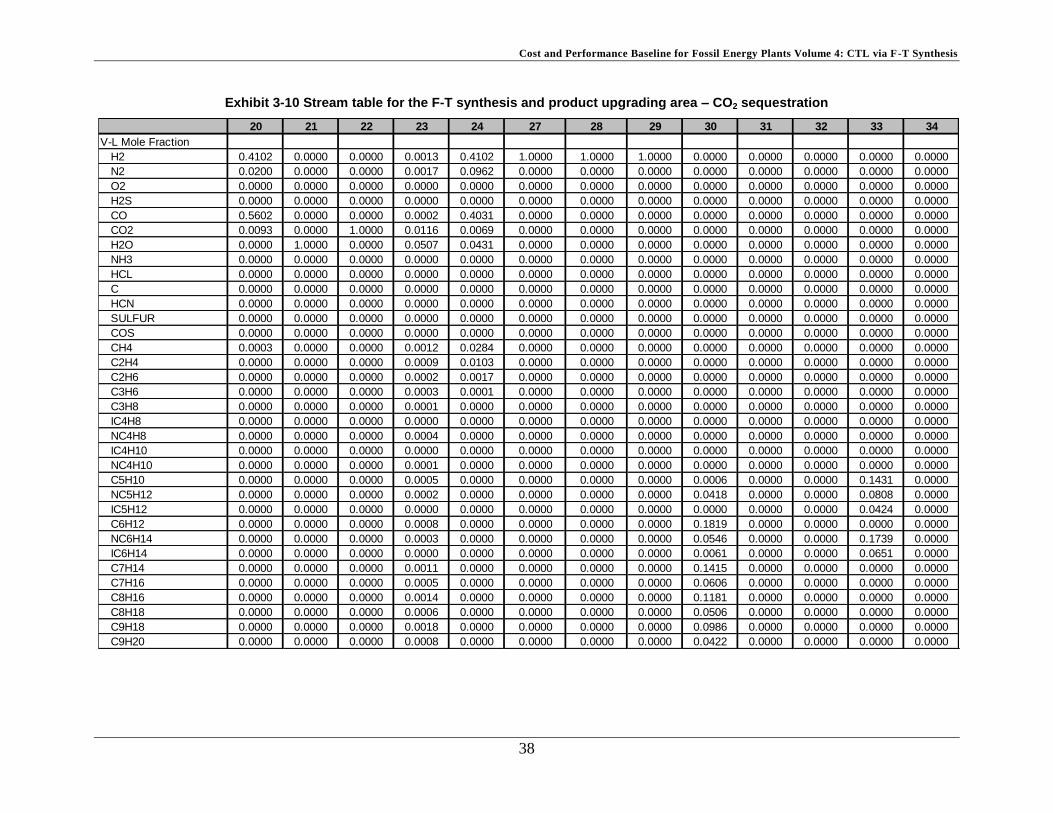
Cost and Performance Baseline for Fossil Energy Plants Volume 4: CTL via F-T Synthesis
38
Exhibit 3-10 Stream table for the F-T synthesis and product upgrading area – CO2 sequestration
20 21 22 23 24 27 28 29 30 31 32 33 34
V-L Mole Fraction
H2 0.4102 0.0000 0.0000 0.0013 0.4102 1.0000 1.0000 1.0000 0.0000 0.0000 0.0000 0.0000 0.0000
N2 0.0200 0.0000 0.0000 0.0017 0.0962 0.0000 0.0000 0.0000 0.0000 0.0000 0.0000 0.0000 0.0000
O2 0.0000 0.0000 0.0000 0.0000 0.0000 0.0000 0.0000 0.0000 0.0000 0.0000 0.0000 0.0000 0.0000
H2S 0.0000 0.0000 0.0000 0.0000 0.0000 0.0000 0.0000 0.0000 0.0000 0.0000 0.0000 0.0000 0.0000
CO 0.5602 0.0000 0.0000 0.0002 0.4031 0.0000 0.0000 0.0000 0.0000 0.0000 0.0000 0.0000 0.0000
CO2 0.0093 0.0000 1.0000 0.0116 0.0069 0.0000 0.0000 0.0000 0.0000 0.0000 0.0000 0.0000 0.0000
H2O 0.0000 1.0000 0.0000 0.0507 0.0431 0.0000 0.0000 0.0000 0.0000 0.0000 0.0000 0.0000 0.0000
NH3 0.0000 0.0000 0.0000 0.0000 0.0000 0.0000 0.0000 0.0000 0.0000 0.0000 0.0000 0.0000 0.0000
HCL 0.0000 0.0000 0.0000 0.0000 0.0000 0.0000 0.0000 0.0000 0.0000 0.0000 0.0000 0.0000 0.0000
C 0.0000 0.0000 0.0000 0.0000 0.0000 0.0000 0.0000 0.0000 0.0000 0.0000 0.0000 0.0000 0.0000
HCN 0.0000 0.0000 0.0000 0.0000 0.0000 0.0000 0.0000 0.0000 0.0000 0.0000 0.0000 0.0000 0.0000
SULFUR 0.0000 0.0000 0.0000 0.0000 0.0000 0.0000 0.0000 0.0000 0.0000 0.0000 0.0000 0.0000 0.0000
COS 0.0000 0.0000 0.0000 0.0000 0.0000 0.0000 0.0000 0.0000 0.0000 0.0000 0.0000 0.0000 0.0000
CH4 0.0003 0.0000 0.0000 0.0012 0.0284 0.0000 0.0000 0.0000 0.0000 0.0000 0.0000 0.0000 0.0000
C2H4 0.0000 0.0000 0.0000 0.0009 0.0103 0.0000 0.0000 0.0000 0.0000 0.0000 0.0000 0.0000 0.0000
C2H6 0.0000 0.0000 0.0000 0.0002 0.0017 0.0000 0.0000 0.0000 0.0000 0.0000 0.0000 0.0000 0.0000
C3H6 0.0000 0.0000 0.0000 0.0003 0.0001 0.0000 0.0000 0.0000 0.0000 0.0000 0.0000 0.0000 0.0000
C3H8 0.0000 0.0000 0.0000 0.0001 0.0000 0.0000 0.0000 0.0000 0.0000 0.0000 0.0000 0.0000 0.0000
IC4H8 0.0000 0.0000 0.0000 0.0000 0.0000 0.0000 0.0000 0.0000 0.0000 0.0000 0.0000 0.0000 0.0000
NC4H8 0.0000 0.0000 0.0000 0.0004 0.0000 0.0000 0.0000 0.0000 0.0000 0.0000 0.0000 0.0000 0.0000
IC4H10 0.0000 0.0000 0.0000 0.0000 0.0000 0.0000 0.0000 0.0000 0.0000 0.0000 0.0000 0.0000 0.0000
NC4H10 0.0000 0.0000 0.0000 0.0001 0.0000 0.0000 0.0000 0.0000 0.0000 0.0000 0.0000 0.0000 0.0000
C5H10 0.0000 0.0000 0.0000 0.0005 0.0000 0.0000 0.0000 0.0000 0.0006 0.0000 0.0000 0.1431 0.0000
NC5H12 0.0000 0.0000 0.0000 0.0002 0.0000 0.0000 0.0000 0.0000 0.0418 0.0000 0.0000 0.0808 0.0000
IC5H12 0.0000 0.0000 0.0000 0.0000 0.0000 0.0000 0.0000 0.0000 0.0000 0.0000 0.0000 0.0424 0.0000
C6H12 0.0000 0.0000 0.0000 0.0008 0.0000 0.0000 0.0000 0.0000 0.1819 0.0000 0.0000 0.0000 0.0000
NC6H14 0.0000 0.0000 0.0000 0.0003 0.0000 0.0000 0.0000 0.0000 0.0546 0.0000 0.0000 0.1739 0.0000
IC6H14 0.0000 0.0000 0.0000 0.0000 0.0000 0.0000 0.0000 0.0000 0.0061 0.0000 0.0000 0.0651 0.0000
C7H14 0.0000 0.0000 0.0000 0.0011 0.0000 0.0000 0.0000 0.0000 0.1415 0.0000 0.0000 0.0000 0.0000
C7H16 0.0000 0.0000 0.0000 0.0005 0.0000 0.0000 0.0000 0.0000 0.0606 0.0000 0.0000 0.0000 0.0000
C8H16 0.0000 0.0000 0.0000 0.0014 0.0000 0.0000 0.0000 0.0000 0.1181 0.0000 0.0000 0.0000 0.0000
C8H18 0.0000 0.0000 0.0000 0.0006 0.0000 0.0000 0.0000 0.0000 0.0506 0.0000 0.0000 0.0000 0.0000
C9H18 0.0000 0.0000 0.0000 0.0018 0.0000 0.0000 0.0000 0.0000 0.0986 0.0000 0.0000 0.0000 0.0000
C9H20 0.0000 0.0000 0.0000 0.0008 0.0000 0.0000 0.0000 0.0000 0.0422 0.0000 0.0000 0.0000 0.0000

Cost and Performance Baseline for Fossil Energy Plants Volume 4: CTL via F-T Synthesis
39
Exhibit 3-10 Stream table for the F-T synthesis and product upgrading area – CO2 sequestration (continued)
20 21 22 23 24 27 28 29 30 31 32 33 34
V-L Mole Fraction
C10H20 0.0000 0.0000 0.0000 0.0022 0.0000 0.0000 0.0000 0.0000 0.0822 0.0000 0.0000 0.0000 0.0000
C10H22 0.0000 0.0000 0.0000 0.0010 0.0000 0.0000 0.0000 0.0000 0.0352 0.0000 0.0000 0.0000 0.0000
C11H22 0.0000 0.0000 0.0000 0.0027 0.0000 0.0000 0.0000 0.0000 0.0000 0.1206 0.0000 0.0000 0.0000
C11H24 0.0000 0.0000 0.0000 0.0012 0.0000 0.0000 0.0000 0.0000 0.0000 0.0517 0.0000 0.0000 0.0000
C12H24 0.0000 0.0000 0.0000 0.0033 0.0000 0.0000 0.0000 0.0000 0.0000 0.1006 0.0000 0.0000 0.0000
C12H26 0.0000 0.0000 0.0000 0.0015 0.0000 0.0000 0.0000 0.0000 0.0000 0.0431 0.0000 0.0000 0.0000
C13H26 0.0000 0.0000 0.0000 0.0039 0.0000 0.0000 0.0000 0.0000 0.0000 0.0840 0.0000 0.0000 0.0000
C13H28 0.0000 0.0000 0.0000 0.0018 0.0000 0.0000 0.0000 0.0000 0.0000 0.0360 0.0000 0.0000 0.0000
C14H28 0.0000 0.0000 0.0000 0.0046 0.0000 0.0000 0.0000 0.0000 0.0000 0.0700 0.0000 0.0000 0.0000
C14H30 0.0000 0.0000 0.0000 0.0021 0.0000 0.0000 0.0000 0.0000 0.0000 0.0300 0.0000 0.0000 0.0000
C15H30 0.0000 0.0000 0.0000 0.0054 0.0000 0.0000 0.0000 0.0000 0.0000 0.0584 0.0000 0.0000 0.0000
C15H32 0.0000 0.0000 0.0000 0.0024 0.0000 0.0000 0.0000 0.0000 0.0000 0.0250 0.0000 0.0000 0.0000
C16H32 0.0000 0.0000 0.0000 0.0061 0.0000 0.0000 0.0000 0.0000 0.0000 0.0487 0.0000 0.0000 0.0000
C16H34 0.0000 0.0000 0.0000 0.0026 0.0000 0.0000 0.0000 0.0000 0.0000 0.0209 0.0000 0.0000 0.0000
C17H34 0.0000 0.0000 0.0000 0.0066 0.0000 0.0000 0.0000 0.0000 0.0000 0.0407 0.0000 0.0000 0.0000
C17H36 0.0000 0.0000 0.0000 0.0030 0.0000 0.0000 0.0000 0.0000 0.0000 0.0174 0.0000 0.0000 0.0000
C18H36 0.0000 0.0000 0.0000 0.0074 0.0000 0.0000 0.0000 0.0000 0.0000 0.0339 0.0000 0.0000 0.0000
C18H38 0.0000 0.0000 0.0000 0.0032 0.0000 0.0000 0.0000 0.0000 0.0000 0.0145 0.0000 0.0000 0.0000
C19H38 0.0000 0.0000 0.0000 0.0077 0.0000 0.0000 0.0000 0.0000 0.0000 0.0283 0.0000 0.0000 0.0000
C19H40 0.0000 0.0000 0.0000 0.0035 0.0000 0.0000 0.0000 0.0000 0.0000 0.0121 0.0000 0.0000 0.0000
C20H40 0.0000 0.0000 0.0000 0.0082 0.0000 0.0000 0.0000 0.0000 0.0000 0.0000 0.0230 0.0000 0.0000
C20H42 0.0000 0.0000 0.0000 0.0037 0.0000 0.0000 0.0000 0.0000 0.0000 0.0000 0.0099 0.0000 0.0000
ALKYLATE 0.0000 0.0000 0.0000 0.0000 0.0000 0.0000 0.0000 0.0000 0.0000 0.0000 0.0000 0.0000 0.0000
ISOMERAT 0.0000 0.0000 0.0000 0.0000 0.0000 0.0000 0.0000 0.0000 0.0000 0.0000 0.0000 0.0000 0.0000
REFORMAT 0.0000 0.0000 0.0000 0.0000 0.0000 0.0000 0.0000 0.0000 0.0000 0.0000 0.0000 0.0000 0.0000
C7-300HC 0.0000 0.0000 0.0000 0.0000 0.0000 0.0000 0.0000 0.0000 0.0000 0.0000 0.0000 0.1006 0.0000
3-350HC 0.0000 0.0000 0.0000 0.0000 0.0000 0.0000 0.0000 0.0000 0.0000 0.0000 0.0000 0.0265 0.0000
350-5HC 0.0000 0.0000 0.0000 0.0000 0.0000 0.0000 0.0000 0.0000 0.0000 0.0000 0.0000 0.0000 0.7298
500+HC 0.0000 0.0000 0.0000 0.0000 0.0000 0.0000 0.0000 0.0000 0.0000 0.0000 0.0000 0.0000 0.0557
C7-300HT 0.0000 0.0000 0.0000 0.0000 0.0000 0.0000 0.0000 0.0000 0.0000 0.0000 0.0000 0.2981 0.0000
3-350HT 0.0000 0.0000 0.0000 0.0000 0.0000 0.0000 0.0000 0.0000 0.0000 0.0000 0.0000 0.0695 0.0000
350-5HT 0.0000 0.0000 0.0000 0.0000 0.0000 0.0000 0.0000 0.0000 0.0000 0.0000 0.0000 0.0000 0.1475
500+HT 0.0000 0.0000 0.0000 0.0000 0.0000 0.0000 0.0000 0.0000 0.0000 0.0000 0.0000 0.0000 0.0670

Cost and Performance Baseline for Fossil Energy Plants Volume 4: CTL via F-T Synthesis
40
Exhibit 3-10 Stream table for the F-T synthesis and product upgrading area – CO2 sequestration (continued)
20 21 22 23 24 27 28 29 30 31 32 33 34
V-L Mole Fraction
OXVAP 0.0000 0.0000 0.0000 0.0001 0.0000 0.0000 0.0000 0.0000 0.0000 0.0000 0.0000 0.0000 0.0000
OXHC 0.0000 0.0000 0.0000 0.0018 0.0000 0.0000 0.0000 0.0000 0.0860 0.1638 0.0000 0.0000 0.0000
OXH2O 0.0000 0.0000 0.0000 0.0005 0.0000 0.0000 0.0000 0.0000 0.0000 0.0000 0.0000 0.0000 0.0000
C5N 0.0000 0.0000 0.0000 0.0000 0.0000 0.0000 0.0000 0.0000 0.0000 0.0000 0.0000 0.0000 0.0000
C6N 0.0000 0.0000 0.0000 0.0000 0.0000 0.0000 0.0000 0.0000 0.0000 0.0000 0.0000 0.0000 0.0000
C7N 0.0000 0.0000 0.0000 0.0000 0.0000 0.0000 0.0000 0.0000 0.0000 0.0000 0.0000 0.0000 0.0000
C8N 0.0000 0.0000 0.0000 0.0000 0.0000 0.0000 0.0000 0.0000 0.0000 0.0000 0.0000 0.0000 0.0000
C9N 0.0000 0.0000 0.0000 0.0000 0.0000 0.0000 0.0000 0.0000 0.0000 0.0000 0.0000 0.0000 0.0000
C10N 0.0000 0.0000 0.0000 0.0000 0.0000 0.0000 0.0000 0.0000 0.0000 0.0000 0.0000 0.0000 0.0000
C6A 0.0000 0.0000 0.0000 0.0000 0.0000 0.0000 0.0000 0.0000 0.0000 0.0000 0.0000 0.0000 0.0000
C7A 0.0000 0.0000 0.0000 0.0000 0.0000 0.0000 0.0000 0.0000 0.0000 0.0000 0.0000 0.0000 0.0000
C8A 0.0000 0.0000 0.0000 0.0000 0.0000 0.0000 0.0000 0.0000 0.0000 0.0000 0.0000 0.0000 0.0000
C9A 0.0000 0.0000 0.0000 0.0000 0.0000 0.0000 0.0000 0.0000 0.0000 0.0000 0.0000 0.0000 0.0000
C10AP 0.0000 0.0000 0.0000 0.0000 0.0000 0.0000 0.0000 0.0000 0.0000 0.0000 0.0000 0.0000 0.0000
C21OP 0.0000 0.0000 0.0000 0.0136 0.0000 0.0000 0.0000 0.0000 0.0000 0.0000 0.0317 0.0000 0.0000
C22OP 0.0000 0.0000 0.0000 0.0153 0.0000 0.0000 0.0000 0.0000 0.0000 0.0000 0.0305 0.0000 0.0000
C23OP 0.0000 0.0000 0.0000 0.0168 0.0000 0.0000 0.0000 0.0000 0.0000 0.0000 0.0294 0.0000 0.0000
C24OP 0.0000 0.0000 0.0000 0.0179 0.0000 0.0000 0.0000 0.0000 0.0000 0.0000 0.0284 0.0000 0.0000
C25OP 0.0000 0.0000 0.0000 0.0188 0.0000 0.0000 0.0000 0.0000 0.0000 0.0000 0.0274 0.0000 0.0000
C26OP 0.0000 0.0000 0.0000 0.0193 0.0000 0.0000 0.0000 0.0000 0.0000 0.0000 0.0264 0.0000 0.0000
C27OP 0.0000 0.0000 0.0000 0.0197 0.0000 0.0000 0.0000 0.0000 0.0000 0.0000 0.0254 0.0000 0.0000
C28OP 0.0000 0.0000 0.0000 0.0197 0.0000 0.0000 0.0000 0.0000 0.0000 0.0000 0.0245 0.0000 0.0000
C29OP 0.0000 0.0000 0.0000 0.0197 0.0000 0.0000 0.0000 0.0000 0.0000 0.0000 0.0236 0.0000 0.0000
C30WAX 0.0000 0.0000 0.0000 0.6758 0.0000 0.0000 0.0000 0.0000 0.0000 0.0000 0.7198 0.0000 0.0000
Total 1.0000 1.0000 1.0000 1.0000 1.0000 1.0000 1.0000 1.0000 1.0000 1.0000 1.0000 1.0000
V-L Molecular Weight 17.493 18.015 44.010 608.035 16.693 2.016 2.016 2.016 104.506 177.165 658.868 105.664 194.681
V-L Flowrate (lbmol/hr) 142,824 8,775 36,786 572 203,707 709 362 2,756 921 524 537 1,398 2,013
V-L Flowrate (lb/hr) 2,498,396 158,087 1,618,962 347,549 3,400,404 1,429 731 5,556 96,211 92,751 353,896 147,699 391,830
Solids Flowrate (lb/hr) 0 0 0 0 0 0 0 0 0 0 0 0 0
Temperature (°F) 600 240 100 487 343 100 100 100 100 100 100 112 255
Pressure (psia) 360.0 325.0 265.0 75.0 325.0 600.0 600.0 120.0 50.0 50.0 50.0 40.0 20.0
Density (lb/ft3) 0.549 56.237 2.138 37.600 0.625 0.197 0.197 0.040 43.116 46.189 51.458 41.122 42.502

Cost and Performance Baseline for Fossil Energy Plants Volume 4: CTL via F-T Synthesis
41
Exhibit 3-11 Stream table for the F-T synthesis and product upgrading area – CO2 vent
20 21 22 23 23 27 28 29 30 31 32 33 34
V-L Mole Fraction
H2 0.4102 0.0000 0.0000 0.0013 0.4102 1.0000 1.0000 1.0000 0.0000 0.0000 0.0000 0.0000 0.0000
N2 0.0200 0.0000 0.0000 0.0017 0.0962 0.0000 0.0000 0.0000 0.0000 0.0000 0.0000 0.0000 0.0000
O2 0.0000 0.0000 0.0000 0.0000 0.0000 0.0000 0.0000 0.0000 0.0000 0.0000 0.0000 0.0000 0.0000
H2S 0.0000 0.0000 0.0000 0.0000 0.0000 0.0000 0.0000 0.0000 0.0000 0.0000 0.0000 0.0000 0.0000
CO 0.5602 0.0000 0.0000 0.0002 0.4031 0.0000 0.0000 0.0000 0.0000 0.0000 0.0000 0.0000 0.0000
CO2 0.0093 0.0000 1.0000 0.0116 0.0069 0.0000 0.0000 0.0000 0.0000 0.0000 0.0000 0.0000 0.0000
H2O 0.0000 1.0000 0.0000 0.0507 0.0431 0.0000 0.0000 0.0000 0.0000 0.0000 0.0000 0.0000 0.0000
NH3 0.0000 0.0000 0.0000 0.0000 0.0000 0.0000 0.0000 0.0000 0.0000 0.0000 0.0000 0.0000 0.0000
HCL 0.0000 0.0000 0.0000 0.0000 0.0000 0.0000 0.0000 0.0000 0.0000 0.0000 0.0000 0.0000 0.0000
C 0.0000 0.0000 0.0000 0.0000 0.0000 0.0000 0.0000 0.0000 0.0000 0.0000 0.0000 0.0000 0.0000
HCN 0.0000 0.0000 0.0000 0.0000 0.0000 0.0000 0.0000 0.0000 0.0000 0.0000 0.0000 0.0000 0.0000
SULFUR 0.0000 0.0000 0.0000 0.0000 0.0000 0.0000 0.0000 0.0000 0.0000 0.0000 0.0000 0.0000 0.0000
COS 0.0000 0.0000 0.0000 0.0000 0.0000 0.0000 0.0000 0.0000 0.0000 0.0000 0.0000 0.0000 0.0000
CH4 0.0003 0.0000 0.0000 0.0012 0.0284 0.0000 0.0000 0.0000 0.0000 0.0000 0.0000 0.0000 0.0000
C2H4 0.0000 0.0000 0.0000 0.0009 0.0103 0.0000 0.0000 0.0000 0.0000 0.0000 0.0000 0.0000 0.0000
C2H6 0.0000 0.0000 0.0000 0.0002 0.0017 0.0000 0.0000 0.0000 0.0000 0.0000 0.0000 0.0000 0.0000
C3H6 0.0000 0.0000 0.0000 0.0003 0.0001 0.0000 0.0000 0.0000 0.0000 0.0000 0.0000 0.0000 0.0000
C3H8 0.0000 0.0000 0.0000 0.0001 0.0000 0.0000 0.0000 0.0000 0.0000 0.0000 0.0000 0.0000 0.0000
IC4H8 0.0000 0.0000 0.0000 0.0000 0.0000 0.0000 0.0000 0.0000 0.0000 0.0000 0.0000 0.0000 0.0000
NC4H8 0.0000 0.0000 0.0000 0.0004 0.0000 0.0000 0.0000 0.0000 0.0000 0.0000 0.0000 0.0000 0.0000
IC4H10 0.0000 0.0000 0.0000 0.0000 0.0000 0.0000 0.0000 0.0000 0.0000 0.0000 0.0000 0.0000 0.0000
NC4H10 0.0000 0.0000 0.0000 0.0001 0.0000 0.0000 0.0000 0.0000 0.0000 0.0000 0.0000 0.0000 0.0000
C5H10 0.0000 0.0000 0.0000 0.0005 0.0000 0.0000 0.0000 0.0000 0.0006 0.0000 0.0000 0.1431 0.0000
NC5H12 0.0000 0.0000 0.0000 0.0002 0.0000 0.0000 0.0000 0.0000 0.0418 0.0000 0.0000 0.0808 0.0000
IC5H12 0.0000 0.0000 0.0000 0.0000 0.0000 0.0000 0.0000 0.0000 0.0000 0.0000 0.0000 0.0424 0.0000
C6H12 0.0000 0.0000 0.0000 0.0008 0.0000 0.0000 0.0000 0.0000 0.1819 0.0000 0.0000 0.0000 0.0000
NC6H14 0.0000 0.0000 0.0000 0.0003 0.0000 0.0000 0.0000 0.0000 0.0546 0.0000 0.0000 0.1739 0.0000
IC6H14 0.0000 0.0000 0.0000 0.0000 0.0000 0.0000 0.0000 0.0000 0.0061 0.0000 0.0000 0.0651 0.0000
C7H14 0.0000 0.0000 0.0000 0.0011 0.0000 0.0000 0.0000 0.0000 0.1415 0.0000 0.0000 0.0000 0.0000
C7H16 0.0000 0.0000 0.0000 0.0005 0.0000 0.0000 0.0000 0.0000 0.0606 0.0000 0.0000 0.0000 0.0000
C8H16 0.0000 0.0000 0.0000 0.0014 0.0000 0.0000 0.0000 0.0000 0.1181 0.0000 0.0000 0.0000 0.0000
C8H18 0.0000 0.0000 0.0000 0.0006 0.0000 0.0000 0.0000 0.0000 0.0506 0.0000 0.0000 0.0000 0.0000
C9H18 0.0000 0.0000 0.0000 0.0018 0.0000 0.0000 0.0000 0.0000 0.0986 0.0000 0.0000 0.0000 0.0000
C9H20 0.0000 0.0000 0.0000 0.0008 0.0000 0.0000 0.0000 0.0000 0.0422 0.0000 0.0000 0.0000 0.0000

Cost and Performance Baseline for Fossil Energy Plants Volume 4: CTL via F-T Synthesis
42
Exhibit 3-11 Stream table for the F-T synthesis and product upgrading area – CO2 vent (continued)
20 21 22 23 23 27 28 29 30 31 32 33 34
V-L Mole Fraction
C10H20 0.0000 0.0000 0.0000 0.0022 0.0000 0.0000 0.0000 0.0000 0.0822 0.0000 0.0000 0.0000 0.0000
C10H22 0.0000 0.0000 0.0000 0.0010 0.0000 0.0000 0.0000 0.0000 0.0352 0.0000 0.0000 0.0000 0.0000
C11H22 0.0000 0.0000 0.0000 0.0027 0.0000 0.0000 0.0000 0.0000 0.0000 0.1206 0.0000 0.0000 0.0000
C11H24 0.0000 0.0000 0.0000 0.0012 0.0000 0.0000 0.0000 0.0000 0.0000 0.0517 0.0000 0.0000 0.0000
C12H24 0.0000 0.0000 0.0000 0.0033 0.0000 0.0000 0.0000 0.0000 0.0000 0.1006 0.0000 0.0000 0.0000
C12H26 0.0000 0.0000 0.0000 0.0015 0.0000 0.0000 0.0000 0.0000 0.0000 0.0431 0.0000 0.0000 0.0000
C13H26 0.0000 0.0000 0.0000 0.0039 0.0000 0.0000 0.0000 0.0000 0.0000 0.0840 0.0000 0.0000 0.0000
C13H28 0.0000 0.0000 0.0000 0.0018 0.0000 0.0000 0.0000 0.0000 0.0000 0.0360 0.0000 0.0000 0.0000
C14H28 0.0000 0.0000 0.0000 0.0046 0.0000 0.0000 0.0000 0.0000 0.0000 0.0700 0.0000 0.0000 0.0000
C14H30 0.0000 0.0000 0.0000 0.0021 0.0000 0.0000 0.0000 0.0000 0.0000 0.0300 0.0000 0.0000 0.0000
C15H30 0.0000 0.0000 0.0000 0.0054 0.0000 0.0000 0.0000 0.0000 0.0000 0.0584 0.0000 0.0000 0.0000
C15H32 0.0000 0.0000 0.0000 0.0024 0.0000 0.0000 0.0000 0.0000 0.0000 0.0250 0.0000 0.0000 0.0000
C16H32 0.0000 0.0000 0.0000 0.0061 0.0000 0.0000 0.0000 0.0000 0.0000 0.0487 0.0000 0.0000 0.0000
C16H34 0.0000 0.0000 0.0000 0.0026 0.0000 0.0000 0.0000 0.0000 0.0000 0.0209 0.0000 0.0000 0.0000
C17H34 0.0000 0.0000 0.0000 0.0066 0.0000 0.0000 0.0000 0.0000 0.0000 0.0407 0.0000 0.0000 0.0000
C17H36 0.0000 0.0000 0.0000 0.0030 0.0000 0.0000 0.0000 0.0000 0.0000 0.0174 0.0000 0.0000 0.0000
C18H36 0.0000 0.0000 0.0000 0.0074 0.0000 0.0000 0.0000 0.0000 0.0000 0.0339 0.0000 0.0000 0.0000
C18H38 0.0000 0.0000 0.0000 0.0032 0.0000 0.0000 0.0000 0.0000 0.0000 0.0145 0.0000 0.0000 0.0000
C19H38 0.0000 0.0000 0.0000 0.0077 0.0000 0.0000 0.0000 0.0000 0.0000 0.0283 0.0000 0.0000 0.0000
C19H40 0.0000 0.0000 0.0000 0.0035 0.0000 0.0000 0.0000 0.0000 0.0000 0.0121 0.0000 0.0000 0.0000
C20H40 0.0000 0.0000 0.0000 0.0082 0.0000 0.0000 0.0000 0.0000 0.0000 0.0000 0.0230 0.0000 0.0000
C20H42 0.0000 0.0000 0.0000 0.0037 0.0000 0.0000 0.0000 0.0000 0.0000 0.0000 0.0099 0.0000 0.0000
ALKYLATE 0.0000 0.0000 0.0000 0.0000 0.0000 0.0000 0.0000 0.0000 0.0000 0.0000 0.0000 0.0000 0.0000
ISOMERAT 0.0000 0.0000 0.0000 0.0000 0.0000 0.0000 0.0000 0.0000 0.0000 0.0000 0.0000 0.0000 0.0000
REFORMAT 0.0000 0.0000 0.0000 0.0000 0.0000 0.0000 0.0000 0.0000 0.0000 0.0000 0.0000 0.0000 0.0000
C7-300HC 0.0000 0.0000 0.0000 0.0000 0.0000 0.0000 0.0000 0.0000 0.0000 0.0000 0.0000 0.1006 0.0000
3-350HC 0.0000 0.0000 0.0000 0.0000 0.0000 0.0000 0.0000 0.0000 0.0000 0.0000 0.0000 0.0265 0.0000
350-5HC 0.0000 0.0000 0.0000 0.0000 0.0000 0.0000 0.0000 0.0000 0.0000 0.0000 0.0000 0.0000 0.7298
500+HC 0.0000 0.0000 0.0000 0.0000 0.0000 0.0000 0.0000 0.0000 0.0000 0.0000 0.0000 0.0000 0.0557
C7-300HT 0.0000 0.0000 0.0000 0.0000 0.0000 0.0000 0.0000 0.0000 0.0000 0.0000 0.0000 0.2981 0.0000
3-350HT 0.0000 0.0000 0.0000 0.0000 0.0000 0.0000 0.0000 0.0000 0.0000 0.0000 0.0000 0.0695 0.0000
350-5HT 0.0000 0.0000 0.0000 0.0000 0.0000 0.0000 0.0000 0.0000 0.0000 0.0000 0.0000 0.0000 0.1475
500+HT 0.0000 0.0000 0.0000 0.0000 0.0000 0.0000 0.0000 0.0000 0.0000 0.0000 0.0000 0.0000 0.0670

Cost and Performance Baseline for Fossil Energy Plants Volume 4: CTL via F-T Synthesis
43
Exhibit 3-11 Stream table for the F-T synthesis and product upgrading area – CO2 vent (continued)
20 21 22 23 23 27 28 29 30 31 32 33 34
V-L Mole Fraction
OXVAP 0.0000 0.0000 0.0000 0.0001 0.0000 0.0000 0.0000 0.0000 0.0000 0.0000 0.0000 0.0000 0.0000
OXHC 0.0000 0.0000 0.0000 0.0018 0.0000 0.0000 0.0000 0.0000 0.0860 0.1638 0.0000 0.0000 0.0000
OXH2O 0.0000 0.0000 0.0000 0.0005 0.0000 0.0000 0.0000 0.0000 0.0000 0.0000 0.0000 0.0000 0.0000
C5N 0.0000 0.0000 0.0000 0.0000 0.0000 0.0000 0.0000 0.0000 0.0000 0.0000 0.0000 0.0000 0.0000
C6N 0.0000 0.0000 0.0000 0.0000 0.0000 0.0000 0.0000 0.0000 0.0000 0.0000 0.0000 0.0000 0.0000
C7N 0.0000 0.0000 0.0000 0.0000 0.0000 0.0000 0.0000 0.0000 0.0000 0.0000 0.0000 0.0000 0.0000
C8N 0.0000 0.0000 0.0000 0.0000 0.0000 0.0000 0.0000 0.0000 0.0000 0.0000 0.0000 0.0000 0.0000
C9N 0.0000 0.0000 0.0000 0.0000 0.0000 0.0000 0.0000 0.0000 0.0000 0.0000 0.0000 0.0000 0.0000
C10N 0.0000 0.0000 0.0000 0.0000 0.0000 0.0000 0.0000 0.0000 0.0000 0.0000 0.0000 0.0000 0.0000
C6A 0.0000 0.0000 0.0000 0.0000 0.0000 0.0000 0.0000 0.0000 0.0000 0.0000 0.0000 0.0000 0.0000
C7A 0.0000 0.0000 0.0000 0.0000 0.0000 0.0000 0.0000 0.0000 0.0000 0.0000 0.0000 0.0000 0.0000
C8A 0.0000 0.0000 0.0000 0.0000 0.0000 0.0000 0.0000 0.0000 0.0000 0.0000 0.0000 0.0000 0.0000
C9A 0.0000 0.0000 0.0000 0.0000 0.0000 0.0000 0.0000 0.0000 0.0000 0.0000 0.0000 0.0000 0.0000
C10AP 0.0000 0.0000 0.0000 0.0000 0.0000 0.0000 0.0000 0.0000 0.0000 0.0000 0.0000 0.0000 0.0000
C21OP 0.0000 0.0000 0.0000 0.0136 0.0000 0.0000 0.0000 0.0000 0.0000 0.0000 0.0317 0.0000 0.0000
C22OP 0.0000 0.0000 0.0000 0.0153 0.0000 0.0000 0.0000 0.0000 0.0000 0.0000 0.0305 0.0000 0.0000
C23OP 0.0000 0.0000 0.0000 0.0168 0.0000 0.0000 0.0000 0.0000 0.0000 0.0000 0.0294 0.0000 0.0000
C24OP 0.0000 0.0000 0.0000 0.0179 0.0000 0.0000 0.0000 0.0000 0.0000 0.0000 0.0284 0.0000 0.0000
C25OP 0.0000 0.0000 0.0000 0.0188 0.0000 0.0000 0.0000 0.0000 0.0000 0.0000 0.0274 0.0000 0.0000
C26OP 0.0000 0.0000 0.0000 0.0193 0.0000 0.0000 0.0000 0.0000 0.0000 0.0000 0.0264 0.0000 0.0000
C27OP 0.0000 0.0000 0.0000 0.0197 0.0000 0.0000 0.0000 0.0000 0.0000 0.0000 0.0254 0.0000 0.0000
C28OP 0.0000 0.0000 0.0000 0.0197 0.0000 0.0000 0.0000 0.0000 0.0000 0.0000 0.0245 0.0000 0.0000
C29OP 0.0000 0.0000 0.0000 0.0197 0.0000 0.0000 0.0000 0.0000 0.0000 0.0000 0.0236 0.0000 0.0000
C30WAX 0.0000 0.0000 0.0000 0.6758 0.0000 0.0000 0.0000 0.0000 0.0000 0.0000 0.7198 0.0000 0.0000
Total 1.0000 1.0000 1.0000 1.0000 1.0000 1.0000 1.0000 1.0000 1.0000 1.0000 1.0000 1.0000 1.0000
V-L Molecular Weight 17.493 18.015 44.010 608.035 16.693 2.016 2.016 2.016 104.506 177.165 658.868 105.664 194.681
V-L Flowrate (lbmol/hr) 142,824 8,775 36,786 572 203,707 709 362 2,756 921 524 537 1,398 2,013
V-L Flowrate (lb/hr) 2,498,396 158,087 1,618,962 347,549 3,400,404 1,429 731 5,556 96,211 92,751 353,896 147,699 391,830
Solids Flowrate (lb/hr) 0 0 0 0 0 0 0 0 0 0 0 0 0
Temperature (°F) 600 240 100 487 343 100 100 100 100 100 100 112 255
Pressure (psia) 360.0 325.0 265.0 75.0 325.0 600.0 600.0 120.0 50.0 50.0 50.0 40.0 20.0
Density (lb/ft3) 0.549 56.237 2.138 37.600 0.625 0.197 0.197 0.040 43.116 46.189 51.458 41.122 42.502
A - Reference conditions are 32.02 F & 0.089 PSIA

Cost and Performance Baseline for Fossil Energy Plants Volume 4: CTL via F-T Synthesis
44
3.3 Product Recovery
All of the hydrocarbon streams from the Fischer-Tropsch synthesis section (wax and condensate
recovered from the overhead vapor streams) are combined in the feed drum of the product
fractionator. The product fractionator separates these hydrocarbons into a low-pressure light
hydrocarbon vapor stream and three liquid streams: naphtha, middle distillate, and wax. The
liquid cuts of the fractionators are defined by the following boiling range cut points:
Naphtha C5 saturates to 350°F (177°C)
Middle Distillate 350-650°F (177-343°C)
Wax Greater than 650°F (343°C)
This simple separation section consists of one fractionation column with a steam side-stripper.
Required support equipment (heat exchangers, flash drums, and furnace utilities) are included in
the capital estimate of this section. The feed drum operates as a flash drum at approximately
135°F (57°C) and 90 psia (6.2 Bar). The vapor feed rate to the tower is used for pressure control
of the flash drum. The vapor serves as stripping media after being fed to the middle of the
column. The liquid is heated to approximately 343°F (173°C) via a fired heater, which burns
residual fuel gas.
The naphtha product is withdrawn from an upper tray and is sent to the naphtha hydrotreating
section. Steam stripping is used to provide a stable liquid middle distillate stream from the
middle of the column, which is cooled (via contact with the column feed stream), and then is sent
to the distillate hydrotreating section. The tower bottoms are withdrawn and cooled via contact
with the tower feed and subsequent water-cooled exchangers prior to being sent to the wax
hydrocracking section.
The Hydrogen Recovery system processes a slipstream of the F-T tail gas to recover H2 for use
in the hydrotreaters and hydrocracker. A pressure swing adsorption (PSA) unit is used to produce
high purity H2 and the rejected stream from the process is blended with the remaining F-T tail
gas for use as fuel gas.
The rationale for placement of the hydrogen recovery downstream of the F-T reactor is three-
fold:
1. The presence of H2 promotes the F-T reaction:
CO + 2n H2 = CnH2n + n H2O.
2. The F-T reactor produces additional H2 via the WGS reaction:
CO + H2O = CO2 + H2.
3. Less gas is treated per unit of H2 recovered since the F-T liquids are removed.
Fuel gas recovered from the Hydrocarbon Recovery, Hydrogen Recovery, Naphtha
Hydrotreating, Distillate Hydrotreating, and Wax Hydrocracking units is mixed, flashed, and
then compressed to 350 psia at 110 °F.
Oxygen and steam are then added to this stream prior to a WGS reactor in order to increase the
H2 and CO2 fractions in the fuel gas. After the WGS reactor in the sequestration case, this
stream is treated by proprietary amine AGR process which is used to capture CO2, thereby
reducing the greenhouse gas (GHG) emissions in the turbine exhaust. This captured CO2 is
mixed with the CO2 removed from the F-T synthesis loop and sent to the gasification island for

Cost and Performance Baseline for Fossil Energy Plants Volume 4: CTL via F-T Synthesis
45
dehydration and compression. In the vent case the fuel gas is combusted without shifting or CO2
capture.
The remaining fuel gas at 335 psia is separated and part of it routed to the various F-T process
furnaces. The remaining F-T fuel gas is sent to the gasification area for coal drying and power
production. A simplified block flow diagram of the power generation area of the facility is
provided in Section 3.6.1.
3.4 Recycle Gas Loop
Vapor products from the second-stage reactors (those leaving the Fischer-Tropsch synthesis
section) are sent to a cyclone to prevent liquid carryover, cooled, and then sent to a three-phase
separator. The hot condensate is sent to the product upgrading processes. The remaining vapors
are processed for CO2 removal, oxygenate removal, dehydration, and additional hydrocarbon
recovery. The majority of the resulting tail-gas vapor is recycled to the F-T reactor, with the
remainder being processed in the hydrogen recovery unit.
The remaining pre-fuel gas from the hydrogen recovery unit is mixed with the light gases
produced in the hydrocarbon upgrading sections and the off-gas from the wax stream. In the
case of the CO2 sequestration case, this fuel gas is shifted to maximize CO2 capture potential. In
both cases, a portion of the fuel gas is separated out for combustion in direct fired heaters
throughout the CTL plant, which allows for more steam from the heat recovery to be directed to
electrical power production, and the remainder is sent to the combustion turbines.
3.5 Product Upgrading
3.5.1 Naphtha Hydrotreaters
Light liquid hydrocarbon products are processed in the naphtha hydrotreating units to produce
stabilized (heteroatom, olefinic, and aromatic content is reduced) F-T naphtha. This is then
blended with naphtha produced in the hydrocracker. The off gas from this process is combined
with portions of the F-T tail gas.
3.5.2 Middle Distillate Hydrotreaters
The product recovery distillation tower produces a middle distillate that is sent to a fixed bed
catalytic hydrotreater that produces an acceptable quality diesel fuel. This processing section
removes oxygenates and any residual heteroatoms (sulfur and nitrogen), and greatly reduces the
olefinic and aromatic content. The distillate hydrotreater also produces, and the processing
section separates off, a waste-water stream and a residual C4- vapor stream, which is recovered.
The hydrotreated middle distillate from this processing section is blended with the analogous
stream from the wax hydrocracker to form a product diesel. The product diesel has an estimated
pour point of -45.6°C (-50.1°F), which is well below the target value of any region in the United
States [15], and the estimated cetane index of this diesel product is 70.7, which is above the
standards set in the World Wide Fuel Charter (minimum requirements between 48 and 55
depending on category [16]); hence there is no need for additives. These values are provided in
Exhibit 3-12.

Cost and Performance Baseline for Fossil Energy Plants Volume 4: CTL via F-T Synthesis
46
Exhibit 3-12 Diesel properties
Property Value
Density, lb/bbl 266.9
Net Heat of Combustion, MMBtu/gal (LHV) 0.12
Pour Point, °F -50.1
Cetane Index 70.7
3.5.3 Wax Hydrocracking
The models utilized in this study are based on Chevron’s isocracking process that emphasized
diesel production compared to naphtha production. [10] Based on the reported yields for a two-
stage design processing VGO (Vacuum Gas Oil), a set of wax hydrocracking yields was
developed. Exhibit 3-13 provides the wax hydrocracking model product yield. The wax
hydrocracking model produces a Diesel/(C5+ naphtha) product ratio of 6.
Exhibit 3-13 Wax hydrocracking model product yield distributions
Component Yields
Weight % Volume %
C1-C4s 4.50 -
C5-C6s 4.59 5.58
Naphtha 6.67 7.39
Diesel 84.24 87.03
Total 100.00 100.00
C5+Naphtha 11.26 12.97
Diesel/(C5+Naphtha) 7.48 6.71
The F-T process design can be adjusted to a low wax yield (as little as 56 weight percent) and
still make the desired 2.33/1 Diesel/(C5+Naphtha) ratio by using the wax hydrocracking model
described previously.
This facility was designed for maximum diesel fuel production and the hydrocracker is
configured to maximize diesel production by selectively hydrocracking the wax product mainly
to the diesel boiling range. The wax fraction is sent to the wax hydrocracker, which breaks down
the wax into naphtha and middle distillate, as well as some residual C4- vapor, which is
recovered. The single, multibed, downflow wax hydrocracker catalytically cracks the wax under
a 75-103 bar (1088-1494 psia) hydrogen atmosphere at a nominal temperature of 371°C (700°F).
There is inter-bed cooling to remove the heat of reaction from hydrogen-rich recycle gas. A flash
drum is used to recover unutilized hydrogen-rich gas for recycle back to the hydrocracker. A
distillation column is used to separate the liquids from the flash into naphtha, middle distillate,
and wax streams. The residual uncracked wax is recycled to extinction. The middle distillate
from the wax hydrocracker is sent for blending with the middle distillate range product from the

Cost and Performance Baseline for Fossil Energy Plants Volume 4: CTL via F-T Synthesis
47
distillate hydrotreating section. The naphtha stream from the wax hydrocracker is sent to the
naphtha reforming unit.
To achieve a 70:30 diesel/naphtha product split (volume basis), the wax hydrocracker model was
redesigned from that used in the April 2007 study to increase the diesel fuel yield. In the
process, a certain amount of hydroisomerization occurs, which has the beneficial effect of
lowering the pour point of the diesel fuel.
3.6 Power Production
The plant is designed to produce sufficient electric power to satisfy the power requirements for
the gasification plant and the F-T facility, to make the entire facility electric power independent.
Limiting the amount of excess power produced has two benefits: 1) the facility is not dependent
on external power sources or supplies and 2) it improves the efficiency of the facility.
The prevailing industry philosophy in designing CTL facilities is that excess syngas should only
be combusted in a direct-fired boiler so as to maximize the amount of syngas converted to the
higher value liquid fuel products. It was determined, however, that the use of a combined-cycle
power cycle (i.e., adding a combustion turbine to the facility) improved both the environmental
and economic performance of the facility, and subsequently it was decided to use such a power
cycle. Commercially available combustion turbines of the appropriate size were selected in
order to minimize excess power production.
3.6.1 Combustion Turbine Generators
The combustion turbine generators that could be used for this application are three General
Electric (GE) gas turbines (MS6001B) each producing a nominal 45 MWe. The actual total
power production is 112 MWe in the CO2 sequestration case and 136 MWe in the CO2 vent case.
The difference in power output between the cases is attributed to differences in fuel gas
composition. The stream data are available in Exhibit 3-3 and the block diagram is provided in
Exhibit 3-14

Cost and Performance Baseline for Fossil Energy Plants Volume 4: CTL via F-T Synthesis
48
Exhibit 3-14 Block flow diagram for the fuel gas preparation and power generation area
Source: NETL
HRSG
Fuel Gas
Stack Gas
Fuel Gas
Heating
Turbine Cooling AirAmbient Air
Steam Turbine
BFW
Process Steam
Note: Steam cycle simplified
To BFW Heater
Reclaimed Water
Fuel Gas Compressor
35

Cost and Performance Baseline for Fossil Energy Plants Volume 4: CTL via F-T Synthesis
49
Because fuel gas from the F-T area is imported into the gasification and power production Aspen
model, some adjustment had to be made to the composition of the imported fuel gas. The Aspen
gasification and power plant model do not contain any hydrocarbons heavier than methane.
Therefore, in order to import the fuel gas into the power plant model, the heavier hydrocarbons
were changed to methane on a weight basis. This overestimates the heating value and tends to
increase the power production because methane has a higher heating value than the heavier
hydrocarbons. However, this change is slight since there is only a relatively small amount of
these hydrocarbons in the total fuel gas going to the gas turbine. Using the sequestration case as
an example, Exhibit 3-15 shows there is negligible effect on lower heating value (LHV) by
substituting trace heavy components with methane.
Exhibit 3-15 Fuel gas LHV comparison between turbine and F-T models
Component LHV
Btu/lb
Mass Fraction in F-T Fuel Gas
LHV F-T Fuel Gas, Btu/lb
Mass Fraction in Turbine Fuel
Gas
LHV Turbine Fuel Gas,
Btu/lb
H2 51,573 0.02301009 1186.69937 0.0230101 1186.69937
CO 4,344 0.0818232 355.43998 0.0818232 355.43998
CO2 0 0.00211792 0.00000 0.0021179 0.00000
H2O 0 0.00296592 0.00000 0.0029659 0.00000
NH3 7,998 0.00025819 2.06500 0.0002582 2.06500
HCN 9,915 8.51E-07 0.00844 8.51E-07 0.00844
CH4 21,509 0.40201125 8646.85998 0.4021163 8649.11842
C2H4 20,275 1.18E-06 0.02394 0 0.00000
C2H6 20,424 0.00010435 2.13124 0 0.00000
C3H6 19,675 8.44E-09 0.00017 0 0.00000
C3H8 19,920 6.39E-08 0.00127 0 0.00000
IC4H8 19,469 1.16E-11 0.00000 0 0.00000
10193.22939 10193.33121
3.6.2 Steam Turbine Power Generation
Heat from the various gasification, AGR, and F-T processes is recovered with multiple heat
exchangers matching the quality and quantity of available heat. This heat recovery produces
steam at various pressures, part of which is used for process needs and the remainder is used to
run the steam turbines to produce additional power of 316 MWe and 337 MWe of power in the
sequestration and CO2 vent cases, respectively.
The HRSG is a horizontal gas flow, drum-type, multi-pressure design that is matched to the
characteristics of the gas turbine exhaust gas. The HP drum produces steam at main steam
pressure; while the intermediate pressure (IP) drum produces steam for export to the cold reheat.
The HRSG drum pressures are nominally 1,800/452 psia for the HP/IP turbine sections,
respectively.

Cost and Performance Baseline for Fossil Energy Plants Volume 4: CTL via F-T Synthesis
50
Natural circulation of steam is accomplished in the HRSG by utilizing differences in densities
due to temperature differences of the steam. The natural circulation HRSG provides the most
cost-effective and reliable design.
3.6.3 Flare Stack
Each gasifier has a self-supporting, refractory-lined, carbon steel flare stack to combust and
dispose of product gas during startup, shutdown, and upset conditions. The flare stack is
provided with multiple pilot burners, fueled by natural gas or propane, with pilot monitoring
instrumentation.

Cost and Performance Baseline for Fossil Energy Plants Volume 4: CTL via F-T Synthesis
51
4 Performance Summary and Mass Balances
The plant power output, including auxiliary load, for the facilities is summarized in Exhibit 4-1
and Exhibit 4-2.
The total F-T liquids production of 49,992 bpd consists of 35,230 bpd (70.5 percent) diesel and
14,762 bpd (29.5 percent) of low-octane C5+ naphtha. The diesel product can be sold as a
commercial diesel fuel after the addition of appropriate additives. The C5+ naphtha product is a
low octane material that is an excellent ethylene cracker feedstock, or it can be further processed
to make a gasoline blending component.
If more export power is required, additional coal must be consumed to produce it.

Cost and Performance Baseline for Fossil Energy Plants Volume 4: CTL via F-T Synthesis
52
Exhibit 4-1 Plant performance summary – CO2 sequestration case
Plant Output
Gas Turbine Power 111,600 kWe
Steam Turbine Power 315,600 kWe
Total 427,200 kWe
Auxiliary Load
Coal Handling 1,760 kWe
Coal Milling 8,160 kWe
Slag Handling 2,080 kWe
Air Separation Unit Auxiliaries 4,000 kWe
Air Separation Unit Main Air Compressor 235,480 kWe
Oxygen Compressor 35,600 kWe
Nitrogen Compressors 6,080 kWe
CO2 Compressor 43,480 kWe
Boiler Feedwater Pumps 1,640 kWe
Condensate Pump 200 kWe
Quench Water Pump 2,280 kWe
Syngas Recycle Compressor 2,920 kWe
Circulating Water Pump 6,800 kWe
Ground Water Pumps 800 kWe
Cooling Tower Fans 3,560 kWe
Scrubber Pumps 1,360 kWe
Acid Gas Removal 13,640 kWe
Gas Turbine Auxiliaries 4,000 kWe
Steam Turbine Auxiliaries 400 kWe
Claus Plant/TGTU Auxiliaries 1,000 kWe
Claus Plant TG Recycle Compressor 840 kWe
F-T Power requirement 31,948 kWe
Miscellaneous Balance of PlantA 12,000 kWe
Transformer Losses 2,520 kWe
Total 422,548 kWe
Plant Performance
Net Auxiliary Load 422,548 kWe
Net Plant Power 4,652 kWe
Coal Feed Flowrate 794,022 (1,750,518) kg/hr (lb/hr)
Thermal InputB 5,984,963 kWt
Condenser Duty 928 (880) GJ/hr (MMBtu/hr)
Raw Water Withdrawal 32.8 (8,672) m3/min (gpm)
Carbon in coal 506,147 (1,115,863) kg/hr (lb/hr)
Carbon in Slag 2,531 (5,579) kg/hr (lb/hr)
Sulfur 19,901 (43,875) kg/hr (lb/hr)
Raw Water Consumption 26.8 (7,078) m3/min (gpm)
A - Includes plant control systems, lighting, HVAC, and miscellaneous low voltage loads B - HHV of Illinois No. 6 coal is 27,135 kJ/kg (11,666 Btu/lb)

Cost and Performance Baseline for Fossil Energy Plants Volume 4: CTL via F-T Synthesis
53
Exhibit 4-2 Plant performance summary – CO2 vent case
Plant Output
Gas Turbine Power 136,000 kWe
Steam Turbine Power 336,800 kWe
Total 472,800 kWe
Auxiliary Load
Coal Handling 1,760 kWe
Coal Milling 8,160 kWe
Slag Handling 2,080 kWe
Air Separation Unit Auxiliaries 4,000 kWe
Air Separation Unit Main Air Compressor 235,480 kWe
Oxygen Compressor 35,600 kWe
Nitrogen Compressors 6,080 kWe
CO2 Compressor 0 kWe
Boiler Feedwater Pumps 1,840 kWe
Condensate Pump 240 kWe
Quench Water Pump 2,280 kWe
Syngas Recycle Compressor 2,920 kWe
Circulating Water Pump 6,240 kWe
Ground Water Pumps 720 kWe
Cooling Tower Fans 3,280 kWe
Scrubber Pumps 1,360 kWe
Acid Gas Removal 13,640 kWe
Gas Turbine Auxiliaries 4,000 kWe
Steam Turbine Auxiliaries 400 kWe
Claus Plant/TGTU Auxiliaries 1,000 kWe
Claus Plant TG Recycle Compressor 840 kWe
F-T Power requirement 29,278 kWe
Miscellaneous Balance of PlantA 12,000 kWe
Transformer Losses 2,520 kWe
Total 375,718 kWe
Plant Performance
Net Auxiliary Load 375,718 kWe
Net Plant Power 97,082 kWe
Coal Feed Flowrate 794,022 (1,750,518) kg/hr (lb/hr)
Thermal InputB 5,984,963 kWt
Condenser Duty 928 (880) GJ/hr (MMBtu/hr)
Raw Water Withdrawal 30.1 (7,940) m3/min (gpm)
Carbon in coal 506,147 (1,115,863) kg/hr (lb/hr)
Carbon in Slag 2,531 (5,579) kg/hr (lb/hr)
Sulfur 19,901 (43,875) kg/hr (lb/hr)
Raw Water Consumption 24.5 (6,473) m3/min (gpm)
A - Includes plant control systems, lighting, HVAC, and miscellaneous low voltage loads B - HHV of Illinois No. 6 coal is 27,135 kJ/kg (11,666 Btu/lb)
4.1.1 Carbon Balance
An overall carbon balance for the facilities is provided in Exhibit 4-3 and Exhibit 4-4. About
0.5 percent of the total carbon is encapsulated in the slag, while over 80 percent of the entering
carbon is converted to syngas going to the F-T reactor. In the sequestration case the compressed
CO2 and F-T liquid product streams contain the majority of carbon exiting the plant, accounting

Cost and Performance Baseline for Fossil Energy Plants Volume 4: CTL via F-T Synthesis
54
for approximately 55 percent and 40 percent of the total entering carbon, respectively. The total
amount of carbon lost to the environment is about 6 percent of the entering carbon.
Note that carbon emissions from the stack are in the form of CO2 emissions to the atmosphere,
and that these emissions only represent a fraction of the total life cycle GHG emissions
associated with the finished diesel fuel.
Exhibit 4-3 Elemental carbon mass balance – CO2 sequestration case
Carbon In, kg/hr (lb/hr) Carbon Out, kg/hr (lb/hr)
Coal 506,109 (1,115,863) Naphtha 56,404 (124,349) 11%
Diesel 150,183 (331,096) 30%
Slag 2,531 (5,579) 1%
CO2 272,389 (600,516) 54%
Stack gas 24,603 (54,324) 5%
Total 506,109 (1,115,863) Total 506,109 (1,115,863) 100%
Exhibit 4-4 Elemental carbon mass balance – CO2 vent case
Carbon In, kg/hr (lb/hr) Carbon Out, kg/hr (lb/hr)
Coal 506,109 (1,115,863) Naphtha 56,404 (124,349) 11%
Diesel 150,183 (331,096) 30%
Slag 2,531 (5,579) 1%
Stack gas 297,030 (654,839) 59%
Total 506,109 (1,115,863) Total 506,109 (1,115,863) 100%
4.1.2 Sulfur Balance
All the sulfur in the coal is recovered as elemental sulfur in the Claus plant.
4.1.3 Water Balance
Water balances in Exhibit 4-5 and Exhibit 4-6 represent one of the four gasification sections (see
Section 3.1.3) and one quarter of the F-T area water needs. The last row represents the complete
F-T plant and all four of the gasification sections. The water demand is the total water demand
for that plant section; this consists of a combination of raw and recycled water. Some water may
also be discharged via a permitted discharge. The raw water consumption is the difference
between the water withdrawal and consumption. Raw water consumption is 8.4 and 7.7 barrels
of water per bbl of diesel produced for the CO2 Sequestration Case and CO2 Vent Case,
respectively (5.9 and 5.4 barrels of water per barrel of F-T liquids produced).

Cost and Performance Baseline for Fossil Energy Plants Volume 4: CTL via F-T Synthesis
55
Exhibit 4-5 Water balance – CO2 sequestration case
Water Usage by Area
m3/min (gpm)
Water Demand
Internal Recycle
Raw Water Withdrawal
Process Water
Discharge
Raw Water Consumption
Slag Handling 0.43 (114) 0.43 (114) 0.0 (0) 0.0 (0) 0.0 (0)
Quench/Wash 3.0 (786) 2.07 (548) 0.9 (238) 0.0 (0) 0.9 (238)
SWS Blowdown 0.0 (0) 0.0 (0) 0.0 (0) 0.03 (7) -0.03 (-7)
Condenser Makeup 0.8 (221) 0.0 (0) 0.8 (221) 0.0 (0) 0.8 (221)
Gasifier Steam 0.3 (84) 0.0 (0) 0.3 (84)
Shift Steam 0.5 (128) 0.0 (0) 0.5 (128)
BFW Makeup 0.03 (8) 0.0 (0) 0.03 (8)
Cooling Tower 6.7 (1,742) 0.28 (74) 6.3 (1,668) 1.5 (392) 4.8 (1,276)
BFW Blowdown 0 0.03 (8) -0.03 (-8)
SWS Blowdown 0.0 (0) 0.25 (66) -0.25 (-66)
SWS Excess Water 0.0 (0) 0.0 (0) 0.0 (0)
¼ of F-T area values 0.16 (41.60) 0 0.16 (41.60) 0 0.16 (41.60)
Total 10.99 (2,904) 2.79 (736) 8.21 (2,168) 1.5 (398) 6.70 (1,770)
Total 4 Gasifier sections plus F-T plant
43.98 (11,617) 11.15 (2,945) 32.83 (8,672) 6.03 (1,594) 26.79 (7,078)
Exhibit 4-6 Water balance – CO2 vent case
Water Usage by Area
m3/min (gpm)
Water Demand
Internal Recycle
Raw Water Withdrawal
Process Water
Discharge
Raw Water Consumption
Slag Handling 0.43 (114) 0.43 (114) 0.0 (0) 0.0 (0) 0.0 (0)
Quench/Wash 3.0 (786) 2.07 (548) 0.9 (238) 0.0 (0) 0.9 (238)
SWS Blowdown 0.0 (0) 0.0 (0) 0.0 (0) 0.03 (7) -0.03 (-7)
Condenser Makeup 0.8 (222) 0.0 (0) 0.8 (222) 0.0 (0) 0.8 (222)
Gasifier Steam 0.3 (84) 0.0 (0) 0.3 (84)
Shift Steam 0.5 (128) 0.0 (0) 0.5 (128)
BFW Makeup 0.03 (9) 0.0 (0) 0.03 (9)
Cooling Tower 6.1 (1,601) 0.28 (75) 5.8 (1,526) 1.4 (360) 4.4 (1,166)
BFW Blowdown 0.0 (0) 0.03 (9) -0.03 (-9)
SWS Blowdown 0.0 (0) 0.25 (66) -0.25 (-66)
SWS Excess Water 0.0 (0) 0.0 (0) 0.0 (0)
¼ of F-T area values 0.04 (9) 0.04 (9) 0.0 (0) 0.0 (00) 0.0 (00)
Total 10.3 (2,722) 2.79 (737) 7.5 (1,985) 1.4 (367) 6.1 (1,618)
Total 4 Gasifier sections plus F-T plant
41.3 (10,896) 11.20 (2956) 30.1 (7,940) 5.6 (1,467) 24.5 (6,473)
Cost and Performance Baseline for Fossil Energy Plants Volume 4: CTL via F-T Synthesis
56
5 Cost Estimation Results
5.1 Capital and Operating Costs
The gasifier, associated syngas treatment units, Rectisol®
system, CO2 compressors, Claus unit,
gas and steam turbines, and other equipment typically associated with an IGCC plant were scaled
from updated cost estimates (2011 dollar basis) for the Shell gasifier Case 6 in “Cost and
Performance Baseline for Fossil Energy Power Plants, Volume 1: Bituminous Coal and Natural
Gas to Electricity.” [8] Capital costs for the F-T reactor and various treatment and upgrading
systems were based on adjusted, vendor-furnished, actual cost data, and best possible
projections.
A process contingency of 25 percent was applied to the F-T reactor and associated equipment.
The capital costs at the TPC level include equipment, materials, labor, indirect construction
costs, engineering, and contingencies. Additional details are highlighted in Section 1.6 of this
report and the NETL QGESS. [6]
The TOC for the entire CTL facility with CO2 capture was estimated to be $6,532 million. This
cost includes appropriate contingency factors and owners costs. [6] On a per barrel basis of daily
liquid capacity, this cost is $130,662/bpdFTL for the sequestration case. Exhibit 5-1 shows a
summary breakdown of the capital costs for the CO2 sequestration case and Exhibit 5-3 shows a
summary breakdown of the capital costs for the CO2 vent case. The total TOC is the TPC plus
owner’s costs.
A credit of $60/MWh is included for excess power generated. Exhibit 5-2 and Exhibit 5-4 show
the breakdown of the total operating cost for the sequestration and vent cases, respectively.

Cost and Performance Baseline for Fossil Energy Plants Volume 4: CTL via F-T Synthesis
57
Exhibit 5-1 Total plant cost summary with CO2 sequestration
Client: USDOE/NETL Report Date: 2013-Dec-23
Project: Activity 25
Case: Base Case 1 - Total System
Plant Size: 49,992 bbl/day Estimate Type: Conceptual Cost Base (Jun) 2011 ($x1000)
Acct Equipment Material Labor Sales Bare Erected Eng'g CM Contingencies
No. Item/Description Cost Cost Direct Indirect Tax Cost $ H.O.& Fee Process Project $ $/bpd $/bpdECO $/bpdEPD
1 COAL & SORBENT HANDLING
1.1 Coal Receive & Unload $10,063 $0 $4,850 $0 $0 $14,913 $1,296 $0 $3,242 $19,451 $389 $371 $464
1.2 Coal Stackout & Reclaim $13,003 $0 $3,109 $0 $0 $16,112 $1,368 $0 $3,496 $20,976 $420 $400 $500
1.3 Coal Conveyors & Yd Crush $12,090 $0 $3,076 $0 $0 $15,166 $1,290 $0 $3,291 $19,747 $395 $377 $471
1.4 Other Coal Handling $3,163 $0 $712 $0 $0 $3,875 $328 $0 $841 $5,044 $101 $96 $120
1.5 Sorbent Receive & Unload $0 $0 $0 $0 $0 $0 $0 $0 $0 $0 $0 $0 $0
1.6 Sorbent Stackout & Reclaim $0 $0 $0 $0 $0 $0 $0 $0 $0 $0 $0 $0 $0
1.7 Sorbent Conveyors $0 $0 $0 $0 $0 $0 $0 $0 $0 $0 $0 $0 $0
1.8 Other Sorbent Handling $0 $0 $0 $0 $0 $0 $0 $0 $0 $0 $0 $0 $0
1.9 Coal & Sorbent Hnd.Foundations $0 $6,719 $17,561 $0 $0 $24,281 $2,307 $0 $5,318 $31,906 $638 $608 $760
SUBTOTAL 1. $38,318 $6,719 $29,308 $0 $0 $74,346 $6,589 $0 $16,187 $97,122 $1,943 $1,852 $2,315
2 COAL & SORBENT PREP & FEED
2.1 Coal Crushing & Drying $121,566 $7,331 $17,471 $0 $0 $146,368 $12,217 $0 $31,717 $190,302 $3,807 $3,629 $4,536
2.2 Prepared Coal Storage & Feed $5,758 $1,383 $891 $0 $0 $8,032 $664 $0 $1,739 $10,435 $209 $199 $249
2.3 Dry Coal Injection System $189,497 $2,184 $17,357 $0 $0 $209,038 $17,410 $0 $45,290 $271,738 $5,436 $5,182 $6,477
2.4 Misc.Coal Prep & Feed $3,166 $2,313 $6,814 $0 $0 $12,293 $1,099 $0 $2,678 $16,070 $321 $306 $383
2.5 Sorbent Prep Equipment $0 $0 $0 $0 $0 $0 $0 $0 $0 $0 $0 $0 $0
2.6 Sorbent Storage & Feed $0 $0 $0 $0 $0 $0 $0 $0 $0 $0 $0 $0 $0
2.7 Sorbent Injection System $0 $0 $0 $0 $0 $0 $0 $0 $0 $0 $0 $0 $0
2.8 Booster Air Supply System $0 $0 $0 $0 $0 $0 $0 $0 $0 $0 $0 $0 $0
2.9 Coal & Sorbent Feed Foundation $0 $11,614 $9,966 $0 $0 $21,580 $2,005 $0 $4,717 $28,301 $566 $540 $675
SUBTOTAL 2. $319,987 $24,826 $52,498 $0 $0 $397,310 $33,395 $0 $86,141 $516,846 $10,339 $9,856 $12,319
3 FEEDWATER & MISC. BOP SYSTEMS
3.1 Feedwater System $1,568 $2,706 $1,419 $0 $0 $5,693 $515 $0 $1,242 $7,449 $149 $142 $178
3.2 Water Makeup & Pretreating $1,161 $120 $638 $0 $0 $1,919 $177 $0 $629 $2,724 $54 $52 $65
3.3 Other Feedwater Subsystems $882 $291 $260 $0 $0 $1,433 $124 $0 $311 $1,868 $37 $36 $45
3.4 Service Water Systems $679 $1,354 $4,666 $0 $0 $6,698 $637 $0 $2,200 $9,535 $191 $182 $227
3.5 Other Boiler Plant Systems $3,658 $1,367 $3,364 $0 $0 $8,390 $764 $0 $1,831 $10,985 $220 $209 $262
3.6 FO Supply Sys & Nat Gas $511 $966 $895 $0 $0 $2,372 $223 $0 $519 $3,113 $62 $59 $74
3.7 Waste Treatment Equipment $1,570 $0 $973 $0 $0 $2,543 $245 $0 $836 $3,624 $73 $69 $86
3.8 Misc. Power Plant Equipment $1,709 $228 $889 $0 $0 $2,826 $270 $0 $929 $4,025 $81 $77 $96
SUBTOTAL 3. $11,739 $7,032 $13,103 $0 $0 $31,874 $2,953 $0 $8,497 $43,324 $867 $826 $1,033
TOTAL PLANT COST SUMMARY
TOTAL PLANT COST

Cost and Performance Baseline for Fossil Energy Plants Volume 4: CTL via F-T Synthesis
58
Exhibit 5-1 Total plant cost summary with CO2 sequestration (continued)
Acct Equipment Material Labor Sales Bare Erected Eng'g CM Contingencies
No. Item/Description Cost Cost Direct Indirect Tax Cost $ H.O.& Fee Process Project $ $/bpd $/bpdECO $/bpdEPD
4 GASIFIER & ACCESSORIES
4.1 Gasifier, Syngas Cooler & Auxiliaries (Shell) $699,517 $0 $301,659 $0 $0 $1,001,175 $88,113 $137,204 $188,698 $1,415,190 $28,308 $26,986 $33,732
4.2 Syngas Cooling w/4.1 $0 w/ 4.1 $0 $0 $0 $0 $0 $0 $0 $0 $0 $0
4.3 ASU/Oxidant Compression $551,221 $0 w/equip. $0 $0 $551,221 $51,506 $0 $60,273 $663,000 $13,262 $12,642 $15,803
4.4 LT Heat Recovery & FG Saturation $42,214 $0 $15,797 $0 $0 $58,011 $5,481 $0 $12,698 $76,191 $1,524 $1,453 $1,816
4.5 Misc. Gasification Equipment w/4.1&4.2 $0 w/4.1&4.2 $0 $0 $0 $0 $0 $0 $0 $0 $0 $0
4.6 Flare Stack System $0 $3,287 $1,328 $0 $0 $4,615 $431 $0 $1,009 $6,056 $121 $115 $144
4.8 Major Component Rigging w/4.1&4.2 $0 w/4.1&4.2 $0 $0 $0 $0 $0 $0 $0 $0 $0 $0
4.9 Gasification Foundations $0 $39,797 $23,734 $0 $0 $63,531 $5,856 $0 $17,347 $86,734 $1,735 $1,654 $2,067
SUBTOTAL 4. $1,292,951 $43,084 $342,518 $0 $0 $1,678,553 $151,389 $137,204 $280,025 $2,247,170 $44,951 $42,850 $53,563
5A GAS CLEANUP & PIPING
5A.1 Rectisol System $217,615 $0 $176,832 $0 $0 $394,447 $37,218 $78,889 $102,111 $612,665 $12,255 $11,683 $14,603
5A.2 Elemental Sulfur Plant $24,556 $4,786 $31,465 $0 $0 $60,808 $5,775 $0 $13,317 $79,900 $1,598 $1,524 $1,904
5A.3 Mercury Removal $2,985 $0 $2,256 $0 $0 $5,241 $494 $262 $1,199 $7,196 $144 $137 $172
5A.4 Shift Reactors $5,623 $0 $2,248 $0 $0 $7,870 $735 $0 $1,721 $10,327 $207 $197 $246
5A.5 Particulate Removal w/4.1 $0 w/4.1 $0 $0 $0 $0 $0 $0 $0 $0 $0 $0
5A.6 Blowback Gas Systems $3,633 $611 $342 $0 $0 $4,587 $423 $0 $1,002 $6,012 $120 $115 $143
5A.7 Fuel Gas Piping $0 $1,692 $1,107 $0 $0 $2,799 $244 $0 $609 $3,652 $73 $70 $87
5A.9 HGCU Foundations $0 $1,965 $1,324 $0 $0 $3,289 $304 $0 $1,078 $4,671 $93 $89 $111
SUBTOTAL 5A. $254,412 $9,055 $215,574 $0 $0 $479,041 $45,194 $79,151 $121,037 $724,423 $14,491 $13,814 $17,267
5AA F-T SYNTHESIS AND PRODUCT UPGRADE
5AA.1 FT Synthesis* $220,379 w/equip. w/equip. $0 $0 $220,379 $21,156 $59,502 $75,260 $376,298 $7,527 $7,175 $8,969
5AA.2 Amine CO2 Adsorption $15,940 w/equip. w/equip. $0 $0 $15,940 $1,530 $4,304 $5,444 $27,218 $544 $519 $649
5AA.3 Amine Regeneration Section $74,537 w/equip. w/equip. $0 $0 $74,537 $7,156 $20,125 $25,455 $127,273 $2,546 $2,427 $3,034
5AA.4 Compression $27,040 w/equip. w/equip. $0 $0 $27,040 $2,596 $7,301 $9,234 $46,171 $924 $880 $1,101
5AA.5 Hydrocarbon Recovery $81,544 w/equip. w/equip. $0 $0 $81,544 $7,828 $22,017 $27,847 $139,237 $2,785 $2,655 $3,319
5AA.6 Hydrogen Recovery $47,842 w/equip. w/equip. $0 $0 $47,842 $4,593 $12,917 $16,338 $81,690 $1,634 $1,558 $1,947
5AA.7 Autothermal Reformer $0 w/equip. w/equip. $0 $0 $0 $0 $0 $0 $0 $0 $0 $0
5AA.8 Naphtha Hydrotreater $5,481 w/equip. w/equip. $0 $0 $5,481 $526 $1,480 $1,872 $9,358 $187 $178 $223
5AA.9 Diesel Hydrotreater $11,841 w/equip. w/equip. $0 $0 $11,841 $1,137 $3,197 $4,044 $20,219 $404 $386 $482
5AA.10 Wax Hydrocracker $42,706 w/equip. w/equip. $0 $0 $42,706 $4,100 $11,531 $14,584 $72,921 $1,459 $1,390 $1,738
5AA.11 Raw Fuel Gas Compressor, HP $21,883 w/equip. w/equip. $0 $0 $21,883 $2,041 $0 $4,785 $28,708 $574 $547 $684
5AA.12 Fuel Gas to GT Compressor, HP $5,767 w/equip. w/equip. $0 $0 $5,767 $538 $0 $1,261 $7,566 $151 $144 $180
5AA.13 WGS Shift Reactor $10,835 w/equip. w/equip. $0 $0 $10,835 $1,040 $2,925 $3,700 $18,501 $370 $353 $441
5AA.14 Amine CO2 Adsorption $3,896 w/equip. w/equip. $0 $0 $3,896 $374 $1,052 $1,331 $6,653 $133 $127 $159
5AA.15 Amine Regeneration Section $364 w/equip. w/equip. $0 $0 $364 $35 $98 $124 $621 $12 $12 $15
SUBTOTAL 5AA. $570,056 $0 $0 $0 $0 $570,056 $54,649 $146,450 $191,277 $962,432 $19,252 $18,352 $22,940
5B CO2 REMOVAL & COMPRESSION
5B.1 CO2 Removal System $0 $0 $0 $0 $0 $0 $0 $0 $0 $0 $0 $0 $0
5B.2 CO2 Compression & Drying $51,200 $0 $17,359 $0 $0 $68,560 $6,393 $0 $14,991 $89,944 $1,799 $1,715 $2,144
SUBTOTAL 5B. $51,200 $0 $17,359 $0 $0 $68,560 $6,393 $0 $14,991 $89,944 $1,799 $1,715 $2,144
TOTAL PLANT COST

Cost and Performance Baseline for Fossil Energy Plants Volume 4: CTL via F-T Synthesis
59
Exhibit 5-1 Total plant cost summary with CO2 sequestration (continued)
Acct Equipment Material Labor Sales Bare Erected Eng'g CM Contingencies
No. Item/Description Cost Cost Direct Indirect Tax Cost $ H.O.& Fee Process Project $ $/bpd $/bpdECO $/bpdEPD
6 COMBUSTION TURBINE/ACCESSORIES $0
6.1 Combustion Turbine Generator $47,397 $0 $3,359 $0 $0 $50,756 $10,985 $11,909 $14,199 $87,848 $1,757 $1,675 $2,094
6.2 Open $0 $0 $0 $0 $0 $0 $0 $0 $0 $0 $0 $0 $0
6.3 Compressed Air Piping $0 $0 $0 $0 $0 $0 $0 $0 $0 $0 $0 $0 $0
6.9 Combustion Turbine Foundations $0 $394 $455 $0 $0 $849 $186 $0 $653 $1,689 $34 $32 $40
SUBTOTAL 6. $47,397 $394 $3,814 $0 $0 $51,604 $11,171 $11,909 $14,852 $89,537 $1,791 $1,707 $2,134
7 HRSG, DUCTING & STACK
7.1 Heat Recovery Steam Generator $12,719 $0 $2,463 $0 $0 $15,182 $1,408 $0 $1,659 $18,249 $365 $348 $435
7.2 Open $0 $0 $0 $0 $0 $0 $0 $0 $0 $0 $0 $0 $0
7.3 Ductwork $0 $1,076 $754 $0 $0 $1,830 $156 $0 $397 $2,382 $48 $45 $57
7.4 Stack $2,076 $0 $775 $0 $0 $2,850 $266 $0 $312 $3,428 $69 $65 $82
7.9 HRSG,Duct & Stack Foundations $0 $395 $397 $0 $0 $792 $74 $0 $260 $1,125 $23 $21 $27
SUBTOTAL 7. $14,795 $1,471 $4,388 $0 $0 $20,654 $1,904 $0 $2,627 $25,185 $504 $480 $600
8 STEAM TURBINE GENERATOR $0
8.1 Steam TG & Accessories $40,717 $0 $6,409 $0 $0 $47,126 $4,151 $0 $5,128 $56,404 $1,128 $1,076 $1,344
8.2 Turbine Plant Auxiliaries $268 $0 $611 $0 $0 $879 $84 $0 $96 $1,059 $21 $20 $25
8.3 Condenser & Auxiliaries $2,960 $0 $1,436 $0 $0 $4,396 $412 $0 $481 $5,288 $106 $101 $126
8.4 Steam Piping $7,100 $0 $3,079 $0 $0 $10,179 $779 $0 $2,739 $13,697 $274 $261 $326
8.9 TG Foundations $0 $1,264 $2,233 $0 $0 $3,497 $330 $0 $1,148 $4,975 $100 $95 $119
SUBTOTAL 8. $51,045 $1,264 $13,768 $0 $0 $66,077 $5,755 $0 $9,592 $81,423 $1,629 $1,553 $1,941
9 COOLING WATER SYSTEM
9.1 Cooling Towers $5,852 $0 $1,773 $0 $0 $7,626 $710 $0 $1,250 $9,587 $192 $183 $229
9.2 Circulating Water Pumps $2,358 $0 $173 $0 $0 $2,531 $216 $0 $412 $3,159 $63 $60 $75
9.3 Circ.Water System Auxiliaries $241 $0 $34 $0 $0 $275 $25 $0 $45 $345 $7 $7 $8
9.4 Circ.Water Piping $0 $8,535 $2,068 $0 $0 $10,603 $889 $0 $2,298 $13,790 $276 $263 $329
9.5 Make-up Water System $614 $0 $844 $0 $0 $1,458 $135 $0 $319 $1,912 $38 $36 $46
9.6 Component Cooling Water Sys $1,220 $1,460 $1,002 $0 $0 $3,682 $329 $0 $802 $4,813 $96 $92 $115
9.9 Circ.Water System Foundations $0 $3,410 $6,058 $0 $0 $9,468 $893 $0 $3,108 $13,469 $269 $257 $321
SUBTOTAL 9. $10,285 $13,404 $11,953 $0 $0 $35,642 $3,198 $0 $8,235 $47,075 $942 $898 $1,122
10 ASH/SPENT SORBENT HANDLING SYS
10.1 Slag Dewatering & Cooling $45,749 $0 $22,407 $0 $0 $68,157 $6,384 $0 $7,454 $81,994 $1,640 $1,564 $1,954
10.2 Gasifier Ash Depressurization w/10.1 w/10.1 w/10.1 $0 $0 $0 $0 $0 $0 $0 $0 $0 $0
10.3 Cleanup Ash Depressurization w/10.1 w/10.1 w/10.1 $0 $0 $0 $0 $0 $0 $0 $0 $0 $0
10.4 High Temperature Ash Piping $0 $0 $0 $0 $0 $0 $0 $0 $0 $0 $0 $0 $0
10.5 Other Ash Recovery Equipment $0 $0 $0 $0 $0 $0 $0 $0 $0 $0 $0 $0 $0
10.6 Ash Storage Silos $1,381 $0 $1,493 $0 $0 $2,874 $272 $0 $472 $3,618 $72 $69 $86
10.7 Ash Transport & Feed Equipment $1,901 $0 $444 $0 $0 $2,345 $209 $0 $383 $2,937 $59 $56 $70
10.8 Misc. Ash Handling Equipment $2,861 $3,506 $1,040 $0 $0 $7,408 $686 $0 $1,214 $9,308 $186 $177 $222
10.9 Ash/Spent Sorbent Foundation $0 $116 $152 $0 $0 $268 $25 $0 $88 $382 $8 $7 $9
SUBTOTAL 10. $51,893 $3,622 $25,537 $0 $0 $81,052 $7,576 $0 $9,611 $98,239 $1,965 $1,873 $2,342
TOTAL PLANT COST

Cost and Performance Baseline for Fossil Energy Plants Volume 4: CTL via F-T Synthesis
60
Exhibit 5-1 Total plant cost summary with CO2 sequestration (continued)
Acct Equipment Material Labor Sales Bare Erected Eng'g CM Contingencies
No. Item/Description Cost Cost Direct Indirect Tax Cost $ H.O.& Fee Process Project $ $/bpd $/bpdECO $/bpdEPD
11 ACCESSORY ELECTRIC PLANT
11.1 Generator Equipment $837 $0 $815 $0 $0 $1,653 $153 $0 $181 $1,987 $40 $38 $47
11.2 Station Service Equipment $7,702 $0 $708 $0 $0 $8,410 $773 $0 $918 $10,102 $202 $193 $241
11.3 Switchgear & Motor Control $14,215 $0 $2,642 $0 $0 $16,857 $1,560 $0 $2,763 $21,180 $424 $404 $505
11.4 Conduit & Cable Tray $0 $7,223 $22,264 $0 $0 $29,487 $2,748 $0 $8,059 $40,293 $806 $768 $960
11.5 Wire & Cable $0 $13,926 $8,473 $0 $0 $22,398 $1,520 $0 $5,980 $29,898 $598 $570 $713
11.6 Protective Equipment $0 $797 $2,958 $0 $0 $3,755 $361 $0 $617 $4,733 $95 $90 $113
11.7 Standby Equipment $211 $0 $211 $0 $0 $422 $40 $0 $69 $531 $11 $10 $13
11.8 Main Power Transformers $13,787 $0 $117 $0 $0 $13,904 $1,052 $0 $2,243 $17,200 $344 $328 $410
11.9 Electrical Foundations $0 $123 $336 $0 $0 $460 $44 $0 $151 $654 $13 $12 $16
SUBTOTAL 11. $36,753 $22,069 $38,525 $0 $0 $97,346 $8,251 $0 $20,981 $126,578 $2,532 $2,414 $3,017
12 INSTRUMENTATION & CONTROL
12.1 IGCC Control Equipment w/4.1 $0 w/4.1 $0 $0 $0 $0 $0 $0 $0 $0 $0 $0
12.2 Combustion Turbine Control w/6.1 $0 w/6.1 $0 $0 $0 $0 $0 $0 $0 $0 $0 $0
12.3 Steam Turbine Control w/8.1 $0 w/8.1 $0 $0 $0 $0 $0 $0 $0 $0 $0 $0
12.4 Other Major Component Control $1,428 $0 $973 $0 $0 $2,400 $225 $120 $412 $3,157 $63 $60 $75
12.5 Signal Processing Equipment w/12.7 $0 w/12.7 $0 $0 $0 $0 $0 $0 $0 $0 $0 $0
12.6 Control Boards,Panels & Racks $328 $0 $215 $0 $0 $543 $51 $27 $124 $745 $15 $14 $18
12.7 Computer & Accessories $7,615 $0 $249 $0 $0 $7,864 $721 $393 $898 $9,875 $198 $188 $235
12.8 Instrument Wiring & Tubing $0 $2,931 $5,549 $0 $0 $8,480 $686 $424 $2,398 $11,988 $240 $229 $286
12.9 Other I & C Equipment $5,090 $0 $2,522 $0 $0 $7,612 $711 $381 $1,306 $10,009 $200 $191 $239
SUBTOTAL 12. $14,461 $2,931 $9,507 $0 $0 $26,899 $2,394 $1,345 $5,137 $35,775 $716 $682 $853
13 IMPROVEMENTS TO SITE
13.1 Site Preparation $0 $262 $5,948 $0 $0 $6,210 $605 $0 $2,045 $8,860 $177 $169 $211
13.2 Site Improvements $0 $4,653 $6,578 $0 $0 $11,231 $1,114 $0 $3,704 $16,049 $321 $306 $383
13.3 Site Facilities $8,339 $0 $9,360 $0 $0 $17,699 $1,760 $0 $5,838 $25,296 $506 $482 $603
SUBTOTAL 13. $8,339 $4,915 $21,887 $0 $0 $35,140 $3,479 $0 $11,586 $50,205 $1,004 $957 $1,197
14 BUILDINGS & STRUCTURES
14.1 Combustion Turbine Area $0 $317 $179 $0 $0 $496 $43 $0 $108 $647 $13 $12 $15
14.2 Steam Turbine Building $0 $5,495 $7,822 $0 $0 $13,317 $1,200 $0 $2,178 $16,694 $334 $318 $398
14.3 Administration Building $0 $2,275 $1,649 $0 $0 $3,924 $342 $0 $640 $4,906 $98 $94 $117
14.4 Circulation Water Pumphouse $0 $356 $240 $0 $0 $596 $51 $0 $97 $744 $15 $14 $18
14.5 Water Treatment Buildings $0 $954 $930 $0 $0 $1,885 $167 $0 $308 $2,359 $47 $45 $56
14.6 Machine Shop $0 $1,164 $796 $0 $0 $1,961 $170 $0 $320 $2,451 $49 $47 $58
14.7 Warehouse $0 $1,880 $1,213 $0 $0 $3,093 $268 $0 $504 $3,865 $77 $74 $92
14.8 Other Buildings & Structures $0 $1,126 $876 $0 $0 $2,002 $175 $0 $435 $2,613 $52 $50 $62
14.9 Waste Treating Building & Str. $0 $1,182 $2,257 $0 $0 $3,438 $314 $0 $750 $4,503 $90 $86 $107
SUBTOTAL 14. $0 $14,749 $15,963 $0 $0 $30,712 $2,729 $0 $5,340 $38,781 $776 $739 $924
TOTAL COST $2,773,630 $155,535 $815,702 $0 $0 $3,744,868 $347,018 $376,059 $806,116 $5,274,060 $105,498 $100,569 $125,711
TOTAL PLANT COST

Cost and Performance Baseline for Fossil Energy Plants Volume 4: CTL via F-T Synthesis
61
Exhibit 5-1 Total plant cost summary with CO2 sequestration (continued)
Acct Equipment Material Labor Sales Bare Erected Eng'g CM Contingencies
No. Item/Description Cost Cost Direct Indirect Tax Cost $ H.O.& Fee Process Project $ $/bpd $/bpdECO $/bpdEPD
Owner's Costs
Preproduction Costs
6 Months All Labor $47,686 $954 $909 $1,137
1 Month Maintenance Materials $8,285 $166 $158 $197
1 Month Non-fuel Consumables $2,142 $43 $41 $51
1 Month Waste Disposal $1,617 $32 $31 $39
25% of 1 Months Fuel Cost at 100% CF $10,958 $219 $209 $261
2% of TPC $105,481 $2,110 $2,011 $2,514
Total $176,169 $3,524 $3,359 $4,199
Inventory Capital
60 day supply of fuel and consumables at 100% CF $91,311 $1,827 $1,741 $2,176
0.5% of TPC (spare parts) $26,370 $527 $503 $629
Total $117,681 $2,354 $2,244 $2,805
Initial Cost for Catalyst and Chemicals $29,733 $595 $567 $709
Land $900 $18 $17 $21
Other Owner's Costs $791,109 $15,825 $15,085 $18,857
Financing Costs $142,400 $2,848 $2,715 $3,394
Total Overnight Costs (TOC) $6,532,052 $130,662 $124,557 $155,696
TASC Multiplier (Loan Guarantees FUELS, 35 year) 1.147
Total As-Spent Cost (TASC) $7,494,877 $149,922 $142,917 $178,646
TOTAL PLANT COST

Cost and Performance Baseline for Fossil Energy Plants Volume 4: CTL via F-T Synthesis
62
Exhibit 5-2 Total operating and maintenance costs with CO2 sequestration
INITIAL & ANNUAL O&M EXPENSES Cost Base (Jun): 2011
Base Case 1 - Total System
bbl/day: 49,992
Capacity Factor (%): 90
OPERATING & MAINTENANCE LABOR
Operating Labor
Operating Labor Rate(base): 39.70 $/hour
Operating Labor Burden: 30.00 % of base
Labor O-H Charge Rate: 25.00 % of labor
Total
Operating Labor Requirements(O.J.)per Shift: 1 unit/mod. Plant
Skilled Operator 2.0 8.0
Operator 10.0 40.0
Foreman 1.0 4.0
Lab Tech's, etc. 3.0 12.0
TOTAL-O.J.'s 16.0 64.0
Annual Cost Annual Unit Cost
$ $/(bbl/day)
Annual Operating Labor Cost $28,934,630 $578.785
Maintenance Labor Cost $47,363,570 $947.423
Administrative & Support Labor $19,074,550 $381.552
Property Taxes and Insurance $105,481,202 $2,109.962
TOTAL FIXED OPERATING COSTS $200,853,953 $4,017.722
VARIABLE OPERATING COSTS
$/bbl
Maintenance Material Cost $89,476,433 $5.44845
Consumables Consumption Unit Initial Fill
Initial Fill /Day Cost Cost
Water (/1000 gallons) 0 6,244 1.67 $0 $3,433,490 $0.20907
Chemicals 6
MU & WT Chem. (lbs) 0 37,199 0.27 $0 $3,272,918 $0.19930
Carbon (Mercury Removal) (lb) 301,013 515 1.63 $489,217 $275,185 $0.01676
FT Catalyst (lbs) 1,010,363.60 3,532.22 7.15 $7,224,100 $8,296,378 $0.50519
Water Gas Shift Catalyst (ft3) 3,655 3 771.99 $2,821,253 $793,477 $0.04832
Methanol (tons) 1,871 45 300.00 $561,300 $4,434,750 $0.27004
Amine Solution (gal) 479,971 153 36.79 $17,658,727 $1,849,146 $0.11260
Hydrotreating Catalyst (ft3) 772.62 0.71 700.00 $540,835 $162,187 $0.00988
Naphtha reforming catalyst (ft3) 278.90 0.25 900.00 $251,008 $75,273 $0.00458
Isomerization Catalysts (ft3) 373.12 0.34 500.00 $186,560 $55,946 $0.00341
Claus Catalyst (ft3) w/equip. 7 203.15 $0 $486,163 $0.02960
Subtotal Chemicals $29,732,998 $19,701,423 $1.19967
Other
Butane (tons) 0 0 651.34 $0 $0 $0.00000
Gases, N2 etc. (/100scf) 0 0 0.00 $0 $0 $0.00000
L.P. Steam (/1000 pounds) 0 0 0.00 $0 $0 $0.00000
Subtotal Other $0 $0 $0.00000
Waste Disposal
Spent Mercury Catalyst (lb.) 0 515 0.65 $0 $110,074 $0.00670
Flyash (ton) 0 0 0.00 $0 $0 $0.00000
Slag (ton) 0 2,104 25.11 $0 $17,354,113 $1.05674
Subtotal-Waste Disposal $0 $17,464,187 $1.06344
By-products & Emissions (credit)
Sulfur (ton) 0 0 0.00 $0 $0 $0.00000
Supplemental Electricity (for sale) (MWh) 0 112 58.59 $0 ($2,148,868) -$0.13085
Subtotal By-Products $0 ($2,148,868) -$0.13085
TOTAL VARIABLE OPERATING COSTS $29,732,998 $127,926,663 $7.78978
Fuel (ton) 0 21,006 68.60 $0 $473,377,146 $28.82514
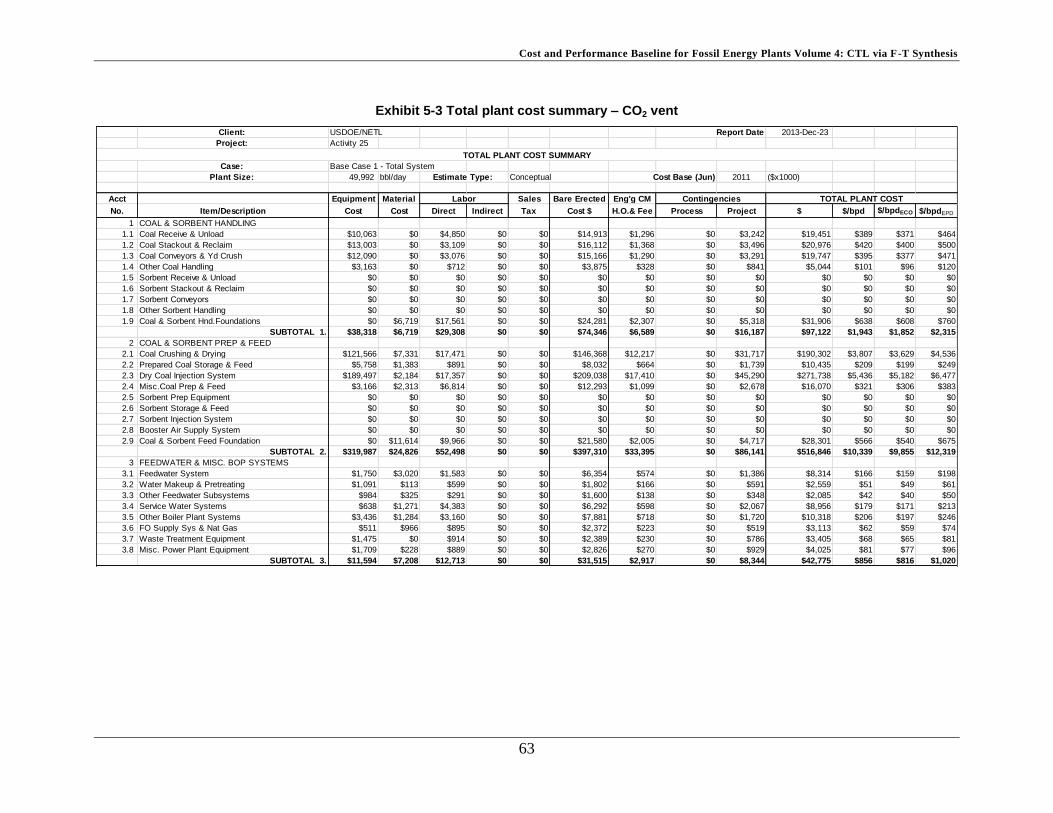
Cost and Performance Baseline for Fossil Energy Plants Volume 4: CTL via F-T Synthesis
63
Exhibit 5-3 Total plant cost summary – CO2 vent
Client: USDOE/NETL Report Date: 2013-Dec-23
Project: Activity 25
Case: Base Case 1 - Total System
Plant Size: 49,992 bbl/day Estimate Type: Conceptual Cost Base (Jun) 2011 ($x1000)
Acct Equipment Material Labor Sales Bare Erected Eng'g CM Contingencies
No. Item/Description Cost Cost Direct Indirect Tax Cost $ H.O.& Fee Process Project $ $/bpd $/bpdECO $/bpdEPD
1 COAL & SORBENT HANDLING
1.1 Coal Receive & Unload $10,063 $0 $4,850 $0 $0 $14,913 $1,296 $0 $3,242 $19,451 $389 $371 $464
1.2 Coal Stackout & Reclaim $13,003 $0 $3,109 $0 $0 $16,112 $1,368 $0 $3,496 $20,976 $420 $400 $500
1.3 Coal Conveyors & Yd Crush $12,090 $0 $3,076 $0 $0 $15,166 $1,290 $0 $3,291 $19,747 $395 $377 $471
1.4 Other Coal Handling $3,163 $0 $712 $0 $0 $3,875 $328 $0 $841 $5,044 $101 $96 $120
1.5 Sorbent Receive & Unload $0 $0 $0 $0 $0 $0 $0 $0 $0 $0 $0 $0 $0
1.6 Sorbent Stackout & Reclaim $0 $0 $0 $0 $0 $0 $0 $0 $0 $0 $0 $0 $0
1.7 Sorbent Conveyors $0 $0 $0 $0 $0 $0 $0 $0 $0 $0 $0 $0 $0
1.8 Other Sorbent Handling $0 $0 $0 $0 $0 $0 $0 $0 $0 $0 $0 $0 $0
1.9 Coal & Sorbent Hnd.Foundations $0 $6,719 $17,561 $0 $0 $24,281 $2,307 $0 $5,318 $31,906 $638 $608 $760
SUBTOTAL 1. $38,318 $6,719 $29,308 $0 $0 $74,346 $6,589 $0 $16,187 $97,122 $1,943 $1,852 $2,315
2 COAL & SORBENT PREP & FEED
2.1 Coal Crushing & Drying $121,566 $7,331 $17,471 $0 $0 $146,368 $12,217 $0 $31,717 $190,302 $3,807 $3,629 $4,536
2.2 Prepared Coal Storage & Feed $5,758 $1,383 $891 $0 $0 $8,032 $664 $0 $1,739 $10,435 $209 $199 $249
2.3 Dry Coal Injection System $189,497 $2,184 $17,357 $0 $0 $209,038 $17,410 $0 $45,290 $271,738 $5,436 $5,182 $6,477
2.4 Misc.Coal Prep & Feed $3,166 $2,313 $6,814 $0 $0 $12,293 $1,099 $0 $2,678 $16,070 $321 $306 $383
2.5 Sorbent Prep Equipment $0 $0 $0 $0 $0 $0 $0 $0 $0 $0 $0 $0 $0
2.6 Sorbent Storage & Feed $0 $0 $0 $0 $0 $0 $0 $0 $0 $0 $0 $0 $0
2.7 Sorbent Injection System $0 $0 $0 $0 $0 $0 $0 $0 $0 $0 $0 $0 $0
2.8 Booster Air Supply System $0 $0 $0 $0 $0 $0 $0 $0 $0 $0 $0 $0 $0
2.9 Coal & Sorbent Feed Foundation $0 $11,614 $9,966 $0 $0 $21,580 $2,005 $0 $4,717 $28,301 $566 $540 $675
SUBTOTAL 2. $319,987 $24,826 $52,498 $0 $0 $397,310 $33,395 $0 $86,141 $516,846 $10,339 $9,855 $12,319
3 FEEDWATER & MISC. BOP SYSTEMS
3.1 Feedwater System $1,750 $3,020 $1,583 $0 $0 $6,354 $574 $0 $1,386 $8,314 $166 $159 $198
3.2 Water Makeup & Pretreating $1,091 $113 $599 $0 $0 $1,802 $166 $0 $591 $2,559 $51 $49 $61
3.3 Other Feedwater Subsystems $984 $325 $291 $0 $0 $1,600 $138 $0 $348 $2,085 $42 $40 $50
3.4 Service Water Systems $638 $1,271 $4,383 $0 $0 $6,292 $598 $0 $2,067 $8,956 $179 $171 $213
3.5 Other Boiler Plant Systems $3,436 $1,284 $3,160 $0 $0 $7,881 $718 $0 $1,720 $10,318 $206 $197 $246
3.6 FO Supply Sys & Nat Gas $511 $966 $895 $0 $0 $2,372 $223 $0 $519 $3,113 $62 $59 $74
3.7 Waste Treatment Equipment $1,475 $0 $914 $0 $0 $2,389 $230 $0 $786 $3,405 $68 $65 $81
3.8 Misc. Power Plant Equipment $1,709 $228 $889 $0 $0 $2,826 $270 $0 $929 $4,025 $81 $77 $96
SUBTOTAL 3. $11,594 $7,208 $12,713 $0 $0 $31,515 $2,917 $0 $8,344 $42,775 $856 $816 $1,020
TOTAL PLANT COST
TOTAL PLANT COST SUMMARY

Cost and Performance Baseline for Fossil Energy Plants Volume 4: CTL via F-T Synthesis
64
Exhibit 5-3 Total plant cost summary – CO2 vent (continued)
Acct Equipment Material Labor Sales Bare Erected Eng'g CM Contingencies
No. Item/Description Cost Cost Direct Indirect Tax Cost $ H.O.& Fee Process Project $ $/bpd $/bpdECO $/bpdEPD
4 GASIFIER & ACCESSORIES
4.1 Gasifier, Syngas Cooler & Auxiliaries (Shell) $699,517 $0 $301,659 $0 $0 $1,001,175 $88,113 $137,204 $188,698 $1,415,190 $28,308 $26,985 $33,732
4.2 Syngas Cooling w/4.1 $0 w/ 4.1 $0 $0 $0 $0 $0 $0 $0 $0 $0 $0
4.3 ASU/Oxidant Compression $551,221 $0 w/equip. $0 $0 $551,221 $51,506 $0 $60,273 $663,000 $13,262 $12,642 $15,803
4.4 LT Heat Recovery & FG Saturation $42,214 $0 $15,797 $0 $0 $58,011 $5,481 $0 $12,698 $76,191 $1,524 $1,453 $1,816
4.5 Misc. Gasification Equipment w/4.1&4.2 $0 w/4.1&4.2 $0 $0 $0 $0 $0 $0 $0 $0 $0 $0
4.6 Flare Stack System $0 $3,287 $1,328 $0 $0 $4,615 $431 $0 $1,009 $6,056 $121 $115 $144
4.8 Major Component Rigging w/4.1&4.2 $0 w/4.1&4.2 $0 $0 $0 $0 $0 $0 $0 $0 $0 $0
4.9 Gasification Foundations $0 $39,797 $23,734 $0 $0 $63,531 $5,856 $0 $17,347 $86,734 $1,735 $1,654 $2,067
SUBTOTAL 4. $1,292,951 $43,084 $342,518 $0 $0 $1,678,553 $151,389 $137,204 $280,025 $2,247,170 $44,951 $42,850 $53,562
5A GAS CLEANUP & PIPING
5A.1 Rectisol System $217,615 $0 $176,832 $0 $0 $394,447 $37,218 $78,889 $102,111 $612,665 $12,255 $11,683 $14,603
5A.2 Elemental Sulfur Plant $24,556 $4,786 $31,465 $0 $0 $60,808 $5,775 $0 $13,317 $79,900 $1,598 $1,524 $1,904
5A.3 Mercury Removal $2,985 $0 $2,256 $0 $0 $5,241 $494 $262 $1,199 $7,196 $144 $137 $172
5A.4 Shift Reactors $5,623 $0 $2,248 $0 $0 $7,870 $735 $0 $1,721 $10,327 $207 $197 $246
5A.5 Particulate Removal w/4.1 $0 w/4.1 $0 $0 $0 $0 $0 $0 $0 $0 $0 $0
5A.6 Blowback Gas Systems $3,633 $611 $342 $0 $0 $4,587 $423 $0 $1,002 $6,012 $120 $115 $143
5A.7 Fuel Gas Piping $0 $1,692 $1,107 $0 $0 $2,799 $244 $0 $609 $3,652 $73 $70 $87
5A.9 HGCU Foundations $0 $1,965 $1,324 $0 $0 $3,289 $304 $0 $1,078 $4,671 $93 $89 $111
SUBTOTAL 5A. $254,412 $9,055 $215,574 $0 $0 $479,041 $45,194 $79,151 $121,037 $724,423 $14,491 $13,814 $17,267
5AA F-T SYNTHESIS AND PRODUCT UPGRADE
5AA.1 FT Synthesis* $220,380 w/equip. w/equip. $0 $0 $220,380 $21,156 $59,503 $75,260 $376,298 $7,527 $7,175 $8,969
5AA.2 Amine CO2 Adsorption $15,940 w/equip. w/equip. $0 $0 $15,940 $1,530 $4,304 $5,444 $27,218 $544 $519 $649
5AA.3 Amine Regeneration Section $74,538 w/equip. w/equip. $0 $0 $74,538 $7,156 $20,125 $25,455 $127,273 $2,546 $2,427 $3,034
5AA.4 Compression $27,040 w/equip. w/equip. $0 $0 $27,040 $2,596 $7,301 $9,234 $46,171 $924 $880 $1,101
5AA.5 Hydrocarbon Recovery $81,544 w/equip. w/equip. $0 $0 $81,544 $7,828 $22,017 $27,847 $139,237 $2,785 $2,655 $3,319
5AA.6 Hydrogen Recovery $47,841 w/equip. w/equip. $0 $0 $47,841 $4,593 $12,917 $16,338 $81,689 $1,634 $1,558 $1,947
5AA.7 Autothermal Reformer $0 w/equip. w/equip. $0 $0 $0 $0 $0 $0 $0 $0 $0 $0
5AA.8 Naphtha Hydrotreater $5,480 w/equip. w/equip. $0 $0 $5,480 $526 $1,480 $1,872 $9,358 $187 $178 $223
5AA.9 Diesel Hydrotreater $11,841 w/equip. w/equip. $0 $0 $11,841 $1,137 $3,197 $4,044 $20,219 $404 $386 $482
5AA.10 Wax Hydrocracker $42,706 w/equip. w/equip. $0 $0 $42,706 $4,100 $11,531 $14,584 $72,921 $1,459 $1,390 $1,738
5AA.11 Raw Fuel Gas Compressor, HP $29,451 w/equip. w/equip. $0 $0 $29,451 $2,746 $0 $6,440 $38,637 $773 $737 $921
5AA.12 Fuel Gas to GT Compressor, HP $6,764 w/equip. w/equip. $0 $0 $6,764 $631 $0 $1,479 $8,874 $177 $169 $212
SUBTOTAL 5AA. $563,527 $0 $0 $0 $0 $563,527 $53,999 $142,374 $187,995 $947,895 $18,961 $18,075 $22,594
5B CO2 REMOVAL & COMPRESSION
5B.1 CO2 Removal System $0 $0 $0 $0 $0 $0 $0 $0 $0 $0 $0 $0 $0
5B.2 CO2 Compression & Drying $0 $0 $0 $0 $0 $0 $0 $0 $0 $0 $0 $0 $0
SUBTOTAL 5B. $0 $0 $0 $0 $0 $0 $0 $0 $0 $0 $0 $0 $0
TOTAL PLANT COST

Cost and Performance Baseline for Fossil Energy Plants Volume 4: CTL via F-T Synthesis
65
Exhibit 5-3 Total plant cost summary – CO2 vent (continued)
Acct Equipment Material Labor Sales Bare Erected Eng'g CM Contingencies
No. Item/Description Cost Cost Direct Indirect Tax Cost $ H.O.& Fee Process Project $ $/bpd $/bpdECO $/bpdEPD
6 COMBUSTION TURBINE/ACCESSORIES $0
6.1 Combustion Turbine Generator $42,610 $0 $3,020 $0 $0 $45,630 $10,985 $11,909 $14,199 $82,723 $1,655 $1,577 $1,972
6.2 Open $0 $0 $0 $0 $0 $0 $0 $0 $0 $0 $0 $0 $0
6.3 Compressed Air Piping $0 $0 $0 $0 $0 $0 $0 $0 $0 $0 $0 $0 $0
6.9 Combustion Turbine Foundations $0 $354 $409 $0 $0 $763 $186 $0 $653 $1,603 $32 $31 $38
SUBTOTAL 6. $42,610 $354 $3,429 $0 $0 $46,393 $11,171 $11,909 $14,852 $84,326 $1,687 $1,608 $2,010
7 HRSG, DUCTING & STACK
7.1 Heat Recovery Steam Generator $14,626 $0 $2,833 $0 $0 $17,458 $1,619 $0 $1,908 $20,986 $420 $400 $500
7.2 Open $0 $0 $0 $0 $0 $0 $0 $0 $0 $0 $0 $0 $0
7.3 Ductwork $0 $1,070 $750 $0 $0 $1,819 $155 $0 $395 $2,369 $47 $45 $56
7.4 Stack $2,064 $0 $770 $0 $0 $2,834 $265 $0 $310 $3,409 $68 $65 $81
7.9 HRSG,Duct & Stack Foundations $0 $393 $394 $0 $0 $787 $73 $0 $258 $1,119 $22 $21 $27
SUBTOTAL 7. $16,690 $1,463 $4,747 $0 $0 $22,899 $2,112 $0 $2,871 $27,882 $558 $532 $665
8 STEAM TURBINE GENERATOR
8.1 Steam TG & Accessories $42,612 $0 $6,707 $0 $0 $49,319 $4,344 $0 $5,366 $59,029 $1,181 $1,126 $1,407
8.2 Turbine Plant Auxiliaries $281 $0 $640 $0 $0 $921 $88 $0 $101 $1,110 $22 $21 $26
8.3 Condenser & Auxiliaries $3,090 $0 $1,499 $0 $0 $4,589 $430 $0 $502 $5,521 $110 $105 $132
8.4 Steam Piping $7,924 $0 $3,436 $0 $0 $11,360 $869 $0 $3,057 $15,287 $306 $291 $364
8.9 TG Foundations $0 $1,325 $2,340 $0 $0 $3,665 $346 $0 $1,203 $5,214 $104 $99 $124
SUBTOTAL 8. $53,907 $1,325 $14,623 $0 $0 $69,854 $6,076 $0 $10,230 $86,160 $1,723 $1,643 $2,054
9 COOLING WATER SYSTEM
9.1 Cooling Towers $5,530 $0 $1,676 $0 $0 $7,206 $671 $0 $1,182 $9,058 $181 $173 $216
9.2 Circulating Water Pumps $2,227 $0 $164 $0 $0 $2,391 $204 $0 $389 $2,984 $60 $57 $71
9.3 Circ.Water System Auxiliaries $228 $0 $32 $0 $0 $260 $24 $0 $43 $327 $7 $6 $8
9.4 Circ.Water Piping $0 $8,107 $1,964 $0 $0 $10,070 $844 $0 $2,183 $13,098 $262 $250 $312
9.5 Make-up Water System $582 $0 $801 $0 $0 $1,383 $128 $0 $302 $1,813 $36 $35 $43
9.6 Component Cooling Water Sys $1,156 $1,383 $949 $0 $0 $3,488 $312 $0 $760 $4,560 $91 $87 $109
9.9 Circ.Water System Foundations $0 $3,243 $5,763 $0 $0 $9,007 $850 $0 $2,957 $12,813 $256 $244 $305
SUBTOTAL 9. $9,724 $12,733 $11,349 $0 $0 $33,805 $3,033 $0 $7,815 $44,653 $893 $851 $1,064
10 ASH/SPENT SORBENT HANDLING SYS
10.1 Slag Dewatering & Cooling $45,749 $0 $22,407 $0 $0 $68,157 $6,384 $0 $7,454 $81,994 $1,640 $1,563 $1,954
10.2 Gasifier Ash Depressurization w/10.1 w/10.1 w/10.1 $0 $0 $0 $0 $0 $0 $0 $0 $0 $0
10.3 Cleanup Ash Depressurization w/10.1 w/10.1 w/10.1 $0 $0 $0 $0 $0 $0 $0 $0 $0 $0
10.4 High Temperature Ash Piping $0 $0 $0 $0 $0 $0 $0 $0 $0 $0 $0 $0 $0
10.5 Other Ash Recovery Equipment $0 $0 $0 $0 $0 $0 $0 $0 $0 $0 $0 $0 $0
10.6 Ash Storage Silos $1,381 $0 $1,493 $0 $0 $2,874 $272 $0 $472 $3,618 $72 $69 $86
10.7 Ash Transport & Feed Equipment $1,901 $0 $444 $0 $0 $2,345 $209 $0 $383 $2,937 $59 $56 $70
10.8 Misc. Ash Handling Equipment $2,861 $3,506 $1,040 $0 $0 $7,408 $686 $0 $1,214 $9,308 $186 $177 $222
10.9 Ash/Spent Sorbent Foundation $0 $116 $152 $0 $0 $268 $25 $0 $88 $382 $8 $7 $9
SUBTOTAL 10. $51,893 $3,622 $25,537 $0 $0 $81,052 $7,576 $0 $9,611 $98,239 $1,965 $1,873 $2,342
TOTAL PLANT COST

Cost and Performance Baseline for Fossil Energy Plants Volume 4: CTL via F-T Synthesis
66
Exhibit 5-3 Total plant cost summary – CO2 vent (continued)
Acct Equipment Material Labor Sales Bare Erected Eng'g CM Contingencies
No. Item/Description Cost Cost Direct Indirect Tax Cost $ H.O.& Fee Process Project $ $/bpd $/bpdECO $/bpdEPD
11 ACCESSORY ELECTRIC PLANT
11.1 Generator Equipment $889 $0 $866 $0 $0 $1,755 $163 $0 $192 $2,110 $42 $40 $50
11.2 Station Service Equipment $7,322 $0 $673 $0 $0 $7,996 $735 $0 $873 $9,604 $192 $183 $229
11.3 Switchgear & Motor Control $13,515 $0 $2,512 $0 $0 $16,027 $1,483 $0 $2,626 $20,136 $403 $384 $480
11.4 Conduit & Cable Tray $0 $6,867 $21,168 $0 $0 $28,034 $2,613 $0 $7,662 $38,309 $766 $730 $913
11.5 Wire & Cable $0 $13,240 $8,055 $0 $0 $21,295 $1,445 $0 $5,685 $28,425 $569 $542 $678
11.6 Protective Equipment $0 $797 $2,958 $0 $0 $3,755 $361 $0 $617 $4,733 $95 $90 $113
11.7 Standby Equipment $222 $0 $221 $0 $0 $443 $42 $0 $73 $558 $11 $11 $13
11.8 Main Power Transformers $14,819 $0 $126 $0 $0 $14,945 $1,131 $0 $2,411 $18,487 $370 $353 $441
11.9 Electrical Foundations $0 $133 $361 $0 $0 $494 $47 $0 $162 $703 $14 $13 $17
SUBTOTAL 11. $36,767 $21,036 $36,940 $0 $0 $94,744 $8,019 $0 $20,302 $123,065 $2,462 $2,347 $2,933
12 INSTRUMENTATION & CONTROL
12.1 IGCC Control Equipment w/4.1 $0 w/4.1 $0 $0 $0 $0 $0 $0 $0 $0 $0 $0
12.2 Combustion Turbine Control w/6.1 $0 w/6.1 $0 $0 $0 $0 $0 $0 $0 $0 $0 $0
12.3 Steam Turbine Control w/8.1 $0 w/8.1 $0 $0 $0 $0 $0 $0 $0 $0 $0 $0
12.4 Other Major Component Control $1,406 $0 $958 $0 $0 $2,364 $222 $118 $406 $3,109 $62 $59 $74
12.5 Signal Processing Equipment w/12.7 $0 w/12.7 $0 $0 $0 $0 $0 $0 $0 $0 $0 $0
12.6 Control Boards,Panels & Racks $323 $0 $211 $0 $0 $535 $50 $27 $122 $734 $15 $14 $17
12.7 Computer & Accessories $7,500 $0 $245 $0 $0 $7,745 $710 $387 $884 $9,726 $195 $185 $232
12.8 Instrument Wiring & Tubing $0 $2,887 $5,465 $0 $0 $8,352 $676 $418 $2,361 $11,806 $236 $225 $281
12.9 Other I & C Equipment $5,013 $0 $2,484 $0 $0 $7,497 $700 $375 $1,286 $9,858 $197 $188 $235
SUBTOTAL 12. $14,242 $2,887 $9,363 $0 $0 $26,491 $2,358 $1,325 $5,059 $35,233 $705 $672 $840
13 IMPROVEMENTS TO SITE
13.1 Site Preparation $0 $262 $5,948 $0 $0 $6,210 $605 $0 $2,045 $8,860 $177 $169 $211
13.2 Site Improvements $0 $4,653 $6,578 $0 $0 $11,231 $1,114 $0 $3,704 $16,049 $321 $306 $383
13.3 Site Facilities $8,339 $0 $9,360 $0 $0 $17,699 $1,760 $0 $5,838 $25,296 $506 $482 $603
SUBTOTAL 13. $8,339 $4,915 $21,887 $0 $0 $35,140 $3,479 $0 $11,586 $50,205 $1,004 $957 $1,197
14 BUILDINGS & STRUCTURES
14.1 Combustion Turbine Area $0 $317 $179 $0 $0 $496 $43 $0 $108 $647 $13 $12 $15
14.2 Steam Turbine Building $0 $5,495 $7,822 $0 $0 $13,317 $1,200 $0 $2,178 $16,694 $334 $318 $398
14.3 Administration Building $0 $2,275 $1,649 $0 $0 $3,924 $342 $0 $640 $4,906 $98 $94 $117
14.4 Circulation Water Pumphouse $0 $352 $234 $0 $0 $586 $50 $0 $95 $732 $15 $14 $17
14.5 Water Treatment Buildings $0 $896 $874 $0 $0 $1,770 $157 $0 $289 $2,216 $44 $42 $53
14.6 Machine Shop $0 $1,164 $796 $0 $0 $1,961 $170 $0 $320 $2,451 $49 $47 $58
14.7 Warehouse $0 $1,880 $1,213 $0 $0 $3,093 $268 $0 $504 $3,865 $77 $74 $92
14.8 Other Buildings & Structures $0 $1,126 $876 $0 $0 $2,002 $175 $0 $435 $2,613 $52 $50 $62
14.9 Waste Treating Building & Str. $0 $1,172 $2,239 $0 $0 $3,411 $311 $0 $744 $4,467 $89 $85 $106
SUBTOTAL 14. $0 $14,678 $15,883 $0 $0 $30,560 $2,716 $0 $5,313 $38,590 $772 $736 $920
TOTAL COST $2,714,962 $153,903 $796,368 $0 $0 $3,665,233 $340,021 $371,963 $787,368 $5,164,585 $103,308 $98,480 $123,101
TOTAL PLANT COST

Cost and Performance Baseline for Fossil Energy Plants Volume 4: CTL via F-T Synthesis
67
Exhibit 5-3 Total plant cost summary – CO2 vent (continued)
Acct Equipment Material Labor Sales Bare Erected Eng'g CM Contingencies
No. Item/Description Cost Cost Direct Indirect Tax Cost $ H.O.& Fee Process Project $ $/bpd $/bpdECO $/bpdEPD
Owner's Costs
Preproduction Costs
6 Months All Labor $47,057 $941 $897 $1,122
1 Month Maintenance Materials $8,109 $162 $155 $193
1 Month Non-fuel Consumables $2,068 $41 $39 $49
1 Month Waste Disposal $1,617 $32 $31 $39
25% of 1 Months Fuel Cost at 100% CF $10,958 $219 $209 $261
2% of TPC $103,292 $2,066 $1,970 $2,462
Total $173,100 $3,463 $3,301 $4,126
Inventory Capital
60 day supply of fuel and consumables at 100% CF $91,216 $1,825 $1,739 $2,174
0.5% of TPC (spare parts) $25,823 $517 $492 $616
Total $117,039 $2,341 $2,232 $2,790
Initial Cost for Catalyst and Chemicals $29,005 $580 $553 $691
Land $900 $18 $17 $21
Other Owner's Costs $774,688 $15,496 $14,772 $18,465
Financing Costs $139,444 $2,789 $2,659 $3,324
Total Overnight Costs (TOC) $6,398,760 $127,996 $122,014 $152,518
TASC Multiplier (Loan Guarantees FUELS, 35 year) 1.147
Total As-Spent Cost (TASC) $7,341,938 $146,862 $139,999 $174,999
TOTAL PLANT COST

Cost and Performance Baseline for Fossil Energy Plants Volume 4: CTL via F-T Synthesis
68
Exhibit 5-4 Total operating and maintenance costs – CO2 vent
INITIAL & ANNUAL O&M EXPENSES Cost Base (Jun): 2011
Base Case 1 - Total System
bbl/day: 49,992
Capacity Factor (%): 90
OPERATING & MAINTENANCE LABOR
Operating Labor
Operating Labor Rate(base): 39.70 $/hour
Operating Labor Burden: 30.00 % of base
Labor O-H Charge Rate: 25.00 % of labor
Total
Operating Labor Requirements(O.J.)per Shift: 1 unit/mod. Plant
Skilled Operator 2.0 8.0
Operator 10.0 40.0
Foreman 1.0 4.0
Lab Tech's, etc. 3.0 12.0
TOTAL-O.J.'s 16.0 64.0
Annual Cost Annual Unit Cost
$ $/(bbl/day)
Annual Operating Labor Cost $28,934,630 $578.785
Maintenance Labor Cost $46,356,386 $927.276
Administrative & Support Labor $18,822,754 $376.515
Property Taxes and Insurance $103,291,707 $2,066.165
TOTAL FIXED OPERATING COSTS $197,405,478 $3,948.741
VARIABLE OPERATING COSTS
$/bbl
Maintenance Material Cost $87,573,721 $5.33259
Consumables Consumption Unit Initial Fill
Initial Fill /Day Cost Cost
Water (/1000 gallons) 0 5,717 1.67 $0 $3,143,709 $0.19143
Chemicals 6
MU & WT Chem. (lbs) 0 34,059 0.27 $0 $2,996,689 $0.18248
Carbon (Mercury Removal) (lb) 301,013 515 1.63 $489,217 $275,185 $0.01676
F-T Catalyst (lb) 1,010,363.60 3,532.22 7.15 $7,224,100 $8,296,378 $0.50519
Water Gas Shift Catalyst (ft3) 3,655 3 771.99 $2,821,253 $793,477 $0.04832
Methanol (tons) 1,871 45 300.00 $561,300 $4,434,751 $0.27004
Amine Solution (gal) 460,177 147 36.79 $16,930,492 $1,772,888 $0.10796
Hydrotreating Catalyst (ft3) 772.62 0.71 700.00 $540,835 $162,187 $0.00988
Naphtha reforming catalyst (ft3) 278.90 0.25 900.00 $251,008 $75,273 $0.00458
Isomerization Catalysts (ft3) 373.12 0.34 500.00 $186,560 $55,946 $0.00341
Claus Catalyst (ft3) w/equip. 5 203.15 $0 $325,539 $0.01982
Subtotal Chemicals $29,004,764 $19,188,314 $1.16843
Other
Butane (tons) 0 0 651.34 $0 $0 $0.00000
Gases, N2 etc. (/100scf) 0 0 0.00 $0 $0 $0.00000
L.P. Steam (/1000 pounds) 0 0 0.00 $0 $0 $0.00000
Subtotal Other $0 $0 $0.00000
Waste Disposal
Spent Mercury Catalyst (lb.) 0 515 0.65 $0 $110,074 $0.00670
Flyash (ton) 0 0 0.00 $0 $0 $0.00000
Slag (ton) 0 2,104 25.11 $0 $17,354,113 $1.05674
Subtotal-Waste Disposal $0 $17,464,187 $1.06344
By-products & Emissions (credit)
Sulfur (ton) 0 0 0.00 $0 $0 $0.00000
Supplemental Electricity (for sale) (MWh) 0 2,330 58.59 $0 ($44,844,463) -$2.73069
Subtotal By-Products $0 ($44,844,463) -$2.73069
TOTAL VARIABLE OPERATING COSTS $29,004,764 $82,525,467 $5.02519
Fuel (ton) 0 21,006 68.60 $0 $473,377,146 $28.82514

Cost and Performance Baseline for Fossil Energy Plants Volume 4: CTL via F-T Synthesis
69
5.2 Cost of Production
Two financial structures were examined that reflect a hypothetical future in which technical risk
has been partially mitigated by the demonstration of two or three commercial-scale CTL plants.
The first is assumed to have no government incentives (commercial fuels) while moderate
government incentives – in the form of a government loan guarantee – are assumed to be
available under the second. Both scenarios face a high degree of market risk because of the
volatile nature of energy prices, especially the world oil price. The TOC, TASC, and annual
O&M costs were estimated based on plant performance and a 90 percent capacity factor (CF).
The COP under each financial scenario structure were calculated. The results are presented in
Exhibit 5-5. These costs include a credit of $60/MWh for excess power generated. These values
are consistent with those expected in an environment after a carbon regulatory framework has
been established. The electricity credit accounts for less than 0.5 percent of the total COP in the
sequestration case and less than 2.5 percent of the total COP in the vent case, as shown in
Exhibit 5-6, any change in the assumed price would have very little impact on the overall COP
values calculated.
Exhibit 5-7 provides the TOC per F-T bbl, ECO bbl, and EPD bbl values for each case for ease
of comparison.
Exhibit 5-5 Cost estimation results summary (CO2 sequestration)
CO2 Venting Case CO2 Sequestration Case
Commercial Fuels
Loan Guarantees
Commercial Fuels
Loan Guarantees
Total Overnight Cost, $1000 6,398,760 6,532,052
Total Overnight Cost, $/bpd 127,996 130,662
Total Overnight Cost, $/bpdECO 122,014 124,557
Total Overnight Cost, $/bpdEPD 152,518 155,696
Total As Spent Cost, $1000 7,558,216 7,341,938 7,715,660 7,494,877
Total As Spent Cost, $/bpd 151,189 146,862 154,338 149,922
Total As Spent Cost, $/bpdECO 144,123 139,999 147,127 142,917
Total As Spent Cost, $/bpdlEPD 180,154 174,999 183,908 178,646
Total annual fixed O&M, $1000 197,405 197,405 200,854 200,854
Total annual variable O&M (90% CF), $1000 127,370 127,370 130,076 130,076
Total annual feedstock cost (90% CF), $1000 473,377 473,377 473,377 473,377
Total annual power credit (90% CF), $1000 -44,844 -44,844 -2,149 -2,149
COP F-T Diesel, $/bblFTD 143.7 123.1 154.2 133.2
COP F-T Naphtha, $/bblFTN 100.1 85.8 107.4 92.8
Equivalent Crude Oil Price, $/bblECO 124.7 106.9 133.8 115.6
Equivalent Petroleum Diesel Price, $/bblEPD 155.9 133.6 167.2 144.5
All costs in June 2011 dollars.

Cost and Performance Baseline for Fossil Energy Plants Volume 4: CTL via F-T Synthesis
70
Exhibit 5-6 COP sensitivity to market price of electricity
0
20
40
60
80
100
120
140
160
0 20 40 60 80 100
FT-
Liq
uid
s C
OP
($
/bb
l EC
O)
tota
l [In
clu
din
g C
O2
T&S]
(Ju
ne
20
11
$s)
Market Price of Electricity ($/MWh)
With CO₂ SequestrationAnd Loan Guarrentees
With CO₂ VentingAnd Loan Guarrentees
With CO₂ SequestrationAnd Commercial Loans
With CO₂ VentingAnd Commercial Loans
Electricity Price = $58.59/MWh assumed in Study

Cost and Performance Baseline for Fossil Energy Plants Volume 4: CTL via F-T Synthesis
71
Exhibit 5-7 Comparison of TOC per F-T bbl, ECO bbl, and EPD bbl
Source: NETL
13
0,6
62
12
7,9
96
12
4,5
57
12
2,0
141
55
,69
6
15
2,5
18
0
20,000
40,000
60,000
80,000
100,000
120,000
140,000
160,000
180,000
200,000
Sequestration Vent
TOC
, $/b
bl (
Jun
e 2
011$
s)
TOC, $/bpdTOC, $/bpdECOTOC, $/bpdEPD

Cost and Performance Baseline for Fossil Energy Plants Volume 4: CTL via F-T Synthesis
72
Exhibit 5-8 provides a chart that demonstrates the sensitivity of the cost of production of FT-
Liquids to the capital charge factor. The capital charge factors (CCF) correlate with various
finance structures, as pointed out in the chart, with high-risk investor owned utility (IOU) having
a CCF of 0.124, loan guarantees having a CCF of 0.170, commercial fuels having a CCF of
0.218 and 100 percent equity at 20 percent internal rate of return on equity (IRROE) having a
CCF of 0.350.
Exhibit 5-8 FT-Liquids COP sensitivity to CCF
Source: NETL
0
20
40
60
80
100
120
140
160
180
200
0.05 0.1 0.15 0.2 0.25 0.3 0.35
FT-
Liq
uid
s C
OP
($
/bb
l EC
O)
tota
l [In
clu
din
g C
O2
T&S]
(Ju
ne
20
11
$s)
Capital Charge Factor based on Financial Structures
With CO₂ Sequestration
With CO₂ Venting
Commercial Fuels
100% Equity @ 20% IRROE
High-RiskIOU
Loan Guarantee

Cost and Performance Baseline for Fossil Energy Plants Volume 4: CTL via F-T Synthesis
73
5.3 Cost of Carbon Capture
The base case F-T process with carbon sequestration was compared to the case where CO2 was
vented. In the vent case the partial shift and carbon separation from syngas using Rectisol® was
kept to maintain the H2/CO ratio fed to F-T reactor as was the amine-based tail gas CO2 capture
system to prevent the build-up of inerts in the recycle loop. However, the WGS reactors and
amine-based capture process were removed from the fuel gas stream as was the CO2
compressors, pipeline, and cost of sequestration. Exhibit 5-9 summarizes the additional costs
due to carbon capture.
The cost of capture was calculating using the following equation:
Cost of Carbon Capture = (𝐴 − 𝐵) (𝐶
𝐷)⁄
Where: A = Cost of production for Fischer Tropsch Diesel with
sequestration ($/bblFTD)
B = Cost of production for Fischer Tropsch Diesel without
sequestration ($/bblFTD)
C = Rate of CO2 sequestration (tonne/day)
D = Sum of total diesel daily production and adjusted total naphtha
production. Naphtha is adjusted by a factor of 0.70 to account for lower value.
Exhibit 5-9 Cost summary of CTL facility with and without CCS
Vent Case Sequestration
Case Cost of adding
CCS (delta)
Total Overnight Cost, $1000 6,398,760 6,532,052 133,292
Total annual fixed O&M, $1000 197,405 200,854 3,448
Total annual variable O&M (90% CF), $1000 127,370 130,076 2,706
Total annual fuel cost (90% CF), $1000 473,377 473,377 0
COP F-T Diesel*, $/bblFTD 123.1 [143.7] 133.2 [154.2] 10.1 [10.5]
COP F-T Naphtha*, $/bblFTN 85.8 [100.1] 92.8 [107.4] 7.0 [7.3]
Equivalent Crude Oil Price*, $/bblECO 106.9 [124.7] 115.6 [133.8] 8.7 [9.1]
Equivalent Petroleum Diesel Price*, $/bblEPD 133.6 [155.9] 144.5 [167.2] 10.9 [11.3]
Cost of Carbon Capture*, $/Tonne N/A 19.11 [19.94] 19.11 [19.94] * Values are shown for two financial structures. The first (lower) value is based on the loan guarantee finance structure. The second (higher/bracketed) value is based on the commercial fuels finance structure. All costs in June 2011 dollars.

Cost and Performance Baseline for Fossil Energy Plants Volume 4: CTL via F-T Synthesis
74
6 Conclusions and Recommendations
6.1 Conclusions
Developing an alternative source of liquid fuels using coal as the carbon input has national
security implications and economic consequences. The results of this study show that liquid
fuels produced from a 50,000 bbl/day coal-based F-T plant (low temperature, iron-based
catalyst) are more expensive than fuels produced conventionally from crude oil at today’s oil
prices (about $98/barrel, WTI average in 2013). Government incentives in the form of loan
guarantees significantly reduce the cost of F-T liquids, but not to less than current fuel prices
derived from crude oil. The two cases examined in this study, one with CO2 captured and one
with CO2 vented, have ECO prices of $134/bbl and $125/bbl, respectively, using the commercial
fuels financing structure. Government loan guarantees reduce the ECO price for the same two
cases to $116/bbl and $107/bbl, respectively. Barring a dramatic shift in the oil market, and
given the extremely large capital investment required for these CTL plants (on the order of $6.5
billion TOC), loan guarantees will likely be required to incentivize project development.
CO2 capture is an inherent part of the F-T process resulting in two point sources: from the shifted
syngas via the Rectisol process and from the F-T tail gas via an amine-based process. In the vent
case, CO2 from these two sources was released to the atmosphere. In the sequestration case, CO2
from these two sources was compressed to 2,214 psia along with additional CO2 captured from
the combined cycle power section. The incremental cost of adding this capture and compression
for sequestration is about $9/bbl (ECO price) independent of the financing structure used.
6.2 Recommendations for Further Study
Suggestions for future work include:
Evaluate plant performance and economics using different coal types (subbituminous and
lignite).
Perform a detailed water usage analysis of the facility to determine more accurately the water
makeup and discharge rates. Also determine the best means for minimizing water usage.
Perform a literature search to identify ways of reducing nitrogen and argon concentration in
syngas to reduce recycle load to the F-T reactor.

Cost and Performance Baseline for Fossil Energy Plants Volume 4: CTL via F-T Synthesis
75
7 References
1 “Baseline Technical and Economic Assessment of a Commercial Scale Fischer-Tropsch
Liquids Facility,” DOE/NETL-2007/1260, Final Report for Subtask 41817.401.08.001,
National Energy Technology Laboratory. April 2007. Available at:
http://netl.doe.gov/research/energy-analysis/publications/details?pub=c0067f0f-422d-
4a28-ba34-46025b4ce0c0
2 Tarka, T. J., et al. “Affordable, Low-Carbon Diesel Fuel from Domestic Coal and Biomass,”
DOE/NETL-2009/1349, National Energy Technology Laboratory, Pittsburgh, PA.
January 2009. Available at:
http://www.netl.doe.gov/File%20Library/Research/Energy%20Analysis/Coal/CBTL-
Final-Report.pdf
3 Research and Development Solutions, LLC (RDS). “Design Basis: Market Based Advanced
Coal Power Systems Comparison Study,” Revision 4, November 2005.
4 “Standards of Performance for Electric Utility Steam Generating Units for Which Construction
Commenced after September 18, 1978,” 40 CFR 60, Subpart Da.
5 National Energy Technology Laboratory. “Quality Guidelines for Energy System Studies:
Carbon Dioxide Transport and Storage Costs in NETL Studies.” September 2013.
6 National Energy Technology Laboratory (NETL). (2011). QGESS: Cost Estimation
Methodology for NETL Assessments of Power Plant Performance. Energy Analysis
Publications: Details. Retrieved on March 16, 2012, from
http://www.netl.doe.gov/research/energy-analysis/quality-guidelines-qgess
7 National Energy Technology Laboratory (NETL). (2011). QGESS: Technology Learning
Curve (FOAK to NOAK). Energy Analysis Publications: Details. Retrieved on
September 16, 2013, from http://www.netl.doe.gov/research/energy-analysis/quality-
guidelines-qgess
8 NETL. “Cost and Performance Baseline for Fossil Energy Plants, Volume 1: Bituminous Coal
and Natural Gas to Electricity”. DOE/NETL-2010/1397, Final Report. November 2010
Available at:
http://www.netl.doe.gov/File%20Library/Research/Energy%20Analysis/OE/BitBase_Fin
Rep_Rev2a-3_20130919_1.pdf
9 AACE (formerly Advancement of Cost Engineering International) (2005) Cost Estimate
Classification System – As Applied in Engineering, Procurement, and Construction for
the Process Industries; TCM Framework 7.3 – Cost Estimating and Budgeting, AACE
International Recommended Practice No. 18R-97, 2005, Rev. November 29, 2011
Retrieved on April 8, 2013 from http://www.aacei.org/non/rps/18R-97.pdf
10 Advancement of Cost Engineering (AACE) International. (2003) Conducting Technical and
Economic Evaluations – as Applied for the Process and Utility Industries TCM
Framework: 3.2 – Asset Planning, 3.3 – Investment Decision Making, AACE

Cost and Performance Baseline for Fossil Energy Plants Volume 4: CTL via F-T Synthesis
76
International Recommended Practice No. 16R-90, 2003.
Retrieved on April 8, 2013 from http://www.aacei.org/non/rps/16R-90.pdf
11 NETL Power Systems Financial Model Version 5.0, December 2008. User Guide available at
http://www.netl.doe.gov/research/energy-analysis/publications/listing?progcat=all
12 Wimer, J. Recommended Project Finance Structures for the Economic Analysis of Fossil-
Based Energy Projects. September 2008.
13 Tarka, T. Polygeneration of Fischer-Tropsch Diesel Fuel and Electricity from Coal U.S.
Department of Energy, National Energy Technology Laboratory. August 2010.
14 Stefan Rabe, Thanh-Binh, Truong, et al. Low Temperature Catalytic Partial Oxidation of
Methane for Gas-to-Liquids applications. s.l. : Elsevier, applied catalysts, 2005.
15 ASTM, TABLE X5.1 Tenth Percentile Minimum Ambient Air Temperatures for the United
States (except Hawaii), American National Standard Designation: D 975 – 07, 2007.
16 Worldwide Fuel Charter Committee, World Wide Fuel Charter, Fifth Edition, 2013.