national export strategy ii - minicom
TRANSCRIPT

National Export Strategy II
REPUBLIC OF RWANDA
MINISTRY OF TRADE AND INDUSTRY


NATIONAL EXPORT STRATEGY II 3
TABLE OF CONTENTS
Executive Summary ...................................................................................................................................................... 51.1 Why it is necessary to revise the National Export Strategy ...................................................................... 81.1.1 Strategic Context has Changed ..............................................................................................................................81.1.2 New Export Targets Have Been Set .......................................................................................................................81.1.3 Challenges under NES I ...........................................................................................................................................9
2.1 Approach ........................................................................................................................................................ 102.2 Rwanda’s Recent Trade Performance ........................................................................................................ 102.2.1 Merchandise Exports ............................................................................................................................................. 112.2.2 Services Exports ..................................................................................................................................................... 112.2.3 Trends in Export Growth ....................................................................................................................................... 122.2.3.1 Sector Contributions to Growth ........................................................................................................................... 122.2.3.2 Existing and New Trade Flows .............................................................................................................................. 12
2.3 Sector Review ................................................................................................................................................. 13
2.4 Market Review ................................................................................................................................................ 132.4.1 International Markets ............................................................................................................................................ 132.4.1.1 Potential New Exports to International Markets ................................................................................................. 142.4.2 Regional Markets ................................................................................................................................................... 142.4.3 Countries of Interest to the Private Sector ......................................................................................................... 16
2.5 Firm Review ..................................................................................................................................................... 172.5.1 The Importance of Exporting ................................................................................................................................ 172.5.2 The Importance of Large Firms ............................................................................................................................ 172.5.3 Creating Large Exporters ...................................................................................................................................... 182.5.3.1 Home Grown Large Exporters .............................................................................................................................. 182.5.3.2 Improving Firm Survival ........................................................................................................................................ 192.5.4 Why smaller firms don’t Export ............................................................................................................................ 19
2.6 Cross-Cutting Constraints ........................................................................................................................... 202.6.1 Export Finance ...................................................................................................................................................... 202.6.2 Standards and other technical requirements ..................................................................................................... 212.6.3 Tax on Exports ....................................................................................................................................................... 212.6.4 Transport Costs ..................................................................................................................................................... 21
Four Strategic Pillars for NES II ................................................................................................................................ 231 Strategic Objective 1: Sector Interventions ......................................................................................................... 24
3.3 Strategic Objective 2: Improved Access to Markets ................................................................................ 293.3.1 International Markets ........................................................................................................................................... 293.3.1.1 The United States ................................................................................................................................................. 293.3.1.2 The European Union ..............................................................................................................................................303.3.1.3 Asia ..........................................................................................................................................................................303.3.2 Regional and African Markets ...............................................................................................................................303.3.2.1 East African Community ....................................................................................................................................... 313.3.2.2 DRC ......................................................................................................................................................................... 313.3.2.3 Africa ....................................................................................................................................................................... 31
3.3.3 Cross-Cutting Market Access and Trade Policy Considerations ............................................................. 31
3.3.4 In Market Support (Multi-Service Centres) ............................................................................................... 38
3.4 Strategic Objective 3: Upgrade Firm Capacity to Access and Grow in Export Markets ....................... 323.4.1 Access to Government funded support measures ........................................................................................... 323.4.2 Export Capacity Program ..................................................................................................................................... 33

NATIONAL EXPORT STRATEGY II4
3.4.2.1 New or potential exporters ................................................................................................................................. 333.4.2.2 For existing exporters .......................................................................................................................................... 343.4.2.3 For Large Exporters .............................................................................................................................................. 343.4.2.4 Export Adviser Initiative ....................................................................................................................................... 34
3.4.3 Trade Promotion and Buyer Outreach ....................................................................................................... 353.4.3.1 Group Branding ......................................................................................................................................................353.4.3.2 ‘Buy from Rwanda’ Export Portal .........................................................................................................................353.4.3.3 Buy from Rwanda promotional materials ............................................................................................................353.4.3.4 Trade Fairs program ..............................................................................................................................................363.4.3.5 Market Linkages program .....................................................................................................................................363.4.3.6 President’s Award for Exporting .......................................................................................................................... 36
3.4.4 Trade Information Centre ............................................................................................................................ 36
3.5 Strategic Objective 4: Export Growth Facility ........................................................................................... 37
4.1 Implementation ............................................................................................................................................. 38
4.2 Institutional Roles ......................................................................................................................................... 384.2.1 Industrial Development and Export Council (IDEC) .......................................................................................... 384.2.1.1 Role of the Secretariat in Coordinating and Monitoring NES ........................................................................... 384.2.1.2 Responsibility of Key Implementing Institutions and Agencies ........................................................................ 384.2.2 PSDS Joint Sector Committee to Coordinate Implementation ........................................................................ 39
Annex 1: Implementation Plan ................................................................................................................................... 41

NATIONAL EXPORT STRATEGY II 5
EXECUTIVE SUMMARY
Since the launch of NES I, Rwanda’s strategic context has changed considerably. Toward the end of 2012 the GoR finalised its second Economic Development and Poverty Reduction Strategy (EDPRS II), designed to accelerate the progress already achieved and to shape the country’s development in the future. EDPRS II set out targets to increase exports revenues from US$1.277 billion in 2013 to US$4.515 billion in 2018 or approximately 29% average annual growth over the next 5 years.
This is a significant revision upward from the previous export target of 15% growth p.a. planned under Vision 2020, and captured within NES I. This made it necessary to revise the National Export Strategy to assess the ability of the country to meet these targets.
An analysis of the export sector highlights the following characteristics of Rwanda’s export Sector:First and foremost, exports are constrained by a lack of goods and services produced in Rwanda and made available for export. Investment in growing export capacities and volumes of the goods and services sector is therefore key to unlocking export growth;
Rwanda’s merchandise exports remain concentrated in a few key commodities (traditional exports) sectors – tea, coffee, and minerals. In 2008, Rwanda’s traditional exports amounted to 69% reducing to a still significant 45% in 2014. Traditional exports averaged 10% growth between 2008-2014 driven largely by growth in mineral exports. Over the same period non-traditional exports averaged 22% growth, re-exports 22% growth and informal exports 25%1 per annum.
Finding new markets for products currently exported and diversifying products exported to well established markets are the best avenues for export growth, compared to trying to develop new products for new markets. However developing new markets is an expensive and risky exercise and many firms do not currently have the appetite for such risk;
Regional markets are increasingly important sources of export growth in the non-traditional export segment and are also to easiest to enter for most firms. Barriers to entry and the cost efficiency of Rwandan firms are less of a constraint than for markets outside the region, including the wider African market. Enabling firms to become more strategic in exporting and therefore to reach beyond neighboring countries, requires an upgrade of firm capacity and ability to finance changes in production and marketing to meet the requirements of more sophisticated buyers.
Companies with export turnover above $1 million (Million Dollar Exporters representing 3% of the number of exporting firms in 2014) accounted for 84% of export value in the same year. These firms are best able to compete and survive in export markets. Large exporters can emerge through large-scale investment (domestic or FDI), but a significant number of these businesses have grown over time from small to large exporters. Of Rwanda’s 64 Million Dollar Exporters in 2013, 26 (40%) grew from being small exporters to MDEs over the past five years and Rwanda should support firms with the potential in repeating this success.
Improving firm survival rates can be achieved through a range of cross-cutting interventions that create an aggregate improvement in survival rates. Interventions include reducing the cost and time of trade, simplifying procedures and providing “in-market support” where many firms are exporting. The second way of increasing survival rates is through increasing the number of large exporting firms where survival rates are higher. It is clear that MDEs survive better in new export markets than smaller firms.
It is well documented that access to finance is a cross cutting factor affecting exports. Access to finance to fund investment in export related activities, adjust production practices to meet technical and safety standards in export markets and fund pre and post shipment activities related to exporting are all key to delivering export growth.
PROPOSED SOLUTIONS
After considering trends in export growth, the dynamic relationship between products and markets, and the specific challenges faced by different types of firms, NES II identified and recommends the following 4 strategic objective areas:
Strategic Objective One: Direct Interventions in selected segments of the export sector with high growth potential: To meet export targets a significant amount of investment and coordination is required in a wide range of sectors. Table 8 of this document summarizes the key interventions required in each sector and the potential contribution to exports by 2018. If all existing sector interventions are implemented it is expected Rwanda will achieve US$2.2 billion in 2018.
1 Informal export growth based on compound average growth rate in exports between 2010 and 2013

NATIONAL EXPORT STRATEGY II6
Strategic Objective Two: Improving Access of Rwanda’s Exports of Goods and Services to Markets: Access to markets (international and regional) will be improved through a combination of specific policy initiatives to reduce the costs of accessing identified strategic markets for exports combined with the provision of in-market support in a few selected markets through the establishment of multi-service centre’s;
Strategic Objective Three: Upgrading Firm Capacity to Enter and Grow in Export Markets:RDB is already active in this area; however a more focused approach to supporting exports is necessary with a focus on the following interventions:
1. Export Capacity Programme: The Export Capacity programme aims to grow both the number of successful exporters and the volume of exports per exporter. There are different groups each having slightly different needs.
2. Export Advisor Initiative (EIA): A cadre of qualified and experienced advisers will be developed to deliver support to exporters of all sizes in the areas of business development for export and market entry strategies. The EAI is managed through a subsidised consulting scheme where companies pay a percentage of the costs of an approved project and the balance is paid by the government.
3. Trade Promotion and Buyer Outreach: Proactive promotion of Rwanda and its products and services will a key element in a successful export growth strategy. The Trade Promotion Strategy will contain a number of specific activities to achieve this.
4. Trade Information Centre: Setting up a small trade information centre to provide a one-stop information and signposting service to exporters. The TIC would be managed by a small well-trained team supported by access to a virtual library of relevant publications, reports and databases.
Strategic Objective Four: Establishing an Export Growth Facility: The export finance component of the NES is designed as a single fund, the Export Growth Facility (EGF) with three separate windows for funding: 1) an investment catalyst fund to encourage export focused investments, 2) a matching grant fund for medium sized exporters to meet specific requirements in target markets and 3) an export guarantee facility to underwrite exports.
The overall impact of full NES implementation is estimated to deliver between 15% and 20% export growth per annum up until 2018. This will come through a combination of direct sector interventions supported by market entry support activities covered under strategic objectives two through four.
For the Export Growth Facility there are also the potential spills over benefits if the successful implementation leads to development of a specialised BRD subsidiary, such as an Import and Export Bank that will serve Rwanda, or the
East Africa region, offering appropriate facilities for regional exporters.
FINANCIAL IMPLICATIONS
• Sector interventions under Strategic Objective 1 should be covered through lead institution budgets following development and approval of sector strategies to grow exports;
• The Export Development Programme under strategic intervention three will cost US$ 3.55 million in year one increasing to US$ 3.6 million by year three. RDB will manage this funding;
• The Export Growth Facility will be launched as a limited pilot programme of US$ 1 million growing to US$ 50 million after year four.

NATIONAL EXPORT STRATEGY II 7
IMPLEMENTATION AND HANDLING The recommendations require co-ordination of private sector and public sector organizations. The role of the main implementers are briefly summarised below:
Institution First Steps Toward Implementation
MINICOM • Coordinate implementation of NES II• Lead implementation of market access programme
RDB • Lead implementation of Export Growth Programme• Participate in invitation / creation of Third party quality inspection company to support firms
accessing finance
BNR • Oversee implementation and advise on EGF
BRD • Host EGF and administer funds• Sensitize exporters in chosen recommendations via one-on-one meetings and sectorial work-
shops• Work with commercial banks to deliver EGF through private banking sector
Exporters • Participate in formation of Export Finance Solutions and benefit from Export Growth Programme

NATIONAL EXPORT STRATEGY II8
CHAPTER 1: THE NES AND THE NEED FOR REVISION
1.1 Why it is necessary to revise the National Export StrategyIn its introductory chapter, the National Export Strategy of 2011 (NES I) states that the strategy “should not been seen as a static document, but as the first stage in an on-going process of planning and implementation that will allow Rwanda to be effective in achieving its exports in the years ahead”.
Since implementation of NES I began in 2012, a number of changes have occurred in Rwanda’s national strategic objectives, export targets and in the understanding of the export sector and export growth. These changes have
made it necessary to revise NES I. The main changes are presented below
1.1.1 Strategic Context has ChangedSince the launch of NES I the strategic context has changed considerably. Toward the end of 2012 the GoR finalised its second Economic Development and Poverty Reduction Strategy (EDPRS II), a five year plan “designed to accelerate the progress already achieved and to shape the country’s development in the future” (EDPRS, 2012). Four thematic areas were identified:
• Economic transformation• Rural development• Productivity and youth employment• Accountable governance
Two documents in particular are important for economic transformation: the Private Sector Development Strategy (PSDS) and the Plan for Strategic Transformation of Agriculture (PSTA III). The main driver of the PSDS is the removal of the binding constraints to private sector growth. Under PSTA III, the priority for agricultural sector is to move from subsistence based to value based production. This has opened up space to shift the priorities under the NES from
cross-cutting domestic constraints to growth, to more focused export orientated activities.
1.1.2 New Export Targets Have Been SetEDPRS II set out targets to increase exports revenues from US$1.277 billion in 2013 to US$4.515 billion in 2018 (Table 1) or approximately 28.7% average annual growth over the next 5 years. This is a significant revision upward from the previous export target of 15% growth p.a. planned under Vision 2020, and captured within NES I.
Table 1: EDPRS II Export Targets (Value In Us$ Million And Volume In Kg)
2013 2014 2015 2016 2017 2018 CAGR
Coffee
Value 65 70.4 76.2 85.1 95.1 104.3 10%
Volume 20,045.8 23,165.4 26,363.1 29658.5 33367.7 36880 13%
Tea
Value 67.8 68.6 73.4 81 89.3 94.9 7%
Volume 25562.5 27597.8 31047.5 34497.2 38332.4 41070.5 10%
Mineral
Value 174.2 223 285.4 365.3 467.6 570.5 27%
Volume 9167.3 12373.9 17017 22561.5 29988.8 38073.7 33%
Other1
Value 418.4 519.7 649.6 802.3 978.8 1213.7 24%
Services
Value 551.6 719.4 969.1 1295.1 1770.7 2,532 36%
of which tourism
352.3 440.3 550.4 688 860 1,075 25%
Total value
1277.1 1601.1 2053.8 2628.8 3401.5 4515.5 28.7%
Source: MINECOFIN Export Targets under EDPRS II, 2013.
EDPRS II targets are heavily dependent on growth in exports from the services sector. Services are targeted to average 36% growth to 2018. Services exports averaged 6% growth between 2008 and 2013 and were driven almost
exclusively by tourism.
NATIONAL EXPORT STRATEGY II 9
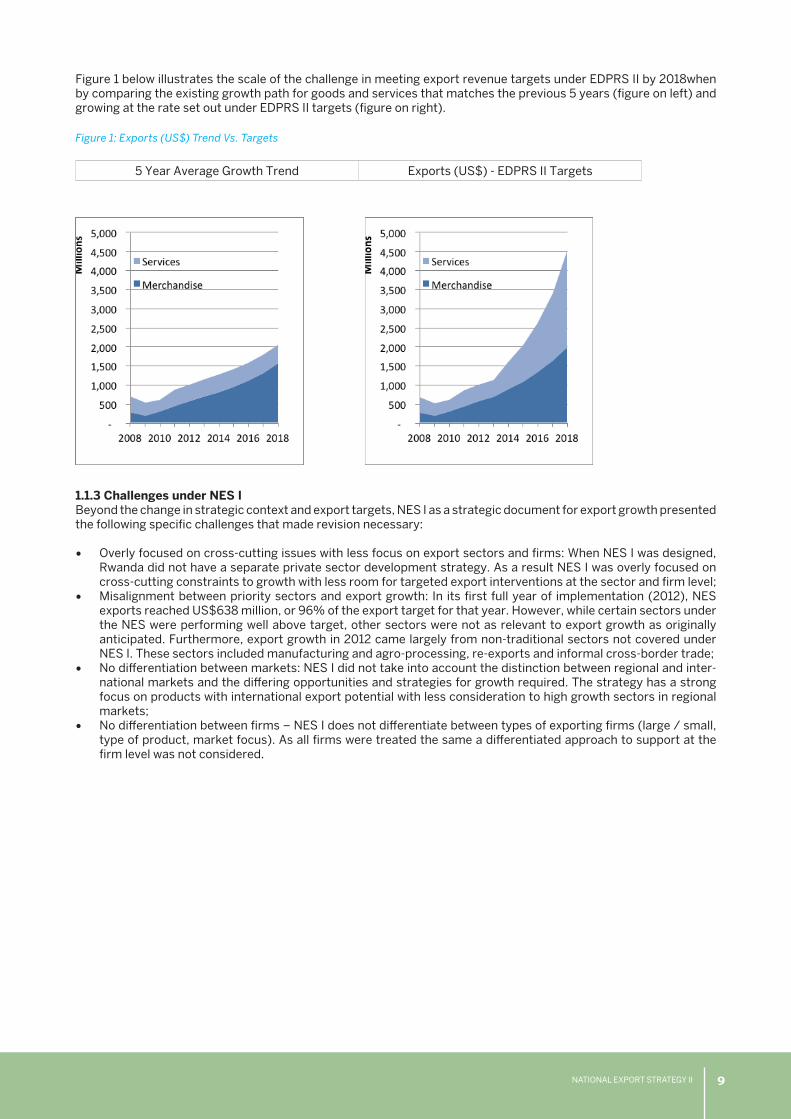
Figure 1 below illustrates the scale of the challenge in meeting export revenue targets under EDPRS II by 2018when by comparing the existing growth path for goods and services that matches the previous 5 years (figure on left) and growing at the rate set out under EDPRS II targets (figure on right).
Figure 1: Exports (US$) Trend Vs. Targets
5 Year Average Growth Trend Exports (US$) - EDPRS II Targets
1.1.3 Challenges under NES IBeyond the change in strategic context and export targets, NES I as a strategic document for export growth presented the following specific challenges that made revision necessary:
• Overly focused on cross-cutting issues with less focus on export sectors and firms: When NES I was designed, Rwanda did not have a separate private sector development strategy. As a result NES I was overly focused on cross-cutting constraints to growth with less room for targeted export interventions at the sector and firm level;
• Misalignment between priority sectors and export growth: In its first full year of implementation (2012), NES exports reached US$638 million, or 96% of the export target for that year. However, while certain sectors under the NES were performing well above target, other sectors were not as relevant to export growth as originally anticipated. Furthermore, export growth in 2012 came largely from non-traditional sectors not covered under NES I. These sectors included manufacturing and agro-processing, re-exports and informal cross-border trade;
• No differentiation between markets: NES I did not take into account the distinction between regional and inter-national markets and the differing opportunities and strategies for growth required. The strategy has a strong focus on products with international export potential with less consideration to high growth sectors in regional markets;
• No differentiation between firms – NES I does not differentiate between types of exporting firms (large / small, type of product, market focus). As all firms were treated the same a differentiated approach to support at the firm level was not considered.

NATIONAL EXPORT STRATEGY II10
CHAPTER 2: APPROACH AND ANALYSIS
2.1. ApproachThe approach under the revised national export strategy (NES II) differs somewhat from NES I, however there remains some overlap. Where possible, NES II has retained what remains relevant within NES I, while developing new or adapting existing interventions in areas where gaps were identified. Four areas were considered when analyzing factors influencing export growth in NES II. These are presented in Table 2 below.
Table 2: Approach to NES II
Approach under NES II
Binding Constraints to Private Sector Growth (Domestic)
With the launch of the PSDS, many of the binding constraints are now covered. NES II focuses only on binding constraints when they are of direct relevance to exporting or where gaps in existing strategic interventions are identified.
Sectors
NES II also prioritizes sectors, adopting some NES I sectors while revising others. In selected sectors under NES II, where growth strategies are already developed, NES II will monitor their implementation. New sectors are also introduced with detailed actions for development of exports.
MarketsNES II focuses on markets both in terms of the characteristics of specific market / product categories and market access.
FirmsNES II considers firms in terms of their size and their ability to survive in selected markets. FDI led export growth remains a priority.
2.2. Rwanda’s Recent Trade Performance
Exports of goods and services over the past decade averaged nominal growth of 20% per annum. Rwanda still runs a trade deficit (the value of imports is larger than the value of exports) with import growth, at 19% per annum, broadly matching export growth. The trade deficit as a percentage of GDP (2011 constant prices) averaged 12% over the past decade (Figure 2) and stood at 17% of GDP in 2014.
Figure 2: Trade as a Percentage of GDP, 2002-2013 (Constant Prices 2011)
Source: NISR GDP Tables (March 2015)
The majority of the deficit comes from an imbalance in merchandise trade, where the deficit in 2014 stood at -16% of GDP compared to minor deficit of -0.006% of GDP for services. The gap to date has been largely financed by aid flows; however a drop in aid flows in 2012 resulted in reduced foreign reserves. This experience brought into focus the need for Rwanda to reduce dependence on foreign aid as a means to financing the trade deficit and prioritise actions to grow export revenue as a means to generating foreign exchange.

NATIONAL EXPORT STRATEGY II 11
2.2.1 Merchandise ExportsMerchandise exports averaged 17% growth between 2008 and 2014. Exports remain concentrated in a few key commodities or traditional export sectors – tea, coffee, and minerals. In 2008, Rwanda’s traditional exports amounted to US$ 186 million or 69% of Rwanda’s merchandise exports. However the level of concentration has reduced over
the past 7 years with traditional export share dropping to 45% in 2014.
Figure 3: Composition of Rwandan Merchandise Exports 2008-2014 (US$ millions)
Source: BNR Export Data 2008-2014
Traditional exports averaged 10% growth between 2008-2014, driven largely by growth in mineral exports. Over the same period non-traditional exports and re-exports both averaged 22% growth with informal exports averaging 25%2 per annum since 2010 when data collection began.
2.2.2 Services ExportsServices exports grew by 10% per annum between 2009 and 2014. The travel sector (including tourism) has steadily increased its share of total services exports in recent years. In 2014, 76% of services receipts were generated in the travel and tourism sector, contributing US$ 303 million in export revenue up from US$ 174 million in 2009. Freight and other transportation services are also important, accounting for 18% of services export revenue in 2014 or US$72 million. Outside of these areas, services exports are low. In 2014, other services exports contributed just US$19.8 million to export revenue.
Figure 4: Services Exports 2009 - 2014 (US$ Millions)
Source: BNR 2014 – Base year set to 2009 because of methodological changes in way services data is captured in 2008-2009. Services data excludes operating costs of embassies.
2 Informal export growth based on compound average growth rate in exports between 2010 and 2013
NATIONAL EXPORT STRATEGY II12
The travel sector averaged 12% growth per annum between 2009 and 2014. Other transportation services average 8% growth while freight averaged just 1% growth. Other private services average -1% per annum.
2.2.3 Trends in Export Growth
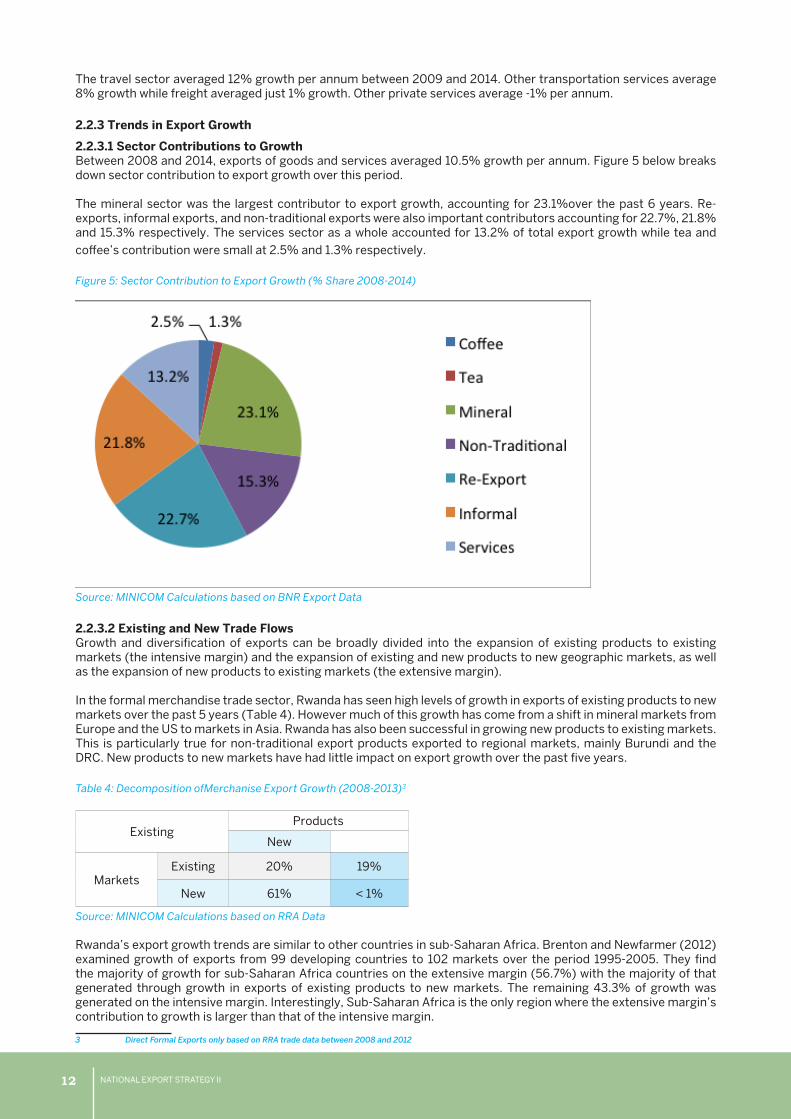
2.2.3.1 Sector Contributions to GrowthBetween 2008 and 2014, exports of goods and services averaged 10.5% growth per annum. Figure 5 below breaks down sector contribution to export growth over this period.
The mineral sector was the largest contributor to export growth, accounting for 23.1%over the past 6 years. Re-exports, informal exports, and non-traditional exports were also important contributors accounting for 22.7%, 21.8% and 15.3% respectively. The services sector as a whole accounted for 13.2% of total export growth while tea and
coffee’s contribution were small at 2.5% and 1.3% respectively.
Figure 5: Sector Contribution to Export Growth (% Share 2008-2014)
Source: MINICOM Calculations based on BNR Export Data
2.2.3.2 Existing and New Trade FlowsGrowth and diversification of exports can be broadly divided into the expansion of existing products to existing markets (the intensive margin) and the expansion of existing and new products to new geographic markets, as well as the expansion of new products to existing markets (the extensive margin).
In the formal merchandise trade sector, Rwanda has seen high levels of growth in exports of existing products to new markets over the past 5 years (Table 4). However much of this growth has come from a shift in mineral markets from Europe and the US to markets in Asia. Rwanda has also been successful in growing new products to existing markets. This is particularly true for non-traditional export products exported to regional markets, mainly Burundi and the DRC. New products to new markets have had little impact on export growth over the past five years.
Table 4: Decomposition ofMerchanise Export Growth (2008-2013)3
ExistingProducts
New
MarketsExisting 20% 19%
New 61% < 1%
Source: MINICOM Calculations based on RRA Data
Rwanda’s export growth trends are similar to other countries in sub-Saharan Africa. Brenton and Newfarmer (2012) examined growth of exports from 99 developing countries to 102 markets over the period 1995-2005. They find the majority of growth for sub-Saharan Africa countries on the extensive margin (56.7%) with the majority of that generated through growth in exports of existing products to new markets. The remaining 43.3% of growth was generated on the intensive margin. Interestingly, Sub-Saharan Africa is the only region where the extensive margin’s contribution to growth is larger than that of the intensive margin.
3 Direct Formal Exports only based on RRA trade data between 2008 and 2012
US$ Millions

NATIONAL EXPORT STRATEGY II 13
2.3. Sector ReviewFirst and foremost, exports are constrained by a lack of goods and services produced in Rwanda and made available for export. Investments in export orientated production and services are therefore key to delivering export growth. This should be combined with targeted interventions to address sector specific constraints to exporting. Annex 2 of this document presents a sector-by-sector breakdown of opportunities and constraints. It’s clear that most sectors already have their own validated growth and export strategies that if fully implemented, could deliver the quantities required to meet export targets. The revised NES does not attempt to replace sector strategies. The NES identifies the key opportunities and constraints for monitoring to ensure activities related to addressing these issues are implemented by the relevant Government institution.
2.4. Market ReviewRwanda exports to a large number of markets across the globe (Figure 6). The DRC is Rwanda’s largest single export destination accounting for 13.3% of formal merchandise exports in 2014 up from 6% in 2008. The DRC is also one of Rwanda’s fastest growing market averaging 34% p.a for the past 7 years. The EAC’s market share was 21% in 2014 with growth averaging 19%. The wider African market has seen its share of exports decline rapidly since 2008, decreasing from 14% to just 1.7% of exports by 2014 and registering an average annual growth rate of -17% p.a. The decline in Africa’s share of exports coincides with Rwanda’s entry into the EAC Customs Union; however causality has not been determined.
The European market remains important, accounting for 39.2% of exports in 2014, up from 38% in 2008, with exports averaging 18% growth p.a. since 2008. Asia accounted for 15.2% of exports in 2014 with growth averaging 14% per annum.
Figure 6: Rwanda Export Markets (2013)
It is important to note that different products have different markets. There is a clear split between traditional exports destined for international markets and non-traditional exports to the Sub-Saharan Africa market (mainly EAC and DRC). Between 2008 and 2014, 76% of Rwanda’s non-traditional exports were destined for markets in Sub-Saharan Africa. Over the same period 76% of traditional exports were exported to markets outside Africa.
2.4.1 International MarketsFor traditional export products (coffee, tea, minerals), Rwanda has duty free access (mainly under MFN) for all major markets of those products. Options for growing traditional exports through improved market access are limited; however improvements in trade facilitation should increase competitiveness allowing exporters to sell more.

NATIONAL EXPORT STRATEGY II14
2.4.1.1 Potential New Exports to International MarketsExport growth from new products to markets outside of Africa are expected to come through agricultural products and light manufacturing (mainly apparel) to the U.S. and European markets. Rwanda already has preferential access for apparel to the U.S. under AGOA and to the EU under the new EPA. However, to date Rwanda has benefited very little from either these arrangements. For example, of the US24.4 million in exports to the US from Rwanda in 2013, just US$ 9,000 was classified as an AGOA import by the US with a further US$ 773,000 imported into the US under GSP provisions (Table 5). In total, just 3% of Rwanda’s exports to the US entered under AGOA (including GSP), all of which were in the arts and crafts sector while some mineral exports entered the US under GSP eligible product lines.
Table 5: Rwandan Exports to US (US$ ,000)
2011 2012 2013
Total Exports 30,858 33,287 24,448
AGOA including GSP Provisions 597 377 782
GSP 580 369 773
AGOA 17 8 9
Source: AGOA Data Centre (http://agoa.info/data.html accessed 12 May 2014)
Rwanda’s experience with AGOA is not unique amongst African LDCs. A systematic review has found that while exports from Sub-Saharan Africa under AGOA to the US have increased substantially since 2000, at best a small share of these increased exports can be directly attributed to AGOA preferences. However, one sector that has clearly benefited from AGOA is the garment industry. A recent review of the textile and apparel sector (TMEA, 2014) in Rwanda found that most garment manufacturers were unaware of AGOA and the requirements for benefiting from AGAO preferences.
Rwanda has also enjoyed duty free quote free (DFQF) access to the European Union under Everything but Arms (EBA) since 2001 and now under the recently signed EPA. EBA was a unilateral commitment by the European Union that grants LDC’s preferential access to the EU. As EBA was a non-reciprocal trade agreement, the EU could theoretically remove access at any time. Furthermore countries can graduate from the scheme once they reach a certain level of development and no longer benefit from DFQF access. These uncertainties increase the attractiveness of the EAC-EU EPA agreement. The EPA agreement also offers simpler rules of origin requirements.
Rules of Origin under the EPAThe rules of origin are particularly important for apparel exports. The EPA offers “single stage transformation” for this sector. This means Rwandan exporters to the EU could benefit from duty free access for garments made using textiles from anywhere in the world (see light manufacturing). In contrast the EBA rules of origin were more restrictive, offering “double stage transformation” – this requires clothing exporters to use fabrics and textiles from the ACP or the EU.
For agricultural products, PSTA III has identified several products with strong international export potential. For al-most all identified priority export products from the agricultural sector, Rwanda already has duty free access to key export markets. Additionally, for many markets the MFN rate is 0% meaning Rwanda does not benefit from pref-erential access over other exporting countries. It is anticipated that agricultural exports will mainly find a market in the EU due to its proximity. Here the largest market access constraints are standards and market linkages.
Since 2002, the EU has obliged food business operators to implement HACCP systems on the basis of legislation (Council Directive 93/43/EEC on the hygiene of foodstuffs). HACCP requires a detailed description in a concise process flow diagram with underlined points where hazards may occur, that can be subject to verification by food safety authorities. HACCP provides the type of disciplined monitoring and control that supermarket chains and food manufacturers increasingly demand. It is also essential for meeting EU food safety requirements. All firms exporting
horticulture products to the EU should therefore be HACCP certified.
2.4.2 Regional MarketsThis section provides an assessment of regional markets with a focus on Rwanda’s non-traditional export sectors. Major non-traditional sectors include: live animals and animal produce, vegetable produce, agro-processed goods, manufactured goods, and hides and skins.

NATIONAL EXPORT STRATEGY II 15
Categorizing Non-Traditional Exports by Sub-SectorThere are some challenges in categorizing non-traditional exports according to different product groups. Under the manufactured heading, much of the exports outside the region appear to be either firms or individuals re-exporting between countries. A good deal of these products are cars and other machinery that are registered as originating from Rwanda. Also captured under manufactured goods are metal alloys, which include waste metal, steel rods, and other metal products, but also in some instance capture minerals. Under the live animal and animal produce section goods such as milk, cheese, meat etc. are captured but could also fit under Agro-Processing.
Regional markets account for the vast majority of non-traditional exports. The DRC alone accounted for 41% exports from Rwanda’s non-traditional sector in 2014 and averaged 29% growth per annum since 2008. The EAC is also an important market accounting for 29% of non-traditional exports in 2014 and growing at a rate of 24% per annum. The rest of Africa’s share remains relatively small at just 3% of exports while the rest of the world accounted for 26% of non-traditional exports in 2014. Figure 7 illustrates value of non-traditional exports by destination between 2008 and 2014.
Figure 7: Non-Traditional Exports by Destination 2008 - 2014 (US$ million)
Source: RRA Export Data 2008-2014
Table 6 below presents a breakdown of market share for different non-traditional export groupings. The figures in red indicate the largest market for each grouping. The figures presented are based on RRA trade data and only include goods that are captured as direct exports. The first row presents the share of non-traditional exports each grouping represents. The Manufactured group account for the largest share (41.8%) of non-traditional exports while Horticulture is the smallest (2.44%).
Table 6: Destination share by Sector in 2014 (%)
Agro-
ProcessedManufac-
turedHides &
SkinsLivestock &
Animal ProduceHorticulture Other
Share of Non-Traditional Exports
25.98% 41.80% 9.87% 5.73% 2.44% 14.19%
Asia 0% 1% 19% 0% 1% 12%
DRC 80% 35% 0% 70% 44% 14%
EAC 8% 41% 66% 2% 53% 9%
Europe 2% 4% 15% 0% 2% 24%
North America 3% 13% 0% 0% 0% 5%
Rest of World 7% 5% 0% 28% 1% 37%
Source: RRA Trade Data, MINICOM Calculations
The main market for agro-processed goods is the DRC, accounting for 80% of all exports from the sector. The EAC market was also important at 8%. Wheat grouts, a residual from wheat processing are exported to the Middle East captured under the rest of world row.

NATIONAL EXPORT STRATEGY II16
The DRC is also an important market for manufactured goods accounting for 35% of exports from the sector. However, in 2014 the EAC was the largest market accounting for 41%.
Hides & Skins are predominately exported to the EAC with Asia and Europe also important markets. The main market for live animals and animal produce is the DRC, accounting for 70% of exports in 2014. Live Bovine exports to other African markets explain the Rest of Worlds 22% share of exports from this sector. Horticultural goods are almost exclusively exported to neighboring countries, with the DRC and EAC accounting for 53% and 43% respectively.
2.4.3 Countries of Interest to the Private SectorThe RDB undertook a survey of firms that have previously participated in trade fairs, to assess what markets they plan to enter in the near future. Table 7 presents the countries identified by the Rwandan private sector listed in no particular order.
Table 7: Markets identified by Rwanda’s private sector as holding good export potential
Country Identified by Rwanda’s Private Sector
DRC ✓
South Sudan ✓
Uganda ✓
Burundi ✓
Tanzania ✓
Kenya ✓
Congo Brazzaville ✓
Somalia ✓
Source: RDB Feedback from Exporter Survey May 2013
Unsurprisingly, regional markets are identified as important by existing exporters. These markets are already the fastest growing, in terms of number of firms exporting. Between 2008 and 2014 the number of firms exporting to the EAC and DRC increased at an average annual rate of 23% per annum, compared to 7% growth in all other markets. Given the rapid growth in the number of exporters to regional markets, it is reasonable to assume that the barriers to entry, and the cost efficiency of Rwandan firms are less of a constraint than for markets outside the region, including the wider African market (Figure 8).
Figure 8: Number of Firms Exporting by Region
Source: MINICOM Calculations based on RRA Data
The relative success Rwandan firms have had in entering the regional market suggests these markets offer an important learning site for exporters. However, the experience of regional exporting does not appear to be translating into a shift from regional to international markets. Possible explanations for this include lower entry costs, less rigorous standards, and lower levels of competition in regional markets meaning firms are not learning to compete in

NATIONAL EXPORT STRATEGY II 17
markets outside the region. Furthermore, regional markets have the second lowest median value per exporting firm, ahead of the wider African market only (Figure 9).
Figure 9: Mediam Annual Value of Exports per FIrm by Region (Thousands RWF)
Source: MINICOM Calculations based on RRA Data
2.5. Firm Review
2.5.1 The Importance of Exporting
As Rwanda is a relatively small market, firms will eventually need to expand into new markets in order to grow. Much of Rwanda’s existing exports already come from firms producing first and foremost for the domestic market but gradually orientating part of their production toward regional and international markets. Growth in exports is therefore partially dependent on firms’ ability to grow within Rwanda.
There are benefits, beyond expanding markets, associated with exporting. Few countries have managed to develop rapidly on the basis of exports of primary products alone. A more diverse structure of exports reduces vulnerability to demand shocks and price swings in overseas markets. A diverse base also creates greater opportunities in regional and global markets.
At the company level, exporting firms in both developed and developing countries tend to be more productive than non-exporters with much of the research suggesting causality running from exporting to efficiency, particularly in the African context. There are a number of possible explanations for this: first, the gains from exporting are large because of wide knowledge and experience gaps between domestic firms and those in international markets. In this context, exporting offers scope for increased discipline of competition, and contact with foreign buyers provides scope for learning. Bigsten & Söderbom (2005) find that the productivity gains for SSA firms from exposure to exporting, in term of value-added are 20-25% in the short run and up to 50% in the long run. Increasing the number of firms exposed to exporting can therefore benefit Rwanda in terms of a more competitive private sector as well as increased export revenue.
2.5.2 The Importance of Large FirmsAnalysis of Rwanda’s trade data indicates that a handful of firms exporting over US$ 1 million (Million-Dollar Exporters or MDEs) have been responsible for delivering the majority of Rwanda’s formal sector direct export growth and diversification over the past 5 years. Between 2008 and 2014, firms formally exporting over US$ 1 million have accounted for between 80% and 90%4 of Rwanda’s total exports. They come from both traditional and non-traditional export sectors (Figure 10). However, these million dollar exporters have been increasing at a much lower rate than the total number of firms exporting. Between 2008 and 2014 the total number of firms exporting increased by 293% while the number of million-dollar exporters increased by 50%.
4 This figure only covers formal direct merchandise exports and does not include firms re-exporting or firms from the services sector, for which no data is avail-able;

NATIONAL EXPORT STRATEGY II18
Figure 10: Decomposition of Million Dollar Exporters (Direct formal Merchandise exports only)
Number of Million $ Exporters MDE Share of Sector
Exports (2014)
MDE Export Value Growth
2008-2014
Sector Export Value
Growth 2008-2015
2008 2011 2014
Coffee 10 8 12 86% 1% 1%
Tea 4 9 12 98% 9% 9%
Mineral 17 14 18 99% 13% 13%
Livestock, Hides & Skins
2 3 4 49% 12% 22%
Agro-Process & Manufacture
6 12 14 63% 39% 29%
Other2 3 8 4 43% 19% 22%
Total 42 54 64 84% 13% 13%
Total Number of Exporting Firms
515 972 2025
Source: MINICOM Calculations based on RRA Data
The mineral sector has the largest number of million dollar exporters (18 in 2014). While million dollar exporters from the tea and coffee sectors accounted for over a quarter of formal direct exports over the past three years, they have contributed little to export growth despite the privatization of the tea sector and focused support on coffee washing stations. Commodity exporters are also subject to price variations, so while not ignoring these important sectors, significant focus needs to be on increasing large exporters outside these sectors. A sector that has performed particularly well is the Agro-Processing and Manufacturing sector, where million dollar exporters have accounted for 63% of the sectors exports, and averaged 38% growth p.a. since 2008 compared to 29% for the sector as whole.
MDEs drove the majority of Rwanda’s export growth since 2008 accounting for 88% of total export growth between 2008 and 2013 (Figure 10). Breaking down growth by sector, the largest MDE contributors to export growth are in the mineral sector and agro-processing and manufacturing sector (A&M).
Figure 11: Contribution of Million Dollar Exporters to Export Growth
Source: MINICOM Calculations based on RRA Data
What is clear from the above analysis is that if Rwanda is to hit export targets set under EDPRS II, a rapid increase in the number of million dollar exporters, combined with sustained export growth from existing million dollar exporters is required. This is because the evidence suggests that “large exporters” not “many exporters” drive export growth.
2.5.3 Creating Large Exporters
2.5.3.1 Home Grown Large ExportersLarger exporters can emerge through large-scale investment (domestic or FDI) or businesses can grow over time. Of Rwanda’s 65 Million Dollar Exporters in 2013, 26 (40%) graduated from exporting under US$ 1 million per annum into
NATIONAL EXPORT STRATEGY II 19
Million Dollar Exporters since 2008.Of the 26 firms that graduated into the MDEs since 2008, 8 come from traditional export sectors. Given that traditional export sectors are purely export focused and are already well established, most exporters from these sectors would be expected to be large. The agro-processing and manufacturing sector produced the most number of MDE graduates with 8 firms. All of these firms were first successful in the domestic market before pursuing growth through exporting to the region; this is discussed in more detail later in the section covering the manufacturing sector.
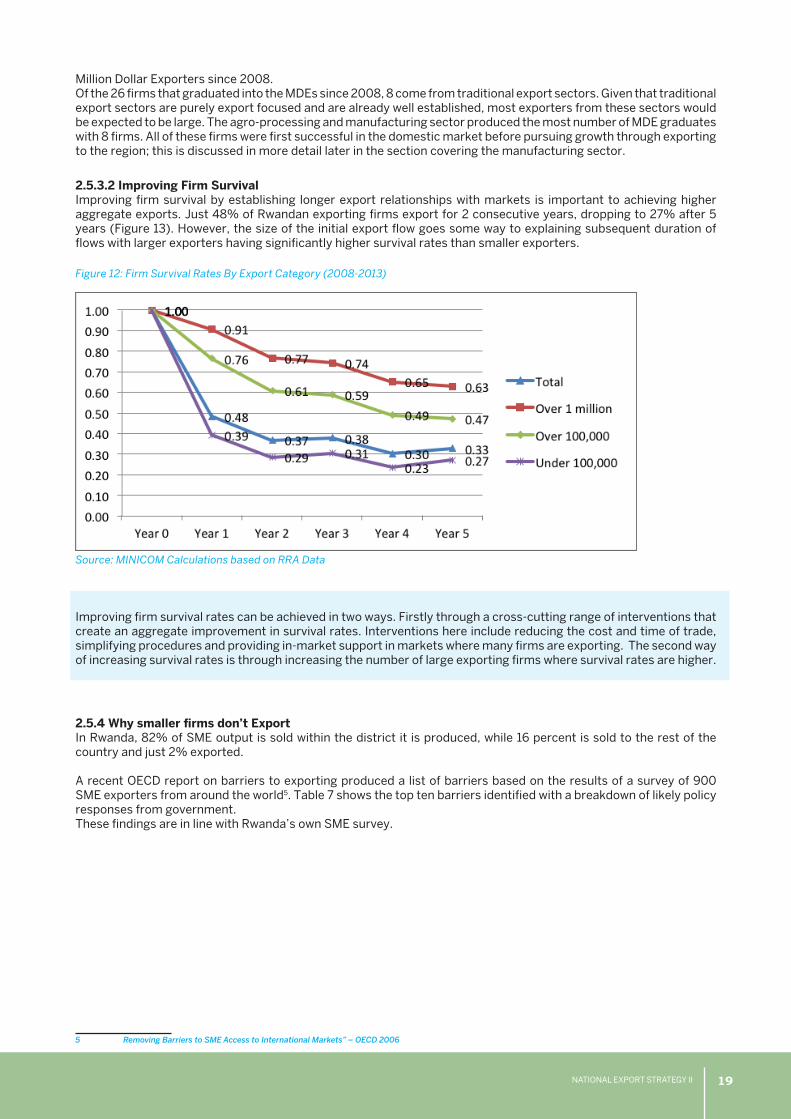
2.5.3.2 Improving Firm SurvivalImproving firm survival by establishing longer export relationships with markets is important to achieving higher aggregate exports. Just 48% of Rwandan exporting firms export for 2 consecutive years, dropping to 27% after 5 years (Figure 13). However, the size of the initial export flow goes some way to explaining subsequent duration of flows with larger exporters having significantly higher survival rates than smaller exporters.
Figure 12: Firm Survival Rates By Export Category (2008-2013)
Source: MINICOM Calculations based on RRA Data
Improving firm survival rates can be achieved in two ways. Firstly through a cross-cutting range of interventions that create an aggregate improvement in survival rates. Interventions here include reducing the cost and time of trade, simplifying procedures and providing in-market support in markets where many firms are exporting. The second way of increasing survival rates is through increasing the number of large exporting firms where survival rates are higher.
2.5.4 Why smaller firms don’t ExportIn Rwanda, 82% of SME output is sold within the district it is produced, while 16 percent is sold to the rest of the country and just 2% exported.
A recent OECD report on barriers to exporting produced a list of barriers based on the results of a survey of 900 SME exporters from around the world5. Table 7 shows the top ten barriers identified with a breakdown of likely policy responses from government. These findings are in line with Rwanda’s own SME survey.
5 Removing Barriers to SME Access to International Markets” – OECD 2006

NATIONAL EXPORT STRATEGY II20
Table 7: Top Challenges Facing SME Exporters
Barrier Potential Government TPO response
Access to Finance
àShortage of working capital to finance exports
àExport Loan (guarantee) Schemes, Cost sharing grant schemes, equipment leasing support, invoice discounting
àCost of transport & infrastructureàStreamlining transport systems, removal of NTB’s,
infrastructure development and upgrade programmes
Market Intelligence
àLimited information to locate and analyse markets and identify opportunities
àMarket Intelligence Services, subsidised market studies and visits
àIdentifying foreign business opportunitiesàMarket Intelligence Services, Due diligence, Consulting
services, Strategic planning, in market TPO’s
Export Promotion
àInability to contact potential overseas customers
àConsulting support, in-market TPO’s, Trade Fairs and missions, promotional materials
àLack of understanding of international standards and high cost of product certification and meeting standards
àSubsidized access to product testing and certification services for qualified exporters
àTechnical training provision for selected sectors
Management
àDeveloping new products for foreign markets
àConsulting support, Cost Sharing Grants, Venture Capital, equipment leasing schemes
àLack of managerial time to deal with export/internationalization
àTA support, graduate trainee programmes, in-market advisory services
Skills & Knowledge
àUnfamiliar exporting procedures/paper work meeting export product quality/ standards /specifications
àTraining programmes, Market Intelligence services, consulting support, Cost Sharing Grants
àInadequate quantity of and/or untrained personnel for export /internationalization
àTraining & coaching programmes for Exporters
àUnfamiliar foreign business practices àTraining and consulting support – local and in-market
Source: OECD, 2013
2.6 Cross-Cutting Constraints
2.6.1 Export FinanceA cross cutting factor affecting exports is availability of finance. This is finance to fund investment in export related activities, adjust production practices to meet technical standards in export markets and fund pre and post shipment activities related to exporting are all key to delivering export growth.
Export finance is defined as inclusive of key exporting activities, but excludes other types of finance such as agricultural finance or SME funding - important as these may be to an exporting economy. Export finance is provided in two phases, which are closely linked: pre-shipment finance and post-shipment finance.
• Pre-shipment finance encompasses all value-adding activities required to prepare and deliver product to market. In agricultural exports, for example, this process begins after the crop has been harvested, and includes activi-ties such as grading, packing and storage. The process may include value-addition such as the washing process of coffee beans; and aggregating volumes of produce from small farmers;
• Post-shipment finance is created by the credit terms agreed between buyer and seller. These range from pay-ment of merchandise shortly after loading on board, to deferred payments, up to six months after shipment (but rarely for more than six months depending on industry and product).
A qualitative assessment of the gap points to the following issues related to export finance. Commercial banks state that there is no significant gap in export finance. The gap that exists is downplayed by the banks, and not considered

NATIONAL EXPORT STRATEGY II 21
as highly significant because projects which are not considered bankable are not considered as part of a gap. In this context, “bankable” means well-collateralized. All “bankable” transactions are indeed financed by the commercial banks.
However, almost unanimously, private companies believe that there is a gap, which must be bridged to enable the sector to grow. Reported constraints include: high interest rates (averaging 18% for Rwanda francs and 8% for dollar loans) making it difficult to profit from exports, banks do not advise properly about available finance options that apply to each transaction and each industry, banks require too much security, and banks are slow to approve export finance requests which is transactional business based on quick turn-around times.
Perceptions differ because the banks and firms focus on different aspects of export finance gap. In this manner the gap in export finance continues because well-collateralized projects are the only type of export finance worth considering for banks.
2.6.2 Standards and other technical requirementsStandards are necessary for many reasons, including environmental protection, safety, national security and consumer information and protection. Although standards and technical regulations vary by country, they are crucial for countries interested in promoting competitiveness, exports and economic growth. If not harmonized within a regional bloc, such as the EAC, standards can become Non-Tariff Barriers (NTB).
Approximately 1200 voluntary standards have already been harmonized for uniform application within the EAC. However there is currently no formal structure for the application of SPS measures at the regional level. As a result the recognition of certification marks among regionally traded goods within the EAC has so far proven difficult to implement. Several existing exporters to regional markets have reported that the RSB Standard Mark is not recognized in other EAC partner states. Some EAC member states are now enforcing prohibitively strict standards with different compliance requirements spread across several agencies. This is effectively blocking exports of certain goods from Rwanda to the target market.
Beyond the EAC, many exporters are unaware of the standards and technical requirements for accessing international markets. There have been a number of instances where firms exporting from Rwanda have come up against challenges at customs in the importing country. In some cases these issues have been resolved - for example, in the case of apparel exports to the US were the exporter did not have an AGOA visa - but in others the failure to comply with regulations results in the destruction of the consignment - as happened with honey that was exported to Europe without the appropriate certification.
2.6.3 Tax on ExportsIn line with international best practice on VAT regimes, Rwanda’s VAT legislation provides for zero-rating of exports to allow businesses to export goods and services on an equal and competitive footing with similar businesses around the world without the encumbrance of irrecoverable VAT changes for customers. This is also the reason why most VAT regimes -Rwanda inclusive - have procedures for accounting for VAT on imported goods and services. Revenue authorities can thus ensure that no one business gains advantage over another because of its location.
However, there are some anomalies with how Rwanda’s existing tax legislation is applied in the case of services exports. Article 5(1)(e) of the VAT law (n0 37/2012) provides that for services to be considered as exported from Rwanda and therefore not subject to VAT, the services should be “rendered abroad”. The RRA interprets this to mean that the service should be physically performed abroad for zero rating to apply. VAT on services rendered within Rwanda (even where the client is foreign based) is applied according to the origin principle6. This means that VAT is levied on value created within Rwanda whereas VAT is generally applied as a tax on consumption, i.e. the VAT should accrue to the jurisdiction where the final consumption takes place and not where the value is created – the destination principle.
There is also the issue of delays in refunding of VAT paid on goods that are exported. Firms can reclaim the VAT that is paid on goods received from suppliers once the good is exported at the VAT free price. The exporting firm carries the cost of financing associated with the 18% VAT until RRA refunds the VAT. Given the high interest rates in Rwanda, the costs associated with financing the payment gap can be considerable. Firms have reported that it takes an average of 172 days to receive the VAT refund. Assuming the cost of finance at 18% per annum then over a period of 172 days the firm will pay 8.13% interest on VAT leading to a direct additional cost of approximately 1.46% on total sales.
2.6.4 Transport CostsOne of the main barriers to accessing markets is the cost of trade itself. Export competitiveness is directly linked to the costs of international transport services. Transportation costs are often a more important inhibitor to participation in the world economy than are policy barriers to entry into export markets. The World Bank (2002a p 356) finds that (a) a doubling of shipping costs is associated with slower growth of more than half a percentage point and (b) potential access to foreign markets, of which transport costs are a determinant, explains up to 70% of variations in country GDP. A reduction in transport costs can lead to a significant increase in trade orientation with Limao and Venables
6 The Origin Principal levies VAT on value created within a countries own border

NATIONAL EXPORT STRATEGY II22
(2001) finding relatively high elasticity’s of trade volumes in response to reductions in transport costs.
The EAC has been largely ineffective in reducing the cost of trade over the past decade. Rwanda, Burundi and Kenya have all seen costs gradually creep up over the past six years (World Bank DB Reports, 2009-2013). Addressing the cost of trade requires a regional response and cannot be achieved by any one state alone. Factors influencing the cost of trade go beyond the cost of ports and trade corridors and include the efficiency and competition within the regional freight transport sector, in-country distribution infrastructure and logistics services. A wide set of trade policy reforms also affect the performance and competitiveness transport sector.
Efficient distribution and logistics services demand significant investment in terminals, handling equipment and yard management systems as well as the right set of policies and regulations. To be financially viable, without overcharging, requires a minimum activity threshold in terms of tonnage or number of containers. Ideally the transport service provider should offer scheduled services that guarantee delivery despite limited traffic and geographical remoteness. The services should also be affordable enough to allow smaller firms to plug into international trade channels. This requires a competitively priced freight transport sector that can both serve the needs of the market while also being commercially viable.
Development of logistics and distribution services that meet the needs of Rwanda, where transport costs are amongst the highest in the region, is therefore essential to unlocking export potential. This involves developing logistics platforms, off-dock container terminals at the ports, bonded warehouses and in-country agro-logistics centres to help consolidate production and benefit from economies of scale when distributing them. Furthermore, enhancing the competitiveness of Rwanda’s trucking sector will also help bring down costs.

NATIONAL EXPORT STRATEGY II 23
CHAPTER 3: STRATEGIC INTERVENTIONS
3.1. Four Strategic Pillars for NES IIThe strategy has been developed based on the analysis of export growth trends for Rwanda. The rationale for the strategic interventions, already highlighted in the analysis, are summarized below:
• Strategic Objective One: Export growth first depends on the ability of firms to produce goods of sufficient quality and quantity to supply potential export markets. This requires an environment that supports and encour-ages firms to rapidly invest and begin production or increase output through productivity gains. Here putting in place infrastructure for export oriented investment, and sector specific interventions to increase output from established export sectors is key to driving growth. In some circumstances this is already planned and will be monitored, in other cases the NES II introduces new activities. This is covered on a sector by sector bases under Strategic Intervention One;
If supply side constraints are overcome and there are goods available for export then the following export specific strategic interventions are necessary:
• Strategic Objective Two: Export growth depends on the infrastructure, policies, regulations, and agreements – and their implementation - that facilitate entry into new markets and entry of export orientated investment into Rwanda. If distribution and logistics infrastructure are not in place, or if they are too costly the firm cannot enter potential markets. Beyond infrastructure, if regulations are costly to comply with and Rwandan goods face high taxes and duties they will once again be uncompetitive in destination markets. Here a combination of the right set of infrastructure linked with a conducive regulatory environment is key to encouraging firms to export;
• Strategic Objective 3: Export growth also depends on the capacity of firms to establish themselves in markets and establish strong and lasting relationships with those markets. Often firms lack information on market op-portunities and an understanding of the requirements to maintain exports over a sustained period of time. Here, firm level support services to develop exporters’ capacity to enter markets are necessary. Linked to this are the trade agreements in place that encourage trade between Rwanda and export markets;
• Strategic Objective 4: Given the importance of finance, this has been kept as a stand alone strategic objective. The gap in export finance needs to be addressed in order to allow firms to export. This requires interventions by both the banking sector and Government to address challenges at the pre and post shipment level.
The four strategic interventions are presented in the image below. It should be noted however, that the NES fits into a broader range of private sector development activities and its success, to a large extent is dependent on delivery of commitments for private sector development made under the EDPRS II programme and sector specific interventions.
As already mentioned in chapter 1, the EDPRS II export target set for Rwanda over the next 5 years is 28% average

NATIONAL EXPORT STRATEGY II24
annual export growth or approximately US$ 4.5 billion of goods and services exports by 2018. Based on a detailed audit of exporting sectors and the planned interventions by sector, total exports are expected to reach approximately US$2.3 billion by 2018.
Figure 13: Projected Export Growth Path
Export Growth Projections to 2018 as determined by lead implementing agencies based on planned interventions:
• 16% average annual growth or US$ per annum between 2013 and 2018• Goods 19% PA
• Services 16% PA
3.2 Strategic Objective 1: Sector InterventionsIncreasing output for export covers a range of sector specific interventions to either increase the number of firms operating in a sector or improve the productivity existing producers. The GoR has already developed growth strategies for a wide number of goods and services sectors. Given the scale of export growth required under EDPRS II, NES II has attempted to document how each sector could conceivably contribute to reaching export targets up to 2018 based on their existing strategies. A review of each sector strategy was undertaken for the purposes of this strategy. We find that is all planned interventions were fully funded and well executed, and all binding constraints ideally removed exports will reach 2.26 billion by 2018. Meeting this target would still require a massive effort across multiple sectors. Rwanda hitting EDPRS II export targets is only conceivable under the most optimistic scenarios.
Table 8 presents export projections based on planned interventions by the implementing agencies, breaking down each sectors contribution to export growth over the next 4 years. The table also identifies the key constraint to export growth and the major activity necessary

NATIONAL EXPORT STRATEGY II 25
Se
ctor
Le
ad
V
alu
e o
f Exp
orts
(US
$)
20
14
Se
ctor p
roje
ction
s to 2
018
ba
sed
on
pla
nn
ed
inte
rven
tion
s by im
ple
me
ntin
g a
ge
ncie
sE
DP
RS
II Exp
ort
Ta
rge
t 20
18 (U
S$
)
Ke
y C
on
strain
tsK
ey in
terve
ntio
ns to
De
liver
Ta
rge
ts2
015
20
162
017
20
18
To
tal E
xpo
rts
1,110,4
63
,142
1,33
8,5
26
,791
1,55
9,5
57,13
11,8
99
,22
3,70
62
,26
3,3
69
,00
74
,514
,978
,24
2
1. Trad
ition
al
32
2,79
8,0
52
40
0,70
0,0
00
45
9,3
00
,00
05
26
,40
0,0
00
59
9,2
00
,00
076
9,2
00
,00
0
1.1 T
eaN
AE
B5
1,758
,34
173
,40
0,0
00
81,0
00
,00
08
9,3
00
,00
09
4,9
00
,00
09
4,9
00
,00
0
•S
up
ply fo
r exp
ort;
•A
ccess to
fin
ance fo
r tea p
rod
ucers
to in
crease p
rod
uctio
n.
•C
on
structio
n o
f 4 ad
ditio
nal
tea factories b
y 20
18 (14
cu
rrently o
peratio
nal);
•E
xpan
sion
pro
gram
by
6,0
00
ha( 2
5,5
00
ha cu
rrently
plan
ted);
•T
rain 4
,700
tea gro
wers u
sing
F
FS
for p
rod
uctivity g
ains;
•C
apacity B
uild
ing
of tea
plu
ckers and
tea makers fo
r q
uality g
ains
•E
xpo
rt Gro
wth
Facility to
in
crease access of fi
nan
ce for
investm
ent in
pro
du
ction
1.2 C
off
eeN
AE
B5
9,6
77,99
876
,20
0,0
00
85
,100
,00
09
5,0
00
,00
010
4,3
00
,00
010
4,3
00
,00
0
•S
up
ply fo
r exp
ort;
•A
ccess to
fin
ance fo
r p
rod
uctio
n
and
exp
ortin
g.
•Im
plem
ent C
off
ee Zo
nin
g
Po
licy to in
crease utilizatio
n
of C
WS
;•
Imp
rove co
ffee h
usb
and
-ry p
ractices thro
ug
h F
FS
train
ing
;•
Exp
and
fertilizer app
lication
fro
m 2
0%
to 8
0%
;•
Imp
lemen
t turn
arou
nd
pro
-g
ram in
coff
ee coo
peratives;
•U
pg
rade co
ffee p
rocessin
g;
•E
xpo
rt Gro
wth
Facility to
exp
and
investm
ent in
pro
-d
uctio
n an
d p
rod
uctivity an
d
enab
ling
direct exp
ortin
g
Table 8
: Exp
ort Targets an
d K
ey Activities To R
ealise Secto
r Exp
ort P
otential

NATIONAL EXPORT STRATEGY II26
1.3
Min
eral
MIN
I-R
EN
A2
11,3
61,
713
25
1,10
0,0
00
29
3,2
00
,00
03
42
,10
0,0
00
40
0,0
00
,00
05
70,0
00
,00
0
•R
egu
lato
ry
and
man
-ag
emen
t w
eakn
esse
s•
Lo
w e
x-tr
acti
on
ra
tes
amo
ng
ar
tisa
nal
m
iner
s w
ith
n
o o
pti
on
s fo
r fi
nan
cin
g
tech
no
log
y u
pg
rad
e;•
Acc
ess
to
fin
ance
fo
r ex
po
rtin
g
•M
igra
tio
n o
f lic
ense
s fr
om
ex
plo
rati
on
to
min
ing
.•
Fo
rmer
Go
vern
men
t co
nce
s-si
on
to
be
licen
sed
an
d p
rop
er
mo
nit
ori
ng
of
the
agre
emen
t si
gn
ed b
etw
een
Go
R a
nd
p
riva
te c
om
pan
ies;
•G
atu
mb
a co
nce
ssio
n:
ten
der
is o
ng
oin
g•
Bis
eser
o: A
gre
emen
t is
b
ein
g n
ego
tiat
ed•
NR
D w
ith
five
co
nce
ssio
ns
: P
end
ing
fo
r b
ein
g li
cen
sed
/te
nd
ered
•
Mu
sha
and
Ntu
ng
a: T
he
pla
nt
is u
nd
er c
on
stru
ctio
n
to c
om
ple
ted
in A
ug
ust
,•
Ru
ton
go
Min
es a
nd
N
yaka
bin
go
: lo
ng
te
rm a
gre
emen
t,•
Rw
inkw
avu
an
d G
ifu
rwe
Co
nce
ssio
ns:
ag
reem
ent
has
bee
n s
ign
ed;
•B
ibar
e co
nce
ssio
n: T
he
pro
cess
ing
pla
nt
is u
nd
er
con
stru
ctio
n,
•N
ew s
erio
us
op
erat
or
to
com
e in
: eg
. Maw
arid
Min
-in
g/
Nya
nza
pro
ject
;•
Imp
rove
d le
gal
an
d r
egu
lato
ry
fram
ewo
rk:
•L
on
g a
nd
med
ium
ter
m
licen
ses
issu
ed t
o a
ttra
ct
stra
teg
ic in
vest
ors
,•
Pro
fess
ion
al c
on
sult
ancy
b
oar
d e
stab
lish
ed t
o h
elp
co
mp
anie
s u
nd
erta
ke
geo
log
ical
stu
die
s an
d
oth
er s
tud
ies
like
bu
sin
ess
pla
ns,
…•
Imp
rove
d m
anag
emen
t sy
s-te
m o
f th
e se
cto
r: C
adas
tre
syst
em•
Org
aniz
ed m
inin
g s
ecto
r:
stre
ng
then
ing
th
e ca
pac
ity
of
Rw
and
a M
inin
g A
sso
ciat
ion
an
d m
inin
g c
oo
per
ativ
e fe
der
-at
ion
to
imp
rove
neg
oti
ates
in
par
tner
ship
ag
reem
ents
wit
h
fun
din
g in
vest
ors
or
fin
anci
al
inst
itu
tio
ns;
•E
xpo
rt G
row
th F
acili
ty t
o
incr
ease
effi
cien
cy a
nd
ex-
trac
tio
n r
ates
of
arti
san
al m
in-
ers
by
enab
ling
inve
stm
ent
in
tech
no
log
y an
d fi
nan
cin
g f
or
exp
ort
ing
rel
ated
act
ivit
ies.
•D
iver
sifi
cati
on
of
min
eral
s
Se
cto
rL
ea
d
Va
lue
of
Exp
ort
s (U
S$
)2
014
Se
cto
r p
roje
ctio
ns
to 2
018
ba
sed
on
pla
nn
ed
inte
rve
nti
on
s b
y im
ple
me
nti
ng
ag
en
cie
sE
DP
RS
II
Exp
ort
T
arg
et
20
18 (
US
$)
Ke
y C
on
stra
ints
Ke
y in
terv
en
tio
ns
to D
eli
ver
Ta
rge
ts2
015
20
162
017
20
18
To
tal E
xpo
rts
1,
110
,46
3,1
42
1,3
38
,52
6,7
91
1,5
59
,55
7,13
11,
89
9,2
23
,70
62
,26
3,3
69
,00
74
,514
,978
,24
2
1. T
rad
itio
nal
32
2,7
98
,05
24
00
,70
0,0
00
45
9,3
00
,00
05
26
,40
0,0
00
59
9,2
00
,00
076
9,2
00
,00
0

NATIONAL EXPORT STRATEGY II 27
2. N
on
Tra
di-
tion
al
111,2
16,7
22
152
,43
1,73
02
04
,04
3,7
163
39
,89
8,4
89
45
8,0
43
,94
91,2
13,7
29
,27
5
2.1 A
gro
-Pro
-c
es
sin
gR
DB
32
,619
,75
34
2,2
51,9
01
54
,72
8,2
84
105
,88
8,7
65
126
,82
1,20
5
Ac
ce
ss
to ra
w
ma
teria
ls;
Ac
ce
ss
to
fin
an
ce
for
pro
du
ctio
n;
Hig
h ris
k to
e
xp
ortin
g a
nd
n
ew
sta
nd
ard
s
req
uire
me
nts
in
targ
et m
ark
ets
•Ma
p u
nd
eru
tilize
d p
ub
lic la
nd
, e
arm
ark
an
d g
az
ette
lan
d fo
r c
om
me
rcia
l farm
ing
; •S
up
po
rt Priv
ate
Se
cto
r to
ac
qu
ire o
r lea
se
ag
ricu
ltura
l lan
d
in o
the
r co
un
tries
for e
xp
ort to
R
wa
nd
a;
•Co
-op
era
tize
farm
ing
thro
ug
h
lan
d le
as
e: th
is in
cre
as
es
the
p
rod
uc
tivity
of th
e fa
rme
r an
d
se
cu
res
raw
ma
teria
l for th
e
fac
tory
.•E
xp
ort G
ua
ran
tee
fac
ility
pro
mo
te in
ve
stm
en
t in
pro
du
ctio
n, d
e-ris
k e
xp
ort a
nd
m
atc
hin
g g
ran
t fun
d s
tan
da
rd
req
uire
me
nts
in n
ew
ma
rke
ts.
2.2
Ma
nu
fac
-tu
ring
RD
B2
5,6
72
,59
93
5,2
53
,35
15
7,0
72
,59
19
0,7
91,3
1212
2,2
65
,69
1
Ina
de
qu
ate
in
fras
truc
ture
to
attra
ct in
ve
s-
tors
;
Ac
ce
ss
to
fin
an
ce
for
pro
du
ctio
n a
nd
e
xp
ortin
g;
•Co
ns
truc
t 60
,00
0 m
2 fa
cto
ry
sp
ac
es
with
ex
po
rt pro
ce
ss
ing
z
on
e s
tatu
s in
the
Kig
ali S
EZ
. T
he
se
wo
uld
pro
vid
e fl
ex
ible
s
pa
ce
for in
ve
sto
rs to
en
ter
Rw
an
da
an
d im
me
dia
tely
be
gin
p
rod
uc
tion
. Ta
rge
t se
cto
rs
inc
lud
e a
pp
are
l an
d e
lec
tron
ic
as
se
mb
ly;
•Su
pp
orte
d b
y in
du
stria
l en
erg
y
tariff
s a
nd
de
dic
ate
d p
ow
er lin
es
to
ind
us
trial z
on
es
;• E
xp
ort G
row
th F
ac
ility fo
r in
ve
stm
en
t in n
ew
pro
du
ctio
n
an
d e
xp
ortin
g;
2.3
Ag
ricu
lture
NA
EB
4,9
92
,125
18,8
45
,75
22
6,6
28
,39
16
6,4
49
,50
5119
,137
,43
2
Av
aila
bility
of
La
nd
;
Ac
ce
ss
to
fin
an
ce
for
pro
du
ctio
n;
•Hig
h ris
k to
e
xp
ortin
g a
nd
n
ew
sta
nd
ard
s
req
uire
me
nts
in
targ
et m
ark
ets
.
• Fa
cilita
te a
cc
es
s to
lan
d (2
00
0
ha
for n
uc
leu
s a
nd
60
00
ha
for
ou
t gro
we
rs);
• Inv
es
t in c
old
ch
ain
in
fras
truc
ture
an
d n
eg
otia
te a
ir ra
tes
;• Im
pro
ve
qu
ality
pla
ntin
g
ma
teria
ls;
• Ex
po
rt Gro
wth
Fa
cility
for
inv
es
tme
nt in
pro
du
ctio
n
ex
pa
ns
ion
, me
etin
g s
tan
da
rds
a
nd
ex
po
rt fin
an
ce
Fre
sh
Fru
it &
Ve
ge
tab
les
NA
EB
3,2
97
,39
410
,87
2,7
65
13,5
77
,813
14,7
40
,35
716
,00
8,8
02
La
nd
for e
xte
n-
siv
e fa
rmin
g;
Fin
an
ce
for
Ex
po
rts.
•PP
P in
ve
stm
en
t in fru
its a
nd
v
eg
eta
ble
s: 5
irriga
ted
site
s
av
aila
ble
, inv
es
tors
sta
rted
s
ho
win
g in
tere
sts
;•C
on
du
ct fe
as
ibility
stu
die
s to
a
ss
es
s re
qu
irem
en
ts in
zo
ne
s
targ
ete
d fo
r ea
ch
of ta
rge
ted
h
ortic
ultu
re c
rop
s;
•Ex
po
rt gu
ara
nte
e fa
cility
to d
e-
risk
ex
po
rting
, ca
taly
se
fun
d to
e
xp
an
d p
rod
uc
tion
.
Flo
we
rsN
AE
B-
27
8,9
64
2,4
54
,32
215
,37
5,0
00
47
,175
,00
0
De
lay
ed
de
ve
l-o
pm
en
t of G
is-
ha
ri & s
urro
un
d-
ing
ou
t gro
we
r s
ch
em
es
;
Fin
an
ce
for
Ex
po
rting
.
•Fin
aliz
e th
e d
ev
elo
pm
en
t of
infra
stru
ctu
re (ro
ad
, wa
ter,
ele
ctric
ity, g
ree
nh
ou
se
s);
•PP
P in
ve
stm
en
t in fl
oric
ultu
re:
a 2
0 h
a la
nd
av
aila
ble
in G
ish
ari,
10 h
a to
be
co
mp
lete
d b
y 2
015
a
nd
65
ha
by
20
17;
•Ex
po
rt Gu
ara
nte
e F
ac
ility to
d
e-ris
k e
xp
ortin
g;
Ste
via
NA
EB
-1,5
84
,00
012
,75
0,0
00
16,2
00
,00
02
5,9
20
,00
0A
va
ilab
ility o
f la
nd
.
•Co
ns
olid
ate
lan
d –
1,00
0 h
a.
Inv
es
t in R
&D
;• S
ee
d m
ultip
lica
tion
an
d
ex
ten
sio
n s
erv
ice
s;

NATIONAL EXPORT STRATEGY II28
Es
se
nti
al
Oil
in
clu
din
g
Py
reth
rum
NA
EB
1,6
94
,73
16
,110
,02
310
,59
6,2
56
20
,13
4,1
48
30
,03
3,6
30
Po
or
ma
rke
tin
g;
Ide
nti
fyin
g
ma
rke
ts;
•Fin
an
ce
fo
r e
xp
ort
s.
•1,5
00
ha
ro
tati
on
al
lan
d
av
ail
ab
le i
n G
ish
wa
ti f
or
ex
pa
ns
ion
;
•In
itia
te t
he
us
e o
f fe
rtil
ize
rs i
n
py
reth
rum
.
•Mo
ve
fro
m m
ult
ipli
ca
tio
n u
sin
g
sp
lits
to
mu
ltip
lic
ati
on
us
ing
s
ee
dli
ng
s a
nd
tis
su
e c
ult
ure
•Fa
rme
rs m
ob
iliz
ati
on
to
ro
tate
Ir
ish
po
tato
wit
h p
yre
thru
m•
Ex
po
rt G
row
th F
ac
ilit
y t
o
en
co
ura
ge
ma
rke
t d
ev
elo
pm
en
t a
nd
fin
an
ce
po
st
sh
ipm
en
t
2.4
Oth
er
4
7,9
32
,24
55
6,0
80
,72
76
5,6
14,4
50
76
,76
8,9
07
89
,819
,62
1
La
ck
of
fin
an
ce
fo
r in
ve
stm
en
t in
ne
w p
rod
uc
-ti
on
ac
tiv
itie
s.
• E
xp
ort
Gro
wth
Fa
cil
ity
to
e
nc
ou
rag
e i
nv
es
tme
nt
in
div
ers
ifie
d s
ec
tors
•
Ex
po
rt D
ev
elo
pm
en
t P
rog
ram
me
to
bu
ild
ex
po
rt
ca
pa
cit
y
3.
Re
-Ex
po
rts
MIN
I-C
OM
165
,35
1,9
79
20
0,1
44
,83
02
43
,66
4,6
06
29
6,6
47
,38
33
61,
150
,812
4.
Info
rma
l M
INI-
CO
M11
0,4
98
,18
114
5,7
01,
162
167
,55
6,3
36
192
,68
9,7
87
22
1,5
93
,25
5
Qu
ali
ty a
nd
q
ua
nti
ty o
f g
oo
ds
av
ail
-a
ble
at
ma
jor
cro
ss
-bo
rde
r c
en
tre
s
• C
ros
s B
ord
er
Ma
rke
ts
co
ns
tru
cte
d a
t 8
ma
rke
t s
ite
s;
• A
cc
es
s t
o fi
na
nc
e a
nd
sk
ills
fo
r s
ma
ll t
rad
ers
;
5.
Se
rvic
es
*4
00
,59
8,2
08
43
9,5
49
,06
94
84
,99
2,4
73
54
3,5
88
,04
76
23
,38
0,9
92
2,5
32
,04
8,9
67
5.1
To
uri
sm
RD
B3
03
,70
0,0
00
32
6,6
00
,00
03
55
,90
0,0
00
39
0,1
00
,00
04
30
,50
0,0
00
1,0
74
,98
1,6
89
Fa
cil
itie
s a
nd
m
an
ag
em
en
t o
f M
ICE
str
ate
gy
,
Tra
inin
g a
nd
q
ua
lity
of
off
er;
• F
ina
lis
e C
on
ve
nti
on
Ce
ntr
e a
nd
la
un
ch
co
nv
en
tio
n b
ure
au
;•
Inc
rea
se
to
uri
sm
nu
mb
ers
th
rou
gh
be
tte
r m
ark
eti
ng
;•
Div
ers
ify
to
uri
sm
off
er
an
d
tra
inin
g f
or
se
rvic
e p
rov
ide
rs;
5.2
Tra
ns
po
rt,
Lo
gis
tic
s &
D
istr
ibu
tio
n
MIN
I-C
OM
77
,017
,216
80
,86
8,0
77
84
,911
,48
18
9,1
57
,05
510
3,0
00
,00
0
1,4
57
,06
7,2
78
•In
fra
str
uc
ture
&
co
mp
eti
tiv
e-
ne
ss
of
Rw
an
-d
an
firm
s i
n
se
cto
r
•De
ve
lop
off
-do
ck
co
nta
ine
r fa
cil
itie
s a
t p
ort
s;
•Fin
ali
se
in
ve
stm
en
t in
Kig
ali
lo
gis
tic
s p
latf
orm
;
•Co
ns
tru
ct
bo
nd
ed
wa
reh
ou
se
s;
•Co
nti
nu
e i
nv
es
tme
nt
an
d
ex
pa
ns
ion
of
Rw
an
dA
ir;
•Gro
w R
wa
nd
a t
ruc
kin
g fl
ee
t
5.3
IC
T &
BP
OR
DB
-10
,00
0,0
00
20
,00
0,0
00
35
,00
0,0
00
50
,00
0,0
00
•In
fra
str
uc
-tu
re a
nd
sk
ills
b
ac
ke
d u
p b
y
rele
va
nt
inv
es
-to
rs
•Bra
nd
ing
– b
uil
d a
n b
ran
d
ima
ge
fo
r th
e I
CT
/B
PO
ex
po
rt
ma
rke
t;
•Ta
rge
ted
ma
rke
tin
g t
hro
ug
h
tra
de
fa
irs
, ro
ad
sh
ow
s,
G2
G
sa
les
etc
;
•In
tro
du
ce
in
du
str
y
ce
rtifi
ca
tio
ns
fo
r c
om
pa
nie
s
ex
po
rtin
g s
erv
ice
s/
pro
du
cts
;
•De
ve
lop
hig
h q
ua
lity
te
ch
nic
al
tale
nt
thro
ug
h t
arg
ete
d t
rain
ing
s
for
ICT
/B
PO
op
era
tors
;
• C
om
ple
te P
ha
se
1 o
f th
e K
iga
li
Inn
ov
ati
on
Cit
y;
• F
un
din
g t
o s
up
po
rt t
he
va
rio
us
g
row
th s
tag
es
of
ICT
/B
PO
c
om
pa
nie
s a
nd
mo
re s
pe
cifi
ca
lly
s
up
po
rtin
g e
xp
ort
ac
tiv
itie
s;
•Cre
ate
10
00
Hig
h t
ec
h e
xp
ort
jo
bs
th
ou
gh
co
lla
bo
rati
on
wit
h
Ja
pa
n;
5.4
Oth
er
Se
rvic
es
*R
DB
19,8
80
,99
22
2,0
80
,99
22
4,1
80
,99
22
9,3
30
,99
23
9,8
80
,99
2•
Div
ers
ity
of
off
er
an
d a
va
il-
ab
ilit
y o
f s
kil
ls
• H
ea
lth
: Im
ple
me
nta
tio
n o
f R
ad
io,
On
co
log
y a
nd
dia
gn
os
is
ce
ntr
es
pro
jec
ts f
or
me
dic
al
se
rvic
es
; •
Ed
uc
ati
on
:Att
rac
t m
ed
ica
l s
tud
en
ts a
nd
pa
tie
nts
fro
m t
he
re
gio
n f
or
ne
w h
ea
lth
ca
mp
us
;
*Ser
vice
s d
oes
not
incl
ud
e o
per
atin
g co
sts
of e
mb
assi
es

NATIONAL EXPORT STRATEGY II 29
3.3. Strategic Objective 2: Improved Access to MarketsAs pointed out in the analysis section, different markets matter for different products. Priority interventions for improving access are listed according to market. Likely sources of growth and proposed interventions are presented below broken down by market.
3.3.1 International Markets
3.3.1.1 The United StatesAlready an important market for coffee, pyrethrum, and handcrafts, has been identified as holding good potential from apparel and accessory exports. New exports from this product group are expected to grow in the following manner:
1. New large investors establishing in government constructed advanced factory units and exporting apparel. As of 2014, two investors have committed to establishing production units in Rwanda. These investors know what products they will export and how to benefit from AGOA. They plan take advantage of the EAC’s EPZ regime to import inputs duty free for single transformation before exporting. They do not require support in accessing the market. Rwanda’s ability to attract foreign investors depends on its’ ability to create the right domestic conditions that reduce factor costs and enable investors to enter Rwanda and within a period of three to six months begin exporting;
2. Major established clothing and apparel brands in the US, sourcing goods from Rwanda as part of their Corporate Social Responsibility Strategy. A number of US high street brands are already working with producers in Rwanda to create sustainable and profitable clothing and accessory lines for sale in the US. These US firms require advice on how to benefit from domestic regulations that could support their operations in Rwanda and on how to export to the US under AGOA, through for example being granted an AGOA visa and having their consignments certified as originating from Rwanda;
3. There are small producers in Rwanda who have identified the US market as a potential export market. These producers require support at all levels, from sourcing inputs in a cost effective manner (including potentially duty free through EPZ), understanding what preferences they could benefit from and creating linkages with buyers.
4. Mineral Exports: Rwandan’s mining sector is in need of major government, industry and end user advocates to legitimize Rwanda’s compliance with Dodd Frank and mainstream the acquisition of minerals sourced in Rwanda by buyers in the US market;
5. Growth from high value agro-processed goods such as Stevia and pyrethrum is also possible. However supply side constraints and linkages to markets need to be addressed before growth becomes a real possibility.
Specific interventions to support new export growth to the US market is through intensifying existing export flows and improving Rwanda’s ability to take advantage of AGOA. Key interventions for this market are:
• Expand list of goods covered under AGOA: Tariffs on products excluded from AGOA, especially on agricultural goods, remain relatively high. AGOA’s broader economic impact could be improved if preferences were extended to all products;
• Extending preferences to all product lines should be coupled with less restrictive rules of origin1. The surge in apparel exports under AGOA clearly illustrates the powerful effect of liberal rules of origin. The 35 percent value added rule on non-apparel goods is in all likelihood too demanding for firms in Rwanda. Lobbying for a 10 percent value-added requirement would give AGOA exporters the flexibility they need to source inputs globally and exploit their comparative advantage in labour intensive products. An alternative would be to lobby for a phased introduction of the 35% value added rule over a 5 to 10 year time horizon. This would allow for the development of local supply chains in the medium term;
• Sensitize relevant sectors on AGOA: Existing producers in Rwanda are either unaware of the opportunity presented under AGOA or do not understand the requirements for qualifying for duty free access under AGOA. AGOA sensitization training is required on a regular basis to ensure new entrants to the sector learn of the potential benefit. This can be provided through USAID regionally funded Trade programmes.
1 The RoO method used under AGOA is Value addition (35 per cent) calculated as a percentage in the ex-factory price of the finished product represented by the cost of local originating material, labour and direct costs of processing.

NATIONAL EXPORT STRATEGY II30
3.3.1.2 The European UnionThe EU is important for existing tea and coffee exports, while also holding good potential for new horticulture and apparel exports - – for the latter this is dependent on EPA (as opposed to EBA) market access in order to allow for single transformation under rules of origin. New exports to the EU are expected to grow through the following routes:
• New investment in the horticultural and floricultural sectors reaching production stage in the next two years. Here avocado, macadamia and floriculture investors have already entered the market but have yet to begin exporting. These investors are already operating in other countries in the region and have established links with markets in the EU. They also have the ability to meet EU food safety standards and requirements. New exports from agricultural goods will come through facilitating investment by firms experienced in exporting to the EU.
• Apparel exports to the EU will come through the same type of firms as those entering the US but real growth is only possible once an EPA is agreed and simpler rules of origin introduced.
Specific market access interventions to support export growth to the EU are the following:
• Mineral Exports: As with the US, Rwandan’s mining sector is in need of major government, industry and end user advocates to legitimize Rwanda’s compliance OECD guidelines and mainstream the acquisition of minerals sourced in Rwanda by buyers in the European market;
• Sign EPA for reduced technical barriers to trade: Finalizing the EPA was particularly important for apparel exports. The EPA offers “single stage transformation” for this sector. Exporters to the EU would then benefit from duty free access for garments made using textiles from anywhere in the world (see light manufacturing). In contrast the EBA rules of origin are more restrictive, offering “double stage transformation” – this requires clothing exporters to use fabrics and textiles from the ACP or the EU;
• RBS’ schemes for food production and product quality certification accredited (HACCP): HAACP is a management system in which food safety is addressed through the analysis and control of biological, chemical, and physical hazards from raw material production, procurement and handling HACCP provides the type of disciplined monitoring and control that supermarket chains and food manufacturers increasingly demand. It is also essential for meeting EU food safety requirements;
• The EU Data Privacy Directive specifically prohibits the sending of personal data to any country without a “level of [data] protection” considered “adequate” by EU standards. The absence of appropriate and enforced data protection laws in Rwanda therefore curtails BPO opportunities in the European market;
• Pre-travel visa requirements for many European countries is likely a major deterrent for tourists from those countries to visit Rwanda. Adoption of the EAC Single Tourist Visa should go some way to addressing this issue. However pre-entry visa clearance will remain a hindrance to travel.
3.3.1.3 AsiaThe Asian market is important for mineral exports (mainly China and Malaysia). Pakistan is also an important market for tea. Rwanda is already granted a degree of preferential access to several Asian markets through WTO declarations. These markets are China, India, Japan, and South Korea. The percentage of tariff lines liberalized under these declarations differ by country with Japan opening up 98% of all tariff lines while South Korea has liberalized just 59% of tariff lines.
Growth in the Asian market is expected to come through traditional export sectors, tea, coffee and minerals. Here increasing exports depends on increased supply as opposed to direct interventions in the market at this point.
3.3.2 Regional and African MarketsRegional and wider African markets are important for manufactured goods, agro-processed goods, livestock, animal produce and horticulture. The regional market is also important for services exports, particularly medical, transport, distribution and logistics. The DRC and Burundi are the two most important markets; however there is interest from the private sector in growing into new markets in Africa including francophone markets for services.
Growth within the region is closely linked to increased productive capacity within Rwanda to supply regional markets. Attracting new investors and growing existing exporters to produce both for Rwanda and beyond is key to unlocking exports from the manufacturing and agro-processing sectors. For horticulture, effective operationalisation of the collection centres and agro-logistics centres to increase supply and efficient distribution to regional markets is important.
Within the region the GoR needs to engage EAC partners to ensure implementation of the Common Market Protocol. An issue here is ensuring the mutual recognition of standards and qualifications to facilitate the movement of goods and services. A number of firms in Rwanda have so far been unable to access other EAC markets because of restrictions in these areas.

NATIONAL EXPORT STRATEGY II 31
Increasing taxes on exports charged by the DRC as well as restrictions on the movement of traders and professionals between the DRC and Rwanda pose a threat to growth in exports to Rwanda’s single largest export destination. Here, cross-border engagement between businesses, traders and government officials is required to reduce restrictions at the border. Beyond the region, creating linkages both in terms of reliable and affordable transport services and stronger business linkages with strategically identified export markets such as South Sudan, Congo Brazzaville and Gabon is important. Exporting firms to these markets may have some experience in exporting to neighbouring countries but will require a good deal of firm level support and in-market country assistance in order to enter new markets. Specific market access interventions by region are provided below
3.3.2.1 East African CommunityWithin the EAC, the focus is on better aligning existing structures with Rwanda’s development needs as well as ensuring implementation of commitments made under the Common Market Protocol.
• Expand NTB National Monitoring Mechanism to cover restrictions on trade in services This is important for policing commitments already made by member states and ensuring the rapid removal of any barriers (primarily regulatory) that may have been put in place be EAC members;
• Harmonisation and mutual recognition of standards within the EAC: The harmonization and recognition of standards across the EAC will facilitate the free movement of goods within the region and remove obstacles associated with the non-recognition of the RBS Quality mark for certain products in other EAC partner states;
3.3.2.2 DRC• Cross-border cooperation on trade related issues: This does not have to necessarily be government to
government. Strengthening business linkages and using support offered by development partners on both sides of the border trade with the Kivu region of the DRC can be enhanced to ensure continued flow of exports from
Rwanda into the DRC.
3.3.2.3 Africa• Market Linkages: Exporting to the wider African market suffers from a chicken and egg problem. On the one hand
there is insufficient and irregular supply meaning transport and distribution costs remain expensive and in some cases unreliable. This reduces the incentive of firms to strengthen linkages with African markets and reduces supply thus pushing up the costs of transport and distribution in those markets. This could be addressed through a combination of “in-market support” in a few selected African markets through for example multi-service centres, linked to routes that have already been established. Overtime it is expected that through this approach the cost of accessing certain markets in Africa should be reduced and exporting to those markets become more attractive;
• Trade Agreements: Rwanda does not have preferential access to most countries identified by the private sector as markets of interest for growth in non-traditional exports. For example, tariff rates in South Sudan, Congo-Brazzaville and Gabon are all high for Rwandan goods. The accession of South Sudan into the EAC would open up this market to free trade. With other countries in Africa new trade agreements would have to be negotiated through the EAC, a long process;
• Low Grade Coffee Exports: Coffee traders have identified new markets for low grade coffee (Sudan and Egypt)
but require support in developing the markets. This is covered through interventions under SO3 of this strategy.
3.3.3 Cross-Cutting Market Access and Trade Policy Considerations• Special Economic Zone and Export Processing Zones: The Kigali Special Economic Zone currently operates
as a normal industrial zone. There is no special infrastructure or tax regime operating in the phases currently occupied. It is likely therefore that the Government will move to implement the EAC Export Processing Zones law on a company by company basis. The EPZ law offers tax advantages to exporters of manufactured products who sell more than 80% of their turnover outside the EAC. As an example, this is the tax regime under which Light Industry investors would expect to operate. Encouraging investments to take advantage of EPZ status will be an attractive incentive to reducing the costs of inputs for planned export goods outside the EAC.
• Effective and Innovative Logistics Services: The distribution and logistics services strategy identifies what needs to be done to improve the competitiveness of these services and reduce the costs of trade with the region and the rest of the world.
• Leverage Trade Facilitation Support: The WTO TF Agreement is aimed at reducing transaction costs through elimination of red tape, increased transparency, streamlined border procedures and formalities as well as reduction of import-export documentation requirements; automation; reduction of fees and charges; enhanced cooperation among border agencies; expedited clearance and release of goods among others. The TF Agreement

NATIONAL EXPORT STRATEGY II32
contains flexibilities for the implementation of the Agreement by developing countries as well as provisions for technical assistance and capacity building. Donors committed to provide financial and technical assistance. Rwanda should finalise its needs assessment for trade facilitation and begin leveraging for support through development partners.
3.3.4 In Market Support (Multi-Service Centres)The role of an international Trade Promotion Organizations (TPO_ varies depending on the market and the specific needs of exporters. Activities undertaken can include:
• Partner identification (qualifying partners, submitting samples, promoting specific products, arranging missions and visits, drafting agreements)
• Market Research (standards, market size & potential, competition, distribution, price points)• Event organisation (inward missions/outward missions)• Trade fair (pre, during and post event activities)• Fixing local market problems (customs, tax, payments)• Identification and coordination of in country support networks including; sector experts, transport, warehousing,
lawyers, accountants, designers, PR experts and other relevant services• Undertaking generic PR to promote the country
Through its Embassies and RDB nodal offices, Rwanda has a small but qualified presence in a number of key export markets. However the emphasis on Investment Promotion can often leave commercial attachés with little time to actively support export activities.
It is therefore proposed that based on the recommendations of the Agro-logistics strategy, RDB and MINICOM will review the opportunity to establish either 100% government funded or PPP’s with local in market partners to deliver services in addition to those provided by Rwandan embassies (e.g. Warehousing and Distribution) or full TPO services in those markets where Rwanda has no diplomatic representation.
Ideally such services should be delivered on a fully commercial basis where users pay for services consumed such that GOR has no long-term financial commitment. However in the short term where new markets are being considered and where trade flows cannot justify a fully commercial arrangement, it may be necessary for some form of short term PPP between GOR and a selected in-market partner.
3.4 Strategic Objective 3: Upgrade Firm Capacity to Access and Grow in Export Markets
3.4.1 Access to Government funded support measuresAny company or group of companies who wish to export should ideally be able to access certain levels of government support. However with limited resources support has to be focused on those companies where the best impact can be generated using the resources available. Trade Promotion Organisations therefore tend to segment their services so that some are available to all exporters and potential exporters while others, generally more expensive to deliver are restricted to selected groups most likely to benefit from these services.
It is also worth noting that Government funded TPO’s among OECD members often charge for certain services to ensure both commitment from the service user as well as a greater value for money for the public purse. It may be some time however before this becomes common practice in Rwanda.
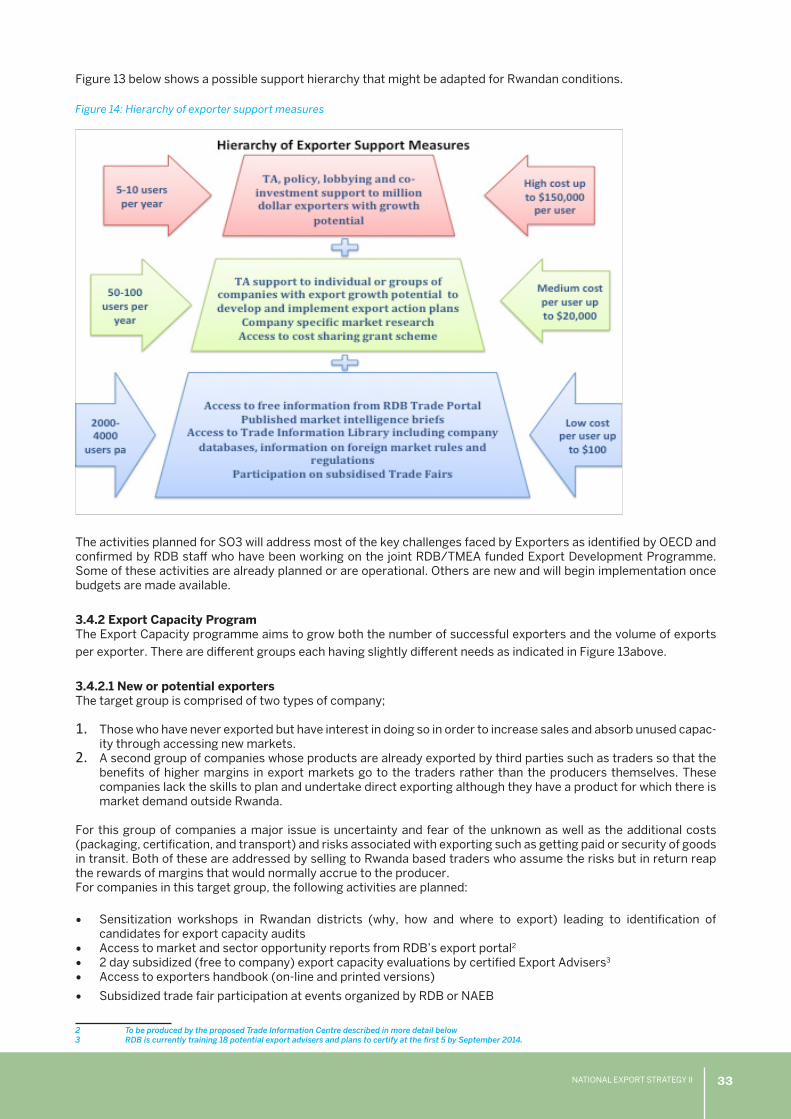
NATIONAL EXPORT STRATEGY II 33
Figure 13 below shows a possible support hierarchy that might be adapted for Rwandan conditions.
Figure 14: Hierarchy of exporter support measures
The activities planned for SO3 will address most of the key challenges faced by Exporters as identified by OECD and confirmed by RDB staff who have been working on the joint RDB/TMEA funded Export Development Programme. Some of these activities are already planned or are operational. Others are new and will begin implementation once budgets are made available.
3.4.2 Export Capacity ProgramThe Export Capacity programme aims to grow both the number of successful exporters and the volume of exports
per exporter. There are different groups each having slightly different needs as indicated in Figure 13above.
3.4.2.1 New or potential exportersThe target group is comprised of two types of company;
1. Those who have never exported but have interest in doing so in order to increase sales and absorb unused capac-ity through accessing new markets.
2. A second group of companies whose products are already exported by third parties such as traders so that the benefits of higher margins in export markets go to the traders rather than the producers themselves. These companies lack the skills to plan and undertake direct exporting although they have a product for which there is market demand outside Rwanda.
For this group of companies a major issue is uncertainty and fear of the unknown as well as the additional costs (packaging, certification, and transport) and risks associated with exporting such as getting paid or security of goods in transit. Both of these are addressed by selling to Rwanda based traders who assume the risks but in return reap the rewards of margins that would normally accrue to the producer.For companies in this target group, the following activities are planned:
• Sensitization workshops in Rwandan districts (why, how and where to export) leading to identification of candidates for export capacity audits
• Access to market and sector opportunity reports from RDB’s export portal2
• 2 day subsidized (free to company) export capacity evaluations by certified Export Advisers3
• Access to exporters handbook (on-line and printed versions)
• Subsidized trade fair participation at events organized by RDB or NAEB
2 To be produced by the proposed Trade Information Centre described in more detail below3 RDB is currently training 18 potential export advisers and plans to certify at the first 5 by September 2014.
NATIONAL EXPORT STRATEGY II34
3.4.2.2 For existing exportersWhile the number of exporters has grown substantially over the past 5 years to approximately 1,200 many of these are small and ‘occasional’ small exporters who handle export orders opportunistically on a reactive basis rather than through a planned strategic approach. In fact approximately 80% of Rwanda’s exporters operate on this basis and generate annual exports of less than $100,000 per year which together account for less than 5% of total exports. It follows that where GOR can successfully support these companies to become confirmed and proactive exporters this could have an important impact on national export performance.
Of particular interest are those companies regularly exporting between $100,000 /year and $1 million per year – some 150 in all. These companies clearly have the product and potential to grow.For these companies it is planned to offer the following services:
• Free or subsidized support to develop and implement export action plans by certified export advisers• Free access to the information services provided by the planned Trade Information Centre, which will provide
input to action development and implementation.• Access to planned Export Growth Facility for qualifying support• Participation in RDB’s Market Linkages Program
• Access to appropriate sector or country focused trade missions and events organized by RDB and NAEB
3.4.2.3 For Large ExportersAt the end of 2013 there were 65 companies with export turnover greater than $1 million (Million Dollar Exporter – MDE) and an average turnover of $8 million. To achieve the growth EDPRS2 growth targets will require a significant increase in Rwandan MDE’s. As in the past, some of these companies will be new foreign investors such as Bahkresa and Steelrwa. Many others will be home grown.
These large (by Rwandan standards) companies generally already have successful business models. This potentially limits the scope for direct strategic or tactical intervention by GOR or its appointed consultants. However, often these companies require specific policy actions by government to remove barriers to growth. Issues to be considered may cover supply chains, import duties or other fiscal issues and access to infrastructure.
For large exporters RDB shall provide Export Growth Account Managers (EGAM) whose responsibility will be to work with MDE’s and RDB export specialists to identify where appropriate initiatives that could significantly improve their export performance either through market or product diversification.
Services to be provided through the EGAM’s could include:
• Tailor made export growth strategies (cost shared with GOR) using local and if required, international experts• Supply chain development support• Access to the planned Export Growth Facility for qualifying support• Policy advocacy to address individual export growth constraints• Possible GOR co-investments
3.4.2.4 Export Adviser InitiativeTo deliver support to exporters of all sizes and capacity will require a cadre of qualified and experienced advisers based in Rwanda who understand the local business context but are familiar with both the process of exporting and that of planning and implementing export action plans. In late 2012, RDB started the process of recruiting and train-ing the first group of future certified Export Advisers. Up to 10 advisers will be certified in by September 2014 and thus ready to provide strategic and tactical support to Rwandan exporters. Given the small number of Rwandan ex-porters, 10 advisers is probably a good start but at some future date, it will probably be necessary to develop further advisers as well as to help upgrade some of the soon to be certified SME advisers.
The small number of active company consultants in Rwanda signals a challenge for these newly qualified advisers. Many companies are unused to hiring consultants to address challenges or provide strategic or tactical support out-side technical areas such as standards or quality and they are even less used to paying for these services. If Rwanda wants to develop a cadre of qualified and professional export consultants then it will be necessary to find a way for them to earn income. In other countries this is often managed through a subsidized consulting scheme where com-panies pay a percentage of the costs of an approved project and the balance is paid by the government.
The EAI will over the life of the strategy undertake the following activities
• Undertake quality control of subsidized work performed by certified advisers• Train and certify additional Export Advisers depending on market demand• Re-qualify existing certified advisers every 3 years.• Evaluate a senior tier of advisers after 3 years who can train and certify other advisers

NATIONAL EXPORT STRATEGY II 35
3.4.3 Trade Promotion and Buyer OutreachProactive promotion of Rwanda and its products and services will a key element in a successful export growth strategy. Currently Rwanda has a very limited coordinated trade promotion strategy outside possibly tourism and coffee. This creates an information gap for potential buyers for whom information about Rwandan export potential tends to be hard to find and superficial. It also means that in general exporters either have to organise promotional activities themselves or they do nothing either because of lack of knowledge or because international promotion can be expensive.
In the medium term it will be up to companies to organise their own promotion. Where necessary in the short term, this can be supported by government agencies as facilitators and trainers.
The Trade Promotion Strategy will contain the activities listed below:
3.4.3.1 Group BrandingGiven the small size of most exporters marketing and branding can be an expensive challenge. This is compounded when a large order is received that may require cooperation between producers as could happen for coffee, tea or even textiles. It is recommended that support mechanisms be created to help improve individual company branding (including packaging, web sites, brochures etc) as well as to encourage group branding where opportunities exist.
NAEB has commissioned consultants to develop an overriding brand for Rwandan Coffee. This will not preclude from using their own branding but will provide a quality guarantee for buyers and consumers that the coffee that is ‘Rwanda Excellence’ or whatever the brand may turn out to be has minimum levels of quality certified by the industry.
This approach could be used for other sectors and indeed it is NAEB intention to also create a sector brand for Tea. ‘Rwanda Fresh’ has already been registered as a brand for Fruit, Vegetable and Horticulture products. For garments a group of producers could form an association (eg; Rwanda Garment Manufacturers Association – RGMA) that would set minimum standards of quality as well as combining to promote members capacities to buyers in US and EU markets where significant AGOA and EBA duty advantages exist.
To be successful in international markets these new brands and their values will have to be actively promoted both at trade fairs, direct buyer outreach, in-store directly at consumers and through both digital and traditional media in key markets.
3.4.3.2 ‘Buy from Rwanda’ Export PortalRDB has created a specific portal, www.buyfromrwanda.rw that will provide online and up to date information and support to exporters and potential exporters. The portal will also enable potential buyers to learn about Rwandan products and to make sourcing enquiries directly to companies registered in the exporter’s database (56 to date) or via RDB who can advise on the most qualified suppliers.
Included on the portal will be a detailed exporter’s handbook, currently under preparation by PSF. It is planned that the handbook provides detailed and easy to use information about the essential elements of successful export action plans as well as covering in detail how to handle the mechanics of exporting such as standards, tariffs and duties, transport and logistics, distribution options and getting paid.
3.4.3.3 Buy from Rwanda promotional materialsPromotional materials should be of sufficient quality to be distributed to all Rwandan Embassies as well as to multipliers such as foreign embassies and Chambers of Commerce.
Currently under the “Buy from Rwanda” brand the following elements are produced by RDB in small quantities:• Export Catalogue listing Rwandan exporters and their contact details
• Penguin stands and banners
3.4.3.4 Trade Fairs programA key role of any successful Trade Promotion strategy is the organization of effective participation in international trade fairs. Not all fairs will be suitable for Rwandan exporters so events have to be chosen carefully. Since trade fair attendance can be expensive, there are other options that can also be considered such as sales missions to visit targeted buyers. The key to success is proper advance preparation, excellent organization during the event and professional follow-up of the sales leads generated. Working with NAEB and PSF, RDB will select for each year the trade events that will be supported by GOR budget. These events will be branded overall with Buy from Rwanda and sponsoring agencies or Ministries may offer subsidies to qualified exporters to help defray the cost of attendance. However as a basic principal, sector organizations and associations should take over both the funding and organization of such events. This will permit GOR to focus on market and product diversification through providing support to new events in new markets rather than funding the same event year after year.

NATIONAL EXPORT STRATEGY II36
Investment in a professional stand profile and structure that can be re-used at different locations to save costs and maintain image should be considered.
3.4.3.5 Market Linkages programThe market linkages programme has already been successfully tested by RDB in Uganda. The programme involves working with committed exporters whose products can mostly meet the standards of the market being targeted.
Following a briefing for participating companies (if a group marketing approach is being taken), product samples are taken to the target market where potential buyers have been already identified by the chosen market linked consultant. The samples are reviewed by the potential buyers and based on their comments a market feedback report is prepared for each exporter.
The feedback report includes comments on product attractiveness (packaging, quality standards, branding and price points relative to existing competition) and likelihood of purchasing interest and interest to meet the producer.
The market feedback reports are used to help prepare exporters for a sales mission, where individual meetings are arranged with interested buyers at their premises. These meetings provide exporters with an excellent opportunity to ask questions about market conditions and the competitive environment as well as to sell their products. They can open the door to short term orders and successful long term trading relationships. Where appropriate export advisers can provide additional support to market linked companies in adjusting their plans or products to take advantage of the opportunities identified.
While the programme has so far been piloted only in EAC markets, the basic principals can be applied to any market4. While relatively expensive on a cost per company basis ($5,000-$10,000) it is very efficient and effective and can
represent excellent value for money if used with companies that have the appropriate capacity and motivation.
3.4.3.6 President’s Award for ExportingMany successful exporting countries across the globe recognise export success through awards ceremonies. These do not necessarily need to be burdens on the public purse and in fact are often organised as high profile charity events attended by the Prime Minister or the President. Rwanda of course already has a business award ceremony and it may be that the promotion of export success can be given a higher profile in an existing event. Either way, it is important that the public in general and the business community understand the importance of exporting for a small country like Rwanda and that the Government is focused on supporting this activity.
However, the idea of a Presidential Award5 would not simply award export volumes but rather consistent performance. Products given the Presidential ‘seal of approval’ would be those that reflect the image and ambitions of Rwanda – quality, innovation and entrepreneurship.
Exporters receiving the award would be able to use the award logo for a designated period of time on all products exported and in their promotional materials.
3.4.4 Trade Information CentreWhile RDB offers a one-stop-shop for investors there is no such service for exporters in Rwanda. As a result exporters or their consultants are obliged to contact and often visit a wide range of institutions to gather information about market opportunities or about the mechanics of exporting, a time consuming and expensive business. For smaller companies this can be a major constraint in developing sensible export action plans.
While an Export Portal can provide general information at some stage the information needs of an exporter or potential exporter has to become quite company specific. It is therefore proposed that RDB evaluate the cost and benefits of setting up a small trade information centre to provide a one-stop information and signposting service to exporters. The TIC would be managed by a small well-trained team supported by access to a virtual library of relevant publications, reports and databases.
TIC services could be accessed by telephone, Internet or by personal visits to the centre. Services would be defined during the planning stage but might include;
• Desk research for individual companies (cost sharing)• Sector opportunity scans including both primary and secondary research• Market and competitor profiles• Identification of buyers and distributors
• Information on market entry conditions, costs and requirements
4 RDB is currently planning an exercise in Sweden together with NAEB5 This could be fashioned using the same principles as the Queen’s Award for Enterprise in the UK

NATIONAL EXPORT STRATEGY II 37
3.5 Strategic Objective 4: Export Growth Facility
The EGF is designed as a single facility with three separate windows through which firms can access export finance options not currently available in Rwanda. The facility provides the finance necessary for realising the previous three strategic objects and will be implemented by BRD. The three windows through which finance can be accessed are:
• Investment Catalyst Fund: Encourage private sector investment in export oriented production by bridging the high interest costs between a benchmark export finance rate (6%) and the prime rate (16-19%). The loan will be complemented by the provision of support to companies to prepare for investment through operational capacity development and performance enhancement, using where appropriate Export Advisors and selected components of the export development programme (Strategic Objective 3) but also drawing on other external resources;
• Matching Grant Fund for Market Entry Related Costs: Exporting is expensive relative to selling on the domestic market. Costs specific to exporting might include: meeting new quality and standards requirements, developing a firm level export strategy and promotion activities, and product development and innovation. Where such costs represent a potential constraint to exporting there is a role for government to remove part of this constraint through sharing the cost and therefore the risk of such investments;
• Export Guarantee Facility: Allow exporters additional export finance from commercial banks or directly from BRD by enhancing the credit worthiness of the exporter though the backing of a guarantee. The guarantee encourages exporting by minimizing the efficiency loss due to the effect of nonpayment risks.
The Export Growth Facility will initially be launched as a limited pilot programme targeting firms in the horticulture, agro-processing and manufacturing sectors. The pilot phase will be used to test demand for, and the impact of, the facility in terms of new exports and employment in Rwanda.
Based on experience in other countries the facility is expected to grow exports of beneficiary firms by 80% - 100%. It is currently envisaged that a single pool of funds would finance the three distinct components of the EGF. However, if a donor requested to fund a specific component only (e.g. due to their internal regulations), the ring-fencing of their facility would in principle be possible.
Multilateral and Bilateral donors will be approached for contributions to support the facility, potentially prioritising development partners currently supporting to the private sector development or financial sector development under the Division of Labour. Two types of assistance will be sought:
• Grants to constitute the pool funding for EGF;• Technical assistance component to enable BRD to create these products.
Should the pilot, as expected, reveal an overall significant demand for lower cost trade finance, longer-term, more sustainable solutions can be considered, including:
• Attracting trade-finance oriented Lines of Credit from multilateral development banks, such as African Development Bank (through their Trade Facilitation Programme), or International Finance Corporation (IFC, through their Trade and Supply Chain Programmes).
• The demonstrated demand for export finance related guarantees could justify the inception of the local offices of existing guarantee-extending DFIs such as African Guarantee Fund.
The ultimate long run aim is to develop a competitive market of commercially viable trade finance products, so that supply is ensured by commercial financial institutions. Increased awareness and understanding of trade finance would further enable the largest exporters to access various DFI trade finance directly.
The consensus is that the Development Bank of Rwanda (BRD) should be the national institution responsible for implementing the proposed Export Growth Facility. The executives of BRD concur with this decision, and point out that the institution already has developed the nucleus of in-house expertise about export-related development and export finance. BRD is also sufficiently resourced to implement the more complex aspects of the programme.
A detailed implementation plan has been developed by MINICOM and BRD including the roles and responsibilities of relevant agencies.

NATIONAL EXPORT STRATEGY II38
CHAPTER 4: MANAGING AND DELIVERING THE STRATEGY
4.1. Implementation
NES II will be implemented during a period of low global economic growth as developed countries struggle to recover from the global financial crises. Volumes of ODA are also predicted to reduce in the short to medium term. Furthermore, there has been a general slowdown in export growth from Rwanda in the past 12 months as a result of falling demand in DRC and low commodity prices
Achieving ambitious export targets with limited financial resources and weak global demand calls for the correct sequencing and coordination of activities. Harmonization of actions by institutions is necessary for both implementation and monitoring and evaluation. To avoid the need to create new structures NES II implementation will fit into existing bodies.
Inter-Governmental monitoring and coordination of NES II will happen primarily through IDEC who will play a high level monitoring role in the implementation of the NES. Coordination amongst a broader set of stakeholder including development partners will take place through the Private Sector Development Joint Sector Committee for Industry and Exports. This combination of Government and Stakeholder high level monitoring of implementation will translate into adequate sequencing (from short term to medium term interventions) and the clear assignment of responsibilities and roles in their implementation and coordination.
4.2. Institutional Roles
The key implementing institutions of the NES are: IDEC, MINICOM, RDB, NAEB, BRD, MINIRENA and PSF.
4.2.1 Industrial Development and Export Council (IDEC)The cross-cutting nature of export growth requires a strong monitoring mechanism for overseeing implementation of activities related to export growth as well as for identifying and removing bottlenecks in the decision making process. In response to this need to GoR established the high level industrial development and export council (IDEC) out of a recommendation under NES I.
IDEC is chaired by MINICOM and under recent restructuring, now plans to meet on a monthly basis to oversee flagship projects and priority actions. To drive implementation of NES actions and ensure proper monitoring the technical content for IDEC will be development by the IDEC Secretariat supported by Ministry Focal points
4.2.1.1 Role of the Secretariat in Coordinating and Monitoring NESThe role of the Secretariat should be to prepare the monthly Technical IDEC meetings by the following means:
• Follow up on the flagship export projects in dialogue with focal points in the relevant Ministries and private sector and by other means necessary (site visits etc);
• Follow up on IDEC indicators (which will incorporate NES indicators) and action plan in dialogue with the focal points in the relevant Ministries and private sector;
• Identify where there are coordination failures and address with the relevant Ministries outside of IDEC in advance of any IDEC meeting;
• Provide recommendations and supporting analysis on decisions that need to be taken at the Technical Committee.
The IDEC secretariat will be coordinated and quality checked by a selected member of staff in MINICOM. The coor-dinator will work with selected analysts who will oversee implementation of their respective agencies commitments under NES. Twenty per cent of the time of each member of the Secretariat will be required for this work and should therefore be allowed for in their Ministry objectives.
4.2.1.2 Responsibility of Key Implementing Institutions and AgenciesDifferent Ministries and Agencies play different roles in the implementation of the NES. The lead and supporting agencies necessary for implementation of each of the activities is presented in the action plan for the NES. A summary of the role the lead government implementers will play is presented below. An implementation plan is attached as Annex I of this document.
Role of MINICOM: As the chair of IDEC, MINICOM will oversee and coordinate implementation of the NES amongst relevant institutions. MINICOM will also lead on required legislative, policy reform and trade negotiations.
Role of RDB: It is proposed that RDB create a full department to coordinate and lead in all matters concerning the development and support of exporters and the promotion of Rwandan products and services in key markets.

NATIONAL EXPORT STRATEGY II 39
Currently RDB has a Trade Development Division with 4 staff members. This is insufficient to take a leadership role in developing exporters and promoting exports. The proposed Department will have three divisions whose responsibilities are outlined in the diagram below:
RDB is also the lead implementing agency for Advanced Factory Unit Programme, MICE Programme, and ICT Kigali Technopole project.
Role of NAEB: NAEB is responsible for implementing strategies for developing, within Rwanda, the agricultural export sectors identified in NES (coffee, tea, horticulture, floriculture). NAEB will also work to support exports by: support them in meeting necessary quality standards in target markets; collecting and disseminating information on local, regional and international markets; coordinating activities of stakeholder networks with regard to agricultural products for export. NAEB will report back to IDEC on progress and highlight any challenges faced.
Role of BRD: The new Development Bank of Rwanda will be responsible for overseeing role out and management of the Export Growth Facility. This includes its role out among the wider commercial banking sector.
Role of MINIRENA: Upgrading capacity of artisanal minerals and lead on technical input for regaining access to markets affected by strict restrictions on mineral exports from Great Lakes Region.
Role of PSF: PSF, as the secretariat of Rwanda Exporter’s Forum should coordinate private sector engagement with the Government in export related matters. The PSF should closely work with private sector operators to ensure NES activities continue to meet their needs and identify were gaps or amendments are necessary in existing strategies
4.2.2 PSDS Joint Sector Committee to Coordinate ImplementationThe PSDS Joint Sector Committee (JSC) on Industry and Export will coordinate implementation of activities between Government and Development Partners. This also ensures alignment of NES priorities with the wider private sector development goals of EDPRS II. The JSC will, in general, be responsible for coordinating the implementation, monitoring and evaluation of NES II at the technical level, and providing inputs and updates to the Sector Working Group ahead of the quarterly SWG meetings.
Specifically, JSC will:
• Monitor and provide inputs to the development of detailed implementation plans for each programme of the NES;
• Track performance of NES programmes and detailed implementation plans in accordance with the monitoring and evaluation framework set out in the NES;
• Provide quarterly progress updates on key indicators and activities for the assigned programmes for discussion

NATIONAL EXPORT STRATEGY II40
in Sector Working Group meetings and any additional inputs required for Joint Sector Reviews (JSRs);• Identify implementation challenges and develop steps for their resolution with clear timeframes and
responsibilities;• Monitor stakeholders’ activities and identify outstanding technical assistance needs (e.g. studies, capacity
building) within the Industry and Export Sub-Group’s area of focus that would contribute towards PSDS programme outcomes, as well as to identify potential funding sources including from Government institutions, Development Partners or other stakeholders;
• Provide the central technical-level forum for discussion of sector diagnostics (including studies), projects, strategies and policies relating to the Industry and Export Sub-Group’s area of focus, to increase ownership, maximize synergies, and avoid duplication.

NATIONAL EXPORT STRATEGY II 41
AN
NE
X 1: IM
PLE
ME
NTA
TIO
N P
LAN
PR
OG
RA
MM
ES
Actio
ns
Ou
tpu
t (by 2
018
)L
eadw
ith2
015
/16
20
16/
172
017/
18
Imp
lemen
tation
of N
ation
al E
xpo
rt Strategy
6
,44
0,0
00
15,3
40
,00
04
4,0
90
,00
0
Strategic O
bjective 1: S
ector
Interven
tion
s
S
ector A
ction
Plan
s fully
imp
lemen
tedV
ariou
s
Co
vered u
nd
er existing b
ud
gets
Strategic O
bjective 2
: Imp
rove
Access to
Markets
1,8
90
,00
0
1,89
0,0
00
4
90
,00
0
Access to
Markets
Accessin
g Intern
ation
al M
arkets
Sen
sitisation
Pro
gramm
e on
AG
OA
and
EU
O
pp
ortu
nities
M
INIC
OM
PS
F 5
0,0
00
5
0,0
00
5
0,0
00
Lob
by fo
r remo
val of restrictio
ns o
n
Rw
and
an M
inerals E
xpo
rts un
der U
SA
and
E
U Legislatio
n
Market access b
arriers rem
oved
for m
inerals
MIN
RE
NA
MIN
AFFE
T 1,0
00
,00
0
1,00
0,0
00
Ad
op
tion
of D
ata Pro
tection
and
Data
Secu
rity Stan
dard
s
RD
BM
YIC
T 4
00
,00
0
20
0,0
00
Accessin
g Regio
nal an
d A
frican
Markets
Exp
and
NT
B N
ation
al Mo
nito
ring
Mech
anism
to in
clud
e trade in
services
MIN
ICO
MM
INE
AC
50
,00
0
50
,00
0
50
,00
0
Harm
on
isation
of S
tand
ards w
ithin
the E
AC
R
BS
MIN
EA
C 15
0,0
00
15
0,0
00
15
0,0
00
Fun
d C
ross-B
ord
er Co
op
eration
C
om
mittees w
ith D
RC
MIN
ICO
MR
RA
40
,00
0
40
,00
0
40
,00
0
Mu
lti-Service C
entres
Estab
lish cen
tres in exp
ort m
arkets strategic m
arkets 5
MS
C o
peratio
nal b
y 20
18M
INIC
OM
PS
F / RD
B2
00
,00
04
00
,00
02
00
,00
0
Strategic O
bjective 3
: Up
grade
Firm C
apacity
3
,55
0,0
00
3
,45
0,0
00
3
,60
0,0
00

NATIONAL EXPORT STRATEGY II42
Tra
de
Pro
mo
tio
n a
nd
Bu
yer
Ou
trea
ch
Gro
up
Bra
nd
ing
Init
iati
ve
Iden
tify
an
d r
ecru
it e
xter
nal
sp
ecia
lists
to
wo
rk w
ith
sel
ecte
d s
ecto
rs t
o d
evel
op
an
d s
up
po
rt t
he
imp
lem
enta
tio
n o
f gro
up
b
ran
din
g in
itia
tive
s
Tw
o g
rou
p b
ran
din
g in
itia
tive
s p
ilote
dR
DB
PS
F/ N
AE
B 1
50
,00
0
20
0,0
00
2
00
,00
0
Bu
y fr
om
Rw
and
a P
ort
al
Set
up
an
d m
ain
tain
exp
ort
po
rtal
for
Rw
and
a ai
med
at
pro
mo
tin
g ex
po
rts
and
p
rovi
din
g u
sefu
l in
form
atio
n t
o R
wan
dan
ex
po
rter
s
Su
cces
sfu
l po
rtal
th
at
incr
ease
s vi
sits
by
bu
yers
an
d
exp
ort
ers;
ack
no
wle
dge
d a
s th
e p
rin
cip
al s
ou
rce
of i
nfo
r-m
atio
n fo
r R
wan
dan
exp
ort
ers
RD
BP
SF
/NA
EB
50
,00
0
75
,00
0
10
0,0
00
PR
OG
RA
MM
ES
Act
ion
sO
utp
ut
(by
20
18)
Lea
dw
ith
20
15/
162
016
/17
20
17/
18
Exp
ort
Cap
acit
y P
rogr
amm
e
Sen
siti
sati
on
wo
rksh
op
sD
esig
n a
nd
ru
n 1
/2 d
ay w
ork
sho
ps
in a
ll d
istr
icts
in c
on
jun
ctio
n w
ith
PS
F an
d B
DS
50
0 c
om
pan
ies
atte
nd
w
ork
sho
ps
RD
BP
SF
/NA
EB
/M
INIC
OM
50
,00
0
50
,00
0
50
,00
0
Exp
ort
Cap
acit
y A
ud
its
(2 d
ays)
Pro
vid
e s
up
po
rt t
o n
ew o
r p
assi
ve
exp
ort
ers
in e
valu
atin
g ex
po
rt c
apac
ity
and
pro
du
cin
g in
dic
ativ
e ac
tio
n p
lan
s b
y q
ual
ified
EA
’s
20
0 n
on
exp
ort
ing
com
pan
ies
rece
ive
exp
ort
cap
acit
y au
dit
sR
DB
10
0,0
00
1
00
,00
0
10
0,0
00
Exp
ort
Cap
acit
y A
ud
its
(4 d
ays)
Pro
vid
e su
pp
ort
to
exi
stin
g ex
po
rter
s to
ev
alu
ate
thei
r p
ote
nti
al t
o g
row
exp
ort
tu
rno
ver
on
a c
ost
sh
arin
g b
asis
by
qu
alifi
ed
EA
’s
25
0 e
xpo
rter
s re
ceiv
e ex
po
rt
cap
acit
y au
dit
s an
d o
utl
ine
exp
ort
gro
wth
act
ion
pla
ns
RD
B
20
0,0
00
2
00
,00
0
20
0,0
00
Exp
ort
Gro
wth
Pla
nn
ing
sup
po
rt
Pro
vid
e su
pp
ort
to
qu
alifi
ed e
xpo
rter
s to
imp
rove
exp
ort
per
form
ance
th
rou
gh
dev
elo
pm
ent
and
imp
lem
enta
tio
n o
f Exp
ort
G
row
th P
lan
s
100
co
mp
anie
s co
mp
lete
an
d
imp
lem
ent
exp
ort
gro
wth
p
lan
sR
DB
5
00
,00
0
65
0,0
00
75
0,0
00

NATIONAL EXPORT STRATEGY II 43
PR
OG
RA
MM
ES
Actio
ns
Ou
tpu
t (by 2
018
)L
eadw
ith2
015
/16
20
16/
172
017/
18
Exp
ort G
row
th P
lann
ing
sup
po
rt
Pro
vide su
pp
ort to
qu
alified
expo
rters to
imp
rove exp
ort p
erform
ance th
rou
gh
develo
pm
ent an
d im
plem
entatio
n o
f Exp
ort
Gro
wth
Plan
s
100
com
pan
ies com
plete an
d
imp
lemen
t expo
rt grow
th
plan
sR
DB
5
00
,00
0
65
0,0
00
75
0,0
00
Ap
po
int E
GA
M’s
Initially u
se qu
alified
EA
’s and
external
experts as E
GA
M’s th
en u
se EA
I to d
evelop
fu
rther E
GA
M’s
Initial rep
orts p
repared
on
o
pp
ortu
nities an
d ch
allenges
facing 4
0 M
DE
’s; follo
wed
by
an actio
n p
lan an
d regu
lar su
pp
ort visits
RD
BP
SF/ N
AE
B 4
00
,00
0
40
0,0
00
4
00
,00
0
Su
pp
ly Ch
ain D
evelop
men
t
Iden
tify sup
ply ch
ain co
nstrain
ts an
d d
evelop
strategies with
relevant
stakeho
lders to
increase su
pp
lies in a co
st eff
ective man
ner
Su
pp
ly con
straints rem
oved
fo
r 25
MD
E’s; im
pact o
n
imp
orts d
ocu
men
tedR
DB
PS
F/ NA
EB
25
0,0
00
2
00
,00
0
20
0,0
00
Po
licy Ad
vocacy
Do
cum
ent an
d q
uan
tify the im
pact o
f issu
es in th
e Exp
ort en
viron
men
t that
are con
straints to
MD
E’s o
r expo
rters in
general an
d p
repare p
rop
osals th
rou
gh P
PD
p
latform
to ad
dress th
em
Ind
ividu
al expo
rt con
straints
remo
ved fo
r 50
MD
E’s an
d
overall exp
ort en
viron
men
t im
pro
ved
RD
BP
SF /N
AE
B /
MIN
ICO
M 2
00
,00
0
20
0,0
00
2
00
,00
0
Exp
ort A
dviser In
itiative
Develo
p p
rofessio
nal exp
ort ad
visers wh
o
can p
rovid
e relevant ad
vice and
sup
po
rt to
new
and
existing exp
orters th
rou
gh a
pro
gramm
e of train
ing an
d m
ento
ring
30
EA
’s qu
alified
; 15 p
requ
al-ifi
ed
RD
BP
SF/ N
AE
B 10
0,0
00
75
,00
0
75,0
00
Trad
e Info
rmatio
n C
entre
Exp
orters h
and
bo
ok
Prep
are and
up
grade E
xpo
rters Han
db
oo
k fo
r distrib
utio
n to
all expo
rters and
po
tential
expo
rters
Exp
orters an
d service p
ro-
viders u
nd
erstand
the ru
les an
d regu
lation
s govern
ing
expo
rting fro
m R
wan
da
RD
BP
SF/ N
AE
B/
RR
A/ R
BS
50
,00
0
50
,00
0
50
,00
0
Exp
ort m
arket intelligen
ce lib
rary
Directo
ries, market an
d secto
r repo
rts co
llected in
a library an
d availab
le for free
amo
ng all exp
orters an
d p
oten
tial expo
rters
Imp
roved
un
derstan
din
g of
market o
pp
ortu
nities an
d
targeting o
f po
tential b
uyers
RD
B
15
0,0
00
75
,00
0
100
,00
0
Strategic O
bjective 4
: Exp
ort
Finan
ce
1,00
0,0
00
10,0
00
,00
04
0,0
00
,00
0

Pro
mo
tio
nal
Mat
eria
ls
Pro
du
ce a
ran
ge o
f pro
mo
tio
nal
mat
eria
ls
un
der
th
e B
uy
Fro
m R
wan
da
Bra
nd
for
use
at
Tra
de
Eve
nts
an
d b
y E
mb
assi
es a
nd
RD
B
offi
ces
Rw
and
a b
ran
din
g an
d a
war
e-n
ess
of R
wan
dan
go
od
s an
d
serv
ices
imp
rove
dR
DB
5
0,0
00
5
0,0
00
5
0,0
00
Tra
de
Fair
s P
rogr
amm
e
RD
B, p
artn
ers
and
pri
vate
sec
tor
dev
elo
p
a p
lan
for
‘bra
nd
ed’ R
wan
dan
att
end
ance
at
gen
eral
an
d s
ecto
r fo
cuse
d t
rad
e fa
irs
app
rop
riat
e to
th
e p
rod
uct
s an
d s
ervi
ces
avai
lab
le fo
r ex
po
rt a
nd
th
e co
mp
etit
ive
envi
ron
men
t in
th
e ge
ogr
aph
ies
cho
sen
.
10%
Incr
ease
in s
ales
by
new
ex
po
rter
s an
d b
y ex
isti
ng
exp
ort
ers
in n
ew m
arke
tsR
DB
PS
F/ N
AE
B 4
00
,00
0
40
0,0
00
4
00
,00
0
Mar
ket
Lin
kage
s P
rogr
amm
e
Hig
hly
tar
gete
d c
om
man
do
sal
es s
up
po
rt
pro
vid
ed t
o in
div
idu
al c
om
pan
ies
thro
ugh
p
rod
uct
sp
ecifi
c m
arke
t re
sear
ch c
om
bin
ed
wit
h o
n-s
ite
sale
s m
eeti
ngs
. Can
be
linke
d t
o
trad
e fa
ir a
tten
dan
ce
15%
Incr
ease
d e
xpo
rt s
ales
by
50
exp
ort
ers
in n
ew m
arke
tsR
DB
PS
F/ N
AE
B 2
50
,00
0
25
0,0
00
2
50
,00
0
Pre
sid
ents
Aw
ard
for
Exp
ort
ing
Des
ign
an
aw
ard
s p
rogr
amm
e u
nd
er t
he
Pre
sid
ents
Offi
ce (
Pre
sid
enti
al A
war
d fo
r E
xpo
rtin
g) t
hat
cu
lmin
ates
in a
hig
h p
rofi
le
awar
ds
cere
mo
ny
to c
eleb
rate
an
d le
arn
fr
om
exp
ort
su
cces
s
Incr
ease
d a
war
enes
s o
f th
e im
po
rtan
ce a
nd
ben
efits
of
Exp
ort
ing
RD
BP
resi
den
cy/
PS
F/ N
AE
B/
MIN
ICO
M 1
50
,00
0
75
,00
0
75
,00
0
Tra
de
pro
mo
tio
n o
ffice
s
Iden
tify
op
po
rtu
nit
ies
to in
crea
se R
wan
da’
s in
mar
ket
pre
sen
ce in
key
mar
kets
on
a P
PP
b
asis
an
d n
ego
tiat
e p
rese
nce
acc
ord
ing
to
exp
ort
er n
eed
s an
d m
arke
t p
ote
nti
al
In m
arke
t p
rese
nce
incr
ease
s sa
les
in t
hat
mar
ket
RD
BM
INIC
OM
50
0,0
00
4
00
,00
0
40
0,0
00
PR
OG
RA
MM
ES
Act
ion
sO
utp
ut
(by
20
18)
Lea
dw
ith
20
15/
162
016
/17
20
17/
18

Exp
ort G
row
th Facility
Exp
ort
Catalyst Fu
nd
Su
bsid
ize investm
ent fo
r expo
rting an
d fu
nd
the d
ifferen
tial b
etween
the cu
rrent h
igh in
terest cost o
f expo
rt fin
ance an
d a
com
petitive rate fo
r expo
rters;
BR
D
50
0,0
00
5,0
00
,00
02
5,0
00
,00
0
Match
ing
Gran
t Fun
dR
edu
ce cost asso
ciated w
ith en
tering n
ew m
arkets or
expo
rting n
ew p
rod
ucts
B
NR
Co
mm
ercial B
anks
25
0,0
00
2,0
00
,00
03
,00
0,0
00
Exp
ort
Gu
arantee
Facility
Un
derw
rite expo
rt fin
ance tran
saction
s (pre an
d p
ost
ship
men
t) for m
ediu
m-sized
expo
rting co
mp
anies
B
NR
Co
mm
ercial B
anks
25
0,0
00
3,0
00
,00
012
,00
0,0
00
Mo
bilise
system
thro
ugh
co
mm
ercial b
anks
Co
mm
ercial ban
ks to m
ake expo
rt fin
ance availab
le at rate p
eriod
ically determ
ined
by B
NR
20
0 Firm
s accessing p
ro-
gramm
e per an
nu
m b
y 20
18
BN
RC
om
mercial
Ban
ks -
- -
PR
OG
RA
MM
ES
Actio
ns
Ou
tpu
t (by 2
018
)L
eadw
ith2
015
/16
20
16/
172
017/
18


