national fish and wildlife foundation - nfwf.org · the purpose of a nfwf business plan is to...
TRANSCRIPT

National Fish and Wildlife Foundation Delaware River Watershed Business Plan
March 2017

Delaware R iver Watersh ed - March 2017 | 2
Purpose of a Business Plan
The purpose of a NFWF business plan is to provide a concise blueprint of the strategies and resources
required to achieve the desired conservation outcomes. The strategies discussed in this plan do not
represent solely the foundation’s view of the actions necessary to achieve the identified conservation
goals, but instead reflect the majority view of the many federal, state, academic, and organizational
experts that consulted during plan development. This plan is not meant to duplicate ongoing efforts but
rather to invest in areas where gaps might exist so as to support the efforts of the larger conservation
community.
Acknowledgements
NFWF gratefully acknowledges the time, knowledge, and support provided by individuals and
organizations that contributed significantly to this business plan through input, review, discussion, and
content expertise relative to the Delaware Bay watershed, species, and habitat. In particular, thanks
goes to members of the Advisory Team including:
Jen Adkins, Partnership for the Delaware Estuary; Greg Breese , U.S. Fish and Wildlife Service; David
Bushek, Rutgers University; Keith Curley, Trout Unlimited; Tim Dillingham, American Littoral Society; Matt
Ehrhart, Stroud Water Research Center; Barry Evans, Penn State University; Sheila Eyler, U.S. Fish and
Wildlife Service; Tom Fikslin, Delaware River Basin Commission; Cathy Haffner, Pennsylvania Game
Commission; Pat Hamilton, New Jersey Department of Environmental Protection; Fred Henson, New York
State Department of Environmental Conservation; Kurt Fesenmyer, Trout Unlimited; Sarah Karpanty,
Virginia Tech; Danielle Kreeger, Partnership for Delaware Estuary; Stefanie Kroll, Academy of Natural
Sciences; Jeff Larkin, Indiana University of Pennsylvania; Emma Melvin, American Littoral Society; Brian
Neilan, New Jersey Division of Fish and Wildlife; David Mizrahi, New Jersey Audubon; Kenneth Najjar,
Delaware River Basin Commission; Larry Niles, Niles Consulting; Eric Olsen, The Nature Conservancy; Daryl
Price, Pennsylvania Fish and Boat Commission; Ron Rohrbaugh, Cornell University; Shawn Rummel, Trout
Unlimited; Ross Shramko, New Jersey Department of Environmental Protection; Nellie Tsipoura, New
Jersey Audubon.
About NFWF
The National Fish and Wildlife Foundation protects and restores our nation's wildlife and habitats.
Chartered by Congress in 1984, NFWF directs public conservation dollars to the most pressing
environmental needs and matches those investments with private contributions. NFWF works with
government, nonprofit and corporate partners to find solutions for the most complex conservation
challenges. Over the last three decades, NFWF has funded more than 4,000 organizations and
committed more than $2.9 billion to conservation projects. Learn more at www.nfwf.org.
Cover photo credit: Feeding red knots and dunlin (iStock photo); Smooth cord grass and ribbed mussels (iStock by
Getty images), and Vibrantly blue Delaware River (Andrew Kazmierski).

Delaware R iver Watersh ed - March 2017 | 1
Conservation Need
The Delaware River, at the heart of the densely populated
mid-Atlantic region and central to the nation’s
Northeastern transportation corridor, flows nearly 330
miles from its headwaters in New York to its mouth at the
Atlantic Ocean, where it forms the border between New
Jersey and Delaware. The Delaware River is recognized
nationally and internationally for its exceptional
ecologically and historically significant sites; it provides
drinking water to over 15 million people; it annually
attracts countless tourists; and it drives an economy largely
based upon the expansive natural resources of the region.
Four states border the Delaware River and Bay with 13,539
square miles contributing to its watershed (Figure 1). The open water of the Bay comprises 782 square
miles with freshwater inputs from nearly 2,000 tributaries. All or portions of 42 counties and 838
municipalities contribute to and benefit from the Delaware River watershed.
Since the 1600s humans have been altering the landscape, including clearing of forested lands for
agriculture; building of canals, roadways, dams; dredging for deeper ports; development of vast
industries reliant on water and energy sources; and harvest of lumber and extraction of coal. Several
times over the past two centuries, migratory fish, birds and oyster populations have been decimated by
overharvesting, pollution, hydrologic and hydraulic changes, and consequent dead zones; however, due
to pollution abatement and other controls measures implemented over the last several decades,
populations have begun to rebound.
The return of these populations has provided strong evidence of the system’s ability to rebound from
disturbances. However, the legacy and persistence of land conversion, river corridor disturbances, and
the rising sea levels associated with climate and other stressors continue to threaten the sustainability
of habitats that support representative and iconic species of the Delaware River watershed.
This business plan targets three integral habitat types for restoration and protection that are critical to
the Delaware River watershed, its fish, wildlife and people: nearshore, aquatic, and forest habitat.
Nearshore Habitat
Defined as the shallow water and land adjacent to the shorelines and stream banks within the Delaware
Bay and coastal areas, nearshore habitat includes the beach, intertidal and subtidal zones, as well as the
upland area of the shore. With an estimated 232 total coastal miles along the Bay, the interdependency
of migratory birds for protected beaches and food sources is intricately interwoven with the welfare of
shellfish and their overall habitat structure and resilience, and creates a compelling case for why a multi-
species approach for the protection and restoration of nearshore habitat is paramount.
Shorebirds. The Delaware Bay’s nearshore habitat serves as a critical stopover and food source for
migratory shorebirds including the red knot (Calidris canutus). Eggs spawned by millions of horseshoe
crabs (Limulus polyphemus) on beaches in May provide a critical energy source that directly correlates
Figure 1. Proximity map of Delaware River
Watershed

Delaware R iver Watersh ed - March 2017 | 2
with the survival of red knots, making the condition of these birds leaving Delaware Bay for their arctic
breeding grounds of high consequence (USFWS, 2013). These long distant migratory shorebirds occupy
habitat that is critical to other coastal migrators, like semipalmated sandpiper (Calidris pusilla) and
ruddy turnstone (Arenaria interpres). The harvest of horseshoe crabs for bait, the loss of beach habitat
for spawning crabs, and the extraction of lysate from live adult horseshoe crabs for pharmaceuticals
affect the availability of the red knot food source. An added and growing threat to the spawning success
of horseshoe crab, and by extension, the habitat needs of red knot, is the expansion of aquaculture,
especially on the New Jersey side. Oyster farming is expected to boost the local economy, but balancing
the industry needs with conservation and restoration is the task at hand.
Living shoreline. Despite the widespread distribution of tidal wetlands throughout the Delaware
Estuary, marsh habitat is rapidly being diminished and currently only occupies an estimated five percent
of its historic range. With over 63 percent of examined marshes experiencing net erosion, estimates
indicate that from 1996 to 2006 tidal wetlands throughout the Estuary experienced a net loss of
approximately an acre per day. These losses to critical habitat are further exacerbated by rising sea
levels and increased storm frequency and intensity. As a result of marsh loss, habitat for myriad species
including shorebirds, shellfish, native vegetation, fish and other wildlife is lost along with all the
ecosystem services provided (e.g., shoreline protection and water quality improvements). Therefore, in
order to protect this critical habitat for fish and wildlife, actions must be taken to stem tidal marsh loss.
Fringing eastern oyster (Crassostrea virginica) reefs are known to absorb wave energy and trap
sediments, creating habitat, filtering water, and performing the much needed recycling of nutrients in
the water column. Ribbed mussels (Geukensia demissa) in the tidal marshes are synergistic with the
wetland grasses, forming natural marsh levees, stabilizing sediments and providing water filtration and
nutrient cycling.
Aquatic Habitat
From the high quality headwaters emanating from the forests to the downstream large river and
estuarine systems, a continuum of water environments create valuable and diverse habitat supporting a
wide array of aquatic life including native trout and alosine species such as American shad and river
herring. With 23,700 linear miles of streams and rivers, and expansive groundwater systems underlying
them, the availability and quality of water is critical not only for the region’s water demands, but also for
supporting the aquatic health of representative fish species like eastern brook trout and an assemblage
of alosine species.
Water quality. The availability of high quality water across the Delaware River watershed is essential to
the 15 million people who depend upon it as their source of drinking water as well as for the welfare of
both aquatic and terrestrial wildlife. Degraded water quality is caused by a combination of historic point
sources (e.g., industrial waste, acid mine drainage, waste water treatment plants), as well as more
diffuse nonpoint sources. Runoff from urban and agricultural lands deliver nutrient, bacteria and
sediment pollution to streams throughout the region. Stormwater runoff from impervious, urbanized
areas has diminished water quality by altering the temperature regime, depleting dissolved oxygen and
introducing roadway and other surface contaminants to streams. These pollution inputs seriously
impact sensitive species like eastern brook trout and the macroinvertebrates they rely upon as a food
source. The sheer velocity and volume of stormwater strips the hydraulic and hydrologic function of
streams, greatly reducing the assimilative capacity of the region’s waters and diminishing overall health
of stream and river systems.
Eastern brook trout. Historians credit the Upper Delaware River as the birthplace of American fly-fishing

Delaware R iver Watersh ed - March 2017 | 3
on account of the prolific populations of eastern brook trout (Salvelinus fontinalis). In fact, nineteenth
century over-fishing in the Catskills was cited as the cause for the original decline in the native trout
population within the Delaware River watershed at the turn of the century. Eastern brook trout persist
in only the coldest and cleanest waters and are excellent indicators of good water quality and watershed
health. Stormwater runoff, incompatible agricultural practices, acid mine drainage, roads, and the
alteration of upland and riparian areas result in water quality, hydrology and habitat impairments that
reduce brook trout populations. Climate-induced warming may increase stream temperatures and alter
stream hydrology and therefore further reduce the amount of habitat available for brook trout in the
basin. Fragmentation from dams and impassable culverts results in small eastern brook trout
populations that are more vulnerable to disturbance events (floods, drought) and demographic
bottlenecks. Brook trout are also threatened by non-native trout, which out-compete for food and
spawning sites and routinely prey upon them. The mid-Atlantic region, including the Delaware River
watershed, has experienced some of the greatest declines in brook trout populations across their native
range.
Alosine species. The river basin is home to ten diadromous fish species that migrate between
freshwater and marine habitat, including three historically abundant alosine species represented by two
species of river herring, alewife (Alosa pseudoharengus) and blueback (A. aestivalis), and American shad
(A. sapidissima). Historically, the alosines are thought to have utilized many, if not all, medium to large
tributaries of the Delaware River watershed and were among the region’s most abundant and
economically valuable fishes. While little is known about the number of adults that return to the
Delaware River’s tributaries to spawn and how they utilize available habitat, it is clear that populations
of American shad and river herring have declined significantly over the last century. The alosines’
unique migratory life cycle is dependent upon unrestricted access to high quality upstream spawning
habitat, but a number of factors have diminished this access including barriers on tributaries,
overfishing, pollution, and habitat alteration and channelization for shipping or flood control, and the
loss of natural shoreline that changed flow patterns. Consequently, available habitat for alosine species
such as American shad and river herring is greatly limited and populations are currently at historic lows.
Forest Habitat
The forests that once dominated the Delaware River watershed provided vast, contiguous habitat that
nurtured numerous bird species as well as other terrestrial and aquatic species. Today, just under 50
percent of the Delaware River Basin’s upland is forested but much of it is fragmented, with isolated
patches surrounded largely by encroaching development.
Analyses of the Breeding Bird Survey (BBS data from 1966-2013) have demonstrated significant negative
trends, especially for neotropical migrants occupying eastern forests. In the eastern region, the decline
of habitat specialists including cerulean warbler (73% decline), golden-winged warbler (60% decline),
and wood thrush (59% decline) are symptomatic of habitat loss and fragmentation that have
dramatically reduced the habitat suitability in both temperate and tropical forests.
A healthy forest mosaic exists when bird species that are known to represent the discrete stages of
forest succession are present and fully utilizing breeding territories. For example, golden-winged
warbler (Vermivora chrysoptera) represent species dependent on early successional forest. Wood
thrush (Hylocichla mustelina) require mature forest for establishing successful breeding territories, and
cerulean warbler (Setophaga cerulea) are dependent upon a heterogeneous open canopy indicative of
late successional forests. But these species are at risk due to incompatible land practices,

Delaware R iver Watersh ed - March 2017 | 4
fragmentation, or forest management that focuses on a single attribute instead of the diverse age and
structure needed within the forest.
Current Conservation Context
Through its Delaware River Restoration Fund, NFWF participates in an unprecedented collaboration with
partners including the William Penn Foundation, the Institute for Conservation Leadership, the Open
Space Institute, the Academy of Natural Sciences and 50 nonprofits across the Delaware River
watershed to improve water quality with the overarching goal of ensuring the future of clean, abundant
water for all aspects of life in the watershed. The need for an overall business plan approach for habitat-
driven restoration is especially timely for improving alignment with the resources that this broader
partnership and capacity brings.
The William Penn Foundation has invested in the capacity of non-profit organizations to protect and
restore water and ensure clean, abundant water for present and future generations. NFWF’s business
plan will complement this work by expanding the scope to emphasize habitat protection and
restoration, which benefits species.
In addition, national and international efforts to track and conserve migratory shorebirds and
diadromous fishes have established conservation goals that include the Delaware Bay and the unique
habitat and role it plays in the Atlantic Flyway for shorebirds and the life cycles of American shad and
river herring. This business plan integrates and augments the goals of national and regional partners to
maximize the opportunity to leverage programs and funding towards the success of these species.
Figure 2 Source: iStock, historical. Used with permission.

Delaware R iver Watersh ed - March 2017 | 5
Conservation Outcomes
The Delaware River Watershed business plan takes a multi-species approach to improve and sustain
targeted nearshore, aquatic, and forest habitat in combination with improved water quality in targeted
geographies across the Basin. The overarching goal is to:
Restore and protect the diverse natural resources of the Delaware River Watershed, from the
headwaters to the Bay, to sustain healthy, interconnected populations of fish and wildlife, their
natural habitat, and the water quality upon which they depend.
Based on scientific literature and extensive content expert input, investment in strategies supporting the
conservation goals (Table 1) are expected to achieve multiple ecosystem benefits for native fish and
wildlife and improve water quality in targeted geographies and at scales within which assessment of
change over time can occur.
Table 1. Conservation Goals by Habitat Type and Species
Nearshore Habitat
Outcomes
Shorebirds
Restore sufficient amount and diversity
of beach habitat to sustain and enhance
healthy populations of red knot, other
shorebirds, and horseshoe crabs during
breeding and passage periods in the
spring and fall.
Goals
• Increase overall population size of red knot using Delaware Bay
by 15% during spring migration
� More than 80% of red knot maintain or exceed 180 gram
optimal threshold weight
� Increase overall availability of high quality horseshoe crab
habitat in the Bay by 50% so that red knot reach optimum body
weight threshold
Living shoreline
Maintain a zero net shoreline erosion
rate by stemming marsh loss and
protecting beach and shoreline habitat
for red knot and other species through
the construction of living shorelines in
priority sites.
� Protect beach habitat using oyster breakwaters to support
increased availability of high quality horseshoe crab habitat
(see above)
� Stabilize salt marsh edge habitat a using ribbed mussel and
oyster living shoreline techniques, protecting marsh habitat for
other marsh dependent species, so that net accretion rates will
exceed net erosion rates to prevent marsh loss at priority sites

Delaware R iver Watersh ed - March 2017 | 6
Aquatic Habitat
Outcomes
Water quality
Achieve clean and sufficient water quantity
and habitat quality to support healthy
aquatic ecosystems and human
communities through restoration in
targeted watersheds
Eastern brook trout
Enhance the habitat integrity, future
security and connectivity of coldwater
streams to support a robust conservation
portfolio of EBT populations
Goals
� Reduce polluted runoff in eight targeted watershedsb
� Enhance ecological community health in eight targeted
watersheds as measured by algae, benthic
macroinvertebrates and fish as indicators of healthb
Increase the population size of EBT (as measured using the
number of effective breeders in the population) in:
� Two resilient,c stronghold population patches
� Three redundant, persistent population patchesc
Alosine species
Increase American shad and river herring
runs through enhanced aquatic
connectivity and access to high quality
habitat
� Increase adult runs of American shad and river herring in
priority rivers to population goals that will be established
based on habitat suitability assessment and improved
monitoring1
� Restore access to high quality spawning habitat by increasing
connectivity in priority rivers through the removal of
barriers1
Figure 3 Eastern brook trout. Credit: USFWS

Delaware R iver Watersh ed - March 2017 | 7
Forest Habitat
Outcomes
Goals
Golden-
winged
warbler
Wood thrush
Cerulean
warbler
Test premise that
management of one or
more 2,500- to 5,000-acre
forest blocks for improved
stand age and structural
diversity, results in
improved habitat
conditions for forest birds
and other wildlife
� Manage 15% to 20% of the block for early successional
forest habitat (375 to 500 acres) resulting in 40 or more
golden-winged warbler breeding territories (goal assumes
375 acres; up to 80 breeding territories could be achieved,
based on 3 to 4 territories per 25 acres and 500 acres of
habitat)
� Manage 30% to 60% of the forest block for mature forest
habitat (750 to 1,500 acres), resulting in 60 or more wood
thrush breeding territories (goal assumes 750 acres; up to
360 breeding territories could be achieved, based on 2-6
breeding territories per 25 acres and 1,500 acres of habitat)
� Manage 30% to 60% of the forest block for late
successional forest habitat (750 to 1,500 acres), resulting in
180 or more cerulean warbler breeding territories (goal
assumes 750 acres; up to 480 breeding territories could be
achieved, based on 6 to 8 territories per 25 acres and 1,500
acres of habitat)
a Since the conditions and needs vary widely from location to location, quantitative estimates of the length and/or acreage
needed to set and achieve conservation goals will be established following initial baseline assessments and identification of
specific priority areas in years 0-3 of the plan.
b The Academy of Natural Sciences and implementation partners are currently developing the conservation targets via the
Phase 2 DRWI planning process, anticipated completion September 2017.
c Eastern brook trout patches are designated by Trout Unlimited as 1) resilient, 2) redundant, 3) representative of a unique life
history form, and 4) other (i.e., not resilient, redundant, or representative). Resilient populations are strongholds, and
represent large patches with diverse stream habitats and fewer non-native trout species that enhance the capacity for
populations to recover from large scale environmental disturbances. Redundant populations occur in smaller patches than
resilient populations but are still considered persistent, having the demographic capacity to resist genetic bottlenecks through
sufficient population size.
Figure 4 Wood thrush. Credit: M. Holland

Delaware R iver Watersh ed - March 2017 | 8
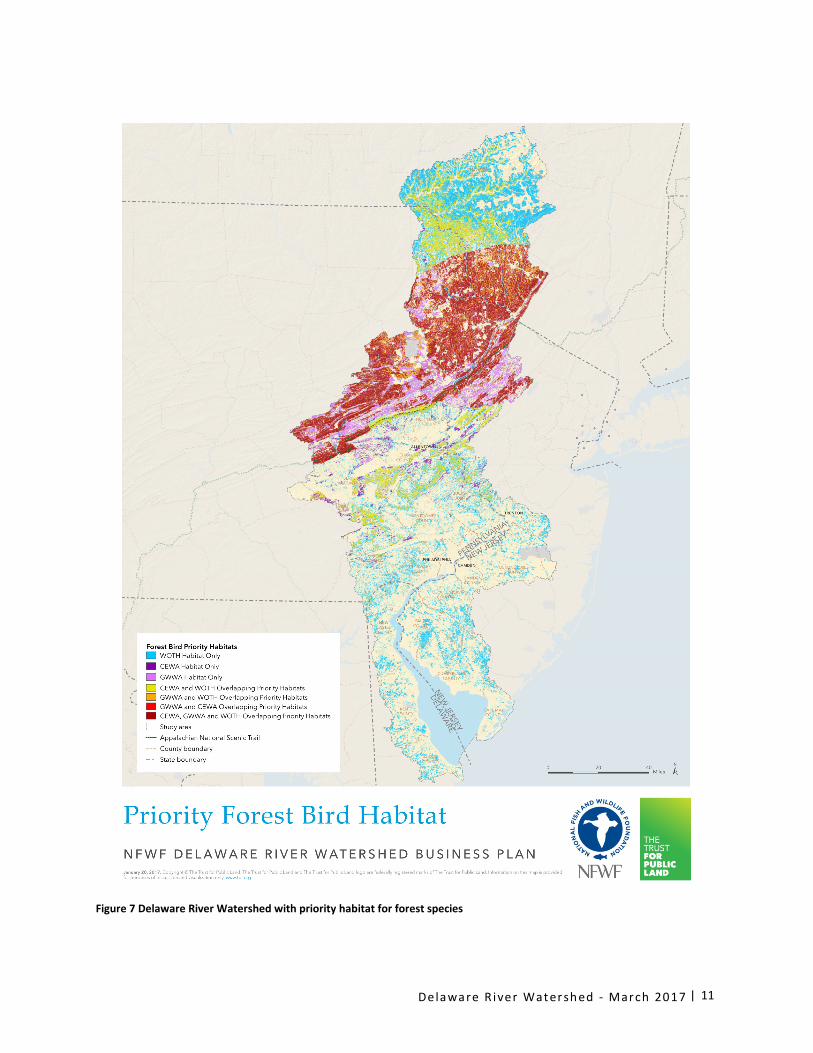
Geographic Focus
Program investments will be directed to key locations within the Delaware River watershed (Figures 5, 6
and 7) for each of the plan’s conservation targets. Priority habitat was mapped for red knot, eastern
oyster, ribbed mussel, living shorelines, alosine species, eastern brook trout, and the assemblage of
forest birds, golden-winged warbler, wood thrush, and cerulean warbler. The habitat maps were
evaluated and additional modeling was applied in response to extensive feedback and guidance from
content experts, resulting in more geographic specificity for species and habitat priorities. The
methodology for prioritization and full set of maps by habitat and species are in Appendix A. Below,
Table 2 briefly summarizes the focal geographies by priority habitat and representative species.
Table 2. Focal geographies by category, habitat, and species
Habitat/Species Focal Areas
Nearshore: Red knot,
shorebirds, and living
shorelines
1. Delaware Bay, areas of moderate to high overlap of red knot occupancy with
horseshoe crab spawning beaches that coincide with high to very high coastal
vulnerability indexa and locations of Partnership for Delaware Estuary’s designated
living shoreline opportunities that are adjacent to high priority beaches and salt
marshes. Sites include Reed’s, Stone, Fortescue and Thompson’s Beaches (NJ) and
Millespione Beach in (DE), denoted by the red line along the Bay shore (Fig. 5).
Aquatic: Water quality
2. Eight targeted watersheds identified by the Delaware River Water Initiative as areas
with highest potential to show impact to water quality in response to restoration
and protection include Kirkwood-Cohansey (NJ), Brandywine-Christina (PA/DE),
Upstream Suburban Philadelphia (PA), Schuylkill Highlands (PA), Middle Schuylkill
(PA), New Jersey Highlands (NJ), Upper Lehigh (PA), Poconos – Kittatinny (PA/NJ/NY)
and are shown in green thatch (Fig. 6).
Aquatic: Eastern brook
trout
3. Resilient, redundant, and representative patches that contribute to a portfolio of
Eastern Brook Trout populations in the Delaware River watershed. Patches are
defined by an EBTJV and TU effort, shown in purple thatch (Fig. 6) and are
concentrated in proximity to the forest habitat priority areas primarily in the
northern tier of the Delaware Basin.
Aquatic: Alosine
species
4. Priority rivers to be established based on assessments of habitat suitability and
barriers or impediments to alosine connectivity. Alosine Active River Areas in
catchments that scored highest in the Stream Reach Assessment Tool (DRWI) are
classified as very high priority and will be further evaluated. These areas are
denoted by orange along the river lines (Fig 6). To the extent practicable, priority
sites for alosine conservation will align with water quality sites (e.g., White Clay &
Brandywine Creek in the Brandywine-Christina cluster and the Schuylkill or Lehigh
Rivers).
Forests: Golden-
winged warbler, wood
thrush, cerulean
warbler
5. Appalachian region, northern tier of the Delaware River watershed and primarily
focused in NY, northeastern PA, and areas of northwestern NJ, and shown in a
series of solid colors dependent upon overlap of habitat for two or more of the
forest bird species (Fig. 7). Designated areas include 2,500 to 5,000 forest block(s)
and priority habitat for the forest bird species is based on the overlap of moderate,
high, and very high priority habitat for each of the individual species habitat models. a Coastal Vulnerability Index is a commonly used method to assess coastal vulnerability to sea level rise, in particular due to
erosion and/or inundation (Gomitz et al., 1991).

Delaware R iver Watersh ed - March 2017 | 9
Figure 5. Delaware River Watershed with priority habitat for nearshore

Delaware R iver Watersh ed - March 2017 | 10
Figure 6 Delaware River Watershed with priority habitat for aquatic species and targeted watersheds for water quality
Delaware R iver Watersh ed - March 2017 | 11
Figure 7 Delaware River Watershed with priority habitat for forest species

Delaware R iver Watersh ed - March 2017 | 12
Implementation Plan
The Delaware River Watershed plan strategies are designed to improve the quality and resilience of
nearshore, aquatic and forest habitats critical to the viability and future of the region’s diverse
shorebirds, shellfish, migratory fish, native trout, and forest dwelling birds. The strategies are also
undergirded by the need to improve and protect water for human uses while simultaneously ensuring
its quality and availability to sustain wildlife and their habitat. While the strategies are presented by
habitat category, in many cases activities may result in conservation outcomes across a range of habitat
and species. The results chain in Figure 8 provides a model for how the collective strategies are
predicted to contribute to the identified conservation outcomes.
Figure 8. Overall strategies results chain model for the Delaware River Watershed business plan

Delaware R iver Watersh ed - March 2017 | 13
Strategy 1: Management and Restoration of Nearshore Habitat – Shorebirds and Living Shorelines
Shorebirds
1.1 Increase high quality beach habitat at priority roosting and foraging sites through the
restoration and enhancement of four miles of beach habitat that has been altered or destroyed
during recent storm events and the establishment of best management practices (BMPs) to
reduce the impact of aquaculture on priority roosting sites and intertidal foraging areas.
1.2 Reduce impacts of human and wildlife disturbances to critical red knot habitat areas through the
development of a community outreach and social marketing program to manage access to
public beaches and increase awareness about the importance of beaches to red knot and other
species during critical staging period between May and June. The public outreach will be
targeted to areas with known roosts at Stone Harbor Point, Egg Island Point and Bombay Hook.
To address wildlife disturbances/predation, the translocation of breeding Peregrine Falcons will
be assessed and where feasible, moved at least 10 miles from the Delaware Bay shore.
1.3 Reduce incompatible management of natural resources by working collaboratively with public
and private sectors to develop and implement BMPs for aquaculture development at priority
areas for roosting and foraging red knot and to minimize the impact of horseshoe crab harvest.
1.4 Research and monitoring for ensuring shorebird success. Conduct annual census of red knot
and other shorebirds throughout the Bay and in critical staging and wintering areas. Support the
census and mapping of horseshoe crab populations in and adjacent to the Bay to ensure reliable
data is being collected and is available for determining their management.
Living shorelines
1.5 Identify priority sites for the construction of living shorelines that will contribute to the
protection or stabilization of habitat for multiple species including but not limited to shorebirds
such as red knot, horseshoe crab, eastern oyster, and ribbed mussels. Through initial
investments in the first year of the business plan, criteria will be established and analyzed to
identify high priority sites to target restoration investments and maximize conservation
outcomes for both beach and marsh habitat. To the extent possible, efforts should build on
existing and ongoing regional prioritization efforts and tools.
1.6 Research and monitoring for ensuring living shoreline success. Large scale and long-term
monitoring efforts are currently underway to evaluate living shorelines and better understand
their effectiveness at stemming erosion, how they benefit coastal resiliency, and to determine
the ecological benefits and trade-offs. These monitoring efforts apply standardized methods in
coordination with myriad state and federal partners to monitor and evaluate the impact of
marsh, beach, and living shoreline restoration efforts throughout the mid-Atlantic. This ongoing
monitoring effort will inform the implementation of the business plan and assist resource
managers, researchers, and conservation practitioners throughout the Delaware Estuary to
choose the most effective and cost efficient methods for stemming marsh loss, protecting beach
habitat, and supporting fish and wildlife. Results from these monitoring efforts will also help to
identify critical gaps and opportunities for research and development to refine methodology
and enhance conservation outcomes. In addition to ongoing monitoring efforts, the living
shoreline projects funded through this business plan will require site-specific rapid assessments
using established methods to develop baselines and determine appropriate design and

Delaware R iver Watersh ed - March 2017 | 14
engineering needs. Later, projects will develop longer-term and site-specific monitoring,
maintenance, and adaptive management plans in accordance with standardized guidelines.
1.7 Construct living shorelines in priority areas to provide marsh and beach habitat protection. This
plan focuses on four main shellfish-based living shorelines techniques that can help stem marsh
loss, protect important shoreline habitat, or be utilized in combination for a hybrid approach,
including: (1) Nature-based living shorelines are best suited for low-energy areas along the tidal
marsh edge in which shellfish are used to create contained areas capable of accumulating
sediment and allowing for the growth of marsh vegetation; (2) Living reef breakwaters protect
marsh and beach habitat through wave attenuation, but also support critical aquatic habitat.
Oyster living breakwaters offer a complementary approach to bolster the protection of red knot
foraging and roosting sites (Activity 1.1); (3) Marsh sills are used to stabilize shorelines utilizing
low elevation structures such as stones or bagged oyster shell. Vegetation is then planted in the
space between the sill and the marsh to enhance stabilization and provide habitat; (4) Intertidal
oyster reef and ribbed mussel beds creation will enhance ribbed mussel cover in mid-high
intertidal zones and help to mitigate marsh edge loss and stabilize shorelines. Similarly,
facilitating the colonization of oysters on intertidal mudflats provides habitat and supports
shoreline stabilization.
Strategy 2: Restoration and Management of Aquatic Habitat and Water Quality – Water Quality and
Quantity, Eastern Brook Trout, and Alosine Species
Water quality and quantity
2.1. Reduce the impact of polluted runoff on water quality and stream hydrology. For agricultural
lands, conduct assessments and develop conservation plans that result in accelerated
implementation of BMPs like forested riparian buffers, stream livestock exclusion, and improved
barnyard management. Stabilize streambanks (where appropriate), reconnect streams to
floodplains, and enhance and restore wetlands to improve the assimilative capacity and overall
resiliency of streams. Improve road maintenance and management to reduce the potential for
sediments and other pollutants to discharge to streams under storm conditions. Upgrade septic
systems where they are a known source of stream contamination. For developed and
impervious areas, assess the opportunities for green stormwater infrastructure (GSI) and
implement practices that will enhance infiltration, reduce stormwater-related delivery of
pollutants to waterways, and diminish the overall volume and energy of stormwater. GSI
practices may include rain gardens, bioswales, green roofs, riparian buffers, basin retrofits, and
wetland restoration. Remediate streams where acid mine drainage prevents the stream from
meeting its designated use for aquatic life.
2.2. Increase partner capacity to accelerate water quality improvements through technical
assistance, volunteer development, and municipal engagement. Improve outreach and
technical assistance to farmers and other landowners. Engage citizens in supporting economic
and policy incentives that promote watershed health including ordinances, zoning, and planning
that increase both the adoption of agricultural best management practices and GSI at the
household and municipal levels. Develop volunteers to engage in conservation and restoration
projects where feasible.

Delaware R iver Watersh ed - March 2017 | 15
Eastern brook trout
2.3. Restore connectivity in streams that support eastern brook trout (EBT) populations. Reduce the
threat of fragmentation stemming from dams and impassable culverts, decreasing species
vulnerability to extreme weather events or other demographic threats. Assess patch
fragmentation to develop finer scale information needed to identify priority passage barriers.
Remove small dams and replace impassable culverts with passable structures to increase patch
size. Proactively engage federal and state transportation agencies, local townships and
municipalities to design road-crossings appropriately to enable fish passage and to prevent road
blowouts from extreme storm events. Work with governmental partners to ensure that
interventions in response to flood damage maintain or enhance lateral and longitudinal stream
connectivity.
2.4. Restore uplands, riparian, in-stream habitat, water quality, and hydrology in streams that
support EBT populations. Urban and agricultural runoff, acid mine drainage, roads, and the
alteration of upland and riparian areas result in water quality, hydrology and habitat
impairments that reduce brook trout populations. Addressing these impairments through
restoration and BMPs will support the overall resiliency of EBT-occupied streams and will help
EBT populations adapt to the added stress of climate-induced stream warming and hydrologic
change. Additional activities that support this strategy are identified in the water quality
section, 2.1.
2.5. Identify and protect high-quality native trout patches and unique life history patches from
future development and related disturbances. Many streams in the Delaware Basin have not
been surveyed for fish. Residential, commercial, and energy-related development, including the
increase of roads, culverts, and stream crossings, are expected to continue and possibly
accelerate in the Delaware Basin, impacting high-quality brook trout populations through land
conversion and hydrologic alteration. Continue assessment programs that target streams likely
to support EBT (but where fish populations have not been previously assessed). Support
conservation easements or fee-based acquisition on priority streams.
2.6. Establish a robust monitoring program for the key EBT patches where NFWF and partners plan
to invest in restoration. Adequate and spatially explicit monitoring will ensure that brook trout
population response to restoration investments is measurable. Develop an EBT population
monitoring design in priority patches. Implement this design to establish a baseline brook trout
population size using Whiteley et al (2015) genetic estimates of number of breeding adults (a
surrogate for population size). Use this baseline to measure change in the number of breeding
adults over time as restoration activities are undertaken. Potentially pair this technique with
other monitoring work state agencies are performing.
Alosine species
2.7. Identify priority sites for restoration. To restore aquatic connectivity for alosine species within
the Delaware Basin, it is critical to first assess habitat suitability and characterize any barriers or
impediments that are currently preventing American shad and river herring from reaching or
fully utilizing high quality spawning habitat. Through initial investments in the first year of the
business plan, criteria will be established and analyzed to identify high priority sites to target
restoration investments and maximize conservation outcomes.

Delaware R iver Watersh ed - March 2017 | 16
2.8. Establish and/or improve monitoring programs for alosine species. Once priority sites are
identified through completion of Activity 2.7, sentinel monitoring sites will be established, as
needed, to fill data gaps and develop an infrastructure to monitor long-term population
changes. Run count monitoring will be conducted at sentinel sites, coupled with surveys that
monitor the extent to which adults are utilizing available spawning habitat. Once sentinel sites
are established and initial habitat utilization surveys are conducted, baseline data will be
collected and used to set a 10 year population goal for American shad and river herring. The
population goal will be established by year 3 of the business plan.
2.9. Restore access to spawning habitat by increasing connectivity in priority rivers. Through
completion of Activity 2.7, high priority barriers will be identified that prevent or significantly
reduce fish passage. Full assessments of priority sites will be conducted as needed to determine
site-specific dam removal and/or fish passage improvement opportunities including an analysis
of engineering, design, and permit requirements as well as passage efficiency studies. High
priority barriers will be removed and/or fish passage improvements will be made to restore
access to upstream habitat.
2.10. Support and build community outreach and education about alosine species and habitat
requirements through citizen science and intergenerational- and youth engagement projects.
Offer educational opportunities that engage all ages around the goals and expected outcomes of
alosine restoration projects.
Strategy 3: Forest Health – Forest Management and Representative Bird Species
3.1 Manage one or more 2,500 – 5,000 acre blocks of forest for age and structural diversity to
demonstrate that it will improve forest habitat conditions for birds and other wildlife. Forest
block size will be determined based on the habitat use of indicator species during the post-
fledgling period in which more habitat is required. For instance, golden-winged warblers require
a minimum patch of early successional habitat of 400 acres; wood thrush require a minimum
patch of 1,800 acres of mature forest; and cerulean warbler require a minimum forest block of
5,000 acres.1
3.2 Create and manage a portion of the forest block(s) for early successional forest (ESF). Manage
15% to 20% of the forest block for ESF. Patch size and distribution across the landscape will
need to be carefully planned to account for habitat senescence and bird dispersal. Develop and
implement ESF management plans using BMPs developed for golden-winged warbler (Golden-
winged Warbler Working Group, www.gwwa.org, 2013).
3.3 Manage a portion of the forest block(s) for a transitional mature forest (i.e. standard oak
silviculture methods). Manage 30 to 60% of the forest block for structurally diverse forest
conditions. Develop and implement BMP’s (including cerulean warbler BMP’s) for mature forest
management to benefit wood thrush, cerulean warbler and additional species (potential forest
management practices include those used by foresters to regenerate oak stands – e.g. crop tree
1 The science behind forest block size is grounded in habitat use of indicator species during the post-fledging period. After leaving the nest,
parents and dependent young require more habitat – for golden-winged warbler (a young forest indicator) fledglings range up to 700 m from
nest at 30 days, suggesting a minimum patch size of 400 acres; in contrast wood thrush (a mature forest indicator) will travel up to 1,500m from
nest at 30 days, suggesting a minimum forest block of 1,800 acres; lastly cerulean warblers (a late successional forest species) can travel more
than 2.5km from the nest at 30 days, suggesting a minimum forest block of 5,000 acres.

Delaware R iver Watersh ed - March 2017 | 17
release; cerulean warbler management guidelines, (Appalachian Mountains Joint Venture,
2013).
3.4 Create and manage a portion of the forest block(s) for late successional forest (LSF). Manage 30
to 60% of the forest block for LSF habitat; develop and implement LSF management plans
including implementation of cerulean warbler BMPs. Overall the management footprint for LSF
habitat will be light, with forests “allowed” to age “naturally” utilizing tools like invasive species
control, prescribed fire, or other light forest stand improvement activities. These acres will
benefit multiple species, including wood thrush and cerulean warbler, as age and structural
diversity are improved.
3.5 Research and monitor within the established forest block(s). Establish bird diversity baseline
estimates in unmanaged and pre-treatment blocks using transect point count sampling (Ralph et
al. 1995) or other techniques. Use baseline data and monitoring program to measure changes in
bird abundance, density, diversity and productivity as forest management activities are
undertaken. Track forest management goals (acres per habitat type) through GIS land cover data
and stand maps.
Risk Assessment
Risk is an uncertain event or condition which, if it occurs, could have a negative effect on a program’s
desired outcome. Seven risk event categories were assessed to determine the extent to which they
could impede progress towards the stated business plan strategies and goals for the Delaware River
Watershed during the next 10 years (Table 3).

Delaware R iver Watersh ed - March 2017 | 18
Table 3. Risk assessment summary
Risk Category Rating Risk Description Mitigating Strategies
Regulatory
Risks
Low
Executive order banning offshore drilling,
location of wells, and oil exploration could be
rescinded, leading to disturbance to intertidal
zone for red knot
Not addressed in plan
High
Infrastructure modifications made in response to
increased storms and flooding events may
negatively impact restored areas by diminishing
connectivity and exacerbating EBT habitat loss
Communications and outreach to local agencies
and governments with flood response
responsibilities is addressed in strategies for EBT
Financial Risks Low
Lack of diversity in current funding for Delaware
Basin makes program vulnerable to potential loss
of primary funder
Budget includes plan for diversifying portfolio of
investments to include private and broader public
funding
Environmental
Risks
High
Increase in water temperature might cause HSC
to spawn earlier, disrupting synchronicity of food
availability for red knot migration. Also, intensity
of storms may degrade restored shoreline.
Plan includes goal weights for red knot to better
understand impact of declining food sources and
creation of predator-free colonies through
translocation. Also, living shoreline strategy at
priority locations will reduce impact of storms on
shoreline
Low Increases in water temperatures threaten EBT
requirement for cold water
Plan includes strategies that improve/restore
forested riparian buffer in targeted areas,
increasing shade and thermal regulation
Mod
Living shorelines impacted by loss of tidal marsh
due to sea level rise, unprotected shoreline, river
hydraulics, etc.
Living shoreline strategy increases resiliency in
priority locations
Mod
Non-native trout and other species could out-
compete native brook trout for habitat, food in
priority sites
Plan targets streams that support allopatric
(native-trout only) patches.
Scientific Risks
Low
Insufficient scientific understanding of
population size and habitat occupancy for some
species could misdirect investments
Plan identifies research and monitoring strategies
where species data are lacking that reduce this
risk
Mod Uncertainty about the impacts of harvest on the
horseshoe crab (HSC) population
Strategies include study of impact of extraction
on HSC reproduction and life cycle. Near term
(<10 years) industry may have a synthetic formula
that would reduce/eliminate need to extract from
HSC.
Mod
Uncertainty as to whether growth of aquaculture
adjacent to critical staging and foraging beaches
for red knot will reduce productivity of HSC
Plan includes strategy to develop/implement
BMPs that support aquaculture and protect
critical habitat for red knot and HSC
Social Risks Low
Local communities might not adopt behavioral
changes to minimize beach disturbances (e.g.,
recreational access, ATVs) and beach waste,
which attracts predators. Landowners might not
adopt agricultural BMPs that reduce nitrogen,
phosphorus, sediment, and other agro-chemical
inputs into water.
Plan identifies social marketing and outreach
strategies for engaging local communities to
protect. It also includes agricultural technical
assistance as a strategy for increasing farmer
participation in conservation.
Economic
Risks Low
Bycatch as a management risk occurs outside of
the spatial and strategic scope of this plan but
may impact alosine populations that could
occupy expanded spawning areas
Not addressed in plan
Institutional
Risks Mod
Multiple agencies and organizations have responsibility
and missions associated with the plan’s outcomes. Risk
that there is insufficient coordination and collaboration
required to successfully implement the strategies.
Plan includes strategies for organizational
collaboration, as appropriate

Delaware R iver Watersh ed - March 2017 | 19
Monitoring & Evaluating Performance
To track program performance and conservation outcomes, NFWF will monitor progress at the project
and program scales. Table 4 summarizes the core metrics for tracking overall progress on meeting the
stated conservation goals. A detailed description of monitoring and evaluation plans by habitat type,
including strategy-based metrics, is in Appendix A. Where possible, monitoring efforts will be
coordinated across species and within each habitat category.
At a key stage in the program’s lifecycle, NFWF might commission a third-party evaluation to examine
the factors that have facilitated and hindered successful program implementation to inform future
decision-making and adaptively manage. In some cases these course corrections may warrant increased
investment; however, it is also possible that NFWF would reduce or eliminate support if periodic
evaluation indicates that further investments are unlikely to achieve intended outcomes or conversely if
goals are met ahead of schedule.
Nearshore Habitat. Restoration of nearshore habitat and the species that depend on it will be
monitored by the Delaware Bay Shorebird Project, state and federal wildlife agencies, the USGS Digital
Shoreline Analysis System, other site-specific monitoring, and grantees. By selecting priority sites for
living shoreline restoration, NFWF and partners can maximize monitoring and assessing restoration
benefits to shorebirds, shellfish, and other species, through a coordinated design.
� Shorebirds: To determine whether the number of red knots using Delaware Bay has increased, and if
their condition has improved, NFWF will fund an annual assessment of long and short distance red
knot populations, health (weight), and the abundance of horseshoe crab.
� Living shoreline: To assess the goal of net zero marsh loss at the restoration sites, NFWF will fund
external, remote sensing combined with site-specific assessments (e.g. high resolution measures via
real-time kinetic GPS) will be used to evaluate the ratio of net accretion versus erosion within
priority sites by grantees.
Aquatic Habitat and Water Quality. Targeted monitoring by the conservation community outside of the
business plan is underway and may provide information necessary for scaling up future restoration
efforts. Monitoring to assess response to the plan strategies will be coordinated across the water
quality program and partners and will include species level monitoring that integrates standardized
methods and emerging technologies for assessing populations, as described below and in Appendix A.
� Water quality: In coordination with the Delaware River Watershed Initiative, the Academy of
Natural Resources is leading a combination of water chemistry, instream biological sampling, and
habitat sampling. Together, they will provide a holistic picture of aquatic condition in the eight
targeted watersheds and will help (1) identify the sources of biotic impairment and (2) track changes
in water quality over time as restoration is implemented. In addition, NFWF will collect project-level
metrics on nutrient, sediment, and stormwater reductions associated with individual projects using
the WikiWatershed Toolkit (Stroud Water Research Center), integrated with the Stream Restoration
Assessment Tool (SRAT).
� Eastern brook trout: NFWF will collaborate with the Eastern Brook Trout Joint Venture partners and
potentially state agencies who manage trout resources (NY, NJ, PA) to measure baseline EBT

Delaware R iver Watersh ed - March 2017 | 20
abundance where significant restoration investment will be made and conduct annual sampling
within focal patches measuring the effective number of breeding EBT per patch (Nb). Nb is a genetic
surrogate of EBT population size that provides a whole-patch population estimate (Whiteley et al.
2014). EBT population patches must meet the portfolio criteria for resiliency (having sufficiently
large populations and intact habitats to facilitate recovery from rapid environmental change),
redundancy (saving enough different populations so that some can be lost without jeopardizing the
species), and representation (protecting/restoring EBT diversity) as defined by the Trout Unlimited
Eastern Brook Trout range-wide population analysis (NFWF-funded effort to be completed in 2017).
� Alosine species: NFWF will invest in sentinel monitoring sites in priority alosine species locations
where existing monitoring is not already in place and will utilize standardized methods (see
Appendix A) to monitor the number of spawning adults via annual run counts. In addition,
electrofishing, ichthoplankton, and/or eDNA surveys will also be used to evaluate trends in the
occurrence and extent of spawning adults to assess occupancy and use of habitat before and after
restoration efforts.
Forest Habitat. Bird monitoring will build upon existing monitoring efforts as well as initiating additional
sampling especially for control blocks. With the overall integrated forest management approach, the
diversity of the forest structure and bird diversity will be assessed by establishing bird abundance,
density, diversity and productivity baseline estimates in unmanaged and pre-treatment blocks using
point count sampling, mist netting and other techniques. Monitoring of the forest habitat response will
be addressed as a part of the research strategies to assess the overall study design; forest management
goals (acres per habitat type) can be tracked with GIS land cover data and stand maps.
Table 4. Metrics for measuring progress towards conservation goals
Nearshore Habitat Goals Metrics Baseline
(2017)
Target
(2027) Data source(s)
Shorebirds: Restore
sufficient amount and
diversity of beach
habitat to enhance,
secure and sustain
healthy populations
of red knot, other
shorebirds, and
horseshoe crabs
during breeding and
passage periods in
the spring and fall
Increase overall population
size of red knot using
Delaware Bay by 15% during
spring migration
# red knot
estimated through
ARMa model
21,128
individuals
/ARM
estimate -
47,254
individuals
24,297
individuals/
ARM
estimate -
54,342
individuals
ARM, Atlantic States
Marine Fisheries
Commission
More than 80% of red knot
maintain or exceed 180 gram
optimal threshold weight
Pre-departure body
weight (grams)
~70%
> 80%
Delaware Shorebird
Project; body weight
sampling; Project level
reporting by grantees
Increase overall availability of
high quality horseshoe crab
habitat in the Bay by 50% so
that red knot reach optimum
body weight threshold
# of miles or acre
equivalent of
restored and
undisturbed beach
TBD 4
Project level reporting by
grantees
Living shoreline:
Maintain a zero net
shoreline erosion rate
by stemming marsh
loss and protecting
beach and shoreline
habitat for red knot
and other species
through the
Protect beach habitat using
oyster breakwaters to support
increased availability of high
quality horseshoe crab
habitat
# of miles beach
restored TBD b TBD b
Project level reporting by
grantees
Stabilize salt marsh edge
habitat using ribbed mussel
and oyster living shoreline
Accretion Rate –
Erosion Rate > 0 Varies 0
USGS Digital Shoreline
Analysis System, On-site
Rapid Assessment

Delaware R iver Watersh ed - March 2017 | 21
construction of living
shorelines in priority
sites
techniques, protecting marsh
habitat for other marsh
dependent species, so that
net accretion rates will
exceed net erosion rates to
prevent marsh loss at priority
sites.
Monitoring; Project level
reporting by grantees
# of acres of marsh
habitat restored TBD b TBD b
Project level reporting by
grantees
Aquatic Habitat Goals Metrics Baseline
(2017)
Target
(2027) Data source(s)
Water quality:
Achieve clean and
sufficient water
quantity and habitat
quality to support
healthy aquatic
ecosystems and
human communities
through restoration in
targeted watersheds
Reduce polluted runoff in
eight targeted watersheds.
Lbs. of N avoided
annually
Note f
Note f
Academy of Natural
Sciences (ANS) g
ANS/DRWI
Modeling via SRAT
(Stream Reach
Assessment Tool) and
Wiki Watershed (Stroud
Water Research Center)
Lbs. of P avoided
annually
Lbs. of sediment
avoided annually
Enhance ecological
community health in eight
targeted watersheds as
measured by algae, benthic
macroinvertebrates and fish
as indicators of health.
IBIs (algae, benthic
macroinvertebrates,
fish)
Eastern brook trout:
Enhance the habitat
integrity, future
security and
connectivity of
coldwater streams to
support a robust
conservation
portfolio of EBT
populations
Increase the population size
of EBT (as measured using the
number of effective breeders
in the population) two (2)
resilient, stronghold
population patches
Increase effective
number of breeding
EBT per patch (Nb)c
relative to baseline
TBDe TBDe EBTJV
Increase the population size
of EBT (as measured using the
number of effective breeders
in the population) in three (3)
redundant, persistent
population patches
Increase effective
number of breeding
EBT per patch (Nb)c
relative to baseline
TBDe TBDe EBTJV
Alosine species:
Increase American
shad and river herring
runs through
enhanced aquatic
connectivity and
access to high quality
habitat.
Increase adult runs of
American shad and river
herring in priority rivers to
population goals that will be
established based on habitat
suitability assessment and
improved monitoring.
# of American shad
that are crossing
barriers
469c TBD d NFWF funded run counts
on priority rivers
# of river herring that
are crossing barriers 76c TBD d
NFWF funded run counts
on priority rivers
Restore access to high quality
spawning habitat by
increasing connectivity in
priority rivers through the
removal of barriers.
# of miles of stream
opened TBD d TBD d
Project level reporting by
grantees
# of acres of lake/pond
habitat opened TBD d TBD d
Project level reporting by
grantees

Delaware R iver Watersh ed - March 2017 | 22
Forest Habitat Goals Metrics Baseline
(2017)
Target
(2027) Data source(s)
Test premise that
management of one
or more 2,500- to
5,000-acre forest
blocks for improved
stand age and
structural diversity,
results in improved
habitat conditions for
forest birds and other
wildlife
Manage 15% to 20% of the
block for early successional
forest habitat (375 to 500
acres) resulting in 40 or more
golden-winged warbler
breeding territories (goal
assumes 375 acres; up to 80
breeding territories could be
achieved, based on 3 to 4
territories per 25 acres and
500 acres of habitat).
# of acres created and
managed for early
successional habitat
0
375 to 500
Project level reporting
by grantees including
GIS land cover data and
stand maps.
# of breeding
territories for golden-
winged warbler
0 45-80 h Project level reporting
by grantees.
Manage 30% to 60% of the
forest block for mature forest
habitat (750 to 1,500 acres),
resulting in 60 or more wood
thrush breeding territories
(goal assumes 750 acres; up
to 360 breeding territories
could be achieved, based on
2-6 breeding territories per 25
acres and 1,500 acres of
habitat).
# of acres created and
managed as mature
forest habitat
0 750 to
1,500
Project level reporting
by grantees including
GIS land cover data and
stand maps
# of breeding
territories for wood
thrush
0 60 – 360 i Project level reporting
by grantees
Manage 30% to 60% of the
forest block for late
successional forest habitat
(750 to 1,500 acres), resulting
in 180 or more cerulean
warbler breeding territories
(goal assumes 750 acres; up
to 480 breeding territories
could be achieved, based on 6
to 8 territories per 25 acres
and 1,500 acres of habitat)
# of acres managed as
late successional
forest habitat
0 750 to
1,500
Project level reporting
by grantees including
GIS land cover data and
stand maps
# of breeding
territories for
cerulean warbler
0 180 – 480j Project level reporting
by grantees.
a ARM – Adaptive Resource Management http://www.asmfc.org/uploads/file/2009DelawareBayARMReport.pdf b Baseline values and goals cannot be established until priority sites for living shoreline construction are identified and initial
site assessments are completed. c Baseline values are based on the number of spawning adults that have been counted successfully passing the Fairmount
Fishway on the Schuylkill River. d Baseline population estimates are not available for the majority of the watershed. Once sentinel sites are established,
baseline data will be collected and used to set a 10 year population goal for American shad and river herring. The population
goal will be established by year 3 of the business plan. e TBD: See strategy 2.6 and monitoring and performance section in Appendix A that lays out a plan to establish an EBT
population size baseline and goals for each of the patches where we plan to concentrate investment. f In development by ANS and implementation partners via Phase 2 DRWI planning process, anticipated completion Spring 2018. g As indicated in narrative (and Appendix A) the indices of biotic integrity that will be used to gauge change in biological
community condition are still being determined by the Academy of Natural Sciences. h Range tied to forest block size and based on the number of breeding males 0.37/ha (McNeil 2015). i 2 to 6 breeding territories/25 acres (Powell et al 2000 and other sources). j 6 to 8 breeding territories /25 acres (Boves et al 2013; expert opinion).

Delaware R iver Watersh ed - March 2017 | 23
Budget
The following budget shows the estimated costs to implement the activities identified in this business
plan. This budget reflects NFWF’s anticipated engagement over the business plan period of
performance; however, it is not an annual or even cumulative commitment by NFWF to invest. We
acknowledge that in many cases the activities laid out in the plan build upon efforts funded by other
organizations. This budget assumes that the current trajectory of funding by those other organizations
continues over this program’s time frame.
Table 5. Budget for Delaware River Watershed Business Plan
BUDGET CATEGORY Yrs 1-5 ($K) Yrs 6-10 ($K) Total ($K)
Strategy 1. Management and Restoration of Nearshore Habitat – Shorebirds and Living Shoreline
1.1 Increase high quality beach habitat at priority roosting and
foraging sites
1,000 900 1,900
1.2 Reduce impacts of human and wildlife disturbances of beach
habitat areas
250 250 500
1.3 Reduce incompatible management of natural resources 400 100 500
1.4 Research and monitoring for ensuring shorebird success 300 300 600
1.5 Identify priority sites for the construction of living shorelines 150 0 150
1.6 Research and monitoring for ensuring living shoreline success 1,300 300 1,600
1.7 Construct natural and hybrid living shorelines in priority areas to
protect marsh and beach habitat
900 850 1,750
Strategy 2. Aquatic Habitat and Water Quality – Water Quality/Quantity Restoration, Eastern Brook Trout, and Alosine Species
2.1 Reduce volume and impact of polluted runoff to improve water
quality, restore hydrology and upland, riparian and in-stream
habitat
4,720 4,720 9,440
2.2 Increase partner capacity for technical assistance and
engagement
1,100 1,100 2,200
2.3 Restore connectivity in streams that support eastern brook trout 660 670 1,330
2.4 See 2.1 --- --- ---
2.5 Identify and protect high quality native trout patches and unique
life history patches
300 450 750
2.6 Establish robust monitoring for native trout 150 150 300
2.7 Identify priority sites for restoration (alosine species) 200 0 200
2.8 Establish and/or improve monitoring programs (alosine species) 300 200 500
2.9 Restore access to spawning habitat by increasing connectivity in
priority rivers
1,000 870 1,870
2.10 Community outreach and education for alosine species through
citizen science and engagement.
150 100 250
Strategy 3. Forest Health – Forest Management and Birds
3.1 Manage one or more 2,500 (to 5,000) acre block for diverse
forest structure and age.
2,560 2.560 5,120
3.2, 3.3, and 3.4: See 3.1 --- --- ---
3.5 Research and monitor unmanaged and pre-treatment forest
blocks.
290 280 570
Other
Program Assessment and Evaluation 0 250 250
TOTAL BUDGET $15,730 K $14,000 K $29,780 K

Delaware R iver Watersh ed - March 2017 | 24
Literature Cited
Birds with Silviculture in Mind. 2011. Audubon Vermont and Vermont Department of Forestry.
http://vt.audubon.org/sites/g/files/amh751/f/bird-guide.pdf
Boves TJ, Buehler DA, Sheehan J, Wood PB, Rodewald AD, et al. (2013) Emulating Natural Disturbances for Declining
Late-Successional Species: A Case Study of the Consequences for Cerulean Warblers (Setophaga cerulea). PLoS ONE 8(1):
e52107. doi:10.1371/journal.pone.0052107
DePhilip M, Moberg, T. 2013. Ecosystem flow recommendations for the Delaware River basin. The Nature Conservancy.
Harrisburg, PA
Kreeger D, Bushek D, Whalen L, Moody J, and Padeletti, A. 2012. Mussel Powered Living Shorelines for Salt Marsh
Erosion Control. Presentation at 6th National Conference on Coastal and Estuarine Habitat Restoration.
McGarigal K, Deluca WV, Compton BW, Plunkett EB, and Grand J. 2016. Designing sustainable landscapes: modeling focal
species. Report to the North Atlantic Conservation Cooperative, US Fish and Wildlife Serve, Northeast Region.
McNeil, D. 2015. Gauging the Success of Timber Harvests Managed for Golden-winged Warblers (Vermivora
chrysoptera): Characteristics and Territory Density within a Wetland Reference System. Masters Thesis, Dr. J Larkin,
Chair.
Niles L, Sitters H, Dey A, and Red Knot Status Assessment Group. 2010. Red Knot Conservation Plan for the Western
Hemisphere (Calidris canutus), Version 1.1. Manomet Center for Conservation Sciences, Manomet, Massachusetts, USA.
PGC-PFBC (Pennsylvania Game Commission and Pennsylvania Fish & Boat Commission). 2015. Pennsylvania Wildlife
Action Plan, 2015-2025. C. Haffner and D. Day, editors. Pennsylvania Game Commission and Pennsylvania Fish & Boat
Commission, Harrisburg, Pennsylvania.
Powell, L, Lang, J, Conroy, M, Krementz, D. 2000. Effects of forest management on density, survival, and population
growth of wood thrushes. The Journal of wildlife management, 11-23.
USFWS. 2013. Rufa red knot background information and threats assessment supplement to: Endangered and
Threatened Wildlife and Plants; Final Threatened Status for the Rufa Red Knot (Calidris canutus rufa) [Docket No. FWS–
R5–ES–2013–0097; RIN AY17]. U.S. Fish and Wildlife Service. Northeast Region.
Whiteley AR, Hudy M, Robinson Z, Coombs JA, Nislow KH (2014) Patch-based metrics: a cost effective method for short
and long-term monitoring of EBTJV wild Brook Trout populations? In: Proceedings of the Wild Trout Symposium, Vol. XI,
pp. 170–179. West Yellowstone, Montana.
Wood, P.B., J. Sheehan, P. Keyser, D. Buehler, J. Larkin, A. Rodewald, S. Stoleson, T.B., Wigley, J. Mizel, T. Boves, G.
George, M. Bakermans, T. Beachy, A. Evans, M. McDermott, F. Newell, K. Perkins, and M. White. 2013. Management
guidelines for enhancing Cerulean Warbler breeding habitat in Appalachian hardwood forests. American Bird
Conservancy. The Plains, Virginia. 28 p
Yepsen, M., Moody, J., Schuster, E. (2016). A Framework for developing monitoring plans for coastal wetland restoration
and living shoreline projects in New Jersey. A report prepared by the New Jersey Measures and Monitoring Workgroup
of the NJ Resilient Coastlines Initiative, with support from the NOAA National Oceanic and Atmospheric Administration
(NOAA) Coastal Resilience (CRest) Grant program (NA14NOS4830006).
Golden-winged Warbler Working Group. 2013. Best Management Practices for Golden-winged Warbler Habitats in the
Appalachian Region, www.gwwa.org

Delaware R iver Watersh ed - March 2017 | 25
Appendix
Provided as separate document.