national five year development plan 2016/17 2020/21 · · 2016-05-11the united republic of...
TRANSCRIPT

KIAMBATISHO A
THE UNITED REPUBLIC OF TANZANIA
National Five Year Development Plan 2016/17 – 2020/21
“Nurturing Industrialization for Economic Transformation and Human Development”
Ministry of Finance and Planning
30 March 2016


i
TABLE OF CONTENTS
1.0 INTRODUCTION ......................................................................................................................... 1
1.1 BACKGROUND ..................................................................................................................... 1
1.2 FYDP II ORIENTATION ........................................................................................................ 1
1.3 OBJECTIVES OF FYDP II ...................................................................................................... 2
1.4 SALIENT FEATURES OF THE PLAN ....................................................................................... 2
1.5 PROCESS OF DEVELOPING FYDP II ..................................................................................... 2
1.6 STRUCTURE OF THE DOCUMENT .......................................................................................... 3
2.0 SITUATION ANALYSIS AND ASSESSMENT OF IMPLEMENTATION OF
PREDECESSOR FRAMEWORKS .............................................................................................. 4
2.1 MACROECONOMIC DEVELOPMENTS .................................................................................... 4
2.2 PRODUCTIVE SECTORS ......................................................................................................... 7
2.3 INFRASTRUCTURE DEVELOPMENT ....................................................................................... 7
2.4 IMPROVING BUSINESS ENVIRONMENT ................................................................................. 8
2.5 SOCIO-ECONOMIC DEVELOPMENT ....................................................................................... 8
2.6 GOOD GOVERNANCE AND ACCOUNTABILITY ...................................................................... 9
2.7 FINANCING STRATEGY ....................................................................................................... 10
2.8 MONITORING AND EVALUATION ....................................................................................... 10
2.9 SCIENCE, TECHNOLOGY AND INNOVATION (STI) ............................................................. 11
2.10 OVERALL ASSESSMENT ..................................................................................................... 12
2.11 KEY MESSAGES FOR STRATEGIC INTERVENTIONS ............................................................. 13
3.0 STRATEGIC REPOSITIONING FOR PLAN IMPLEMENTATION ....................................... 16
3.1 OVERVIEW ......................................................................................................................... 16
3.2 STRUCTURAL TRANSFORMATION AND SOCIAL DEVELOPMENT IN TANZANIA ................. 16
3.3 THE FUNDAMENTAL CONSIDERATIONS TO THE FYDP II ORIENTATION .......................... 20
3.4 SELECTION OF PRIORITIES ................................................................................................. 25
4.0 STRATEGIC INTERVENTIONS FOR INDUSTRIALIZATION AND SOCIAL
ENHANCEMENT ...................................................................................................................... 30
4.1 INTRODUCTION .................................................................................................................. 30
4.2 INTERVENTIONS TO FOSTER INDUSTRIALIZATION AND ECONOMIC GROWTH .................. 30
4.3 INTERVENTIONS FOR HUMAN DEVELOPMENT .................................................................. 36
4.4 ENVIRONMENT FOR DOING BUSINESS ............................................................................... 48
4.5 FLAGSHIP PROJECTS OF THE PLAN .................................................................................... 50
5.0 FINANCING STRATEGY ......................................................................................................... 52
5.1 OVERVIEW ......................................................................................................................... 52
5.2 GOVERNMENT/PUBLIC RESOURCES ................................................................................... 53
5.3 MOBILIZATION OF NON-GOVERNMENT/NON PUBLIC RESOURCES ..................................... 58
5.4 DEVELOPMENT FINANCING INSTITUTIONS ........................................................................ 60
5.5 SPECIALIZED BANKS/FINANCE INSTITUTIONS .................................................................... 61
5.6 OTHER CONSIDERED FINANCING ARRANGEMENTS .......................................................... 62
5.7 GOVERNMENT IN SUPPORTING PRIVATE SECTOR DEVELOPMENT FINANCING ................. 62
5.8 RATIONALIZING PUBLIC EXPENDITURE AND DEVELOPMENT FUNDS ............................... 62
6.0 IMPLEMENTATION STRATEGY ........................................................................................... 65
6.1 OVERVIEW ......................................................................................................................... 65
6.2 KEY CHALLENGES TO IMPLEMENTATION EFFECTIVENESS ............................................... 65
6.3 REFORMS FOR EFFECTIVE IMPLEMENTATION ................................................................... 67
6.4 INTERVENTIONS FOR STATE/GOVERNMENT EFFECTIVENESS ........................................... 70

ii
6.5 DECENTRALIZATION BY DEVOLUTION AND LOCAL ECONOMIC DEVELOPMENT (LED)
APPROACH ......................................................................................................................... 72
6.6 IMPLEMENTATION FRAMEWORK ....................................................................................... 74
7.0 MONITORING AND EVALUATION ...................................................................................... 78
7.1 OVERVIEW ......................................................................................................................... 78
7.2 MONITORING AND EVALUATION FRAMEWORK ................................................................ 78
7.3 STRATEGY FOR MONITORING AND EVALUATION ............................................................. 79
7.4 UNDERLYING ASSUMPTIONS FOR M&E STRATEGY ........................................................... 83
7.5 FYDP-II RESULTS FRAMEWORK ....................................................................................... 83
ANNEXES ............................................................................................................................................ 85
ANNEX I: SUMMARY OF RECURRING LESSONS FROM OTHER COUNTRIES
INDUSTRIALIZATION EXPERIENCE .......................................................................... 86
ANNEX II: SPECIFIC SECTOR INTERVENTIONS ................................................................ 91
ANNEX III: COSTING AND FINANCING ENVELOPE ....................................................... 178

1
1.0 INTRODUCTION
The Second Five Year Development Plan (FYDP II) 2016/17 – 2020/21 takes into account
the integration of the Five Year Development Plan (FYDP) and the National Strategy for
Growth and Reduction of Poverty (NSGRP/MKUKUTA) planning frameworks. The theme of
FYDP II “Nurturing Industrialization for Economic Transformation and Human
Development” incorporates the main focus of the two frameworks, namely growth and
transformation (FYDP) and poverty reduction (MKUKUTA). The FYDP II outlines new
interventions to enable Tanzania industrialize in a way that will transform its economy and its
society. It also outlines interventions carried over from predecessor plans, - FYDP I and
MKUKUTA that are deemed critical for the aspiration of FYDP II goals. More importantly,
and in tandem with the two predecessor Plans, FYDP II also implements Tanzania’s
Development Vision (TDV) 2025 which aspires to have Tanzania transformed into a middle
income, semi industrialized nation by 2025. The also Vision outlines five attributes to
characterize Tanzania in 2025: (i) high quality livelihoods; (ii) peace, stability and unity; (iii)
good governance and the rule of law; (iv) an educated and learning society; (v) a strong and
competitive economy.
1.1 Background
Implementation assessments of TDV 2025 conducted in 2009 and 2010 revealed a number of
risks facing achievement of the goals if strategic repositioning of implementation was not
made. The Government of Tanzania (GoT) reverted to long and medium term planning in
2011, in a bid to ensure strategic reorganization to attain TDV 2025 goals. In this regard the
Long Term Perspective Plan (LTPP) was developed and adopted in 2011 to organize and
steer efforts towards achieving aspirations of the Vision. The implementation of the LTPP
was sequenced in three five-year development plans, (FYDPs). Each of the three Plans has a
specific theme to underline its thrust and priority interventions. The first Five Year
Development Plan (FYDP I), 2011/12 - 2015/16 “Unleashing Tanzania’s Latent Growth
Potentials” focused on debottlenecking binding constraints to growth. The designated themes
for FYDP II (2016/17-2020/21 and FYDP III (2021/22 - 2025/26) were respectively
“Nurturing an Industrial” and “Realizing Competitiveness-led Export Growth”.
1.2 FYDP II Orientation
Though focus of FYDP II had already been determined within the framework of LTPP, its
contents needed equally focus on interventions pertaining to poverty reduction and improved
livelihoods, which were the predominance of the MKUKUTA framework. The Government’s
decision to merge FYDP and MKUKUTA frameworks taken in May 2015 aimed at
improving efficiency and effectiveness through organizing national resources under one
framework in order to accelerate achievement of TDV 2025 aspirations and address
challenges, which beset the parallel implementation of the two frameworks. The challenges
included the existence of many similar priorities with varying scope and emphasis, leading to
resources being spread too thinly; weak coordination and unclear division of responsibilities
in monitoring, evaluation and reporting.
It is envisaged that merging of the two Frameworks will: (i) facilitate mainstreaming poverty
reduction agenda into the core of the nation's development planning framework; (ii) improve
coordination with respect to prioritization, implementation, monitoring, evaluation and
reporting; (ii) enhance resource mobilization and utilization by articulating clear national key
result areas (NKRAs) and focusing both domestic and foreign resources on implementation
2
of national priorities; (iv) align national priorities with sector strategies through MTEFs and
the Strategic Budget Allocation System (SBAS); and (v) ensure coherence of public
expenditure with national priorities. FYDP II thus fuses together the core focuses of
MKUKUTA and FYDP in a way that ensures implementation of FYDP addresses issues
pertaining to growth and economic transformation as well as those pertaining to poverty
reduction.
1.3 Objectives of FYDP II
The Plan is built on three pillars of accelerating transformation namely, industrialization,
human development, and implementation effectiveness. Specifically, the Plan aspires to:
i. Build a base for transforming Tanzania into a semi-industrialized nation by 2025;
ii. Accelerate poverty-reducing economic growth that is broad-based and inclusive to allow
shared benefits to the majority of the people through increased productive capacities and
job creation especially for the youth and the disadvantaged groups;
iii. Improve quality of life and human wellbeing;
iv. Foster development of self-propelling domestic productive and exporting capacities;
v. Promote requisite industrial human skills, production and trade management, operations,
and quality assurance;
vi. Consolidate Tanzania’s strategic geographical location through improved environment of
doing business to position itself as a regional trade and logistic hub;
vii. Foster and strengthen plan implementation effectiveness, including prioritization,
sequencing, integration and alignment of interventions;
viii. Emphasize the role of local actors in planning and implementation, and
ix. Assimilate global and regional solidarity agreements, specifically SDGs with the aim of
mainstreaming them into the national development planning and implementation
frameworks.
1.4 Salient Features of the Plan
i. The Plan has the following distinct features:
ii. Some of the interventions are packaged and aligned along development corridors, zoning
and clustering to provide investors with economies of conglomeration. Coordination and
sequencing of implementation is emphasized to spur the required synergies,
complementarities, and impacts.
iii. The Plan embodies a “business unusual” approach not only for fostering implementation
effectiveness but also for embracing strategic partnership with the private sector,
facilitating its development and competitiveness, and creation of conducive environment
for its operations to thrive.
iv. The Plan identifies and seeks to entrench the necessary policy and institutional reforms
required for enabling its implementation.
1.5 Process of developing FYDP II
The Government reviewed implementation of FYDP I and NSGRP II in order to assess
progress made visa-a-vise the set objectives and targets and to identify major challenges and
their respective remedies that could inform formulation of FYDP II. Past industrialization
efforts and strategies were also reviewed to ensure that useful lessons are carried forward,
past mistakes are avoided, and new efforts and socioeconomic dynamics are put in a proper
perspective.

3
Development of the Plan also benefitted from rich experiences and recommendations drawn
from other change processes nationally, regionally and globally. These include National
Constitutional Review, consultations on the Post 2015 Development Agenda; tripartite
process for EAC, SADC and COMESA; etc. There were also other internal consultations and
peer reviews at various stages to ensure shared understanding by key stakeholders at all
stages and to enrich the substance of the Plan.
The consultations were done at three stages: first, seeking opinions and inputs from targeted
stakeholders (e.g. industrial and business owners and practitioners, high level decision
makers in government and politicians; as well as representatives from academia, research
institutions and the civil society. Second, consultations were done for building consensus on
the priority areas and interventions and to validate the content. Third, consultations were
undertaken to facilitate and obtain approval of the Plan. These involved other key
stakeholders including Parliamentarians. In all the stages of consultations, broader
representation was observed to ensure that the Plan benefits from inputs of all levels of the
society and balance the varying interests. Thirdly, checks of rationale, relevance and
pragmatism of the proposed interventions for FYDP II were ensured through a robust
approval process of the Government and Parliament.
The Plan has also benefited from analytical work, which highlighted the pre-requisites for
nurturing and leap-frogging to a semi-industrialized economy given current and future
conditions both locally and globally. The analytical work guided prioritization of choices and
interventions for their implementation.
1.6 Structure of the document
FYDP II is organized as follows. The introductory first Chapter is followed by presentation
of situational analysis and assessment of FYDP I and MKUKUTA II, drawing challenges,
lessons to carry forward and prospects to take advantage of in FYDP II are outlined. The
third Chapter proposes strategic repositioning that is needed for FYDP II implementation,
clearly outlining the criteria used for selection of the priority areas and interventions. The
fourth Chapter outlines the strategies for nurturing an industrial economy and achieving the
desired human development milestones.
The fifth Chapter identifies the potential sources of and strategies for financing the Plan. It is
followed by chapter six, which deals with implementation strategies for the Plan, suggesting
reforms to be undertaken to ensure favorable conditions for economic growth and
transformation; the requisite institutional arrangements for implementation as well the roles
and responsibilities of various institutions and stakeholders. The seventh Chapter presents the
Plan’s monitoring and evaluation (M&E) strategy and framework; including the main
objectives of the envisaged FYDP II (M&E) framework, institutional arrangements, indicator
framework, reporting and dialogues structure and M&E Products linked to FYDP II
implementation.

4
2.0 SITUATION ANALYSIS AND ASSESSMENT OF
IMPLEMENTATION OF PREDECESSOR FRAMEWORKS
This chapter presents socio-economic and governance situations in Tanzania. It also
highlights results from the assessment of FYDP I and MKUKUTA II and brings together
insights on achievements and challenges that informed the discourse for FYDP II1.
2.1 Macroeconomic developments
During FYDP I and MKUKUTA II implementation, Tanzanian economy followed the same
positive trajectory as in the pre-FYDP I/MKUKUTA II years, growing at an average of 7
percent per annum. Encouraging developments have been noted during implementation of the
ending Plan. The current per capita income of TZS 1,997,139.19 in 2015 or US$ xxxxxx2 up
from US$ 749.3 (2010) implies that Tanzania is on the verge of crossing the low middle
income country threshold of per capita income of US$1,045, though far from meeting the
target of US$ 3,000 by 2025. Despite outperforming many other developing and
industrialized countries, the growth rate was lower than the targeted rate of 8-10 percent
deemed necessary to eradicate absolute poverty and to place the country on a rightful path to
realizing the national objective of raising per capita income to US$ 3,000 by 2025.One of the
reasons for missing the target is weak implementation of strategic projects in power sector,
railway, and agriculture, as shall be discussed under respected sector sections. This weakness
partly is explained by slow pace in decision-making within Government. Efforts need to be
scaled up to diversify the sources of growth, to include the sectors that employ the majority
of the poor.
The five fastest growing sectors over this period have been information and communication,
finance and insurance, wholesale and retail trade, and manufacturing (Figure 1). The
agriculture sector lagged behind, growing at only 3.4 percent (2014) from 2.7 (2010), far
below the FYDP I target of 6 percent. The economy is transforming as evidenced by
increasing employment and GDP shares of services and industry with a corresponding
declining GDP share of the agriculture sector as indicated in Figure 2.1-2.4).
1 Annex A2 to this Plan presents detailed situation analysis. Comprehensive reviews of the FYDP I and MKUKUTA II are separately presented in their respective implementation reports. 2the indicative exchange rate provided by BOT (TZS 2,227 per USD)

5
On average, the macroeconomic environment remained stable. However, signs of
macroeconomic volatility have started to be felt with respect to value of domestic currency,
by the end of June 2015, the national debt stock was USS$ 19.10 billion equivalent to 34.7
percent of GDP. It represented a 73 percent increase from the US$ 10.96 billion recorded in
March 2011. Since 2013, with prudent monetary policy, a favorable food situation and
declining fuel prices have sustained the inflation rate at single digit. On the contrary to the
Tanzania shilling depreciated rapidly, over 2013- 2015. This was linked mainly to the
appreciation of the US dollar in international financial markets, decline in aid inflows,
increasing costs of imports and rising import bill (especially, importation of capital goods).
This led Tanzania to gain export competitiveness as the shilling depreciated against
currencies of major trading partners.
Figure 2.1: Average growth rates over the
FYDP I period
Figure 2.2: Increasing GDP share of
industry and construction: 2005-2015
Figure 2.3: Increasing GDP share of services
sector 2005-2015
Figure 2.4: Declining GDP share of
agriculture 2005-2015
6
Fiscal performance continued to experience “stresses” due to faster rates of increasing
expenditure compared to domestic resources mobilization; though revenue collection
generally increased with domestic annual revenue collections, including local governments'
own sources reaching sh. 10,957,765 billion, equivalent to 86.7 percent of the targeted sh.
12,636.5 billion; up from sh. 5,578 billion in 2010/11. As such, the revenue to GDP ratio
increased modestly from 11.6 percent in 2010/11 to 12.4 percent in 2014/15. Despite such
progress, the ratio was well below the FYDP I target of 14.4 percent, and below that of
neighboring countries, Kenya (17.7 percent) and Mozambique (22.4 percent).
Most of the fiscal policy challenges faced relate to budget credibility (unrealistic resource
envelop and expenditure plans, accumulation of budget arrears, weak budget control), thus
calling for further reforms of Public Finance Management; mismatch between approved
budgets and expenditure outturns, misuse of public finances as frequently revealed by reports
of the Controller and Auditor General (CAG), weak enforcement of procurement and
financial regulations, and inadequate financial allocations to development budget. Other
challenges include low mobilization of LGAs own revenue and unsecured full funding for
priority investments and limited private sector funding.
Investment is a primary determinant of productivity growth and economic transformation.
The average investment rate measured by the gross capital formation as a ratio of GDP stands
at 28.5 percent, much higher than the 21.4 percent in Kenya, but less than the 29.2 percent in
Uganda. It made a significant surge from around 13 percent recorded in the early 2000.
Despite performing better than comparator regional neighbors, Tanzania is lagging behind the
required rates of investment for economic transformation. Malaysia, for example, invested
almost 40 percent of its GDP pre-crisis period. Vietnam seems to be following the same path.
Nevertheless, it is encouraging that Tanzania has remained a desirable destination for Foreign
Direct Investment (FDI). The value of FDI has reached US$ 2.14 billion in 2014 from US$
936 million in 2005. The facilitating role of the Tanzania Investment Centre (TIC) as a one-
stop point for investors played a pivotal role. However, other EAC members are increasingly
competing with Tanzania for FDI flowing to the region. Moreover, FDI to other EAC
members recorded an annual average growth rate of 64 percent between 2010 - 2014
compared to Tanzania’s 12 percent. Sustaining high level of FDIs will not only depend on
investment opportunities but largely on conducive environment in doing business and
investment relative to its competing countries. There are some concerns on the quality of
some of the FDIs and the tendency for most of the FDI targeting service and extractive
activities, which offer limited employment opportunities and insignificant linkages to the rest
of the economy.
The investment field in Tanzania is characterized by two main challenges, namely; (i)
suboptimal investment and disparities between beneficiary sectors. Primary causes for this
challenge include: limited promotion of alternative opportunities, weak investment climate
(bureaucracy, and multiplicity of regulations), disparities in quality of infrastructure between
regions, regional competition for FDI, and weak institutional capacity to accelerate reforms
(ii) Dormant assets (reference is made to assets (industries and land) remaining idle. Primary
causes for this challenge include: Weak enforcement of investment contracts, weak business
environment, lack of finances and technical knowhow, reluctance of banks to accept idle
assets as collaterals, weak market conditions (quality standards, supply chains), weak
supportive facilities (insurance, financial, marketing and technology), and unfavorable
international trading relations.

7
2.2 Productive sectors
Agriculture: Agriculture supports the livelihood for the majority of Tanzanians; yet remains
underdeveloped and generally subject to the whims of nature. At present, the agricultural
sector provides about 70 percent of employment, 23 percent of the GDP, 30 percent of
exports and 65 percent of inputs to the industrial sector. About 50 percent of all households
keep livestock. Most of the agriculture exports have continued to be in raw, mainly due to
weak agro-processing industrial base. Most of the privatized key agro-processing industries,
e.g. leather industries, have not performed per expectation, resulting in continued export of
raw produces.
Tourism: From 2012, the sector of tourism has been the leading sector in terms of foreign
exchange earnings.
Manufacturing: The share of manufacturing in the GDP remained relatively low, at 7.3
percent, in 2014, with food and beverages accounting for more than 40 percent of the
manufacturing output. Other products dominating the manufacturing sector in Tanzania
include furniture, rubber and plastic, and non-metallic mineral products. The sector is steadily
moving towards product specialization, such as products that are inputs to other processes
(i.e., intermediate technologies relating to machinery, electronics and garments). The share
of the manufacturing sector in total exports increased from 17 percent in 2012 to 23 percent
in 2014 which is above the FYDP I target of 19.1 percent by 2015. The growth is attributable
to domestic firms taking advantage of the expanding regional markets, particularly the EAC
and SADC trading blocks. The share of manufacturing in total employment also rose from
2.6 percent in 2010 to 3.1 percent in 2014. Manufacturing production also doubled in real
terms between 2005 and 2014.However, low productivity, weak market conditions (quality
standards, supply chains), inadequate finances, unfavorable international trading relations,
low usage of advanced and modern technologies, challenging business environment, dormant
assets and sub-optimal sectorial linkages have remained the long standing challenges facing
this sector.
2.3 Infrastructure development
During implementation of FYDP I significant investments were made in infrastructure assets.
Currently, with an exception of Katavi to Tabora and Kigoma, and Manyara to Tanga, all
regional headquarters are connected to each other by tarmac roads. However, infrastructure
gaps persist, with the quality and quantity aspects lagging behind comparator countries. The
country was ranked 102nd in the2015 World Economic Forum’s (WEF) global
competitiveness ratings among 140 countries, far behind Kenya (64th) and Ghana (79th). The
length of the road network (district, urban and feeder roads) is estimated at 143,279 km,
comprising of 9,781 km (paved) and 133,499 (unpaved). Because of the deteriorating railway
conditions, most shippers have switched from rail to road, damaging the road network and
ultimately raising road maintenance costs. In recent years, the sub-sector has been exposed to
management inefficiencies, weak oversight, and incidences of over commitment beyond
available resources. Horrid traffic jams and regional disparities in the distribution of good
road infrastructure are the other emerging concerns.
Limited investment in railway infrastructure has seen the railway network, which covers 14
out of the 26 regions, deteriorating overtime. However, notable progress was made in
improving operational efficiency of ports, for instance, by extending operations of the Dar es
Salaam port from the previous 8 hours to 24 hours. The handling capacity also improved

8
from 9.9 million tons (2011/12) to 14.6 tons (2014/15). However, these developments remain
insufficient to support economic transformation and industrialization. Remaining challenging
areas include, management and operations inefficiencies, inadequate infrastructure, which
constrained competitiveness of ports in Tanzania relative to ports in neighboring countries.
Overall, the absence of intermodal transport system remains an impediment to economic
transformation. The air and marine time transport which have important roles in accelerating
growth and enhancing economic transformation face similar challenges. To revive ATCL,
new investment will be needed to address inadequate facilities and weaknesses in airport
services, which need to meet or even exceed domestic and international standards.
Energy production and distribution facilities have been at the center of public infrastructure
development program. The major sources of electricity production in Tanzania are
increasingly being diversified, in particular natural gas, which currently account for 34
percent of electricity production. Progress has been made in generation capacity from
900MW (2010) to 1,246.24MW (June 2015), which is some progress equivalent to 44.8
percent of the target of 2,780MW by 2015. Despite missing the target, the completion of
production plants in Dar es Salaam will narrow the gap between supply capacity and demand.
Key challenges characterizing the energy sector include low access, to both urban and rural
population, and high costs of power production, distribution and transmission. It worth
highlighting that over 40 years of Government monopoly has resulted into complete absence
of competition in electricity supply, overreliance on Hydro Electric Power (HEP),
underinvestment, limited diversification of energy resources and weak efforts to expand
customer base and optimally serving clients. Moreover, inefficiencies of TANESCO’s
operations and the expensive emergency power production contracts have further constrained
the sector’s ability to accelerate industrialization and economic transformation.
2.4 Improving business environment
A conducive investment climate is underpinned by effective political, economic and social
policies favoring investors seeking to take advantage of the vast and, in many instances,
untapped investment opportunities. Major reforms have been implemented towards
improving the business environment.
However, progress has been slow in other dimensions of ease of doing business and Tanzania
has missed the target set of ending FYDP I among the top 100 countries in the world in doing
business environment rakings.According to the World Bank Report - Doing Business- as at
June, 2014 Tanzania was ranked 145th out of 189 countries. Before that, Tanzania stood at
136th and 128th positions in 2013 and 2011 respectively. The country has only been able to
achieve the target set in the FYDP I of being among the top 100 countries in enforcing
contracts (45). The worst positions for Tanzania in 2014 was in dealing with construction
permits (169) and paying taxes (148). The only improvement that Tanzania made between
2013 and 2014 was trading across borders. As such, the private sector faces difficulties in in
dealing with construction permits, and paying taxes, trading across borders. Policy,
institutional constraints, energy generation, shortage of skills, cumbersome bureaucracy that
limits access to land for industrial purposes still imped the growth of the private sector.
2.5 Socio-economic development
The most recent Household Budget Survey (HBS) confirms that poverty is becoming more
responsive to economic growth. The basic poverty has declined substantially from 34.4
percent (2007) to 28.2 percent (2012) and extreme poverty from 11.7 per cent to 9.7 percent.
It is the first major decline in poverty in twenty years, and consequently, raising the Human

9
Development Index (HDI) score for Tanzania from 0.466 (2011) to 0.521 (2014). Human
Development outcomes such as education, health, water and nutrition improved, but overall
levels continue to remain low. The country has registered sharp increases in pupil-teacher
ratio, pupil-textbook ratio, gender parity and enrolment in primary and secondary schools.
Infant mortality, under-5 mortality and the maternal mortality rates have all been on a
declining trend. However, it is only the under-5 mortality rate whose decline met and
surpassed the MKUKUTA II’s target3. The decline is linked to the improvements in health
services, including extensive coverage of under-five immunization, vitamin-A supplements,
use of insecticide treated bed nets and advanced malaria drugs.
Maternal mortality rate also declined from 578 per 100,000 live births (2004) to 454 deaths
per 100,000 (2013). However, the rate remains far away from the MKUKUTA II’s target of
265 deaths per 100,000 live births. Access to improved water in rural areas has also increased
substantially, from 40 percent (2013) to 67 percent (June 2015). However, large disparities
persist in access to improved water and sanitation facilities between urban (water: 83.9
percent, sanitation: 71.9 percent) and rural (water: 44.1 percent, sanitation: 15 percent), as
well as widening inequities between the rich and poor, regions and LGAs. Inadequate
financial allocations and human resources remain the primary challenges affecting further
advanced in water, health and education. Other challenges include school dropouts, mismatch
between quality and qualifications of graduates and needs of the labor market, households’
and lack of understanding the value of education. Disparities and limited access between
regions and socio-economic groups, poor quality of medical services, inadequate qualified
workers, and weak functioning rural health systems are primary impediments to better health
outcomes. Low access to safe water sources and improved sanitation is on the account of
dilapidated infrastructure, weak policy and institutional arrangement for sanitation, limited
coordination between different entities, and climate change.
The recent mega trends in population growth, urbanization and climate change risk derailing
some of the gains. The population of Tanzania is growing at 2.7 percent annum, which is
more than twice the global average (1.2 percent) and the average in Africa (2.5 percent). The
population of Tanzania is therefore expected to double in 26 years. Nevertheless,
urbanization is accelerating at an annual rate of 5.2 percent, more than twice the world
average (2.1 percent) and higher than the average for Africa (3.5 percent). Dar es Salaam is
growing at 5.6 percent and the city is one the fastest growing cities in Africa. Urbanization is
already putting intense pressure on basic services and urban infrastructure at a time when
emerging cities still lack the resources and institutions to provide citizens with access to
productive jobs, housing, and basic services. Traffic jam in the large urban areas, particularly,
the capital city of Dar es Salaam is getting worse as it takes over 3 and 2.5 hours round trip
by public and private transports; the City is increasingly scattering.
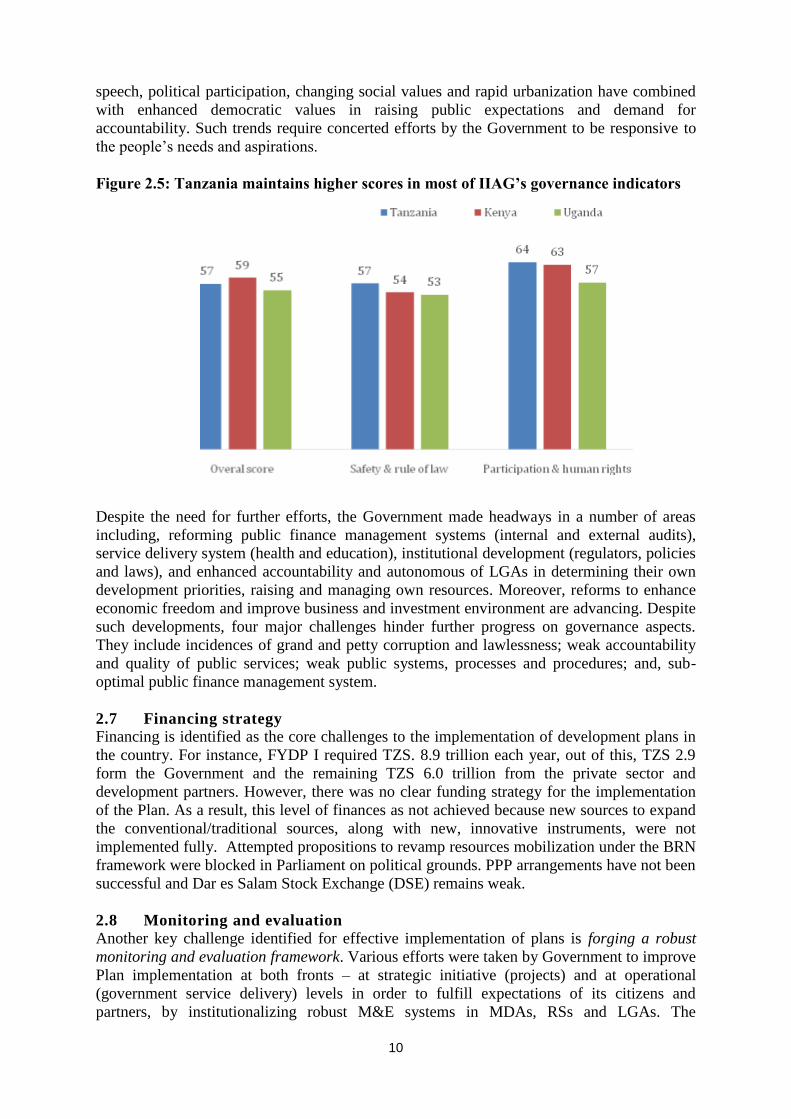
2.6 Good governance and accountability
The Government has upheld the spirit of democratic principles as evidenced by the past four
competitive, free and fair, and peaceful multiparty elections. This trend has been well
acknowledged by global governance indices. The country is ranked 15 out of 52 countries in
the Mo Ibrahim Index of African Governance (IIAG) with an overall score of 56.7 (out of
100) in 2014, which is higher than African average of 50.1, and also higher than the East
Africa regional average of 44.3 (Figure 2.5). Over the past decade, increasing freedom of
3World Bank’s 2015 World Development Indicators (WDI). Under5- mortality rate currently stands at 487 deaths per 1,000 per children, a decline from 106 in 2003.
10
speech, political participation, changing social values and rapid urbanization have combined
with enhanced democratic values in raising public expectations and demand for
accountability. Such trends require concerted efforts by the Government to be responsive to
the people’s needs and aspirations.
Figure 2.5: Tanzania maintains higher scores in most of IIAG’s governance indicators
Despite the need for further efforts, the Government made headways in a number of areas
including, reforming public finance management systems (internal and external audits),
service delivery system (health and education), institutional development (regulators, policies
and laws), and enhanced accountability and autonomous of LGAs in determining their own
development priorities, raising and managing own resources. Moreover, reforms to enhance
economic freedom and improve business and investment environment are advancing. Despite
such developments, four major challenges hinder further progress on governance aspects.
They include incidences of grand and petty corruption and lawlessness; weak accountability
and quality of public services; weak public systems, processes and procedures; and, sub-
optimal public finance management system.
2.7 Financing strategy
Financing is identified as the core challenges to the implementation of development plans in
the country. For instance, FYDP I required TZS. 8.9 trillion each year, out of this, TZS 2.9
form the Government and the remaining TZS 6.0 trillion from the private sector and
development partners. However, there was no clear funding strategy for the implementation
of the Plan. As a result, this level of finances as not achieved because new sources to expand
the conventional/traditional sources, along with new, innovative instruments, were not
implemented fully. Attempted propositions to revamp resources mobilization under the BRN
framework were blocked in Parliament on political grounds. PPP arrangements have not been
successful and Dar es Salam Stock Exchange (DSE) remains weak.
2.8 Monitoring and evaluation
Another key challenge identified for effective implementation of plans is forging a robust
monitoring and evaluation framework. Various efforts were taken by Government to improve
Plan implementation at both fronts – at strategic initiative (projects) and at operational
(government service delivery) levels in order to fulfill expectations of its citizens and
partners, by institutionalizing robust M&E systems in MDAs, RSs and LGAs. The

11
implementation of NSGRP II was monitored through the MKUKUTA Monitoring Master
Plan, through a set of indicators; some of which were tracked annually and others
periodically. The FYDP initiated the Big Results Now (BRN) as its tool for M&E,
particularly for tracking implementation of key result areas and reforms. BRN was inspired
by Malaysia’s Big Fast Results approach. The methodology is premised on the concept that,
by implementing key innovations at critical points in the way Government operates, the
existing system can be propelled to deliver even more effectively and efficiently. Delivery is
monitored through the identified National Key Result Areas (NKRAs), concrete actions,
milestones and indicators; clearly and carefully identified through a robust lab (thinking and
consensus building) process.
Three-year implementation plans were developed in relation to these, with implementation
beginning in July 2013. In 2014 a further 6 NKRAs were selected under the chapeau of
Improving the Business Environment. These are (i) access to land and security of tenure, (ii)
contract enforcement, (iii) curbing corruption, (iv) labour laws and skillsets, (v) realigning
regulations and institutions, and (vi) multiplicity of taxes, charges and levies. Healthcare
became the thirteenth NKRA in 2015. Implementation of all these will begin on 1 July 2015.
Implementation in the first six NKRAs started in July 2013. In the two years since BRN was
introduced, we have seen impressive results in these NKRAs, demonstrating that the BRN
methodology works.
M&E in general and that of BRN face several challenges, namely prioritization has remained
weak, including addition of new NKRAs while others have not been implemented effectively.
There was under-disbursement of the funds even to selected NKRAs; lack of ring-fencing of
the selected priority. Implementation effectiveness requires results of the M&E to be
associated with rewards and penalties. However, the existing system seems to be reluctant to
take this direction.
2.9 Science, Technology and Innovation (STI)
STI is an important enabler in economic and social development as it supports production of
material goods and services. Tanzania has resolved to set aside 1 percent of its GDP for STI
related activities annually exclusive of private spending for the same. However, the
implementation of this target has been dismal as the Government expenditure on R&D (as a
percentage of GDP) stands only at 0.4 percent. Besides finances, Tanzania has low usage of
advanced and modern technologies, primarily due to high costs of sourcing and updating
rights to modern technology, restrictive patent rights, and limited knowledge on existing
technologies. There is also a limited contribution of the private sector to R&D, mainly due to
weak incentives to invest in R&D, ignorance on the financial and economic advantages of
adopting new technologies, and weak multi-stakeholder platforms and partnerships. Another
important dimension of technology is information and communication (ICT). This is now
become one of the critical enabler of socioeconomic development and transformation. As to
provide the basis for advances in the use of ITC, Tanzania has completed the National ICT
Infrastructure Backbone Project, by laying 7,560 kilometers of Optic Fibre Cable (OFC)
Backbone covering 24 regions of Tanzania Mainland. The OFC provides basis for scaling up
the broadband access connectivity and efficient services and regional connectivity to provide
40 percent of the communications services of the land-locked countries. Connectivity to
submarine cables (EASSy & SEACOM) and cross-border connectivity with neighboring
countries namely Kenya, Uganda, Rwanda, Malawi, Burundi and Zambia has been
successfully implemented. However, limited education levels and human resources to adopt,
manage and operate new technologies, weak monitoring of quality standards of hardware and

12
software, low awareness and usage of open-source software are among the challenges facing
the sector.
2.10 Overall Assessment
Table 2.1 summarizes the progress made towards the national targets for 2015/16. During the
assessment in December 2015, overall FYDP I performance was 50. Given the increase in
flow of funds to strategic project since the 5thPhase Government, FYDP performance is
expected to reach 60 percent by June 2016.The growth rate so far attained is lower than the
targeted rate of 8-10 percent deemed necessary to eradicate absolute poverty and to put the
country on a rightful path to realizing objectives of TDV 2025 as illustrated in Figure 2.6.
Sequel to the challenge of realizing the projected per capita income of US$ 3,000 by 2025, it
suggests that economic growth has to be maintained to a rate of at least 8 per cent per annum
up to 2020 and beyond. This can only be achieved with a shift to a higher value production
frontier than the current one that is dominated with primary production. While modest, the
achievements under the preceding plans Tanzania on a reasonable footing to start pursuing
industrialization which will facilitate the much needed value addition of the abundance of
primary goods that the country is endowed with.,
Table 2.1: FYDP I progress against targets
Target area FYDP I target Progress Comment
Average annual
growth
8 percent 6.7% over 2011-2014 Below target
Global rank of
Tanzania in World
Bank’s doing business
surveys
Decreasing below 100 131 in 2015 and 130 in
2014
Below Target
Manufacturing sector
GDP contribution
Increasing sector contribution
to 12.9 percent by 2015/16
Constant at 7percent
over 2007-2013
(rebased data) 9 percent
old data
Below target
Manufacturing sector
employment
Growing from 120,000 people
2010 to over 221,000 people
by 2015/16
615,323 in 2014 (ILFS) Well above
target
Tertiary enrolment
rate
Increased from 1.5 to 4percent 4 percent in 2012 On target
Manufacturing share
in total country's
export
Accounting for 19.1 percent
by 2015/16
25.1% in 2013 Above target
Mineral sector in
GDP
3.7 percent 4.3 percent in 2013 Above target
Fisheries Sector in
GDP
5% in 2015/16 2.4 percent in 2013 Below target
Increase share of
Tanzania in world
trade
From current 0.022 percent to
0.1 percent by 2015/16
0.016 percent in 2014 Below target
Increase contribution
of trade to GDP
From current 16 to 20 percent
by 2015/16
19 percent
(exports/GDP) in 2014
Approximately
right
Source: FYDP I and MKUKUTA II Implementation Reviews, 2016
It is with this understanding that FYDP II has put more emphasis on industrialization and
openness to the regional and global trade than before. This will require concerted efforts to
build and organize the domestic productive capacities in a more orderly manner while also
ensuring availability of a conducive environment for doing business and investment. The

13
envisaged industrialization, among others, has to be based on the country’s comparative
advantages, upgrading and innovativeness with a focus to integrating into the regional and
global value chains to consolidate its trade share. With the current levels of income in the
country and the region, Tanzania is now better positioned to steer for export-led
industrialization than before; but at the same time, with careful selection of industrial path for
import substitution.
Figure 2.6. Required Change in Economic Growth Trajectory for MIC Target
NB: (i) MIC= Middle Income Country
(ii) LIC= Low Income Country
2.11 Key messages for strategic interventions
The following messages can be sifted from the analysis in this Chapter, for onward
incorporation in strategic choices and interventions.
Message 1: Macroeconomic performance has been good but volatility is an emerging
concern
Economic growth is gradually becoming pro-poor, further emphasize that for poverty to be
further reduced, the FYDP II needs to sustain high rates of economic expansion. Therefore, a
number of growth constraints outlined in the situational analysis need to be addressed for the
country to attain its development goals.
Despite years of a renowned track record in maintaining macroeconomic stability, there are,
emerging signs of volatility. Such volatilities range from prolonged periods of instability in
inflations rates, domestic revenue missing out on established targets, rising national debt, to
volatilities in public expenditure and the resultant budget deficit. These trends class for FYDP
The Tanzania’s Vision to attain MIC status by 2025 remains; however, must be a shift to higher Value and Faster Growth Path
Industrial

14
II to strengthen procedures and mechanisms, accountability and institutions responsible for
the management of fiscal policy.
The private sector remains as the engine of growth, poverty reduction and the driver of
economic transformation. The three roles cannot be effectively delivered if the prevailing
business and investment environments remain unfriendly. In addition, it is necessary for the
policy interventions to ensure smallholder farmers, micro and small businesses are all part of
the growth process.
Message 2: Achievements in social sectors have been modest but quality and
sustainability concerns are mounting
Disparities in growth rates between service and less poverty reducing sectors
(communication, finance and construction) and sectors with high potential for poverty
reduction but lagging behind (agriculture and manufacturing) calls for (i) rekindling growth
in sectors where the poor generate their livelihoods, (ii) pursuing policy initiatives that would
raise the contribution of the service sector on poverty reduction, and; (iii) industrialize
through regional trade.
Commendable achievements have been made in the areas of social service delivery and
outcomes. However, population pressure, weak fiscal policy, and rapid urbanization risk
derailing some of gains. In the backdrop of huge demand for prioritizing quality delivery of
education and health services, rapid population growth by itself calls for further investments
in social infrastructure including classrooms and health centers, as well as facilities such as
teaching equipment, textbooks etc. Rapid population growth has resulted in un-managed
urbanization and has implications on the environment and stresses the natural resources.
Message 3: Infrastructure holds the key to transformation
Significant investments have been made in both hard and soft infrastructure during
implementation of FYDP I. However, infrastructure gaps still exist in power and transport
sectors to satisfy needs of growing demand for FYDP II.
Message 4: Decentralization and Local Economic Development
Effective service delivery requires efficient and decentralized system to respond to local
needs in a timely manner. Likewise, decentralization is key to ensure that growth is broad-
based and includes all communities and large part of the country’s population (including
small holders, small and micro businesses etc.). FYDP II must strategically approach and deal
with persistent spatial disparities in development through decentralization based on the
principle of subsidiarity, which empower the local communities and LGAs to sustainably
exploit their environment and natural resources, and better protection for vulnerable groups.
Message 5: Prioritization of resource allocation to achieve maximum impact
The Government was overambitious during the preceding FYDP I and MKUKUTA II,
resulting in weak resource prioritization and allocation. Thus, focusing on few high return
investments, effective policy coordination and implementation, and a robust Monitoring and
Evaluation (M&E) system, are necessary to attain the intended development policy outcomes.
Message 6: M&E systems are strong but need further reforms for accommodating
FYDP II needs
Reforms have been implemented in the area of M&E with the objective of ensuring a robust
M&E framework. A number of challenges however remain for tracking key results. A more
robust M&E system will be needed to suit FYDP II M&E needs.

15
Message 7: Major impediments to human development, economic transformation and
industrialization They include (i) inadequate financial, human and technical resources (ii) weak business and
investment environment (iii) low productivity (iv) weak and inadequate infrastructure
facilities (v) limited linkages between economic sectors (vi) limited macro-micro linkages
(vii) weak implementation of sectorial and national development plans and the subsequent
activities. The effects of climate change reinforce some of these impediments, e.g.
distractions of infrastructure, loss of productivity in agriculture, and disease outbreaks.
Message 8: Overall - path to TDV 2025 is still filled with hurdles that need fast leveling
Over the period of FYDP I and MKUKUTA II implementation considerable success has been
achieved that need concerted efforts in areas of boosting sustainable pro-poor growth.

16
3.0 STRATEGIC REPOSITIONING FOR PLAN IMPLEMENTATION
3.1 Overview
This Chapter presents the imperative to reposition the framework for implementation in light
of FYDP II orientation (industrialization and human development focus) in the context of
domestic, regional and global dynamics. Economic transformation and human development
are not new issues in the Tanzania’s development agenda. They have been central in most the
previous plans. The critical question therefore is why and what is different this time. To
answer this question, the Chapter begins with a brief account of early attempts at
transformation of both industrial and social development in Tanzania, with a view of
identifying lessons to be considered to inform the chosen path of FYDP II. It also attempts to
assess the terrain in which the late industrializing countries are faced with taking into
consideration the increased move for trade liberalization and economic globalization. It
enlists also experiences from some comparator countries and ends by delineating the key
criteria for selecting priority areas for both industrial and social interventions.
3.2 Structural Transformation and Social Development in Tanzania
3.2.1 Record of Industrial Transformation and Current Status
The need to step up industrialization has remained high in the Tanzania’s development
agenda since early days of its independence. The approach however has not been stable,
being much influenced with the changes in the socioeconomic management landscape. The
early phase of industrialization in Tanzania (1961-1966) followed the colonial approach,
focusing on industrial promotion through Import Substitution industrialization strategy
(largely simple processing of consumer goods for the elite urban consumers). Between 1961-
the Arusha Declaration in 1967, there were 186 industries, most, of which were labor
intensive providing 200,000 employments and contributing 4 percent to GDP. The industries
include Coca-Cola, East African Breweries, Tanganyika Packers, British American Tobacco,
Metal Box all privately owned. Consequently industrial production was unbalanced largely
being import net and of very limited scales. In terms of ownership structure industry was
foreign dominated. Table 2.2 shows development of the industrial sector.
Table 3.1: Number of industries in Tanzania Period
Pre-1961 1961-
1970
1971-
1980
1981-
1990
1991-
1995
1996-
2000
2001-
2005
2006-
2010
2011-
2013
Number of
industries 61 125 411 1,188 1,176 3,430 5,153 12,849 50,656
Source: NBS, 2016
The second phase of industrialization had promotion of local ownership of the tertiary sectors
of the economy at a core. Declaration of policy of socialism and self reliance as enshrined in
the Arusha Declaration of 1967 led to championing of industrialization through state created
entities. After the Arusha declaration in 1961, state-led import substitution industrialization
started with the nationalization of existing industries and the establishment of new industries
under parastatal organizations. During the period, foreign investors participated mainly
through management agreements and as suppliers of machinery and equipment for industries.
The period also saw an increased role of the government in setting, implementing and
monitoring monetary and exchange rate policies. The National Development Corporation
was reorganized and further strengthened as a special purpose vehicle to drive

17
implementation of the Declaration in regard to industrialization and ensuring local ownership.
In earnest industrialization followed the same strategy of import substitution.
It was not until 1975 that a shift of paradigm towards structural change was articulated as a
long agenda in Basic Industry Strategy (BIS, 1975-1995). The BIS was intended to be a 20
year plan (1975-95), being implemented in four phased five year plans. This strategy
emphasized industrial activities that could transform the economy so that most of the
industrial demand would be met primarily from domestic sources using obtaining resources
in the country. Industrial goods were to meet basic needs of the population and intermediate
and capital goods were to be produced to meet domestic demand. Moreover, a number of
industrial support institutions were established and resources allocation for research and
development.
However, by early 1980s currency overvaluation was depressing the export sector and
shortage of foreign exchange and imported intermediate inputs was adversely affecting
industrial performance. Furthermore, the control measures introduced by the government,
including import licensing, exchange controls and price controls, created a business
environment that did not facilitate the industrial sector to build capabilities to compete.
Following the persistence of the economic crisis, Tanzania to adopt the policy package under
structural adjustment programmes in 1986 with the objective of restoring economic stability
and accelerating structural reforms in order to create sustainable position of country’s balance
of payment, correcting budget deficits, cutting down inflation, reforming microeconomic
framework of policies and increasing incentives to agricultural producers. The economic
reforms and industrial restructuring assumed that enterprise level inefficiencies are a
reflection of distorted or inappropriate macroeconomic policies. In the same vain, trade
liberalisation was adopted to force enterprises to compete with imports. The state controlled
industrialisation was gradually giving way to market led industrialization exhibiting trade
liberalisation and privatisation. Initially however, structural adjustment programmes marked
led to deindustrialisation as reforms eroded several industrial capacities (by 1990, 22 out of
24 textile factories had closed). Indeed this was a period of widespread deindustrialisation.
3.2.2 Industrial Performance in Recent Years and Challenges
Since the mid-1990s the policy stance changed and brought the question of industrial
development back to the development agenda in the context of market orientation and private
sector led development. In 1996, a 25 year Sustainable Industrial Development Policy for
Tanzania (SIDP 2020) began to be implemented with the aim of enhancing sustainable
development of industrial sector. For the period 1996-2020 the government aimed at
achieving sustainable growth in the industrial sector in order to create favorable levels of
employment, economic transformation, equitable development, import substitution and
export promotion. Industrial sector continue to play key role in providing employment and
exports. However, the sector growth has been fluctuating widely. In 2005, the sector was
growing at 9.6 percent per year and up to 11.5 percent in 2007 and then down to 4.7 percent
in 2009, mainly due global economic and financial crisis. Since then, growth has gradually
improved to 6.0 in 2015 due to increased investment and production in textile, iron, cement,
drinks, cigarettes, agro-processing and construction materials. During this period, the
industrial sector has been contributing about 7 percent of GDP.

18
Figure 3.2: Performance in selected indicators of industrial sector 2005 2006 2007 2008 2009 2010 2011 2012 2013 2014 2015
Sectoral growth (%) 9.6 8.4 11.5 11.4 4.7 8.9 6.9 4.1 6.5 6.8 6.0
Share in GDP (%) 7.3 7.5 7.0 7.0 6.9 6.9 7.6 7.5 6.4 5.6 4.2
NBS, 2016
According to the national 2015 industrial census, Tanzania has 50,656 industries. However,
majority are small-scale industries as indication in Table 3.4. Regional wise, the industries
are distributed as follows: Dar es Salaam 7,705 (15.2%) then Mara 3,573 (7.1%), Ruvuma
3,517 (6.9%) and Morogoro 3,302 (6.5%). Sector wise, there are 20,228 (39.9%) food and
agro processing; textile 13,758 (27.2%) and furniture 7,071 (14.0%). It is apparent that the
starting point in any industrialization strategy should not ignore small scale industries.
Table 3.4: Distribution of industries by size in terms of number of employees
Number of employees Number of Industries %
1-4 41,919 85.1
5-9 6,002 12.2
10-19 493 1.0
20-49 412 0.8
50-99 170 0.3
100 - 499 199 0.4
500+ 48 0.1
Total 49,243 100.0
Source: Industrial Strategy 2016.
So far, the Government had privatized 196 industries. Out of these, performance in terms of
production and profitability and contribution to tax revenues has been satisfactory in 34
industries. They include Tanzania Portland Cement Company, Minjingu Phosphate Company
Ltd, Metalbox Tanzania Limited, Kibo Paper Industries Ltd, Auto Mech Limited, Kilombero
Sugar Company, Tanga Cement, Mbeya Cement and Tanzania Breweries LTD. However, 33
have been making loss. These are Ubungo Spinning Mill; Musoma Textile Mills Limited,
Keko Pharmaceutical Industries Ltd, Tanzania Pharmaceutical Industries Ltd, Concrete Roof
Tile Plant, The Giraffe Extract Company (T), Tanzania – China Friendship industries, and
Moshi Leather Goods Ltd. About 39 closed production. Those, which closed production,
include leather industries, iron, cashewnut processing, farm implements, as well as soap and
edible oil. The industries are CMSC; Tanzania Bag Corporation LTD (Moshi); Kisarawe
Brick Manufactures Ltd; Mbeya Ceramics Company Ltd; Steel Rolling Mills; Tanganyika
Packers Ltd (Shinyanga Meat Plant); Ubungo Garmets Ltd; Tanzania - China Friendship
Textile Mills; and Arusha Metal Industries Ltd.
The challenges facing the privatized industries include stiff competition from imported
predicts (e.g. cements, processed food); availability of reliable power supply; change of
production line (or to godowns) in some privatized industries; and obsolete plants. Other
challenges include inadequate capital and inadequate investment in machinery and buildings;
installation of some plants; and some investors using the industries as collateral for other
forms of business.
Generally, the challenges of implementing industrialization strategies include private
industrialists have not been a significant part and are some atmosphere of mistrust between
political power and private sector, which is key if the government has to play a role of

19
developmental state. The manufacturing sector, in particular, suffer from weak domestic
value chains; caused mainly by weak sector’s linkages to the rest of the economy, weak
diversification through utilization of a diverse natural resource base in the country (forestry,
agricultural products, minerals and fisheries). Also, the sector is characterized by low
productivity; occasioned largely by weak access to finance, modern technologies and
technical knowhow, challenging business environment (time and resource spent on
interacting with tax and regulatory authorities, nuisance taxes and business unfriendly laws
and regulations), unstable and unreliable supply of water and energy, underdeveloped
transport infrastructure, and weak incentives for both the private and public sectors to
prioritize Research and Development (R&D) activities.
These challenges manifest themselves in low growth and informality of most of the small
scale-manufacturing firms, which operate in household backyards due to lack of industrial
parks. This has also not made it difficulties for formal linkages between small scale and
large-scale firms.
3.2.3 Record of social transformation
The immediate post-independence period was characterized by inadequate social services
provision and near absence of skilled human resources. Targeted as one of the ills (enemies)
to development, ignorance was to be addressed vehemently. It was actually the Arusha
Declaration of 1967 which can be credited as the first attempt towards social transformation.
Through aggressive policies, which included nationalization of private education and training
infrastructure, the government was able to chart out its manpower development plan. There
was unprecedented literacy campaign that involved training within the country and abroad, as
high as for managerial and industrial skills.
The largest impact of the economic crisis fell on social services provision as the government
could not continue funding and safeguarding early achievements, in terms of both quantity
and quality. Various forms of cost sharing were introduced in social services namely
education, health and water. Given the general poverty level, affordability became the main
challenge.
During mid 1990s the government implemented a number of measures intended to revamp
social-service provision, including promoting private providers in social. Such measures
included review of policy, such as the Education and Training Policy of 1995, in a view to
step up human resources and skills development.
3.2.4 Industrialization Lessons from Other Countries
A common lesson is each of the reference countries is that of taking deliberate measures
aimed at promoting industrial development and transformation. China, for example, had a
breakneck industrialization program dubbed ‘The Great Leap Forward’, which led the
country to its industrial transformation. Other countries such as India progressively oriented
industrial production to primarily satisfy the huge and multiple domestic basic needs. As
such, irrespective of their ideological orientations, industrialization was essential for fostering
their development and freedom. As most of countries had limited domestic markets all
embarked on national industrialization programs that opened up and integrated their domestic
production with global markets, but with variations that factored in the local initial
conditions, and whatever else was peculiar to the domestic environment. These invested to
ensure close link between industries and other sectors of the economy with more focus on

20
enhancing general productivity
In general, the experiences of other countries as further elaborated in Annex I, point out the
following realities that are useful for Tanzania’s industrial transformation:
(i) There is no single route to industrialization; country specificity matters;
(ii) Technology and innovation are critical for productivity improvement;
(iii) Human capital Development and uplifting the country’s skills profile is imperative for
industrialization;
(iv) Targeting niche markets including integrating into the regional and global value chains
are important;
(v) Linking trade and industrial policy smoothens the industrialization path;
(vi) Export drive and promotion of domestic and foreign private investments play an
important role in bolstering productive capability and financing of industrialization;
(vii) Focus has to be made in ensuring availability of conducive business environment,
including readily availability of quality infrastructure and services, stable
macroeconomic management and discipline, and predictable policies and transparent
processes and procedures, strengthening safety and security;
(viii) Industrialization is generally capital and skills intensive endeavor, it would be
imperative therefore to have specific strategies to bolster financial mobilization and
skills development.
(ix) Successful industrialization requires smart developmental state to spearhead strategic
industries using various mechanisms including state procurement.
3.3 The Fundamental Considerations to the FYDP II Orientation
3.3.1 The Regional and Global Socioeconomic Terrains for Tanzania
Despite continuing high growth and an increasing rate at which poverty declines rate over
recent years, Tanzania future growth is not all promising unless bold decisions. There are for
this: (i) the slowdown of economic growth in a number of Tanzania’s key strategic trade and
investment countries, including China and end of commodity super-cycle will have negative
effects on Tanzania’s exports; (ii) rapid population growth increases pressure on jobs, social
services, and infrastructure particularly in urban areas; (iii) climate change is already
affecting agriculture, energy and water sources; (iv) the trend of ODA flow to Tanzania is
already dipping at a time when investment to bridge the gap in infrastructure is highly
required; and (v) Tanzania’s competitiveness has stalled with a number of countries in the
region already showing overtaking Tanzania in improvement in doing business environment.
Nevertheless, with intensifying globalization, Tanzania is increasingly becoming part of the
global economy and the international and regional trade is becoming an important growth
driver of the economy. Tanzania exports continued to increase at an annual average of 9.5
percent since 2011. The bulk of Tanzania’s manufactured exports are for the region whereby
intraregional exports to the rest of Africa accounted for approximately 72.4% of the total
value of Tanzania’s manufacturing exports in 2014. Exports destined for markets in the East
African Community (EAC) accounted for 46.6% and that for or the Southern African
Development Community as 47.1%. With the signing of the SADC-COMESA - EAC
Tripartite, the share will even be higher. In order to increase trade performance regionally
and internationally, the country should build the necessary productive capacities that can be
leveraged to harness opportunities with the emerging markets.

21
In addition, Tanzania has a number of preferential trade windows to exploit in a bid to
expand its export trade, such as AGOA, Everything But Arms (EBA) and bilateral
agreements with several countries. To this effect, however, it requires to significantly invest
in improving its transport and energy infrastructure as well as in creating a pool of skilled
human resource to allow commensurate expansion of its domestic productive and delivery
capacities. There are other new forums of solidarity emerging in the form of (Tokyo
International Conference on African Development (TICAD) with Japanese Government and
the Forum of Cooperation between Africa and China (FOCAC) of Chinese Government,
presenting substantial of financial pledges to support Africa’s development. Tanzania has to
align properly to benefit from these opportunities.
They’re other African own initiatives that complement the orientation of FYDP II. The East
African Community has of recent articulated a strategy to implement its Industrialization
Policy (2012-2032). The Strategy is premised on the collective commitment of Partner States
to fast track equitable and sustainable development for majority of the people through
industrialization to enhance structural transformation and diversification of the economies.
The Region’s overriding objective is to create a modern, competitive and dynamic industrial
sector, fully integrated into the global trade. The strategy is in line with orientation of FYDP
II, emphasizing for the following:
(i) Diversifying the manufacturing base and raising value addition of locally available
resources prior to exports to 40 percent from the currently estimated value of 8.62
percent by 2032;
(ii) Strengthening national and regional institutional frameworks and capabilities for
industrial policy design and implementation; and delivery of support services to ensure
sustainable industrialization in the region;
(iii) Strengthening R&D, Technology and Innovation capabilities to facilitate structural
transformation of the manufacturing sector and upgrading of production systems;
(iv) Increasing the contribution of (i) intra-regional manufacturing exports relative to total
manufactured imports in to the region from the current 5 percent to about 25 percent by
2032 and (ii) growing extra regional manufacturing exports relative from the current 32
percent to over 50 percent by 2032; and
(v) Transforming Micro, Small and Medium Enterprises (SMEs) into viable and sustainable
business entities capable of contributing up to 50% of manufacturing GDP.
Similarly, the SADC Industrialization Strategy and Roadmap 2015 – 2063recognizes that for
trade liberalization to contribute to sustainable and equitable development for the populace of
the respective countries, concerted efforts have to be taken build the requisite productive and
trade capacities. The Strategy is anchored on three pillars namely; industrialization as
champion of economic and technological transformation; competitiveness as an active
process to move from comparative advantage to competitive advantage; and regional
integration and geography as the context for industrial development and economic prosperity.
There are also a number of initiatives for which Tanzania has ratified and therefore had
influenced FYDP II orientation, including the following
(i) Africa Mining Vision (AMV) 2050 is a pathway on how mining can be used to drive
continental development and tackle the paradox of great mineral wealth existing side by
side with pervasive poverty. With emphasis to value addition industries on minerals
(ii) Africa’s Agenda 2063, African, as a continent, is looking ahead towards the next fifty
years with a vision of an integrated, prosperous and peaceful Africa, driven by its own
citizens and representing a dynamic force in the global arena, popularly referred to as
Africa’s Agenda 2063.

22
(iii) The SADC Regional Indicative Strategic Development Plan which is a comprehensive
development and implementation framework guiding SADC Regional Integration
Agenda over a period of fifteen years (2005-2020), which aims at deepening
integration, accelerate poverty eradication and the attainment of other economic and
non-economic development goals.
(iv) Sustainable Development Agenda: on 25 September 2015, world leaders adopted the
2030 Agenda for Sustainable Development. The Agenda has set 17 Sustainable
Development Goals (SDGs). Goals that are congruent with FYDP II direction are: Goal
9 - infrastructure and industrialization; 1 - ending poverty; 2- agriculture and food
Security; 3 – Health; 4 – Education; and 5 - gender equity. Likewise, industrialization
will place a huge toll on utility supplies e.g. energy and water, so naturally Goals
number 6 - water and sanitation, and number 7 - energy supplies will need to be
mainstreamed while number 17 is critical for realization of the Plan and SDGs.
3.3.2 Embedding the FYDP II Orientation
After assessing the speed of social economic transformation and its attendant poverty
reduction and after scanning the regional and global socioeconomic terrains for which
Tanzania currently found herself, the Plan re-orient the national efforts towards
industrialization based on existing comparative advantages in terms of natural resource and
labor endowment as well as geographic location.
Tanzania’s Comparative Advantages Tanzania resolves to hasten the industrialization process in order to minimize reliance on
exportation of row commodities. Tanzania’s industrialization aims to harness the country’s
niches or comparative advantages. Tanzania’s strategic comparative advantages lie in (i) the
abundance of natural resource endowments, particularly agricultural land, water for irrigation
and fishing, forests, minerals (gemstones, iron ore, coal, tin, phosphate, uranium, salt, soda
ash), large fresh water lakes and ocean resources including fisheries, and tourism resources
(wildlife, mountains, long coastline & pristine beaches, rich cultural heritage); (ii) a young,
growing and low-cost labour force; (iii) rapid urbanisation; and (iv) country-wide ICT
backbone infrastructure investment. The analysis shows that the majority of the industries are
small scale and strategies should aim at provide space for their growth. However, there will
be need to strike a balance between small scale for domestic market and large-scale industries
capable of penetrating the regional and international market.
Geographical Location Advantage
The industrial strategy of the Plan recognizes and takes advantage of Tanzania’s strategic
geographical location. Having direct territorial access to the Indian Ocean and located at the
centre of the east coast of the African continent, Tanzania has the potential to become the
least-cost trade and logistics/ trade facilitation hub of the Great Lakes Region as it links up
with global markets. However, this will hinge on building adequate physical and soft
infrastructure (transport, energy, ICT) and getting transit policy issues right. Tanzania is, by
its location, a traditional bridge for inter-trade and intra-trade, being the place of physical
intersection of the transport corridors which link the markets of the Tripartite (EAC, SADC
and COMESA) Regional Trading Arrangement. Figure 3.1 illustrates the trade impact area of
the inland.

23
Figure 3.1: Strategic International Shipping Gateway and Trade Impact Area of
Tanzania
African markets that can trade with and from there avail linkage of the regional group of
countries with access to the rest of the World through the gateway seaports of Tanzania,
provided there is appropriate and adequate supply of multi-modal transportation
infrastructure with efficient services. Tanzania is, therefore, an ideal location for market-
seeking industries that target the emerging African (EAC, SADC and COMESA) market.
Figure 3.2: Tanzania’s Geographic Location in Relation to International Maritime
Shipping Routes to Asia and Middle East via the Indian Ocean
Tanzania with a maritime coastline of about 1,000 kilometers is favorably situated halfway
between the Horn of Africa in the North East and Cape of Good Hope to the South (Figure
3.2). Thus, Tanzania has a natural disposition to become the leading multi-modal

24
transportation and logistics hub with wide scope for regional and global trade facilitation,
presented with advantages for shipping, warehousing and bulk storage.
Rather than build more walls is instead pushing for openness and integration to a new
paradigm that prizes ever closer collaboration with the rest of the world. This coupled with
improved cross-border trade would stir up the industrialization drive considered under the
Plan. This places a premium on collaborative cross-border security. Rather than duplicate
efforts by having custom facilities to inspecting goods twice as they cross borders, efforts
need to be considered to forge further customs collaboration, with officials working side by
side, trained to common standards and procedures, and operating transparently under a
common roof.
The logistics clusters would act as natural magnets to attract all sorts of manufacturing and
processing industries that would readily supply the co-located trading enterprises for
transportation and distribution of goods to markets. It has been estimated that by the year
2050, 60 percent of aggregate global trade in all commodities including energy minerals will
be shipped through the Indian Ocean. Tanzania should seize the unfolding advantage to
position itself among the maritime economies.
3.3.3 Linking industrialization and Human Development
The challenge for Tanzania is how to attain inclusive growth and ensure equity in the society.
Significance and relevance of non-inclusive growth is spelt out in several respects, especially
in the light of increasing unemployment (particularly, youth unemployment), high and
pervasive rural poverty and increasing income inequalities in the midst of high economic
growth. Promoting growth with equity requires a holistic Sustainable Human Development
(SHD) policy framework that is pro-people, pro-jobs, and pro-nature (environment), in
accordance with SGDs. The Tanzania Development Vision 2025, envisaging a
transformation process that is industry/manufacturing sector-led, able to build a diversified
competitive economy and desirable human development outcomes. FYDP II as the lynchpin
to this process builds the foundation for the requisite structural change and socially inclusive
development.
Conceptually, FYDP II does this by embracing the symbiotic link between industrialization
and human resources development, which were the characterizing focus of MKUKUTA II
and FYDP I (Figure 3.3). The two dimensions interact dynamically in a synergetic manner,
which is requisite for structural change and socially inclusive development. For instance,
while on one hand, the industries provides test ground for skills, which are one of the
components emphasized in human development realm; on the other, skills take industry to a
higher level of technological progress. The spiral thus grows to higher level as this interaction
deepens. In terms of progress towards TDV 2025 aspirations, the link from industry to skills
enables HD to move towards skill targets through apprenticeship, on-job industrial training
etc. This enables the shift from low to high skills. The link from skills to industry enables
sophistication of industry to move from low tech to high tech diversification through
technological innovation, training curricular, technological transfer/ favorable international
conditions etc. The end result of these two processes is increased growth and ultimate
improvement of human welfare (employment and income distribution).
In this conceptual underpinning, the fast results are achieved if these interactions take place
in an environment of factor and skill endowments (i.e. Tanzania’s comparative advantage)
and appropriate technologies which reflect the capability of an economy to create greater

25
wealth and distribute it across different segments of the population. This greater wealth will
improve human development if it is used to fulfill individual and collective needs by
expanding human capabilities and extending human freedoms. Successful transformation
ensures that economic growth forms part of a virtuous circle of cumulative causation that
accentuates productivity, and income convergences between agriculture and non-agricultural
sectors. This is important in the context of Tanzanian economy, which is largely agrarian in
nature, in particular in terms of its concentration of the labor force though, a gradual shift in
the sector composition of GDP away from agriculture has begun to emerge.
Figure 3.3: Conceptual Framework
2
TDV2025Goal:Toattainsustainablehumandevelopment
CompetitiveEconomy
SocialWellbeingSustainableEnvironment
BasefortransformationInfrastructure(e.g.energy,railways,roads);Skills;
andSupportiveInstitutions
Growth,SocialwellbeingGoodGovernanceandAccountability
EconomicTransformation
MKUKUTA
Feedbackeffect-skillscomposition
Healthlaborforce,etc.
UnleashingGrowthpotentialInfrastructure,HR,etc.
HumanDevelopment
FYDP
WellfunctioningInstitutions
Industrialdevelopment,humanDevelopment,implementa on
effec veness
-SectorsharesinGDP,employment,exports,sourcesofrevenues,etc.
Increaseinincomes,employment,formality,socialsecurity,accesstosocialservices,etc.
FYDPII
DrivetoCompe veExportledEconomyFY
DPIII
3.4 Selection of Priorities
The interventions for FYDP II and their selection criteria are grouped into four main
categories: those related to industrialization per se, those geared towards fostering human
development and social transformation, interventions gearing towards improving
environment for doing business in Tanzania, and those deemed necessary to get
implementation right.
3.4.1 Industrial Interventions
Industrialization that is envisaged under FYDP II focuses on realizing the country's
aspirations, and is anchored on current and future lynchpin drivers of the economy especially
the country's niches current and future; fostering innovation and technological adaptation;
strategically repositioning the country to maximize on the global and regional economic
dynamics. In view of these, the following criteria were used to inform selection of priority
industrial activities and interventions for FYDP II:

26
(i) Potential tin Contributing to the Realization of the National Development Aspirations
(strategic)
The activity or intervention to be elected must be relevant to and in line with realization
of the National Vision 2025 targets particularly that of propelling Tanzania to become a
semi-industrialized middle-income country by 2025. This criterion encompasses impact
large/substantial impact (growth, employment creation, poverty reduction) and national
security.
(ii) Anchored on Tanzania's niches or Comparative Advantages: in-country resource
availability
Tanzania’s industrialization should aim to harness the country’s niches or comparative
advantages, both current and future, including (a) abundant natural resource
endowments, (b) strategic geographical location; (c) regional integration; (d) rapid
urbanization; and (e) country-wide ICT backbone infrastructure investment.
(iii) Market demand and dynamics
Efforts to promote particular products and services under the plan will need to take into
account demand in the domestic, regional or global markets. In particular, Tanzania
needs to prioritize products and services with growing demand in targeted markets.
Access to a growing market demand plays a vital role in driving industrialization.
While all markets will be targeted, products that will allow Tanzania to quickly
integrate into regional and global markets will be accorded high priority. Activities that
have great potential to boost foreign exchange earnings or facilitate its savings will be
prioritized.
(iv) Sustainability of the Transformation Process
The transformation process envisaged in TDV 2025 is being implemented through a
sequential process of FYDPs as outlined in LTPP. Unfinished activities from FYDP I
who are fundamental for the transformation process have been carried over in FYDP,
which in turn prepares the ground for implementation of FYDP III in order to sustain
the transformation process.
(v) Technology Appropriateness
This criterion emphasizes innovation and competitiveness for driving productivity and
economic growth. Priority is on activities that contribute to the development of
domestic technological capabilities and deliver win-win-win solutions on growth,
environmental considerations and social considerations.
(vi) Unfinished activities from FYDP I and MKUKUTA II
The FYDP II will continue with the ongoing activities that were started in both FYDP I
and MKUKUTA II which are still in line with FYDP II objective.
Based on the above criteria, particularly that comparative advantage and availability and
access to market, four scenarios evolve for Tanzanian industries and export specialization
(Figure 3.4.)
a. Products where both Tanzanian Comparative Advantage and world demand is growing
- Zone 1.
The products are cashew nuts, cereals (excl. those which have been hulled); cocoa beans,
whole/broken, raw/roasted; coconuts; gold (incl. gold plated with platinum); oil seeds
and oleaginous fruits; oil-cake and other solid residues; precious stones (excl. diamonds)

27
and semi-precious; and sesame seeds. Efforts of public sector and the private sector
should be directed to support specialization on the production and trade of those
products. As such, many of these products are familiar, as they tend to constitute the
main exported products. However, others may escape to the radar and may constitute
interesting opportunities for further specialization.
b. Products where Tanzanian Comparative Advantage is falling but world demand is
rising – Zone 2
Tanzania has commodities whose comparative advantage is declining but there is a
growing world market. These are vegetable fats and oils; tanned/crust hides and skins
of bovine; sunflower seed/safflower oil; palm kernel/babassu oil; Iron and non-alloy
steel in primary forms; footwear with outer soles and uppers of rubber/plastic; foliage,
branches and other parts of plants; boxes, cases, crates and similar articles; beer made
from malt; articles for the conveyance/packing of goods. These are products where
Tanzania’s competitors might be presenting better production and trade conditions.
Therefore, Tanzania is losing efficiency in production relatively to other products being
exported by Tanzania. Although in some of these products, Tanzanian exports are
growing, they are growing slower than world demand. With smart market
interventions, there is potential for growth in this area.
Fig. 3.4 Scenarios of Tanzania’s Industries and Export Specialization
c. Products where Tanzanian Comparative Advantage is growing but world demand is
falling – Zone 3.
For some products the comparative advantage is increasing but the world market is
falling. These are ceramic sinks, washbasins; containers for the transport; filters (i.e.,
optical elements); jute and other textile bast-fibres; parts suit; etc. Those products present
certain risk as they suggest that specialization is moving towards products where demand
is weak. Although Tanzania, in this way, will be capturing market share, it will be in
products where world demand is losing interest.

28
d. Products where both Tanzanian Comparative Advantage and world demand are falling –
Zone 4.
This category includes wooden furniture of a kind used in offices; wood sawn/chipped
lengthwise, sliced/peeled; T-shirts, singlet and other vests; electrical transformers (excl.
dielectric); durum wheat; bars and rods of iron/non-alloy steel; angles, shapes and
sections of iron/non-alloy steel; and aerials and aerial reflectors of all kinds. Tanzania
should, unless for strategic reasons, avoid directing efforts to this category of products.
3.4.2 Human Development
The following are criteria for selection of priority areas for social development.
a. Potential to Contribute to the Realization of the National Development Aspirations.
Intervention should have a potential to significantly contribute to the development
objective social transformation and aspiration of the Development Vision 2025.
b. Sustaining and Consolidating Current Social Development Achievements
An intervention will be selected if it is aimed at sustaining and consolidating levels of
achievements. A number of social indicators once achieved they have to be consolidated
to avoid slippage and these include immunization and mortalities in the health sector.
c. Improving delivery/quality
Governments have primary responsibility to deliver social services. An intervention will
be selected for FYDP II if it has potential of improving quality of service delivery to the
communities.
d. Social Protection
Social protection is a broad area that encompasses wide range of social groups, however
an intervention on social protection will be selected if it is aimed at those groups that
have no support at all. These will include people with disability that cannot support
themselves and very old people without any support.
e. Contribution to quality of human wellbeing
Quality of life is one of the desired conditions in the aspiration of Tanzania’s
development Vision. A social intervention potentially contributing to a desired state of
human wellbeing will be prioritized.
3.4.3 Better business environment
The Plan aims to continue scaling up efforts to create conducive environment for doing
business and investing in the country. Thus, the plan gives priority to interventions aimed at
boosting quantity, connectivity and quality of infrastructure and services as well as policy and
institutional reforms aiming at making ease to start a business; dealing with provision of
business permits, including construction permits and employability of foreign experts;
acquiring utility connection, including getting electricity; registering of property; getting
credit and accessing finances; protecting investors; paying taxes; cross-border trading;
enforcing contracts; and resolving insolvency.
3.4.4 Implementation effectiveness
Implementation effectiveness hinges on financial, human and institutional capacity in
planning, decision-making, and organization and coordination for implementation. The Plan
therefore prioritizes the interventions which aim at:

29
i. Reforms to enhance mobilization of finances required for the implementation of the
Plan
ii. Reforms to enhance efficiency, effectiveness and transparency in policies, including
taxes, incentives, land administration and accessibility
iii. Effective institutional and actions organization and coordination to ensure timely and
quality public services delivery, and
iv. Reforms to Eradicate Corruption and ensure Good Leadership
v. Reforms to entrench Implementation Culture
vi. Reforms specific to implementation of Plan Flagship projects
vii. Reforms to re-activate the role of the State in in economic governance
viii. Reforms to ensure effective and working decentralization for local economic
development (LED) based on the principle of subsidiarity
Based in the above series of areas of focus, the next chapter, the Plan present interventions
related to priority industries, human development, enabling environment, and show the
flagship projects. The interventions related to resource mobilization are presented in Chapter
5 and those related to implementation effectiveness are in Chapter 6.

30
4.0 STRATEGIC INTERVENTIONS FOR INDUSTRIALIZATION AND
SOCIAL ENHANCEMENT
4.1 Introduction This chapter presents the strategic interventions to rally the society behind implementation of
the Vision 2025 objectives and targets of FYDP II. It outlines the interventions of strategic
discourse in relation with the four focus areas of the Plan; namely promotion of growth and
industrialization as a cradle for economic transformation; enhancement of human and skills
development; improvement of the environment of doing business, and; improving
implementation effectiveness. Performance targets are set to provide basis for effective
implementation as well as monitoring and evaluation. This chapter provides broad areas of
priority interventions, which are further articulated in Annex II.
4.2 Interventions to Foster Industrialization and Economic Growth
4.2.1 Manufacturing Subsector
This Plan has been formulated in consistence with the Vision 2025, which is further
elucidated in the Tanzania Long Term Perspective Plan (LTPP), 2011/12-2025/26, industry,
broadly defined to cover manufacturing, mining, quarrying and construction, would by 2025
account for over 30 percent share in GDP. However, targets for the industry sector and
manufacturing sub-sector during the plan period have been reset taking into account the
realities and is indicated in Table 4.1
Table 4.1: Overall Industrial Sector Performance and Manufacturing Sub-Sector
Targets, 2016/17 – 2020/21
S/N Indicator/Target 2015 2020 2025
1. Industrial and construction
1.1 Average Growth rate (%) 9.33 10.9 9.2
1.2 Share to GDP ( at current prices) 21.1 23.7 25.0
1.3 % Share on Total Foreign Exchange
Earnings
1.4 % Share on Total Wage Labour
2. Of Which Manufacturing
2.1 Average Growth rate (%) 6.9 13.3 10.59
2.2 Share to GDP (at current prices) 5.7 5.8 5.9
2.3 % Share on Total Foreign Exchange
Earnings
2.4 % Share on Total Wage Labour
3 Of which agro processing
3.1 Average growth rate(%) 6.95 13.21 10.58
3.2 Shares to GDP(at current prices) 2.4 2.4 2.4
Attainment of the manufacturing sub sector targets set is predicated onto the implementation
of the following industrial activities. Further elaboration is provided in Table A II1, of Annex
II.
(a) Special Economic Zones and Export Processing Zones
Development of Special Economic Zones and Export Processing Zones will be given priority
as a means to promote investment and trade in industrial activities and products. The

31
following are the identified priority SEZs/EPZs: Bagamoyo SEZ, Kurasini Logistic Centre,
Mtwara SEZ (free port zone), Kigoma SEZ, Tanga SEZ, Ruvuma SEZ, and Manyoni SEZ.
(b) Industrial Parks
Development of industrial parks is aimed at facilitating industrial development. Industrial
parks will be developed in the following areas: Tanga-Kange, Kilimanjaro Machine Tools
Company (KMTC), Mtwara, Lindi, Songea, Sumbawanga, Dodoma, Kagera, Mara, Manyara,
Njombe, Katavi, Geita, Simiyu, Shinyanga and Morogoro.
(c) Micro, Small and Medium Enterprises Parks
This sector is very important for the development of the industrial sector and for creating jobs
particularly for the youth. Therefore, facilitation of this sector will be done through the
development of parks. Strategic interventions are as follows: o industrial parks infrastructure
will be developed in regions of Mtwara, Lindi, Songea, Sumbawanga, Dodoma, Singida,
Shinyanga, Kagera, Mara, Manyara, Njombe, Katavi, Geita, Simiyu and Morogoro.
(d) Automotive Industry
Under this sector the strategic choices are made in the following areas: Commercialization of
Tanzania Automotive Technology Centre (Nyumbu), Revamping General Tyre-Arusha, Plant
for Tractors and agricultural inputs-Carmatec Arusha, as well as Motorcycle assembly plant.
(e) Petro and Chemical Industries
This sector will cover the following strategic investment; Liquidation of Natural Gas (LNG),
construction of LNG Plant in Lindi, Mtwara Petro Chemical industry complex and
improvement of Petrochemical laboratory at TIRDO.
(f) Development of pharmaceutical industries
The focus under this sector includes the construction of strategic pharmaceutical industries
including Agave Syrup Factory (PSPF) in Tanga.
(g) Building and Construction Materials Industries
This includes the following; Ceramics, Cement, and Kisarawe Kaolin
(h) Agro-Industries
Adding value for the agricultural products depends on the existence of the agro-processing
industries in Tanzania. Emphasis will be on the following priority activities: Leather
industries in Dodoma and Singida, Edible oils industries, Oil Palm production at Kimala
Misale, Construction of Metal Silo for small holder farmers, establishment of Food
processing Training Cum Production Centres in Morogoro and Dar es Salaam.
(i) Coal for Industries and Households
As a source of industrial energy as well household fuel to provide alternation to biomass
based fuel and serve forest.
(j) Iron and Steel
Emphasis is placed on development of Iron and Steel technologies from locally available ore
deposits and revamping of privatized industries
4.2.2 Mining and Metals Mining has now placed Tanzania in the higher ranks of African economies in terms of FDI
attraction and a very top of the list in terms of non-oil economies. The progressive

32
liberalization of the economy that began in 1980’s, has helped to shape a new structure for
the Tanzanian economy. In that new structure, the private sector generally has been able to
play a more active role in several sectors and to become the dominant player in some,
including mining and tourism. Tanzania is endowed with variety number of industrial
minerals and precious metals, including iron ore, soda ash, coal, clay soil, uranium, gold,
diamond and tanzanite, a rare metal so far worldwide being found only in the East African
country. It is unfortunate however that most of these non-renewable resources have been
exported without being processed to deny jobs that would have been created had some of the
beneficiation and value addition activities been undertaken in the country. The plan seeks to
promote resources based industrialization. The Targets set over the plan period with regard to
mining subsector are expounded in Table 4.4.
Table 4.2: Indicators and Targets for Implementation of Mining Sector Interventions
during FYDP II
S/N Indicator/Target 2014/15 2020/21 2025/26
1.1 Average Growth rate (%)
1.2 Share to GDP (%)
1.3 Total Foreign Exchange Earnings
1.4 Of which % of raw export
1.5 Of which % beneficiated
1.6 % Share on Foreign Exchange Earnings
1.7 % Share on Total Wage Labour
Specific interventions identified towards realization of these targets are listed below and
further elaborated under Table AII.2 in the Annex.
a) Minerals Beneficiation and Value Addition
Under this sub sector, strategic interventions include the followings: processing of precious
metals and gemstones; Caustic Soda Refinery Plant, Liganga Iron Ore and Steel, Kabanga
Nickel, and Mkuju Uranium Project.
4.2.3 Construction
Construction is one of key activities of Tanzania’s economy and is increasingly growing. The
gross value of annual investment into the construction industry has over the ending plan been
around Tshs. 4 trillion. The sector is, however in terms of value, dominated with foreign
companies. The domestic companies have a business stake of only 30 percent. Therefore, the
Plan will focus on strengthening the participation of domestic companies in the sector share.
Targets set for the industry in this regard are as indicated in Table 4.3
Table 4.3: Set Performance Indicators and Targets for Construction Sub-Sector
during FYDPII
S/N Indicator/Target 2014/15 2020/21 2025/26
1.1 Average Growth rate (%) 14.1 26.8 33.28
1.2 Share to GDP (%) 12.5 22.62 28.0
1.3 % Share of domestic companies 40 60 80
1.4 % Share in Total Employment 98.7 99.2 101.3
Specific interventions to be taken towards realization of the set targets are outlined in Table
AII 3. The interventions are aimed at promoting local Construction companies participation

33
in the Industry by improving access to equipment and skills development. Detailed
interventions are provided in Table AII.3.
4.2.4 Agriculture
The Agricultural sector remains central to Tanzania’s industrialization and livelihood of
majority of the people in rural and urban areas with about 70 percent of the population.
earning their living through agricultural related activities. The performance of agricultural
sector, though improved, remains far short of Vision 2025 set targets objectives. For the Plan
period efforts will be directed to consolidate and further scale up the achievements so far
recorded. Table 4.8 indicates the targets for the sector over the plan period.
Table 4.4: Overall Agricultural Sector Performance Targets, 2016/17 – 2020/21 S/N Indicator/Target 2015 2020 2025
Agriculture
Average Growth rate (%) 3.1 6.0 8.0
% Share to GDP (current prices) 28 (2014) 23 21
% Share on Total export Earning
% Share on Total Employment 67 (2014)* 60 48
Productivity (% growth) 3.3 4.0 4.0
1. Crops
1.1 Average Growth rate (%) 3.41 6.0 8.0
1.2 % Share to GDP (current prices) 16.2 15.0 14.6
1.3 % Share on Total export Earning 8.5 9.8 19.9
1.4 % Share on Total Employment
1.5 Hectare under irrigation 700,000 1,000,000
2. Livestock
2.1 Average Growth rate (%) 3.16 6.99 8.49
2.2 Share to GDP (at current prices) 7.4 6.0 4.8
2.3 % Share on Total Export Earnings
2.4 % Share on Total Employment
3. Forestry and Products
3.1 Average Growth rate (%) 5.17 6.85 7.53
3.2 Share to GDP (at current prices) 3.2 3.5 3.0
3.3 % Share on Total Export Earnings
3.4 % Share on Total Employment
4. Fisheries
4.1 Average Growth rate (%) 2.72 5.67 6.42
4.2 Share to GDP(at current prices) 2.9 3.3 2.8
4.3 % Share on Total Export Earnings
4.4 % Share on Total Employment
Interventions identified for realization of the set targets over the plan period are shown in
Table AII.4.
Crops: The prioritized products are Maize, Rice, Sunflower, Pulses, Floriculture, Cotton,
Sisal, Grape, Sunflower. Interventions for acceleration of the sector include among others,
expansion and improvement of irrigation systems, improvement of R&D in crops cultivation,
improvement of extension services, improving agricultural land use plans, as well as
enhancing the availability of market. Other strategic interventions include the development of
MKULAZI Agricultural City, and SAGCOT.

34
Livestock: Prioritized products include; Beef, Chicken, Diary
Fisheries: Prioritized products include: freshwater fishing, sea and deep sea fishing, Deep sea
and fishing, aquaculture
4.2.5 Environmental and natural Resources Management Tanzania is privileged to have rich resources of wildlife. The same has increasingly becoming
a cradle of its burgeoning tourism sector. As such, protecting of wildlife and its habitats is
one of the focuses of the Plan. Over recent years invasion and encroachment of the wildlife
habitats has increased along with poaching. This is threatening development of this natural
resource and associated tourism. Table 4.5 indicates the targets set for the sector to the
realization of this plan.
Table 4.5 Overall Performance Indicators and Targets for Environment and
Protection
S/N Indicator/Target By
2025/26
2014/15 2020/21
1.1 % share of GDP Income from sustainable utilization of forest, water
and marine resources
20% 10%
1.2 % of energy derived from Renewable Green Energy 70% 36% 50%
1.3 No. Of Commercial Forest Plantations established
1.4 Increase the percentage of forest cover (Ha) 200,000 60,000 130,000
1.5 Reduced charcoal consumption in Urban areas 60% 90% 30%
1.6 % of large projects complying with approved Environmental Impact
Assessment (EIA) and audit regulations
90% 60%
1.7 % Contribution from sustainable tourism to GDP 13.2% 4% 8%
1.8 % of water for House and commercial use supplied from the natural
ecosystems
80 % 60%
Specific Interventions geared towards the realization of the targets are as follows: Promotion
of renewable green energy technologies (biogas, LPG, Solar Energy), Climate change
adaptation, enforcement of EIA, and SEA, tourism and hospitality industry as well as natural
resources conservations and strengthening of contribution of natural resources and products.
Details are provided in Table AII.5.
4.2.6 Science Technology and Innovation Technological change is widely acknowledged as one of the main drivers of long-term
growth. Technology change happens in all spheres of human life and different sectors of
economies, albeit, at differentiated speed. The recently endorsed new global development
declaration on the “Sustainable Development Goals”, among others places technology change
and innovation higher on the agenda, specifically goal number 9 “build resilient
infrastructure, promote inclusive and sustainable industrialization and foster innovation” and
generally all other 16 goals as they require improved ways of implementation.
While it is unattainable that technology makes production processes more efficient, thereby
increasing the competitiveness of countries and reducing their vulnerability to market
fluctuations, structural change, i.e. the transition from a labour-intensive to a technology-
intensive production frontier, if not implemented in a well guided approach can drive massive
of labour, especially unskilled off their jobs. Analogously, this can also be applicable
countries. Countries with less technological advancements can caught up and replaced with
advanced countries even in production lines that were traditionally of comparative
advantages. In case of Tanzania, for instance, its replacement as world’s privileged, in case of

35
cashew-nuts and palm-oil production by Vietnam and Malaysia respectively and, of recently,
on tilapia trade by China.
Technological change also requires the labour force to be prepared to use increasingly
complex machinery and equipment, which widens the inequality between highly skilled and
unskilled workers in terms of wage distribution. Industrialization has historically been
accompanied by increasing pollution and the depletion of natural resources. Economic
growth also entails a rise in the use of inputs, materials and fossil fuels, which generate
environmental pollution and degradation, especially in low income countries. It is imperative
therefore that as countries seek to undertake economic upgrading through technological
advancement and innovation be prepared to acquire the necessary capabilities to catch up and
reduce the gap with per capita incomes in high income countries.
Reaching advanced levels of inclusive and sustainable industrial development requires not
only increasing incomes but also conscious efforts to sustain growth, promote social
inclusiveness and move towards greener structural transformation, as well as, managing the
trade-offs between them. This can be attained only with accumulation of internal sciences,
technology and innovation (STI) capabilities.STI capabilities are strengthened by investing in
human capital, institutions, improving innovation systems and upgrading in industrial clusters
and global value chains.
Technological capabilities are expanded in developed countries through tinkering with the
frontiers of science and technology and in developing countries by acquiring and adapting
technologies created elsewhere. And further, promoting social inclusiveness in manufacturing
requires matching the choice of technologies to a country’s resource and skill endowment.
Tanzania has no other escape route had it to realize its determination for sustainable growth
and economic transformation through industrialization as elucidated in this plan than
cautiously organizing the society towards accumulation of own sciences, technology and
innovation capabilities. This development needs to be carefully tracked. Table 4.6indicates
the indicators and targets set in tracking the development in this area while specific
interventions are outlined in Table AII 6 in the Annex.
Table 4.6 Indicators and Targets for Science Technology and Innovation Capabilities
Development in Tanzania.
S/N Indicator/Target 2014/15 2020/21 2025/26
4 Of the Manufacturing
% share of resource based 69(2010)* 55 38
4.1 % Share of Low Tech 17(2010)* 29 39
4.2 % Share of Medium Tech 11(2010)* 24 32
4.3 % Share of High Tech 2(2010)* 6 8
4.4 R&D Expenditure
4.5 Total Expenditure (bill Tshs.) 40.7 90.2
4.6 Of which % on agriculture 38.6 38.8 40.0
4.7 Of which % on manufacturing TB 40.0 42.8
4.8 Of which % on mining, construction & utilities TB 13.5 10.6
4.9 Of which % on Services 7.6 8.5 6.6
4.10 Institutional Technological Capabilities
4.11 % R&D expenditure by Public Sector 58
4.12 % R&D expenditure by Private Sector 9

36
S/N Indicator/Target 2014/15 2020/21 2025/26
4.13 Number of Qualified Researchers 6,355 9,556 12,639
4.14 R&D institutions with ISO Certifications
4.15 R&D institutions with foreign partner institution 11
4.16 Technological capability for imitation & adaptation
4.17 Up Grading
4.18 Number of firms practicing KAIZEN
4.19 Number of Firms exporting
4.3 Interventions for Human Development
People’s development is the lynchpin objective of any development plan in Tanzania. The
industrialization and transformation are, thus, the trusted means to the realization of the
central objective, i.e. human development. They have to provide expanded freedom of choice
for every Tanzanian citizen, in the rural and urban centers, by affording access to production,
consumption and employment opportunities.
The freedom of choice is fostered with education, skills and health conditions of an
individual and society at large. With this understanding, the plan seeks to raise both
availability and quality of services required by an individual and society at large for self-
propelling improvement inequality livelihood.
4.3.1 Education and Capability Development
In this context, education has been referred to the total process of imparting knowledge and
starts at early ages in families, through childhood development, adolescence, to lifelong
learning. It is one of the major inputs into human development in terms of building human
capability. Furthermore, education and training are essential on economic transformation by
providing skills and generation of technology and workforce that can be deployed to change
country’s endowments from comparative advantages (CA) to competitive advantages. In the
contrary, decline in the quality of education has negative implications for human
development and reduces the contribution of human capital to growth. Thus, policies towards
securing access and improved quality in all levels, i.e. early learning, basic education,
vocational and technical, tertiary and high education needs to be designed in such a way that
it becomes a means of retooling human capital to transform the economy in a sustainable
manner.
FYDP II needs to address the quality of education as well as, ensuring that its provisions are
well aligned with and tailored to meet needs of both the local society and competition in the
domestic, regional and global economies.
The quality of education is delivered through two sides. It is directly related to the quality of
the recipient as well as the teaching and teaching environment. The quality of the recipient is
determined with the mental health and preparedness, which is crucial during the early 1,000
days of livelihood. At the same time, the teaching and teaching environment need to be
friendly and enticing. The role of teachers in improving the quality of education is crucial and
therefore it is vital to improve the professional competencies of teachers and to raise their
morale by improving the quality of teaching environment.
Table 4.7highlights some of the targets envisaged to the realization of the Plan with regard to
human development and human capital.
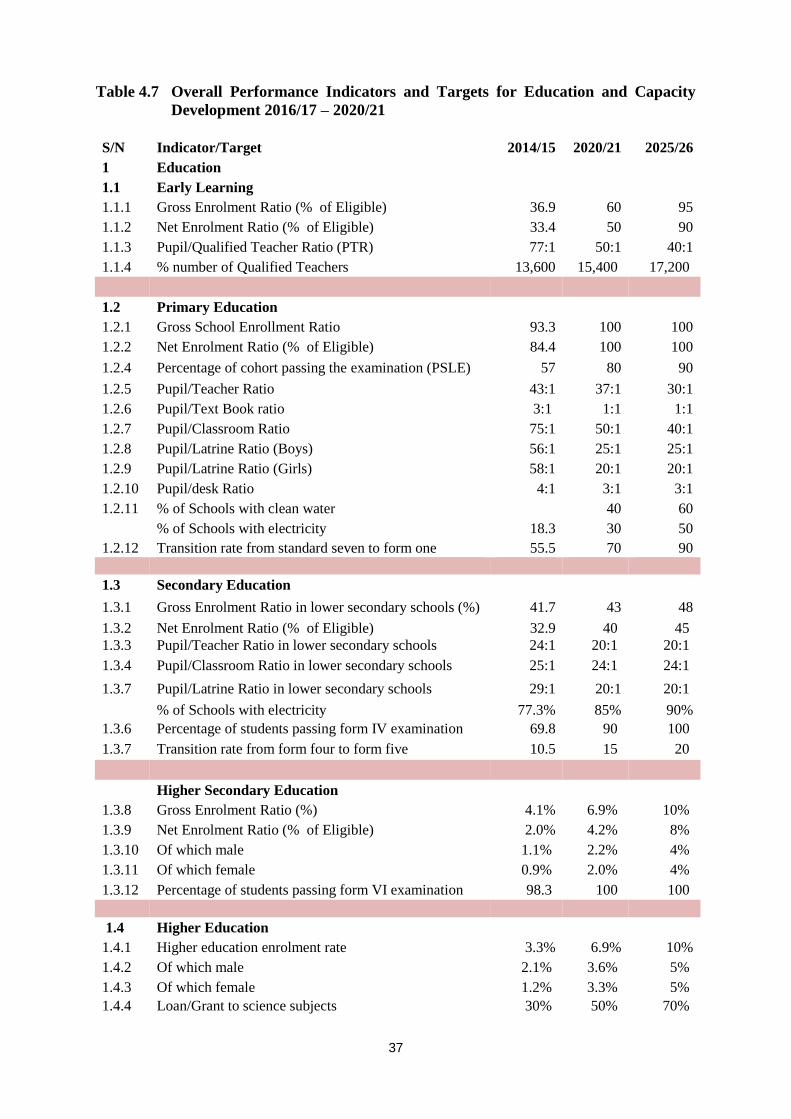
37
Table 4.7 Overall Performance Indicators and Targets for Education and Capacity
Development 2016/17 – 2020/21
S/N Indicator/Target 2014/15 2020/21 2025/26
1 Education
1.1 Early Learning
1.1.1 Gross Enrolment Ratio (% of Eligible) 36.9 60 95
1.1.2 Net Enrolment Ratio (% of Eligible) 33.4 50 90
1.1.3 Pupil/Qualified Teacher Ratio (PTR) 77:1 50:1 40:1
1.1.4 % number of Qualified Teachers 13,600 15,400 17,200
1.2 Primary Education
1.2.1 Gross School Enrollment Ratio 93.3 100 100
1.2.2 Net Enrolment Ratio (% of Eligible) 84.4 100 100
1.2.4 Percentage of cohort passing the examination (PSLE) 57 80 90
1.2.5 Pupil/Teacher Ratio 43:1 37:1 30:1
1.2.6 Pupil/Text Book ratio 3:1 1:1 1:1
1.2.7 Pupil/Classroom Ratio 75:1 50:1 40:1
1.2.8 Pupil/Latrine Ratio (Boys) 56:1 25:1 25:1
1.2.9 Pupil/Latrine Ratio (Girls) 58:1 20:1 20:1
1.2.10 Pupil/desk Ratio 4:1 3:1 3:1
1.2.11 % of Schools with clean water 40 60
% of Schools with electricity 18.3 30 50
1.2.12 Transition rate from standard seven to form one 55.5 70 90
1.3 Secondary Education
1.3.1 Gross Enrolment Ratio in lower secondary schools (%) 41.7 43 48
1.3.2 Net Enrolment Ratio (% of Eligible) 32.9 40 45
1.3.3 Pupil/Teacher Ratio in lower secondary schools 24:1 20:1 20:1
1.3.4 Pupil/Classroom Ratio in lower secondary schools 25:1 24:1 24:1
1.3.7 Pupil/Latrine Ratio in lower secondary schools 29:1 20:1 20:1
% of Schools with electricity 77.3% 85% 90%
1.3.6 Percentage of students passing form IV examination 69.8 90 100
1.3.7 Transition rate from form four to form five 10.5 15 20
Higher Secondary Education
1.3.8 Gross Enrolment Ratio (%) 4.1% 6.9% 10%
1.3.9 Net Enrolment Ratio (% of Eligible) 2.0% 4.2% 8%
1.3.10 Of which male 1.1% 2.2% 4%
1.3.11 Of which female 0.9% 2.0% 4%
1.3.12 Percentage of students passing form VI examination 98.3 100 100
1.4 Higher Education
1.4.1 Higher education enrolment rate 3.3% 6.9% 10%
1.4.2 Of which male 2.1% 3.6% 5%
1.4.3 Of which female 1.2% 3.3% 5%
1.4.4 Loan/Grant to science subjects 30% 50% 70%

38
4.3.2 Creative Industry
Entertaining industry is one of the rapidly growing tertiary economic activities in Tanzania,
attracting massive of the youth labor force in particular. The industry, sometimes known as
show business or show biz, is part of the tertiary sector of the economy and in Tanzania is
broadly defined to include a large number of sub-industries devoted to entertainment. In the
popular parlance, the term show biz in particular connotes the commercially popular
performing arts, especially musical theatre, vaudeville, print, comedy, film, and music,
cinema, television, radio, animation, gaming and visual effects, internet advertising, sports
and all sorts of cultural entertains.
Tanzanians, particularly urban dwellers, are increasingly spending more on entertainment and
projections for the coming years with a steady growth in their disposable income, suggests
entertainment industry in Tanzania and the regional market of East and Central Africa to
expand by 12.5 percent annually over the Plan period. The industry is however still at its
infancy stage and it needs carefully nurturing to reach its fullest potential. Table 4.8 identifies
the performance indicators and targets for the entertainment industry over the Plan period.
Table 4.8 Indicators and Targets for Creative Industry
S/N Indicator/Target 2014/15 2020/21 2025/26
1.1 Annual Growth 12.5
1.2 %Share on GDP
1.3 Number of registered training institutions
1.4 Number of students registered for entertainment
industry training education
1.5 Number of skilled administrators and coachers
Table AII 8 in the Annex identifies strategic interventions to be undertaken to promote the
entertainment industry in Tanzania over the Plan period.
4.3.3 Skills Development
Skills Development is about developing a set of ability, knowledge and attitude of the
national labor force for the purpose of improving productivity, performance and
competitiveness. “Skills development” is a conceived concept and is inclusive of any
abilities, which are useful for making a lawful living, not only those transmitted in education
and training programmed for particular occupations”. The term is not confined to institutional
based training but includes industry and labor market training which may occur in different
settings covering a full range of applied learning at all skills levels – professionals, technical
and vocational.
The recent labor market survey has revealed the following as being the main skills gaps or
concerns:
(i) Tanzania employees do generally have appropriate education qualifications but have,
either low levels or lack of soft or behavioral skills to affect labor productivity
negatively.
(ii) About 80% of the occupations currently available as well as for occupations in
demand in next three to five years are based on science and mathematics related
subjects, while pass rates in Form IV and VI were lowest in mathematics and science
related subjects.
(iii) Another dimension of skills gap is with regard to expectations of graduates as about
79% of graduates are aspiring for wage employment upon completion of their basic
training and only 17% were for self-employment, clearly jeopardizing the goal of

39
promoting self-employment, despite that about 44% of graduates hardly get employed
in a year.
(iv) There has been a growing aspiration to acquire degrees or equivalent qualifications
and many institutions responsible for technical/tertiary education have been converted
into higher learning institutions with far reaching implications on the balance of ratios
between engineers and technicians and artisans.
With the notable gaps of skills in the country as indicated in Table 4.9in comparison with the
set targets 2025, the future approach to skills development will need to be manner that is
more focused to bridge the gaps.
Table 4.9 Indicators and Targets for Skills Development Selected Occupations 2012 2015/16 2020/21 2025/26
Engineering, Manufacturing &Construction 14,196 17,600 58,092 148,800
Agriculture 3,717 4,475 8,908 15,130
Science 16,049 20,920 56,490 87,100
Health and Welfare 48,215 64,000 123,672 212,200
Services, Social Science, Business, Law 105,433 119,529 216,398 401,689
Humanities and Arts 8,738 9,870 18,045 32,680
In accordance with projections made for FYDP I, Tanzania was supposed by 2015 to have
26,000 physical scientists, 88,000 architects and engineers, 22,000 life scientists and 64,000
medical, dental and veterinary scientists. In addition, should have 30,000 economists and
related professionals, 63,000 accountants and financial experts, 320,000 teachers and 130,000
of management skills. To meet this requirement, it was further projected to have at least
80,000 students graduating from tertiary and higher educational institutions and over 230.000
from vocational training schools every year from 2011 to come close to the skills levels for a
country to have sound labor-force reflective of requirements to propel into middle income
status being indicated in Table 4.10 As has been revealed from the implementation review of
the ending Plan these targets could not be attained. There is a need therefore to scale up the
efforts this time round.
Table 4.10 Comparison of Tanzania and Average MIC Skill Levels
Skill Level Occupation Category Tanzania (% of
working
population) 2011
MIC Average % of
Working Population
High Legislators, Managers, Senior Officials 0.2 2.72
Professional 0.7 4.66
Technicians and Associates 1.8 4.73
Medium Clerks 0.4 4.55
Service Workers, Market Sellers 9.1 11.77
Crafts and Related Trade Workers 4.1 17.35
Skilled Agriculture and Fishery Workers n.a 0.42
Low Plant & Machine Operators 1.3 5.66
Agriculture & Elementary Occupations 83.7 48.83
Invariably, the targets set for FYDP II in this regard are indicated in Table 4.11 as follows:

40
Table 4.11 Indicators and Targets for Skills Development, 2015/16 – 2020/21
S/N Indicator/ Target 2014/15 2020/21 2025/26
1.1 Tertiary enrolment rate increased (%) 3.0 4.5 6.0
1.2 Annual number of students graduating from
tertiary/higher education
40,000 80,000 120,000
1.3 Of which % of women/girls 36% 48% 50%
1.4 Average annual number graduates from vocational
schools
150,000 700,000 1,000,000
1.5 People with skills obtained through informal system
learning for six priority sectors (annually)
20,000 200,000 250,000
1.6 Internship training or graduates at the working places
(annually)
10,000 230,000 300,000
1.7 Apprenticeship training for students at the working
places (annually)
1,000 20,000 30,000
1.8 % of working population with high level skills 3.6 12.1 12.1
1.9 % of working population with medium level skills 16.6 33.7 33.7
1.10 % of tertiary and higher learning with access to student
loan
45.6 80 90
1.11 Of which % of science and engineering students 30 56 63
1.12 Improved satisfaction of employers with quality of
local employees (%)
44 60 70
Specific interventions proposed in view of raising the availability and quality of skilled labor
force are annexed in Table AII 9
4.3.4 Health Health is a sector with many dimensions including care outside of the context of everyday
usage of the term. While it is an end in itself (e.g. reduced deaths, longevity, etc.), providing
quality health care ensures that people are fit to participate in economic activities. Tanzania
has made significant process in reducing child mortality, combating malaria, addressing non-
communicable diseases, among others. These gains must be sustained and consolidated. In
some areas, e.g. maternal mortality, progress has been slow and more efforts are required.
Addressing this depends critically on strengthening of health service delivery system with
service delivery geared towards improving the health of mothers and children. It also entails,
addressing the prevalent illnesses such as malaria and HIV and AIDS which are major causes
of deaths as well as address human resource crisis which constrains provision of adequate
health care.
Another important input to human development is access to clean and safe drinking water by
the individuals and citizenry. While commendable gains are recorded in the past period,
much is needed to ensure majority of Tanzania with access clean and safe water in close
distance and reasonable shortest time possible. The challenges are surmountable, as
highlighted in chapter two whereas in 2015, only 67 percent have access to clean water
sources in rural areas. And, in Dar es Salaam about 68 percent of the Dar es Salaam residents
had access to clean water by 2014. Though urban areas are better off than rural areas,
challenges remain too. Efforts are needed in terms of investment in water sources
infrastructures and distribution to households including proper treatment of water sources to
reduce and or eliminate water borne diseases, which in the end reduces burdens in the health
sector. Water supply is very much related to environment

41
Table 4.12 Indicators and Targets for the Health Sector
S/N Indicator/Target 2014/15 2020/21 2025/26
2.1 Heath
2.1.1 Infant Mortality Rate per 1,000 births 45 42 40
2.1.2 Under five Mortality Rate per 1,000 births 81 45 40
2.1.3 Births attended by a skilled health worker (Percentage) 51 75 90
2.1.4 Maternal Mortality Rate per 100,000 432 250 220
2.1.5 Life Expectancy (Years) 62 66 70
2.1.6 National HIV Prevalence rate (Percentage) 5.1 3 1.5
2.1.7 Access to safe water and sanitation in urban areas (% of
total) 86 90 95
2.1.8 Access to safe water and sanitation in rural areas (% of
total) 67.7 80 90
2.1.9 Health expenditure, public (% of Govt. expenditure) 8.1 15 15
2.1.10 Percentage of people reported to travel a long distance to
health services facilities 36 25 15
2.1.11
Specific interventions related to health are outlined in Table AII10
4.3.5 Water Supply and Sanitation Services
Water is one of the vital natural resources that touch all aspects of human life; from domestic,
agricultural and industrial development to the cultural and religious values embedded in
societies. In that respect, water is a very important resource for socio-economic development
in any country. Availability of adequate clean, safe and affordable water and sanitation
services in a country has impact on improving the standard of living of people as well as
contributing to economic growth. The Government continues to invest in the development of
water resources and increasing access to safe and clean water as part of broader development
strategy. In that regard, various interventions have been done aimed at the protection,
conservation and efficient utilization of water resources for agriculture, industry and
improving access to water supply and sanitation services in rural and urban areas.
However, the Government is cognizant that meeting the set targets calls for huge investments
in water supply infrastructure in both rural and urban areas. This adds to other factors such as
increasing multi sector demands, environmental and water degradation due to pollution, over
abstraction, poor land use practices and encroachment of land for agriculture, urbanization
and industrial development to increase pressure on water sources. Therefore, as we think of
increasing water supply services for domestic, industries, irrigation and other socio-economic
needs; we also need to increase investments in water resources management to ensure water
resources are available and utilized in a sustainable manner.
For the past first five years, commendable gains are recorded; much is needed to ensure
majority of Tanzania with access clean and safe water in close distance and reasonable
shortest time possible. The challenges are surmountable, as highlighted in chapter two
whereas in 2015, a total 21.8 million people equivalent to 68.9 percent have access to clean
water sources in rural areas; 86 percentage of people living in urban Centre’s with access to
safe and clean water services and, in Dar es Salaam about 72 percent of the Dar es Salaam
residents had access to clean water by 2015.It is important to notice that, the delivery of the

42
planned targets requires a significant increase in financial and human resources. The table
bellows summaries the targets to be achieved in the forthcoming five years:
4.3.6 Urban Planning, Housing and Human Settlement Development
The low level of productivity in particular, characterizes Tanzanian urban areas, and cities by
global standards. Moreover, most of the enterprises in urban areas are small, informal, and
usually bypassed by the benefit from the process of urbanization due to low urban density
and limited trickle down of urbanization economies. As such, inadequate urban infrastructure
and basic services constrains the potential economic benefits to be derived from the growth of
cities due to disconnections between people, industries, and markets.
The Plan is informed that the majority of Tanzanians will live in urban areas in the near
future and therefore support interventions prepare Tanzania capitalize on this and develop
thriving, efficient cities that function well by providing people and firms with basic services
of an adequate quality, including providing productive job opportunities. Without such
preparedness, Tanzania risks to have poor quality of urbanization, which leave Tanzania with
a network of poorly planned and serviced cities. The strategic direction of the Plan is to
ensure that, increasingly, Tanzania is characterized by planned and serviced urban
settlements with functioning town planning procedures, including improved solid and liquid
Water and Sanitation 2015/16 2020/21 2025/26
1. Percentage of rural population with
access to piped or protected water as
their main source
72 85 90
2. Proportional of the households in
Rural areas with improved sanitation
facilities
25 75 85
3. Percentage of Regional Centre’s
population with access to piped or
protected water as their main source
86 95 100
4. Percentage of households connected
to convention public sewer systems in
Regional Centre’s
20 50 70
5. Percentage of Non Revenue Water
(NRW) for Regional Centre’s
37 25 20
6. Percentage of district capitals and
areas small towns population with
access to piped or protected water as
their main source
60 70 85
7. Percentage of Dar es salaam
population with access to piped or
protected water as their main source
72 95 100
8. Percentage of household connected to
convention public sewer systems in
Dar es Salaam
10 40 60
9. Percentage of Non Revenue Water
(NRW) for Dar es Salaam
47 30 25
10. Number of water sources demarcated
and gazette for protection and
conservation
59 161 250
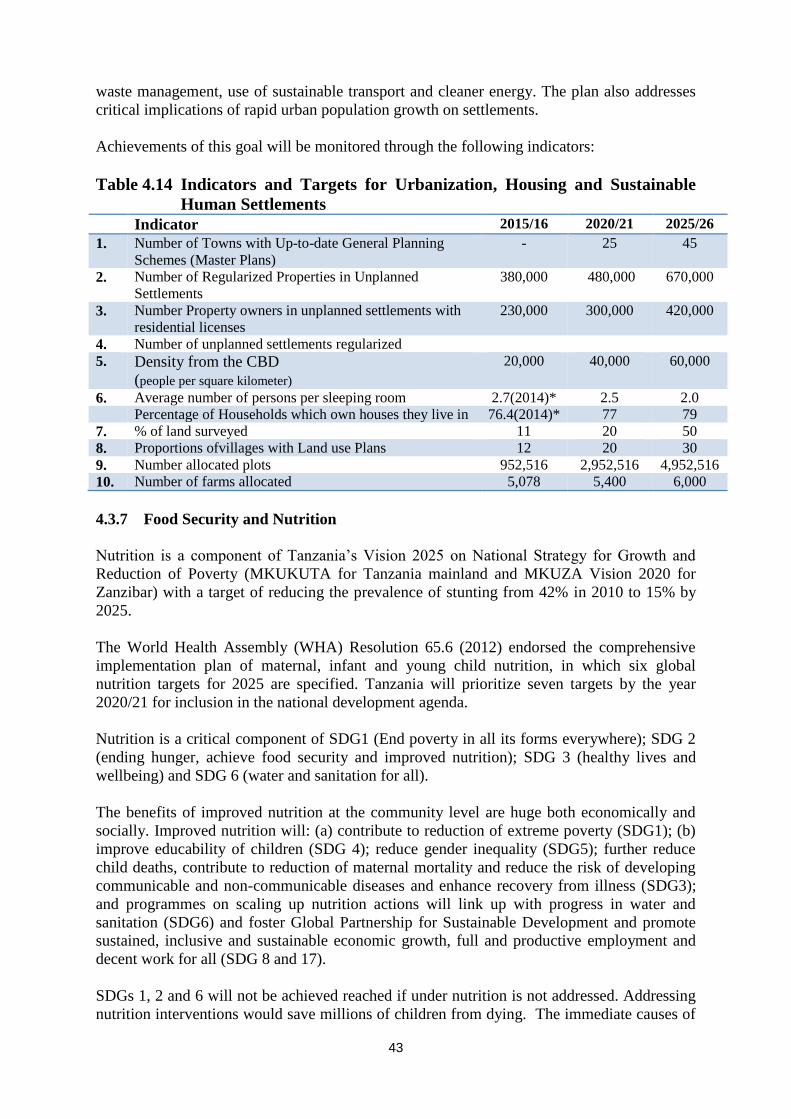
43
waste management, use of sustainable transport and cleaner energy. The plan also addresses
critical implications of rapid urban population growth on settlements.
Achievements of this goal will be monitored through the following indicators:
Table 4.14 Indicators and Targets for Urbanization, Housing and Sustainable
Human Settlements
4.3.7 Food Security and Nutrition
Nutrition is a component of Tanzania’s Vision 2025 on National Strategy for Growth and
Reduction of Poverty (MKUKUTA for Tanzania mainland and MKUZA Vision 2020 for
Zanzibar) with a target of reducing the prevalence of stunting from 42% in 2010 to 15% by
2025.
The World Health Assembly (WHA) Resolution 65.6 (2012) endorsed the comprehensive
implementation plan of maternal, infant and young child nutrition, in which six global
nutrition targets for 2025 are specified. Tanzania will prioritize seven targets by the year
2020/21 for inclusion in the national development agenda.
Nutrition is a critical component of SDG1 (End poverty in all its forms everywhere); SDG 2
(ending hunger, achieve food security and improved nutrition); SDG 3 (healthy lives and
wellbeing) and SDG 6 (water and sanitation for all).
The benefits of improved nutrition at the community level are huge both economically and
socially. Improved nutrition will: (a) contribute to reduction of extreme poverty (SDG1); (b)
improve educability of children (SDG 4); reduce gender inequality (SDG5); further reduce
child deaths, contribute to reduction of maternal mortality and reduce the risk of developing
communicable and non-communicable diseases and enhance recovery from illness (SDG3);
and programmes on scaling up nutrition actions will link up with progress in water and
sanitation (SDG6) and foster Global Partnership for Sustainable Development and promote
sustained, inclusive and sustainable economic growth, full and productive employment and
decent work for all (SDG 8 and 17).
SDGs 1, 2 and 6 will not be achieved reached if under nutrition is not addressed. Addressing
nutrition interventions would save millions of children from dying. The immediate causes of
Indicator 2015/16 2020/21 2025/26
1. Number of Towns with Up-to-date General Planning
Schemes (Master Plans)
- 25 45
2. Number of Regularized Properties in Unplanned
Settlements
380,000 480,000 670,000
3. Number Property owners in unplanned settlements with
residential licenses
230,000 300,000 420,000
4. Number of unplanned settlements regularized
5. Density from the CBD
(people per square kilometer)
20,000 40,000 60,000
6. Average number of persons per sleeping room 2.7(2014)* 2.5 2.0
Percentage of Households which own houses they live in 76.4(2014)* 77 79
7. % of land surveyed 11 20 50
8. Proportions ofvillages with Land use Plans 12 20 30
9. Number allocated plots 952,516 2,952,516 4,952,516
10. Number of farms allocated 5,078 5,400 6,000

44
malnutrition which are inadequate food and diseases are exacerbated by poor maternal and
childcare practices and inadequate access to health care. Poor nutrition affects health
outcomes and vice versa. Interventions to scale up for improved nutrition outcomes that can
most be feasible will include; breastfeeding promotion and support, complementary feeding
promotion and support, hand washing and hygiene behaviours, Vitamin A supplementation
deworming, therapeutic zinc, iron and folic acid (for pregnant women), multiple
micronutrient powders, prevention and treatment of severe and moderate acute malnutrition.
The malnutrition-infection relationship is the most obvious and understood with inadequate
dietary intake causing weight loss and hence growth faltering and hence vulnerability to
infections and morbidity. Diseases also alter metabolism, nutrient absorption and loss and
lack of appetite, hence weight loss, growth faltering and hence malnutrition.
Poor nutrition affects health outcomes, with micronutrients deficiencies depressing the
immune system, poor pregnancy outcome and susceptibility to infections, and severity of
infectious diseases.
Poor health affects nutrition outcomes with infections resulting in micronutrient deficiencies,
depleting of body nutrient stores, suppressing appetite and limit the ability of women to care
for the child.
Under nutrition is the largest contributor of child deaths, which has direct implications for
goals 1, 2 and 6 of reducing child mortality. The proposed interventions will; reduce
micronutrient deficiencies among vulnerable groups, reduce prevalence of anaemia in
pregnant and lactating women and children0-24 months, achieve optimal breastfeeding and
complementary feeding practices (increase EBF rates), reduce low birth weight, moderate
and severe wasting (impacting on morbidity and stunting levels). These outcomes directly
relate to high-level health systems improvement in sustainable ways, as interventions will be
embedded on capacity development of health facilities and technical staff to deliver on
selected interventions coupled with strengthened monitoring systems for effective nutrition
and health outcomes.
Table 4.15: Indicators and Targets for Food Security Interventions
Food Security and
Nutrition indicators 2015/16 2020/21 2025/26 International threshold cut-off
prevalence rates for public
health significance (%) at <-2SD
Mild Moderate Severe
Food Self Sufficiency
Ratio
Reduce the prevalence
of stunting in children
aged 0 – 59 months
from 35% in 2016/17
to 28% in 2020/21
34.7 % 28% 15% 10-<20 20-<30 30 and
above
Wasting (weight for
height) of under fives
Maintain prevalence of
acute malnutrition
(Wasting) among
children aged 6 – 12
years at <5% by
2020/21
3.8 <5 Maintain
<5
1-<5 5-<10 10 and
above

45
Food Security and
Nutrition indicators 2015/16 2020/21 2025/26 International threshold cut-off
prevalence rates for public
health significance (%) at <-2SD
Mild Moderate Severe
Reduce by 25% the
current level the
prevalence of anaemia
among women of
reproductive age
(haemoglobin
concentration <11g/dl)
by 2020/21
40% Reduce
by 25%
from
baseline
Reduce
by 50%
from
baseline
10-<20
20-<30 30 and
above
To increase the
proportion of
household accessing
adequately iodized salt
from 64% to 90% by
2020/21
64% 80%
90%
Reduce by 10% the
current level of the
prevalence of Low
Birth Weight (LBW)
among Children by
2020/21
7% (of 53
delivered
in a
health
facility)
Reduce
by 10%
Reduce
by 30%
Increase the rate EBF
from 41.8 % to at least
50 % by 2020/21
41.8 50% 60%
Reduce the prevalence
of vitamin A
deficiency among
children aged 6 – 59
months (serum retinol
level < 20 µg/dl) from
33% in 2010 to < 25%
by 2020/21.
33% <25% <20% 5-<10 10-<20 20 and
above
4.3.8 Poverty Reduction and Social Protection Efforts to reduce poverty in Tanzania have been a continuous activity since Independence. A
number of initiatives were developed for guiding national efforts towards achieving
transformation that will enable the country become a middle income country and rid herself
of abject poverty by 2025. Towards achieving the later objective, national efforts have been
rallied through the National Strategy for Growth and Reduction of Poverty
(NSGRP/MKUKUTA) I (2005-2010) and II (2010 – 2015). In the same vein of attaining
TDV 2025 goals, the Government launched the Long Term Perspective Plan (LTPP)
spanning 2011/2012 to 2025/2026 with the objective of reviving planning, which is essential
for achieving transformation. LTPP is being implemented in three sequential Five Year
Development Plans (FYDPs) with the first covering the period 2011/2012 to 2015/2016.

46
Assessment of all these efforts have indicated mixed results including a number of
challenges, which require further initiatives to address them. One of these efforts is the design
of the Second Five Year Development Plan which integrates poverty reduction issues
including Social Protection to help reduce poverty; avoid economic deprivation and
vulnerability, protect human rights and improve capabilities and labor market results through
increased human capital, inclusive growth, decrease inequality and increase social cohesion.
Table 4.16highlights some of the proposed targets to the realization of the Plan with regard to
poverty reduction and social protection.
Table 4.16 Indicators and Targets for Poverty Reduction and Social Protection
Social Protection 2014/15 2020/21 2025/26
Coverage of health insurance scheme
NHIF 7.2 22
CHF 12.8 22
Coverage of the social security scheme 7.3 30
Inspectors per 10,000 employed persons TBD TBD
Proportion of eligible elderly receiving
pension
Youth percentage in vulnerable
employment
82.3 56.3
Employed persons to have suffered work
related injuries and illness
22.3 TBD
Proportion of children with disability
attending primary school
76 100
Proportion of orphans attending schools TBD
Children aged 5-17 engaging in child
labor
28.8 24.9
Proportion of eligible elders receiving
free medical services
Proportion of people living with
disabilities engaged in economic
activities
7.0 Poverty Reduction
Basic needs poverty (National) 28.2 19.3
Basic needs poverty rural areas 33.3
Basic needs poverty urban areas 21.7
Basic needs poverty Dar es salaam 4.1
Food poverty (National) 9.7
Food poverty rural areas 11.3
Food poverty urban areas 8.7
Food poverty Dar es salaam 1.0
Inequality (National) 0.34
Inequality rural 0.29
Inequality urban 0.37
Inequality Dar es salaam 0.35
Unemployment rate 10.3

47
4.3.9 Good Governance
The Government of Tanzania has continued to pay attention and according high priority
governance and accountability, taking into account the effects of ineffective management of
the public sector. Mismanagement of public resources, corruption, poor service provision,
tax evasion, and unnecessary bureaucratic snags are some of the effects, which have
significant bearing on the achievement of development goals. The realization of the goals and
targets of the second Five Year Development Plan (FYDP II), therefore, hinges on the
existence of good governance ad effective accountability. These are essential to ensuring
good use of the resources in accordance with the plans, effective participation of the private
sector in developing industries and enterprises that spur economic growth and create jobs,
and effective participation of citizens in demanding accountability and respecting the rule of
law. While governance is covers broad spectrum of areas, this FYDP focuses on few
components considered necessary for achieving its main objectives. These are (i) Effective
use of the rule of law (ii) Enhanced democracy, political and social tolerance (iii) peace,
security and political stability (iv) Good corporate governance, and (v) Active role of state in
economic governance.4Table 4.17summarizes some of the envisaged targets to the realization
of the Plan with regard to good governance.
Table 4.17 Indicators and Targets for Interventions Related to Good Governance
S/N Indicator/Target 2014/15 2020/21 2025/26
3. Good Governance
3.1.
Number of corruption cases convicted as a percentage of
total number of investigated cases sanctioned for
prosecuted
10.39 23 33
3.2
% of court cases that have not been disposed for more
than 24 months as a % of all court cases (criminal and
civil cases)
10 5
3.3 CPIA transparency, accountability, and corruption in the
public sector rating (1=Low to 6=High) 4 4.5
3.4 Proportion of births registered within 90 days after birth 6.04 90 95
3.5 Seats of Women in Parliament (% of total) 36.5 44 50
3.6 Proportion of population reporting to be satisfied with
government basic services
3.7
% of those contacting a service provider that paid a
bribe, by sector (Lands, Education Health, Judiciary
systems, Police, Tax administration) within the last year
TBD TBD
3.8 Percentage of turnout of eligible voters in regular
elections and by-elections
3.9
Proportion LGAs posting public budgets, revenue and
actual expenditures on easily accessible public notes
boards
4The use of “state” here refers to the government and public institutions responsible for public administration,
regulations, and provision of economic and social services

48
S/N Indicator/Target 2014/15 2020/21 2025/26
3.10
Percentage of villages that have functioning village
office (Functioning village office refers to office that has
a physical address comprising at least a room, a meeting
space, a filing system, basic office furniture such as desk
and chairs; basic office materials such as pens, paper
and envelopes; and a whether proof notice board to
which the public have ready access)
4.4 Environment for Doing Business
Over the past 5 years, Tanzania has improved its business regulatory landscape and that has
been able to create a relative conducive environment to investments. However, World Bank
report reveals that Tanzania has not been very successful in improving business environment.
In fact, it ranks Tanzania among countries with worsening global rank on most key business
environment indices. The deteriorating global ranking of Tanzania in ease of doing business
suggests that other countries have been doing much better as compared to Tanzania.
In this context, future undertakings to improve business environment for Tanzania, require a
new and more effective approach. Consequently, concerted efforts are needed at the policy
and institutional levels to coherently align visions and processes amounting to attracting
investment flows and facilitation for their prospects commensurate with agreed objective
targets and milestones over the coming years. These efforts will have to include also
continuous improvement of business climate for existing domestic and foreign investors
through infrastructure development; quality of services and facilitative regulatory framework.
In this light, Table 4.18establishes the performance indicators to the implementation of FYDP
II towards improving environment for doing business and investment in Tanzania. Three
categories of interventions have been distinguished to involve (i) improvement on the quality
of business supportive infrastructure and services, (ii) improvement in the global ranking of
Tanzania in ease of doing business, and (iii) reforms to be undertaken in view of realizing
specific area targets as follows:
Table 4.18: Performance Indicators for Enhancing Ease of Doing Business in
Tanzania during FYDP II
S/N Indicator/Target 2025/26 2014/15 2020/21
1. Infrastructure (Position in Global ranking) 100 102 102
1.1 Road (Position in Global ranking) 102 112 106
1.1.1 %of paved road length of total road network 15 6.8 10
1.1.2 % of districts connected to each other by
paved road
50
1.2 Railway (Position in Global ranking) 78 88 84
1.2.1 Length in Km of standard gauge 2,000 0 1,341
1.3. Ports(Position in Global ranking) 98 106 102
1.3.1 Cargo Freight (‘million tons) per year
1.3.2 % Share on Total Foreign Exchange
Earnings

49
S/N Indicator/Target 2025/26 2014/15 2020/21
1.4 Electrical Power (generation in MW) 10,000 1501 4,915
1.4.1 Electricity – Regions connected to national
grid
26 19 23
1.4.2 Electricity – national grid length (in km) 13,165 4901 9511
1.4.3 Electricity – Per capita consumption (KWh) 490 108 377
1.4.4 Reduced Power losses percentage 12 19 14
1.5 Water – Total population access to piped
water
1.6 % of Population – usage of telephone 80 57.29 66.64
1.6 % of Population – internet 80 22 66.64
1.8 % of public institutions connected to e-
Government
100 100
Interventions to be taken towards improving the business environment during implementation
of the plan are outlined in Table AII 16-17
4.4.1 Global Competitiveness
2025/26 2015/16 2020/21
2 Ease of Doing Business (Global Ranking) 95/189 139/189 100/189
2.1 Staring Business 91/189 129/189 111/189
2.2 Dealing with Construction Permits 87/189 126/189 100/189
2.3 Getting Electricity 29/189 83/189 44/189
2.4 Registering Property 55/189 133/189 94/189
2.5 Getting Credit 100/189 152/189 113/189
2.6 Protecting Investors 40/189 122/189 83/189
2.7 Paying Taxes 92/189 150/189 121/189
2.8 Trading Across Borders 102/189 180/189 141/189
2.9 Enforcing Contracts 14/189 64/189 25/189
2.10 Resolving Insolvency 45/189 99/189 60/189
4.4.2 Sector Specific Interventions
3 Macroeconomic Stability 2015 2020 2025
3.1 %Economic Growth 7.0 10.0 10.3 3.2 Per capita GDP (US$) 1005 1500 2567 3.3 Change in Inflation (%) 5.1 5 5 3.4 Exchange Rate 1985.39 2185.62 2686.62 3.5 Foreign Exchange Reserve (months of
import bill)
4.8 4.0 4.0
3.6 Balance of payments (current Account
balance/GDP)
-7.35 -20.78 -18.06
4 Budget (Tshs bill) 14,604 32,663 62351
4,1 Of which % of Recurrent 74.5 67.2 59
4.2 Of which % of development 25.4 32.8 41
4.3 Of which % allocation to RA and LGAs
5.1 Total Revenue Collection (Tsh bill) 10958 35168 86434
5.2 Total revenue to GDP (%) 14.3 18.3 18.5

50
5.3 Of which Tax revenue % of Total 90.27 93.2 93.2
5.4 Tax revenue to GDP (%) 12.1 17.1 17,3
5.5 Of which non-tax revenue % of Total 9.72 6.8 6.8
Non tax revenue to GDP (%) 1.3 1.1 1
5.3 Of which RALGAs % of total revenue
6 Finance (domestic vs. external)
6.1 % of population with bank account
6.2 % of firms with bank account
6.3 % loans to private sector to GDP 17 59 70
6.4 Difference on interest rate 5.64 5.81 7.4
4.5 Flagship Projects of the Plan
Out of the prioritized projects and implementation effectiveness interventions, the plan has
identified a few to the status of flagship projects. These are the projects representing the
critical path to the realization of the Plan. By characteristics, flagships are project large
enough to influence and catalyze the envisaged transition towards Tanzania’s
industrialization and socio-economic transformation and vividly demonstrating changes in
relation with the set Plan objective targets. As such, the choice of these projects based on
their potency to propel Tanzania’s supply structure to the higher level of growth,
sophistication, value chain and competitiveness to allow effective integration alignment of
the economy in the evolving market dynamics nationally, regionally and globally. In
addition, the select flagship projects had fulfilled the basic criteria for any project to be
considered for the Plan, including:
i. Based on the country’s comparative advantages;
ii. Strategic geographical advantage and potency of positioning the country as a
regional trade gateway and logistics hub;
iii. Creating employment for the growing young labor force of all gender;
iv. Increasingly mainstreaming the country’s rural economy and primary commodity
production amid the growing regional and global value chains; and
v. Bolstering efforts for human development and poverty reduction.
In view of the fore criteria, the Plan has the following select flagship projects:
i. Realization of the Central Development Corridor, with it comprising the following
projects:
a) Development of the proposed new Bagamoyo Port and expansion and
modernisation of the Dar es Salaam, Mwanza and Kigoma Ports;
b) Establishment of Bagamoyo Special Economic Zone, the Kurasini Trade and
Logistics Centre, the Dodoma Trade and Logistics Centre, and Kigoma Special
Economic Zone;
c) Establishment of the Agricultural City of Mkulazi;
d) Development of Machinery and Automotive Assembly Industries;
e) Construction of a new Central Railway Line to Standard Gauge.
ii. Development of the North-West Corridor of Tanga, with which the following
projects have been identified:
a) Expansion and modernization of the Tanga Port;
b) Development of Tanga Special Economic Zone;
c) Rehabilitation and revitalization of operations in the Ruvu –Tanga – Moshi spur
of the Central Railway Line;

51
d) Construction of the Arusha – Musoma Road;
e) Construction of the Lake Albert (Uganda) – Tanga oil-pipeline; and
f) Soda Ash Refinery and development of associated chemical and glass sheet
industries.
iii. Development of the Mtwara Development Corridor, involving the following
projects:
a) Expansion and modernization of Mtwara Port;
b) Mtwara Petrochemical Special Economic Zone;
c) Preparatory works for the construction of Liquefied Natural Gas Plant;
d) Iron Ore Mining and Iron and Steel Complex Plant; and
e) Preparatory works for establishment of the gas-based Fertilizers Plant
f) SAGCOT
g) Preparatory works for construction of Mtwara – Liganga Mchuchuma Railway
Line to standard gauge
iv. Improving availability and reliability of electrical power, particularly:
a) Increasing power generation by 2,899.3 MW from a mix of fuel sources – gas,
hydro, geothermal, wind and coal.
b) Enhancing power transmission by constructing 3,119.3 km of 400 kV and 549
km of 220 kV in various parts of the country.
c) Enhancing rural electrification.
d) Improving power distribution for Arusha, Dar es Salaam and Mwanza Cities.
v. Mass training for development of rare and specialized skills for industrialization and
human development and fostering science, technology and innovations, for which the
following interventions have been flag-shipped:
a) Completion and operationalization of Mlonganzila and Dodoma Schools of
Medicine;
b) Strengthening the training and scholarship provision fund for scientists,
engineers and other rare professionalisms;
c) Increasing budget allocation for research and development activities;
By design, one common feature in all five set of flagship is their package approach, such that
a set will be completed if each of the components is adequately completed. This is why the
Plan emphasizes proper sequencing of the implementation within the set of flagships.
Moreover, within the corridors, the implementation will require zoning and clustering. Thus,
effective coordination is key for effective implementation and therefore, a robust work-plan
shared across actors will be required to ensure each one is fully informed what and when to
execute their components within a sect of flagship. These issues are subject matters of the
chapter on implementation.

52
5.0 FINANCING STRATEGY
5.1 Overview
Success in Plan implementation hinges, amongst others, on national capacity to mobilize
financial resources, from both domestic and external sources, as well as ability to utilize those
resources effectively and efficiently. Financing of public spending in Tanzania has been
mainly relying on mobilization from the so-called traditional revenue sources of domestic and
external. Lessons of past performance have revealed these sources are generally insufficient.
The orientation of Plan requires more resources especially for financing industrialization.
As indicated in Chapter 4, implementation of the Plan requires Tshs xxxxxx, hence the urgent
need to augment its financing sources. This chapter presents strategies and reforms to be
undertaken in mobilizing adequate resources to finance planned development activities and
general public services delivery. It covers strategies to be deployed for both domestic and
external sources and the way of channeling them for implementation in the public sector and
private sector as well as other actors. Table 5.1 summarizes the contribution from each
source.
The chapter also proposes complementary measures for effective and efficient expenditure
execution and predictability in delivery of the mobilized resources. The combined effect of
the two measures has the potential of increasing government fiscal space in general and space
for development spending in particular.
Revenues projections are made based on the following assumptions: Real GDP to grow at 7.8
percent on average annually and implementation of prudent fiscal reforms that will unlock
new revenue sources and reduce leakages. FDIs in the gas sector are assumed to begin
flowing in 2018/19.
Table 5.1: Sources to the Financing of the Plan 2016/17 2017/18 2018/19 2019/20 2020/21
Sources 48,203,779 71,979,676 102,503,323 141,797,831 189,047,867
Public/Government 20,157,292 23,641,461 28,796,114 34,337,396 39,705,471
O/w Tax 14,300,187 17,475,721 22,373,333 27,645,397 32,775,084
Non-tax 1,408,555 1,542,874 1,670,581 1,806,699 1,947,160
Grant 1,248,836 1,295,806 1,344,953 1,395,943 1,443,870
o/w domestic 136,000 136,000 136,000 136,000 136,000
Foreign 1,156,631 1,184,505 1,213,052 1,242,287 1,272,370
Borrowing 3,199,714 3,327,060 3,407,247 3,489,357 3,539,357
o/w domestic 1,597,157 2,003,356 2,508,506 3,052,412 3,082,412
Foreign 1,602,557 1,323,704 893,741 436,945 456,945
Private sector 28,046,487 48,338,215 73,707,209 107,460,435 149,342,396
o/w Domestic 22,272,575 39,618,300 58,592,540 87,644,898 127,842,234
FDIb 5,773,912 8,719,915 15,114,669 19,815,537 21,500,162
Tax to GDP ratio 15% 15% 16% 18% 18%
Non- tax to GDP ratio 1.3% 1.3% 1.2% 1.1% 1.0%
Source: MACMOD Feb 2016, most data from GFS; b= Balance of Payment (BOP)
Figures for fiscal years were computing averages
It has to be noted that the Government has made a decision to spend 30-35 percent of its total
revenue for development activities, starting with 6.08 trillion shillings in year 2016/17 up
to13.9 trillion shillings in 2020/21.
The strategies presented in this chapter are built on the desire of the Plan to: (i) scale up
domestic revenue mobilization; (ii) identify opportunities for public-private partnerships; (iii)
make sure that priority investments secure full funding to ensure results; (iii) develop the

53
domestic financial market to leverage private sector financing and strengthen private long-
term domestic financing; (iv) build strong debt management capacity in the Government; (v)
build a strategy to reduce borrowing costs including leveraging guarantees from multilateral
financial institutions and develop domestic debt market.
5.2 Government/public resources
5.2.1 Tax revenue
This is a conventional means of raising public revenue for government spending. The tax
revenues will raise from 16,043,391.40 in 2016/17 to 35,168,919.17 in 2020/21, which
results in a ratio of tax revenue to GDP of 18 percent by 2020 (from current around 13
percent).
To achieve this increase, the Government needs, therefore, to take deliberate actions to
reform the taxation system and step-up revenue collection by encouraging compliance and at
the same time expanding tax base. This will involve the following measures geared to:
i. Strengthening collection of various taxes such as import duties, excise duties, VAT
and other taxes using maximum automation in order to reduce human influence. This
measure will go parallel with building the capacity within TRA to monitor transfer
pricing and invoice mispricing;
ii. Strengthening customs tariff collections at Dar es Salaam port, all border posts and
all inland Container Terminals in the country so as to curb tax evasion and
avoidance;
iii. Expanding the tax net by bringing in informal sector and taxing incomes that are not
channeled through the payroll. The strategies address the challenges of absence of
systems and mechanisms to reach many taxpayers by linking the Taxpayer
Identification (TIN) system and the national identification (ID) system and the
limited knowledge of potential taxpayers who fall in the informal sector economy.
The later will entail an exercise to quantify the size of the informal economy and
enforcing compliance;
iv. Strengthening the capacity of the Local Governments to mobilize resources through
proper identification of local revenue potentials and addressing the key factors
undermining their revenue collection capacity. The strategies including building and
maintaining the technical and professional capacity to operate and maintain the ICT
revenue collection systems at local and central level.
v. Developing a framework for taxing mobile money payments for revenue collection
from electronic payments;
vi. Intensifying mining inspections including verification of quantities, contents of
mineral production and regular auditing of mining company transactions;
maximizing collection of both taxes and royalties from mineral resources; and
strengthening the capacity of Tanzania Minerals Agency (TMA) and Tanzania
Extractive Industries Transparency International (TEITI);
vii. Enhancing measures that will ensure maximum collection from auctioning of hunting
blocks, sale of trophies, and charges and fees.
viii. Minimize exemptions whose efficacy and intended impact are doubtful, e.g.
exemption on oil used some mining companies. This will require reforms which
induce shift in socio-culture among the benefiting elite, political leaders and
organizations and requires strong will and commitment by the political leadership.
ix. Ensure corruption zero temperance in all aspects of revenue collection across all
MDAs and LGAs.

54
TRA will be strengthened by building on new initiatives introduced since elections in
October 2015, – including efforts to improve TRA relations with taxpayers, close loopholes
leading to revenue leakages, legally enforce requirements for businesses to pay unpaid tax
charges (e.g. taxes due for unpaid container charges) and improved monitoring – to boost tax
compliance. All tax reforms will be carrying out a with view of achieving high revenue
collection without suffocating the private sector.
As efforts to increase collection are strengthened, efforts will also be directed to minimize the
application of tax exemptions, building on existing reforms under the VAT Act of 2014, and
following through on government plans to reduce the value of tax exemptions to 1% of GDP
from the current level of around 1.5% by 2017/18.
For implementation effectiveness, the Government will continue to earmark some tax
revenues for specific investment of national interest and continue strengthening the existing
ones, such as:
i. Road Fund
The road fund is collected through fuel levy and is the primary source of road projects
financing in the country.
ii. REA
The Rural Energy Fund (REF) represents a mechanism to finance rural electrification.
This Fund will utilise opportunity through Climate Change Fund to encourage
renewable energy sources.
iii. Railway Development Fund.
The fund serves as a market entity for railway investment and financing. The fund is
projected to invest at least 70 percent of its capital in railway projects.
iv. Skills Development Fund
The Plan will continue the Government resolves to gradually reduce the level of skills
development levy and earmarked the funds so generated exclusively for skills
development in the country. The portion of the funds, which goes to support higher
education, will be reviewed in tandem with reforms to making the Higher Education
Student Loan Board (HESLB) run based on loan recovery with some modest interest
rate. Studies in other countries show that private returns to higher education are higher
enough to enable graduate to service the education loan in semi-commercial basis.
5.2.2 Non-tax revenue (NTR)
Non-tax revenue is an area where potentials have not adequately been exploited. Under the
plan, non-tax revenue collection will increase from 1,408,555.89 in 2016/17 to 1,947,160.35
in 2020/21. The government will enhance collection of non-tax revenue from all potential
sources (agencies, public assets, etc.) in order to augment tax revenue. The sources will
include:
i. Rents, concessions, and royalties;
ii. Dividend from state-owned enterprises;
iii. Revenues from sales of state assets;
iv. Revenue (including interest or profit) from investment funds (collective investment
schemes);
v. Fines and assets forfeitures collected as a penalty;
vi. Fees for the granting or issuance of permits or licenses;

55
vii. User fees for the use of public services and facilities;
viii. Donations and voluntary contributions; and
ix. Tribute and/or indemnities.
A part of revenue collection function will be outsourced to private collectors to reduce costs
and to increase collection efficiency. As for MDAs, the Government will review existing
retention schemes with a view to harmonizing them and introducing incentives for MDAs to
actively pursue sustainable growth in NTR. Furthermore, the Government will set-up
appropriate schemes that would incentivize MDAs to pursue revenue collection as a key
performance indicator, both for individual officers and for relevant departments.
The immediate and medium term measures to raise NTR include following:
i. Focus on Natural Resources
The major categories of the natural resources that will be looked at include: forestry,
wildlife (tourism and hunting blocks), fishery (including the deep sea fishing), mining
(all major categories) using ICT.
ii. Government Agencies
These organizations are instrumental to capital finance access through equity and debt
instruments. For some lines of Agencies/parastatals, Government will review the legal
and operational status of executive agencies and create robust entities capable of
operating commercially and generating surpluses for the national exchequer.:
iii. Property taxes
Government will actively facilitate LGAs to put in place mechanisms and practices to
elevate property tax as key source of revenue by establishing comprehensive
valuation rolls, setting realistic rates and keeping them under regular reviews;
instituting performance linkages between enforcement of property taxes and transfers
from the centre, e.g. GPG, that will incentivize LGAs to treat property taxes as
principal source of revenue.
iv. Sale of share/Non-core Public Assets
Revenues collected from the sale of shares owned by the Government in public
enterprises or privatization as well as dividends/retained earnings from those
enterprises.
The Plan emphasizes that an effective collection of NTR requires ICT based automation,
which is well aligned to the legally allowed retention scheme.
5.2.3 Domestic borrowing
The Government will continue to borrow from the domestic market for financing its
expenditure, particularly investment expenditure on infrastructure development. In this
FYDPII a new approach is included which allows pooling of infrastructure financing together
in order to get the benefits of the economies of scale.
The government will invest TZS. 1 trillion in equity to allow the TIB Development Bank to
leverage that capital in order to undertake projects worth more than the equity. TIB will
implement the leveraging program within the maximum allowable regulatory levels by the
Bank of Tanzania Capital Adequacy Ratio (CAR). The TIB program, on the other hand,
allow the government to focus its development budget solely on service oriented sectors like

56
education, health, local roads etc. which require direct government subvention.
5.2.4 New/innovative Domestic Sources
i. Natural Resources Fund
Tanzania has intensified exploitation of non-renewable natural resources in recent
years. The Natural Resources Fund (NRF) will be formed to assure intergenerational
equity i.e., benefits to both current and future generations of the country, or vertical
and horizontal equity objectives.
To generate resources for the Fund, the government without suffocating the private
sector accord special oversight over strategic natural resources (e.g. the Mining
Sector) in order to enhance revenue collections through continued improvements in
mining inspections, verification of quantities and contents of mineral production and
regular auditing of mining company transactions.
ii. Revenue bonds
Regional and local governments will borrow for their qualified potential projects
guaranteed by their own potential revenues, without collaterals. Borrowing will be
made specifically for profit making projects from which debt servicing and
amortization can be derived.
5.2.5 ODA, Other Official Flows (OOF) and other external resources
The Government will continue to attract Official Development Assistance in the form of
grants and loans. The source of Foreign Financing will include among others: issuing
sovereign bonds and soliciting concessional loans. Among the key instruments in this option
are:
i. Foreign grants and concessional loans
The government will continue to use this financing window as an important source of
funds for national development. Borrowing will mainly be on concessional terms,
while non-concessional debt will be limited to projects with a high economic rate of
return, especially for energy, transport and infrastructure. In view of increased
financing requirements, Tanzania will continue working with all multilateral
financing institutions such as African Development Bank, World Bank, IMF, BADEA
and others as well as bilateral development partners.
Besides the traditional external sources of finances, the Plan will explore and harness from
the following innovative sources:
i. Funds from Foundations /philanthropies
The government will access these funds and support other actors in their initiative to access
these funds. The focus will be on for example the Belinda & Gate Foundation.
ii. Foreign market bond
The Government will issue commercial debt (sovereign bonds) to tap on international
capital market resources for financing. The Government is in final processes of
conducting country rating to determine credit worthiness for borrowing from
international financial markets.

57
iii. National Climate Fund
National Climate Fund can be created to access and manage the global climate change
finance such as done in by Brazil, China, and Indonesia. There is room for additional
earning by maintaining forest cover and trading the associated carbon credits. Proper
management of industrial emissions and marketing the carbon credits will provide
additional sources of funding. Tanzania can also introduce an indirect ‘carbon tax’
based on the carbon content of the oil, coal and natural gas to provide more finances
for development expenditure.
iv. Debt to Health Initiative
Utilize the Global Fund initiative established to fight AIDS, tuberculosis and malaria.
The Debt to Health initiative aims at channeling resources of indebted countries from
debt repayment towards health development.
v. Diaspora Bonds
Tanzanians living abroad will be encouraged to invest back home through Diaspora
bonds. A conducive environment will be designed to facilitate the Diaspora to invest
back home. This will include creation of special savings instruments for this purpose,
improvement in the banking processes, reduction in costs of money transfers to
Tanzania, securitization of remittances, and facilitating the inflow of remittances.
vi. Regional Economic Arrangements and South-South Cooperation
Within the framework of regional integration, Tanzania is a member of two regional
blocks in the sub-continent, the East African Community (EAC) and Southern African
Development Community (SADC). Within these regional blocks, member countries
have forged effective financing mechanisms for the joint financing of economic
infrastructures to link their economies. Also through the Treaties and Protocols,
member states have agreed to cooperate in various areas including industrial
development. In EAC the proposed financing mechanisms include; regional industrial
fund within the framework of the EAC Development Fund, PPPs, development
partners, foreign direct investment, portfolio investments, EAC financial and capital
markets. In SADC a number of instruments such as the Finance and Investment
Protocols, Guidelines and Fiscal Framework for Tax Incentives, National Investment
Policy and Promotion Instruments, and PPPs have been developed.
5.2.6 Public Private Partnerships
Stocks of the public sector through public-private partnership are encouraged to share
synergies between the public and private sectors in mobilizing resources. PPP approach has
been widely used in other countries to finance infrastructure and other investment projects.
PPP is a way to amalgamate public and private capital for public projects in which the private
sector may have interest to share in the ownership. PPP Act (2010) and PPP Regulations
(2011) give areas of collaboration, which comprised of investment capital, managerial skills
and technology.
Division of roles is made in a manner such that while the private sector does the actual
investment, the public sector will mostly undertake facilitative role, ranging from putting
physical infrastructure, ensuring macroeconomic stability and setting the rules of the game.
Intervention of the Government is twofold; (i) general intervention, that is creating enablers
of industrialization; and (ii) specific interventions, including support to the selected or
priority industries and collaboration with the private sector through public-private partnership
(PPP). In designing the specific interventions to nurture the selected industries, the FYDP II

58
has specified requisite Government interventions, comprising those from the social sectors,
for example; development specialized skills and provision of services such as water and
energy supply for industrial use.
The PPP fund will ensure feasible PPP pipeline projects which reflect FYDP II Priorities are
fully funded.
Table 5.2: General policies to enhance public finance mobilization and optimum
utilization
Category Policies to mobilize finance Policies to use finance effectively
Domestic public
finance
Reforms to the tax system
Minimize the application of tax exemptions
Build capacity within the TRA to monitor transfer pricing and
trade mispricing
Broaden the geographic distribution of the tax base by
improving the capacity of LGAs to collect taxes and introducing modern tax revenue administration systems in
LGAs
Diversify sectoral contributions to the tax base through, for
example, strengthening the taxation of property
More effective taxation of the informal sector by effectively identifying taxpayers (complete the integration of the national
ID system with the TRAs Tax Identification Numbers; enlist
the help of ward, Mtaa and village executives to identify and register businesses)
Develop mobile money payment options to effectively facilitate electronic payment of taxes
Deepen fiscal decentralization
Better coordination of revenue collection across spheres of government
Empower LGAs to generate their own revenue
Sovereign bonds
Carefully consider the fiscal risks (implementation, debt sustainability, roll-over, exchange rate and macroeconomic
risks) associated with a sovereign bond issue
Enhance public financial management
systems
prevent accumulation of arrears
reduce the existing debt stock
Reduce the use of expenditure floats at fiscal year end
More timely compilation of fiscal
outturn data
More influential role for Tanzania’s DFIs together with regional and
international development banks
DFIs such as TIB Development Bank to play a more influential role in designing and structuring
development projects associated
with FYDP II, and linking these projects to funding opportunities
(e.g. arranging and leveraging funds for investment; developing
bankable projects; managing
project funding and implementation)
International
public finance
Tie development objectives to climate change targets
Tap into new sources of climate-related funding
Broaden the donor base
Focus on South-South cooperation to expand relations with large southern donors (e.g. China, India, Brazil, Saudi Arabia,
Turkey, South Africa)
More strategic use of aid allocations
Channel aid allocations to support public financial management
Allocate large share of ODA to support tax administration reforms
5.3 Mobilization of non-government/non public resources
Implementation of FYDP will, to a large extent, depend on the capacity of the non-
government sector (private sector, CSOs, NGOs, FBOs, individuals and groups of
individuals) to mobilize financial resources as the main expected investor.
A large part of the investments will be carried out by the private sector, using their own
funding, private credit provided by domestic banks, market capitalization, and capital
formation. The Plan, based on the laws recognizes that a prospective investor can have either
rightful ownership or non-ownership of sources of finance. In the first category, an investor
mobilizes own financial resources and invests in the form of ownership equity which can be
acquired in a variety of ways such as previously accumulated savings; contributions from
others; loans from investment funds and stock exchange, etc. Non-ownership sources do not
entitle ownership status to the financier. Most of the non-ownership sources are debt
securities. The role of the Government is to set legal and regulatory framework right for all

59
this to happen in a predictable manner.
The Government will also facilitate access and growth of new and innovative sources of
private sector financing instruments and institutions. The instruments are:
i. Debt instruments
These include debentures and secured bonds and commercial papers issued by the private
sector for purposes of mobilizing resources from the market. Potential lenders are then
attracted to provide resources to investors in industries and other sectors. Current players in
the market such as UTT AMIS, pensions and social security institutions as well as insurance
companies have to be more vibrant and scale up such operations in the priority areas
identified for investment. Issuance of bonds for purposes of raising capital from the market
will involve both secured instruments and unsecured ones, in order to widen access to
resources.
Debentures and commercial papers, for example, are not secured by physical assets or
collateral. They are backed only by the general creditworthiness and reputation of the issuer.
They are important instruments for mobilization of loan resources especially where there are
no readily available collaterals. It is thus important to inculcate social trust and values; at the
same time, in the event of default ensure speedy judicial process in providing resolutions to
such commercial disputes in financial markets.
i. Finance lease and hire purchase
These instruments provide resources outside own resources. Institutions that are ready to
provide these financing alternatives should be encouraged to expand by providing appropriate
conducive environment for their establishment and development. Through finance lease
lessor will for example, purchase equipment at agreed periodic payments from the lessee in
exchange for the use of the asset. At the end of the lease term, the lessee will obtain
ownership of the equipment upon successful offer to buy the equipment. Other modalities
include investor buying equipment on installment payments and ownership becomes fully
transferred when the agreed price is entirely paid. Like in the case of debt instruments,
functioning of the lease and hire purchase is also premised on trust and proper understanding
of the lessees. Social trust and values are important.
ii. Venture capital
Tanzania has increasingly been attracting foreign venture capitalists to risky high potential
investments for seed capital funding. Venture capital is usually a pooled financing option
whereby a number of investors may want to put capital in a newly planned project and to also
venture in management and control functions until it pays back; and then the project
graduates as the venture capitalist(s) withdraws for it to be fully owned and operated by the
initial owners. Although venture capital as a source of financing is not commonly used in
Tanzania, there are institutions that have pioneered to offer venture capital opportunity,
including Tanzania Venture Capital and Private Equity Project (TVC) - a joint project
between Tanzania Private Sector Foundation (TPSF) and TMS Consultants Ltd. One
characteristic of this financing option is that it requires prospectively profitable areas such
as high tech investments, high growth Small and Medium Enterprises (SMEs), etc., for
venture capitalists to be attracted.
iii. Foreign Direct Investment and other private sector financial flows
For a foreseeable future, the private sector capacity to mobilize adequate investment capital
to finance country’s development programs will need to be supplemented by foreign private

60
sector financing. This could come in the form of foreign direct investments and portfolio
private sector investments. The complementary inflows include international private
transfers, including private development assistance (PDA), remittances, Foreign Direct
Investments (FDIs) and other international private capital flows, such as bank lending and
equity and bond portfolio inflows
In order to facilitate private sector finances, the Government will implement a range of
measures to reduce borrowing costs, including support to the development of the domestic
debt market, fostering regional cross-border participation in the T-bill market, and leveraging
guarantees from multilateral financial institutions to attract private investments and sovereign
loans.
5.4 Development Financing Institutions
The private sector will need increased access to industrial capital and specialized
development finance institutions are key in this regard. Existing development finance
institutions will play important role and newly specialized ones will be established to widen
financing space. Some actions will be taken to strengthen the existing institutions, including
recapitalization and capacity building for these institutions to adequately execute their
functions with utmost competence. Both technical and financial capacities of finance
development institutions will be enhanced.
While ensuring adverse impact on macroeconomic stability is mitigated, generally, the Plan
will encourage national DFI to organize the Loans Syndications as an alternative non-tax
financing opportunity as some banks join together to finance a large public project under a
certain arrangement.
5.4.1 Tanzania Investment Bank (TIB)
Tanzania Investment Bank’s core objective is to provide debt finance at the long-term end of
the market. Such loans assist enterprises in setting up new and expansion projects to increase
the productive capacity. Tanzania Investment Bank (TIB) places special emphasis on projects
that are export oriented and on those, which utilize local resources. Although the bank
operates on a commercially sustainable basis, it does at the same time, have a responsibility
of contributing to the development of the country in terms of empowering SMEs, increasing
employment, and other important socio-economic considerations of human development.
This means TIB is engaged in financing for both economic transformation and poverty
reduction. Following objectives and the nature of functions TIB which are aligned to the
goals of this national plan, the Government will design a mechanism to enable TIB to finance
emerging investment projects in the areas of the national priority. TIB does not provide
subsidized loans from its ordinary resources but can manage funds on an agency basis for
special and specific considerations. This is a window the Government can use to accomplish
financing of some earmarked projects as a way of sharing synergies with the bank to
minimize risks and to harness the available expertise.
5.4.2 Tanzania Agricultural Development Bank (TADB)
The primary objective of Tanzania Agricultural Development Bank (TADB) for which the
bank is established is to provide short, medium to long-term financing to agricultural sector.
The bank is an apex agricultural financing bank, and will be catalyst to existing agro-
financing activities through provision of short, medium and long-term facilities through
institutions like commercial banks, community banks, savings and credit cooperative

61
societies (SACCOS), and microfinance institutions (MFIs) that are active in lending to the
agricultural sector. In view of this, the Government will support TADB to enable agriculture
as a priority sector of the country.
Government through the TADB will directly finance the large projects mainly in
infrastructure development for irrigation, storage and transport. This will be done in
collaboration with commercial banks by the way of credit extension to the private sector
engaging in agriculture and individual small holders. The operational model will be agreed
between the Government, Central bank and Commercial banks.
5.4.3 National Development Corporation (NDC)
NDC was established soon after independence in 1962 to fill the gap of promoting and
financing critical development projects. The vision of NDC has been to leading
industrialization prose in Tanzania. NDC will be further strengthened to continue identifying,
promoting and implementing strategic industrial development projects in partnership with
private sector in the form of PPP. The Government will channel its funding of industries
through NDC as an institution that is statutorily mandated to industrialize the country. NDC
will take a lead role in soliciting collaborative private investors with whom to share in the
establishment of strategic industries that can transform the economy. Industrial priorities of
this plan will be put into practice by the NDC projects development capabilities and financing
packaging.
The Plan underscore the fact that, the effectiveness of the national DFI and PPP arrangements
require strengthening of the existing legal and regulatory frameworks. For this, the Plan will
support the review and amendment of the Government Loans, Grants and Guarantee Act to
enable it to serve as a comprehensive legislative framework that includes primary legislation
and regulations. This framework should cover the establishment of the debt management
office, with measures to ensure that this entity is fully functional.
5.5 Specialized banks/finance institutions
Specialized development banks and financial institutions will be empowered to finance
development sectors in the country. Tanzania Investment Bank (TIB) and Tanzania
Agricultural Development Bank (TADB) are among the banks that will be recapitalized for
this purpose. TIB is mandated to take a lead role in industrial development finance.
Recapitalization of TIB will be done from within the country, and more financing of the bank
from outside, especially from the regional investment banks will be attracted for TIB to meet
the huge industrial capital requirement. TIB can play more influential role in designing and
structuring development projects associated with FYDP II, and linking these projects to
funding opportunities (e.g. arranging and leveraging funds for investment; developing
bankable projects; managing project funding and implementation). Also, the models of
specialized banks that have succeeded in other countries like establishment of specific
Industrial Development Bank will also be explored for Tanzania as one of the sources of
sophisticating its finance sector.
Because banks in the country target also high growth sectors as their prime customers,
opening of specialized windows for businesses in the existing banks is encouraged in order to
unlock financial barriers to emerging businesses; particularly, those with potential for profits.
Banks will, however, need to use competent financial analysts to guide in their selection of
the borrower to avoid bad risks as a way to maintain stability of the banking industry in the
country.

62
5.6 Other Considered Financing Arrangements
5.6.1 SMEs Bank –
Small and Medium Enterprises will be nurtured to grow into large businesses through
financing from specialized banks. Finca (Tanzania) Ltd. which has graduated from
microfinance institution to a licensed microfinance bank is a kind of the model of specialized
banks for SMEs financing.
5.6.2 Cooperatives and Community Banks
Cooperative and community banks will be supported to spearhead development at the local
and regional levels. These are banks that are close to the people and can cater for financial
needs of specific groups in a specialized manner. Cooperative and community banks will be
responsible for inspiring saving and investment behavior at different community levels.
5.7 Government in Supporting Private Sector Development Financing
In order for the private sector to effectively mobilize finances to develop industries and
participate in investments in flagship and other projects, the government will support the
issues presented in Table 5.2
Table 5.3 Government Interventions to Support the Private Sector Category Policies to mobilize finance Policies to use
finance effectively
Domestic
private finance
Expanded role for the private sector through PPPs
Greater private sector involvement in development-focused
investments (e.g. transport and energy infrastructure investments) to
transfer some government spending responsibilities to the private
sector
to potential investors
clear government policy stance on macroeconomic management) to
attract more private investment
Improve financial intermediation to bolster access to private credit
Step up the removal of obstacles to lending
Support greater competition in the banking system
Targeted sectoral approach to loosening constraints in accessing
credit (e.g. in agriculture)
Further develop the market for government securities
Technical
assistance to
government and
the private sector
in the preparation
of bankable PPP
projects
International
private finance
Improve the quality of the business climate Explore options for
additional non-concessional borrowing and borrowing on
commercial terms
5.8 Rationalizing Public Expenditure and Development Funds
5.8.1 Rationalizing Public Expenditure
The Plan intends to ensure that at least 35 percent of the national budget is allocated to
development component; ring-fence funds for flagship projects and selectively abandoning

63
cash budget for strategic projects and revisiting the basis of cash budget in some strategic
projects; and exploring scope of earmarked sources of revenue for some strategic choice
projects.
In order to improve the level of efficiency and to instill discipline in expenditure management
under the Plan period, the Government will stick to realistic budget estimates that reflect
accurate estimates of revenue and expenditures. Furthermore, the development projects to be
included in the annual budget estimate will be selected only if approved by the Planning
Commission in line with the public investment management (PIM) criteria.
Each MDA will be required to submitting annual budgets with procurement plans and cash
flow forecasts drawn from the latter to improve execution efficiency. The disbursement will
be on a quarterly basis to spending units to improve budget execution. In order to ensure
resource predictability:
(i) Under the plan, the Government will introduce a set of transparent rules for cash rationing
of the appropriated budget when revenue and grants are under-collected.
(ii) The Government will also develop a prudent Medium Term Fiscal Framework as a basis
for the formulation of annual budgets
The government will continue with bulk purchases of goods and services directly from
producers or continuing with single source procurement of government vehicles through
GPSA after approval by the Prime Ministers’ Office. It will oversee Public Procurement
Act in order to curb all loopholes emanating from weak management of public funds;
The government will control non-productive expenditures by government agencies by
conducting regular monitoring and evaluation exercise with the view to ascertaining their
economic viability for national development.
The government will strengthen Monitoring and Evaluation of the budget execution at all
levels of government. The Public Expenditure Tracking system will be strengthened and will
address all Internal Audit recommendations as part of budget execution. Several measures to
improve public expenditure will be implemented including rationalization of expenditure of
MDAs, particularly the parastatals and agencies; containing Government expenditures in
electricity, telephone and water by making regular follow-ups; removing all ghost workers
from government and enforce continuous monitoring of the pay roll. The Government will
also reduce operational costs in various government institutions through control of
expenditure in vehicle maintenance, fuel consumptions, government ceremonies and foreign
travel. In general, the key reforms on the expenditure side include:
(i) Review the current pay and allowance system for the civil service in order to establish
clear links between performance and rewards and ultimately promote higher levels of
productivity. The strategies will include measures to enforce stricter sanctions for non-
performance, such as absenteeism.
(ii) Adopt a financing strategy to liquidate arrears and to prevent the build-up of further
arrears in the future.
(iii) Take appropriate actions in the case of officials who breach PFM laws, regulations, or
guidelines, as determined by findings from the Internal Auditor reports, the CAG
special audits and procurement audits
(iv) Consolidate the Integrated Financial Management Information System used in central
government with a similar system used by LGAs for budget execution data (revenue
and expenditure), and for related financial asset and liability data.
(v) Extend the use of Tanzania Interbank Settlement System (TISS) and Electronic Funds
64
Transfer (EFT) to LGAs. Currently this covers all MDAs and RASs.
(vi) Introduce an e-procurement system for the purchase of goods at the Medical Stores
Department (MSD) and Government Procurement Services Agency (GPSA).
5.8.2 Rationalizing Special Development Funds
There are is a plethora of empowerment and development related funds (at micro scale),
which target more or less the same social group with the objective of supporting
entrepreneurial development and job creation. They include the Youth Development Funds,
Mwananchi Empowerment Funds, SELF, etc. However, these funds remain fragmented and
uncoordinated, resulting in duplication of effects and increases in overhead and
administrative costs.
The Plan proposes a review the existing micro empowerment and development funds with the
view of consolidating and formalizing them under one or few institutions. The consolidated
funds will be used to capitalize the new institutions (or windows in existing institutions) or
used as guarantee to loans given to the targeted groups by the commercial banks.

65
6.0 IMPLEMENTATION STRATEGY
6.1 Overview
The Plan has identified more explicitly set of measures to be implemented in order to realize
the desired economic transformation. Such measures include building resilient infrastructure
systems, creating conducive environment for investment and doing business, building quality
human capital as well as improving social wellbeing. The Plan has also identified concrete
strategies for financing and monitoring and evaluation of the Plan. This chapter sets out
mechanisms for making this to happen- by putting measures to strengthen implementation
effectiveness.
The Chapter begins by echoing on the implementation challenges highlighted in chapter two
of this Plan. It ends in subsequent sections by suggesting set of measures to strengthen
implementation, including setting up an institutional framework for implementation of the
Plan.
6.2 Key Challenges to Implementation Effectiveness
The challenges of implementation largely relate to institutional capacities required to ensure
that there is good governance and accountability and enforcement of the legal and regulatory
frameworks. The challenges also reflect weak institutional capacity to coordinate and
organize mobilization of finance, monitor and evaluate implementation of planned activities.
6.2.1. Policy incoherence, instability, and unpredictability
There is weak alignment of policies, procedures, planning, and coordination, reflected in lack
of consensus among key stakeholders and ultimately policy reversal. The cases in point,
include the hike of land charges and compensation rates, implantation of the VAT Act of
2014, the changes in examination results grading, multiplicity of taxes and institutional
charges and cumbersome procedures for acquisition of village land on one hand, and the need
to promote commercial farming and rural industrialization on the other. The weak
coordination leads to entities acting in on their own, under unclear chain of command, thus
causing plethora of priorities; incompatible implementation sequencing and resources
allocation alignment. In some cases, there have been policy reversals, resulting into partial
implementation of projects and programs, as well as and slowdown in reforms. All these cost
the nation in terms of forgone fixed costs/sunk costs, inadequate outputs, and ultimately weak
impact.
6.2.2. Effects of corruption on implementation
Although there has been progress in tackling corruption as reflected in PCCB operations,
CAG reports, etc., the low level of value for money is apparent in some of the government-
funded projects. Shoddy works common in constructions are suspect of corruption
tendencies and they inflict immense costs to the society in terms of incomplete projects,
delayed commencement of projects, early maintenance, rehabilitation and renovation, in
some cases, re-construction. Figure 6.1 compares Tanzania with some countries in the level
of corruption in construction sectors. Similarly, corruption is reflected in low quality in
service delivery. Sometimes, shoddy works are results of thinly spreading the available
resources for political appeasement. Political pressure has oftentimes triumphed over
evidence based expert opinions.

66
Figure 6.1: Indicator of corruption in the construction sector
6.2.3. Weak Prioritization
Tanzania’s plans had failed to stick to the principle of prioritization, mostly during the design
stage where everything is considered as “priority”, and occasionally during the
implementation. Here again, the main cause is the undue pressure from both domestic and
international stakeholders. As Mwalimu Nyerere once said, “Kupanga ni Kuchagua”. Some
inter-temporal trade-off is inevitable. The principle is that plan should start with those areas,
which yield the highest impacts with a view of creating additional capacities for other issues
to be embraced in subsequent rounds of plans. Weak prioritization manifests itself in
untimely project completion due to inadequate disbursements.
6.2.4. Inadequate Mobilization of Financial Resources
There have been little innovations in resources mobilization. The Government continues to
fund most of the development projects mainly from own domestic revenues, concessional
loans and grants, which unfortunately have increasingly declined over recent years. The
disbursement is done on cash-budget basis, which was adopted as an interim macro-economic
stabilization measure over two decades ago. As a result, the level of fund disbursements
constrains implementation of projects either because are always inadequate to meet
requirements as per action plan or released untimely. Some of the Government own
Development Finance Institutions, such as TIB and recently the TADB though have
mandates to raise syndicated loans to finance projects upfront, are ill capitalized.
Other challenges to development financing in Tanzania included low competitiveness and
efficiency of the financial sector; quality and variety of financial services; shallow capital
market; low tax collection capacity of TRA and LGAs; tax exemptions, delays in release of
concession loans and grants, waivers, tax holidays and similar preferential facilities; narrow
tax base; un-simplified/unified tax reforms; tax policies and regulations.
6.2.5. Inadequate decentralization and localization of the national priorities
The decentralization by devolution (D-by-D) that was envisaged to transfer implementation
of national development issues to the local government did not go to the full length. Some
central ministries still hold more powers to control implementation of local development
activities. Of recent there has been more budgetary resources going directly to the LGAs,
their capacity in many other aspects has, however, not received commensurate attentions. As

67
a result, LGAs and Lower Level Governments (LLG) have failed to fully assimilate the
national development priorities in the typical local context (Local Economic Development –
LED Approach).
Inadequate assimilation of the national development priorities to local level partly explains
the failure of Tanzania to translate good macroeconomic performance e.g. high growth into
substantial poverty reduction; increasing income and spatial inequity. Experiences in other
countries and regions have shown that local and regional economic development strategies
(LED) have become a necessary and viable complement to traditional development strategies.
LED approach leads to many significant social benefits, by promoting voice, participation,
and sustainability across LGAs and regions. But for LED to be effective, capacity
strengthening at the LGA and LLG level is required.
6.2.6. Weak system for follow-up, monitoring and Evaluation
There is an adage that goes “don’t expect the uninspected”. To ensure effectiveness in
implementation there is need to have robust systems for constant follow up and inspection.
The monitoring and evaluation activities, both physical and financial performance is required
to ensure effective plans implementation but in most cases are ill funded. The current audit
approach is mainly procedural based and less on value for money and it is done oftentimes
too late to correct mistakes.
6.2.7 Delayed Decision Making
A combination of policy incoherency, policy instability and unpredictability, on one hand and
corruption on the other hand, result in slow decision-making process. This has been one of
the issues the private sector has been complaining about. Slow in decision making has
repelled investors, especially international investors with several country options for
investment destinations. Other challenges under this area include lengthy procedures for
acquiring land for investments; weak enforcement of property rights; poor land use planning
and management; weak integrated land management information system; challenges in
energy supply and low private sector participation (among other factors due to high cost of
doing business thus deterring new entrants and crippling current players through reduced
profit margins).
Far-reaching reforms are required to address these challenges and ensure implantation
effectiveness of the Plan.
6.3 Reforms for Effective Implementation
To achieve the various strategic objectives envisaged in this plan, core forms will have to be
reviewed, mainstreamed, accelerated and deepened with the focus on creating an enabling
environment for economic growth and human development. The core reforms will address
weaknesses in public service management; public finance management; public goods and
services delivery systems; Local-Central government relations; business and investment
environment; citizens’ participation; access to legal and judicial services; citizens and
corporate responsibility; and enforcement of rule of law and order. The reforms to support the
Plan targets the following areas:
6.3.1 Reforms to Eradicate Corruption, Promote Good Leadership
The Plan is predicated on the eradication of corruption and promotion of good leadership and
effective governance. These are the cornerstones of a country’s economic development and
the following will be implemented and performance measures devised to monitor:
i. Having no tolerance to corruption and recognizing that corruption is the number one

68
enemy to the country’s development. Reforms to make institutions and agencies that
control corruption and oversee ethics in private and public service delivery effective
and compliant.
ii. Promoting effective governance by focusing on three issues: fast-tracking decision-
making processes, enhancing commitment to the implementation of development
goals by the civil servants, and having proactive government leaders.
iii. Demand Government leaders being proactive and pro-business,
Halt institutional dysfunction that can prevent socio-economic development by
indiscipline, inefficiency, lack of accountability and immorality
iv. Strengthen the functioning of the Boards of Directors of state-owned enterprises to
ensure these boards fulfill their oversight functions appropriately and are directly
accountable for their performance.
v. Enable the Treasury Registrar to oversee state-owned enterprises and to support the
Government in making strategic decisions related to public investments in these
organizations.
6.3.2 Entrenchment of Implementation Culture
BRN has generated good lessons which warrant scaling up with the view of entrenching work
culture and attitudes. Rates of BRN projects implementation were good. The Plan
implementation will benefit from the experience of BRN model, hence qualify for harnessing
and mainstreaming them into the whole government machinery.
Culture can be a major factor behind success and or failure of plans/projects. From the BRN
initiatives, it has been observed some projects were able to deliver successfully within the
planned period even without the requisite financial resources. The BRN methodology should
therefore be strengthened and extended to be used in the implementation of FYDP II. To
start with, the Labs should be organized along the FYDP II flagship projects.
BRN systems already exist in some MDAs and nonexistence in others. BRN will be
mainstreamed in the structures of the MDAs. The departments responsible for Policy and
Planning in each MDAs will be the delivery units. These units will link up with the
department responsible for FYDP II delivery in the Ministry of Finance and Planning.
Specifically, the Plan demands the following:
i. Reform governing institutions and make them effective in pursuing their functions.
ii. Reform institutions with focus on: independence, transparency, responsibility and
accountability. These should be the key features that must be part and parcel of each
institution in the country.
iii. Effectively coordinate all functions and records of key outcomes of all government
institutions, including the LGAs.
iv. For all national level strategic projects, which involve several actors and bold decisions
for some aspects of project execution, there will be mechanisms set to refer such
projects back to the Cabinet for implementation guidance.
v. Introduce a special window in the procurement process to deal with national strategic
projects.
The Plan will gradually on a pilot bases, require the civil service management to make
appointments and promotions open, competitive, and merit-based for vacancies below the
level of Permanent Secretary - mainly principal officers, heads of section, TGS directors, and
executive directors of independent parastatals and agencies.

69
The plan will expand the use of Human Capacity Management Information System (HCMIS)
for strategic staffing decisions in the public sector and for improving performance
management within service delivery units.
6.3.3 Reforms for Improved Business Environment (including Executive and
Autonomous Agencies)
The private sector, which will be the main driver of industrial investments, oftentimes
interfaces with the executive and semi-autonomous agencies of the Government. The
efficiency and effectiveness of the agencies is thus key for effective implementation of the
Plan. The Plan will support efforts to review strategic agencies, which hold key for successful
implementation of the plan. They include TANESCO, regulators of standards e.g. TBS,
TDFA, etc. The entrenchment and inculcation of the BRN culture in these agencies will be an
integral part for envisaged reforms in order to enhance their pro-business and pro-private
sector supportive role.
Generally, the Plan will support legal review aimed at improved business environment by
eliminating conflicting laws and regulations, regulations which retard decision-making,
6.5.1 Specific reforms for Flagship Projects
Besides the requirement for the FYDP II BRN implementation Lab to commence with the
flagship projects, the five sets of Flagship require special and tailored reforms for their
effective implementation, as follows:
(i) Realization of the Central Development Corridor and North-West Corridor of Tanga
corridor as well as Mtwara Development Corridor
(ii) Reforms to facilitate zoning and clustering of some economic activities (productive
sector, economic services, and social services) to flourish along the selected corridors.
(iii) Improving availability and reliability of electrical power including finalizing
discussions regarding de-bundling TANESCO to separate operators in the production,
transmission and distribution of electricity. In the reform, the role and mandate of the
electricity regulator will be expanded to include projection and determination of
national demand and inviting independent power producers to compete. There is a
need to have an independent manager in charge of transmission.
(iv) Mass training for development of rare and specialized skills:
(a) The Plan support increasingly allocating revenue generated from Skills
Development Levy (SDL) to skills development, particularly for skills required in
priority industries. A forum will be created where private sector will participate to
express the demand for skills and shape the interventions for the provision of
technical education and vocation training. Moreover, the Plan well set strategies
for scholarship and other support for higher education related to priority
industries.
(b) Behind successful training in specialized skills is quality education at primary and
secondary level. Thus, the Plan proposes gradual review of the school level
administration to ensure quality delivery of education, starting with primary
school administration to secondary school administration.
(c) The Plan will pilot school administration based professional management
approach, where the school managers are granted power to oversee staff
incentives.
6.3.5 Land Administration Reforms
The land use plan and management is a key variable for management of urbanization and in
unlocking the potential for growth by making land accessible for productive uses in rural and

70
urban area. The current land policy, as governed by the two Acts, namely, the Land Act and
Village Land Act, does not facilitate industrialisation, include mining sector forms. renewed
focus on formalization of land ownership and commercialization appear to be combining to
intensify land disputes and create additional disputes including those between investors and
existing land holders/users. The acquisition of land for investment is complicated and takes
long time. The bureaucracy and procedures in acquiring land for investment is cumbersome
and thus deterrent. Transactions costs are high to investors with the current regime of land
policy. Reforms are required to address the follow specific issues:
i) Ways in which surveyed land can be a good source of sustainable income for the
government (during titling and extraction of rent in strategic locations) and for the
private sector as capital/share/equity or save as collateral in accessing finances. This
include formalizing unplanned urban settlements and increase the number of surveyed
villages and delivering Certificates of Customary Right of Occupation (CCRO). This
also requires strengthening of MKURABITA programme/concept and
implementation.
ii) The need to have a one-stop center to deal with land issues and decisions for
investment, including increasing availability and access to land serviced land in line
with the economic activities designated (title deeds, irrigation schemes, feeder roads,
power, etc.);
iii) The review the Village Act No 4 and Land Act No 5 to enable it to support
industrialization and socio-economic transformation, with the view of eliminating
conflict with other laws, including those affecting agriculture land, mining, and
industrial location.
iv) Ensuring proper land use planning, management, and settlement development,
including enforcing property rights and standards, as well as promoting the
development of secondary towns;
v) Carrying out reforms in land sector, including formalization of unplanned urban
settlements and increase the number of surveyed villages; and
vi) Ensuring environment sustainability in development of township, towns, and cities,
including strengthening national and sub-national (LGAs) land development planning.
vii) Creation of industrial “land banks” nationally and at lower levels; and
viii) Establishing an effective land registry.
6.3.6 Formalization Reforms
Tanzania’s economy dominantly informal and nation cannot account for ‘who’ does ‘what’,
and ‘where’. Informality constrains development of infrastructure in unplanned settlements;
hinders growth of business due to limited scope of contractual enforcement; increases costs
of social service provisions and costs of collecting government revenues. Without concrete
database of the production pillars - people, their entitlements to locations, and their activities
in general - the economic transformation process is rendered futile since planning and
policies will be based on incorrect statistics.
The Plan will support efforts to formalize the economy, including (i) identification of the
country’s people (ii) availability of a comprehensive land use plan, and (iii) establishment of
a comprehensive and deep transactional businesses registration database.
6.4 Interventions for State/Government Effectiveness
6.4.1 Building an Integrated government
Other set of reforms will focus on ensuring government institutions work in an integrated
manner (joined-up government); open government aimed at increasing transparency and

71
opening-up government business, with ICT (e-government) being a major vehicle in
achieving both goals.
6.4.2 Effective use of the Rule of Law
Necessary measures must be taken to ensure equal access to timely justice to all people.
These measures will include, first; to improve the capacity and efficiency of justice
institutions through investing in human resource development and streamlining processes and
procedures; second; to improve court infrastructure (including construction of new primary
courts). In addition, to enhance independence of the judiciary and to improve efficiency of
adjudication of cases; fourth, to deepen the legal sector reform and the law reform and fifth,
to strengthen measures and actions to curb petty and grand corruption as a national agenda
with clear monitoring and evaluation tools.
6.4.3 Enhanced democracy, political and social tolerance
Deepening of democracy and participation will be accelerated through:
(i) Investing further in the electoral process and expand freedom of expression,
transparency, and access to information.
(ii) Promoting domestic accountability and effectiveness of watchdog and oversight
institutions, and to put in place mechanisms for strict follow up, accountability and
sanctions.
(iii) Ensuring separation of powers and effectiveness of the three pillars of government,
including enhancing the institutional and human resource capacity of each pillar of the
state for the proper execution of its functions;
(iv) Designing interventions to promote the culture of hard work, self-confidence, self-
esteem, creativity, and innovation and moral integrity among the youth from early
childhood.
6.4.4 Safety, peace, security and social stability
Strategic actions to ensure peace, individual security and safety of property and stability will
include:
(i) Enhancing border control and immigration, and to check the inflow of arms.
(ii) Strengthening capacity (physical, human, and financial) of law enforcement agencies and
to strength mechanisms for arbitration and conflict resolution among and within
communities.
(iii)Finalizing national identification process and strengthening of vital registration from the
grassroots, both in urban and rural areas.
(iv) Expanding civic education and public awareness on the importance of national unity and
to fight tribal polarization and sectarian sentiments.
6.4.5 Good corporate governance
Several legislations aimed to reforming and providing reasonable level of sound corporate
governance have been in place, including the Companies Act, (Cap 212) and the Capital
Markets and Securities Act of 1994. The Public Corporations Act (1992) provides the
regulatory frameworks for corporate governance in public companies. Strategic actions to
enhance corporate governance include:
(i) Addressing remaining bottlenecks to investment climate and business environment
(ii) Promoting strategic acquisitions, mergers, or joint ventures between public and private
companies, and between domestic enterprises and multinational companies in order to
foster diffusion of technological innovation and managerial skills, aimed at increasing
global competitiveness.
(iii) Promoting effective public-private dialogues and ensure implementation of agreed

72
milestones. The existing forums such as the TBNC will be strengthened in order to
facilitate effective public-private dialogue and monitor the implementation of the agreed
milestones.
(iv) Use open data dashboards as the key instrument for government interactions with
citizens in the areas of policy making, monitoring, and implementation.
(v) Introduce an annual service delivery survey to determine levels of citizen satisfaction
with priority social services.
(vi) Leverage technology to facilitate mobile governance: This should include the
appropriate use of m-health applications, one-stop e-services for businesses, and citizen
feedback mechanisms to enable citizens to provide feedback on matters such as teacher
absenteeism, lack of staff, and/or stock-outs of essential drugs at health facilities.
6.4.6 Active role of state in economic governance
To be effective in economic management, the state will have to carry additional and specific
time-bound actions, and in some cases employ non-conventional tools to drive development
actors in a desired direction. The following actions will be the key ingredients of strategic
implementation:
(i) Demonstrating strong political leadership and implementation mechanism that
transcend political boundaries to retain long term horizon in development planning,
supported by a competent and committed cadre of merit-based and well remunerated
civil servants.
(ii) Aligning implementing institutions with the incentive systems that creates a working
synergy between government institutions, the private sector, and the market and
regulatory institutions.
(iii) Promoting strong national market players, without succumbing to patronage and
capture by maintaining a competitive environment among them.
(iv) Ensuring that macro-economic policy is strongly aligned with the development agenda,
so that there are mutually supportive combination of macro, meso, and micro outcomes.
(v) Facilitating industrial development by overcoming constraints, particularly
infrastructure gap, concessional sources of financing, and human resource development
in priority industries.
(vi) Promoting knowledge creation, and facilitate research and development to foster
innovation and adoption of new technologies in major sectors.
(vii) Establishing a special fund for project development. The fund will be used for all
national strategic concepts/proposals, be it from government, partnership/joint venture
or purely from private initiatives. The management of the fund to support the
preparation of bankable project documents will be established latter
6.5 Decentralization by Devolution and Local Economic Development (LED)
Approach
To ensure trickle down effects both from economic growth and service delivery to local level
and households, the Plan proposes further decentralization of the Government system in order
to respond to local needs in a timely manner. Local government must be increasingly
empowered to make planning decisions. This entails shift mandates and resources to the
local level as follow:
6.5.1 Reforms to strengthen Local Economic Development (LED) initiatives
The Plan will institute reform to contribute greatly to the transformation and shaping of the
country’s economic status through greater decentralization and transparency. It entrenches
the BRN methodology; efforts will be directed to ensure there is effective coordination
among actors in MDAs and RS, and LGAs in order to deliver conducive business

73
environment/enablers for private sector to flourish. This entails also implementing the
unfinished business of the Local Government Reform Program which include administrative
(human resources management) and fiscal decentralization as well as harmonization of laws
and lower local government authorities (LLGA).
Under the Plan, the role of LGAs will be critical for issues related to land for investment,
development of SME clusters, support of Local Economic Development (LED) initiatives,
etc. The core aim of LED in FYDP II is to direct practical approaches to be used by regions,
LGAs, and communities in designing and implementing locally customized interventions.
Effective LED planning ensures that priority issues are addressed and limited resources are
well targeted to promote local growth and poverty reduction.
Recognizing the capacity of LGAs, the Plan will build and strengthen their capacity in line
with key LED strategies which involve:
i. Regions and LGAs tendering and procurement procedures must favor small
contractors and emerging businesses.
ii. Marketing of LGAs investment opportunities, to local and international businesses,
including supporting service centres that provide assistance and information to
businesses that wants to start operations in their respective areas of jurisdiction.
iii. Developing Economies Locally Through Action and Alliance (DELTA), which
focuses on building institutions within LGAs and exploiting private sector resources
that can foster and support policy reform for private sector development.
iv. Supporting Living Laboratory, which provide practical demonstrations of what could
work better in their respective localities and create sustainable jobs and real
community benefits.
v. Supporting communities to develop their own economic solutions, including
exploring new ideas for improving the creation for and distribution of work to
disadvantaged groups and minorities.
vi. Ensuring that the local investment climate is functional for local enterprises
supporting small and medium sized enterprises encouraging new enterprises attracting
inward investment
vii. Investing in physical (hard) infrastructure by improving the built environment (roads,
sewerage, airports) for businesses investing in soft infrastructure including human
resource development, institutional support and regulatory issues
viii. Supporting the growth of business clusters targeting particular geographical areas for
regeneration or growth (i.e. area or spatial targeting) supporting survivalist, primarily
informal sector enterprise targeting certain disadvantaged groups.
The Plan recognizes that effective LED is community driven as well as LGA supported. A
community begins LED strategy planning process by identifying the people, public
institutions, businesses, community organizations and other groups with interests in the local
economy. The skills and resources that each of these stakeholders bring to the strategy
process provide a critical foundation for success. The LGA and RA will be responsible for
ensuring conducive local business environment, particularly those affecting the SMEs.
Progress in this aspect will be evaluated the through Local Business Enabling Environment
(BEE) Survey
The Government will address the challenges related to financing LED, because most of the
LGAs often have limited resources to deliver LED services. Through the Plan, the
Government will safeguard LED expenditure when it comes to budget time from being out

74
competed by other expenditure items in order to ensure LGA LED becomes a vehicle for
local transformation. Sources of funding for LED initiatives include:
i. Local authority revenue raised from the usual own sources, without necessarily falling
in the trap of introducing nuisance taxes;
ii. Central government transfers, e.g. the TZS 50 million for each village;
iii. Donor grants – including international NGOs, foundations, e.g. environmental aligned;
iv. Private sector funding such as funds from corporate social responsibility; and
v. Foundations, especially for environmental improvements, human resource initiatives
and poverty alleviation.
In order to ensure effective monitoring and evaluation of LED initiatives, LGAs will be
facilitated to conduct the Local Business Enabling Environment (BEE) Survey to obtain
information on citizens' perceptions of local conditions and regulations that affect them and
local businesses, with the goal of highlighting policies and practices that hinder business
development and identify key concerns and issues facing their localities.
The Ministry of Finance and Planning in collaboration with the President's Office Regional
Administration and Local Government will develop a guide for rolling out the LED approach.
The guide will include, among others, approaches to measure the performance of the
leadership at the regional and LGA level so that the citizenry will be informed of their local
development. The Local Business Enabling Environment (BEE) Survey will be one of such
evaluation tool for local leaders’ performance. Effective performance of LED will, in
aggregate, diversify the national economy and government revenue sources and reduce overly
dependency on Dar es Salaam. It will also reduce push factor for migration from rural
(township) to large cities and relieve pressure on urban social amenities and infrastructure.
6.5.2 Specific LGA Reform – Dar es Salaam City
The Dar es Salaam City is hub of the national economy and provides the basis for social
transformation in terms of revenue collection, growth of the private sector, job creation,
markets, etc. However, performance of the city is constraining by its administrative structure,
which as implication on management of the city development. There are overlapping
mandates of the city district municipals, the city municipal (LGAs), and regional
administration (RS) in Dar es Salaam, which undermines regional coordination. As a result,
the major services such as transportation, land use planning, water and waste management are
not coordinated on a metropolitan-wide basis. The Plan proposes:
a) Reform of the institutional and governance arrangements of Dar es Salaam city in order
to improve coordination, accountability, and service delivery. The reform aims
triggering the evolution of Dar es Salaam into an efficient metropolitan area by providing
redefining the role and functions of the DCC and, in particular, to provide it with a clear
mandate to require the municipal councils to coordinate services on a metropolitan-wide
basis.
b) Reforms to allow and pilot with the city (DCC) capability to raise adequate revenue
sources that match their expenditures and install the systems to ensure that the City
councils are accountable to citizens.
6.6 Implementation Framework
6.6.1 Planning and Implementation Coordination
The implementation of the Plan will be streamlined through a coherent planning process,
whereby all actors are aligned to the set objectives and targets. Since the implementation of
the Plan involves a myriad of key stakeholders and institutions priorities the planning will

75
adopt the following steps
a) Annual Development Plans (ADPs)
FYDP II Priorities will be further articulated through the Annual Development Plans (ADPs).
The Identification of annual priorities and sequencing be done through a consultative process
using the dialogue structure that will be established. The ADPs will be derived from reviews
of an implementation matrix of the FYDPII, which also lays out the status of implementation
of preceding year’s targets. The Ministry of Finance and Planning will spearhead and
coordinate this process including the formation of a dialogue structure and production of
ADPs.
b) Budget Guidelines
The Budget Guidelines will further translate the ADPs into a financeable programme to guide
actors on issues related to measures for resources mobilization, expenditure management and
budget resources allocation. The Budget guidelines will scale up program approach and
financing in order to provide interface with all actors involved in project implementation.
c) Annual Plan and Budgets
Based on the National Annual Development Plan(ADPs) and the Budget Guidelines, MDAs
and LGAs will Develop Institutional Annual plans and budget that will be tabled for further
budget scrutiny carried out by a central committee coordinated by the Ministry of Finance
and Planning.
d) Budget Scrutiny
Budget proposals will be scrutinized through a transparent and iterative process. The aim is to
facilitate further prioritization and sequencing of interventions including identifying areas of
synergies and cross sector collaboration. The Ministry of Finance and Planning will
coordinate this process.
e) Creation of SMART performance indicators for each of the implementing MDAs;
f) Adoption of a real time response to a problem during implementation.
This will be achieved through regular consultation between coordinator of the ADPs and the
implementing MDAs and LGAs facilitated through a dialogue structure.
6.6.2 Institutional Arrangements
The institution framework presented in this section responds to thrust of the Plan, which is to
build an industrial economy and undertake a socio-economic transformation with high
productivity and quality social services delivery. While guided by the focus of the plan, the
institutional framework intends to achieve the following key implementation objectives:
(i) Ensuring coherence of policies and implementation;
(ii) Strengthening vertical chains of intra- agency/ministerial accountability and inter-
ministerial coordination;
(iii) Strengthening horizontal coordination;
(iv) Creating strong state-business/investor relationship at sectoral levels;
(v) Strengthening the coordination of the national innovation system, which is bring
together individuals, business organizations, government, academia, and research
institutions; and
(vi) Facilitating adoption of a more problem-driven and flexible approach to
implementation;

76
As stated earlier, the focus of the Plan is building an industrial economy. For the largest
extent the private sector role is central. The state, will inevitably play a smart role to catalyze
and support the private sector play its role more efficiently. This section articulates the roles
and responsibilities and the modes and structures of interaction, collaboration and dialogue.
The aim is to create a structure flexible enough to facilitate timely response to problems as
they arise in the process and adjust thereto. The key stakeholders and their roles include the
following;
(i) Central government
While central ministries will be responsible for overall coordination of the implementation of
the plan, The ministry of Finance and Planning, in particular, will:
(a) provide central point of coordinated development planning, synchronise and prioritise
public investment projects for funding;
issue Annual Development Plans and Budget guidelines;
(b) Set performance targets with associated timeframes and timelines
(c) monitor and evaluate the implementation of the plans
(d) facilitate dialogues between investors and the sector ministries and/or thematic agency
to address issues at hand;
(e) Mobilize financial resources and allocate resources to selected priorities and other
government operations;
(f) Ensure prudence use of financial resources by undertaking project monitoring
missions, expenditure tracking and reviews
(g) Ensure macroeconomic stability and predictability
(ii) Sector Ministries and thematic agencies;
(a) Provide the central point of coordination to sector projects;
(b) Provide real time solutions/guidelines to issues related to investment in sectoral areas;
(c) Maintain and safeguard the national stock of capital
(d) facilitate acquisition of needed infrastructures to private sector investment;
(e) provide and enforce standards for services delivery;
(f) provide technical support and backstopping to LGAs and Regional Secretariats, and
Business sector such as land acquisition;
(g) promote resource-based industries and to invest in commercially viable PPP projects
(h) undertake feasibility studies and prepare projects
(iii) Regional Secretariat and LGAs;
(a) facilitate the business sector in developing businesses;
(b) facilitate acquisition of facilities for investment and businesses;
(iv) Private sector;
(a) Establish business to create wealth
(b) Develop bankable projects
(v) Academia;
(a) Build capacity and quality of the national stock of human capital;
(b) train graduate engineers in challenges of society that requires technology solutions to
be applied;
(c) Train technicians and skilled labour for use in the industrial sector, agriculture, and
services sector.

77
(vi) Industrial Research Institutions;
(a) Lead industrial innovation for national economic development;
(b) assimilate and adapt technology for application to the local environment; to lead
industrial innovation to find technology solutions to economic challenges;
(c) Link and coordinate research in academia with industrial research institutions.
(vii) Financial Institutions
(a) provide financial services and intermediation to industry sector;
(b) Conduct project development and confirm commercial sustainability before physical
implementation.
(viii) Labour: Provide the necessary and essential human capital.
The Planning Commission will require each main public sector actor (agency), in
collaboration with relevant implementing partner for each of the strategic project, to submit a
detailed work plan, with all necessary details of project activities, sequencing as well as cash
flows for their execution.

78
7.0 MONITORING AND EVALUATION
7.1 Overview This chapter proposes the requisite monitoring and evaluation framework for realization of
FYDP II. It is being developed on the basis that monitoring and evaluation are not new
practices in Tanzania. They have been here since the country adopted performance
management systems (PSM) and results based management (RBM) in the late 1990s, aiming
at raising transparency and accountability by the government system in delivery of services to
trigger economic transformation and human development in a more coherent manner. The
framework involves general and specific objective indicators and targets to be realized at
macro, sector and project or intervention levels. It also spells out institutional arrangement,
roles and responsibilities as well as assumptions underlying realization of effective
framework for FYDP II monitoring and evaluation.
7.2 Monitoring and Evaluation Framework The monitoring and evaluation (M&E) framework for FYDP II emphasizes for availability of
reliable data in order to gauge quantitative and qualitative information. It further emphasizes
on having in place analytical capabilities in order to generate new insights for policy makers
and distill reliable information to be communicated to the citizenry on progress made and
gaps to be filled to evoke commitment and consistence towards realization of the Plan.
It is with this background that improvement of Government-wide M&E with standard tools
and guidelines, and objective targets at all three levels – national, sectoral, and LGA - has
been emphasized to further improvement of RBM in terms of better articulation of indicators
as requires and as specified in the Medium Term Strategic Planning and Budgeting Manual.
Generally, the framework and institutional arrangement for FYDP II monitoring and
evaluation is embedded in the prevailing Government-wide Monitoring System (GMS) as
indicated in Figure 7.1. The experiences and lessons coming from implementation of the
existing M&E framework have sharpened the proposition design of FYDP II with a focus on
enhancing implementation efficiency and effectiveness.
Figure 7.1. Conceptual Framework for FYDP II Monitoring and Evaluation
Control
Socio-economictrasformation
Outcomeandimpact
monitoring
Review Evaluation
Inspection Monitoring
ImpactEvaluation
OutcomeandImpactindicators
ProgresstowardsTDV2025
Inputindicators
Activityindicators Outputindicators
Yearlyperformancereporting
Financialauditing
Performanceauditing
Mid-termandfinalevaluation
Financialimplementationmonitoring
Physicalimplementationmonitoring
Follow-up&Inspection
Financialcontrol
The framework identifies and defines main M&E components and set the scope of the M&E
policy, which follows a public value chain approach. The framework emphasizes clear roles
for control, inspection, review, monitoring and evaluation. The roles and responsibilities of
for each node are assigned to institutions in Section 7.3.2.

79
The overall objective of M&E Framework is to avail constructive engagement space with
stakeholders. At macro level, the framework uses an integrated approach that combines
outcome reported by Ministries, Departments and Agencies (MDAs), Local Government
Authorities (LGAs), other public institutions and the private sector implementing strategic
projects and interventions as well as analysis of outcomes and impacts felt at macroeconomic
development indicators. At meso (sectorial and cross-cutting interventions) level, reporting
will be on the overall objective targets and transformation changes attained in relation to the
set sector and project/intervention targets. At micro (project/intervention) level reporting is
designed to inform achievements and gaps to the expected timeline targets, milestones and
runs in terms of time and cost as was stipulated in the action plans.
Specifically, FYDP-II framework for monitoring and evaluation are, to:
i. Track progress and demonstrate results of FYDP-II interventions over the
immediate, medium and long term, including reporting on regional and international
targets such as the SDGs that are integrated into national development frameworks;
ii. Facilitate setting of a research agenda, detailed analysis of data on growth,
transformation and human development trends and dissemination of the findings to
inform a wide range of stakeholders;
iii. Coordinate and facilitate MDAs, LGAs, private sector and other stakeholders to
regularly and systematically track progress of the implementation of priority
initiatives of FYDP II;
iv. Assess performance in accordance with the agreed objectives and performance
indicators and targets to support management for results (i.e. evidence-based
decision making), compliance with Government policies (accountability) and
constructive engagement with stakeholders (policy and implementation dialogue);
v. Dispense an Early Warning System for potentially challenging issues or processes in
relation with implementation of FYDP-II, which may need urgent corrective
measures and provide continuous learning ground for MDAs, LGAs and other
freelance M&E practitioners during the implementation of FYDP-II; and;
vi. Continue to institutionalize and harmonize the use of M&E information in policy
formulation, planning and budgeting in the public sector in particular and the
economy in general, including sustained technical support and training for
entrenchment of an M&E culture in Tanzania.
7.3 Strategy for Monitoring and Evaluation Although there are monitoring and evaluation systems within MDAs, there are concerns that
establishment and use of M&E tools in Tanzania has been relatively slow, sporadic and
largely limited to monitoring and reporting on targeted activities. Moreover, there is absence
of a comprehensive and integrated framework and whole-of-government M&E system to
provide overall guidance on the development and application of M&E across sectors. The
lack of an integrated and effective M&E system is an impediment to measuring actual
impacts of development results on human development thus making it difficult to flag areas
of risk or identify critical issues that need deeper analysis and policy responses in a timely
manner. Most critically there is lack of capacity to synthesize information that is collected for
strategic decision-making and accountability.
Overall, there is insufficient capacity with respect to staffing and specific technical expertise
to identify and disaggregate available data, and adequately coordinate, manage and report
new data among the multiple partners that are involved in implementing the national
development agenda and policies. This has led to over reliance on national surveys and

80
censuses by the National Bureau of Statistics (NBS) as the main source of reliable data for
national, sector, private sector and Local Government systems. Survey data is available at
specific periods as per Tanzania Statistical Master Plan (TSMP) calendar, in most cases in
five (5) year periods; thus making it difficult to track progress in implementation on a
yearly basis.
The strategy, therefore, aims at building a system that is robust, comprehensive, fully
integrated, harmonized and well-coordinated to monitor the implementation of national
development initiatives as well as evaluating their outcomes and impacts. Equally important,
it intends to strengthen implementation, monitoring and evaluation (including impact
assessment) and reporting during the implementation of FYDP-II. It will also mean ensuring
full coordination and operationalization of the monitoring, evaluation and reporting systems
as articulated in the Medium Term Strategic Plan and Budgeting Manual. FYDP II will also
adhere to the principles of monitoring and strategic issues as stipulated in the Public
Investment - Operational Manual (URT 2007) and strategic issues for monitoring.
Efforts to improve existing routine data systems will continue, being of critical importance in
enhancing monitoring and evaluation of the priority areas embedded in the Plan. The
framework of routine data systems is built under the implementation of the Tanzania
Statistical Master Plan (TSMP). The most efficient features of routine data are their
availability at little cost and timeliness. The value attached to routine data is vital in terms of
data production in a short period of time or high frequency data such as price data. The
National Bureau of Statistics has a legal mandate of providing guidelines to all Ministries,
Departments and Agencies on how to retrieve administrative data from their respective
sectors. These features and developments in routine data have informed the design of the
FYDP II monitoring and evaluation framework.
For all MDAs, LGAs and other implementing agencies, a five year medium- term Plan will
be developed reflecting on the priority areas. The programme will identify clear terms
involved in developing data systems coupled with sector databases starting from lower level
up to the national level. Issues that will be considered during development of the system
include; accuracy of the data, precision, completeness, timeliness, coverage, analysis,
accessibility, confidentiality, as stipulated in the principles and standards of official statistics.
Stakeholders' analysis will be conducted, and results will be incorporated in the programme.
Governance and leadership, as well as, financial framework for generating and disseminating
routine data systems have been developed. New sources of financial streams for supporting
M&E have been identified bringing on board new stakeholders.
7.3.1 Approach
In order to ensure effective tracking, evaluation and feedback on FYDP-II implementation, a
well-coordinated government-wide M&E system will have to be established. In this regard,
MDAs, LGAs, CSOs, private sector, research and academic institutions will be involved in
formulation and implementation of M&E activities in an integrated approach that entails the
involvement of all key actors and primary stakeholders. This will enable all key actors to
fully internalize and own the system as well as utilize the results to inform and shape
requisite intermediate interventions.
7.3.2 Institutional arrangements
The governance arrangements for FYDP-II M&E will be set out for FYDP-II M&E Master

81
Plan. The key features under consideration are:
i. An institutional framework that is inclusive in the manner that it brings together all
relevant stakeholders to carry out data generation (Survey and Routine Data), research
and analysis, communication and feedback mechanism and linking to relevant
Government policy, decision making bodies and users;
ii. An indicator framework that tracks FYDP-II implementation and results, specifying data
sources, frequency of reporting, and institutional responsibility, among others;
iii. A survey calendar to be implemented by the National Bureau of Statistics (NBS) to
provide estimates for key FYDP-II indicators, including mid-term review of trends in
poverty reduction.
iv. A calendar of planning, budgeting and reporting;
v. Defined outputs of FYDP II M&E, including survey reports, analytical and
implementation progress reports.
vi. A funding mechanism and a budget for the implementation of FYDP-II M&E.
The consolidation of these key features will deepen integration of FYDP-II strategic
interventions into the budget process, financing options and the public expenditure review
(PER) process. It will also strengthen the alignment strategic plans of MDAs, LGAs and
other strategic implementing agencies to FYDP-II interventions to ensure that plans priorities,
implementation action plans, sequencing and reporting implementation of FYDP-II is
enhanced.
7.3.3 Roles and Responsibilities
In order to avoid overlaps, conflicting roles and uncertainty in the monitoring and evaluation
function during the implementation of FYDP-II, roles and responsibilities of key actors are
clearly delineated, thus providing guidance for the activities and outputs that will be
coordinated at the national, sector and other relevant institutions will be elaborated in
accordance with the Plan and Budgeting Manual for the whole of government.
i. MOFP: will continue to be responsible for planning and budgeting, and administering
disbursement of finance according to the approved plans’ interventions and ensuring that
relevant implementing institutions of Government and non-state actors, develop action
plans, cash requirements-flows and results indicators that are consistent with realization
of planned interventions for FYDP-II. MoFP will also be responsible for producing the
Tanzania Human Development Report, Poverty and Environment Mapping Report,
SDGs Performance Reports, and Stakeholders’ Engagement Reports (with regard to
policy and interventions implementation dialogue). In this regard, it will continue with
the responsibility of coordinating implementation of FYDP-II by key actors through the
development of annual plan and budget, producing an overall annual national
implementation report and overall socioeconomic performance report (Economic
Survey), capturing progress and issues pertaining to the strategic components of the
FYDP-II. In addition, it will have the responsibility of mobilizing financial resources
particularly in funding government stakes in strategic interventions of the Plan and
tracking expenditure for financial accountability and producing budget monitoring and
evaluation reporting and site field mission reports.
For effective monitoring, MoFP will coordinate other actors responsible for flagship
projects to develop 3-feet work plan with implementation milestones and the KRAs. This
system will be a forum to assign remunerations is in line with the performance
management system, which was introduced under PSRP.
ii. PO-PSM: is responsible for ensuring provision of requisite human resources to

82
operationalize the Plan and M&E strategy. This will include recruitment of M&E
specialists, as well as, socioeconomic statistical analysts. This will entail also reviewing
organisational structures, manning, capacity analysis and determining capacitation
programmes for M&E sections across the public sector in collaboration with MoFP
commensurate with sufficient capacity needed to deliver on the Plan and M&E strategy.
iii. MDAs and LGAs: these are key implementing agents and therefore central for reporting
day to day and timeline implementation performance, monitoring and evaluation, as well
as, reporting on progress against planned milestones, time and cost outruns, alignment of
plans and budget implementation and their strategic plans, including monitoring targets
and interventions with their delivery responsibilities set out in FYDP-II. Local
Government Authorities (LGAs): These will be responsible for reporting on progress of
implementation and achievements of planned outputs. This involves focusing on
implementation constraints including tracking of specific local economic development
planned for their locality.
iv. Development Partners (DPs): they will support M&E strategy by providing financial and
technical assistance for its operationalization, capacity building for M&E, and use of
M&E products.
v. NBS: The role of NBS will be to provide core statistics that are critical for the
monitoring and evaluation of FYDP-II goals and strategic interventions. It will entail
scaling up and deepening of the implementation of existing Statistical Master Plan. The
main objective of the master plan is to strengthen the national statistical system in
Tanzania so as to enable it produce quality statistics for decision makers in an objective,
timely and cost effective manner.
vi. Private sector and other strategic partners: the general thrust of the Plan has been
developed in the ambit of market-led economic management framework. In this context
the private sector and others are instrumental to the realization of the Plan priority areas.
Their participation is through straight own implementation or by partnership with the
public sector. They are, therefore, part of the plan and should assist its implementation
by providing information needed for reviewing policy and implementation modalities
that enable or hinder the development of businesses and investments.
The M&E framework for FYDP II will explore mechanisms and tools to capture policy
information from non-state actors, particularly the private sector who are central player in
industrial investment. They will be required to provide reliable information in areas of their
interest and levels of financing they are going to put in realizing their businesses. For major
investments and required support from the public sector, they have to disclose their
investment action plans and implementation milestones to inform schedule of support actions
by the public.
7.3.4 Evaluation of FYDP II Evaluation will be conducted at three phases; annual, mid-term to the plan horizon, and end
of the plan horizon. The details of the evaluations are as discussed hereunder:
i. Annual Internal Evaluation
The internal evaluation will involve production of Tanzania Human Development
Reports (THDR), PER and sector Annual reviews to stimulate dialogue and inform
the plan and budgeting process.
ii. Mid-term Evaluation

83
This will be conducted after two and half years during the Plan's implementation. This
review will be coordinated by MoFP and will address performance against the
intended objectives and targets. It will recommend any changes required to square
back implementation towards achieving the objective targets set in the original set up
of the Plan.
iii. Final Evaluation
This is to be conducted after four-and-a-half years of the Plan's roadmap of
implementation. The evaluation will be coordinated led by MoFP, though
importantly done by external/independent evaluators, to ensure independence and
objectivity as stipulated in the Public Investment Management - Operational Manual
(URT 2007). The evaluation will assess the overall effectiveness of FYDP-II against
its objectives/goals and the targets, and where possible it will look on outcomes and
impacts. It will also constitute to the main analytical reports to inform ways to
coordinate implementation of the successor FYDP. The evaluation plan detailing
specific policy and programme evaluation to be conducted during the life span of
FYDP-II will be contained in M&E plan. Capacity development plan in evaluation
will have also to be developed as an integral part of M&E strategy.
iv. Diagnostic data and analysis:
In some issues, the M&E framework will allow detailed diagnostic work to provide
more insights to the constraints economic agents, including men and women face in
realizing economic opportunities. In some strategic projects, impact evaluation
research will be supported beyond those provided by overall assessment of the Plan.
7.4 Underlying assumptions for M&E strategy While M&E strategy is desirably necessary, its effectiveness assumes availability of
fundamental success factors, including the following:
i. Strong political will and commitment to transparency, accountability and results
based management;
ii. A coherent institutional framework with surveillance mandates on performance and
results monitoring and evaluation with clout to call defaulting implementing agents to
remedial actions;
iii. Policy consistency and persistence to ensure that the framework, which defines
responsibility, intended targets, outcomes and results of interventions are relevant and
holding;
iv. Alignment of roles, responsibilities and sequencing implementation of priority
interventions across spectrum of plans of MDAs and LGAs sharing delivery
responsibility of the projects/interventions;
v. Dedicated resources for monitoring through the budget and a revitalized Pooled Fund
Facility for M&E strategy, including key review of policies, institutional, building
analytical capacities and availing core statistical data for monitoring and evaluation.
7.5 FYDP-II Results Framework The extended results framework will be presented in a separate M&E framework document.
In the plan will be a results matrix, which among others, includes the following set of
indicators:
i. Indicators associated with aspects of industrialization and economic transformation;
ii. Indicators associated with Human development;
iii. Indicators associated with policies that remove constraints to further economic
transformation;
iv. Indicators associated with ways of working and institutional development.

84
Given the importance of industries and the employment channel, data on industrial
production, employment, and wage disaggregated by gender will be important for the FYDP
II monitoring system. In developing the FYDP II monitoring Framework, efforts should be
made to target employment and earnings by gender. Some of the indicators in the results
matrix (appended) include:
i. Unemployment rate (disaggregated) such as rural vs. urban; farm vs. non-farm,
formal vs. informal; wage vs. own incomes, etc.;
ii. Labor force participation rate and labor productivity (GDP per worker), GDP per
capita;
iii. Poverty levels (various indices), and inequities such as proportion of income
earned by the bottom quintile; farm yield, etc.;
iv. Manufacturing Value Added (MVA), exports (as measured in volume and value)
showing level of value addition/processing - non-traditional exports)
v. Savings rate and investment rate; gross fixed capital formation by key sectors -
public sector gross fixed capital formation vs. private sector.
7.5.1 Baseline and Targets
This section of FYDP II result matrix will establish baselines and set targets on aspects
related to:
i. Industrialization and economic transformation;
ii. Policies that remove constraints to further economic transformation and human
development
iii. Working culture and institutional development.
The last point above is related to quest to improve service delivery as Tanzania strengthens
policies and programs to improve quality and efficiency in the face of growing demand. In
this regard, new perspectives in surveys should include Client survey data collected regularly,
and published in gender-disaggregated formats. These surveys will cover both traditional
human development services and other services used by households in the production of
goods and services for sale and for household consumption
7.5.2 M&E Plan Implementation Framework(s)
FYDP II M&E implementation framework will be detailed and form a separate document,
clearly indicating, among others,
i. Link/interface to other process such as TSMP;
ii. Link to local government M&E systems, such as LGMD;
iii. Link to LED setup;
iv. Roles and responsibilities of all key actors in M&E;
v. Strengthening of M&E, including a national department to coordinate M&E (function,
staffing, financing, etc.).

85
ANNEXES

86
ANNEX I: SUMMARY OF RECURRING LESSONS FROM OTHER
COUNTRIES INDUSTRIALIZATION EXPERIENCE
Institutional, political and policy
Coherent Policy choices important – Botswana, Ghana
Policy must be flexible to the environment – South Korea
Firm line with corruption needs to be taken to prevent policies being undermined –
Botswana, Ghana, Rwanda,
The decentralisation of State authority combined with development mandates can lead to
good results5 - China.
Institutions need to be well designed and properly aligned and coordinated – Rwanda
Continuous improvement of the business environment is possible with the right institutions
and targets – Rwanda.
Institutional set-up needs to be in line with strategy and should ensure no overlapping
responsibilities – Dubai, Rwanda
An overarching strategy needs to be in place rather than piecemeal, chaotic approaches to
allow industrial, trade, education and technology policies to be harmonised. – Taiwan,
Thailand, Ghana
High level commitment to reform packages is crucial – Ghana, Rwanda
Political stability is important – Ghana
Ideology should not get in the way of effectiveness – Poland
Solid government finances and low aid dependency free up policy space – Malaysia
Resource Revenues
Resource wealth should be used to finance diversification of future sources of growth –
Botswana, Dubai, Oman
Countercyclical management of resource revenues can encourage macroeconomic stability –
Botswana, Chile.
Political independence of resource management organisations is necessary to prevent
political interference and damaging political agendas – Chile, Malaysia
Agriculture
Effective land management system needed – China
Agriculture development in general and food security is important component of economic
transformation – China
Rural economic transformation is critical for effectiveness of local market and poverty
reduction strategy - China
Agriculture should be commercialized withfarmersbeingorganised but left free to choose
what they grow and sell, and trade in agricultural produce should be liberalised – China.
Agricultural research programmes should be invested in to modernise agriculture – China.
Land use rights need to be appropriate to a commercial agricultural system – China
Infrastructure
Infrastructure investments should not be overlooked – Chile, Rwanda, Dubai
Inequality and education
5 Lee – also, if regional authorities are free to experiment, the methods used in successful regions can be imitated in others.

87
The potential growth of Inequality should not be neglected – Botswana, Ghana, Chile
Social safety nets are needed to insure against the inequality that can increase as the economy
grows – Chile.
Investment in human capital is important – South Korea
A good quality education system can also help to reduce inequality – Chile
And if this education system is tied to the needs of industry, it can address skill shortages –
Rwanda
Poverty reduction programmes should also be designed in line with the overarching
Strategy – Vietnam, China, Malaysia, Rwanda
Social
Ethnic Inclusiveness to avoid social tensions – Malaysia
Empowerment is a slow process. Impatient intervention can be damaging – Malaysia,
Zimbabwe
Involvement of all stakeholders – Rwanda
Openness to outsiders to mobilise their skills and experience - China, Malaysia, Vietnam.
Specific Private Sector Policies
National champions should be promoted – China, Ghana, Dubai (for booming sectors if
possible with a big-push approach)
Barriers to entry and to trade should be identified and removed – China, Malaysia
Foreign Investment is important – Ghana, Poland
Simplified trading regulations – Malaysia, Poland
Access to finance is necessary to private sector development – Oman, Ireland, China,
Malaysia, Costa Rica
Informal sector finance can be legitimized through alternative exchanges – Vietnam
Subcontracting arrangements can encourage knowledge, capital and technology spillovers
– Taiwan.
Local Content Requirements can also encourage spillovers of skills and capital.

88
Specific Country Lessons
Botswana
Policy choices are important for strong development.
A firm line with corruption has prevented development strategies from being scuttled through
graft.
Effective countercyclical use of resource revenues was important to government fiscal space.
Botswana seems to have skilfully balanced the interests of the nation with the need to
incentivise foreign capital and expertise to continue operating in Botswana – even after the
diamonds are expected to run out. (Relevant to Natural Gas and PPPs)
Inequality is an inherent side effect of a resource based economy unless consciously
addressed through redistributive policies.
Implementing redistributive policies in tandem with managing resource revenues counter
cyclically is a key challenge.
Tanzania should be careful not to put all of its eggs in two baskets (the government and a
single foreign partner) and to mobilise its resource wealth to stimulate diversification.
Chile
Countercyclical management of resource revenues is important to maintaining stability,
especially when those revenues constitute a large share of the economy.
The political independence of revenue management decisions allows this system to operate
and removes the potential for politicians to use revenues for political purposes.
Investing in infrastructure is important.
Despite economic growth, social safety nets are required to prevent rising inequality.
Quality education was something Chile neglected during its development, which probably
added to inequality.
China
Agriculture is a source of wealth for most of the population but effective land use and
management plan is required: allocation of specific land for agriculture and other economic
activities to reverse the current situation where arable land is becoming scarce as it is turned
into other uses. Tanzania should allocate and protect arable land for agriculture as well as
allocate and service land for other specific economic activities;
State authority should be decentralized and local governments should be mandated to attract
investors in their localities and provide internal incentives like reward, promotion and
recognitions for best performers as China did with Township & Village enterprises;
Diversifying agricultural production and liberalizing trade in agriculture; introduction of high
value crops and giving freedom to farmers to sell their crops including food crops, this will
make agriculture a profitable undertaking and attract more youth to engage in agriculture;
Modernize agriculture by introducing massive research programmesin agricultural science
and technology; and establishing an agricultural science and extension system to increase
production;
Promotion of "national champions" which could compete with large foreign corporations, this
can be done by identifying promising local investors and provide them with the required
support to enable them to grow and be able to compete internationally; and
Removal of barrier to entry and reduction of trade barriers to enable more Tanzanians to
invest;
Dubai
The institutional set-up needs to ensure proper coordination with no overlapping
responsibilities
Local ownership in booming sectors should be promoted
Careful management of natural resources is crucial to financing economic transformations.

89
Ghana
Government promotion of key strategic sectors can lead to growth and spillover effects
Reform packages that are comprehensive and far reaching must have commitment at the
highest levels.
A stable political environment with reduced corruption helped growth.
The appropriate policies are important
The importance of foreign investment should not be overlooked in the process of reducing
‘foreignisation’. High levels of capital and technology which are not available locally are
necessary to rapid transformation.
Inequality remained during the transformation and Tanzania should try to avoid this.
Malaysia
Ethnic inclusiveness is important in a multi-ethnic society to prevent social tensions.
Economic empowerment is a very slow process and radical interventions to encourage this
can be highly destructive.
Solid government finances and low aid dependency are important to having freedom in policy
space.
Operational independence of large state-owned energy and utilities removes them from
damaging political infighting and allows them to prioritise company objectives rather than
political agendas.
Revenues from these operations should be controlled by the operation itself, with the state as
a silent beneficiary / shareholder.
Tanzania should simplify its trading regulations to promote trade and exploit its comparative
advantage as a regional hub
Oman
Prudent management of natural resource wealth mean diversification can be financed
sustainably.
Access to finance is important to the development of the private sector.
Poland
Tanzania should not be blinded by the dogma of ideology when pursuing economic policies
and instead consider effectiveness and evidence.
The legacy of socialist ideologies needs to be recognised and, where they continue to impede
development, gradually but continuously reformed. For example, cumbersome state
bureaucracies, general attitudes.
If domestic capital is lacking, as in Tanzania, foreign investment and open trade are crucial to
creating a competitive capital-intensive industrial sector6.
Rwanda
A firm line must be taken with corruption if well designed institutional reforms are not to be
undermined through theft and malfeasance.
A well designed institutional structure can lead to ongoing and well informed reform ideas to
be generated so that the business environment is continuously improved.
The continual involvement of all stakeholders was necessary for reform ideas to be fully
informed of the realities of the Rwandan economy and to prevent them from becoming rigid
in their thinking
Commitment at the highest level is necessary for such deep reform strategies to work
Openness to outsiders – diaspora and ex-patriates – can mobilise their skills and experience
towards developing the economy.
Clearly defined roles and responsibilities of various institutions prevents chaotic and
damaging reform efforts.
6 Although sectors that are labour intensive also need to be promoted outside of this aim to avoid growing inequality.

90
Education needs to be closely linked to private sector needs to avoid skill shortages that
impede industry growth.
Infrastructure should not be neglected whilst focusing on improving the business
environment.
South Korea
The policy environment must be adaptable to changes in the economic environment and must
have the institutional structure behind it to permit such flexibility.
Human capital investment is important and allows labour intensive sectors to be competed in7.
An overarching strategy needs to be in place so that industrial policy is in harmony with trade
policy, and human resource policy etc. A holistic approach is key.
Taiwan
Because of the lack of skills, capital and technology in Tanzania, well managed
subcontracting arrangements could lead to the transfers of these from foreign firms.
Local content requirement policies can also encourage the spillover of gains from foreign
operations in Tanzania and promote local business growth, especially when combined with
subcontracting arrangements.
Vietnam
Poverty reduction programs should be closely linked with broader development programmes
to be effective and not clash with their goals.
Making land use rights more appropriate to a commercial economic system is crucial to a
country with a comparative advantage in agriculture like Vietnam or Tanzania.
Tanzania has a relatively good record on investor protection but to stem its recent decline
should further encourage shareholder participation in company decision.
Informal sector finance can be legitimized through creating an alternative securities market
where stocks not eligible for the main exchange can be traded.
7 Which are sectors that lead to less inequality growth.

91
ANNEX II: SPECIFIC SECTOR INTERVENTIONS
Table AII 1: Manufacturing Subsector Strategic Interventions
Location/
Type
Challenges
Intervention Required
Cost/Source (Tshs Bill) Expected Results
Govt Private DPs
SEZ/EPZs Strategic Choices
Bagamoyo
SEZ
Funds for outstanding
compensation
Land acquisition and
compensation
47.5 Port construction to start by
January 2017 and accomplished
by 2020
Funds for resettlement of Pande
and Zinga residences
Resettlement of Pande and
Zinga Residence
102 Port side Industrial zone fully
operational by 2020.
Employment estimated at
20,000 by December 2020
Financing of supporting
infrastructure, Port and Portside
Industrial Zones
Construction of supporting
infrastructure
2200 Estimated investment projects
(factories) to be attracted by 2020
is 10
Constructions of Port
Infrastructure
22000
Funds to facilitate Joint
Working Team and Joint Task
Force for Bagamoyo SEZ
Facilitation of JWT and JTF 0.5
Development of Portside
Industrial Zone and Mbegani
Sea port
44
Kurasini Logistics
Centre
Funds for outstanding
compensation, demolition,
clearance and chain link fencing
Land acquisition and
compensation, demolition,
clearance and chain link
fencing
3.7 Operational by June 2018.
20 local industries sell into the
zone by December 2020
2000Employment Survey and procedures for
registration of Title Deed
Registration of Title Deed 0.3
Project infrastructure Development of Kurasini
Logistics Centre
880
Mtwara SEZ
(Freeport Zone)
Project infrastructure Cost for connecting water to
the project area
0.17 Increased port capacity to handle
about 15-20 Million metric tons
per annum hence increased port
revenue

92
Location/
Type
Challenges
Intervention Required
Cost/Source (Tshs Bill) Expected Results
Govt Private DPs
Project infrastructure Cost for connecting electricity
to the project area
0.88 Expected number of firms
attracted is 8 Estimated
employment created is 250
Freeport Zone Master Planning
and environmental assessment
Cost for SEZ Master Plan and
SEA for the whole 110 Ha.
1.5
Project infrastructure Cost for onsite infrastructure
on 10 Ha. Phase 1 area
1.84
Establishment of facilities to
service the oil and gas
exploration companies
Development of Mtwara
Freeport Zone
44
Kigoma SEZ
Funds for outstanding
compensation
Financing of Project
infrastructure
Land compensation 2.1 Operational by June 2019
Expected number of firms
attracted is 5
Estimated employment created
is 200
Construction of Project
infrastructure
25
Detail design of project
infrastructure
1
Development of Kigoma SEZ 5
Tanga SEZ
Funds for outstanding
compensation
Financing of Project
infrastructure
Feasibility plan and Master
not done
Detail design not done
Land and compensation 2.7 Operational by June 2019
Estimated employment created
by 2020 is 100
5 firms attracted by 2020
Cost for onsite and offsite
infrastructure
70
Feasibility study, master plan
and cadastral survey
1.125
Detail design 1.5
Development of Tanga SEZ 5
Ruvuma SEZ
Funds for outstanding
compensation
Feasibility plan and Master
not done
Financing of Project
infrastructure
Feasibility plan and Master
Land and compensation 1.3 Operational by June 2019
Expected Number of firms
attracted is 2Estimated
employment created is 100
Feasibility study, master plan
and cadastral survey
1.25
Cost for onsite and offsite
infrastructure
50
Development of Ruvuma SEZ 2
Feasibility study, master plan
and cadastral survey
0.75 Operational by June 2018
Expected Number of firms

93
Location/
Type
Challenges
Intervention Required
Cost/Source (Tshs Bill) Expected Results
Govt Private DPs
not done
Detail design not done
Project infrastructure not done
Detail design 1.1 attracted is 10
Estimated employment created
is 500
Cost for Project infrastructure 30
Investment by Private Sector
in Mara SEZ
3
Registration of Title Deed 0.85
Manyoni
SEZ Funds for outstanding
compensation
Feasibility plan and Master
not done
Detail design not done
Project infrastructure not done
Land and compensation 0.594 Operational by June 2020
Expected Number of firms
attracted is 1
Estimated employment created
is 20
Feasibility study, master plan
and cadastral survey
0.5
Detail design 0.9
Project infrastructure 15
Investment by Private Sector
in Mara SEZ
1
Industrial Parks Interventions
Tanga - Kange Lack of Industrial Park
infrastructure such admin office,
sewage system, internal roads,
communication facilities, stable
power connections, etc.
Fund mobilization/ provision
budget for construction of
infrastructure for the park
Industrial plots with associated
basic infrastructure in place to
attract developers and
operators.
Operational by 2017
Developed downstream
industries that can be
implemented to secure further
benefits from Liganga iron ore
and steel long products
Demarcated plots for industries
constructions
Industrial cluster demarcation
in the park
Kilimanjaro
Machine Tools
Company(KMTC
)
Commercial production
stopped since 1989
Machines are in good
conditions though obsolete as
technology has changed
tremendously
Potential investors to invest on
230ha not yet secured
Lack of design and cadastral
survey/ plots demarcation due
to unavailability of fund
Rehabilitate buildings and
other associated
infrastructure
Carrying out repair and
maintenance of machines
and equipment as per
production technological
roots,
Build new industry on a
reserved land of 230 ha
Seek potential investor for
4.45

94
Location/
Type
Challenges
Intervention Required
Cost/Source (Tshs Bill) Expected Results
Govt Private DPs
Unavailability of Industrial
Park infrastructure such admin
office, water, sewage system,
internal roads, communication
facilities, stable power
connections, etc.
development of the KMTC
under PPP arrangements
Development of
Industrial Parks
(Mtwara, Lindi,
Songea,
Sumbawanga,
Dodoma, Singida,
Shinyanga,
Kagera, Mara,
Manyara,
Njombe, Katavi,
Geita, Simiyu and
Morogoro)
Investor to develop the area
not yet secured
Lack of Industrial Park
infrastructure such admin
office, sewage system, internal
roads, communication
facilities, stable power
connections, etc.
Development of basic
infrastructure (road works and
drainage system, water supply
system, electricity and
securing the area) in the areas
identified
750 Industrial park infrastructure in
place to attract developers and
operators.
Working sheds/business
premises in place by 2020
Operational offices in place by
2020 Construction of working
sheds/business premises:
22.5
Construction of 5 operational
offices
2.5
Capacity
enhancement for
TEMDO to
develop suitable
technologies
(machinery,
equipment and
devices) .
Lack of local capacity to
manufacture machinery,
equipment and devices for use
in production activities
Worn out infrastructure and
outdated Research and
Technology Development
facilities
Underfunding of R&D
activities
Lack of skilled and competent
human resource
Rehabilitation and upgrading
of R&D infrastructure and
facilities
1 Modern R&D infrastructure and
facilities available
Adequate budget for prototype
development available
Skilled and competent human
resource available for
technology development and
transfer
Increase R&D budget for
prototype development
0.8

95
Location/
Type
Challenges
Intervention Required
Cost/Source (Tshs Bill) Expected Results
Govt Private DPs
Training of personnel in
research, design and
technology development
0.3
Technology transfer to local
manufacturing SMEs
40 Suitable technologies
(machinery, equipment and
devices) available for the
industrial park investors
MSMEs Parks Strategic Choices
Domestic
Capacity to utilize
iron and steel
Unavailability of large size
foundries
Lack of coking coal
Inadequate skilled personnel
Scarce iron raw materials for
smelting
Low quality and productivity
of manufacturing sector.
Establish 3 Comprehensive
foundries at Liganga,
Nyumbu and KMTC with …
tonnages
Establish coking coal plant
for coke coal production
Enhance training to
metallurgists related skills
Fast tracking establishment
of metallurgical complex
24
Foundries of …..tonnages at
Nyumbu , .....KMTC and …..
Liganga
Coking coal plant of
….tonnages per year at
Liganga/ Ngaka
Liganga metallurgical complex
operational by 2019/20 to ….
More than 1 million tons per
year.
Strengthening
manufacturing
enterprises
through quality
and productivity
improvement
(KAIZEN) phase
II
Delay in implementation of
Phase I
The continuous intervention
through implementation for
upgrading the Tanzania’s
KAIZEN movement to the
next stage.
0.6 6.681 Tanzania’s KAIZEN movement
improved to the next stage by
2020.
Improvement
SMEs access to
industrial
infrastructure in
Mtwara, Lindi ,
Lack of Industrial Park
infrastructure such operational
offices, drainage system,
internal roads, communication
facilities, stable power
Development of basic
infrastructure (road, drainage
system, water supply system,
electricity and securing the
area)
0.75 Basic infrastructure (road,
drainage system, water supply
system, electricity) installed by
2020.
Area for developing SMEs

96
Location/
Type
Challenges
Intervention Required
Cost/Source (Tshs Bill) Expected Results
Govt Private DPs
Songea,
Sumbawanga ,
Dodoma, Singida
Shinyanga Kagera
Mara, Manyara,
Njombe, Katavi,
Geita, Simiyu and
Morogoro
connections, etc
secured
Construction of working
shades/business premises 22.5 Working sheds/business
premises in place by 2020
Construction of operational
office
2 Operational offices in place by
2020
Facilitation of
technology
transfer
Scarcity of technology
development centers in Dar es
salaam and Mara
Low capacity of the existing
TDCs in Shinyanga Lindi,
Iringa, mbeya, Arusha and
Moshi
Establishment of new
technology development
centers in Dar es Salaam,
Singida, Mara and
strengthening seven exisiting
TDCs of Shinyanga Lindi,
Iringa , Mbeya, Arusha and
Moshi
8.29
Establish new technology
development centers in Dar es
salaam and Mara by 2020
Seven existed TDCs of
Shinyanga, Lindi, mbeya,
Arusha and Moshi strengthened
by 2020
Development of incubations
in Dar es salaam, Singida,
Arusha, Lindi , Iringa
Shinyanga, Rukwa, and
Mwanza for promotion of
technology and innovation
4.44
Enhance
capacities of the
existing business
information and
SME products
display centers in
all regions
Worn out of existing building
structures
Renovation of 25 existing
building structures
0.1 25 building structures
rehabilitated by 2020
Lack of information collection
and determination facilities
Purchase and install
information collection and
determination facilities
0.25 Information collection and
determination facilities installed
by 2020

97
Location/
Type
Challenges
Intervention Required
Cost/Source (Tshs Bill) Expected Results
Govt Private DPs
Implement one
District one
product strategy
Weak or lacking business
organization structure to
collaborate with
Review districts profiles and
develop techno economic
profiles
0.05 0.45 …..districts profile and
development of techno economic
profile by 2020
Low entrepreneurship and
business acumen
Facilitate establishment of new
small scale industries
2.4 24 ……New small scale industries
established by 2020
SMEs access to
finance
High financial implication I
terms of working capital and
personnel
Facilitate SMEs to attain
TFDA and TBS standard
requirement
0.55 SMEs met Standard requirement
of TFDA and TBS met by 2020
Lack of finance to SMEs
enterprise
Enhance SMEs credit
guarantee scheme (NEDF)
4 SMEs credit guarantee scheme
enhanced by 2020
Automotive industry Strategic Choices
Commercializatio
n of Tanzania
Automotive
Technology
Centre (Nyumbu)
Worn out infrastructure and
outdated RD technology
capacities
Rehabilitation of infrastructure
and upgrading R&D
technology capacities
38 Improved infrastructure
R&D laboratory
A new foundry
Underfunding of R&D activities Increase R&D budget 15 Available budget for R$D
Pipeline of proved technologies
Practical researchers
Untitled land Titling of land 1 Land title
Proper land use planning
Aging out skilled and competent
human resource
Recruitment and training of
personnel
·South South Corporation
programme
3.3
Adequately manned institution
A pool of skilled and personnel
professional competence
Technology transfer and
assimilation
Failure to commercialize
developed automotive
technologies
PPP for automotive assembly 232 Technologies disseminated to
SMEs
Design layout of the assembly
plant
Construction of assembly plant
Commercialization of Nyumbu

98
Location/
Type
Challenges
Intervention Required
Cost/Source (Tshs Bill) Expected Results
Govt Private DPs
Truck
Spin-off companies
More innovations
Automotive industry Strategic Choices
General Tyre
(Arusha) Worn out plant associated
infrastructure and outdated
tyre manufacturing technology
Unavailability of funds to
revive and modernize the tyre
manufacturing plant
Replacement of outdated
equipment and machines
Fund mobilization for
completely revival and
modernization of the tyre
manufacturing plant.
60 Resume and increase capacity
of tyre production in the
country
Reduce foreign expenditure to
import tyres
Growth of industrial sector for
contribution to GDP
Create employment and
technology transfer to
Tanzanian
CAMARTEC-
Arusha
Inadequate of agricultural inputs
related industries
Construction of tractors and
agricultural tools
222.7 Increase in agricultural inputs
Tractors assembly
plant (TAMCO –
Kibaha)
Shortage of tractors assembly
plants
Assembling tractors which will
be used in supporting
agricultural growth
329.6 Increase the number of tractors in
the market
Motorcycles
Assembly Plant
Distance of the site from the
basic infrastructures Connection of basic
infrastructure to the site
Installation
Installation of step down
transformer from 11kV to
400V
200 nationals will be employed
including engineers, technicians,
marketers, sales persons, and
other supporting staffs.
Petro and chemical Industries Strategic Choices

99
Location/
Type
Challenges
Intervention Required
Cost/Source (Tshs Bill) Expected Results
Govt Private DPs
Liquidation of
Natural Gas
(LNG)
Lack of local capacity to
manufacture gas equipment and
devices such as gas cylinders,
gas cookers and gas equipment.
Facilitation of TEMDO to
develop and commercialize
suitable technologies/processes
for the manufacture of gas
equipment and devices.
400 Suitable technology/process for
the manufacture of gas
equipment and devices
available locally;
Capacity to manufacture gas
equipment and devices
enhanced
Gas equipment and devices
manufactured locally.
Acquisition of LNG plant site
and resettlement
Identify site for resettlement
and land survey
25 LNG site identified and
compensated
Resettlement surveyed
LNG plant in
Lindi
Lack of plant to process massive
discovered natural gas
Construction and operation of
of a joint onshore Liquefied
Natural Gas plant and
associated infrastructure
Consultant for negotiation of
the Host Government
Agreement (HGA) hired
Necessary negotiation
completed
Construction of LNG plant
started by 2020
Mtwara Petro
Chemical
Industries
Complex
Distance to Mtwara port and gas
reserves which is a critical
resource in petrochemical
industries
Construction of offsite and
onsite infrastructure
facilities, especially utilities
like water, electricity and gas
Development of the complex
11,135 Injection of substantial
domestic and foreign direct
investments
Employment creation during
the construction phase, as well
as operation and maintenance
Petrochemical
laboratory at
TIRDO
There is no specialized
laboratory for the
petrochemical industry in
Tanzania
Most of the petrochemical
products e.g. fertilizers need
tailored quality assurance
Establish an accredited
petrochemical laboratory at
TIRDO
Establish database for
nutrient requirement in each
agricultural zones
Establish quality assurance
8.5 Specialized accredited
petrochemical laboratory at
TIRDO by 2018.
Data base on nutrient
requirement in all agricultural
zones established by 2019
Quality assurance systems

100
Location/
Type
Challenges
Intervention Required
Cost/Source (Tshs Bill) Expected Results
Govt Private DPs
services to ensure quality
products to meet both
national and internal standard
requirements
systems in petrochemical
factories
established in fertiliser plants in
Mtwara, Tanga, Iringa by 2020
Development of pharmaceutical industries Strategic Choices
Agave Syrup
Factory in Tanga Financing of the project
Availability of skills local
personnel
Form JVC
Acquire industrial premise
Secure counterpart funding
Training of local personnel
15 The Factory operational by Dec
2019
… Direct employment
Construction of
other strategic
pharmaceutical
industries
Land compensation not
finalized
Delays of compensation
results into increase in
compensation cost due to
accrued interest as well as
encroachment of the area by
citizens
Feasibility plan and Master
not done
Detail design not done
Lack of adequate technology
Paying compensation
Construction of the site
Securing the investors
100.22 Increase in accessibility of
pharmaceutical equipments
Textile and Cloth Industries
Building and Construction industries Strategic Choices
Ceramics Lack of suitable local
technology for the production of
ceramic products such as tiles,
refractory bricks, etc.
Facilitation of TEMDO to
develop and commercialize
suitable technologies for
production of ceramic products
such as tiles, refractory bricks,
etc.
500 Establishment of small to medium
scale industries for the production
of ceramic products

101
Location/
Type
Challenges
Intervention Required
Cost/Source (Tshs Bill) Expected Results
Govt Private DPs
Construction of Ceramic
factory in Dar es Salaam
118.35 Ceramic products produced by
2019
Cement Inadequate cement production Construction of Cement
Factory in Tanga
2.5 million tonnes per day
produced by 2020
Kisarawe kaolin High buildings construction
costs
Agro-industries Strategic Choices
Dodoma and
Singida leather
industrial park
No proof of existing recent
feasibility study.
Issues of compensation is still
unresolved
The project cost need to be
established
Carry out feasibility study
Preparations for
compensation
Market analysis
32.96 Value addition to meet and
skin by 2020
Strengthening of leather
industries by 2020
Meat, hides and
skin processing
industry at Ruvu
Issues of compensation is still
Lack of grading livestock
products
Little value addition in
livestock
Construction of modern
abettor at Ruvu ranch
Leather tanning facility
Animal fattening system
Waste management facilities
22.59 Abettor main line construction
Edible oils
industries Low production and
productivity
Lack of modern technique of
production to meet national
and international demand
Lack of support infrastructure
and incentives to make it
operate
Lack of appropriate
Mount Meru Millers Limited
(MMML) for Sunflower Oil
Production and Packaging
Facility in Singida
343.85 1,000 Metric tons of oil per day
Introduce new oil refinery
technologies to Tanzania
Provision of 142 direct and
1000 indirect employment.
Locally manufactured oil
processing plants available for
use by the small to medium
scale processors

102
Location/
Type
Challenges
Intervention Required
Cost/Source (Tshs Bill) Expected Results
Govt Private DPs
technology for locally small
scale edible oil processing
plants
Facilitation of TEMDO to
Commercialize small to
medium scale edible oil
processing technology
(processing plant – cleaning,
expelling, filtering, refining
and packaging)
600 Medium scale edible oil
processing technology facilitated
and commercialized
Oil Palm
Production at
Kimala Misale -
Coast
Lack of roads connectivity
Delay of provision of land
title deed to NDC
Identification of about
10,000 Ha of land in Kimala
Misale for Project
implementation
Construction of basic
infrastructure such as roads
and power supply
247.2 10MW of electricity
Total employment of 1,000
employees
Additional raw materials (oil
palm) will be sourced from
local farmers to be engaged
through contract farming
programme.
Construction of
metal silos for
small holder
farmers
Lack of financing
Lack of basic infrastructures
on the site
Feasibility study
Construction of basic
infrastructures
155.89 Empowerment of small holder
farmers
Bagamoyo Eco
Energy Ltd for
Sugar Production
Lack of basic supportive
infrastructures
Inadequate sugar supply
Construction of basic
supportive infrastructures
Construction of sugar factory
303.99 125,000 metric tons of sugar,
15,000 cubic meters of ethanol
and production of 85,000MWh
per year.
Comprehensive out-growers’
development program, jobs,
technology and skills transfer to
local farmers, and increasing
Government revenue (direct
and indirect taxes).
Coal for Industries and Households Strategic Choices

103
Location/
Type
Challenges
Intervention Required
Cost/Source (Tshs Bill) Expected Results
Govt Private DPs
Rural
Electrification
through
Decentralized
Small to Medium
Scale Electricity
Generation
Facilities Using
Locally Available
Coal and Biomass
Rural electrification is less
than 5%
Poor (electrified) services for
health, schools and water
supply
Poor economic activities
Rampant diseases from use of
fuel wood
Environmental degradation
from intensive use of fuel
wood
Provision of clean energy
technologies for electricity
generation
Utilization of locally
available coal and biomass
materials
Development and
dissemination of local
technologies for electricity
generation
1,200 Advanced (electrified)
diagnostic services.
To increase access and quality
of education, this is mandatory
to the perceived industrialized
economy.
Use of carbonized
coal briquettes to
substitute
charcoal and
firewood as
cooking fuel in
Tanzania
Rampant diseases from use of
fuel wood
Environmental degradation
from intensive use of fuel
wood
Drudgery of women in search
of fuel wood
Development of carbonized
coal briquettes in
substitution of fuel wood and
charcoal for household
cooking
Utilization of locally
available coal and biomass
materials
Development and
dissemination of local
technologies for household
cooking
3.4 Availability of clean cooking
fuel
Reduced use of biomass fuel
Comprehensive
assessment of
Tanzania coal
quality using
accredited
laboratory
Despite the abundant coal
deposits, less is on their
quality
Danger of utilizing quality
(coking) coal for thermal
applications
Technology development is
impaired in absence of coal
quality information
Establishment of coal quality
databank for Tanzania
Undertaking a detailed
sampling and analysis of
Tanzania coal
5.5 Known quality of available coal
Enhanced coal utilization
Enhanced coal export
Development of coal utilization
technologies for industries,
households, and for chemical
industry

104
Location/
Type
Challenges
Intervention Required
Cost/Source (Tshs Bill) Expected Results
Govt Private DPs
Iron and Steel Strategic Choices
Development of
iron and steel
technologies from
locally available
ore deposits
Existing ore deposit under-
utilized
Overdependence on scrap
metal for iron and steel
industry
Low technological capacity in
iron and steel industry
Low quality of iron and steel
products
Low iron and steel per capital
consumption and hence low
GDP
Capacity development to the
TIRDO accredited
metallurgical laboratory
Carrying out evaluation of
raw materials for iron &
steel and other related
industries.
Characterization and
optimization of raw
materials and direct
reduction (DR) process
parameters for production of
high-grade sponge iron from
e.g. Liganga and Maganga
Matitu iron ores
Develop appropriate iron
and steel technologies for
SMEs Transfer the
technology of sponge iron as
metallic feedstock in rolling
mills and foundries to
replace conventional scrap
metal Assist local industries
to produce high quality iron
& steel products e.g. high
strength steel reinforcement
bars.
5.3 Strengthen the infrastructure for
conducting applied R&D and
testing activities in iron & steel,
coal, oil, natural gas, and agro-
processing
Best practices production
methods in iron & steel, coal,
oil, natural gas, and agro-
processing made available to
SMEs Improved quality of
locally manufactured products
as well as enhanced capability
and competitiveness of the
industry
Increased knowledge and skills
to improve technical
competence for supporting the
industry.
Improved local support services
for increasing competitiveness
and ensuring sustainability of
the industries
Enhanced value addition of
raw materials in iron & steel,
coal, oil and natural gas
Creation of employment in
emerging SMEs through
technology transfer
Increased foreign exchange
earnings through improved
quality products and services

105
Location/
Type
Challenges
Intervention Required
Cost/Source (Tshs Bill) Expected Results
Govt Private DPs
Industrial services Strategic Choices
Provision of
Professional Coal
Analytical
Services for
Supporting
Industrial Coal
Users (Cement,
Paper Mills and
Others) and the
Proposed Thermal
Power Plants
(Kiwira,
Mchuchuma, and
Ngaka)
Tanzania coal is analyzed
abroad
Abroad analysis is skeptical
and is associated with delays
Tanzania coal quality is less
known which poses for
cheating in coal export deals
There is a rampant revenue
loss due to adulterated coal
quality
Strengthening the technical
capacity to the coal
accredited laboratory at
TIRDO
Dedicating the TIRDO coal
laboratory into a reference
coal laboratory
2.5 Increased government revenue
(GDP) from coal quality
assurance in industries and
power sector
Technologies transfer for
industrial purposes include
carbonization for metallurgical
coke production; combustion;
gasification, coal to liquid,
different area and blending
Development of coal
briquetting technologies will
benefit the industries and
household
Increased human resource and
skills
Increase employment in coal
industries and SMEs
Improving
competitiveness
to industries
through energy
management
Energy cost to industries
consumes up to 40% of total
revenue
The high energy cost makes
industries not attractive
The high energy cost makes
products not competitive
regionally and internationally
Introduce energy
management practices to
industries
Train the industries to adopt
the practices and energy
efficient technologies
Energy management skills
development to industrialists
0.89 Increased revenue and GDP
from industries
Reduced energy consumption
Reduced energy bills
Increased competitiveness of
industrial products
Environmental management
Revival of
privatized
industries
Majority of the privatized
industries are said to be
marginally contributing to the
development agenda
Less is known on their status
Undertake an industrial audit
to establish the status of the
privatized industries
Undertake the needs
assessment
1.5 Prioritize industries and
respective intervention
Mitigate industrial problems
Increase industries contribution

106
Location/
Type
Challenges
Intervention Required
Cost/Source (Tshs Bill) Expected Results
Govt Private DPs
Some are said to have shifted
their basic role
Establish a prioritized
strategy by taking into
consideration of
employment, GDP
contribution and contribution
to socio-economic
development
to GDP and employment
Assist TIB in industrial studies’
investment

107
Table AII 2: Mining Subsector Strategic Interventions
Location/Type Challenges Intervention Required Cost/Source (Tshs billion) Expected Results
Govt Private DPs
Minerals Beneficiation and Value Addition Strategic Choices
Processing of precious
metals and gemstones Unorganized market for small
scale mining
Unreliability raw material
stocks
High volatile global commodity
price
Existence of black market and
smuggling activities
Lack of Mineral Value Addition
Act
Establishing a
gemstones/gold bourse
BOT start buying and
stocking refined gold
Enforce the restriction of raw
gemstones export
Establishment of tin
processing plant
Formulation of mineral value
addition act
200 122.27 Increased minerals value
Low assaying, lapidary and
jewellery making skills
Low gem identification, stone
carving and laboratory services
Introduction of lapidary,
gemology, jewelry design,
jewelry manufacturing, stone
carving and gem
identification specialized
training course at VETA
level and accreditation by
international institutions like
GIA, GIT
50 Increased skills for minerals
value addition
Low activities of lapidary and
jewellery industry
Introduce restriction of gold
export only refined up to
bullions
Establishment of lapidary
and jewelry industries
29 Increased employment and
national income
Caustic Soda Refinery
Plant Incomplete environmental
clearance
Not yet identified development
partner
Lack of feasibility study
Compensation to the
residents
Construction of the refinery
plant for caustic soda
Carry out feasibility study
0.7 Feasibility study carried out
Compensation completed
Plant for caustic soda
constructed
1 million tons of caustic
soda per year
Revenue of 400 billion per
year

108
Location/Type Challenges Intervention Required Cost/Source (Tshs billion) Expected Results
Govt Private DPs
Liganga iron ore and
steel Compensations/ resettlement not
started
Delayed road and railway
construction
Unreliable source of power
Set aside budget to finalize
compensation in
Construction of road and
railway
3.34 3,785.9 4000 direct jobs
Liganga project operational
by 2018/19
Kabanga Nickel Unreliable infrastructure (power
supply and rail transport);
Fall of Nickel price in the World
market;
Generation of enough power
to run the mine and
construction of standard
gauge railway line from
Kabanga to Dar es Salaam
Mkuju Uranium
Project Obtaining mining development
agreement
Cumbersome regulations to
enter game reserve
World price after Fukoshima
incident
Inadequate funding for
monitoring activities
Inadequate trained personnel in
radiation monitoring
Lack of specialised laboratory
and equipment
Low public awareness in
radiation related issues
Specialized equipment for
surveillance inspections
Capacity to conduct inspections
Occupational exposure due to
Radioactive dust and radon gas)
and external exposure (Gamma
radiation).
Safe disposal of radioactive
waste arising from uranium
mining.
Scrutinizing the draft MDA
and sign process to take
effect;
Awareness campaign;
Infrastructure development
like roads, water, electricity,
railways etc);
MEM to discuss with
Ministry of Natural
Resources and Tourism on
how to wave regulation to
operate in game reserve for
mining companies;
Ministry in collaboration
with UN on equipping TAEC
laboratory, specialized
equipment for surveillance
inspection, training of
personnel in radiation
monitoring and upgrade of
Dar port to handle class
seven material
Capacity building;
Establishment of steering
committee which will have a
memorandum of
1,680.00
Mining development 2016
4,000 direct jobs during
construction phase and then
1,500 operation

109
Location/Type Challenges Intervention Required Cost/Source (Tshs billion) Expected Results
Govt Private DPs
understanding between
ministries

110
Table AII 3: Construction Subsector Interventions
Location/Type Challenges Intervention Required Cost/Source (Tshs. Bill) Expected Results
Govt Private DPs
Promoting Local Construction Industry Strategic Choices
Equipment Weak capital Promoting Hire and purchase
mechanism
Establishment of contractors
assistance fund
26.7 Hire purchase mechanism
enhanced
Contractors fund in place by
June 2020
Skills Development Low skills and lack of
experience
Conditional partnerships
between local and domestic
companies
Field attachment of students
to domestic and foreign
construction companies
Training of local contractors
267.74 8,593 contractors trained by
2020
3,500 field attachment trainees
domestic and foreign
construction companies by
2020

111
Table AII 4: Agricultural Subsector Interventions
Location/Type Challenges Intervention Required Cost/Source (Tshs. Bill) Expected Results
Govt Private DPs
Crops Strategic Choices
Maize Low productivity
High post harvest loss
Limited storage capacities
-Increase use of modern
technology
-Construction of 150 collective
warehouse Based Marketing
schemes –COWABAMA
22.37 Increase maize production by 100,000
tons annually
-Post harvest losses reduced
Rice Weak rice cultivation practice
Limited irrigation coverage
Low productivity
-Project for supporting rice
industry Development in
Tanzania
- Increase use of modern
technology
9.35 3.11 18.707 1.963 million tons of paddy produced
per year by 2018
Linking KPL commercial Farm
with smallholder farmers to
raise productivity to world class
levels (Mngeta and Kihansi
Valley) using improved
irrigation and System for Rice
Intensification (SRI) and state of
the art rice drying and milling
technology
305.10
Project’s phase I operational and
producing at least 50,000 tons
(Mngeta farm) and 10,000 tons
(smallholders out-growers) per
annum.,
technology installation Large-Scale
Zero Tillage Mechanized farming
introduced
Create at least 86 full time jobs and
325 part time jobs during phase I of
project development.
Expanded Rice
production
Project (ERPP)
Weak rice cultivation practice
Limited irrigation coverage
Low productivity
Improving crop productivity
through irrigation and crop
management
Innovative marketing
strategies
Sustainable seed systems.
Project management and
coordination
Improved rice production
1.0 48.791 Increase Rice Production and
Productivity.
Expansion of Rice marketing
Increased productivity from 4-6MT
to 8-10MT/ha
Increased seed production on 400ha.

112
Location/Type Challenges Intervention Required Cost/Source (Tshs. Bill) Expected Results
Govt Private DPs
techniques through (SRI).
Agricultural Sector
Development
Programme II (ASDP
II)
Land and Water mismanagement Sustainable Water & Land Use
Management
1.45 Integrated water use &
management for crops/irrigation &
livestock/fishery development
Land use planning and sustainable
watershed & soil management
Mainstreaming resilience for
climate variability/change and
natural disasters
Enhanced Agricultural
Productivity
1.517 Agric. research for development -
AR4D
Extension, training & info. services
Access to agricultural inputs
Access to mechanization services
Rural Commercialization &
Value Addition
1.483 Stakeholder empowerment &
organization
Value addition & agro processing
Rural marketing
Access to rural finance
Strengthening Sector Enablers 1.778 Policy and regulatory framework
Institutional capacity strengthening,
communication and knowledge
management and ICT
Food security and nutrition
ASDP2 sector c coordination
(planning & implementation at
national, regional and LGA levels)
Monitoring & evaluation (incl.
Agricultural statistics).
Sunflower Compliance with and
adherence to internationally
recognized food safety and
Promoting contract farming
in the local sunflower
industry;
Increase of sunflower productionin
Tanzania.
Greater penetration of sunflower

113
Location/Type Challenges Intervention Required Cost/Source (Tshs. Bill) Expected Results
Govt Private DPs
quality standards
Availability and accessibility
of high-quality certified
sunflower seeds
Availability of agricultural
inputs, including fertilizers and
pesticides
Management capacities of
farmers’ associations to
sustainably increase sunflower
production
Adoption of GAP
Access to finance and limited
use of insurance across the
value chain
Storage capacity and
application of premiums and
discounts for quality
Strengthening coordination
across the sunflower industry,
Promoting the use of locally
produced sunflower products;
Improving the quality of
sunflower products to comply
with both national and
international standards,
Reviewing any policy
constraints or issues that
affect the sunflower industry
Provide timely and
appropriate market entry
support for effective market
development
oil in Tanzanian markets, through
improved oil quality and food
safety.
Expansion of sunflower oil market
in the Eastern, Southern and
Central African regions through
increased production volume.
Expansion of sunflower oil into
foreign markets, particularly India,
Europe Middle East and the
United States, through greater
adoption of high-quality seed
postharvest practices
Pulses
Lack of commercially
available improved pulse
varieties and deficient seed
multiplication system
Limited interest from farmers
in using improved varieties be-
cause of the high cost of seeds
and other inputs
Low productivity levels
resulting from the limited
availability of agricultural
inputs, training and services to
improve production and reduce
losses
Limited access to rural finance
for pulse production.
Low levels of quality
assurance and disease control
strengthen policy support
institutions, that will promote
pulses as a viable agricultural
crop,
Improve quality standards and
improve inter-institutional
coordination.
Tackles weaknesses in supply
conditions generally and
production level inputs in
particular
Effectively build the skills of
stakeholders throughout the
different stages of the value
chain, in order to ensure that
productivity rises, losses fall
and professionalism improves.
2.6
Increased production of pulses to
carter for the increase in demand
for legume-based proteins
Increased pulse exports
particularly to India in, which can
be extended with branding ;
To tap in the huge South Asian
diasporas in regional markets, as
well as Middle Eastern and
European markets, which is an
existing consumer base which
remains untapped to a considerable
degree by Tanzanian exporters;
Increased export of processed
pulses from the United Republic of
Tanzania due to the ban on imports
of pulses from India.

114
Location/Type Challenges Intervention Required Cost/Source (Tshs. Bill) Expected Results
Govt Private DPs
in the production of pulses
Limited availability of
efficient storage and
warehousing along the value
chain
Increased Investment in the
country opportunities
Low levels of investment
attracted into the sector at the
levels of research and
development, inputs,
production techniques,
postharvest handling and
storage, and distribution
Lack of market information
and trade promotion
Scale up production and
trade by strengthening PPPs
for seed development, access
to finance, and technology
transfer and farmer support
services.
Promote skills building along
the value chain to
professionalize the sector.
1.5
Floriculture The construction of greenhouses
which is considered to be the most
expensive accounting for more
than 50% of total investment cost
Research on cheap materials for
the construction of green houses
4.5 Cost of greenhouses reduced
Purchase of land and rose planting
materials, which represent more
than 18 and 12%, respectively
Diversification of the
industry towards the southern
highlands could further
enhance the growth of the
industry
The involvement of
stakeholders in the
acquisition of inputs,
research and market
information
1.3 Costs of Land reduced particularly in
the southern Highlands
Growers consider the policy as
being too general and not
applicable to the flower industry
To formulate guidelines under
the existing National
Agricultural Policy that
specifically and actively
promotes the cut flower industry
in Tanzania.
Cut flow production promoted and
enhanced
Several introduced municipal Engagement of municipal Municipals Taxes reduced

115
Location/Type Challenges Intervention Required Cost/Source (Tshs. Bill) Expected Results
Govt Private DPs
taxes were affecting business
planning.
officials as stakeholders in
floriculture business
Cotton Poor cotton farming practices
result in suboptimal yields
Excessive price volatility
limits farmer motivation to
grow cotton and increases
poverty
Mistrust between farmers and
ginners hinders cooperation
Quantity and quality of cotton
lint is unreliable and
inadequate for the domestic
textile industry
Limited productivity and value
addition in the cotton by-
product subsector
Insufficient policy support for
the sector hinders development
Lack of institutional
coordination and support in
specific areas of the value
chain leads to various
inefficiencies, including
limited service provision and
advocacy
Structural problems within the
industry impede development
Burdensome taxes reduce
competitiveness
The impact of climate change
on cotton production.
Raise the profitability of
cotton production through in-
creased productivity and
quality control.
Improve the policy
environment to raise the
efficiency and
competitiveness of the cotton
value chain.
Improve the competitiveness
of textile and gametes firms
through raised productivity
and product diversification.
Strengthen the Government
focus on investment as a
vector for growth and
integration in the value chain.
Strengthen the capacity of
firms to diversify markets to
raise profitability.
5.2 Availability of raw materials (local
cotton is available at a discount of
5 % of the world market price)
Increased ability to access the
Preferential market in the United
States and EU markets
Cheap products produced as a
result of Low labour costs (~US $
0.40 per hour – similar to
Bangladesh and among the lowest
labour costs in the world)
Increased employment potential to
both skilled and unskilled labour
An array of investment promotion
incentives (including Export
Processing Zones (EPZs) and
Special Economic Zones (SEZs)
managed by the Export Processing
Zones Authority (EPZA).
Sisal Low production in the country
There huge capacities to
produce various sisal products
but underutilized due to low
Increase sisal production
through encouraging Estate
farming, and establishing
smallholder and out grower
1.71 Increased Sisal Production
More investments both FDI and

116
Location/Type Challenges Intervention Required Cost/Source (Tshs. Bill) Expected Results
Govt Private DPs
fiber production and
unfavorable policies in local
production
Low utilization of the
abundance labour
Low value addition to the raw
sisal fibre as only the 2% of
the sisal plant is utilized to
produce fibre the remaining
98% biomass that is thrown
away as "waste" at cost both
financially and to the
environment is now known to
contain serious economic value
and is being seriously
exploited. (see sisal energy)
Low level of research
schemes Local in sisal industry
High level of productivity due to
utilization of the abundance of
managerial, skilled and semi-skilled
workers with qualifications and
experience in the sisal industry.
Increased production of fiber that
can be utilized in the production of
various sisal products
Strengthened Tanzania only sisal
Research Centre in the world at
Mlingano, Tanga now equipped
with an ultra-modern Meristematic
Increased capacity utilization to
produce various sisal products
Encourage Investment in sisal
industry so as to utilize the
abundance of managerial,
skilled and semi-skilled workers
with qualifications and
experience in the sisal industry
built over a period of more than
100 years of commercial
production.
Opens up further market
opportunities for sisal to
produce energy, medicinal,
composite and value added
products such as pulp for paper,
which will be very competitive.
Carry out the extensive Market
Research into new fiber-based
products that has market
potential running into millions
of tons worldwide
Grape Insufficient agricultural
extension services
low labour productivity
Government should employ
more extension officers in order
to help to overcome production
challenges
0.8
High yield as well as quality
improvement
Labour productivity improved
Provision of agriculture
technologies and
information/knowledge from
research experts to farmers
0.6
High price of Inputs Insecticides
and fertilizer
Delayed payment by
Establishing grape Board and
provision of credit to grape
farmers
Increase budget for subsidized
1.0 Affordable prices of inputs
Prompt and reliable payment system
Reliable Market established

117
Location/Type Challenges Intervention Required Cost/Source (Tshs. Bill) Expected Results
Govt Private DPs
processing firms
Unreliable markets and low
prices
Unreliable rainfall,
Low level of Investment
inputs More yield due to irrigation
Large scale production Written contract between
producers and the buyers
(Processing Firms)
Government should invest in
processing industries in order to
increase market for this crop
Increase irrigation techniques
Encourage large scale
investment including FDI
0.4
Sunflower Low production and
productivity
Lack of modern production
technologies to meet national
and international demand
Increase sunflower production
and productivity through the
adoption of modern
production techniques to
Meet national and
international demand.
3.3 Increase the production of sunflower
to …..tons by 2020
Low skills across the value
chain
Lack of coordination and
institutional capacity across the
value chain
Modernize the sunflower
industry through strengthening
coordination, institutional
capacity and skills across the
value chain.
4.3 Strengthening coordination,
institutional and skills across the
value chain by 2020
Low quality of sunflower products Improve the quality of
sunflower products to comply
with national and international
standards
1.65 Quality of sunflower products
improved by 2020
Small growth of the sunflower
sector
Incoherent policies with the
nation objectives
Stimulate growth in the
sunflower industry by
implementing coherent and
supportive policies in line with
national development objectives
1.0 Growth in sunflower industry
improved by 2020
Mkulazi
Agricultural
City
Incomplete land layout and design
Lack of core infrastructure
No prospecting investor obtained
Shortage of water and irrigation
infrastructure
Construction of basic
infrastructure
3,117.8 Established basic infrastructure in
place by 2020
Obtain potential investors by
2020

118
Location/Type Challenges Intervention Required Cost/Source (Tshs. Bill) Expected Results
Govt Private DPs
SAGCOT Lack of smallholder farmers
aggregated into commercial
farmer organizations
Small number of nucleus farms
Low value chains in agriculture
Large scale Nucleus Farms
and Sustainable Agriculture
projects financed by TADB
984.000 At least 10 large nucleus farms
500,000 smallholder farmers
aggregated into commercial farmer
organizations by 2020
Lending to at least fourteen value
chains in the eight sub sector of
focus
Capacity building for
ASDP Shortage of skilled personnel on
data collection, analysis and
Data based reporting under
ASDP
Clear demarcation with other
statistical data
Development on Data
collection, Analysis and Data
based reporting under ASDP :
3.56 4.71 10.47 ….Personnel on Data collection,
Analysis and Data based reporting
under ASDP trained by 2020
Projects have been conducted
under the absence of ASDP
basket fund which is the main
source of DADPs.
Project for strengthening the
Backstopping capacities for the
DADP planning and
implementation under the ASDP
Phase II
3.67 4.90 10.91
Strengthening the linkage between
farmers and market
Low capacity of irrigation human
resources personnel
irrigation human resources
development by strengthening
the capacity of Arusha technical
college
2.45
Increase in number of skilled
personnel
Weak irrigation development
capacity especially at local level
Project for capacity
development for the promotion
of irrigation scheme under
DADPs phase 2
8.02
505,000 farmers using irrigation by
2019
Low rural agricultural
development
Rural agricultural Development 0.67 Rural agricultural enhanced by 2020
Irrigation schemes Unreliable rainfall
Weak irrigation development
capacity especially at local level
limited irrigation infrastructure
available
Limited irrigation infrastructure
promotion of irrigation scheme
Development Under the District
Agricultural Development plan
phase II
8.02 …..irrigation schemes scheme
developed by 2020
Construction and operationalize of
Mwampuli irrigation scheme by
2020
Irrigation system for cotton and
Mwamapuli irrigation scheme 99 126.18
Construction of irrigation
system for cotton and
8,180

119
Location/Type Challenges Intervention Required Cost/Source (Tshs. Bill) Expected Results
Govt Private DPs
available
Weak operation and
maintenance of irrigation
infrastructure
horticulture (12,300ha) horticulture constructed by 2020
irrigation area Increase by 37,000ha
in 2020
race production increased by
191,400tons in 2020
Annual increase of irrigated land:
30,000ha by 2018
Small scale irrigation
Development project
75.718
Small Scale Irrigation
Development Project SSID
30.08
Improvement of
R&D in crops
cultivation
Chronic diseases to crops like
maize, cassava etc
Establishing researches on
chronic diseases to crops like
cassava maize paddy etc.
1.75 Researches on chronic diseases
established by 2020
Shortage of seeds for difference
crops
Production of seeds for different
crops
5.0 ….tons seeds for different crops
produced by 2020
Lack of technologies which adds
nutrients to soil
Analyzing different agricultural
systems and providing
technologies which will add
nutrient to the soil
2.4 Soil nutrients improved
Weak research infrastructure Improving research
infrastructures and capacity
building to the researchers
15.73 Research infrastructure improved by
2020
Extension officers Shortage of extension officers Providing training to the farmers
and improving cultivation
practices through increasing the
number of extension officers
882.64 Number of extension officers
increased from 10,089in 2015 to
16,225in 2020
Agricultural land use
plan
Existence of land
conflicts
Preparing the plans for
agricultural sustainable land use
through surveying the farms and
providing ownership title to the
farmers
4.1 Farmers been able to use land as a
collateral for bank loans by 2020
Eliminating land conflicts by 2020
Women and youth
empowerment
through agriculture
Lack of land tittles
Poor linkage of farmers with
financial institutions
Low level of technology use
Indicating and surveying the
agricultural land.
Continuing with surveying
the land and provision of land
titles
Linking farmers with financial
institutions
9.34 Increase the number of land tittles
to farmers
Linkages of farmers to financial
institution improved by 2020
Usage of technologies improved by
2020

120
Location/Type Challenges Intervention Required Cost/Source (Tshs. Bill) Expected Results
Govt Private DPs
Improving the use of
technology
Market availability
for crops Poor participation of private
sector on construction of
markets and silos
Lack of commodity exchange
market
Lack of strategic markets at the
boards
Incorporating private sectors
on construction of markets
and silos
Introducing market products
in accordance with the law
(commodity exchange Act 15
of 2015.
Construction of strategic
markets at the borders,
improving and empowering
corporative unions
2.4 Private sectors involved on
construction of markets and silos
Introduction of commodity
exchange markets.
strategic markets at the borders
Constructed by 2020
Encouraging cooperative
unions and private sector to
establishing agro processing
industries
2.04 Processing industries established by
2020
Skills development
for improved
livestock productivity
Lack of high skilled personnel
to provide quality livestock
efficiently
Lack of community based
national livestock early warning
system
Strengthening Livestock
Training Agency (LITA) to
provide quality livestock
training efficiently
1.67 30 LITA staff in long (PhD & MSc)
and short courses trained
class rooms at Madaba and
Morogoro Campuses in good
condition Community based national
livestock early warning system
project
6.54 Community early warning system
enhanced by 2020
Regulatory
Framework for
Animal Health
services
Inefficient of regulatory
framework for animal health
services
Low capacity of institution of
the Veterinary Council to
regulate animal health services
effectively and efficiently
Enhancing Regulatory
Framework for Animal Health
services
1.67 Regulatory framework for animal
health services improved to enhance
the capacity for monitoring and
enforcement of Animal Health
Services.
Institution capacity of the
Veterinary Council to regulate
animal health services effectively
and efficiently strengthened

121
Location/Type Challenges Intervention Required Cost/Source (Tshs. Bill) Expected Results
Govt Private DPs
Beef and others Low quality and productivity
Rudiment slaughtering premises
Lack of competitive market for
meat industry stakeholders
Meat quality and marketing
improvement
3.72 Tanzanian Meat quality standard
codes available and quality control
mechanism applied;
Pictorial livestock and meat grades
available and livestock and meat are
graded;
Meat industry stakeholders are
competitive in market; and
TAMEPA, TALIMETA and CCWT
organized and functional.
Beef Industry
Development: Lake
Zone (Mwanza,
Shinyanga, Mara and
Kagera), Central
(Dodoma, Singida
and Tabora), Nothern
Zone (Manyara,
Arusha and
Kilimanjaro) and
Eastern Zone
(Morogoro and
Pwani).
Low quality beef products
Under exploitation of resources
in livestock sector
Shortage of skilled personnel in
livestock related field
To increase production of
quality beef cattle in the
country that meet international
standards.
Increase national outputs
through exploitation of under-
exploited resources in the
livestock sector.
Develop local human
resources capacities for
operation and management of
ranches.
Pictorial livestock and meat
grades available and livestock
and meat are graded
Meat industry stakeholders
are competitive in market
Enhance technical skills
development in meat value
addition
Purchase and installation of
hide pullers in areas of high
slaughter figures.
To undertake massive
livestock breeding programme
ASDPSAGC
OT
16.92 Production of quality beef cattle in
the country enhanced to meet
international standards by 2020
…. human resources trained for
operation and management of
ranches.
Enhance Meat industry stakeholders
competitiveness in market by 2020
Enhance technical skills
development in meat value addition
to …. Personnel by 2020
massive livestock breeding
programme undertaken through
both natural and Artificial
Insemination by 2020
…..ha of pasture and crops growing,
and paddock and wire fenced by
2020.

122
Location/Type Challenges Intervention Required Cost/Source (Tshs. Bill) Expected Results
Govt Private DPs
through both natural and
Artificial Insemination
Facilitate pasture and crops
growing and padlock and wire
fencing
Chicken Low quality and quantity of
DOC produced in the country
Unsatisfied production and
marketing of indigenous
chicken rearing
Lack of poultry stakeholders
organization
Establishment of Multi-
Stakeholder
Innovation Platforms (MSIP) for
improvement of marketing
system and commercialization
of indigenous chicken in:
Arusha, Dodoma,
Kilimanjaro, Morogoro,
Mtwara, Mwanza, Shinyanga,
Singida, Tabora and Tanga.
4.14 Organized commercial indigenous
chicken producers
Increased quality and quantity of
DOC produced in the country
Improved production and
marketing of indigenous chicken
Women and youth groups involved
in chicken rearing
Improved livelihoods of women
and youth
Established and strengthened
poultry stakeholders organizations
Dairy Lack of milk drinking culture of
the human population;
Inadequate internal market for
milk and milk products
Low capacity of production,
collection, processing and
marketing of a wide range of
dairy products produced in the
country;
High rate of rural poverty
School milk feeding programme
in Tanzania
1,750.29 Developed milk drinking culture of
the future human population;
Expanded milk drinking culture of
the future human population;
Internal market for milk and milk
products;
Increased capacity of milk
production, collection, processing
and marketing of a wide range of
dairy products produced in the
country;
Reduced imports of milk and milk
products;
Employment creation along the
dairy value chain (for every 100
litres produced 4 jobs are created);
Reduced rural poverty by increasing
farmers’ income; and

123
Location/Type Challenges Intervention Required Cost/Source (Tshs. Bill) Expected Results
Govt Private DPs
Increased government revenue
through formal marketing of milk
and milk products.
Fisheries Strategic Choices
Deep sea fishing Low fish export from Tanzania
EEZ
Lack of data collected from the
EEZ fisheries resources
Inadequate fish processing,
value addition and marketing
Construction of fishing landing
port (Tanga or Dar es Salaam or
Mtwara)
1,336.20 400.86 801.72 Employment and business
opportunities increased
Fish export from Tanzania EEZ
increased
National food security improved
Reliable data collected from the
EEZ fisheries resources
Tourism opportunities improved
Fish processing, value addition and
marketing improved
Worn out of TAFICO
infrastructure
Fish Post harvest loss
Low government revenue from
fishing
Lack of modern fisheries
facilities
Operationalization of new
TAFICO along the coast of
Indian ocean
26.39 Current value of TAFICO assets
TAFICO infrastructures
rehabilitated;
Establish a modern fisheries
handling facilities at RasMkwavi,
TAFICO Dar es Salaam;
Appropriate use of under/un
utilized facilities;
Increased government revenue;
Enhances livelihood opportunities
and income
Fish post-harvest loss reduced;
Improved fisheries Laboratory
services along the coast of Indian
ocean;
Enhanced mariculture production
and marketing;
Employment increased; and
Food security enhanced.
Lack of deep sea fishing facilities Strengthening fisheries market of Fisheries markets strengthened by

124
Location/Type Challenges Intervention Required Cost/Source (Tshs. Bill) Expected Results
Govt Private DPs
Sea fishing Feri (DSM), Kirumba (Mwanza)
and Munganza (Kagera )
2020
Construction of pools for fish
farming
Increase fish production from 10,000
tons to 50,000 tons per year
Procurement of 5 fishing vessels 15,000 employments per year
Empowering seaweed farmers
especially women and youth
groups in the coastal region
Increase production from 12,000 tons
to 20,000 tons per year
Aquaculture Shortage of skilled personnel
Lack of low cost aquaculture
technology
Establishment of national
aquaculture development
programme
1,246.40 Increased income from aquaculture
Increased aqua-farmers practicing
aquaculture operations
Increased production of aquaculture
products
Automatic water
Quality Monitoring
and Reporting in
Aquaculture
Inadequate supply of fish to the
existing fish processing
industries
Lack of modern technology in
aquaculture
There is a need of establishing
automatic monitoring and
reporting systems of aquaculture
industry in Tanzania and
identification of baseline
conditions suitable for aquatic
life.
Training of SMMEs owner of
fishing processing industries
on modern fish farming
technology
Establishment of automatic
monitoring and reporting
system I Tanzania and
identification of baseline
conditions suitable for aquatic
life
Environmental impact
assessment
0.70 Increase fish production
Modern technology on fish farming
transferred to fish farmers by 2018
Fish farmers trained on new fish
farming technology by 2020
Fish Processing
Empowerment of
artisanal fishers in
Tanzania
Lack of fisheries resource
management
Lack of resources utilization
and marketing
Fisheries Resource
Management
Fisheries Resources
Utilization and Marketing
30.650 Fisher folks marketing ability and
income generation strengthened
through acquisition of
entrepreneurship skills by 2020;
Alternative livelihood to fishing
communities will be promoted by
2020;
Sustainable fisheries promoted
through educating fishing

125
Location/Type Challenges Intervention Required Cost/Source (Tshs. Bill) Expected Results
Govt Private DPs
communities on sustainable
fisheries management by 2020;
Increased fish catches, revenue and
food security;
Reduced fish post harvest losses
and poverty reduction among
fishing communities by 2020; and
Improved fisheries resources
management and environmental
protection by 2020

126
Table AII 5: Environmental and Natural Resources Conservation Interventions
Location/Type Challenges Intervention Required Cost/Source (Tshs. Bill.) Expected Results
Govt Private DPs
Promotion of Renewable green Energy technologies (Biogas, LPG, Solar Energy ) Strategic Choices
Household level
(rural and urban)
Policy, institutional capacity Need for a Green Growth
Strategy
Enact a Charcoal production
and Use Regulation policy
Increased renewable energy sources
Climate adaptation and mitigation and projects Strategic Choices
Strengthening the forest
institutions responsible for
forest management and
development
Climate Fund and Financing
mechanisms established
Increased community resilience
capacity to climate risks
Reduction on Damage and loss due
to natural disasters
Enforcement of EIA and SEA regulations for all major projects Strategic Choices
Major industrial
zones
Institutional, Policy and Legal Cabinet decision on new
National Environment Policy
(NEP)
Reduced water and air pollution
Undertake Tourism and hospitality industry Strategic Choices
Key Tourism
potential areas
(Kilimanjaro/Arusha)
Capacity and knowledge gaps
(including attitude, cultural)
Comprehensive Tourism and
Hospitality strategy
Increased Revenue from Tourism
industry
Increased forest and habitat
cover for increased ecosystem
services (clean water, air,) and
products
Outdoor recreation
facilities
along the coast of
Dar es salaam city
Realization of fund and technical
expertise to turn the project into
reality.
Development of outdoor
recreation facilities
along the coast of Dar es salaam
city
4,454 Open areas are properly utilized
for public recreation and to
attract additional visitors and to
become an integral part of the
local tourism economy in
Tanzania.

127
Location/Type Challenges Intervention Required Cost/Source (Tshs. Bill.) Expected Results
Govt Private DPs
Poverty eradication through new
employment opportunities.
Revenue to the Government
through taxes; and
Increase number of international
and domestic tourists hence
revenue to the government.
Tourism Strategic Choices
Increasing the
number of tourist Attract more tourist to visit
Tanzania
Encouraging of local tourism
Increase of new tourist
attraction centers
Increase revenue from tourism
Strengthening training on hotel
and tourism hospitality
Add impetus to tourism
landmark
Encouraging local tourism
Open up tourism opportunities
in the southern zone
Increase the number of beds
Increase the number of tourism
products
Increase the number of tourists
visiting Tanzania from 1200000to
2000,000 by 2020
Increase the number beds to 1,735
in 2020
Number of local tourist visiting
various tourist centers increased
Number of personnel trained on
tourism disciplines to increased
Number of tourism products
increased
Lack of Theme Parks in Dar es
Salaam City
Construction of Theme Park in
Dar es Salaam City
0.5 Theme park constructed in Dar es
salaam by 2020
Natural Resources Strategic Choices
Strengthening the
contribution of
natural resources
products (forestry
and bees) to the
Economy
Resolving territorial disputes
between citizens and the
surrounding areas near by
reserves
Improving infrastructures
within the game reserves
Continuing within the bee
keeping program of 2007-2016
Increasing the area for planting
trees from 60,000ha in 2015
130,000 ha in 2020
Establishing authority
responsible for wildlife

128
Location/Type Challenges Intervention Required Cost/Source (Tshs. Bill.) Expected Results
Govt Private DPs
management
Poor management of natural
resources
Sustainable Management in
natural resources
4.88 Natural resources management
strengthened
Inadequate capacity to combat
wildlife crime
Combating Wildlife Crime and
advancing Conservation
0.83 Wildlife crime reduced
Poor management of wet lands Kilombero wet land
management
2.08
Kilombero wet land managed
Inadequate natural resource
management Resilient natural resources
management for growth
55.675 Natural resources management
improved by 2020
Natural resources (forestry) Strategic Choices
High loss of forest cover due to
unsustainable use
Tree Planting 2.84
…..ha of trees planted by 2020
National tree planting
and management
strategy 2016-2020
Unsustainable livestock
management practices
Un-coordinated implementation
of environmental best practices
Incidences of wildfires
Inadequate compliance to the
national legislations and by-
laws
Inadequate monitoring and
evaluation programmes
Inadequate incentives for tree
planting and forest protection
and management
Inadequate stakeholders
involvement
Unsustainable human activities
on vulnerable areas
Unsuitable tree species in water
catchments including high
water consuming tree species,
alien and exotic tree species
Inadequate use of alternatives to
Tree planting in open areas
degraded areas, institutional
area, water sources etc.
Improve public awareness on
tree planting
Financing resources
mobilization
Monitoring and evaluation at
national level
105.150 185,000ha (280 million trees)
planted every year

129
Location/Type Challenges Intervention Required Cost/Source (Tshs. Bill.) Expected Results
Govt Private DPs
energy sources
No green areas preserved in
expansive urban developments
Poor value private value chain Private Forestry and Value
Chain in Tanzania
2.64 Private forest value chain improved
Inadequate institutional
capacity in forestry and
beekeeping
Capacity Building in Forestry
and Beekeeping Institutions
0.5 Institutional capacity in forestry and
beekeeping enhanced
Enhancing the Forest Nature
Reserve Network for
Biodiversity Conservation
1.32 Forest Nature Reserve Network for
Biodiversity Conservation enhanced
Heritage
Heritage liberation
program There is no liberation heritage
program leading to
disappearance of heritage
Acquire land for
construction
Construct buildings for
liberation program
11.12
Availability of 25 hectors of land.
Publication in place
Availability of four Blocks
Cultural tourism
promotion along the
central slave and
ivory trade caravan
route
Difficulties in coordinating the
stakeholders to participate in
the project
Identify, demarcate, map
and erect sign posts in
relevant locations along the
route
0.239 Attractive, accessible well
conserved and managed Central
Slave and Ivory Trade Route.
Increased revenue from
collection to the Division of
Antiquities and local
government authorities
Increased number of
tourists/visitors on the route and
promote income generating
Declaration of Mamboya,
Mpwapwa and Kilimatinde
heritages sites as national
monuments.
0.068

130
Location/Type Challenges Intervention Required Cost/Source (Tshs. Bill.) Expected Results
Govt Private DPs
Restoration and
consolidation of the Slave
Route in the selected centers
0.678 activities to local communities.
Preparations and
implementation of
awareness raising strategy
for the route
0.239
Construction of onsite
museum and rehabilitation
of historic monuments
along the route 300,000
0.717
Preparations of the Tourism
Master Plan for the Slave
Route 30,000

131
Table AII 6: Science Technology and Innovation Interventions
Strategic choice Location/ Type Challenge Required Intervention Cost/Source (Tshs billions) Expected Result
Government Private DPs
Technology Advancement
Acquire, Adopt and adapt
technologies for building technical
capabilities for industrial
development
Technology
agreements
Low technological
capabilities limits
competitive growth
Develop technology road maps,
build relevant human capital
and promote technological
adoption and adaptation
mechanisms
4.00 1.50 2.00 Competitive products and
services in manufacturing
sector
Develop and partner with local
and foreign Private sector to Invest
in Technology Parks (Parks
provide mechanisms for
innovating R&D and testing for
market)
PPP
arrangements
for investments
– Prioritized
sectors and geo-
locations
Limited Product and
service development
and testing for
markets.
Investment and marketing 50.00 150.00 10.00 Increased quality and
standards of products and
services readily available
for market.
Increased number of
innovations
Research and Innovation
Invest in local research and
innovation focusing human and
industrial development with
special consideration to value
addition. Support STI policy
implementation and Impact
evaluation of interventions
R&D
institutions
Limited and
uncompetitive
output from R&I for
uptake by industry
Increased support/investment in
competitive research granting
Increased support/investment in
Commissioned research
granting
30.00 4.00 5.00 Increased locally generated
knowledge for human and
industrial development
improved health and
education services, water
and sanitation
Developand equip research
infrastructure forhigher learning
and R&D Institutions
R&D
institutions
Low capacity for
production of quality
R&D output from
local facilities.
Competitive R&D
outputs need cost
effective use of
facilities
Increased support/investment in
research facilities
40.00 0.00 10.00 Improved research
environment that will be
translated in to Quality
research for better products
while informing policy and
supporting decision making
Buildcompetent and competitive
human capital(vocational,
Pre-employment
and Post-
Low level of skills
and competence to
Increased investment in human
capacity building at all levels in
94.5 0.00 10.5 Competent and competitive
work/labour force,

132
technical, professionals, graduates
and postgraduates) in areas
relevant to industrial development
training
institutions8
cater for
industrialization
accordance with the National
Skills Development Strategy
(NSDS)
developed.
Innovation
Promotion of Innovation
initiatives at Local Government
Authorities (LGA) through
supporting SMEs, Clusters, and
startups
LGA, NEEC,
Innovation
platforms
Unemployment;
unfavorable
environment (policy
and resources) for
uptake of
innovations; weak
linkages between
R&I and industry
Job creation through support of
innovation platforms; Nuture
innovation ecosystem;
Strengthen linkages between
R&I and industry
23.00 8.50 2.00 Increased employment
(both self and institutional)
Enhanced
commercialization of
research and innovation
outputs
Improved linkages between
R&I and industry
Expand and exploit ICT
opportunities particularly for
improving quality and access of
social and business services
Primarily social
service sector
Geographic divide
and resources limits
access to quality
social and business
services
Increase access to and use of
ICT platforms particularly in
health services and education
delivery system
15.00 2.00 8.00 Improved quality and
access of health services
and education delivery
particularly in rural areas
8 See the National Skills development strategy (NSDS) developed by the Ministry of Labour and Ministry of Education, Science and Technology and Vocational training.

133
Table AII 7: Human Development Interventions
Locatio
n/Type Challenges Intervention Required
Cost Implication (TshsBil.) Expected Results
Government Private DPs
Education
Early
Learnin
g
Deteriorating family
cohesion , parenting and
virtues
Inadequacy descent pre-
schooling facilities and
teachers
Train teachers for pre-
primary schools
Implement comprehensive
plan for free education
Increase rooms for pre-
primary education
70.10
The number of schools and teachers with
curricula and syllabi improved
Availability of the English language
curriculum
Primary
School
Inadequate number of
teachers in relation to
number of students
across LGAs
Poor quality and
standards of school
environment
Weak inspections
Improper Methodology
for Learning and
Teaching of 3Rs
Unqualified teachers and
lack of incentives for
upgrading
Weak administration and
enforcement of code of
conducts
High pupils teacher ratio
Inadequate text books
Improvement of Literacy and
Numeracy Strategy (LANES) 31.99 Improved Pupils to Class Ratio
Improved Pupil to Latrine Ratio
School inspectorate tools reviewed to
incorporate 3Rs and distributed to all QAs
ESDP Developed and sub sector operational
plans in operation
LGAs meet annual target for schools
achieving acceptable primary PTR range
Outreach visits to sensitize communities
about enrolment conducted
annually implemented
Education Sector Performance Report
(ESPR) in place
The proportion of pupils and books
improved
Program for Results (P4R) 416.62
Construct class rooms and
latrines 800.00
Implement comprehensive plan
for free education
150.00
Enhance School Inspection 9.26
Improve availability of water,
electricity 200.00
Training science subject
teachers
15.00
Review and improve teaching
curriculum
12.15
Procure text books 100.00
Seconda
ry
School
Unqualified teachers and
lack of incentives for
Secondary Education
Development Programme
(SEDP II)
1.00 19.66 Increase completion rate at O-Level and A-
Level

134
Locatio
n/Type Challenges Intervention Required
Cost Implication (TshsBil.) Expected Results
Government Private DPs
upgrading
Weak administration and
enforcement of code of
conducts Weak
inspections
Inadequate number of
mathematics and science
teachers
Poor quality and
standards of school
environment
Implement comprehensive plan
for free education
185.00
Specialty Qualification Training Records in
place
Improve examination pass rate in
mathematics and science subjects
Improved Students to Class Ratio
Improve Students to Latrine Ratio
Increased number of secondary school
meeting minimum infrastructure
requirements
Improved Students to Class Ratio
Enhance School Inspection 9.26
Construct classrooms and
Latrines 600.00
Training more science subject
teachers
35.00
Improve availability of water,
electricity and latrines 100.00
Higher
Learnin
g
Educatio
n
Increasing number of
students who need loans
for higher education
through Loan Board
Rapid change of
technology
Shortage of lecturers in
universities
Enhance Loan Board to
continue issuing loans for
higher education
2,500.00 Eligible students facilitated with loans for
higher education
ICT infrastructure enhanced
Increased number of lecturers
Expand use of advanced ICT
technology 12.15
Train more lecturer for
different courses
100.00

135
Table AII 8: Sports and culture Interventions
Challenges Intervention Required Cost Implication (Tshs. Bill.) Expected Results
Governm
ent
Privat
e
DPs
Sports and culture Strategic Choices
Tanzania is lagging behind
in Sport worldwide
No purposeful investment
has been done to boost
sport, hence lagging
behind
Construction of National Sports
Complex
Construction of Malya Sports
College 243.90
Availability of National Sport Complex
Availability of college to train sports
Poor environment for
Bagamoyo College of Arts
Absence of culture complex
in the country
Rehabilitation of Bagamoyo College
of Arts
Construction of Culture Complex 100.96
Improved learning environment
Availability of Culture Complex

136
Table AII 9: Skills Development Interventions
Location/Typ
e
Challenges Intervention Required Cost Implication (Tshs. Bill.) Expected Results
Government Private DPs
Skills Development
Strategic
Skills
Development
for achieving
Middle
Income
Economy.
Education institutions
does not consider skills
requirement of the
labour market
Low quality Education
Inaccurate investment
and Insufficiency
financial resources for
skills development
Lack of opportunities for
apprenticeship and
internship
Lack of strong labour
market information
system
Lack of National Skills
Development Strategy
Prepare National Skill
Development Strategy
Prepare curriculum for
training suitable for labour
market demand, working
cultures and confidence of
self employment
Increase equipment and
infrastructure for practical
training
Increase the number of
qualified teachers and tutors
Increase colleges which
offer middle cadre skills
Provide internship training
for graduates at the working
places
Provide apprenticeship
training for students at the
working places.
To develop and strengthen
the national labour market
information collection
system
To initiate and strengthen
the availability of labour
market information in all
regions of the county
357.38 - -
National Skill Development Strategy in
place.
Increased staff with practical training.
Skilled Tanzanians to be absorbed in
new emerging sectors of Oil, Gas, ICT,
Mining, Agri-business, Tourism and
Hospitality services,transportation and
logistics.
Reduced low skilled labour force to
middle cadre.
Labour market information system in
place.

137
Location/Typ
e
Challenges Intervention Required Cost Implication (Tshs. Bill.) Expected Results
Government Private DPs
To conduct the Labour
Force and Manpower
Surveys in every two years.
To identify people with
skills obtained through
informal system learning for
six priority sectors
To provide training and
certificates which are
recognized by the labour
market
Education and
Skills for
Productive
Jobs.
The cultural barriers to
technical and
vocational skills levels.
The need for soft skills
such as work ethics,
teamwork, and
communication to meet
the demand of
employers.
Train 2500 graduates
country-wide in
agribusiness skills to
establish agri-business
enterprises.
Train 6100 extension
officers’ country wide.
Train 2,750 in agribusiness
skills needed by Tanzanian
emerging commercial sector
Twenty (20) Agricultural
and Livestock Training
Institutes (MATIs & LITIs)
upgraded with tools for
more practical, competence-
based training
Train 20,000 young
smallholder farmers in
modern irrigation
management skills in 10
regions of Tanzania
80,20
267.35
Number of graduates trained on
agribusiness enterprises.
Number of extension officers trained.
Number of public training providers
with at least 30% private sector
representation on their board
Number of training providers receiving
financing from the Skills Development
Fund (i.e. grant agreements signed)
Number of enrolled students in
alternative, TVET and university
training programs in targeted sectors
funded by the Skills Development Fund
or supported to attend training by the
National Student Voucher scheme

138
Location/Typ
e
Challenges Intervention Required Cost Implication (Tshs. Bill.) Expected Results
Government Private DPs
Raise the number of
Tanzanians with basic ICT
skills from 10-17 million.
Vocational
Training Skills Mix not
conducive, middle
cadres is low
Low access to and
improved quality and
equity of technical
vocational education
and training
Low capacity of
secondary teacher
education in science
and mathematics.
Construct infrastructures
in 13 institutions
Expand the ICT
infrastructure for 53
institutions
Increase enrolment for
students 12.83 83.91
Expanded infrastructure at 13 institutions
(4 RVTSCs, Morogoro Vocational
Teachers Training Centre, Arusha
Technical College and 6 TTCs) with
about 8,000 trainees attending at any
given time
Expanded and extensive use of ICT in
instruction at 53 institutions
Increased capacity for teaching, policy
formulation, planning and quality
assurance in technical vocational
education and teacher education
No modern workshop for
practical training to
students in 30 vocation
training colleges
Construct workshop to equip
students in practical
training
Improve learning
environment for students
300 Availability of modern training
workshops
Folk
Education
Development
Programme II
Most of the college
buildings and
infrastructures are in
dilapidated form
Poor enrolment in most
FDC as compared to
planned enrolment
Construction of buildings
for FDC colleges in the
country
Improve infrastructure in
FDC colleges
Capacity Building
663.22
284.28
Increased number of FDCs graduates
managing their own income generating
projects
Increased technical knowledge in
communities

139
Location/Typ
e
Challenges Intervention Required Cost Implication (Tshs. Bill.) Expected Results
Government Private DPs
Youth
Development
Programme
Increasing Youth
Unemployment. Enhance youth
entrepreneurship skills
LGAs to allocate special
areas for business to
support youth
Provision of soft loans to
youth
Promote local and
international markets for
products produced by
youth
33.6
Reduced Youth unemployment.
Availability of markets for youth
produced products
Entrepreneurship skills to youth
enhanced
Increase
number of
rural
planners
from
Institute of
Rural
Developmen
t Planning
Shortage of offices in
the college
No proper use of land
plan
New campus has
shortage of offices
Shortage of
accommodation for
students
Construction of
Academic Blocks at Main
Campus and Lake Zone
Centre Mwanza
Land-scapping at
Dodoma Campus
Construction of
Administration Blocks at
Dodoma Campus Lake
Zone Centre Mwanza
Construction of hostel
blocks at Dodoma
Campus and Lake Zone
Centre Mwanza
125.33
Availability of office space and well
equipped offices
Student and staff canteen in place
Availability of administration block
Availability of academic block
Availability of Investment Centre

140
Table AII 10: Health Interventions
Location/
Type Challenges Intervention Required
Cost Implication (Tshs Bill) Expected Results
Government Private DPs
Health
Improve
livelihood
of
Tanzanian
Potential new
AIDS infection if
not managed
Youths are more
vulnerable to
AIDS infection
New born are
vulnerable to
mother to child
transmission of
AIDS
Mainstream AIDS issues in core sectors 111.35 90% of core sectors incorporate
AIDS issues in their strategic
plans by June 2021
Increased HIV and AIDS
counseling by June 2021
A number of children below 15
years receive ART by June 2021
Prevent new infections to young people 412.00
Testing of children under15 years
Reduce new infections of AIDS
3,986.33
Strengtheni
ng of
Referral
System
Physical barriers
resulting into lack
of access to better
health services at
different levels of
service delivery
Construction of 8,743dispensaries and 2,751
Health Centres
13,369.21 Increased access to health
services.
Reduced Congestion of patients
at National levels.
Strengthened availability of
blood at the Lake Zone
Improved disgnostic services and
reduced congestion to National
level.
Improved TB and infectious
diseases control
Create conducive working
environment for planning and
coordination HIV and AIDS
interventions.
Improved diagnostic services
Construction of 29 new District Hospitals for
new Districts Hospitals
610.36
Construction of 5 Regional Hospital for new
Regions
415.44
Construction of Zonal Hospitals in Southern,
Western, Eastern and Lake zones.
400.00
Construction of regional satellite blood bank
in five BRN regions Kigoma, Mara, Mwanza,
Simiyu and Geita
0.50
Completion of 2 storey X-ray building at
Mbeya Referral Hospital
3.00
Construction of new ward and rehabilitation of
the existing buildings at Kibong’oto Infectious
Centre
2.00
Renovation, rehabilitation and equipping of 21
regional hospitals
126.00

141
Location/
Type Challenges Intervention Required
Cost Implication (Tshs Bill) Expected Results
Government Private DPs
Construction and rehabilitation of
infrastructures at Mirembe and Isanga
Institutes for Mental Health
6.00
Completion of office building at National
AIDS Control Programme (NACP)
5.00
Construction of National Laboratory 11.00
Improve
availability
of
specialized
services
Increased costs of
referral Abroad
Equip Referral, Specialized and National
Hospitals with modern equipment.
424.73 Reduce the number of referral
abroad
Improvement of diagnostic
services
Short and long term training to health staff in
Referral, Specialized and National Hospitals.
63.44
Procurement and maintenance of medical
equipment for Regional and District Hospitals
through ORIO project
25.00
Strengtheni
ng of
Training
Institutes
Shortage of Health
Professionals in the
Health Sector
Rehabilitate, redesign, remodeling of old
buildings and construction of new buildings in
77 Health training Institutions.
27.50 Increased number of Health
professional in the Sector
Improved capacities of HRH to
provide specialized services Counter Part funds for construction of Health
Training Institutions carried out by the Global
Fund
3.00
Long course training for health professionals 26.50

142
Table AII 11: Water Subsector Interventions
Location/Type Challenges Intervention Required
Cost Implication (Tshs Bill)
Expected Results Govt.
Private DPs
Water Resource Management Strategic Choices
Protection,
development and
management of
water sources in
the country (all
Basin Water)
Pollution and
encroachment of water
sources in the country
Climate change and
variability which causes
insufficient short rains
Exacerbating decrease of
water flows
Destruction of water
source areas (watershed,
wetlands, springs and
recharge areas)
Inadequate water
storage facilities
infrastructure that
impedes the national’s
ability to deal with
climate variability
impacts.
Demarcation and gazetting of 161
water sources
Preparation and approval for
Integrated Water Resources
Management and Development
Plans (IWRM&D Plans) for all 9
Water Basins
Drilling of 150 groundwater
monitoring boreholes, and
rehabilitation of existing 120
Construction and rehabilitation of
offices for 9 Basin water Board.
250.00
456.12 161 Water source identified and demarcated
IWRM &D Plan in all 9 Basin prepared
150 groundwater monitoring boreholes drilled
120 groundwater borehole rehabilitated
9 Basin water office constructed and
rehabilitated
Water quality
management and
pollution control
Increasing pollution of
water source from
Municipal sewage,
mining and industrial
activities, agriculture etc.
Rehabilitation of 9 existing
laboratory buildings and
construction of 8 new water
laboratories;
Conduct water quality monitoring
of all important water sources; and
Development of comprehensive
fluoride database and maps in
10.500 21.301 8 Laboratory building constructed;
9 Laboratory building rehabilitated;
Water quality pollutants/contaminants
determined;
A comprehensive fluoride database and maps in
fluoride belt developed.

143
Location/Type Challenges Intervention Required
Cost Implication (Tshs Bill)
Expected Results Govt.
Private DPs
fluoride belts
Rural water Supply Strategic Choices
Scale up water
supply in Rural
areas
Shortage of water supply
infrastructure in rural areas;
Low capacity of some
consultants and contractors
to supervise and implement
water projects;
Financial constraints as a
results of delay in
disbursement which result
in increased costs due to
accruing of interest rate;
Low awareness of
communities contribution
to capital investment,
O&M and conservation of
water sources
Construction of 38,759 new water
points to serve 9,644,750;
Rehabilitation of 19,889 non-
functioning water points to restore
water supply service to 4,972,250;
Installation of 17,686 water points from
extension of existing infrastructure, to
serve 4,463,000 people; and
Recruitment and deployment of 386
Water Engineers and 3,338 Water
Technicians to LGAs up to the ward
level
950.000
528.528 Increase the number of people with access to water
in rural areas from 20,022,283 in 2015 to
43,285,159 in 2020.
Improved water supply and sanitation services in
rural areas
Improvement of
Same - Mwanga
water project
Shortage of water supply
infrastructures
Construction of water source, intake,
storage facilities, transmission lines and
distribution networks
10.000 88.340 Improved water supply and sanitation services in
Same and Mwanga townships
Urban water supply Strategic Choices
Improvement of
water supply in
Mtwara -
Mikindani from
River Ruvuma
Increase of water demand
due to rapid increase of
population;
Inadequate water storage
facilities infrastructure that
impedes the national’s
ability to deal with climate
variability impacts; and
Shortage of water supply
Construction of water source, main
transmission line, storage facilities and
distribution networks
150.000
550.000 Improved provision of water supply services in
Mtwara urban areas and along the main pipes

144
Location/Type Challenges Intervention Required
Cost Implication (Tshs Bill)
Expected Results Govt.
Private DPs
infrastructure
Rehabilitation and
improvement of
water supply in
Arusha city
Increase of water demand
due to rapid increase of
population; and
Shortage of water supply
infrastructure
Construction of water source, main
transmission line, storage facilities and
distribution networks
100.000
514.6152
Water supply and waste water infrastructures for
Arusha rehabilitated and extended
Extention of
Kahama -
Shinyanga water
project to Tabora,
Nzega, Igunga and
89 Villages
Shortage of water supply
infrastructures
Construction of water source, intake,
storage facilities, transmission lines and
distribution networks
150.000
590.348 Water supply infrastructures for Tabora, Nzega and
Igunga, 89 villages constructed and water supply
service improved
Improvement of
water supply and
sanitation services
in Regional
centre's
Increase of water demand
due to rapid increase of
population;
Inadequate water storage
facilities infrastructure that
impedes the national’s
ability to deal with climate
variability impacts;
Shortage of water supply
infrastructure
Weak legal framework to
address vandalism;
Dilapidated water
infrastructure; and
High level of Non Revenue
Water (NRW)
Completion of major water supply and
sanitation projects at Chalinze phase III
Project, Musoma - Bukoba project,
Dodoma project, Mugango - Kiabakari,
Bunda, and New Regional HQ project;
Construction of 22 treatment plants;
Construction of 44 storage tanks;
Construction of 60 wastewater treatment
ponds;
Construction of 887 Km of sewer lines;
Installation of 200,000 new house
connections; and
Construction of 330 Km new
transmission main and laying of
2,111km of distribution network
250.000 503.804
Water supply infrastructures improved and Non
Revenue water Reduced in all regional centre's

145
Location/Type Challenges Intervention Required
Cost Implication (Tshs Bill)
Expected Results Govt.
Private DPs
Improvement of
water supply in
DSM
Weak legal framework to
address vandalism;
Dilapidated water
infrastructure; and
High level of Non Revenue
Water (NRW)
Completion of on-going strategic
projects in DSM (Lower Ruvu, Upper
Ruvu, Kimbiji and Mpera Deep Water
Production Boreholes);
Construction of Kidunda Dam;
Construction of 76km access road to
Kidunda dam
Expansion of water supply networks;
and
Implement NRW strategy in DSM
Construction of 11 water storage tanks;
Drilling of 26 boreholes and
construction of 10 kiosks in low
income areas; and
Construction of 7 water treatment ponds
and 156 km of the public sewer line;
130.000
594.185
Kidunda dam and access road constructed;
Water supply infrastructures improved; and
Non Revenue water Reduced from 47% in 2015 to
30% in 2020;
26 borehole and 10 kiosks in low income area
constructed; and
7 water treatment ponds and 156 km of the public
sewer line constructed
Water supply
improvement in
National projects,
District HQ and
small towns
Weak legal framework to
address vandalism;
Dilapidated water
infrastructure;
High level of Non Revenue
Water (NRW);
Lack of skilled of staff; and
Pollution of water sources
Strengthening of wanging’ombe,
Maswa, Mugango-Kiabakari, Handeni
Trunk Mian (HTM) chalinze, Makonde
and Kahama- Shinyanga projects,
District HQ, and Small Towns;
Construction of 37 treatment plants;
1,091 Km of new transmission main
constructed and 3,518 Km of
distribution network expanded;
306 storage tanks constructed;
110,000 Household water connections
installed; and
Recruitment of 260 Water Engineers
and 1,040 Water Technicians to
enhance the human resources technical
capacity
1.553 0.381 37 treatment plants constructed;
306 storage tanks constructed;
Water supply infrastructures improved; and
Non Revenue water Reduced in all District HQ,
Small towns and National Projects; and
110,000 Household water connections installed

146
Location/Type Challenges Intervention Required
Cost Implication (Tshs Bill)
Expected Results Govt.
Private DPs
Construction of
Dams in dry
regions including
DSM
Climate change and
variability which causes
insufficient short rains
Exacerbating decrease of
water flows
Rainwater harvesting dams/pools in
Dodoma, Singida, Tabora, Mara,
Simiyu, Arusha, Shinyanga, Manyara,
DSM etc. constructed
50.000 150.000 8 Strategic dams constructed;
6 dams rehabilitated for rainwater harvesting in in 9
regions; and
Water supply infrastructures improved
Construction of 8 strategic dams for
environmental conservation, preventing
floods etc.
350.000
560.000
Rehabilitation of the existing dams 75.000 150.000
Water Program Delivery Support Strategic Choices
Program
Coordination and
Performance
Monitoring
Human resources capacity
constraints in IA's in area
of financial management,
contract management, PPP
and project follow-ups,
which has contributed to
slow in implementation of
water projects.
Construction of ongoing Office
Building projects for MOWI, Basin
Water Boards, Urban Water Supply
and Sanitation Authorities and Water
Laboratories;
5 Major PPPs Projects devel
6,000 staff trained in enhanced
Management Information System
(MIS), contract management and
Social and Environmental Safeguards
(SES) guidelines
MIS enhanced to produce Interim
Financial Reports (IFR), Contracts and
other sector M&E reports
0.250 0.409 On going Office Building projects for MOWI, Basin
Water Boards, Urban Water Supply and Sanitation
Authorities and Water Laboratories constructed;
5 Major PPPs Projects developed and implemented;
Implementation of Projects in the Water Sector
enhanced

147
Table AII 12:Urban Planning, Housing and Human Settlement Development Interventions Location/Type Challenges Intervention Required Cost/Source (Tshs. Bill) Expected Results
Govt. Priva
te
DPs
Rapid Urbanization
Outdated master plans
Unplanned settlements and
growing slums in urban
centers
Less transparent,
inefficient and worse
resourced land sector
Small proportions of
villages with land use
plans
Formulate and implement a well-
designed National Urban Development
Strategy
Preparation of General Planning
Schemes (Master Plans for major
Tanzanian cities)
Establishing land rangers’ and building
inspectors’ Units in order to efficiently
manage land development
190.00 25 master plans prepared
Overlapping mandates of
the LGAs in Dar es Salaam
with that of the regional
administration which
undermines regional
coordination
Major services such as
transportation, land use
planning, water and waste
management are not
coordinated on a
metropolitan-wide basis
Reform the institutional and
governance arrangements to improve
coordination, accountability, and
service delivery, thus enabling Dar es
Salaam to evolve into an efficient
metropolitan area.
Local government must be
increasingly empowered to make
planning decisions.
New LGAs structure for Dar es Salaam
Poor urban infrastructure
and amenities
Limited financial resources
required to meet the
demand for urban
infrastructure investment
Pursue new sources of financing, such
as Private Public Partnerships (PPPs),
for investment in urban infrastructure
Scaled up to all Urban Local
Government Authorities (ULGAs),
including property taxes, so as to boost
Own Source Revenue (OSR)
LGA Level PPP contracts on key strategic
amenities and locations
Urban LGAs with property Revenue
Collection and Information System (LGRIS)
Poor urban mobility and
access to service quality,
jobs, etc.
Transform Dar es Salaam by expanding
and improving DART, including swiftly
expansion of new variant of DARR;
Introduce few (oligopolistic) but efficient
Improved urban mobility

148
regulated public transporters; and
integrated transport and land-use
planning.
Housing and Sustainable Human Settlements Strategic Choices
Zonal Offices in Dar
es Salaam,
Morogoro, Dodoma,
Tabora, Mwanza,
Arusha, Mtwara and
Mbeya
Poor housing and over
clouding
inadequate office spaces
insufficient teaching
premises like classrooms,
libraries and dormitories to
properly accommodate
academic functions
Construction and Rehabilitation of
Buildings
29.30
Ardhi House building rehabilitated;
8 Zonal Land Zonal Offices constructed
Classrooms, libraries and dormitories for
Ardhi Institutes Tabora constructed and for
Ardhi institute Morogoro rehabilitated.
Increase students enrolment and thus reduce
shortage of land sector experts .
Kilombero,
Ulanga/Malinyi
Districts in
Morogoro region
Unplanned settlements and
growing slums in urban
centers
Less transparent,
inefficient and worse
resourced land sector
Land Tenure Support Programme
20.00
Regularized, surveyed and titled land in two
districts by 2018
Country wide Poor infrastructure Tanzania International Boundaries
Reaffirmation Project 54.29
New boundaries protocol established by 2018
Well defined borderline
181 LGAs in
Tanzania Mainland
Proportion of districts,
villages and reserved land
with undisputed Government
notes
Programme for Planning, Surveying and
Titling of Land in Tanzania 1,129.00
Unplanned settlement reduced and increase of
land as collateral
Kigamboni - Dar es
Salaam
Absence of Master Plan for
Kigamboni City
Implementation of Kigamboni New City
Master Plan 66.28
Kigamboni area planned, surveyed and allocated
Low cost houses Low income earners cannot
afford to own houses
Promotion of Appropriate Technology
for Affordable Housing
14.69
Improved housing standard of the low income
bracket
Job creation for the youths
Affordable low cost building materials
Availability of affordable housing for low
income earners
Land Inefficient sustainable land
use plans
Preparation sustainable land use plan 215
7,500 villages and 25 districts land use plans
prepared
2,500,000 citizens provided customary right
of occupancy
250 land registry at district and village level

149
constructed
2,000,000 citizens in line with registering
other legal documents provided
Land
administration
Country wide
Absence of integrated land
management information
system
No or weak land
compensation fund
Lack of verified data on
virgin lands which are not
developed for long time
Land conflicts
Absence of land bank
Put in place Integrated land
management information system
Strengthening land services in 8 zones
Building the capacity of the councils
through training and equipments
Strengthening the land compensation
fund
Verifying the virgin lands which are
not developed for long time
Establishing national land advisory
council
Providing training to the community
about land laws
Strengthening the land conflicts
solving services by establishing 100
new land and housing councils in
districts with majority of land
conflicts
260
Integrated land management information
system in place
capacity of the councils enhanced through
Land compensation fund strengthened
Undeveloped virgin lands identified
National land advisory council established
Community trained about land laws
100 new land and housing councils
established in districts with majority of land
conflicts by 2020.
Housing Strategic Choices
Country wide Absence of national
housing bank
Tax on construction
materials of low cost
houses especially in
villages
House construction 2,635.44 50,000 low cost houses constructed
Tax on construction materials of low cost
houses especially in villages reduced
Low cost construction corporative unions
established and strengthened
Urban and rural
planning Incomplete provincial
master plans
Unavailable satellite cities
in Dar es Salaam and other
cities
Non-formalized operating
business
Provincial master plans
Encourage Satellite cites development
Formalization of businesses
293
Provincial capitals master plans completed
Satellite cities in Dar es salaam and other
cities developed
Property and Business Formalization Program
(PBFP) in un-surveyed areas implemented
surveying and
mapping No satellite receiving
station in Tanzania
Construction of satellite receiving
station at University of Dodoma
79
Satellite receiving station at University of
Dodoma constructed.

150
No base mapping available
in the country
Improving landmarks between
Tanzania and neighboring countries.
Unsecured international
boundaries. Strengthening 7 international
boundaries
Tanzania international boundaries secured and
improved

151
Table AII 13:Food Security and Nutrition Interventions
Location/Type Challenges Intervention Required Cost Implication (Tshs. Bill) Expected Results
Govt. Private DPs
Food Security and Nutrition Strategic Choices
Construction of
grain silos in
7zones
Shortage of storage
capacity
construction of grain silo storage
system in 7 zones
128.1
14
Increased storage capacity by 2020
Nutrition specific interventions areas: Strategic Choices
Promotion of
Maternal Infant
and Young Child
Feeding practices
(MIYCF)
including
nutrition related
WASH, ECD and
Health key
family practices
in order to
prevent stunting
and
improvement
early childhood
development
Low percentage of
mothers practicing
timely initiation of
breastfeeding and
exclusive breastfeeding
Poor quality of health
care, nutrition,
protection of young
children
There has been high
rate of deaths for
infants
Conduct TOT’s on SBCC IYCF,
WASH, ECD and Health (at
regional level)
Deliver Services to Children and
Support Early Childhood
Programmes to Vulnerable
Children
Care givers and educating parents
Promoting and Enhancing
awareness to Community on Early
Child Development (ECD)
Coordination, Monitoring and
Evaluation of ECD
334.24 8.91 18.89
To contribute to the reduction of
malnutrition prevalence among children
under five years and women of
childbearing age (15-49 years) including
adolescent girls in Tanzania
Increased quality ECD services for
children from vulnerable including with
albinism and children from poor
families
Increased early life skills development
and nutrition
Sensitized communities on the
importance of ECD
Inadequate support from
families, communities,
policy makers and skilled/
trained personnel to breast
feeding mothers
Training of Health service providers
(Nurses, Midwifes, and Clinicians) on
SBCC IYCF, WASH, ECD and
Health (at district level)
Increased proportion of adolescents,
pregnant women and mothers / caregivers
of children under two years who practice
optimal maternal, infant and young child
nutrition behaviours
Inadequate supportive
supervision to trained
personnel conducting
infant feeding counseling
Training of Health service providers
(Nurses, Midwifes, and Clinicians) on
growth monitoring and promotion
using WHO 2006 growth standards
·Increased coverage and quality of MIYCN
services at the community level by June
2021

152
Location/Type Challenges Intervention Required Cost Implication (Tshs. Bill) Expected Results
Govt. Private DPs
Organise quarterly meeting among
health service providers and CHWs at
Health Facility level
·Improved MIYCN law enforcement
through advocacy and capacity building of
key institutions
Training of community health
workers on SBCC IYCF, WASH,
ECD and Health (at district level)
·MIYCN is promoted at all levels through
mass-media and the use of new
technologies
.Inadequate enforcement
of maternity rights for
women working in
informal and private
sector.
Procurement of Supplies:o Flipcharts,
Counseling cards, leaflets for SBCC
on MIYCF including nutrition related
WASH, ECD and Health key family
practices to all health services
providers and community health
workers o job aids, guidelines,
training packages to all health
services providers and community
health workers Reporting tools
(registers and forms)
Improved quality of MIYCN services at
the health facilities level by June 2021
Inadequate access,
availability and utilization
of health care services.
Strengthened synergies between MYICN
and health, WASH, Food Security, Social
Protection, Education and IMAM
Interventions that
improve vitamin
and mineral
intake
Low awareness of the
micronutrient problems at
all levels
Prevention of Anemia 18 7 40 improving physical work capacity,
Low adherence to Iron and
folic acid supplements
among women
Training of health staff on Anemia
Prevention among women, adolescent
and children (at regional and district
level)
reducing disease burden and mortality
High levels of anemia in
women of reproductive
age
Procurement of Supplies:

153
Location/Type Challenges Intervention Required Cost Implication (Tshs. Bill) Expected Results
Govt. Private DPs
inadequate supplies for
prevention of anemia
Iron Folic acid, Micronutrient
Powders, Multiple Micronutrient
tablets
Job aides (posters/charts etc.),
guidelines, training packages
Reporting tools (registers and forms)
1/3 of children underfive
are vitamin A deficiency
Vitamin A Supplementation and
Deworming through Child Health
Days and routine
Vitamin A deficiency eliminated as a
problem of public health significance
Orientation on Planning and
Management of Child Health Days
(at regional and district level)
Training of RHMT/CHMT’s on
social mobilisation tool kit on VASD
(at regional and district level)
Organise social mobilization activities
for two rounds of VASD (at district
level)
Procurement of Supplies:
Vitamin A capsules and deworming
tablets
Job aides (posters/charts etc.),
guidelines, training packages
Reporting tools (registers and forms)
low coverage of USI Promotion of Universal Salt
Iodization
Iodine deficiency disorders as problem of
public health significance eliminated
Low awareness of the
problem of iodine
deficiency disorders at all
levels;
Training of Nutrition Officers, health
inspectors and salt traders on quality
control of iodized salt
improved cognitive development

154
Location/Type Challenges Intervention Required Cost Implication (Tshs. Bill) Expected Results
Govt. Private DPs
Promotion of iodized salt through
community radios
Procurement of Supplies:
inadequate supplies for
prevention IDD
Iodized salt test kits
Job aides (posters/charts etc.),
guidelines, training packages
Reporting tools (registers and forms)
Provision of guidelines and strategies
for use of micronutrient powder and
fortification (of salt, flour, edible oil)
and food-based strategies (vegetable
gardens).
Interventions that
lead to proper
management of
acute
malnutrition
(IMAM)
limited personnel who can
manage acute
malnourished children
Conduct TOT’s on treatment of
severe acute malnutrition (at regional
level)
20 46 Improved quality of services for
management of severe acute malnutrition
in at least 75% of health facilities by 2021
Training of Health service providers
(Nurses, Clinicians) on
limited screening and
treatment of acute
malnutrition
treatment of severe acute malnutrition
(at district level)
At least 75% of children under five years
old are reached through SAM screening at
community level by 2021
Training of community health
workers on screening and referral
severe acute malnourished children
(at district level)
Training on use of anthropometric
equipment for regular nutrition
assessment in facilities without SAM
services (at district level)
Functional Management Information
System for severe acute malnutrition is
available in at least 80% of districts by
June 2021

155
Location/Type Challenges Intervention Required Cost Implication (Tshs. Bill) Expected Results
Govt. Private DPs
inadequate coordination
and integration of
management of acute
malnutrition
Organize quarterly meeting among
health service providers and CHWs at
Health Facility level
Strengthened coordination of integrated
management of severe acute malnutrition
at the national and sub national level by
June 2021
inadequate supplies for
management of acute
malnutrition
Procurement of Supplies:
oAnthropometric equipment
(height/length measuring board,
weighing scales, MUAC tapes) to all
health facilities (Hospitals, HC’s and
dispensaries) oTherapeutic nutrition
supplies to facilities managing
children with SAM (Ready to Use
Therapeutic Food (Plumpynut),
Therapeutic Milk (F100, F75)oJob
aides (posters/charts etc.), guidelines,
training packagesoReporting tools
(registers and forms)
·Essential therapeutic nutrition supplies
and equipment are available in at least 90%
of health facilities providing services for
management of severe acute malnutrition
by June 2021
Interventions
promoting
enrichment of
nutrient density
of the diets of
young children
Carry out research in matters relating
enrichment of nutrient density of the
diets of young children 6-–23 months
of age)
0.4 0.4 0.8 Protein Energy Malnutrition in children 5-
59 months reduced to levels below WHO
targets by 2025
Prepare methods for the correction or
avoidance of malnutrition
Collaborate with the producer,
manufacturers and distributors of
articles of food, to ensure proper
nutritional value of the food marketed
in the United Republic or exported to
foreign countries

156
Location/Type Challenges Intervention Required Cost Implication (Tshs. Bill) Expected Results
Govt. Private DPs
programmes that
improve public
health, water, and
sanitation
poor availability and
quality of basic social
services essential for
nutrition improvement,
including health, water
and sanitation;
Advocate through media on; 2 2 7
inadequate household food
and nutrition security
especially in rural areas;
Immunization
inappropriate socio-
cultural behaviours and
practices that negatively
impact nutrition;
Family planning
high prevalence of
communicable and non-
communicable diseases
that impair growth.
management of malaria
Management of nutrition
in emergencies
management of diarrhea and
pneumonia;
De-worming;
access to safe drinking water;
Promotion of good hygiene and
access to sanitation facilities and
practices eg. elimination of open
defecation and hand-washing with
soap;
- nutrition care for people living with
HIV/AIDS and TB;
management of non-communicable
diseases, particularly obesity-related

157
Location/Type Challenges Intervention Required Cost Implication (Tshs. Bill) Expected Results
Govt. Private DPs
illnesses.
Programmes that
address issues of
nutrition
governance and
accountability:
i) Planning and Advocacy 13.2 5 40
Weak institutional
capacity for nutrition
leadership and programme
delivery
Hold annual planning and budgeting
sessions to ensure integration of
nutrition interventions into MTEF
Hold meeting with sectoral Nutrition
focal persons and NGOs/CBOs to
develop a consolidate Annual Work
plan on nutrition for the district
Lack of a well-defined
nutrition accountability
framework;
Conduct nutrition advocacy meetings
with RHMTs, DHMTs, DEDs,
District Treasurers, DPLOs, and
DMOs (Regional level) to increase
resource allocation on nutrition
Lack of Nutrition
Management Information
System (NMIS)
ii) Monitoring and evaluation 45 134
Conduct national nutrition Survey
after every two years
Support quarterly supervision of
nutrition activities (district and
regional level)
Support workshop on monitoring of
District AWP on nutrition every 6
months
Poor functioning of multi- iii)Coordination and partnership 23 67

158
Location/Type Challenges Intervention Required Cost Implication (Tshs. Bill) Expected Results
Govt. Private DPs
sectoral coordination
mechanisms at all levels;
Conduct annually Joint multisectoral
Nutrition review meetings
Support establishment of Regional
and District Nutrition Steering
Committees
Orientation of Regional and District
Nutrition Steering Committees
members
Conduct biannual monitoring visits
Low prioritization of
nutrition actions in the
allocation of financial and
human resources at all
levels;
iv) Policy and strategy development 18.7 56
Print and disseminate Food and
Nutrition Policy
Print and disseminate Multisectoral
Nutrition action plan
Cascade MNAP to subnational levels
Develop Resource mobilization
strategy for MNAP
Establish a nutrition tracking system
to cover all LGAs
Conduct nutrition PER after every
two years

159
Table AII 14: Poverty Reduction and Social protection Interventions
Location/Type Challenges Intervention required Govt. Private DPs Expected Results
Social Protection Strategic choices
WDF/YDF/TWB Low women/youth
participation in economic
activities
Enhance low cost credit to
women/youth
Reduction of gender income inequality and
enhancement of national social protection and
safety net by June 2021
NHIF/CHF Low coverage of health
insurance of the population
Expand coverage of health insurance of
the population
Increased coverage of health insurance of the
population
Programme on
implementation of
universal social
pension scheme to
eligible elders
Universal social pension
scheme not implemented in
the country
Implement universal social pension
scheme to eligible elders
Increased number of eligible elders receiving
universal social pension
Women and Girls'
Empowerment
Programme
Low women participation in
economic activities
Women Economic Empowerment 883.21 883.21 Reduction of gender income parity and
enhancement of national social protection and
safety net by June 2021
High rate child marriages
Increasing rate of early
pregnancies
End Child Marriage and Early
Pregnancies
3.690 3.690 Reduction of gender income parity in education and
employment by June 2021
NSPF Fragmented SP
interventions
Cabinet decision on NSPF Reduction of number of poor households.
Poverty Reduction Strategic choices
Develop and
implementation of
Local Economic
Development
(LED) initiatives
Low pace of poverty
reduction
Institutionalize LED approach in LGAs 2.5 Reduction of Headcount ratio for food and basic
needs poverty
SDGs Inadequate implementation
of MDGs
SDGs localization 2.5 1 SDGs fully integrated in national and sector plans
M&E Lack of National M&E
framework.
Develop M&E framework to track the
implementation of poverty reduction
initiatives including SDGs
1.5 M&E activities institutionalized across government.

160
Table AII 15: Good Governance Interventions
Location/Type Challenges Intervention Required Cost Implication (Tshs. Bill) Expected Results
Govt. Private DPs
Good Governance Strategic Choices
Prevention and
Combating
Corruption
There is a shortage of
staff houses in regions
Absence of modern
special building for
investigation
lack of office building for
African Corruption Unity
Advisory Board
Office buildings in
regions are in bad
condition
Construction of Tanzania Institute of
Good Governance and Anti-
Corruption
Construction of infrastructures
Construction of Special building for
Investigation at Headquarters
An advisory board of the corruption of
African Unity
Rehabilitation of Office Buildings in
Regions
250.35 Investigation building in place
Availability of offices in regions
Availability of staff houses in regions and 2
districts
Availability of training college for good
governance and corruption
Advisory Board for the Corruption of African
Unity building in place
Availability of office buildings in regions
Fire and Rescue
Force
There is no buildings
in new planned HQ
There are shortage of
fire tenders in regions
Fire and rescue
training institute is in
bad condition
Office buildings in
regions are in bad
condition
Completion of Fire and Rescue Head
Quarter – Five Storey Building located
at TAZARA - Mchicha in DSM
Acquisition of 140 Tenders
Rehabilitation and Extension of the
Fire and Rescue Training Institute at
Chongo, Handen
Rehabilitation and Extension of 25
Fire Stations countrywide
169.22
Availability of office buildings in regions
Availability of new building at new located HQ
Availability of sufficient tenders in regions
Availability of rehabilitated building at training
institute
Availability of office buildings in regions

161
Location/Type Challenges Intervention Required Cost Implication (Tshs. Bill) Expected Results
Govt. Private DPs
Tanzania Prisons
Services
The Government spends
huge amount of money
to buy shoes for prisons
and staff
Buying uniforms for
prisons is very expensive
Unutilized irrigation
infrastructure
Building Brigade have no
working tools
Unprocessed agricultural
products leading to low
pricing in the market
Absence of working tools
and offices complicates
the process of quarrying
There are opportunity of
using homemade
furniture but not
captured
Renovation of Shoe Production
Workshop
Acquisition of Machines for Uniform
and Cloth Production Factory
Acquisition of Machines and Farm
Implements for Irrigation Agriculture
Equipping Building Brigade
Construction of a Building and
Installing Machines for Commercial
Agriculture (Oil crops)
Construction of Office and Installing
Machines for Quarry Production
Construction of Workshop for
Furniture Production
14.58
Tanzania Prisons to use self-manufactured
shoes
Tanzania Prisons to use self-manufactured
uniforms
Full utilization of irrigation infrastructure
for agriculture
Full equipped Building Brigade
Ability to add value in agricultural products
Availability of office and installed machine
for quarry production
Availability of furniture workshop
National
Identification
Tanzanian have no national
identification cards
Issue ID cards to all people aged 18 and
above 359.56 70.81
All eligible citizens issued with IDs by June
2021
Immigration
Lack of friendly
environment for
maintaining law of order
Unconducive working
environment for living
Various areas not
connected with ICT
infrastructure
Maintaining Law of Order for Public
Safety and Security
Improving Working and Living
Environment
Strengthening MIS, IEC and ICT 483.15
Improved working environment for
maintaining law of order
9 offices and staff buildings constructed and
rehabilitated
Number of regions lined with ICT network

162
Location/Type Challenges Intervention Required Cost Implication (Tshs. Bill) Expected Results
Govt. Private DPs
Tanzania Police
Force
Increasing need of
training but limited
with capacity of the
college
Long time for testing
crime offence for
investigation
Office building and
residential houses in
bad condition
There are shortages
of staff houses in
most areas
No sufficient
equipment for patrol
Increasing need of
airplanes and
helicopter
There are shortages
of ICT equipment
Most vehicles are not
in good condition
There is rapid change
of technology
Increase of marine
crimes
Extension of Professional Police
Colleges
Construction of Zonal Laboratories
for Crime Offense Investigation
Construction of Police Posts
Construction of Regional Police
Commanders’ Offices
Surveys for Police Force areas
Construction of Staff Residential
Houses
Acquisition of Patrol Equipment
Acquisition of Airplanes and
Helicopters
Acquisition of ICT Equipment
Acquisition of Motor Vehicles Spare
parts
Construction of Health Centres
Rehabilitation of Police Centres,
Regional Commanders Offices and
Staff Residential Houses
Human Resource Development
Acquisition of Patrols’ Boats
1,922.
03
Increased capacity of enrolment at the
college
Speeded sample tests for crime offences
Availability of Police services at near posts
Availability of Regional Commanders’
offices in all regions
Shortages of staff houses reduced
Availability of patrol equipment
Availability of airplanes and helicopters
Availability of ICT equipment
Availability of health services in all areas
Equipped staff to match the growing
technology
Availability of marine working equipment

163
Table AII 16: Infrastructure Development Interventions
Location/Type Challenges Intervention Required Cost Implication (Tshs.Bill) Expected Results
Govt. Private DPs
Roads Strategic Choices
Construction of Dar
es Salaam – Isaka –
Rusumo-Tabora
(1,341Kms), central
railway system to
Standard Gauge
Way leave for the new
line from Isaka – Rusumo
Project financing
Preparation of Cabinet Paper on
financing mode of Project
Negotiation with Investors on financing
andimplementation of the project.
Fast track procurement process for
acquisition of contractors
Begin construction
8,900.05 High speed – SGR for smooth passenger and
cargo transportation between Dar – Isaka
Construction
of1,220 Kms of
Railway line
fromTabora-
Kigoma, Isaka-
Mwanza, Uvinza-
Musongati, and
Kaliua-Mpanda-
Karema.
Way leave for the new line
from Uvinza - Musongati.
Project financing
Spearhead obtaining of project Feasibility
study and detailed design.
Preparation of Cabinet Paper on financing
mode of Project
Negotiation with Investors on financing
andimplementation of the project.
Fast track procurement process for
acquisition of contractors
Begin construction
8,115.70 1,220 kms of railway construction from Dar –
Kigoma; – Isaka – Mwanza ;– Uvinza –
Musongati; and Kaliua – Mpanda – Karema
Construction of
railway line from
Mtwara-
Mbambabay
(Ameliabay)
withbranches
toLiganga and
Mchuchuma 1,000
kms (std gauge)
Project financing Spearhead obtaining of project Feasibility
study and detailed design.
Preparation of Cabinet Paper on financing
mode of Project
Negotiation with Investors on financing
andimplementation of the project.
Fast track procurement process for
acquisition of contractors
6,607.55 1,000 kms of railway construction from port
of Mtwara with the coal and iron fields of
Mchuchuma and Liganga
Construction of
Tanga-Arusha-
Musoma rail
withbranches to
Minjingu and
Project financing Spearhead obtaining of project Feasibility
study and detailed design.
Preparation of Cabinet Paper on financing
mode of Project
Negotiation with Investors on financing
7,312.85 Increase in efficiency of Tanga Port.
Facilitate Uganda’s import and export trade
with Tanzania.
Facilitate transportation of soda ash and
fertilizer to the market, from Engaruka and

164
Location/Type Challenges Intervention Required Cost Implication (Tshs.Bill) Expected Results
Govt. Private DPs
Engaruka andimplementation of the project.
Fast track procurement process for
acquisition of contractors
Minjingu respectively.
procurement of 63
high horsepower
locomotives
Funding source for this
procurement is not in place. Fast track obtaining of funds for
procurement of locomotive and wagons
Allow private operators to put their
wagons and pay user fee to RAHCO for
the use of railway.
0.459 63 high horsepower locomotives procured by
2020 for transport between Dar es salaam and
Kigoma
Procurement of
2,234 goods wagons
funding source for this
procurement has not yet
been found
Fast track obtaining of funds for
procurement of locomotive and wagons
0.381 2,234 goods wagon procured by 2020
Allow private operators to put their
wagons and pay user fee to RAHCO for
the use of railway.
Increased number of freight serviced by TRL
between DSM and Kigoma to 3 million tons
per year.
Construction of Dar
es salaam - Chalinze
- Morogoro Express
way, 200 km
Project financing Expedite completion of feasibility study 1,155.8
1
Decongestion of the Dar es Salaam City.
Construction of
Arusha - Moshi -
Himo Junction Dual
Carriageway,
105km
Project financing Expedite soliciting of funds 808.4 Enhance traffic movement along Arusha –
Moshi – Holili areas.
Upgrading Kidahwe
(Kigoma) - Ilunde -
Malagarasi – Kaliua,
188km
Project financing Expedite soliciting of funds 334.05 Boost economic activities
Upgrading of Itoni –
Mkiu – Ludewa –
Manda to Bitumen
Standard (211.42)
Km
Project financing Expedite soliciting of funds 378.59 Boost economic activities

165
Location/Type Challenges Intervention Required Cost Implication (Tshs.Bill) Expected Results
Govt. Private DPs
Upgrading to
Bitumen standard
for the Manyoni-
Itigi-Tabora Road,
245 km
Project financing Expedite soliciting of funds 126.94 Boost economic activities
Tabora – Ipole -
Koga- Mpanda , km
350
Project financing
Land compensation
Expedite valuation of land and
properties section of Mpanda – Koga –
Ipole
Ministry of Works should set aside
fund for compensation in FY 2016/17
2,941 Boost economic activities
Sumbawanga –
Mpanda –
Nyakanazi, 346.6km
Project financing Ministry of Works should set aside fund
for construction
400
Masasi – Songea –
Mbamba bay,
898km.
Project financing Expedite financial negotiation with
prospective financiers i.e AfDB
167 466 Boost economic activities
Upgrading to
Bitumen Standard
for the Chunya-
Makongolosi-
Rungwa-Itigi-
Mkiwa road 456km
Project financing 1,053.37 Boost economic activities
Bagamoyo –
(Makurunge) –
Saadan – Tanga
Road, km 178
Project financing Completion of feasibility study and detail
design
178 178 km constructed
Arusha &
Kilimanjaro Compensation Poor
coordination among key
stakeholders
Expedite the design review which is
conducted by JICA.
Enhance good coordination with
stakeholders involved in the project (
Tanroads, EAC, AfDB etc)
To clarify issue of legal and regulatory
justification of compensation
139.3 Enhance traffic movement along Arusha –
Holili road.

166
Location/Type Challenges Intervention Required Cost Implication (Tshs.Bill) Expected Results
Govt. Private DPs
Country wide Use of World Bank law
on compensation rise
contradiction with ours.
Dissemination of project
outputs national wide
Dissemination of the ‘‘Operational
Guideline for District and rural road
management’’
Modal of improvement and technical
transfer conducted in Iringa and
Dodoma regions should be
disseminated country – wide.
9.131 Rural roads maintenance system development
enhanced.
Construction of
Interchange at
Ubungo Dar es
Salaam
Compensation for land
and properties
Failure to agree on
dividing the contract and
managing project risks
Expedite soliciting of funds for
feasibility study and detail design and
compensation
222.7 Decongestion of the Dar es Salaam City.
Construction of Fly-
over at Tazara Dar
es Salaam
Compensation for land and
properties
Begin construction 66.587 Decongestion of the Dar es Salaam City.
Construction of Fly-
over at Uhasibu Dar
es Salaam
Compensation for land and
properties
Expedite soliciting of funds for
feasibility study and detail design and
compensation
50.587 Decongestion of the Dar es Salaam City.
Construction of Fly-
over at
Chang’ombe, Dar es
Salaam
Compensation for land and
properties
Expedite soliciting of funds for
feasibility study and detail design and
compensation
50.587 Decongestion of the Dar es Salaam City.
Gerezani road
widening
Compensation for land and
properties
GoT should set aside funds for
compensation in FY 2016/17
22.938 Decongestion of the Dar es Salaam City.
New Bagamoyo
road 2 - Mwenge –
Morocco section.
Delay in project financing
approval from government
of Japan
0.891 Decongestion of the Dar es Salaam City.
Construction
Selander bridge
Obtain financing from Korea
Do Feasibility and detail design studies
Start construction
Decongestion of the Dar es Salaam City.

167
Location/Type Challenges Intervention Required Cost Implication (Tshs.Bill) Expected Results
Govt. Private DPs
Dar es Salaam Outer
Ring Road Namely:
Bunju-Mbezi
(Morogoro Road) –
Pugu (34 km).
Project financing Start Construction 794.371 Decongestion of the Dar es Salaam City.
Road sector support
program
Bottlenecks on the major
international corridors and
too much reliance on road
transport mode
MOW/TANROADS to accelerate the
project process considering due to date of
disbursement implementation
134.511 Enhance transport network
Dar es salaam traffic congestion eased by
2020
Rural roads good- fair condition increased
by 2020
Road sector support
program II
Bottlenecks on the major
international corridors and
too much reliance on road
transport mode
MOW/TANROAD to accelerate the
project process considering due to date of
disbursement implementation and
develop an action plan for that purpose
144.532 Enhance transport network
Dar es salaam traffic congestion eased by
2020
Rural roads good- fair condition increased
by 2020
Ports Strategic Choices
Dredging and
expansion ofthe
entry to Dar es
Salaam Port, Dar es
Salaam
The project aimed at
Increasing efficiency and
throughput of Dar es Salaam
Port. The objective of this
project is to increase water
depth for berths number 1 –
7 from the current depth of
less than 10 meters to at
least 12.
Expedite procurement of contractor 1,113.50 Throughput and efficiency of the port
increased.
Container Terminal
- Berths 13 – 14 Dar
es Salaam
The objective is to develop
a modern terminal with two
berths (13 & 14) to match
the increase traffic. The
terminal will include the
quay of minimum 750
meters length; minimum 13
meters channel depth and
dredging of the port
entrance.
Expedite procurement of contractor 890.8 Throughput and efficiency of the port
increased.
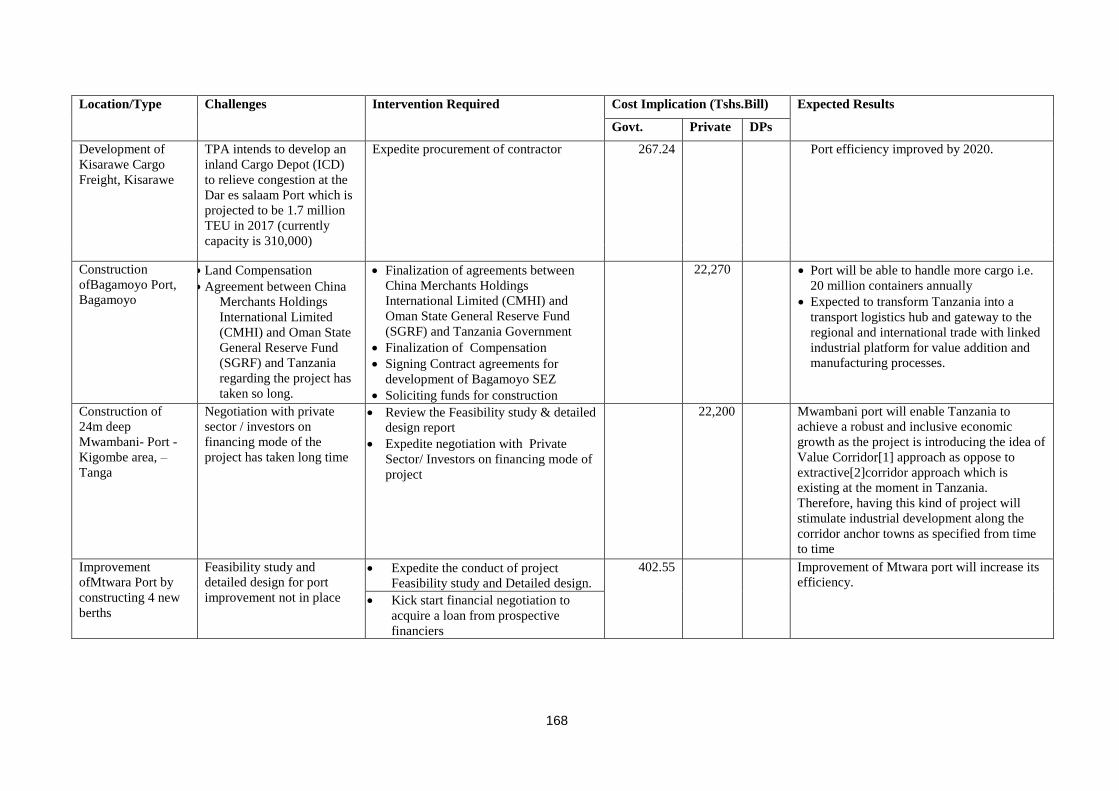
168
Location/Type Challenges Intervention Required Cost Implication (Tshs.Bill) Expected Results
Govt. Private DPs
Development of
Kisarawe Cargo
Freight, Kisarawe
TPA intends to develop an
inland Cargo Depot (ICD)
to relieve congestion at the
Dar es salaam Port which is
projected to be 1.7 million
TEU in 2017 (currently
capacity is 310,000)
Expedite procurement of contractor 267.24 Port efficiency improved by 2020.
Construction
ofBagamoyo Port,
Bagamoyo
Land Compensation
Agreement between China
Merchants Holdings
International Limited
(CMHI) and Oman State
General Reserve Fund
(SGRF) and Tanzania
regarding the project has
taken so long.
Finalization of agreements between
China Merchants Holdings
International Limited (CMHI) and
Oman State General Reserve Fund
(SGRF) and Tanzania Government
Finalization of Compensation
Signing Contract agreements for
development of Bagamoyo SEZ
Soliciting funds for construction
22,270 Port will be able to handle more cargo i.e.
20 million containers annually
Expected to transform Tanzania into a
transport logistics hub and gateway to the
regional and international trade with linked
industrial platform for value addition and
manufacturing processes.
Construction of
24m deep
Mwambani- Port -
Kigombe area, –
Tanga
Negotiation with private
sector / investors on
financing mode of the
project has taken long time
Review the Feasibility study & detailed
design report
Expedite negotiation with Private
Sector/ Investors on financing mode of
project
22,200 Mwambani port will enable Tanzania to
achieve a robust and inclusive economic
growth as the project is introducing the idea of
Value Corridor[1] approach as oppose to
extractive[2]corridor approach which is
existing at the moment in Tanzania.
Therefore, having this kind of project will
stimulate industrial development along the
corridor anchor towns as specified from time
to time
Improvement
ofMtwara Port by
constructing 4 new
berths
Feasibility study and
detailed design for port
improvement not in place
Expedite the conduct of project
Feasibility study and Detailed design.
402.55 Improvement of Mtwara port will increase its
efficiency.
Kick start financial negotiation to
acquire a loan from prospective
financiers

169
Location/Type Challenges Intervention Required Cost Implication (Tshs.Bill) Expected Results
Govt. Private DPs
Modernization of
Kigoma Port Feasibility study and
detailed design for port
improvement not in
place
Expedite the conduct of project
Feasibility study and detailed design.
Kick start financial negotiation to
acquire a loan from prospective
financiers
201.5 Modernisation of Kigoma port will increase
its operational efficiency particular serving
DRC freight through lake Tanganyika and
Central railway.
construction and
rehabilitation of
Mwanza South Port,
Mwanza region
Feasibility study and
detailed design for port
improvement not in
place
Expedite the conduct of project
Feasibility study and detailed design.
Kick start financial negotiation to
acquire a loan from prospective
financiers
201.5 Modernization of Mwanza port will increase
its operational efficiency
Air Transport Strategic Interventions
Revamping
Operations of Air
Tanzania.
Regulation of aviation
sector
Ground handling service
Reform ATCL
Purchase new aircrafts
485 Smooth operations of ATCL as a national
carrier will have a direct impact on tourism
industry which currently is among large
contributors of government revenue.
Poor infrastructure Rehabilitation and extension of
Aerodromes(Annex)
1,829 Air craft accidents reduced by June 2020
Four aviation radar procured by June 2020
Improvement of
Metrology
forecastServices
Project financing
No office premises
Outdated radar
Construction of Central forecasting
office.
Acquisition of 5 weather radar.
54.21 New central forecasting office by June 2020
Five weather radar procured by June 2020
Maritime Transport Strategic Choices
Procurement of 7
new lake vessels
and rehabilitation
of 8 existing
vessels for lake
Victoria,
Tanganyika and
Nyasa
Dilapidation of lake
vessels
Shortage of passenger and
cargo vessels
Procurement of 3 ship and
rehabilitation of 3 for Lake Victoria,
Procurement of 2 ship and
rehabilitation of 3 for Tanganyika
Procurement of 2 ship and
rehabilitation of 2 for Nyasa
121.5 Seven (7) new passenger and cargo vessels
procured by 2020.
Eight (8) passenger and cargo vessels
rehabilitated by June 2020.
Energy generation Strategic Choices

170
Location/Type Challenges Intervention Required Cost Implication (Tshs.Bill) Expected Results
Govt. Private DPs
Kinyerezi I
Extension –
185MW gas-fired
plant
Project financing Expedite negotiation with respective
project financiers including the GoTZ
TANESCO should expedite extension
of contract with Ms. Jacobsen Electro
Ltd (contractor) who executed
Kinyerezi I 150 MW.
410 185 MW added to National Grid by June
2018.
Kinyerezi II – 240
MW combined
cycle gas-fired
plant (project
financed by the
GoTZ and
Japanese Bank for
International
Cooperation –
JBIC)
Availability of enough
water for combined cycle
operations
Water project financing
TANESCO to undertake water supply
study for operation of Kinyerezi II, III
and IV.
TANESCO to fast track
implementation of water supply project
110 638.0
9
240 MW added to the National Grid by June
2019.
Kinyerezi III –
600MW combined
cycle gas-fired
plant, to be
implemented as
PPP project in two
phases (phase I -
300MW)
Project financing Treasury Registrar to approval Joint
Venture Agreement
TANESCO to expedite negotiations of
PPA with Partners
Expedite Project Implementation
Agreement.
832.898 300 MW added to National Grid by June 2020
Kinyerezi IV –
330MW combined
cycle gas-fired
plant, to be
implemented as
PPP project
Project financing Treasury Registrar to approve Joint
Venture
Agreement and shareholding
agreement
Fast track feasibility study to be
approved by Minister for Finance and
Planning.
890.8 330 MW added to National Grid by 2020.
Singida Geowind
Phase I – MW 50
wind plant, Singida
Project financing
NDC failed to secure loan
Implement the project as PPP. 302.872 50 MW added to National Grid by June 2018.

171
Location/Type Challenges Intervention Required Cost Implication (Tshs.Bill) Expected Results
Govt. Private DPs
Kilwa Energy
Phase 1 – 210 MW
gas-fired plant,
Somanga Fungu -
Kilwa
Project financing Government guarantee is needed to
allow sourcing of funds from
prospective banks i.e. DBSA
Conclude Project Implementation
Agreement
Conclude Gas Supply Agreement
584 210MW added to national grid by 2018.
Malagarasi
44.7MW
hydropower plant –
Malagarasi river
Kigoma
Project financing Preparation of tender document
Soliciting funds
355.18 44.7 MW added to the national grid and
Kigoma region connected to the grid by 2020
Kakono 87MW
hydropower plant –
Kagera river
Project financing Preparation of tender document
Soliciting funds
823.45 87MW added to the national grid by 2020
200MW coal fired
power plant –
Kiwira Mbeya
Project financing STAMICO to undertake the feasibility
study
5 450 200MW added to the national grid by 2020
Ngaka 400MW
coal fired power
plant – Ngaka
Ruvuma
Project financing Undertake feasibility study for 200MW
phase I and 220kV transmission from
Ngaka to Songea
NDC and TANCOAL to mobilize
funds
Negotiation for PPA wit TENESCO
450 400MW added to the national grid by 2020
Mchuchuma
600MW coal fired
power plant –
Njombe
Project financing Fund mobilization
Negotiation for PPA with TENESCO
1,200 600MW added to the national grid by 2020
Construction of
Rusumo 80MW
hydropower plant
to be equally
shared by
Tanzania, Burundi
and Rwanda.
Compensation of Project
Affected Peoples Financing secured from World Bank for
power plant construction
Financing secured from AfDB for
construction of transmission line from
Rusumo to Nyakanazi substation
236.867 27MW added to the National Grid and power
trade between three countries Tanzania,
Rwanda and Burundi attained by June 2020.

172
Location/Type Challenges Intervention Required Cost Implication (Tshs.Bill) Expected Results
Govt. Private DPs
Development of
Geothermal and
Ngozi 200MW
Geothermal plant,
Ngozi -Mbeya
Project financing Government to finance the deep wells
drilling phase to establish steam
reservoir properties (USD 21 million).
Expedite PPP process to acquire
private partner.
45.99 495.5
2
200MW to be attained by 2020
Energy distribution strategic choices
Rural
electrification
projects under
REA (completion
of Turnkey PhaseII
and
commencement of
III)
Project financing Ring fencing petroleum levy
Increase electricity charge/levy from
3% to 5% as required by law
1,191.79 Electricity connection level in urban and rural
increased at least 50% and access increased at
least 75%.
Energy transmission strategic choices
Dar – Tanga -
Arusha 400kV, km
682
Project financing
compensation of way
leave
Expedite financial negotiations with
Exim Bank of china.
Expedite payment of compensation for
Project Affected Peoples in order to
acquire way leave
Expedite procurement of consultant
1,143.31 Evacuation of power from Dar to Tanga and
Arusharegions by June 2020. The project will
enhance availability of reliable power in the
regions.
Singida – Arusha-
Namanga 400kV,
km 414
Compensation of way leave valuation and compensation should be
fast-tracked
380.817 Evacuation of power from Singida to
Namanga via Arusha also the project will
enhance availability of reliable power in the
regions and enhance regional power trading.
Somangafungu -
Kinyerezi 400kV,
km 203
Project financing fast track financing negotiation with
Tanzania Investment Bank (TIB)
Upgrade feasibility study from 220kV
to 400kV
182.61 The project will enable evacuation of power
produced by Kilwa Energy (an independent
power producer) and future gas-to-power
generation to reach national grid at Kinyerezi
Complex.
Makambako –
Songea 220kV, km
250
Untimely release of funds
issued by Sida and
counterpart funds
Expedite timely release of funds. 34.23 The project is expected to connect the
Ruvuma Region to the national grid by June
2017.

173
Location/Type Challenges Intervention Required Cost Implication (Tshs.Bill) Expected Results
Govt. Private DPs
North West Grid
400Kv –Mbeya –
Sumbawanga –
Nyakanazi –
Kigoma, km 1,148
Project financing Upgrade feasibility study from 220kV
to 400kV
Expedite project financial negotiations.
1,264.89 The project will enable the regions of Katavi,
Rukwa and Kigoma to have reliable power
supply which is very crucial input for
industrial development.
Chalinze - Dodoma
400kV, km 350
Project financing Fast track feasibility study
Expedite financial negotiations.
Payment of compensation
297.97 The project is expected to evacuate power
from Kinyerezi power plants to load centres
hence provide reliable power supply in the
regions of Morogoro and Dodoma.
Bulyanhulu – Geita
– Nyakanazi
220kV, km 199
Project financing Expedite compensation of project
affected people.
146.98 Evacuation of power from Bulyanhulu – Geita
– Nyakanazi and Rural Electrification for 15
villages in Geita District
Construction of
domestic gas
supply
Infrastructure in
Dar es salaam.
Project financing
Compensation for the
way leave
Expedite financial negotiations. 224.93 Increase household use of gas for domestic
purposes and hence reduce consumption of
biomass and protect environment.
Construction of
domestic gas
supply
Infrastructure in
Mtwara
Project financing
Compensation for the
way leave
Expedite financial negotiations. 13.139 Increase household use of gas for domestic
purposes and hence reduce consumption of
biomass and protect environment.
Construction of
domestic gas
supply
Infrastructure in
Bagamoyo
Project financing
Compensation for the
way leave
Expedite financial negotiations. 24.5 Increase household use of gas for domestic
purposes and hence reduce consumption of
biomass and protect environment.
Construction of
domestic gas
supply
Infrastructure in
Lindi
Project financing
Compensation for the
way leave
Expedite financial negotiations. 6.24 Increase household use of gas for domestic
purposes and hence reduce consumption of
biomass and protect environment.

174
Location/Type Challenges Intervention Required Cost Implication (Tshs.Bill) Expected Results
Govt. Private DPs
Establishment of
ICT
equipment,manufac
turing, E – waste
recycling and
Software
development
Centers
Skilled personnel on ICT
sector
Project financing
Proper proposal for
establishing the project
Sector is required to develop a solid
project proposal for the said
interventions.
Establish a computer and /or radio
manufacturing/ assembling plants;
recycling centers for ICT and electronic
hardware;
establishing ICT incubators and ICT
ICT Park, EPZA –
Bagamaoyo
Land compensation (already paid)
Land survey and topographical survey
and geotechnical investigation (75%
paid)
Preparation of master plan
Preparation of detailed engineering
drawings and BOQ for basic
infrastructure
Construction of basic infrastructure
through PPP
3.509 Promotion of high quality jobs in the country.
The National ICT
Broadband
Backbone (Phase
III – Sub – phase
II), Dodoma
Backbone Network Expansion
Regional Transmission Network
IDC in Dodoma
688.366 5. The capacity of ICT backbone networkfurther
expanded to cover more services,
enhance its contribution to information
industry and telecom infrastructure and
make Tanzania a telecom HUB in South
east Africa by June 2020
Postal
Communications:
National
Addressing System
in 92 districts
157.877 The capacity of ICT backbone networkfurther
expanded to cover more services,
6.enhance its contribution to information
industry and telecom infrastructure and
make Tanzania a telecom HUB in South
east Africa by June 2020

175
Location/Type Challenges Intervention Required Cost Implication (Tshs.Bill) Expected Results
Govt. Private DPs
11.5 Deveployment
of Wireless Sensor
Networks for
Industrial
Environmental
Monitoring
There is great emission of
pollutant gases in
manufacturing industries
Currently rudimentary
technologies are
employed to monitor
industrial pollutants.
These technologies are
inaccurate and unsafe to
users
Establish innovate industrial
environmental pollutant gases (CO, O2,
CO2, CO, SO2, H2S, NO, NO2, HC and
PM10(Lead)) monitoring base on
sensor technology
Awareness creation in the use sensor
technology to monitor industrial
processors
Transfer of sensor industrial process
monitoring technology to SMMES
1.5 Increased industrial safety
Reduced environmental pollution
Capacity on sensor industrial monitoring
of pollutants and process established in
Tanzania by 2018
Advanced Cyber
Security Training
Services (TIRDO)
Critical infrastructure
security in Tanzania is
insufficient
Training on cyber security issues to raise
awareness
0.5 Increased security in industry
Media used in banking
transaction for industrial
business is not safe
Lack of awareness of
cyber security threats
To establish security measures in
industrial Tanzania ( major automated
industrial)
Development of Industrial application
software
Increased security in industrial
infrastructure
Increased awareness on cyber security
threats in Tanzania

176
Table AII 17: Doing Business Strategic Choices
Location/Type Challenges Intervention Required Cost Implication (Tshs.Bill) Expected Results
Govt. Private PDs
Easy Doing Business. Strategic Choices
Starting Business Long Time and
procedures to start
business
Establishing one stop centre at TIC
Reduce the registration time and
procedures
Starting business, time and procedures
reduced
Dealing with
Construction
permit
Long and cumbersome
procedures
Reduce time and procedures required
in getting construction permit
Time and procedures for obtaining
construction permit reduced
Getting Electricity Inadequate power
supply
Increase power production through
completion of Kinyerezi I&II Gas
projects; introduction of Coal Power
Plants and renewable energies such
as wind power.
Power Connection and transmission
eg from Kinyerezi to the national
grid; connecting power from Zambia-
Tanzania-Kenya; connecting
electricity from Mchuchuma to
Makambako and North west- power
transmission etc
Elimination of electricity problem in
the country
Registering
Property Long and cumbersome
procedures
Enhance the capabilities of
BRELLA, COSOTA and other
property registering institutions
Property right registration improved
Getting credit Lack of collateral.
High interest charges by
Banks and other lending
institutions
Bank regulations
Expedite activities of MKURABITA
in providing customary right of
occupancy
Expedite procedures of providingtitle
deeds by Ministry of Land
Encourage Banks and other lending
institutions to lend at reasonable
interest rates
More funds for starting and expansion
of businesses available

177
Protecting
Investors Inadequate protection of
investors
Enact law and regulations to protect
investors
More investors ready to invest
Paying Taxes Existence of multiple
taxes
Non transparency in
taxation
Review taxation system
Adherence to the avoidance of
double taxation agreement
Transparency in Taxation system
Trading Across
Borders Existence of various Non
Tariff Barriers
Removal of NTBs through
operationalisation of one border
posts; introduction of single customs
territory; reduction of customs
procedures and documentation
Transit time reduced
Enforcing contract Poor negotiation
capacity
Long period used in
concluding a contract
Increase capacity of negotiators
through training
Reduce time taken for concluding
contract
Contract enforcement process
Enhanced
Resolving
Insolvency Long and cumbersome
procedures
Increase efficiency of the
Commercial Courts
Insolvency disputes reduced

178
ANNEX III: COSTING AND FINANCING ENVELOPE