national forum on economic growth of the big cities in canada montréal, june 9-10-11, 2004
TRANSCRIPT

National Forum on Economic Growth of the Big Cities in Canada
Montréal, June 9-10-11, 2004

• In the context of globalization, a nation’s wealth is mainly created in its big cities.
• To reach their full economic potential, cities must invest massively in their competitiveness and attractiveness and enjoy a fair return on their investments.
• To reinvest in the future, cities must obtain their fair share of the new growth
Context
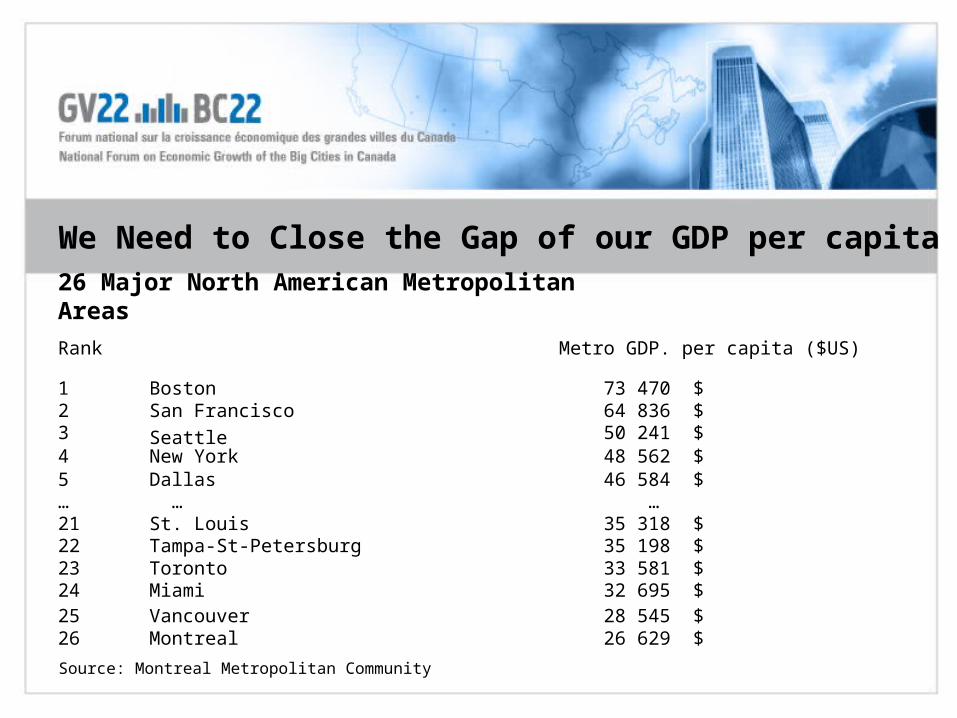
We Need to Close the Gap of our GDP per capita
Source: Montreal Metropolitan Community
26 Major North American Metropolitan Areas
Rank Metro GDP. per capita ($US)
1 Boston 73 470 $ 2 San Francisco 64 836 $ 3 Seattle 50 241 $ 4 New York 48 562 $ 5 Dallas 46 584 $ … … …21 St. Louis 35 318 $ 22 Tampa-St-Petersburg 35 198 $ 23 Toronto 33 581 $ 24 Miami 32 695 $ 25 Vancouver 28 545 $ 26 Montreal 26 629 $
Cities are a major players in closing the gap of our living standard
« It is becoming overwhelmingly apparent that the long term performance of the Canadian economy and
Canadian living standards will hinge on the fortunes of our cities. »
TD Economics, April 2002
The Business Approach : Sharing New Wealth
• Let’s stop asking and let’s start proposing a new partnership with both levels of government.
• Revenue sharing agreements would encourage cities to keep improving the attractiveness of their living environments and thus contribute to stimulating even more growth and wealth.

The Forum

• How can cities become more competitive?(how to create new wealth)
• How can we implement competitive tax policies in cities?(how to share this new wealth)
Two questions
• Establish a new partnership between big cities and higher levels of governments, to :
• accelerate growth and increase citizens’ prosperity
• allow municipalities to better plan their development, by decentralizing and diversifying sources of revenue
Objectives
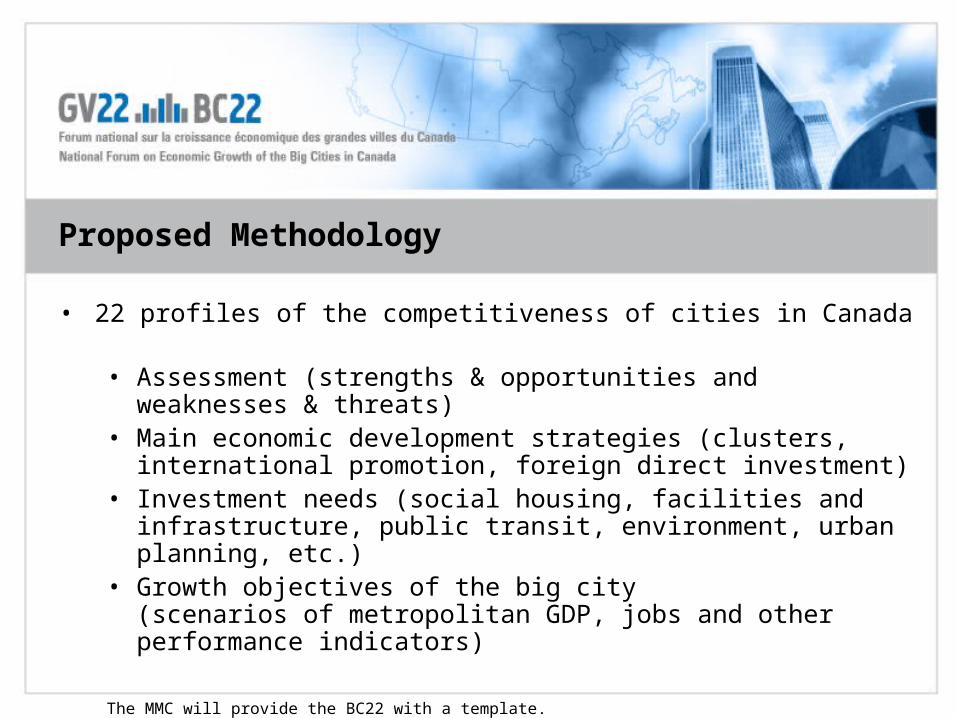
• 22 profiles of the competitiveness of cities in Canada
• Assessment (strengths & opportunities and weaknesses & threats) • Main economic development strategies (clusters, international
promotion, foreign direct investment)• Investment needs (social housing, facilities and infrastructure, public
transit, environment, urban planning, etc.)• Growth objectives of the big city
(scenarios of metropolitan GDP, jobs and other performance indicators)
The MMC will provide the BC22 with a template.
Proposed Methodology

• 22 city profiles
• National Summary on the competitiveness of cities
• Short term and Long term action plan
• BC22 declaration
• A first draft of the deliverables will be discuss at a working session of the BCMC in Edmonton
Deliverables to improve our competitiveness

Wednesday• Launch of the Forum
Thursday• A.M.: Working session to reach a consensus on competitiveness
challenges for Canadian big cities (summary)• P.M.: Working session to reach a consensus on the action plan
Friday • BC22 declaration• Press conference
* To develop a new partnership civil society and government representatives will be invited to the meetings
Proposed Formula *
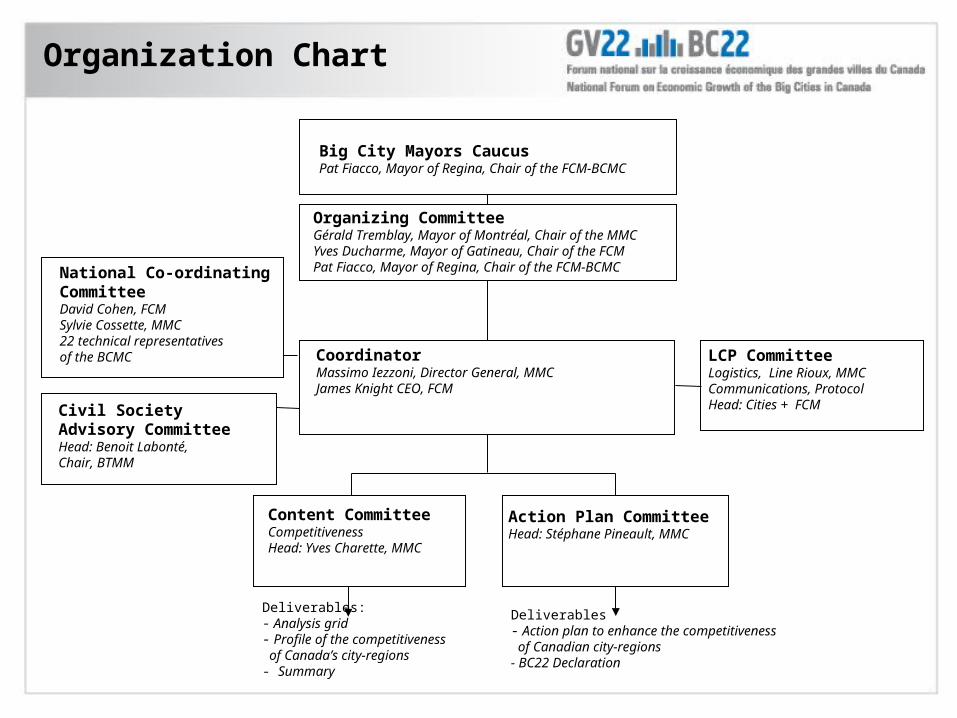
Organization Chart
Organizing CommitteeGérald Tremblay, Mayor of Montréal, Chair of the MMCYves Ducharme, Mayor of Gatineau, Chair of the FCMPat Fiacco, Mayor of Regina, Chair of the FCM-BCMC
LCP CommitteeLogistics, Line Rioux, MMCCommunications, ProtocolHead: Cities + FCM
National Co-ordinatingCommitteeDavid Cohen, FCMSylvie Cossette, MMC22 technical representatives of the BCMC
Content CommitteeCompetitivenessHead: Yves Charette, MMC
Action Plan CommitteeHead: Stéphane Pineault, MMC
Deliverables:- Analysis grid- Profile of the competitiveness of Canada’s city-regions- Summary
Deliverables- Action plan to enhance the competitiveness of Canadian city-regions - BC22 Declaration
CoordinatorMassimo Iezzoni, Director General, MMCJames Knight CEO, FCM
Civil Society Advisory CommitteeHead: Benoit Labonté, Chair, BTMM
Big City Mayors CaucusPat Fiacco, Mayor of Regina, Chair of the FCM-BCMC

FCM-BCMC
12. Vancouver,His Worship Mayor Larry Campbell
13. Surrey,His Worship Mayor Doug W. McCallum
14. Calgary,His Worship Mayor David Bronconnier
15. Edmonton,His Worship Mayor Bill Smith
16. Regina,His Worship Mayor Pat Fiacco
17. Saskatoon, His Worship Mayor Don Atchison 18. Winnipeg, His Worship Mayor Glen Murray 19. Brampton, Her Worship Mayor Susan Fennell 20. Hamilton, His Worship Mayor Larry Di Ianni 21. Kitchener, His Worship Mayor Carl Zehr 22. London,
Her Worship Mayor Anne Marie DeCicco
1. Mississauga, Her Worship Mayor Hazel McCallion
2. Ottawa, His Worship Mayor Bob Chiarelli
3. Windsor, His Worship Mayor Eddie Francis
4. Toronto,His Worship Mayor David Miller
5. Gatineau, Mayor Yves Ducharme 6. Montréal, Mayor Gérald Tremblay 7. Laval, Mayor Gilles Vaillancourt 8. Québec, Mayor Jean-Paul L’Allier 9. Longueuil, Mayor Jacques Olivier 10. Halifax,
His Worship Mayor Peter J. Kelly 11. St. John's,
His Worship Mayor Andy Wells
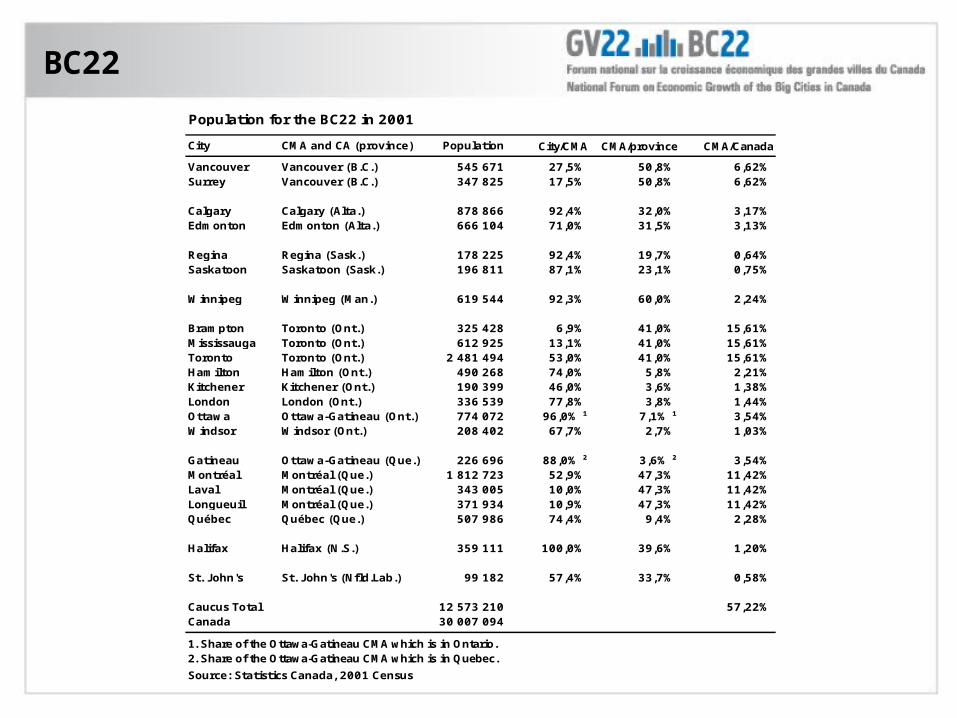
BC22
Population for the BC22 in 2001
City CMA and CA (province) Population City/CMA CMA/province CMA/Canada
Vancouver Vancouver (B.C.) 545 671 27,5% 50,8% 6,62%Surrey Vancouver (B.C.) 347 825 17,5% 50,8% 6,62%
Calgary Calgary (Alta.) 878 866 92,4% 32,0% 3,17%Edmonton Edmonton (Alta.) 666 104 71,0% 31,5% 3,13%
Regina Regina (Sask.) 178 225 92,4% 19,7% 0,64%Saskatoon Saskatoon (Sask.) 196 811 87,1% 23,1% 0,75%
Winnipeg Winnipeg (Man.) 619 544 92,3% 60,0% 2,24%
Brampton Toronto (Ont.) 325 428 6,9% 41,0% 15,61%Mississauga Toronto (Ont.) 612 925 13,1% 41,0% 15,61%Toronto Toronto (Ont.) 2 481 494 53,0% 41,0% 15,61%Hamilton Hamilton (Ont.) 490 268 74,0% 5,8% 2,21%Kitchener Kitchener (Ont.) 190 399 46,0% 3,6% 1,38%London London (Ont.) 336 539 77,8% 3,8% 1,44%Ottawa Ottawa-Gatineau (Ont.) 774 072 96,0% ¹ 7,1% ¹ 3,54%Windsor Windsor (Ont.) 208 402 67,7% 2,7% 1,03%
Gatineau Ottawa-Gatineau (Que.) 226 696 88,0% ² 3,6% ² 3,54%Montréal Montréal (Que.) 1 812 723 52,9% 47,3% 11,42%Laval Montréal (Que.) 343 005 10,0% 47,3% 11,42%Longueuil Montréal (Que.) 371 934 10,9% 47,3% 11,42%Québec Québec (Que.) 507 986 74,4% 9,4% 2,28%
Halifax Halifax (N.S.) 359 111 100,0% 39,6% 1,20%
St. John's St. John's (Nfld.Lab.) 99 182 57,4% 33,7% 0,58%
Caucus Total 12 573 210 57,22%Canada 30 007 094
1. Share of the Ottawa-Gatineau CMA which is in Ontario.2. Share of the Ottawa-Gatineau CMA which is in Quebec.
Source: Statistics Canada, 2001 Census