national institution for transforming india...
TRANSCRIPT

AssamH u m a n D e v e l o p m e n t R e p o R t 2014
Government of AssAm
Managing Diversities, Achieving Human Development
National Institution for Transforming India

Assam HDR 2014
© Copyright 2014
All right reserved. No part of this publication may be reproduced, stored or transmitted in any form or by any means without the prior permission of Government of Assam.
Photo Courtesy:Biju Boro/UNDP IndiaUNICEF (page 29, 67, 74, 79, 182 and 190)GRASSHOPPER (page 48)Raj D Mushahary (page 164)
Designed by:Roots Advertising Services Pvt. Ltd, New Delhi

Managing Diversities, Achieving Human Development
Prepared by OKD Institute of Social Change and Development, GuwahatiInstitute for Human Development, New Delhi
On behalf ofPlanning and Development DepartmentGovernment of Assam
AssamH u m a n D e v e l o p m e n t R e p o R t 2014


Sarbananda Sonowal Chief Minister, AssamGuwahati
Message
Since the publication of the first Human Development Report (HDR) in 1990 by UNDP, discussions and policies on development have undergone a major change globally. The focus of development has shifted from ‘wealth’ and ‘income’ to ‘people’ and their ‘capabilities’. Enhancing people’s capabilities through public policies, thus, tends to occupy a central place in development discussions. The shift has not only brought about a fundamental change in the approach to development, but also generated a broad political consensus about the priorities of development, shaped public policies and improved the matrix for evaluating development outcomes. The HDRs, therefore, are considered not merely as an academic exercise, but more as a document to highlight the issues, lay out the development agenda and guide public policies at relevant levels – local, national and international. The publication of an HDR is, therefore, a significant exercise in itself.
Following the publication of the global HDR, several regional, national and sub- national HDRs have been published. India published its first national HDR in 2001 and Assam had its first HDR in 2003. These reports discuss issues related to key dimensions of human development, that is, health, education and standard of living of people of the country and the state. Since 2003, Assam has seen many changes – political, economic and social – and several interventions have been made in bringing about these changes. It is, therefore, both important and worthwhile to make an objective assessment of the status of human development in the state at this moment to move ahead with a clear focus, priorities and policies. The present report is envisaged to fulfil this objective in general.
The report is titled Managing Diversities, Achieving Human Development. The central message of the report entails the understanding that differences in human development achievements observed across the districts, regions, sectors and communities are conditioned by and contingent on myriad geographic, social and economic diversities of the state. The report, therefore, stresses upon ‘managing’ these diversities in order to enhance the capabilities of people and achieve higher human development in the state. The report, accordingly, bring to the fore several key issues and concerns related to unemployment, inequality, multidimensional poverty, child survival and undernutrition, maternal health, early marriage and pregnancy amongst teenage girls, quality of education and healthcare with the objective of informing policy decisions at various levels.

The most unique feature of the report is related to its findings and observations on the ‘subjective well-being’ of the people of the state, which essentially means, the perception and satisfaction of people about the processes which have implications on achieving human development outcomes. The overarching concern of the report, in this context, emanates from the issues related to governance and the quality of delivery of public services. The report clearly highlights the significance of strengthening and improving the system and structure of governance in achieving better and higher human development outcomes. There is no doubt that without making a qualitative and distinctive difference in the system and structure of governance, the indicators of human development cannot be improved in the state.
The report is being published at a time when a newly elected Government has assumed office in Assam with a decisive mandate to bring about a ‘change’ in the state taking everybody onboard. The people of Assam have shown enormous trust in this newly formed Government and have high hopes, aspirations and expectations from it. The Government of Assam is committed to fulfil the hopes and expectations of the people of the state. I am sure that the report will facilitate informed debate about many vital issues related to the development of the state and help the Government to chart out policies, which will impact the lives of people in the most desired way.
(Sarbananda Sonowal)

Dr. Himanta Biswa sarma, mA, LLB Ph.Dminister, Government of AssamFinance, P&D, Health & F.W., Education, GuwahatiDevelopment Department, Tourism, Cooperation,Handloom & Textile (Khadi & Village Industry),Pension & Public Grievance
Assam Secretariat (Block-E)Dispur, Guwahati-781 006Telephone No. : (0361) 2237315Fax : 0361-2237012 email : [email protected]
This is the second Human Development Report of Assam; the first one was published in 2003. It is about the people of Assam and their lives– how they are and how they are doing. The report has been prepared by the OKD Institute of Social Change and Development, Guwahati in collaboration with the Institute for Human Development, New Delhi under the aegis of the Planning and Development Department, Government of Assam. The report is an outcome of three years of research which involved the largest development survey conducted in the state till date covering 40,000 households and 1,90,000 individuals. The report is innovative in perspective; human development is attempted to be explained in terms of a range of diversities characterising the state. It is also inventive in analyses when it incorporates an index of ‘subjective well-being’ reflecting the perception and satisfaction of people about the critical processes affecting their lives.
The report shows, in terms of the desired goal, that the average level of achievement in human development in the state remains about halfway. More importantly, the achievements have been almost the same in all three dimensions – health, education and living standards. However, the report observes that there have been improvements in achievements since the publication of the first HDR for the state. The halfway level of achievements in human development, on average, is suggestive of an underlying inequality which needs to be addressed urgently. In fact, the report observes that about one-third of the potential human development achievement in the state is lost due to inequalities in income, health and education among people. Besides, about 37 per cent potential achievement gets reduced due to inequalities in gender. Such disparities in achievement are also evident across the districts. The report ranks Kamrup Metro at the top followed by Jorhat in district-level achievements, while Hailakandi remains at the bottom of the list. The report, therefore, identifies addressing inequality as one of the critical policy options in achieving human development in the state.
The Report comes with an interesting perspective on these differences in terms of geographical, social and economic diversities of the state. These diversities are recognised as critical contingent factors and economic drivers of these differences. The report, therefore, emphasises the ‘management’ of these diversities through appropriate public policies and interventions in order to achieve enhanced human development outcomes for the people of the state. The broad, overarching message that the report intends to offer entails the need for a focused, differentiated and decentralised development approach in the state instead of a homogeneous one.
The report is informative, and policy oriented and, in general, should serve as a guide for development planning in the state.
Dr. Himanta Biswa Sarma
Message


Government of AssAmBlock-’C’, 3rd floor,
Assam sachivalaya,Dispur, Guwahati-781006
tel.: 0361-2261120 (o)2261403 (o)
2237200 (fax)e-mail: [email protected]
v. K. Pipersenia, IAsChief secretary
I take immense pleasure in presenting the second Human Development Report of
Assam. The first Human Development Report of the state was published about a decade back.
Based on careful analyses of data collected through a special household survey conducted for
the purpose, the present report throws light on the development scenario of the state during
the last decade. While on several fronts, including health as well as education, the state has been
able to achieve significant progresses, there are areas where much needs to be done. The report,
therefore, highlights both successes as well as areas of concern. Most importantly, it offers a clear
message that not only going to school is important but also staying in schools and receiving
quality education indeed matter. It also emphasises that decent and secure employment is
central to a decent life; better health and nutrition to children hold a better future for all of us.
Besides, it also highlights that processes are equally important for outcome, and the consequence
of all types of inequalities is particularly a matter of serious concern. These messages also lay out
possible policy directions and marks priority areas for concrete actions and public policies.
The nature of the Human Development Report, in general, has always been suggestive – it
suggests what the situation is and what can be done to make an improvement therein. It is
envisaged that this improvement must relate to the lives of people, which the present report is
also primarily concerned about.
It is also important to note that Human Development Reports are not only meant for the
Government alone but, in fact, for people in general. That is why these reports are written in a
simple and accessible manner. The present report is also prepared in that fashion – it is nontechnical,
lucid and easy to understand. Yet, the report is also full of first hand information, rich in insights,
rigorous in analyses and focused on the way forward. Therefore, besides to the Government, the
report will be of immense use to all those engaged with the development concerns of the state. It
will be extremely useful for policy makers in particular and academics and public alike more
generally. The report offers ample scope for investigating further, engaging in dialogue, questioning
accepted norms and ideas. Apart from providing policy inputs to the Government, it is expected
that the report will facilitate in generating an informed public debate regarding the pressing
concerns of the development in the state.
(V.K. Pipersenia)Date: 17/8/2016
Message


Message
The Assam Human Development Report provides a comprehensive status of the state on a number of socio-economic parameters.
There are two unique features of this report. The first is that it not only compares districts in the state on these parameters, but also compares them through a lens of various diversities – spatial, demographic and socio- economic. The second is that the report takes into consideration various processes involved in the enhancement of capabilities of individuals. It pioneers a well-being framework that combines eight domains related to aspects of personal, social, political, cultural and ecological lives of individuals.
The report highlights that in order for economic growth to translate into greater human development outcomes, it is important to understand and manage various diversities in the state. It emphasizes the need to focus on providing gainful employment, quality and universal education and quality and universal healthcare. It underlines that sustainability of human development needs to be ensured by negotiating the environmental externalities as well as by redressing all types and forms of deprivations and inequalities.
We commend the Government of Assam on the release of the Assam Human Development Report and hope that it is used by the planners for developing an inclusive and sustainable development strategy harnessing the state’s tremendous growth potential.
(Amitabh Kant)
Hkkjr ljdkjuhfr vk;ksx] laln ekxZubZ fnYyh&110 001Government of India
nAtIonAL InstItutIon for trAnsformInG InDIAnItI Aayog, Parliament street,
new Delhi-110 001
tel.: 23096576, 23096574 fax : 23096575email : [email protected], [email protected]


Message
We congratulate the Government of Assam on the release of the Assam Human Development Report. UNDP is privileged to have collaborated with the state government in preparing this Report through our partnership with NITI Aayog.
The Assam Human Development Report is unique for two reasons. First, its analysis captures the spatial and socio-economic diversity that the state enjoys. It provides a greater insight into how people living in different terrains fare differently on a range of socio-economic indicators. Second, it marks the first time a state has attempted to measure well-being, a subjective aspect of the quality of life, through developing a dedicated index. It provides a useful and holistic picture of measurable human development outcomes and importantly, people’s assessment of these outcomes.
The Report calls for the formulation of long-term plans that take into account the State’s growth aspirations and sustainability. It advocates for gainful employment and education as key to overcoming the poverty trap. The Report makes a powerful case for inclusive institutions that ensure peoples’ participation. Recognizing the complexities and diversities within the state, the Report calls for moving away from a generic set of policies, towards focused, specific and targeted policies that can address human development challenges in the state.
We look forward to continuing our collaboration with the state government as it prepares the Vision 2030 document, towards a sustainable development agenda for Assam. We hope the Report’s findings will be integrated in planning and budgeting for sustainable growth, and for ensuring that no one is left behind.
We value our strong partnership with the Government of Assam and look forward to supporting the priorities outlined in this Report.
Yuri AfanasievUnited Nations Resident Coordinator and
Resident Representative, United Nations Development Programme
UNITeD NATIONS ReSIDeNT COORDINATOR INDIA
55, Lodhi Estate, New Delhi 110 003, IndiaTel: +91 11 46532333 | Fax: +91 11 24627612 | Email: [email protected] | www.in.one.un.org

xii
Assam HDR: Managing Diversities, Achieving Human Development
Acknowledgement
The Assam State Human Development Report, 2014, indeed, is a product of collective labour. This is truly a collaborative work and the sheer number of persons involved in its preparation is in itself indicative of the magnitude and intensity of the exercise. To name them all, therefore, would be simply impossible. I however, wish to acknowledge particularly those without whose relentless support, guidance, cooperation, inspiration and motivation this report perhaps, would not have been possible. Needless to say, I take both privilege and pleasure in earnestly and gratefully acknowledging their contributions in accomplishing this exercise.
The report has been titled as Managing Diversities, Achieving Human Development. The theme of “diversity” underlying the report has been the intellectual contribution of Professor Atul Sarma, Chairperson of the Institute. He introduced the idea of looking at unique diversities of the state while preparing the framework document at the very beginning. He made all of us believe that we will be able to do a fair job and continued to be a source of constant guidance and confidence for about three years untiringly.
The report was initiated by the Planning and Development Department, Government of Assam, in 2012 under the stewardship of Sri Kumar Sanjay Krishna, IAS, the then Principal Secretary at the Department. Throughout the crucial period of conceptualisation and critical phase of field work, he was immensely supportive. Later, his successor Sri K. V. Eapen, IAS, Additional Chief Secretary at the Department, played an equally supportive and encouraging role, taking the charge of guiding the process to a logical end. All the official difficulties at the initial stage were skilfully smoothened by Sri Shyam Jagannathan, IAS, the then Secretary at the Department. His most cordial and enthusiastic support at the initial stage set the ball rolling in the right direction. Subsequently, Sri Manish Thakur, IAS, the then Secretary, and Sri Santanu Gotmare, the then Additional Secretary to the Planning and Development Department became an integral part of the process and contributed immensely. Sri Gotmare was particularly instrumental in the smooth and timely conduct of the massive training of over 200 field investigators and starting the process of field work well within the scheduled time. Later Sri Ashutosh Agnihotri, IAS, the then Commissioner and Secretary, Planning and Development Department, took keen interest in the report and offered his all-possible support towards its completion. Ms Aruna Rajoria, IAS, the present Secretary at the Department followed the report in the same spirit and facilitated the process of its publication.

xiii
The Steering Committee under the Chairmanship of Honourable Chief Secretary to the Government of Assam was most supportive of the entire process. The process started with Sri N. K. Das, IAS and followed by Sri Jitesh Khosla, IAS, who headed the Committee for most of the period – both of them now retired. Both helped with their constructive and insightful comments and feedback to improve the quality of report. Sri V. K. Pipersenia, the present Chief Secretary to Government of Assam also has been very generous and helpful. Comments, feedback and insights received from all other members of the Committee are most thankfully acknowledged.
The members of the Advisory Committee constituted for the purpose have been exceptionally constructive to the whole exercise from the very beginning. Sri H. N. Das, IAS, the former Chief Secretary to the Government of Assam, who headed the Committee, has been virtually a member of the core team participating in training to the field investigators as well as district-level sensitisation workshops, offering the benefit of his vast experience and thoughtful insights. All other members of the Committee were more than helpful and took keen interest in the report.
The report immensely benefited from very critical and incisive comments received from a large number of renowned academicians and experts either on particular chapters or on the draft of the report as a whole. They include Professor S. R. Hashim, Professor Amitabh Kundu, Professor R. Radhakrishna, Dr A. K. Shiva Kumar, Professor K. S. James, Professor Indrani Gupta, Dr Preet Rustagi, Dr Sandip Sarkar, Dr Tanuka Endow, Dr Gerry Rodgers, Dr Janine Rodgers, Professor Sudhangshu Bhushan, Dr Arabinda Mishra, Dr Amrita Datta and Dr Rakesh Tiwary – all are known for their contributions in concerned fields. Dr Suman Seth of the Oxford Poverty and Human Development Initiative (OPHI) at the University of Oxford has read the draft of the Subjective Well-being chapter and offered useful comments. Sri Bhaskar Mishra, ISS, and his colleagues at UNICEF Delhi office helped revalidate nutritional measurements and firm up undernutrition estimates used in the report. Professor M. P. Bezbaruah and Dr Amit Choudhury, who were also members of the Advisory Committee, reviewed the sample estimation methods used in the report at a couple of workshops organised by the Institute. Karma Wangdi, Tshering Phuntosho and Tshoki Zangmo of Centre for Bhutan Studies, Thimphu, contributed to the report by sharing their experiences of preparing the Gross National Happiness Report of Bhutan both in Thimphu and Guwahati. We acknowledge all of them and wish to thank them for their intellectual contributions.
We are also grateful to Dr Atul Kalita, Parag Barman, Dr Sushmita Priyadarshini, Dr Ratul Mahanta, Dr Gopal Sarma, Dr Manjit Das, Dr Devashis Bose, Sri Rajumani Bhuyan, Sri Manash Roy, Dr Arup Kumar Deka and Bipul Kumar Rabha for helping us as local resource persons in conducting more than 50 sensitisation workshops in all districts and sub-divisions in the state. We also wish to put on record our gratitude to all Deputy Commissioners and Sub- Divisional Officers for organising these workshops in respective districts and sub-divisions. We are equally indebted to all those numerous participants in these workshops for giving us their valuable time and providing useful local insights on issues critical to human development in general.
Acknowledgement

xiv
Assam HDR: Managing Diversities, Achieving Human Development
During the last two- and-a-half years, Ms Ritu Mathur from UNDP and Sri Tuhin Pandey, IAS, the then Joint Secretary at the Planning Commission, Ms Swayamprabha Das from the erstwhile Planning Commission were instrumental in keeping things rolling from their end. The report not only has benefitted from their inputs at various stages but also gained enormously from the inputs received from numerous participants of various workshops organised by them both in Delhi and outside. Interaction with Milorad Kovacevic, Chief Statistician of UNDP’s Human Development Report Office, facilitated by them has been most useful in preparing the report.
Although very much part of the team, I intend to thank Sri Hitesh Ch. Sarmah (now retired), Sri Dilip Sarma, Sri N. C. Rajkhowa (now retired), Ms Kamala Goswami, Ms Banti Devi and Ms Panchami Dowera of the Planning and Development Department, Government of Assam, for all the administrative supports provided to the Institute and to me personally.
It is not enough to thank the Directorate of Economics and Statistics, Government of Assam, for the extremely professional and splendidly superlative partnership without which the massive HDR survey simply couldn’t have been possible. Special mentions are due to late Sri P. K. Bhattacharyya, the then Director and his esteemed colleague Sri Bimal Kumar Phookan (now retired), Ms Nirupama Talukdar and Sri Ranjan Kumar Dutta for their relentless cooperation. The Deputy Directors of the Directorate in all 27 districts, over 200 field staff, dozens of data entry operators were all into the work with utmost sincerity. I take the privilege of thanking them all.
Last, but not the least, I sincerely and humbly thank all those 40,000 households for responding to quite a longish and probing interview schedule. In fact, the report is for them, by them. I also formally acknowledge and thank the core team members, chapter writers, working group members and research support staff named at appropriate places. I conclude by thanking all those individuals who have contributed valuably in making of the report either directly and indirectly.
(Joydeep Baruah) Principal Coordinator and Lead Author
OKDISCD, Guwahati

xv
Team LeadersProfessor Bhupen Sarmah, Director, OKDISCD, GuwahatiProfessor Alakh N. Sharma, Director, IHD, New Delhi
Principal Coordinator and Lead AuthorJoydeep Baruah
Core Researchers and AuthorsSumit Mazumdar (Health)Indranee Dutta, Rajshree Bedamatta (Education)Rajarshi Majumder (Income and Livelihood)Saswati Choudhury, Vandana Upadhyay (Gender)Kalyan Das (Environment and Sustainability)
Core Researchers and Authors: Subjective Well-being Working Group Udoy Saikia, James Chalmers, Gournaga Dasverma, Joydeep Baruah, Rajshree Bedamatta, Anamika Baruah
Field Survey Administration and CoordinationPranjal Kumar Bhattacharyya, Director, Economics & Statistics, Government of AssamBimal Kumar Phookan, Joint Director, Economics & Statistics, Government of Assam
Coordinator: Operation and AdministrationHitesh Ch. Sarmah, Former Additional Director, Planning and Development Department
Computer and Technical SupportBiswa Ranjan Sarma
Research AssistanceSapon Baruah, Mausumi Sarma, Swabana Mumtaz, Ila Deka, Banhi Sikha Deb, Mirza Hasan, Jahid Islam, Nabanita Deka, Hirokjeet Roy, Abdur Rashid Ahmed
ASHDR 2014 Team
ASHDR 2014 Team

xvi
Assam HDR: Managing Diversities, Achieving Human Development
Messages........... ...................................................................................................................................................................................... iii
Acknowledgement .......................................................................................................................................................................... xii
ASHDR 2014 Team ............................................................................................................................................................................xv
List of Abbreviations .................................................................................................................................................................... xxiv
Executive Summary ..................................................................................................................................................................... xxvi
Chapter 1 - Introduction Managing Diversity, Achieving Human Development ................................................................................................ 1
Chapter 2 - Human Development in Assam Addressing Deprivations and Inequalities ........................................................................................................................ 20
Chapter 3 - employment, Income and Standard of Living Gainful Employment is Central to Decent Life ............................................................................................................... 44
Chapter 4 - Literacy and education Going to and Staying in School Matters ............................................................................................................................ 70
Chapter 5 - Health and Nutrition Better Health of Children Holds a Better Future ............................................................................................................ 90
Chapter 6 - Gender Dimensions of Human Development From Differentials to Inequalities ..........................................................................................................................................124
Chapter 7 - environment and Sustainability Negotiating Externalities, Ensuring Sustainability......................................................................................................142
Chapter 8 - Subjective Well-being Processes are Critical to Outcome ......................................................................................................................................164
Chapter 9 - Conclusions and Way Forward Need for Differentiated Approach .......................................................................................................................................182
Statistical Appendix ......................................................................................................................................................................190
Technical Appendix.......................................................................................................................................................................258
Bibliography and References ..................................................................................................................................................268
Table of Contents

xvii
List of Tables
Table 1.1 Profile of sample households ..................................................................................................................... 13
Table 2A.1 Key dimensional achievements in Assam (district level) ........................................................191
Table 2A.2 Key dimensional achievements in Assam .......................................................................................191
Table 2A.3 Dimensional inequalities in Assam (spatial diversity category wise) ..............................192
Table 2A.4 Dimensional and human development indices of districts..................................................192
Table 2A.5 Ranks of dimensional and human development indices of districts ..............................193
Table 2A.6 Inequalities in dimensional achievements in districts ..............................................................194
Table 2A.7 Inequality adjusted dimensional Indices and HDI (IHDI) for districts ..............................195
Table 2A.8 Loss in human development due to inequality (in percent) ...............................................196
Table 2A.9 Multi-dimensional poverty index for districts ................................................................................197
Table 2A.10 Multi-dimensional poverty index spatial diversity categories .............................................198
Table 3.1 Changes in key labour market indicators over NSSO rounds ................................................ 46
Table 3.2 Hierarchical decomposition of the labour force (in %) .............................................................. 47
Table 3.3 Unemployment rates among selected categories ....................................................................... 49
Table 3.4 Changes in occupational classes over NSSO rounds, Assam ................................................. 52
Table 3.5 Distribution of workforce by occupational category .................................................................. 52
Table 3.6 Earnings and earning inequality by nature of employment .................................................. 54
Table 3.7 Education-poverty linkage .......................................................................................................................... 66
Table 3A.1 Work participation rate and unemployment rates .....................................................................199
Table 3A.2 Labour force participation rate (male, female, total) .................................................................200
Table 3A.3 Types of works in Assam (in percentage employed) .................................................................201
Table 3A.4 Types of works in Assam by spatial diversity and religion ....................................................202
Table 3A.5 Income and source of income of households district wise ..................................................203
Table 3A.6 Income and source of income of households: diversity and religion ............................204
Table 3A.7 Average MPCE rural and urban, district wise .................................................................................205
Table 3A.8 Poverty ratios in Assam: district level by sector and social category ..............................206
Table 3A.9 Poverty ratios in Assam by spatial diversity and religious groups .....................................206
Table 3A.10 Asset poverty in Assam by spatial diversity and religion (percent) ..................................207
Table 3A.11 District level asset poverty in Assam (percent HH) (rural) ......................................................208
Table 3A.12 District level asset poverty in Assam (percent HH) (urban) ...................................................209
Table of Contents

xviii
Assam HDR: Managing Diversities, Achieving Human Development
Table 3A.13 District level asset poverty in Assam (percent HH) (total) ......................................................210
Table 3A.14 Landlessness by spatial diversity and religious groups (percent HH) .............................211
Table 3A.15 Landlessness district-wise (percent HH)............................................................................................212
Table 3A.16 Average land holding in rural areas (in bigha) ..............................................................................213
Table 3A.17 Size class distribution of operational holding (percent HH) .................................................214
Table 3A.18 Status of housing in Assam: rural-urban district wise (percent HH) ................................215
Table 3A.19 Status of housing in Assam: spatial diversity, religion wise ..................................................216
Table 3A.20 Deprivation in basic amenities: spatial diversity, religion wise ..........................................216
Table 3A.21 Deprivation in basic amenities: rural-urban, district wise .....................................................217
Table 3A.22 Proportion of self-assessed poor households ..............................................................................218
Table 3A.23 Inequality in living standard (MPCE): rural .......................................................................................219
Table 3A.24 Inequality in living standard (MPCE): urban ....................................................................................220
Table 3A.25 Chance of being poor (result of logistic regression analysis) ...............................................221
Table 3A.26 Employment and Livelihood Index (ELI) ..........................................................................................222
Table 4.1 Literacy rate Assam and India: 2001 and 2011 ................................................................................ 72
Table 4.2 Literacy rates in different age groups ................................................................................................... 73
Table 4.3 Occupational engagement by level of education (in %) .......................................................... 76
Table 4.4 Age specific enrolment rates ..................................................................................................................... 77
Table 4.5 Distribution pattern of out of school children of age 6-16 in % .......................................... 78
Table 4.6 Distance of primary and upper primary school from habitation, Assam ....................... 80
Table 4.7 Households by distance from secondary school (in %) ............................................................ 80
Table 4.8 School building by type, rural and urban (in %) ............................................................................. 81
Table 4.9 Improvement in school facilities in Assam (2005-14) ................................................................. 81
Table 4.10 Parents’ involvement in children’s education and study (in %) ............................................. 84
Table 4.11 Reported future plan of study for children (in %) .......................................................................... 84
Table 4.12 6 to14 year students by type of schools currently attended (in %) ................................... 85
Table 4.13 Enrolment at various levels of higher education in Assam (%) ............................................. 86
Table 4A.1 Percent literates (7 + years), male-female, rural-urban .............................................................223
Table 4A.2 Percent literates (15 + years) male- female, rural- urban ........................................................224
Table 4A.3 Percent literates in the 7 + and 15+ age category, by social category ..........................225
Table 4A.4 Percent literates in the 7 + and 15+ age category, by religious group ..........................225
Table 4A.5 Percent Literates in the 7 + and 15+ age category, by spatial diversity .......................225
Table 4A.6 District wise Muslim population and literacy, Hindus and Muslims ................................226

xix
Table A4.7 Odds of literacy (7+ years) of Muslims against Non-Muslims ..............................................227
Table A4.8 Levels of education by social categories (in percent) ...............................................................228
Table A4.9 Levels of education by religion (in percent) ...................................................................................228
Table A4.10 Levels of education by religion (in percent) ...................................................................................228
Table 4A.11 Age group wise students currently pursuing education (in percent) ............................229
Table 4A.12 Age group wise students currently pursuing education by social groups .................230
Table 4A.13 Age group wise students currently pursuing education by spatial diversity (in %) ..................................................................................................................................................230
Table 4A.14 Age group wise students currently pursuing education by religion (in percent) ...230
Table 4A.15 Children who are out of school, male-female and rural-urban (in percent) ...............231
Table 4A.16 Children who are out of school by spatial diversity (in percent) .......................................232
Table 4A.17 Children who are out of school by social category (in percent) ........................................232
Table 4A.18 Children who are out of school by religion (in percent) .........................................................232
Table 4A.19 Reasons for dropping out of school: male-female, Assam (percent of children) ...233
Table 4A.20 Reasons for dropping out of school: rural-urban, Assam (percent children) .............234
Table 4A.21 Reasons for dropping out of school: rural diversities, Assam (percent) .......................235
Table 4A.22 Reasons for dropping out of school: religion wise, Assam (percent) ..............................235
Table 4A.23 Reasons for dropping out of school: social category wise, Assam ...................................235
Table 4A.24 Availability of schooling facilities (primary and upper primary) .........................................236
Table 4A.25 Reported school facilities ...........................................................................................................................237
Table 4A.26 Reported teacher behaviour towards child at school, by school type (percent) ....238
Table 4A.27 6-14 year olds currently studying (in percent) ..............................................................................238
Table 4A.28 Children (6-14 years) currently in schools by various categories (percent).................239
Table 4A.29 Reported reasons for going to private schools (in percent) .................................................240
Table 4A.30 Perception about quality of education received by child (in percent) ..........................241
Table 5.1 Infant mortality rates across districts in Assam, 2011-12 and 2012-13 ............................ 93
Table 5.2 MMR in Assam and administrative divisions (2010-13).............................................................. 96
Table 5.3 Self-assessed health status by select background characteristics ...................................... 98
Table 5.4 Prevalence of self-reported morbidity by background characteristics ............................ 99
Table 5.5 Health and sanitation behavioural practices in Assam, across selected socio-economic attributes.........................................................................................................................107
Table 5.6 Child undernutrition in Assam and districts, 2013 (% children aged 0-59 months) ..............................................................................................................108
Table of Contents

xx
Assam HDR: Managing Diversities, Achieving Human Development
Table 5.7 Nutritional status of children in Assam, selected characteristics .......................................109
Table 5.8 Public health infrastructure in Assam .................................................................................................111
Table 5.9 Type of healthcare provider for short-term and chronic morbidities .............................113
Table 5.10 Type of healthcare provider by spatial diversity categories ..................................................114
Table 5.11 Household healthcare expenditure in Assam and districts (INR) ......................................120
Table 5.12 Sources of financing household healthcare expenditures (in %) ......................................121
Table 6.1 Life expectancy at birth by gender, rural-urban ...........................................................................127
Table 6.2 Sex ratio in Assam and India (2001-2011) ........................................................................................127
Table 6.3 Child sex ratios (0-6) in Assam and India (2001-2011) ..............................................................128
Table 6.4 Total fertility rate Assam and India (2013) ........................................................................................129
Table 6.5 Indirectly estimated TFR: Assam .............................................................................................................129
Table 6.6 Age group wise married men and women (as % within age cohorts) .........................130
Table 6.7 Married women in 15-19 age-group by different categories (in %) ................................131
Table 6.8 Infant mortality rate Assam and India ................................................................................................132
Table 6.9 Under five mortality rate by gender, Assam and India .............................................................132
Table 6.10 Prevalence of chronic morbidities (% individuals reporting cases) .................................133
Table 6.11 Differential learning of male and female ..........................................................................................136
Table 6.12 Percentage share of male and female elected representatives in Assam ....................137
Table 6.13 Percentage of crimes against women in the total crimes in the State ..........................138
Table 6A.1 Sex ratio in Assam and its Districts (2001-2011) ...........................................................................242
Table 6A.2 Child sex ratios (0-6 years) in Assam and its districts (2001-2011) ....................................243
Table 6A.3 Percent of married women in 15-19 years and district share ..............................................244
Table 6A.4 Gender inequality index (GII) for districts .........................................................................................245
Table 6A.5 Gender development index (GDI) for districts ..............................................................................246
Table 6A.6 Crimes reported to be committed against women in Assam: 2001 (No) ...................248
Table 6A.7 Crimes reported to be committed against women in Assam: 2005 (No.) ...................249
Table 6A.8 Crimes reported to be committed against women in Assam: 2012 ...............................250
Table 7.1 Land use changes in Assam ....................................................................................................................147
Table 7.2 Floods impacts on attainment of capability in flood-affected villages .........................149
Table 7.3 Indicators of environmental stressors in state (% reporting HH) .......................................156
Table 7.4 Environmental vulnerability: ranking the districts ......................................................................160
Table 8.1 Domains and indicators/variables of the Assam well-being framework ......................167

xxi
Table 8.2 Satisfaction with healthcare services of people who self-reported dissatisfaction with their health (N=2,904) ......................................................................................181
Table 8A.1 Rural-urban head counts as per level of overall satisfactions (in percent) ..................251
Table 8A.2 Male-female head counts as per level of overall satisfactions (in percent) .................251
Table 8A.3 Social Category wise head counts of overall satisfactions (in percent) .........................251
Table 8A.4 Religion wise head counts of overall satisfactions (in percent) ..........................................252
Table 8A.5 Spatial diversity wise head counts of overall satisfactions (in percent) .........................252
Table 8A.6 Domain wise head counts of satisfied people (in percent) ..................................................253
Table 8A.7 Spatial diversity wise headcounts of satisfied people on domains (percent) ...........253
Table 8A.8 District wise head counts of overall satisfactions (in percent) ............................................254
Table 8A.9 District wise headcounts of satisfied people on domains (percent) ...............................255
Table 8A.10 Average number of domains where people are satisfied ......................................................256
Table 8A.11 Important gaps in average number of domains where people are satisfied ............257
List of Figures
Figure 1.1 Ends and means interface: the capability framework ................................................................ 11
Figure 1.2 Rural-urban profiles of districts ................................................................................................................ 14
Figure 1.3 Profiles of districts by spatial diversity categories ......................................................................... 15
Figure 1.4 Profiles of districts by religious groups ................................................................................................. 16
Figure 1.5 Profiles of districts by social categories................................................................................................ 17
Figure 2.1 Life expectancy across districts of Assam ........................................................................................... 23
Figure 2.2 Life expectancy by religious and social categories ...................................................................... 24
Figure 2.3 Life expectancy by diversity categories ............................................................................................... 24
Figure 2.4 Differential MYS across sex, religion and social categories ...................................................... 26
Figure 2.5 District wise estimates of MYS ................................................................................................................... 26
Figure 2.6 MYS across spatial diversity categories ................................................................................................ 27
Figure 2.7 Differential EYS across sex, religion and social categories ....................................................... 28
Figure 2.8 District level EYS ................................................................................................................................................. 28
Figure 2.9 EYS across spatial diversity categories .................................................................................................. 29
Figure 2.10 Relation between NDDP per capita (200-05 prices) 2012-13 and PCAI .......................... 30
Figure 2.11 Differential PCAI across rural-urban, religion and social categories ................................... 31
Figure 2.12 District level PCAI ............................................................................................................................................... 31
Figure 2.13 PCAI across spatial diversity categories ............................................................................................... 32
Table of Contents

xxii
Assam HDR: Managing Diversities, Achieving Human Development
Figure 2.14 Dimensional achievements in health across districts ................................................................ 33
Figure 2.15 Dimensional achievements in education across districts ........................................................ 33
Figure 2.16 Dimensional achievements in income across districts .............................................................. 34
Figure 2.17 HDI and districts ................................................................................................................................................. 35
Figure 2.18 PCAI and HDI in districts ................................................................................................................................ 35
Figure 2.19 HDI in Assam (2001-2014) ............................................................................................................................ 37
Figure 2.20 Loss in potential human development due to inequalities involved ............................... 39
Figure 2.21 Multi-dimensional poverty head-count, intensity and MPI in districts ........................... 41
Figure 2.22 Overlaying of HDI and subjective well-being index ................................................................... 43
Figure 3.1 LFPR, employment and unemployment rates by spatial diversity ..................................... 48
Figure 3.2 Poverty rates in Assam by rural-urban and social category (%) ........................................... 57
Figure 3.3 Poverty rates in Assam by spatial diversity categories (%) ....................................................... 58
Figure 3.4 Asset poverty in Assam: rural and urban (% households) ........................................................ 59
Figure 3.5 Intensity of asset poverty in districts .................................................................................................... 60
Figure 3.6 Agricultural landlessness in rural areas of Assam (% households) ...................................... 61
Figure 3.7 Deprivations in basic household amenities .................................................................................... 63
Figure 3.8 Incidence of self-assessed poverty across spatial diversity categories ............................ 64
Figure 3.9 Inequality in land-holding in rural Assam: share of the top quintile ................................. 65
Figure 3.10 Employment and livelihood quality index for districts .............................................................. 68
Figure 4.1 Distribution of population by levels of education (in %) .......................................................... 75
Figure 5.1 IMR by residence and sex, Assam: 1990-2012.................................................................................. 92
Figure 5.2 IMR in Assam and India (2003-2012) ..................................................................................................... 93
Figure 5.3 NNMR by residence: Assam and India (2000-2012) ..................................................................... 94
Figure 5.4 Maternal mortality ratios in Assam and India (2001-2012) ...................................................... 95
Figure 5.5 District wise prevalence of short-term and chronic morbidities ......................................101
Figure 5.6 Socio-economic differentials in smoking, males .........................................................................105
Figure 5.7 Utilisation of government health facilities for outpatient care in Assam .....................115
Figure 5.8 Reasons for healthcare provider choices for outpatient care in Assam ........................115
Figure 5.9 Trends in delivery care coverage in Assam (2005-2014) .........................................................116
Figure 6.1 Profile of women’s work in Assam (in %) ...........................................................................................135
Figure 6.2 Percentage of reported cases of violence in Assam against women .............................137
Figure 6.3 Loss of human development due to gender inequality across districts.......................140
Figure 6.4 GDI across Districts .........................................................................................................................................141
Figure 8.1 People enjoying subjective well-being in Assam (in %) ..........................................................168
Figure 8.2 People enjoying subjective well-being by diverse categories (%) ...................................169
Figure 8.3 People enjoying subjective well-being across districts (in percent) ...............................170

xxiii
Figure 8.4 Drivers of well-being in Assam (% satisfied) ...................................................................................171
Figure 8.5 District-wise percentages of people satisfied in the domain of ecology .....................171
Figure 8.6 District-wise percentages of people satisfied in the domain of culture .......................172
Figure 8.7 District-wise percentages of satisfied people in the governance domain ..................173
Figure 8.8 District-wise intensity of subjective well-being (number of average domains) ......174
Figure 8.9 Average number of domains in which people are satisfied according spatial categories .............................................................................................................................................176
Figure 8.10 Gaps in intensity of satisfaction along with head counts ......................................................176
Figure 8.11 Subjective well-being gradients with educational attainment ..........................................177
Figure 8.12 Age gradient of subjective well-being ..............................................................................................177
Figure 8.13 Distribution of the proportion of the vulnerable people in each district ....................180
List of Maps
Map 1.1 International and interstate borders shared by the state ............................................................ 2
Map 1.2 Spread of Char-dominated blocks in the state .................................................................................. 3
Map 1.3 High flood affected blocks in the state ................................................................................................... 4
Map 1.4 Overlapping diversities in the state ......................................................................................................... 4
Map 2.1 HDI in South Asia (2013) ................................................................................................................................ 36
Map 2.2 HDI in India (NHDR, 2011) ............................................................................................................................ 37
Map 4.1 Plot of ‘odd ratios’ of literacy (7+ years) of Muslims against non-Muslims ..................... 74
Table of Contents

xxiv
Assam HDR: Managing Diversities, Achieving Human Development
AHDS Assam Human Development Survey
AHS Annual Health Survey ANC Ante-Natal Care API Annual Parasite Incidence ARI Acute Respiratory InfectionASDMA Assam State Disaster Management
Authority ASHA Accredited Social Health Activist AWC Anganwadi CentreBPHC Block Primary Health CentreBTAD Bodoland Territorial Autonomous
Districts BTC Bodoland Territorial Council CAGR Compounded Annual Growth Rate CHC Community Health Centrecumec cubic metre per second DH District HospitalDLHS District Level Household Survey DISE District Information System for
Education EB Enumeration BlockELQI Employment and Livelihood
Quality Index EYS Expected Years of Schooling FSS First Stage StrataGATS Global Adult Tobacco Survey GDI Gender Development Index GDP Gross Domestic Product GER Gross Enrolment Ratio GII Gender Inequality Index GIS Geographic Information System GNI Gross National Income GPI Gender Parity Index GPS Global Positioning System GSDP Gross State Domestic Product ha hectare HAZ height-for-age HCR Head Count Ratio
HDI Human Development Index HDR Human Development Report HH householdHPI Human Poverty Index ICDS Integrated Child Development
Services IHD Institute for Human Development IHDS India Human Development Survey IMR Infant Mortality Rate IT Information Technology JSY Janani Suraksha Yojana km kilometrekm2 square kilometrel litreLFPR Labour Force Participation Rate MCH Maternal and Child Health MCTS Mother and Child Tracking System MDF Moderately Dense ForestMDG Millennium Development Goalmg milligram MMR Maternal Mortality RatioMPCE Monthly Per Capita Consumption
Expenditure MPI Multi-dimensional Poverty Index MT mega tonneMW megawatt MYS Mean Years of Schooling NCAER National Council of Applied
Economics and Research NCD Non-Communicable Disease NCO National Occupational
Classification NDDP Net District Domestic Product NFHS National Family Health Survey NHA National Health Accounts NHM National Health Mission NNMR Neonatal Mortality Rate NRHM National Rural Health Mission NRSC National Remote Sensing Centre
List of Abbreviations
xxv
NSSO National Sample Survey Organisation
NTFP Non-Timber Forest ProductNVDCP National Vector-Borne Disease
Control Programme OBC Other Backward ClassOF Open Forest OKDISCD Omeo Kumar Das Institute of
Social Change and Development PAP Proportion of Ailing Persons PCAI Per Capita Annual Income PCB Pollution Control Board PHC Primary Health Centre PIP Programme Implementation Plan ppb parts per billion PPP Purchasing Power Parity PSU Primary Sampling UnitPTA Parents-Teachers Association RBI Reserve Bank of India RCH Reproductive and Child Health RR Response Rate
RSBY Rashtriya Swasthya Bima Yojana SAGE Survey on Ageing and Adult Health SAH Self-Assessed Health SAPov Self-Assessed Poverty SC Scheduled CasteSRS Sample Registration System SSA Sarva Sikhsa Abhiyan ST Scheduled TribeTET Teacher Eligibility Test TFR Total Fertility Rate TSS Third Stage StratumU5MR Under 5 Mortality Rate UHC Universal Health Coverage UNER Unemployment Rate UNDP United Nations Development
ProgrammeVDF Very Dense Forest WAZ weight-for-age WHO World Health Organization WHZ weight-for-height WPR Work Participation Rate
List of Abbreviations

xxvi
Assam HDR: Managing Diversities, Achieving Human Development
Distinguishing Features of the Report
• TheAssamHumanDevelopmentReport(HRD)2014presentsadetailscenariooftheoverallhuman development in the state. The most distinguishing feature of the report is that it goes beyond the usual way of looking at district-level aggregate scenarios of human development and brings the myriad diversities of the state, even within districts, into perspective while analysing varying degrees of human development outcomes.
• The report specificallyhighlightsgeographical, social,economicand institutionaldiversitiesof the state and their implications on aggregate human development outcomes. The report emphasises geo-spatial diversities which are not only unique but indeed enormous. The state shares large international as well as inter-state boundaries, accommodates both plains and hills, suffers from recurring floods and erosion, and has substantial riverine areas known as the ‘Chars’ and large tea gardens. More often than not, these geo-spatial diversities overlap with one another. Besides, the state is a unique storehouse of demographic diversities with uniquely rich and diverse social norms and customs. There are interesting institutional diversities in the state as well – ranging from autonomous councils to development councils. These wide varieties of institutional arrangements have resulted from political processes of fulfilling various demands for autonomy and self-governance by different communities. The report, therefore, highlights the fact that relative advantages of people differ greatly in the state and, as such, differential achievements of people need to be understood in terms of these diversities. The report, therefore, has been titled as Managing Diversities, Achieving Human Development.
• Anothersalientaspectofthereportisthatitisbasedonprimarydata.Thisis,infact,thelargestsurvey ever conducted in the state for development evaluation. The sample size of the survey is about 10 times that of the typical National Sample Survey Organisation (NSSO) rounds and about eight times that of the National Family Health Survey (NFHS) in the state. As such, the report provides some estimates related to child nutrition, health and educational attainment at state and sub-state levels for the first time. Secondly, this allows the report to adopt the United Nations Development Programme’s (UNDP’s) new (2010) method of assessing human development. This is the first time that a human development report has been prepared with new UNDP method in the country.
• Anotherdistinguishingfeatureofthereportcomesfromitsanalyticalinnovation.Thereportprovides three supplementary indices related to employment-livelihood, vulnerability and subjective well-being. While the first two offer additional information regarding opportunities of making choices, the third is concerned about the processes involved in realising the
Executive Summary

xxvii
opportunities. Having an index of subjective well-being in the HDR, therefore, adds value to the analyses. This kind of juxtaposition of ‘objective’ and ‘subjective’ aspects of well-being within the capability approach is an important innovation attempted in this report. Besides, the collaborative and participative approach involved in the preparation of the report itself is a milestone.
Key Findings
• ThereportputstheHumanDevelopment Index(HDI) inAssamat0.557 indicatingthatthelevel of overall human development in the state is just about half of the desired level. However, it has been observed that the overall level of human development in the state has shown a steady and continuous improvement over the last 15 years.
• It may, further, be observed that achievements in all three key dimensions of humandevelopment, that is, education, health and income are about halfway with education being at about two-thirds followed by health and income which are just at the half mark of the desired level. Besides, district-wise and various diversities wise, both overall and dimensional achievements have shown wide variations. The district ranking based on the values of overall HDI puts Kamrup Metro at the top (with a value of HDI 0.703) followed by Jorhat (HDI 0.655). The lowest value is obtained in the district of Hailakandi (HDI 0.437).
• Mostimportantly,driversofthehumandevelopmentachievementshavebeenfoundtodiffergreatly across districts. While the overall level of human development achievement in some districts such as Kamrup Metro is primarily driven by achievements in the income dimension; in case of others, it has been found to be either education (say, in Sibsagar) or health (say, in Kamrup). This clearly points to policy focuses for district planning and favours a decentralised, differentiated and need-based development planning in the state.
• The report categorically underlines redressal of various inequalities to improve humandevelopment outcomes in the state. It is estimated that about one-third (30 per cent) of the potential aggregate human development is lost due to the prevailing inequalities underlying achievements in education, health and income dimensions. The loss due to inequality is the highest in the income dimension (about 44 per cent) followed by health (32 per cent) and then education (9 per cent). Moreover, it was found that, district wise, dimensional inequalities vary distinctly.
• The report also highlights the significance of removing gender inequalities in improvingoverall human development achievements in the state. The report estimates that overall human development of women, in general, is lower than that of men by some 14 per cent. Besides, the report reveals that the observed gender inequality in key dimensions of human development, that is, education, health and income, results in the loss of about 37 per cent of potential human development achievement in the state in general.
Executive Summary

xxviii
Assam HDR: Managing Diversities, Achieving Human Development
• Thereportdisclosesthataboutone-thirdofthepopulationinthestateis‘multi-dimensionallypoor’, that is, poor in more than one dimension of human development. It, therefore, emphasises that poverty beyond income poverty be addressed within a much wider framework and approach.
• The report highlights an index of subjective well-being of people which represents howpeople value the various critical processes of human development. It is found that 56.4 per cent of people is ‘satisfied’ – either moderately or intensely – with the most critical processes of well-being. However, many variations exist in the proportions of ‘satisfied’ people across districts. The highest percentage of people ‘satisfied’ is obtained in Jorhat (82.4 per cent) while the lowest is found in Marigaon (18.1 per cent). The main drivers of ‘satisfaction’ have been aspects related to ecology and environment, cultural and psychological domains whereas the three main drivers of ‘dissatisfaction’ have been governance, education and health domains.
Major Issues and Concerns
• Thereporthighlightssomemajorissuesandconcernsinachievingoverallhumandevelopmentin the state. It first underlines the concerns related to the unemployment scenario in the state. The total unemployment rate (percentage of people within the age of 15-59 years finding no employment) is estimated at 13.4 per cent. The female unemployment rate is found to be 33.9 per cent compared to 8.0 percent in the case of males. The youth unemployment rate (15-24 per cent) is again found to be as high as 37.7 per cent. Geographical diversity-wise unemployment is found to be the highest in the tea gardens (15.3 per cent) and flood affected areas (15.2 per cent).
• The report brings in issues and concerns regarding myriad forms of inequalities. It findsthat inequalities in human development outcomes emanate from inequalities in access to productive resources and basic amenities. The extent of inequality in land holding, for example, is evident from the fact that the top 20 per cent of the people holds about 70 per cent of the total cultivable land while 80 per cent share 30 per cent of the remaining land. Consequently, the top 20 per cent shares 45 per cent of the total consumption expenditure while the bottom 20 per cent shares only 8 per cent. The report, thus, highlights that redressal of fundamental inequalities in access to resources is essential for improving human development achievements.
• Thereportemphasisesthemulti-dimensionalnatureofpovertyanddeprivations.It,therefore,advocates for ending all types and forms of deprivations in order to improve human development outcomes.
• In this context, the report underscores the criticality of education for overall humandevelopment in the state. It clearly emphasises the benefits of making children stay longer in school along with a qualitative improvement in education. The report observes that reducing dropout rates at all levels is extremely important.
xxix
• On the health front, the report highlights, inter alia, four issues and concerns. It reiteratesthe need to accelerate progress in improving the infant and maternal mortality scenario. However, in this connection, the report observes that, in the context of infant mortality, social determinants and behavioural aspects are to be brought within the policy focus. Similarly, the report observes that maternal mortality, perhaps, cannot be addressed only by focusing on institutional factors and policy must accommodate a range of non-institutional factors. It very clearly raises concerns on the child nutrition scenario in the state. The report estimates that 37.4 per cent children below the age of five years is under weight. Most of the underweight children are in the age group less than two years and live in rural areas. Very importantly, the report does not find a clear gradient with respect to consumption expenditure classes. This indicates that child undernutrition in the state is not the result of poverty alone and thus needs a much wider policy framework for it to be addressed. The report also highlights health vulnerabilities in terms of high out-of-pocket expenses with very limited risk coverage.
• Thereportalsopointsouttotheissuesregardingearlymotherhoodandearlypregnancyand adolescent girls. It finds that about 15 per cent of girls in the age group of 15-19 are already married. The report observes that this is a serious concern affecting a host of cross-cutting issues related to reproductive and child health, education and employment, and gender inequality.
Broad Messages
• The report indicates that economic growth needs to be translated into greater humandevelopment outcomes and achievements for improving the lives of people. In doing so, it is extremely critical to understand and manage various diversities in the state. Three aspects – as the report argues – are significant in achieving better human development outcomes and in making economic growth inclusive and broad-based: gainful employment, quality and universal education and quality and universal healthcare. Sustainability of human development, again, needs to be ensured not only by negotiating the environmental externalities but also by redressing all types and forms of deprivations and inequalities. In fact, the report underlines that redressal of inequalities is fundamental in achieving human development and making it inclusive as well as sustainable. The report makes an important value addition by considering ‘processes’ along with ‘outcomes’ and emphasises the point that processes are critical to outcome. The report, therefore, makes a very strong case for getting the processes right by underlining the principles of transparency, accountability and democratisation in the state. The report, in this connection, makes a strong case for inclusive institutions to ensure people’s participation in different processes involved.
• Theoverarchingbroadmessageofthereportisthat,giventhemulti-layeredandmulti-facetedcomplexities emanating out of unique diversities of the state, no generic set of policies would be able to bring about overall human development; rather there is a need for a focussed and specific set of policies to deal with the issues and concerns raised in the report and for achieving a higher level of human development in the state.
Executive Summary

xxx
Assam HDR: Managing Diversities, Achieving Human Development
1 IntroductionManaging Diversities, Achieving Human Development

1
Managing Diversities, Achieving Human Development
1.1 Assam: Geography, Economy and People
Assam is one of the 35 states and union territories of India. The total geographical area of the state is 78,438 square kilometre (km2) with a total population of 3.12 crore. Assam is primarily a rural state with more than 98 percent of its area falling under rural areas and a rural population of 86 percent. The state accounts for about 2.4 percent of the total geographical area and 2.6 percent of the total population of the country (Census, 2011).
The state is a unique showcase of diversities of myriad forms. As a “land locked”state, it is enormously diverse in terms of its geographical features. Given these features, the state in general faces some distinctive challenges.
The geographical location of the state itself is quite unique. The state shares borders with seven states and two countries, that is, Bhutan and Bangladesh, having 2,276.3 kilometre (km) inter-state and 529 km of international borders1. Evidently, the physical remoteness of these border areas limits the connectivity and economic opportunities of the people living in these areas. The lack of adequate infrastructure in these areas has been acknowledged long back in 1986 and, consequently, the Border Area Development Programme under the Ministry of Home Affairs, Government of India, was formulated to meet the special need of these areas in the country as a whole. Specific provisions were made in subsequent Five Year Plans for the development of these areas in the country, in general, as well as in the state, in particular, since the Eighth Five Year Plan onwards. Besides physical remoteness, limited economic opportunities and lack of infrastructure, these areas also commonly
witness numerous conflicts related to border disputes, often violent in nature, directly affecting life and livelihood of people. Such conflicts only reinforce the development challenges. Over the years, such conflicts have been a familiar feature of the Assam-Meghalaya, Assam-Nagaland and Assam-Arunachal borders. The genesis of these disputes related to borders, however, dates back to colonial history of the region and subsequent post-colonial nation building processes. The distinctive challenge in these areas, thus, emanates from both security and development perspectives.
The geographical terrain of the state has a mix of hills and plains –of 27 districts two, that is, Karbi Anglong and Dima Hasao, are hills districts. These two districts comprise about 20 percent of the total geographical area and about 4 percent of the total population of the state. Like the border areas, the hill areas also offer unique challenges given their difficult terrain, forest cover, peculiar agro-climatic conditions, distinct socio-cultural features and typical institutional arrangements. These again impede the scope and opportunities of various choices its people can make.
The plains of the remaining 25 districts are divided into two valleys – the Brahmaputra and the Barak valleys – each having unique historical legacies. The Brahmaputra valley is further divided into two banks – southern and northern. Also, the valley is divided as “upper” and “lower” with respect to the course of the river Brahmaputra. The history of the divisions is different in terms of population settlement and agricultural practices, giving rise to unique social and economic formations in the districts. When the British brought the state into the fold of the colonial empire in the early 19th century, a typical and uniform revenue system emerged
1 Working Group Report on Border Area Development, 10th Five Year Plan, Planning Commission, Government of India (2001).
Managing Diversities, Achieving Human Development

2
Assam HDR: Managing Diversities, Achieving Human Development
and the state economy grew in a particular fashion, serving mostly, colonial interests. The economic resources of the state including oil and coal attracted colonial interests followed by the possibilities of tea plantation. These continued to be the state’s economic backbone subsequently. The economy of the state, therefore, remained primarily ‘extractive’ with very limited domestic vibrancy. It may be noted that the infrastructure built in the state due to the economic interests of the colonial powers remained mostly lopsided, contributing little to domestic development.
In the valleys, there are areas surrounded by the courses of the river Brahmaputra and its tributaries, known as the chars. These chars are, in fact, mid-channel bars, which are an integral part of the fluvial process of the river Brahmaputra and its tributaries in Assam. The
extremely braided channels of the river along with its suspended particles and bed load combine together during floods to give rise to “almond” shaped alluvial formations known as chars. Since these formations are built under a flood environment, the height of the char is never greater than the height of the highest flood2. They are extremely unstable and can be wiped out by erosion during recurrent floods. Above all, the chars follow a peculiar pattern of migration that started during the colonial period. Besides, the chars are subject to erosion on their upstream and deposition on the downstream, due to which char dwellers migrate downstream. This affects the geometry and location of the chars during floods almost every year.3 The chars account for about 5 percent of the total area of the state spreading across 14 districts, 55 blocks and around 2,300 villages.4
Map1.1: International and interstate borders shared by the state
2 See Bhagabati (2001). 3 See Chakraborty (2013). 4 Directory of Char Areas (2007-08), Government of Assam.

3
Managing Diversities, Achieving Human Development
The life and livelihood of people living in the char areas are challenged by several uncertainties besides the problems of accessibility and connectivity. Although the land of the chars is favourable for agricultural production, uncertainties related to land relations are worth noting. Moreover, recurrent floods and erosion as mentioned above are perennial features of the chars, giving rise to considerable uncertainties for the char dwellers.
Floods, however, are a major challenge in themselves. The state faces recurring floods each year affecting land, life and livelihood. The hazard maps prepared by the National Remote Sensing Centre (NRSC) reveal that there are areas in the state with recurring floods five to seven times in a year. Based on satellite data, for instance, it has been estimated that during the flood that occurred in June-July 2012, 27 districts in Assam had more than 5 percent of the total geographical area submerged, about 3,829 villages marooned and 23.08 lakh people
were affected5. Floods also naturally accompany large-scale erosion. As per government records, the average annual damage since 1954 has been over INR124 crore and the estimated average annual erosion rate has been 8,000 hectares, which have affected lakhs of families spread over 2,534 villages6.
The state also has a large number of tea gardens. There are some 765 large tea gardens with 2.33 lakh hectare of area under their possession7. The tea gardens represent a typical diversity with distinct population streams that migrated into the state during the colonial period. Life and livelihood at the tea garden are characterised by the typical features of plantation economy and the people in the tea gardens are considered as one of the most marginalised communities. Employment security, fare wages, provisioning of basic services and amenities and improving the overall living standard of the tea garden people have been major challenges all along. Due to their relative backwardness, they have
Map1.2: Spread of char-dominated blocks in the state
5 See Bhatt et. al. (2013).6 See Chakraborty (2013).7 Statistical Hand Book of Assam (2013).
Char-dominated blocks

4
Assam HDR: Managing Diversities, Achieving Human Development
Map1.3: High flood-affected blocks in the state
Map1.4: Overlapping diversities in the state
International BoundaryState BoundaryControl BlocksHill BlocksTea Garden BlocksFlood Prone BlocksChar BlocksBlock sharing International & State Boundary
High flood-affected blocks

5
Managing Diversities, Achieving Human Development
been identified as “backward classes” by the Government, even though collectively they are called tea tribes.
It is interesting to note that, more often than not, these unique geographical diversities overlap with each other generating cascading effects on lives of people –their routine functioning. The complexity is presented in the Map 1.4.
The economy of the state is primarily agricultural. In the hills, people have been practicing shifting cultivations since time immemorial. Wet rice cultivation started during the Ahom rule in the early 13th century is mostly practiced in the valleys. British occupation of the region resulted in cultivation of cash crops during the early 19th century together with a sizable plantation economy. Even though the state is rich in terms of oil, gas and other natural resources, industrialisation remained limited. Urbanisation has also been limited and confined only to administrative rather than economic processes, and, consequently, most urban centres grew either as administrative headquarters or as
army cantonments. Notwithstanding, the service sector has become important in the state’s economy in the recent past.
The growth rate of the state’s economy – one of the primary macroeconomic indicators – measured by the rate of growth of the Gross Domestic Product (GDP) for the year 2013-14 at the constant (2004-05) prices has been estimated to be 5.87 percent against the national level of 4.74 percent. However, during 2004-09, the growth rate of the state’s economy remained lower than the national average. The observed turn-around, that is, growth rate of the state’s economy being higher than the national level, has existed since 2009-10 consecutively. Notably, during the last decade, that is, 2004-14, the state’s growth rate has increased from 3.74 to 5.87 percent whereas that of the country has declined from 8.52 to 4.74 percent. The data show that recovery in agricultural growth and a pronounced improvement in industrial growth together with steady service sector growth have contributed to this turn-around. The agricultural growth rate, which was a mere

6
Assam HDR: Managing Diversities, Achieving Human Development
1.92 percent in the beginning of 2005, has risen to 4.45 in 2013-14, whereas that of the country has declined from 5.60 to 4.93 percent during the same period. The industrial growth rate in the state which was -3.53 percent in 2005 has improved to 4.28 percent in 2013-14 while that of the country has fallen from 9.40 to 0.35 percent during the period. The growth rate of services in the state in 2013-14 has been given as 6.95 percent which was 7.93 percent in 2005. The growth rate of services in the country as a whole has been 6.78 percent in 2013-14 which was 10.91 percent in 2005.
Notwithstanding the share of agriculture in the Gross State Domestic Product (GSDP) at constant (2004-05) prices has declined from 21.70 percent in 2004-05 to 17.77 in 2013-14.
The share of industry in the total GSDP has also declined from 27.54 percent to 21.27 percent during the same period. The share of the service sector, on the other hand, has increased from 46.89 percent to 57.47 percent.
The per capita net domestic product – the other important macroeconomic indicator–shows that the state’s per capita net domestic product at constant (2004-05) prices was 40 percent lower than the national level in 2013-14. In 2004-05, the gap was 30 percent. The gap is widening despite the higher rate of growth in per capita net domestic product in the state compared to the national level in 2012-13 and 2013-14. It is, therefore, necessary to have a substantially higher growth in per capita for the long term to

7
Managing Diversities, Achieving Human Development
reduce the per capita gap between the state and national levels.
Census 2011 data makes it clear that about 50 percent of the total workforce (main and marginal put together) still depend on agriculture. Data also reveal that, during 2001-11, the proportion of cultivators (main as well as marginal) to total workers has declined from about 40 percent to 34 percent. On the contrary, during the same period, the proportion of agricultural labourers has increased from 13 to 15 percent. Data also reveal that the proportion of marginal cultivators and agricultural workers has also increased during 2001-11.
Data shows that the total gross cropped area in the state is about 53 percent of the total geographical area. However, the state’s cropping intensity is rather low at 149. The major challenge comes from not having adequate irrigation facilities as the state’s irrigated area is less than 10 percent of the total cultivated area. Thirty-eight percent of the gross cropped area is under high yielding variety seed cultivation. It is further observed that an overwhelming proportion, that is,86 percent of operational holdings in the state belongs to the small and marginal categories (less than 2 hectare in size) of which almost 68 percent belongs to the marginal category (less than 1 hectare in size). The index of food grain production in the state in 2013-14 was 156 (with respect to the base triennium ending 2007-08) and that of non-food grain is 124. The corresponding figure for the country has been 123 and 135, respectively. The index of industrial production in the state in 2013-14 (base taken as 2004-05) was 138 which remained almost stagnant for the subsequent five years. The index of production from total manufacturing happens to be 178 while that of total mineral production is found to be 1038.
These trends depict an overall economic situation of the state. Increasing agricultural growth coupled with its falling share in GSDP, on one hand, indicates a lack of adequate value addition in the agricultural sector. Notwithstanding, half of the working population is engaged in agriculture which itself is witnessing a tendency towards proletarianisation and marginalisation, this, in general, is adversely impacting upon the level of per capita net domestic product. The criticality of the agricultural sector, therefore, becomes eminent.
The state is further uniquely diverse in terms of its demography. Census 2011 puts the total population in the state at 3.12 crore. The growth rate of population in the state during 2001-11 was 17.1 percent compared to 17.7 percent in the country. Growth rate of the population registered a decline from 18.9 during 1991-2001. The sex ratio in the state has improved from 935 (2001) to 958 (2011). There are about 26 Scheduled Tribes (STs) in the state accounting for 12.44 percent of the state’s population. The state also has 22 Scheduled Castes (SCs) accounting for 7.15 percent of the state’s total population9. The population is also diverse in terms of religious minorities and 118 blocks spreading across 17 of 27 districts in the state have been categorised as minority concentrated blocks10. Demographic diversities give rise to myriad socio-cultural conditions and contingencies offering development challenges of various forms.
Apart from uniqueness and diversities, the state is also characterised by assorted institutional arrangements of governance. The two hills districts of the state have autonomous district councils formed under the provisions of the
8 Data from Statistical Hand Book of Assam 2014, Directorate of Economics and Statistics, Assam.9 See Census 2011, 2001.10 As per the Ministry of Minority Affairs, Government of India

8
Assam HDR: Managing Diversities, Achieving Human Development
Sixth Schedule to the Constitution. Further, fulfilling the aspirations for autonomy of the Bodos, four districts, that is, Kokrajhar, Baksa, Chirang and Udalguri, were characterised as Bodoland Territorial Autonomous Districts (BTAD) and brought under the Bodoland Territorial Council (BTC) created through an Amendment to the Sixth Schedule in 2003. The rest of the districts in the state are under part IX of the Constitution where Panchayats and Urban Local Bodies are functional. However, there are six autonomous councils related to six of the communities – Rabha-Hasong, Mising, Tiwa, Deori, Thengal Kachari and Sonowal Kachari– which have been formed through State Legislations. Besides, there are 18 community-specific development councils created by the state government which are primarily mandated to focus on development of specific communities.
Autonomous district councils, including the BTC, created under the Sixth Schedule to the Constitution have elaborate functions and powers in the legislature, executive, judicial and financial domains. These powers are expected to uplift the tribal communities especially in the domains of primary education, health, culture, social customs, social welfare, forest, land, agriculture, water management, village administration, and economic and rural development. However, in practice, the performance of the autonomous councils has not come up to the expectations. For instance, the autonomous district councils in the hills failed to set up courts at the village level. The autonomous councils have also been constrained by a lack of adequate coordination with the state government. They have not been able to play a significant role in the planning process at the micro level. Though the Constitution of India envisaged the autonomous district councils as effective instruments of democratic decentralisation, especially among the tribal societies, they
have largely failed to create the institutions envisaged below the level of the district. Further, questions of gender justice have largely been ignored and, consequently, the district councils have failed to ensure a political space for women. In addition, though planning at the district level to ensure overall development of the autonomous district has been one of the fundamental concerns of the district councils, they have failed to create the required institutional mechanism of district planning. The other autonomous councils created by the state legislature have remained substantially weak in terms of ushering in the process of democratic decentralisation. The community-centric autonomous councils witness a tendency of the state to fulfil the political aspirations of the respective communities but they have never been strengthened as institutions of democratic decentralisation ensuring peoples’ participation at the grassroots. The other development councils which are again community-centric have also never been operationalised with the ethos of democratic decentralisation and remain dependent on the mercy of the state government. These institutions have also failed to involve the community at large.
Similar failure is also eminent in the Panchayats. The actual devolution of funds, functionaries and functions is still wanting in the Panchayats. The District Planning Committees lack effectiveness in district planning exercises. These shortcomings have clear implications for the overall governance structure and outcome in the state.
Undoubtedly, the diversities – spatial, demographic and institutional – have significant implications for determining ‘advantages’ and ‘achievements’ of people in making diverse choices in life. Therefore, in understanding and evaluating differential development outcomes, sufficient attention is to be paid to them.

9
Managing Diversities, Achieving Human Development
1.2 Evaluating Development – Focusing on Human Development
Everybody in society desires development. However, every single person differs on the kind of development she or he desires. There exists, therefore, limited consensus with regard to the idea of ‘development’, even though development is universally desirable.
For long, the idea of development has typically been identified with people’s relative affluence in terms of material wealth. Within this idea of development, income essentially serves as an ‘index’ or metric of the level of development; for more income fetches more wealth. Clearly, any specific level of income is indicative of the choice options of people and any increase in income simply implies enlarging people’s choices over commodities. An evaluation of development, in this approach, naturally takes the form of a comparison of levels of income across societies, and such comparison typically requires an evaluation of the levels of per capita income, that is, average income of individuals, across societies.
This approach to evaluating development, however, comes with some serious problems. The most obvious is that associated with the very idea of averages. Statistically, the average is heavily biased towards extreme values – presence of any high or low value readily influences the average in its favour. This brings in the other issue: the distributional aspect of income to which the approach remains mostly indifferent. Even in a highly income unequal society, the per capita approach ascribes higher weight to high per capita income while evaluating development. Further, income as an index of wealth serves well given the prices. The prices of commodities, however, are not always reflective of their real worth in contributing to
personal well-being. Besides these problems, there is a more fundamental and philosophical problem involved in this approach which relates to the ‘ends’ and ‘means’ of development.
The most significant shortcoming of the income approach to evaluating development is that it tends to obscure people from the focus of the development agenda by overwhelmingly emphasising commodities or income. While wealth or income is a necessary ‘means’ to better lives, neither wealth nor income is an ‘end’ in itself. Admittedly, the ‘end’ of a better human life is not limited to amassing commodities or income only; rather, it is about becoming engaged in and performing those activities that are considered worthwhile. In performing such activities, commodities become instrumental no doubt, but it is, indeed, the ability to perform valuable activities that is of intrinsic importance in evaluating the quality of human life. The goal of development, that is, the ‘end’ is, thus, distinguished from the ‘means’ by focusing on the possessed relevance; the ‘ends’ must necessarily possess some intrinsic relevance – all those with instrumental importance have to be classified as ‘means’. If the quality of life is the ‘end’ of development, then an evaluation of development needs to focus on the quality of life and the human development approach essentially tries to achieve this.
In the human development approach, unlike in the income approach, the quality of life of people occupies the centre-stage. Notwithstanding, income, in the human development approach too, has a role to play but the role is instrumental rather than intrinsic. The theoretical underpinnings of the human development approach rest on the capability framework pioneered and developed over a long period of time by Amartya Sen and profoundly enriched and extended by some

10
Assam HDR: Managing Diversities, Achieving Human Development
11 See Sen (1982, 1985, 1987, 1989, 1995, 2000) and Nussbaum (1995, 2000).12 For more on this see Robeyns (2000, 2005).
very distinguished thinkers11. Human life in the capability approach is viewed as a combination of various doings and beings that an individual considers worthwhile and her/his well-being depends on what she/he manages to do or be. The various doings and beings which an individual finds valuable to pursue in life are together called functionings which can range from very basic to quite complex ones. The ability to engage in functionings of diverse types is called capability. The focus of human development lies on expanding the capability of individuals so that their genuine choices over the range of functionings are enhanced. This marks the most fundamental shift from the income approach – while the income approach concerns itself with expanding choices over commodities, the capability approach attaches significance to the expansion of choices over functionings.
It may be noted that the distinction between ‘functioning’ and ‘capability’ is elementary in the capability approach. Typically, a ‘functioning’ is taken as an ‘achievement’ of an individual while ‘capability’ is considered to be the embodiment of her/his ‘real freedom to achieve’. The idea of “freedom” is, thus, central to the capability approach. In this sense, differential ‘achievements’ and hence quality of life or well-being of individuals are results of differential capabilities of individuals which are indicative of differences in ‘real freedoms to achieve’ that individuals enjoy. The evaluation of development, in the human development approach, therefore, is conducted over the space of capabilities.
1.3 Assessing Human Development
It is, thus, clear that the fundamental motivation behind the assessment of human
development lies in evaluating individuals’‘ capability to achieve’ when ‘achievements’ are defined in terms of an array of attainable functionings. The notion of capability, however, is abstract, directly unobservable, but derived from the notion of observable functionings. In a sense, the essence of evaluation of human life on the space of capability lies in critically examining the ‘extent of freedom’ that it reflects. The extent of freedom connotes two constitutive aspects of the capability space, that is, ‘diversity’ and ‘richness’ of functionings contained in it. Diversity relates to the quantitative aspects of the capability space, that is, the number of alternatives available therein. However, the evaluation of diversity of functioning goes well beyond simple counting of the number of alternatives. Indeed, it is the nature or richness or worth of functionings which is more critical in evaluating capability. Recognisably, therefore, notwithstanding the significant distinction between capability and functioning, the evaluation of capability starts with an examination of the nature and value of functionings themselves12.
How can ‘richness’ or ‘worth’ of the functionings be evaluated when individuals are allowed to pursue their own reasons and valuations within the normative framework of the capability approach? This, clearly, requires knowledge and understanding of the contexts and contingencies that shape the individual values and preferences. It is, therefore, essential that the capability assessment be based on a detail information base. The role of information in capability assessment is, indeed, enormous.
Although an examination of functionings and their underlying contexts has its unique significance in capability evaluation, the capability is also to be assessed in its own right.

11
Managing Diversities, Achieving Human Development
There needs to be a way to the capability space from functionings. This is achieved through the Human Development Index (HDI).
The HDI, devised by United Nations Development Programme (UNDP) way back in 1990 is a composite index which attempts to quantify capability. The index is composed of three dimensions – long and healthy life, knowledge, and a decent standard of living – denoting some ‘basic’ capabilities. These basic capabilities are minimally required capabilities for a human life, which effectively describe the deprivation threshold. Each dimension is measured through one or more indicators depicting certain levels of achievements in respective dimensions. Indicators are normalised to obtain dimensional indices which are then aggregated by way of averaging to arrive at the index of human development. The value of the index ranges from 0 to 1 indicating specific capability such that more the value more is the capability. The capability comparison, then, is carried out by comparing the value of HDIs across societies just as the income comparison is carried out by comparing per capita incomes13.
It may be noted that over the years, the methodology of obtaining HDI has undergone several changes. This, in a way, goes on to exhibit the flexibility and dynamism of the approach to adapt itself to emerging changes and challenges.
1.4 Accounting for Diversities
As has been mentioned, in the human development approach, the evaluation of development is conducted over the capability space and, therefore, it is the equality in terms of capability that matters the most. However, equality over the capability space does not necessarily guarantee equality over other spaces. This is not because capability alone determines achievements and well-being, but various ‘means’ and their relations to capability are also important determinants of the level of achievements and well-being. Various means in the forms of commodities and services along with other social contexts including institutions, norms, practices, etc., affect the capability set of individuals as well as their choices, thereby implicating the achieved functionings. The relations between the means and capability
Figure 1.1: Ends and means interface: the capability framework
Figure adapted from Robeyns (2005).
13 More on this can be found in Chapter 8.
Social Contexts/Social Conditions
Preference & Value
Good & Services
• Market Production
• Non-market Production
• Income
ConversionFactors
CapabilitySet
AchievedFunctioning
Choice
12
Assam HDR: Managing Diversities, Achieving Human Development
are hugely diverse and the capability approach acknowledges and accommodates these inherent diversities – both individual and social. These are recognised as conversion factors which can be of three types – personal, social and environmental. Personal factors comprise bodily capacity of individuals, skills, intelligence, etc. Social factors include social structures and norms, culture and customs, public policies, institutions and environmental factors entail climate, geographical location, etc. Having means alone, thus, are not sufficient for functioning; differential functioning may still result due to diverse conversion factors affecting individuals. The wholesome interface is depicted in Figure 1.2.
It is, thus, clear from Figure 1.1 that various personal, social and environmental factors – together called “conversion factors” – mediate between means and ends resulting in differential achievements and well-being. In the capability framework, the notion of ‘advantage’ is used to refer to these diverse conditions and contingencies affecting choice options. The goals of the human development approach are, therefore, two-fold – understanding differential functionings, that is, achievements or well-being from the perspective of capability differentials and also to understand the differential well-being in terms of diversity of advantages. The present report takes this route in assessing the status of human development in Assam.
1.5 Scope and Approach of the Present HDR
Assam published its first Human Development Report (HDR) in 2003. The report highlighted several important aspects of human development in the state besides ranking its districts with regards to HDI, Gender Development Index (GDI) and Human Poverty Index (HPI). These indices offered insights with
regard to the varying degrees of achievements in human development across districts in three basic dimensions of human development: health, education and income.
Since the publication of the first state HDR for Assam, a decade has elapsed and many interventions have on a massive scale have been undertaken with the objectives of making the lives of people better. It is therefore appropriate to come up with the second HDR for the State. While the purpose of the present report is to assess the status of human development and its related aspects in the state, with districts as units of analysis, the scope of the present exercise goes a little further than ranking the districts in terms of human development achievements. The present report attempts to understand the differential human development achievements in different districts in terms of the constituting diversities within the district. This invariably requires disaggregation of information by diversity categories. Since suitably disaggregated information is not readily available for such an analysis, the report is based on primary data.
To allow such an analysis, the sampling methodology has to be statistically robust and needs to accommodate an appropriate design. The districts, accordingly, have been stratified into two sectors: rural and urban. The rural sector is then further stratified into diversity blocks based on spatial features of border, char, flood, tea garden, hills and general. It may be noted that, in certain cases, there are overlaps of more than one diversity categories. Such blocks are stratified as multiple diversity blocks. The sample blocks within a district were then selected at random. In the second stage, villages were selected based on demographic diversities using the Census frame. From the sample villages, households were selected based on economics criteria of monthly per capita consumption expenditure following the

13
Managing Diversities, Achieving Human Development
National Sample Survey Organisation (NSSO) thresholds. The survey was then conducted at the household level.
In the urban sector, based on the urban frame of Census 2011, urban areas were stratified based on size-class and civic status combinations. In the next stage, Census Enumeration Blocks were considered as equivalent to villages in rural areas for selection. In the third stage again, like in rural areas, the NSSO monthly per capita consumption expenditure thresholds were
14 The field work was carried out by officials of the Directorate of Economics and Statistics, Government of Assam, under the guidance and supervision of the Omeo Kumar Das Institute of Social Change and Development (OKDISCD), altogether 201 investigators were engaged with 27 district supervisors. Field training including piloting was conducted by OKDISCD. The process was independently monitored with 2 percent random revisits. The data entry process was fully automated using especially designed software. The entire field work has been standardised to meet the quality criteria.
used for stratifying the households. Selections of households were based on complete house listing of the sample villages. Selections at all levels were random, based on a fixed random number table with proportional allocation of units to each stratum.
The present report is based on a survey of 39,998 households and 187,511 individuals from 27 districts, 97 blocks, 95 urban centres, 1,972 villages and 147 enumeration blocks (sampling details and field work14 is given at Technical Appendix 1).
Table 1.1: Profile of sample households
District Rural Urban TotalBaksa 1188 15 1203Barpeta 1937 201 2138Bongaigaon 783 161 944Cachar 1926 397 2323Chirang 547 48 595Darrang 1105 80 1185Dhemaji 751 66 817Dhubri 2337 279 2616Dibrugarh 1377 345 1722Dima Hasao 211 58 269Goalpara 1050 181 1231Golaghat 1275 142 1417Hailakandi 837 66 903Jorhat 1188 325 1513Kamrup 1672 184 1856Kamrup (M) 265 1562 1827Karbi Anglong 965 152 1117Karimganj 1415 149 1564Kokrajhar 1077 58 1135Lakhimpur 1138 135 1273Marigaon 1044 104 1148Nagaon 2966 507 3473Nalbari 868 112 980Sibsagar 1392 165 1557Sonitpur 2184 255 2439Tinsukia 1323 369 1692Udalguri 1008 53 1061Total 33829 6169 39998

14
Assam HDR: Managing Diversities, Achieving Human Development
The present report adopts a participatory approach. A large number of consultations have taken place at each stage. The process started with a state-level workshop. This was followed by district- and sub-division-level sensitisation workshops in all 27 districts and 31 sub-divisions involving all stakeholders. At the village level, issue based discussions were also held. Besides, several consultations with relevant functionaries were held at different stages.
Figure 1.2: Rural-urban profiles of districts
1.6 Salient Aspects of the Report
The most salient aspect of the present report is that it is based on primary data. This is, in fact, the largest survey ever conducted in the state for development evaluation. The sample size of the survey is about 10 times larger than the size of the sample of typical NSSO rounds and about eight times more than that
UdalguriTinsukiaSonitpurSibsagar
NalbariNagaon
MarigaonLakhimpur
KokrajharKarimganj
Karbi AnglongKamrup (M)
KamrupJorhat
HailakandiGolaghatGoalpara
Dima HasaoDibrugarh
DhubriDhemajiDarrangChirangCachar
BongaigaonBarpeta
Baksa
0%
Urban Rural
20% 40% 60% 80% 100%

15
Managing Diversities, Achieving Human Development
of the National Family Health Survey (NFHS) in the state. As such, the report provides some estimates related to child nutrition, health and educational attainment at state and sub-state levels for the first time. This allows the report to adopt UNDP’s new (2010) method of assessing human development. This is also the first time that a HDR is prepared as per the new UNDP method in the country.
Figure 1.3: Profiles of districts by spatial diversity categories
Another salient feature of the report is that it provides three supplementary indices related to employment-livelihood, vulnerability and subjective well-being. While the first two offer additional information regarding opportunity aspects of the capability space, the third is more concerned about the processes involved in realising the opportunities. Usually, the ‘process aspect’ of freedom is accorded only the
UdalguriTinsukiaSonitpurSibsagar
NalbariNagaon
MarigaonLakhimpur
KokrajharKarimganj
Karbi AnglongKamrup (M)
KamrupJorhat
HailakandiGolaghatGoalpara
Dima HasaoDibrugarh
DhubriDhemajiDarrangChirangCachar
BongaigaonBarpeta
Baksa
0%
Char
Tea Garden
General
Flood Affected
Border
Hills
Multiple Diversities
20% 40% 60% 80% 100%

16
Assam HDR: Managing Diversities, Achieving Human Development
Figure 1.4: Profiles of districts by religious groups
instrumental worth in the capability approach15. Well-being, thus, in the capability approach is considered in an objective sense, that is, what people do and manages to be. Subjective aspects of well-being, that is, ‘satisfaction’ or’ happiness’ that a person gets out of such doings and being are rather opposed to the capability approach. Having a subjective well-being index in a HDR, therefore, merits an explanation regarding its perspective.
Subjective aspects of well-being, that is,‘satisfaction’ or ‘happiness’, however, can be useful in public policy especially when such aspects are evaluated from the overall perspective of service delivery and governance. People sometime manage to do or be what they value but the ways in which these achievements come about may not be valuable to them. Therefore, getting processes right itself may be considered as
UdalguriTinsukiaSonitpurSibsagar
NalbariNagaon
MarigaonLakhimpur
KokrajharKarimganj
Karbi AnglongKamrup (M)
KamrupJorhat
HailakandiGolaghatGoalpara
Dima HasaoDibrugarh
DhubriDhemajiDarrangChirangCachar
BongaigaonBarpeta
Baksa
0% 20% 40% 60% 80% 100%
Hindu Muslim Christian Other
15 See Sen (2003).

17
Managing Diversities, Achieving Human Development
Figure 1.5: Profiles of districts by social categories
valuable achievement. In this perspective, ‘being satisfied’ with the processes happens to be a valuable and relevant functioning for individuals. When satisfaction is brought under the rubric of functionings then the opposition of objective and subjective can be overcome16. Hence, if it is considered that ‘being satisfied’ is a relevant functioning, that is, a valuable aspect of being, then it is quite sensible to include a measure of satisfaction in the vector of
functionings. In this sense, just as being healthy is an important functioning over the capability space, so is being satisfied with the processes a relevant functioning over the same space. Having an index of subjective well-being in the HDR, therefore, simply adds value and does not create conflict. This kind of juxtaposition of ‘objective’ and ‘subjective’ aspects of freedom within the capability approach is an important innovation attempted in this report.
UdalguriTinsukiaSonitpurSibsagar
NalbariNagaon
MarigaonLakhimpur
KokrajharKarimganj
Karbi AnglongKamrup (M)
KamrupJorhat
HailakandiGolaghatGoalpara
Dima HasaoDibrugarh
DhubriDhemajiDarrangChirangCachar
BongaigaonBarpeta
Baksa
0%
SC ST OBC GeN
20% 40% 60% 80% 100%
16 For an exposition on this possibility, see Sen (1987).

18
Assam HDR: Managing Diversities, Achieving Human Development
1.7 Reading the Report
The report is organised in nine chapters. The first chapter introduces the theme and perspective of the report. The second chapter provides human development indicators and indices both at the aggregate and disaggregated levels. This chapter is followed by thee chapters related to three key dimensions of human development: income, education and health. These chapters highlights the various ‘advantages’ and ‘achievements’ of people with respect to the three key dimensions of human development. The sixth chapter highlights sex-biases in these ‘advantages’ and ‘achievements’ along with standard gender-related indicators and indices of human development while the seventh chapter identifies various environmental stressors and vulnerabilities imposing limits over the capability space. The eighth chapter discusses process aspects of freedom in greater detail along with the subjective well-being indices. The last chapter concludes the report with some suggestions regarding the way forward.
It may, thus, be noted that from the third to the fifth, the chapters essentially deal with various functionings and their contexts, that is, under what circumstances people manages to accomplish them. In other words, these chapters describe the ‘richness’ and ‘range’ of ‘functionings’ that people manage to engage in. The sixth and seventh chapters try to provide insights about the social and environmental conditioning influencing the choices over a set of functionings. However, based on the functionings, one has to discern the capability space over which the ultimate evaluation of human development is to be conducted. This has been done in the second chapter where all indices of human development are estimated and discussed. These indices, in a way, are an
abstraction of the capability space, derived from realised functionings as given by a set of indicators. The status of human development in the state is, therefore, provided at various disaggregated levels in terms of the given set of human development indices (see Technical Appendix 2 and 3 for indices and their methods of estimation). The eighth chapter, by emphasising processes, tries to evaluate the comprehensiveness of the development outcomes.
While reading the report, however, two caveats are applicable. Firstly, although, the report comprehensively discusses various functionings across the chapters, they in no way represent the so-called ‘prescribed list of relevant and valuable functionings’. Rather, they are descriptive of various doings and beings of people as observed. Therefore, these serve as a valuable ‘informational base’ for capability evaluation more than anything else. The role of the informational base in capability evaluation is, undeniably, huge17. This, indeed, aptly justifies the need for having a primary survey. The chapters present a range of information regarding realised levels of functionings, their social and economic contexts and conditions of choice and mechanics of people’s valuation over them without, however, making any value statement in general.
Secondly, it may be noted that the present report stresses upon broad policy contours rather than specific policy prescriptions simply because the later would stretch the scope of the report too far. However, some broad policy take-away points have been highlighted the last chapter of the report. Although the report does not attempt to explore causalities underlying the observed trends in detail, it does offer indicative insights as to what could be the possible reasons underlying them. The
17 See Sen (1987), Chapter XI in particular (p.26).

19
Managing Diversities, Achieving Human Development
information and interpretation presented in the report, therefore, need to be viewed in that perspective only. That is if any indicator or index for a district is found to be relatively lower compared to other districts then this fact or information is to be seen together with other information related to it. For instance, if a certain education indicator in a district is found to be low then disaggregated values of that indicator across diversity groups, sex, rural-urban, socio-religious groups need to be examined. The intra-district representation of these disaggregated categories would then offer some insights regarding the low district value of the indicator. To facilitate such interpretation, a detail district profile in terms of the disaggregated categories is also provided. Given the robustness of the
sampling adopted, most of the key indicators and indices have been provided at least for four levels of disaggregation. These four important levels of disaggregation provided in the report based on the survey are: a) sectoral disaggregation of rural-urban; b) disaggregation by spatial diversity categories of char, flood, tea garden, hills, border and multiple diversities; c) disaggregation by religious groups; and d) disaggregation with respect to social categories besides usual disaggregation by sexes. The intra-district diversities are represented by Figure 1.2, Figure 1.3, Figure 1.4 and Figure 1.5, respectively. These offer clues to differential advantages and achievements in human development in the districts which are highlighted in the report.

20
Assam HDR: Managing Diversities, Achieving Human Development
Human Development in AssamAddressing Deprivations and Inequalities2

21
Human Development in AssamAddressing Deprivations and Inequalities
2.1 Introduction
The idea of human development rests on the theoretical foundations of the capability approach. The capability approach is a broad, interdisciplinary and normative framework offering insights as to what constitutes a better human life, and how further betterment may possibly be achieved.
The framework brings about a fundamental shift in development thinking by focusing upon the freedom of individuals to make genuine choices over the kinds of life they consider worth living. It is, indeed, this emphasis on the notion of ‘freedom to achieve’, distinguished from ‘achievement’ itself, that underlines the paradigm shift brought in by the capability approach to the development discourse.
A human life is all about various doings and beings – together called functionings – which in certain ways denote specific levels of realised achievements or well-being. An evaluation of well-being, therefore, necessarily entails an appraisal of varied functionings that people undertake. This appraisal essentially relates to the ‘nature’ and ‘extent’ of functionings which people manage to choose and perform. As a normative approach, the capability approach allows people to pursue their own reasons to justify the choices made. As such, the ‘nature’ of the chosen set of functioning is to be examined by looking at their justifications. The ‘extent’ of functioning, on the other hand, depends on having a greater number of valued opportunities to choose from. These two aspects constitute the central themes of discussion in the subsequent chapters.
The concept of capability signifies the ability of people to engage in various functionings
and the capability space of an individual, thus, is given by all relevant functionings (and their combinations) over which she/he has freedom to exercise choices. The idea of capability is, therefore, reflective of opportunity freedom; hence, expanding the capability, essentially, implies enhancing the freedom of people. Development, in the capability framework, thus, signifies capability expansion – offering people more choices over valuable functionings which, in turn, endow them with greater freedom to choose a life considered more valuable.
Evidently, capability is a derived concept – it is derived from the notion of functionings; only those capability-sets containing ‘relevant’ and ‘valuable’ functionings can be labelled, in turn, as ‘relevant’ and ‘valuable’. Given the normative character of the capability approach, a valuation of functioning assumes central significance. Consequently, two stands emerge – one prefers having a prescriptive set of valuable capabilities while the other is completely averse to having such a predetermined list1. Notwithstanding the distinction, there is an agreement over certain ‘basic’ capabilities which are viewed as minimally required capabilities for a decent life. These capabilities are ‘basic’ because they set the threshold for deprivation.
The ‘basic’ capabilities refer to the ability to perform certain basic functionings, that is, to be educated, to live a long and healthy life and to enjoy a minimally decent standard of life. The realised level of these basic functionings define an achievement level and, hence, well-being. The level of well-being given by the levels of achievement in these three functionings is reflective of the capability. The capability, therefore, can be assessed by an index based on the realised levels of achievements in these three basic functionings.
1 This, in fact, is the major point of departure between Nussbaum and Sen. While Nussbaum prefers a list, Sen does not.

22
Assam HDR: Managing Diversities, Achieving Human Development
2.2 Human Development Index
The UNDP’s HDR is motivated by the idea of quantifying capability through a composite index of human development2. Just as the per capita income ranks countries and societies according to the average level of income, HDI ranks countries and societies according to the average level of capability enjoyed by their people.
HDI has three components denoting three basic capabilities related to health, education and living standard. The realised levels of achievement in the three components are measured by a set of indicators. Over the last two decades, these indicators have undergone several changes to reflect the responsive and evolving nature of the approach. For instance, in the education dimension, indicators of literacy rate and combined gross enrolment ratio have been replaced, in 2010, by mean years of schooling and expected years of schooling. These changes became imperative as countries progressed along literacy and enrolment over the last two decades, reducing the distinguishing power of these previous indicators.
Naturally, the indicators coming from three different domains involve different scales. They, therefore, needed to be normalised, that is, expressed in terms of a common scale before they could be aggregated. The normalisation typically requires a minimum and maximum defining the origin and goal and then putting the observed value in relation to the chosen minimum and maximum. The choice of minimum and maximum, therefore, presents a normative framework of assessing any level of realised achievement.
The aggregation of three dimensional achievements after normalisation provides a composite index. The method of aggregation is, however, extremely crucial. Initially, HDI was obtained by taking the simple arithmetic average along the three dimensions. Despite its elegance, the method faced severe criticism for it allowed ‘perfect substitutions’ among the dimensions. Any loss in one dimension, under a simple average, gets fully compensated by an equivalent gain in any of the other two dimensions. Also, higher achievement in one dimension tends to obscure failure in the remaining dimensions. The UNDP revised the method of aggregation by opting for geometric mean while aggregating the three dimensional values. The method has an implicit normative judgement that improvement in the lowest dimension contributes the most to the improvement in overall human development. This report is based on UNDP’s new method (2010) with some modifications to contextualise the myriad forms of diversities in the state3. The results of the analyses are presented below.
2.3. Human Development Indicators and Indices in Assam
2.3.1 Life expectancy at Birth
The indicator of life expectancy at birth is used to measure the realised achievement in the health dimension, that is, ‘to be able to live a long life’. The life expectancy at birth denotes the number of years that a child can expect to live at the time of birth, given the age-specific mortality rates in the population. The life expectancy, however, is an indicator of very long-term improvement in health.
2 The first ever HDR was published by UNDP in 1990.3 For detail discussion on methodology used in the report, see Technical Appendix 2.

23
Human Development in AssamAddressing Deprivations and Inequalities
In India, data on life expectancy at birth are available through Sample Registration System (SRS) only up to the state level usually disaggregated at the levels of male-female and rural-urban. The latest available SRS data (2006-10) estimate life expectancy at birth in Assam at 62 years (male 61 years and female 63.2 years) putting the state in the bottom echelon4. This low achievement of the state in health functioning is consequent on high infant and child mortality together with high adult mortality in the state since life expectancy at birth depends on an age-specific mortality pattern. Low probability in child survival adversely affects the life expectancy at birth in the state.
Based on HDR survey data, the life expectancy at birth in the state is found to be 54 years5. District level estimates of life expectancy at birth reveal that life expectancy varies widely across districts. The highest life expectancy is estimated in Kamrup (71.88) while the lowest
4 Life expectancy at birth in India for the same period (2006-10) is estimated at 66.1 years. The highest life expectancy is in Kerala (74.2 years). 5 The total number of reported death is 3113 in last 5 years. 95 percent Confidence Interval bounds are given by (53.13, 54.80). The estimates were obtained by standard Chiang method. 6 The higher estimates of life expectancy in these districts are to be considered keeping in mind the smaller number of reported deaths in these districts.
is found in Cachar (40.76). Relatively higher life expectancies are found to be in the districts of Barpeta, Chirang, Dima Hasao, Karbi Anglong, Goalpara and Marigaon6. Similarly, relatively lower life expectancies are found in districts of Baksa, Karimganj, Hailakandi, tinsukia and Sonitpur (Figure 2.1).
The life expectancy in rural areas is found to be lower (53.39) than in urban areas (57.97). Religion wise, it is found that Christians have higher life expectancy (58.37) compared to Hindus (54.62) and Muslims (52.98). Moreover, the life expectancy among Other Backward Classes (OBCs) is found to be much lower (51.75) than the state average (54.0) (Figure 8.2).
Across spatial diversity categories, life expectancy was found to be the highest in the hill blocks (67.42). On the other hand, border, flood-affected and tea garden blocks have been found to be disadvantaged in terms of life expectancies (Figure 2.3).
Figure 2.1: Life expectancy across districts of Assam
Source: HDR Field Survey (2013)
80.00
70.00
60.00
50.00
40.00
30.00
20.00
10.00
0.00
Kam
rup
Barp
eta
Dim
a H
asao
Chira
ng
Karb
i Ang
long
Mar
igao
n
Goa
lpar
a
Dar
rang
Lakh
impu
r
Nag
aon
Jorh
at
Kam
rup
(M)
Gol
agha
t
Kokr
ajha
r
Uda
lgur
i
Bong
aiga
on
Ass
am
Sibs
agar
Dib
ruga
rh
Dhu
bri
Nal
bari
Dhe
maj
i
Soni
tpur
Tins
ukia
Hai
laka
ndi
Karim
ganj
Baks
a
Cach
ar

24
Assam HDR: Managing Diversities, Achieving Human Development
2.3.2 Mean Years of Schooling
Mean Years of Schooling (MYS) is one of the two indicators used to measure educational achievement in HDRs by UNDP. It replaced the literacy rate as an indicator under the education dimension in 20107.
MYS indicates the average number of completed years of education of a country’s population8. Usually, MYS is estimated for populations aged 25 years and older, which is also the indicator used in the calculation of the HDI by UNDP.
Figure 2.2: Life expectancy by religious and social categories
Figure 2.3: Life expectancy by diversity categories
Source: HDR Field Survey (2013)
60
58
56
54
52
50
48
Hindu Muslim Christian SC ST OBC General
7 It may, however, be noted that MYS figured as an indicator under the education component in the HDRs of early years, that is, 1990-94. 8 This typically excludes years spent repeating individual grades.
80.00 –
70.00 –
60.00 –
50.00 –
40.00 –
30.00 –
20.00 –
10.00 –
0.00 – – – – – – – – – –
Hills Char General Assam Multiple Diversities
Border Flood Affected
Tea Garden

25
Human Development in AssamAddressing Deprivations and Inequalities
MYS is derived from data on educational attainment. For obtaining estimates of MYS, distribution of population by age and educational attainment is required at a given point of time. The officially required number of years for each level of education is then applied as a multiplier to the age-education frequency distribution to get the mean years from the distribution9.
Based on the HDR survey data, the MYS for Assam is estimated at 6.1710. Given the normative goal of 15 years which ensures secondary level of schooling11, the present educational achievement in the state is only
about 40 per cent of the goal12. Besides, there is a clear rural-urban divide with MYS in rural areas at 5.70 and that in urban areas at 8.59. The second visible divide is observed in male-female achievement levels: the MYS of males is estimated at 6.93 against the MYS of females at 5.32. Differences in MYS are also prominent along religious and social categories. The MYS amongst Hindus is found to be 6.85 compared to 4.49 amongst Muslims. Similarly, MYS is found to be lower (5.92) amongst SCs compared to other social categories (Figure 2.4).
In terms of MYS, the most disadvantaged section is found to be rural Muslim women –
9 See Barro and Lee (1993, 2010). Also see UNESCO Institute for Statistics (2013).10 It may be noted that the Global HDR 2014 gives the MYS for India as 4.4. 11 The maximum value used for normalisation. 12 This, however, comes with the fact that the estimation is done for individuals aged 25 years and above.

26
Assam HDR: Managing Diversities, Achieving Human Development
their MYS is estimated as a mere 3.3. However, the estimated MYS for rural Muslim women varies widely across districts, the lowest being observed in Darrang (1.55 only) and the highest is found in Sibsagar (7.98). District wise estimates show that MYS ranges from 3.77 to 9.16. The highest MYS of 9.16 is found in Kamrup (M) while the lowest 3.77 is
Figure 2.4: Differential MYS across sex, religion and social categories
Source: HDR Survey (2013).
found in Darrang (Figure 8.5). In terms of MYS in rural areas, Darrang again figures at the bottom with 3.59 followed by Dhubri with 4.09. The highest MYS in rural areas is observed in Sibsagar (8.26) followed by Jorhat (7.20) and Nalbari (7.07). As far as the MYS among females is concerned, the lowest is found again in Darrang (2.87) followed by Baksa (3.51) and Dhubri (3.50). The highest MYS in females is
General
8 –
7 –
6 –
5 –
4 –
3 –
2 –
1 –
0 –Male Female Hindu Muslim Christian SC ST OBC
10.00 –
9.00 –
8.00 –
7.00 –
6.00 –
5.00 –
4.00 –
3.00 –
2.00 –
1.00 –
0.00 –
Kam
rup
(M)
Sibs
agar
Jorh
at
Nal
bari
Dim
a H
asao
Dib
ruga
rh
Nag
aon
Lakh
impu
r
Mar
igao
n
Gol
agha
t
Dhe
maj
i
Barp
eta
Cach
ar
Baon
gaig
aon
Ass
am
Tins
ukia
Chira
ng
Kam
rup
Karim
ganj
Hai
laka
ndi
Karb
i Ang
long
Kokr
ajha
r
Soni
tpur
Uda
lgur
i
Goa
lpar
a
Baks
a
Dhu
bri
Dar
rang
– – – – – – – – – – – – – – – – – – – – – – – – – – – –
Figure 2.5: District-wise estimates of MYS

27
Human Development in AssamAddressing Deprivations and Inequalities
Figure 2.6: MYS across spatial diversity categories
Source: HDR Survey (2013).
obtained in Kamrup Metro (8.35) followed by Sibsagar (7.79) and Jorhat (7.22). This notwithstanding, the highest gender gaps in MYS are also observed in Sibsagar, Kamrup (M) and Jorhat.
Looking at the MYS across spatial diversity categories, it is seen that the estimated MYS is rather low in Char blocks (Figure 2.6)
2.3.3 expected Years of Schooling
The second indicator of educational achievement in HDI is Expected Years of Schooling (EYS) which replaced the gross enrolment ratio in 2010. Nevertheless, EYS is built upon enrolment rates. EYS is a measure of the number of years of schooling a child at the start of his or her education is expected to receive, if current rates of enrolment are maintained throughout the child’s life13. The advantages of using this indicator are that
it represents a measure which takes into account both stock and flow dimensions of the school system and it does not require standardisation in comparing countries or societies with distinct age structures. The indicator is intended to represent knowledge accumulation under the formal school system where higher value of EYS is believed to denote higher accumulated knowledge14.
For Assam, the estimated EYS is found to be 11.85 years15. This indicates that, on an average, given the present enrolment pattern in the state, a child is expected to complete at least the secondary level when he or she starts going to school. There are, however, many divides. The EYS in rural areas is found to be 11.80 which is less than the EYS of 12.20 estimated in urban areas. The EYS for males is found to be 11.72 against that of females which is 11.99. Similar divides are also noticed across religious and social categories (Figure 2.7).
13 See UNESCO Institute for Statistics (2009).14 The fact that EYS overlooks the progression structure and, therefore, sometimes may be misleading is discussed in Rigotti et. al. (2013).15 The maximum value for normalisation is taken as 13 instead of 18 in the UNDP method. This is due to the fact that one is considered to be a child in India up to the age of 18 with a school start age of 6. Therefore, enrolment rates for the age cohort 6-18 are only considered for estimation of the EYS from the survey data. Further it may also be noted that the HDR 2014 (UNDP) gives EYS for India as 11.7 years.
7.00 –
6.00 –
5.00 –
4.00 –
3.00 –
2.00 –
1.00 –
0.00 – – – – – – – – – –
Flood Affected
Assam General Tea Garden
Border Multiple Diversities
Hills Char

28
Assam HDR: Managing Diversities, Achieving Human Development
District level estimates reveal that EYS in the state varies in the range 10.98 to 12.57. The lowest if found in Hailakandi (10.98) and the highest is found in Chirang (12.57). Similarly, tea garden areas and areas with multiple diversities have relatively low EYS compared to other spatial diversity categories (Figure 2.8 and Figure 2.9).
Figure 2.7: Differential EYS across sex, religion and social categories
Figure 2.8: District level EYS
Source: HDR Survey (2013).
Source: HDR Survey (2013).
2.3.4 Income Per Capita Income per capita is considered as an ‘indirect’ indicator of human development. The first HDR of UNDP (1990) observes that an indicator of ‘command over resources needed for a decent living’ requires data on access to land, credit, income and other sources. However, there
12.5 –
12.00 –
11.50 –
11.00 –Male Female Hindu Muslim Christian SC ST OBC General
13.00 –
12.50 –
12.00 –
11.50 –
11.00 –
10.50 –
10.00 –
Chira
ng
Nal
bari
Kam
rup
(M)
Jorh
at
Sibs
agar
Barp
eta
Lakh
impu
r
Dhe
maj
i
Kokr
ajha
r
Gol
agha
t
Karb
i Ang
long
Dib
ruga
rh
Nag
aon
Mar
igao
n
Baon
gaig
aon
Kam
rup
Goa
lpar
a
Baks
a
Ass
am
Soni
tpur
Dar
rang
Uda
lgur
i
Cach
ar
Karim
ganj
Dhu
bri
Tins
ukia
Dim
a H
asao
Hai
laka
ndi– – – – – – – – – – – – – – – – – – – – – – – – – – – –

29
Human Development in AssamAddressing Deprivations and Inequalities
Figure 2.9: EYS across spatial diversity categories
Source: HDR Survey (2013).
12.20 –
12.10 –
12.00 –
11.90 –
11.80 –
11.70 –
11.60 –
11.40 –
11.40 – – – – – – – – – –
General FloodAffected
Hills Assam Char Border MultipleDiversities
Tea Garden
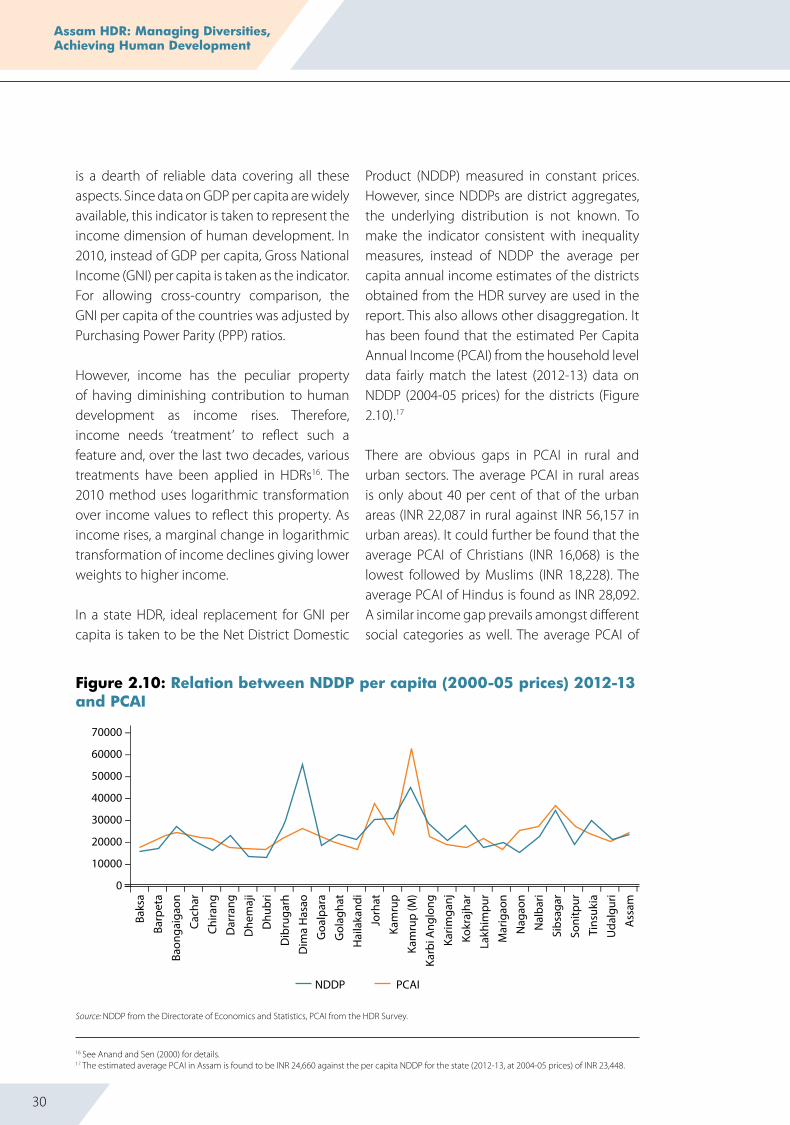
30
Assam HDR: Managing Diversities, Achieving Human Development
is a dearth of reliable data covering all these aspects. Since data on GDP per capita are widely available, this indicator is taken to represent the income dimension of human development. In 2010, instead of GDP per capita, Gross National Income (GNI) per capita is taken as the indicator. For allowing cross-country comparison, the GNI per capita of the countries was adjusted by Purchasing Power Parity (PPP) ratios.
However, income has the peculiar property of having diminishing contribution to human development as income rises. Therefore, income needs ‘treatment’ to reflect such a feature and, over the last two decades, various treatments have been applied in HDRs16. The 2010 method uses logarithmic transformation over income values to reflect this property. As income rises, a marginal change in logarithmic transformation of income declines giving lower weights to higher income.
In a state HDR, ideal replacement for GNI per capita is taken to be the Net District Domestic
Product (NDDP) measured in constant prices. However, since NDDPs are district aggregates, the underlying distribution is not known. To make the indicator consistent with inequality measures, instead of NDDP the average per capita annual income estimates of the districts obtained from the HDR survey are used in the report. This also allows other disaggregation. It has been found that the estimated Per Capita Annual Income (PCAI) from the household level data fairly match the latest (2012-13) data on NDDP (2004-05 prices) for the districts (Figure 2.10).17
There are obvious gaps in PCAI in rural and urban sectors. The average PCAI in rural areas is only about 40 per cent of that of the urban areas (INR 22,087 in rural against INR 56,157 in urban areas). It could further be found that the average PCAI of Christians (INR 16,068) is the lowest followed by Muslims (INR 18,228). The average PCAI of Hindus is found as INR 28,092. A similar income gap prevails amongst different social categories as well. The average PCAI of
16 See Anand and Sen (2000) for details.17 The estimated average PCAI in Assam is found to be INR 24,660 against the per capita NDDP for the state (2012-13, at 2004-05 prices) of INR 23,448.
Figure 2.10: Relation between NDDP per capita (2000-05 prices) 2012-13 and PCAI
Source: NDDP from the Directorate of Economics and Statistics, PCAI from the HDR Survey.
Baks
a
Barp
eta
Baon
gaig
aon
Cach
ar
Chira
ng
Dar
rang
Dhe
maj
i
Dhu
bri
Dib
ruga
rh
Dim
a H
asao
Goa
lpar
a
Gol
agha
t
Hai
laka
ndi
Jorh
at
Kam
rup
Kam
rup
(M)
Karb
i Ang
long
Karim
ganj
Kokr
ajha
r
Lakh
impu
r
Mar
igao
n
Nag
aon
Nal
bari
Sibs
agar
Soni
tpur
Tins
ukia
Uda
lgur
i
Ass
am
– – – – – – – – – – – – – – – – – – – – – – – – – – – –
70000 –
60000 –
50000 –
40000 –
30000 –
20000 –
10000 –
0 –
NDDP PCAI

31
Human Development in AssamAddressing Deprivations and Inequalities
Figure 2.11: Differential PCAI across rural-urban, religion and social categories
Figure 2.12: District level PCAI
STs is the lowest (INR. 21,445) compared to that of other social categories (Figure 2.11).
District wise, the highest PCAI was found in Kamrup (Metro) (INR 63,444) followed by Jorhat (INR 38,664). The lowest PCAI was obtained in Hailakandi (INR 16,632) followed by Dhubri (INR 16,336) (Figure 8.12). In general, it is found that
low PCAIs in border areas, areas with multiple spatial diversities and amongst religious minorities are major downward factors in the income dimension (Table 8A.1, Statistical Appendix).
It could also be found that the average PCAI in all spatial diversity categories is lower than
60000 –
50000 –
40000 –
30000 –
20000 –
10000 –
0 –Rural Urban Hindu Christian SC OBCMuslim Others ST General
– – – – – – – – – – – – – – – – – – – – – – – – – – – –70000 –
60000 –
50000 –
40000 –
30000 –
20000 –
10000 –
0 –
Kam
rup
(M)
Jorh
at
Sibs
agar
Nal
bari
Soni
tpur
Dim
a H
asao
Nag
aon
Baon
gaig
aon
Ass
am
Dib
ruga
rh
Tins
ukia
Kam
rup
Karb
i Ang
long
Cach
ar
Goa
lpar
a
Lakh
impu
r
Barp
eta
Chira
ng
Uda
lgur
i
Gol
agha
t
Karim
ganj
Baks
a
Kokr
ajha
r
Dar
rang
Dhe
maj
i
Mar
igao
n
Dhu
bri
Hai
laka
ndi
6344
4
3866
4
3710
4
2751
627
240
2660
425
884
2516
4
2466
023
364
2334
0
2331
6
2307
6
2305
222
404
2224
8
2182
8
2150
4
2043
6
1978
819
152
1819
2
1804
817
892
1756
8
1719
6
1683
6
1663
2
Source: HDR Survey (2013).
Source: HDR Survey (2013).

32
Assam HDR: Managing Diversities, Achieving Human Development
Figure 2.13: PCAI across spatial diversity categories
the state average. The average PCAI is found to be the lowest in border and hill blocks (Figure 2.13).
2.3.5 Dimensional Achievements
The dimensional achievements in health, education and income dimensions of human development are obtained by normalising the values of respective indicators in each of these dimensions18. These normalised dimensional values reflect levels of achievement given the normative goals in each of the dimensions, that is, how much of distance has been covered towards the desired goals. Typically, a wholesome achievement in human development requires full achievements in all three dimensions. It is, however, possible to have a higher value in the aggregate level driven by any single dimension but surely that cannot be regarded as a balanced human development outcome. The examination of dimensional achievements is, hence, needed for understanding the nature of human development – whether or not the development achieved has been a balanced one.
The dimensional achievement in health in the state reveals that the maximum level of achievement is witnessed in Kamrup (80 per cent of the goal) while the lowest is observed in Cachar (only 30 per cent of the desired goal). In the state, the average achievement level in living a long and healthy life is only about half of the desired level. Further, in 11 of 27 districts, the health achievement is lower than the state average of 50 per cent indicating in several districts achievement levels in health are even less than half of the desired level (Figure 2.14).
On the other hand, the highest dimensional achievement in education is found in Kamrup (M) with about 78 per cent achievement of the desired goal, while the lowest is found in Darrang with only about half of the goal achieved. On the average, the achievement level of the state is found to be a little above two-third of the desired goal. It could also be found that about half of the total districts fall short of the state average in attaining achievements in the educational dimension (Figure 2.15).
18 Methods of normalisation are provided in Technical Appendix 2.
– – – – – – – – –
30000 –
25000 –
20000 –
15000 –
10000 –
5000 –
0 – Assam Flood-
affectedBlock
General Block
Tea GardenBlock
Char Block Multiple-diversity
Block
Hill Block Border Block
Source: HDR Survey (2013).

33
Human Development in AssamAddressing Deprivations and Inequalities
Figure 2.14: Dimensional achievements in health across districts
Figure 2.15: Dimensional achievements in education across districts
Source: HDR Survey (2013).
Source: HDR Survey (2013).
In terms of dimensional achievement in the income dimension, the average achievement level in the state is found to be only at 50 per cent of the goal. The highest achievement (80 per cent of the goal) is observed in Kamrup (M) and the lowest is obtained in Hailakandi
(only 37 per cent of the goal). The levels of achievement in the lower echelon are only about four-10th of the goal. It has been found that the dimensional achievement in income is more than the state average only in eight districts (Figure 2.15).
Kam
rup
Barp
eta
Dim
a H
asao
Chira
ng
Karb
i Ang
long
Mar
igao
n
Goa
lpar
a
Dar
rang
Lakh
impu
r
Nag
aon
Jorh
at
Kam
rup
(M)
Gol
agha
t
Kokr
ajha
r
Uda
lgur
i
Baon
gaig
aon
Ass
am
Sibs
agar
Dib
ruga
rh
Dhu
bri
Nal
bari
Dhe
maj
i
Soni
tpur
Tins
ukia
Hai
laka
ndi
Karim
ganj
Baks
a
Cach
ar
100% –90% – 80% – 70% – 60% –50% –40% –30% –20% –10% –
0% – – – – – – – – – – – – – – – – – – – – – – – – – – – – –
Kam
rup
(M)
Sibs
agar
Jorh
at
Nal
bari
Dib
ruga
rh
Lakh
impu
r
Dhe
maj
i
Gol
agha
t
Barp
eta
Nag
aon
Mar
igao
n
Chira
ng
Baon
gaig
aon
Dim
a H
asao
Ass
am
Kam
rup
Cach
ar
Karb
i Ang
long
Kokr
ajha
r
Karim
ganj
Tins
ukia
Soni
tpur
Goa
lpar
a
Baks
a
Hai
laka
ndi
Uda
lgur
i
Dhu
bri
Dar
rang
100% –90% – 80% – 70% – 60% –50% –40% –30% –20% –10% –
0% – – – – – – – – – – – – – – – – – – – – – – – – – – – – –

34
Assam HDR: Managing Diversities, Achieving Human Development
Figure 2.16: Dimensional achievements in income across districts
Source: HDR Survey (2013).
2.3.6 HDI and the Districts
The HDI is a composite index derived on the basis of dimensional achievements in health, education and income. The HDIs are estimated for the districts19 based on the UNDP’s new method (2010). The index presents the status of human development in the districts. The values of HDI represent how much progress the people have made in overall human development given the pattern of dimensional achievements in the district and the normative goal of capability expansion. The values of the index range between 0 and 1 – where 0 implies no progress made and 1 signifies complete achievement with regard to the normative goals set for the purpose of assessment.
The present report estimates the value of HDI for the state as a whole at 0.557. This tells us that given the desired normative goal, the present level of progress in overall human development in the state is just a little beyond the halfway mark. The highest attainment is observed in Kamrup (M) and the lowest in
Hailakandi. In 15 of 27 districts, the average level of achievement in human development is found to be more than the state average (Figure 2.17 and see Table 2A.4 in the Statistical Appendix).
It could also be seen that, in general, educational achievement is the main driver of overall human development in the state and districts. However, in certain districts, namely, Dima Hasao, Kamrup, Barpeta, Chirang, Karbi Anglong, Goalpara and Marigaon, achievements in the health dimension have contributed substantially to overall human development. Contrary to this, barring the district of Kamrup (M), achievements in the income dimension have remained relatively lower limiting the improvement in overall human development (Figure 2.17).
Further, the PCAI and values of HDI across the districts indicate a clear positive correlation (Figure 2.18). Therefore, improving the HDI requires ensuring income and livelihood of people across the state. Income and
19 See Technical Appendix 2 for details about estimation procedures.
100% –90% – 80% – 70% – 60% –50% –40% –30% –20% –10% –
0% – – – – – – – – – – – – – – – – – – – – – – – – – – – – –
Kam
rup
(M)
Jorh
at
Sibs
agar
Nal
bari
Soni
tpur
Dim
a H
asao
Nag
aon
Baon
gaig
aon
Ass
am
Dib
ruga
rh
Tins
ukia
Kam
rup
Karb
i Ang
long
Cach
ar
Goa
lpar
a
Lakh
impu
r
Barp
eta
Chira
ng
Uda
lgur
i
Gol
agha
t
Karim
ganj
Baks
a
Kokr
ajha
r
Dar
rang
Dhe
maj
i
Mar
igao
n
Dhu
bri
Hai
laka
ndi

35
Human Development in AssamAddressing Deprivations and Inequalities
Figure 2.17: HDI and districts
Figure 2.18: PCAI and HDI in districts
Source: HDR Survey (2013).
employment, thus, emerge as the most significant policy variable for enhancing overall human development in the state. This is, however, not to undermine the significance of the other two dimensions of human development in the state.
Source: HDR Survey (2013).
2.3.7 Locating Assam’s Human Development
The estimated value of HDI indicating the present status of human development in Assam is found to be 0.557. It may be mentioned that
– – – – – – – – – – – – – – – – – – – – – – – – – – – –
Kam
rup
(M)
Jorh
at
Dim
a H
asao
Kam
rup
Sibs
agar
Barp
eta
Chira
ng
Karb
i Ang
long
Nag
aon
Goa
lpar
a
Lakh
impu
r
Nal
bari
Mar
igao
n
Baon
gaig
aon
Dib
ruga
rh
Ass
am
Gol
agha
t
Soni
tpur
Uda
lgur
i
Dar
rang
Kokr
ajha
r
Dhe
maj
i
Tins
ukia
Dhu
bri
Cach
ar
Karim
ganj
Baks
a
Hai
laka
ndi
0.900 –
0.800 –
0.700 –
0.600 –
0.500 –
0.400 –
0.300 –
0.200 –
0.100 –
0.000 –
HDI HI EI YI
70000 –
60000 –
50000 –
40000 –
30000 –
20000 –
10000 –
0 –
– 0.800
– 0.700
– 0.600
– 0.500
– 0.400
– 0.300
– 0.200
– 0.100
– 0.000– – – – – – – – – – – – – – – – – – – – – – – – – – –
Hai
laka
ndi
Baks
aKa
rimga
njCa
char
Dhu
bri
Tins
ukia
Dhe
maj
iKo
kraj
har
Dar
rang
Uda
lgur
iSo
nitp
urG
olag
hat
Dib
ruga
rhBa
onga
igao
nM
arig
aon
Nal
bari
Lakh
impu
rG
oalp
ara
Nag
aon
Karb
i Ang
long
Chira
ngBa
rpet
aSi
bsag
arKa
mru
pD
ima
Has
aoJo
rhat
Kam
rup
(M)
PCAI HDI

36
Assam HDR: Managing Diversities, Achieving Human Development
according to the global HDR (2014), the value of HDI for India is 0.586. Therefore, the present report puts Assam in the band of medium human development states. It may further be mentioned that the HDIs of neighbouring countries of Bhutan and Bangladesh are also in the same band (Map 2.1)20.
20 The indicators and methodology used are comparable.21 Data used in the report belong to year 2007-08 though.22 Data used in the report belong to year 1999-2000.23 The indicators used were Infant Mortality Rate, Adult Literacy Rate and Combined Gross Enrolment Ratio and Net State Domestic Product for calculating the HDI.
Map 2.1: HDI in South Asia (2013)
The National HDR, 2011 provides the value of HDI for the state as 0.44421. This marks an improvement of 15 per cent point over the HDI value of 0.386 for the state given in the National HDR 200122. The comparative picture of the human development outcome in 2011 indicates that Assam’s achievement falls within the category of low HDI in the country (Map 2.2). Besides, the Assam HDR 2003 estimated the HDI for Assam at 0.40723 (Figure 2.19).
Source: Global HDR (UNDP, 2014)

37
Human Development in AssamAddressing Deprivations and Inequalities
Map 2.2: HDI in India (NHDR, 2011 )
Figure 2.19: HDI in Assam (2001-14)
Source: NHDR 2001, ASHDR 2003, NHDR 2011, ASHDR 2014
0.386
2001
0.6 –
0.5 –
0.4 –
0.3 –
0.2 –
0.1 –
0 –
0.407
2003
0.444
2011
0.557
2014
Upto 0.473 (Low) 0.474-0.600 (Medium) Above 0.601 (High)

38
Assam HDR: Managing Diversities, Achieving Human Development
It may be noted that the values of HDI as depicted in the Figure 2.19 are, however, not strictly comparable since the indicators and methods of their aggregation differ fundamentally. The values can only help in locating the overall human development scenario in the state. The values provide an idea about the progress made at different points of time in achieving the aggregate human development outcome relative to the normative goals set at the given points of time. For instance, while the overall progress in human development in 2001 was about 39 per cent of the normative goal set at that period of time, it has been about 56 per cent in 2013 given the normative goal for the year. In this sense, Figure 2.19 suggests that there has been distinct and steady progress towards achieving the desired level of human development in the state during 2001-13.
2.4 Accounting for Inequality: Inequality Adjusted HDI
The foregoing discussions reveal that, at various aggregate levels, that is, districts, rural-urban, male-female, religion, social and spatial diversity categories, the gaps in human development achievements and, hence, in various indices are quite visible. While these gaps indicate the extent of inequality at the average levels of achievement, there is an inherent distributional inequality underlying these average levels of achievements as well. The underlying distributional inequality is reflective of an inequality of opportunities which impedes the capability of individuals. The human development approach is concerned about these aspects; since the publication of the first

39
Human Development in AssamAddressing Deprivations and Inequalities
report of the UNDP, there have been attempts at addressing these concerns24. The UNDP’s new method (2010) proposes a new index which not only takes into account the distributional inequalities in underlying dimensions but also takes the inequalities across the dimensions into consideration, and accordingly accounts the human development index for the extent of inequalities involved both ways – intra as well as inter25. 2.4.1 Aspects Health Inequality
The estimated health inequality in Assam is found to be 0.321. This means that by reducing the inequality in the underlying distribution in health the health outcomes can be improved by about one-third of the present level26. The highest inequality in health is found in Dhubri (0.435) while the lowest is found in Chirang (0.177). Strikingly, there is not much difference in rural-urban inequality (both equal to 0.322).
Figure 2.20: Loss in potential human development due to inequalities involved
Inequality in health is more in areas with multiple diversities (0.385) than in hills (0.243).
2.4.2 Aspects of educational Inequality
The inequality in education in the state found to be rather low (0.088). At the level of district the lowest inequality is found in Dima Hasao (0.045) and the highest in Golaghat (0.120). Amongst the spatial diversity categories the inequality is found more in areas with multiple diversities (0.106).
2.4.3 Aspects of Income Inequality
Compared to health and education, inequalities in income27 in the state are found to be higher (0.441). The income inequality is found to be the highest in Karbi Anglong (0.593) and lowest in Chirang (0.241). The income inequality in rural areas is found to be higher (0.419) than in
24 See Kovacevic (2010) and Alkire and Foster (2010) for details on these aspects. 25 For detail method see Technical Appendix 2.26 This interpretation comes from Atkinson’s Index.27 Measured by inequality over PCAI
– – – – – – – – – – – – – – – – – – – – – – – – – – – –
Soni
tpur
Karb
i Ang
long
Sibs
agar
Jorh
atD
ibru
garh
Tins
ukia
Lakh
impu
rCa
char
Uda
lgur
iA
ssam
Nal
bari
Baon
gaig
aon
Baks
aG
olag
hat
Dhu
bri
Hai
laka
ndi
Dhe
maj
iKa
mru
p (M
)N
agao
nM
arig
aon
Dar
rang
Karim
ganj
Goa
lpar
aKa
mru
pD
ima
Has
aoBa
rpet
aKo
kraj
har
Chira
ng
0.800 –
0.700 –
0.600 –
0.500 –
0.400 –
0.300 –
0.200 –
0.100 –
0.000 –
40.0
35.0
30.0
25.0
20.0
15.0
10.0
5.0
0.0
HDI IHDI Loss %
Source: HDR Survey (2013).

40
Assam HDR: Managing Diversities, Achieving Human Development
urban areas (0.396). Across the spatial diversity categories, inequality in income is higher in the hills (0.530) while in border areas it is the lowest (0.349).
2.4.4 IHDI and Loss of Human Development due to Inequality
The estimated Inequality Adjusted HDI28 depicts the loss of potential human development caused by inequality. It is found that almost one-third of potential human development is lost in the state due to inequalities involved. The
28 See Technical Appendix 2 for details on estimation.
loss is the highest in Sonitpur and the lowest in Chirang (Figure 2.20).
2.5 Multi-dimensional Poverty
In the human development framework, the notion of poverty essentially constitutes multi-dimensional deprivation. Multi-dimensional poverty recognises interactions amongst various dimensions of deprivation and any failure to achieve one dimension results in failures in other dimensions. The Multi-dimensional

41
Human Development in AssamAddressing Deprivations and Inequalities
29 See Alkire and Santos (2010) for details.30 Detail method is given in Technical Appendix 2.
Poverty Index (MPI) offers significant insights into multi-dimensional deprivations – both its magnitude and breadth29.
The MPI takes into consideration the three key dimensions of human development, that is, health, education and living standard, and combines 10 indicators. Based on a joint distribution, it identifies a person as poor when the person is deprived in one-third of the indicators weighted equally over three dimensions30. It provides poverty head-count ratios along with the proportion of population vulnerable to become multi-dimensionally poor. The MPI combines both head-count and average deprivation of the poor (intensity).
It is estimated that 30 per cent of the population in Assam is multi-dimensionally poor with an intensity of deprivation of atleast 4 out of 10 indicators. Further about 17 per cent of people
Figure 2.21: Multi-dimensional poverty head-count, intensity and MPI in districts
are vulnerable to become multi-dimensionally poor. The poverty head-count is the maximum in Darrang with more than half of its population being multi-dimensionally poor. However, the intensity of poverty is the highest in Cachar (45.87) with the poor in the district being deprived of about half of the indicators (Figure 2.21).
Moreover, the incidence of multi-dimensional poverty is found to be the highest in Char areas (44.59) while the intensity is the highest in the hill blocks. The proportion of people vulnerable to multi-dimensional poverty is the highest in flood affected areas (Table 2A.10, Statistical Appendix).
It is further found that lack of six years of schooling, adequate sanitation facilities, access to improved fuel for cooking and housing are the four major areas of multi-dimensional deprivation in Assam.
Source: HDR Survey (2013).
– – – – – – – – – – – – – – – – – – – – – – – – – – – –
Dar
rang
Dhu
bri
Karim
ganj
Hai
laka
ndi
Uda
lgur
i
Cach
ar
Soni
tpur
Goa
lpar
a
Baks
a
Tins
ukia
Mar
igao
n
Baon
gaig
aon
Karb
i Ang
long
Ass
am
Dim
a H
asao
Nag
aon
Kam
rup
Chira
ng
Barp
eta
Kokr
ajha
r
Dhe
maj
i
Gol
agha
t
Lakh
impu
r
Nal
bari
Dib
ruga
rh
Jorh
at
Sibs
agar
Kam
rup
(M)
60.00 –
50.00 –
40.00 –
30.00 –
20.00 –
10.00 –
0.00 –
Head-count Intensity MPI

42
Assam HDR: Managing Diversities, Achieving Human Development
2.6 Combining ‘Objective’ and ‘Subjective’ Aspects
Overlaying of objective well-being given by HDI and subjective well-being given by SWI in the Chapter 8 offers an important insight. Figure 2.22 provides the overlay. It can be seen that both indices for districts are fairly correlated in a positive direction31. This is indicative of the complementarities between ‘opportunity’ and ‘process’ aspects of freedom in achieving human development.
The districts in the first and third quadrants in Figure 8.22 reflect complementarities between the objective and subjective aspects of well-being. The districts located in the second quadrant are suggestive of higher SWI relative to HDI. Similarly, the two districts located in
31 The rank correlation between the two is found to be 0.58.
the fourth quadrant indicate high HDI but low subjective well-being. To understand the relations between objective and subjective well-being of the districts located in the second and the fourth quadrants, one has to examine the ‘drivers’ of well-being in the districts. For instance, the high HDI in Marigaon and Karbi Anglong is primarily driven by high health achievements measured in terms of life expectancies. Contrary to this, low SWI in Marigaon is driven by domains of ecology, education and governance. Satisfaction in the governance domain is also low in Karbi Anglong. Most interestingly, satisfaction over the health domain is the lowest in Karbi Anglong. Additional information provided by the subjective well-being index can be extremely useful in improving the quality of life of people.

43
Human Development in AssamAddressing Deprivations and Inequalities
2.7 Summing up
The forgoing discussion suggests that, on the whole, human development in Assam remains about half way in relation to the desired level. The dimensional achievements differ district wise as well as important diversity wise, that is, spatial, demographic and sector wise. The differential achievements in human development observed in the districts, thus, need to be accounted for these diversities within the districts. Improving income and health emerges as the most critical policy concern. Gainful employment thus assumes the central place in the human development strategy in the state.
Inequalities in opportunity with regard to health, education and income have been pervasive and these result in considerable loss in potential development achievements in the state. The distinct divides in achievements, therefore, are to be bridged to improve overall human development in the state. Notwithstanding this, the various processes of service delivery and governance have significant impact over levels of achievements and those need to be set right for better development outcomes. All these hint at major policy directions in terms of addressing multi-dimensional deprivation and inequality in the state.
Figure 2.22: Overlaying of HDI and subjective well-being index SW
I
– – – –
6.000 –
5.500 –
5.000 –
4.500 –
4.000 –
3.500 –
3.000 –
.400 .500 .600 .700
HDI
Sonitpur
Sibsagar
JorhatGoalpara
BaongaigaonBarpeta
Dibrugarh
Tinsukia
Lakhimpur
Cachar
Udalguri Dima Hasao
Chirang
Kokrajhar
Nalbari
Baksa
Golaghat
Dhemaji
Karimganj
Darrang
Karbi Anglong
Marigaon
Dhubri
Kamrup (M)
Kamrup
Hailakandi
Nagaon
II
III IV
I
Source: HDR Survey (2013).

44
Assam HDR: Managing Diversities, Achieving Human Development
Employment, Income and Standard of LivingGainful Employment is Central to Decent Life3

45
Employment, Income and Standard of LivingGainful Employment is Central to Decent Life
3.1 Introduction
People are both a means as well as an end of development in the human development approach. The ultimate aim of development is to improve the quality of life people live. An improved life is characterised as one in which people have opportunities to choose the most, if not all, of the functionings they consider worthwhile.
People, however, perform not one but a range of activities in life. These activities require, besides health and education, several other ‘means’, including inter alia, ‘command over resources’ which can ensure amenities for a decent life. Command over resources differs from health and education in its role in development. Unlike health and education, the command over resources does not possess any ‘intrinsic’ significance on its own; it only has an ‘instrumental’ significance.
Command over resources, however, is a complex, multi-dimensional idea and depends greatly on several factors including social and institutional structures prevailing in the society. Essentially, it reflects all those basic capabilities which have been unrepresented in the human development approach. Given the complexities involved and limitations in acquiring the required data on income, instead, it is taken as an indirect indicator of it. Income, thus, emerges as one of the key components of human development and deprivation in income can lead to obvious deprivations in other components1.
This chapter discusses the income scenario in Assam in general. It accordingly discusses
various livelihood options as sources of household as well as individual income, the overall employment-unemployment scenario, and the situation on wages and consumption. Besides, the chapter also attempts to highlight aspects of poverty and inequality together with the standard of living in terms of housing and other basic amenities. Analyses have been provided for different levels of disaggregation to facilitate effective policy formulation.
3.2 Labour Market Scenario: Key Indicators
Access to adequate livelihood opportunities is fundamental to human development as poverty, vulnerability, and inequality are essentially the consequence of livelihood opportunities. It is also well accepted that having mere access to livelihood opportunities is not enough; the nature of opportunities is more important. While being gainfully employed or not creates a primary divide in the economy, a secondary divide is created along high or low returns from work together with other security and benefits attached to it. Thus, the extent and nature of employment, and associated trends in returns from employment are crucial aspects in livelihood assessment.
3.2.1 Key Labour Market Indicators
The Census data provide useful insights to set the backdrop of the analysis. As per Census 2011, the Work Participation Rate (WPR) in Assam is 38.4 per cent – male 53.6 and female 22.5 per cent2. In 2001, WPR in the state was 35.8 (male 49.9 and female 20.7 per cent, respectively). During 2001-11, the labour force, that is, the economically capable population
1 The fact that income is an indirect indicator of capability has resulted in different types of treatment given to ‘income’ in the human development approach. The most fundamental point in these ‘treatments’ is to reflect the normative idea that there is a diminishing return to transforming income into human capability. For a detail discussion on this, see Anand and Sen (2000) “Consumption and Human Development”, accessible at http://hdr.undp.org/sites/default/files/sen-amartya_anand-sudhir_consumption.pdf.2 The Census defines WPR as the proportion of total workers (both main and marginal put together) of the total population. Main workers are classified as those having work for more than six months in a year and those with work for less than six months are classified as marginal workers.
Employment, Income and Standard of LivingGainful Employment is Central to Decent Life

46
Assam HDR: Managing Diversities, Achieving Human Development
both employed and unemployed, in the state has grown by 31.7 per cent against the overall population growth of 17.7 per cent. The overall Labour Force Participation Rate (LFPR)3 in the state, on the other hand, has increased by 12.5 per cent during the same period (51.3 in 2011 against 45.6 in 2001)4. The LFPR is found to be higher in urban areas compared to rural areas. It is further observed that growth of the female labour force (41.2 per cent) has been almost one-and-a-half times of the rate of growth of the male labour force (27 per cent) during 2001-11. LFPR is higher than the state average in the districts of Jorhat, Sibsagar, Golaghat, Dibrugarh, Dhemaji, and Baksa, fuelled mainly by a relatively high female LFPR5.
It may further be noted that, during 2001-2011, the LFPR for males increased to 64.9 per cent from 59.2 per cent whereas that for females has risen to 37.1 per cent from 31.2 per cent. The Unemployment Rate (UNER)6 in the state, consequently, has increased from 21.6 per cent to 25.3 per cent – that of males increasing from 17.5 per cent 15.7 percent and that of females from 33.5 per cent to 39.5 per cent. The growth of those seeking employment during 2001-11
stands at 54.4 per cent – that of females being as high as 66.5 per cent. The creation of adequate employment opportunities, thus, emerges as a critical policy intervention to cater to the need of an ever-increasing proportion of job-seeking population – particularly females.
NSSO data also offer useful indications related to the key labour market indicators of LFPR, employment rate and unemployment rate in the state. The data indicate a near stagnant labour market during 2004-11 with the key indicators largely remaining unchanged during the period (Table 3.1). It may, however, be noted that the Census definition of employment and labour force participation is quite different from that used in NSSO employment/unemployment surveys. Nevertheless, both together can indicate broad, general tendencies of overall labour market conditions in the state. Given this, the general tendencies of a stagnant labour market indicated by NSSO data coupled with the indication of an ever-swelling labour force from the Census data effectively underline the major challenge to sustainable human development in the state.
3 LFPR is measured as the proportion of the labour force to the total population.4 The corresponding LFPR at the all-India level is estimated at 49 per cent with wide gender disparity, female LFPR at 35 per cent and male LFPR at 62 per cent as per Census 2011.5 Some of these districts are in the tea plantations belt. About 50 per cent of the workforce in the tea sector is women. 6 UEMR is measured as the proportion of those seeking employment of the total labour force based on the Census B series Table B01.
Table 3.1: Changes in key labour market indicators over NSSO rounds
2004 2011Share in 11+ population Not in Labour Force 62.9 63.3
Unemployed 2.4 5.5Self Employed 23.6 23.2
Wage Employed 11.1 11.0Key parameters LFPR (% of Pop) 37.1 36.7
Employment Rate (% of pop) 34.7 34.2Unemployment Rate (% of LF) 6.5 7.1
Source: Unit level NSSO Surveys on Employment and Unemployment, relevant Years

47
Employment, Income and Standard of LivingGainful Employment is Central to Decent Life
Table 3.2: Hierarchical decomposition of the labour force (in %)
Total population 100.01. Population 6 years and above 90.11.1 Child population (6-14 years of age) 21.51.1.1 Child labourers 3.51.2 Population above the working age limit 8.21.2.1 Employed 78.21.3 Working age population (15-59 years of age) 70.21.3.1 Inactive 43.91.3.2 Active 56.31.3.2.1 Employed 86.61.3.2.2 Unemployed 13.4
Source: HDR Survey, 2013
Given this backdrop, the HDR survey helps depict the livelihood scenario of the state in some details. Table 3.2 provides a summary of the labour market profile based on the survey data.
The overall WPR for all age groups in the state is estimated to be 31.9 per cent. The WPR for males is found as 54 per cent whereas that for females only 9 per cent. A relatively higher male WPR is observed in Dima Hasao (63.2 per cent), Kokrajhar (58.0 per cent), Kamrup Metro (57.6 per cent), Jorhat (57.6 per cent) and Dibrugarh (56.1 per cent) while the female WPR is high in Tinsukia (17.7 per cent), Dima Hasao (17.5 per cent), Dibrugarh (14.8 per cent), Sonitpur (13.6 per cent) and Jorhat (13 per cent) (Table 3A.1, Statistical Appendix).
The HDR survey estimates all age group’s LFPR at 37 per cent at the aggregate with 59 per cent for males and just 15 per cent for females. The total LFPR rate is found to be relatively higher in the districts of Dima Hasao, Dibrugarh, Tinsukia and Jorhat. The rate is relatively low in districts such as Dhubri, Karimganj and Dhemaji. The highest female LFPR is found in the hills district of Dima Hasao followed by tea garden districts of Dibrugarh, Tinsukia, Sonitpur and Jorhat. Across the spatial diversity categories, the
LFPR is found to be higher in hill blocks (39.5 per cent) and tea garden blocks (42.5 per cent) (Table 3A.2, Statistical Appendix). The LFPR is also comparatively higher in the hills (39.5 per cent) and tea garden blocks (42.5 per cent).
The HDR survey estimates the total unemployment rate (considering all age groups) at 13.4 per cent. The estimated unemployment rate for females is 33.9 per cent against 8.0 per cent for males (Table 3.3). A relatively high unemployment rate, particularly among females, affects the LFPR adversely through the discouraged worker effect. Among the districts, unemployment is found to be rather high in Cachar, Dibrugarh, Karimganj, and Dhemaji where more than 16 per cent of willing workers are unable to get gainful employment. Alarmingly high female unemployment rates could be found in districts of Karimganj (58 per cent), Marigaon (56 per cent) and Cachar (54 per cent) (Table 3A.1, Statistical Appendix). Unemployment is higher in the hills and tea garden blocks as also in the flood-affected blocks (Figure 3.1; also see Box 2.1 and Box 2.2).
In order to firm up the estimates of unemployment rates, age group can be restricted to working ages of 15-59. Such ‘firmed up estimates’ are provided in Table 3.3.

48
Assam HDR: Managing Diversities, Achieving Human Development
Figure 3.1: LFPR, employment and unemployment rates by spatial diversity
Source: HDR Survey, 2013
45
40
35
30
25
20
15
10
5
0Char Block Flood-affected
BlockHill Block The Garden
BlockBorder Block Multiple-
diversity Block
General Block
33.936.3
30.8
15.3
39.5
34.1
13.6
42.5
35.7
15.9
36.0
30.8
14.6
35.5
30.0
15.4
36.5
31.8
12.7
30.5
9.8
LFPR WPR UNEMR

49
Employment, Income and Standard of LivingGainful Employment is Central to Decent Life
Table 3.3: Unemployment rates among selected categories
Categories Unemployment Rate by Groups
Group Share Among Unemployed
Total 13.4 100.0GenderMale 8.0 46.9Female 33.9 53.1Age group15-24 37.7 66.025-54 6.4 33.455-59 1.3 0.6ReligionHindu 14.4 74.2Muslim 10.6 21.2Christian 14.4 4.0Buddhist 14.3 0.4Sikh 21.6 0.1Others 15.1 0.1Area of residenceUrban 13.4 15.1Rural 13.4 84.9New FSSUrban Areas 13.4 15.1Char 9.2 8.8Flood Affected 15.2 11.5Hills 13.9 3.4Tea Garden 15.3 18.4Border 14.1 23.2Multiple Diversities 14.7 7.2General 12.3 12.4Level of educationNot literate 5.7 7.8Literate: without formal schooling 5.3 0.6Below primary 8.9 3.2Primary 10.9 13.7Middle 15.2 24.5Secondary 16.5 22.3Higher secondary 21.3 16.8Diploma/certificate course (ITI etc.) 19.5 0.5Graduate (general) 19.2 9.0Post-graduate & above (general) 15.1 1.1Technical/professional degree (medical, engineering, law etc
14.1 0.6
Source: HDR Survey, 2013

50
Assam HDR: Managing Diversities, Achieving Human Development
It may be observed from the Table 3.3 that, category wise, most of the unemployed are located in rural areas, are female, in the age group of 15 to 24 years, border areas and tea gardens. The UNER is particularly high in tea gardens, border areas and flood-affected areas and also among educated youths. Clearly, alarmingly high UNER amongst
the youth (15-24 years) presents a major challenge to policy interventions. The youth (15-24 years) UNER among males is 26.4 per cent and that among females is found to be as high as 69.8 per cent. It is further observed that youth unemployment is relatively higher in urban areas than in rural areas and also in tea garden blocks (20.8 per cent).
Box 3.1: Focus on human development in the tea plantation sector
There are indications that the labour situation in the tea plantations of Assam has worsened in recent years. Rising casualisation of the workforce in the tea estates and emergence of a flexible production structure (on the labour front) in the form of small tea gardens reveal that competitiveness in the ailing tea sector is presently viewed as reducing labour costs and avoiding mechanisms and legalities that ensure labour welfare. The tea management often points at low labour productivity and subsequent rise in labour costs as the reason for under performance of the tea sector. Attendance registers of the workers in tea estates also indicate high rate of absenteeism from work. Determinants of this could be poor health (indicated by estate hospital registers) of the workers and lack of enthusiasm for work. There is need to assess to what extent the prevailing wage structure (though revised at timely intervals) and the associated pecuniary and non-pecuniary benefits ensured by the Plantation Labour Act, 1951 are helping to workers lead a decent life on plantation estates.
The supply of work in the tea plantations depends on field productivity. Rising field productivity raises the demand for more work hours which can be ensured by more labour absorption or by extending work hours with adequate incentives. The rise in productivity is again dependent on how efficiently the management uses its acreages by maintaining the re-plantation norms, applying inputs in optimum quantity and following specified guidelines. Data on re-plantation norms, decline in tea acreages under bearing and stagnant productivity do not support a promising picture of Assam’s tea estates. Overall, we observe a vicious cycle of low performance, low return and poor labour standards.
The state by now has well perceived the significance of ensuring field productivity. The Government of India has come out with schemes for extending financial support to ailing tea estates for rejuvenation and to arrest the trend of declining productivity and quality. The issue now is how these approaches will help labourers? Will all these steps make the sector efficient enough to absorb more labour and ensure that field productivity is right enough to guarantee high labour productivity and decent benefits? It is likely that field productivity of tea estates would improve with such interventions. It is also a fact that, in the foreseeable future, Assam’s tea sector will not face a crisis of labour supply (there are enough impoverished workers agreeing to work at low wage). In such a situation, we do not expect a fair labour standard unless there are serious interventions from the state.
Source: Excerpt from Das, K. (2013, 10 January.) “Focus on Human Development in Assam’s Tea Plantation, Seven Sisters’ Post.

51
Employment, Income and Standard of LivingGainful Employment is Central to Decent Life
3.2.2 Occupational Diversification, Nature of employment and earnings
An important indicator of the employment and livelihood situation in an economy is the change and diversification of the occupational pattern. The most stylised concomitant of economic progress is the movement of labour from agriculture to manufacture, and from manufacture to commerce and services7. This transformation is also visible in India – over the
Box 3.2: Migration as a coping strategy
Migration due to the floods, erosion and sand deposition from villages for employment has now become a significant phenomenon in Assam. A large number of youth are migrating to distant places looking for jobs in plywood and rubber factories of Kerala, security services jobs in Tamil Nadu, coal mines in Meghalaya, to name a few. Movement to some of the remotest areas of the country is unheard of but it has become a common phenomenon revealing constraints faced in the domestic labour market to absorb workers.
Interaction with some workers revealed that a lack of avenues for regular and decent sources of income back in their villages and neighbouring towns has forced them to move to Kerala. The workers enjoy their jobs, employment and labour market security in Kerala. The workers, though they work in an unregulated environment where the minimum wages and other pecuniary and non-pecuniary benefits are not ensured, enjoy their acceptance in industry and societies as they are not looked down upon as migrant workers (informal discussion with Prof. D. Narayana of State Planning Board, Trivandrum too reveals this. Prof. Narayana is the co-author of the report on Domestic Migrant Labour in Kerala, Labour and Rehabilitation Department, Government of Kerala, 2013). The workers are happy to earn a decent amount through their hard work and support their families back home.
The endeavour and struggle made by the youth in the distant land opens up some significant issues for the state of Assam. The state enjoys enough provisions in industrial subsidies and concessions but has failed to create adequate sustainable employment avenues. There is depletion of forest resources, which had compelled the Supreme Court to impose a ban on timber felling. The consequences of closure of hundreds of saw mills and wood factories in the state are well known. There are numerous examples how the state has failed to address sustainable use of resources from saving the paddy fields from negative externalities of flood and sand deposition to resource-based job sectors through effective policies and plans.
*Excerpt from Das, K. and D. Chutia (2011, February 6) “Outward Bound”, Assam Tribune.
The above discussion on the overall labour market situation in the state indicates several broad tendencies and, consequently, throws up some fundamental challenges. An ever increasing labour force, low labour force participation rate and increasing UNER, particularly among females and youth, bear far reaching implications for society at large. The worrisome situation finds expression in employment related out-migration from the state as a negotiating strategy adopted by considerable section of people (see Box 3.2).
7 See, for instance, Clark (1941) and also Kuznets (1966).

52
Assam HDR: Managing Diversities, Achieving Human Development
years, more and more people have shifted out of the agricultural (and primary) sector entering secondary and tertiary sectors, although the trend tends to bypass the manufacturing sector. Consequently, the share of primary sector workers of the total is showing a secular decline over the years.
Such a shift in occupations is also visible in the state as revealed by the National Occupational Classification (NCO 1-digit Codes, (Table 3.4)). There is a discernible tendency of people moving out of agriculture and there is a perceptible increase in myriad service-related occupations. What is more worrying is the fact that the share of white collar jobs has remained
Table 3.4: Changes in occupational classes over NSSO rounds, Assam
Occupation Groups 2004 2011Shares in Workforce1. Technical & Professional 7.4 6.52. Administrative & Managerial 1.2 1.53. Clerical 2.0 3.14. Sales 10.5 11.55. Service 2.7 11.66. Farmers 63.9 44.47. Production 1.2 7.48. Transport 2.3 2.39. Others 8.8 11.6White Collar Jobs (1+2) 8.6 8.0Pink Collar Jobs (3+4+5) 15.2 26.2Blue Collar Jobs (6+7+8+9) 76.2 65.7
Source: Unit level data from NSSO Surveys on Employment and Unemployment, NSSO, Various Years
Table 3.5: Distribution of workforce by occupational category
Occupation Male Female TotalAgriculture & Allied 28.7 13.7 26.6Agricultural Labourer 2.7 4.0 2.9Daily Wage Earner 30.1 33.6 30.6Petty Business/Self-employed 15.4 9.9 14.6Trade/Business 5.0 1.5 4.5Salaried Service (Regular) 10.3 22.3 12.0Salaried but casual 7.8 14.5 8.7Total 100.0 100.0 100.0
Source: HDR Survey, 2013
almost stagnant over the past years, and almost all the decrease in blue collar jobs has been accommodated by commensurate rise in pink collar jobs, raising doubts about the quality of the occupational shift witnessed in the state.
The HDR survey data on occupation reveal that most of the working population is engaged as daily wage earners (30.6 per cent) while 26.6 per cent is engaged in agriculture and allied activities (Table 3.5).
In the human development context, nature, regularity, and returns from work are more important than mere availability work. It has been long argued that the poor can hardly afford

53
Employment, Income and Standard of LivingGainful Employment is Central to Decent Life
to remain idle and, therefore, both observed LFPR and employment rates tend to be higher in poorer societies, though most workers in these cases are engaged in low-paying work, mainly self-employment and in family enterprises, which also include petty vending activities. This is revealed in the HDR survey as well and it is observed that more than 80 per cent of the non-agricultural sector (including livestock) workers in Assam are either self-employed or work as casual labour. Only about 14 per cent of the workers are engaged in regular wage jobs (Table 3A.3, Statistical Appendix). Casual workers are evidently prominent in tea garden, border and char blocks. Among the religious
communities, the percentage of casual workers is high among the Muslims and Christians (Table 3A.4, Statistical Appendix).
Earnings from various employment options vary according to the nature of employment. It could be observed from the HDR survey that, on the average, earning from permanent work – both in the agricultural and non-agricultural sectors – is significantly higher than all other categories. Inequality is also highest among permanent workers. Earnings from agriculture are the lowest among all types of employment, primarily because of the nature of agriculture pursued in the state (Table 3.6).

54
Assam HDR: Managing Diversities, Achieving Human Development
Table 3.6: Earnings and earning inequality by nature of employment
Nature of employment Non-agriculture AgricultureCasual workerMedian earnings (INR/Month) 3,791.7 4,000.0Gini coefficient for earnings 38.9 35.0Theil index for earnings 44.3 36.7Permanent workerMedian earnings (INR/Month) 15,000.0 7,541.7Gini coefficient for earnings 48.7 46.2Theil index for earnings 59.6 36.9Self-employedMedian earnings (INR/Month) 5,333.3 5,137.5Gini coefficient for earnings 44.1 43.3Theil index for earnings 49.7 47.5AgricultureMedian earnings (INR/Month) 916.7Gini coefficient for earnings 46.3Theil index for earnings 47.1
Source: HDR Survey, 2013
8 From the flood-affected area, we now observe massive out-migration of youth for employment. The higher income may because of the remittance.
Given the nature of employment and earnings from various employments, the economic situation of households in terms of household income may be arrived at. The HDR survey estimates the average monthly per capita income in the state as INR 2,000. It is however, observed that variations exist in the estimates across districts and spatially diverse categories. The estimated average monthly per capita income is highest in Kamrup Metro (INR 5,287) followed by Jorhat (INR 3,222) and Sibsagar (INR 3,092). On the other extreme, the reported monthly income per capita is less than INR 1,500 in Hailakandi, Marigaon, Dhubri, Dhemaji, and Darrang. Monthly income levels are relatively lower in the border areas (INR 1,499) and hill blocks (INR 1,505) compared to the general blocks (INR 2,168), but flood-affected blocks (INR 1,967) show relatively higher income8. Income amongst the Muslim (INR 1,519) and Christian (INR 1,339) households is found to be comparatively low (Table 3A.5 and Table 3A.6, Statistical Appendix).

55
Employment, Income and Standard of LivingGainful Employment is Central to Decent Life
Box 3.3: Regulatory constraints in the unorganised manufacturing sector
The all-India census of small scale industries (2001-02) had revealed that about 42 per cent of registered units in Assam was found to be closed in the third census. The focus was on three main causes of closure – the problems of market access, lack of required finance and competition faced in the market. These three reasons seem to be universal for the entire small and unorganised manufacturing sector in the country. Overall, small scale entrepreneurs need information on market access, small-time finance on working capital and development of their capability to produce quality products, creating their own niches. In many instances, to procure working capital and raise finances for daily living, the micro entrepreneurs sell their products at a throw away price. An exploration of all traditional manufacturing sectors of the state would reveal a similar phenomenon. In addition to these three factors, making raw materials and inputs available at appropriate prices remains as a prime issue.
For example, the rich handloom sector of the state, which has immense potential to add value and employment, is now trapped in a crisis. The National Textile Policy, 2000 states that handlooms must produce for upper end markets to overcome competition from cheap products of power looms and mills. The constraint faced by petty weavers at present is more from supply of yarn to add value and sustain their livelihood. India, overall, has an annual demand of 32,000 mega tonne (MT) of raw silk. Production of mulberry raw silk in India during 2013-14 was about 19,500 MT. During 2009-10, India imported about 12,500 MT of silk, mostly from China (Final Report: National Fibre Policy Sub-Group on Silk, 2010-11), though import had declined to 4000 MT in 2013-14. In the silk weaving hub of Sualkuchi in Assam, there are severe shortfalls of yarn, as production of mulberry and non-mulberry silk of Assam is meagre at 27 and 126 MT, respectively. This cannot even meet one-fourth of the demand of the looms, revealing reliance on imported silk. Evidence reveals a positive impact of the inflow of Chinese yarn in terms of raising the opportunity to weave and add value. On the regulatory front, the Government of India however has been apprehensive about the inflow, because of the probable impact of the dumping and import of cheap Chinese silk on the internal growers of mulberry silk (Ministry of Commerce and Industry, 2003). The fallout of this is that now the landed price of imported Chinese yarn accounts for 31 per cent import duty, and the present price of silk at the local market is about INR 4,000 per kilogram (Annual Report, Central Silk Board, 2013-14). Notification on the imposition of anti-dumping duty on Chinese silk came in September 2003 after investigations on anti-dumping by the Ministry of Commerce and Industry. In January 2012, the Government of India further extended the anti-dumping duty for the next five years. The pegging up of the price through imposition of the duty affected production of the silk weaving hubs.
*Source: Das, K. (2012) Understanding Sluggish Industrialisation Process in Northeast India, Research Paper Series 2, OKDISCD, Guwahati.

56
Assam HDR: Managing Diversities, Achieving Human Development
We also need to look at productivity/remuneration in different sectors/occupations as reflected by per worker returns to suggest policy directions. It is observed that per worker return is highest from livestock (INR 62,340), partly because of the low number of workers directly involved and partly because of the higher value of products in recent times. Per worker monthly return is lowest in agriculture (INR 2,629, especially in Marigaon (INR 1,480), Lakhimpur (INR,1662), Dima Hasao (INR 1,693) and Bongaigaon (INR 1,671). A relatively higher per worker return from agriculture is obtained in Darrang (INR 5,028), Chirang (INR 4,169), Cachar (INR 3,556), Karimganj (INR 3,529) and Tinsukia (INR 3,804).
Self-employment has a per worker return of about INR 7,000 per month. Casual jobs provide a return of INR 4,000 while permanent salaried jobs provide more than INR 16,000. In certain pockets of the state, intensification of agriculture and farm activities has yielded better returns. On the other hand, the diminishing scope in land-based activities along with poor returns has forced some households to diversify their income and yield better returns.
3.3 Poverty Scenario
In India, official poverty line is indirectly obtained from Monthly Per Capita Consumption Expenditure (MPCE) based on a fixed calorie norm. As such, poverty in India is, essentially, consumption poverty and it relates to deprivation in one of the most fundamental functioning, that is, to be able to live and be nourished. However, the motivations behind consumption are many: they range from ‘nourishment to amusement, from living long to living well, from isolated
self-fulfilment to interactive socialisation’9. Although consumption is not an ‘end’ in itself, it is an important, indeed, an elementary functioning in human life. Any deprivation on the consumption front must necessarily result in deprivations in a series of functionings.
The poverty rate (that is, the poverty head count ratio) in Assam, as per the official poverty line, was estimated at 30 per cent in 2011-12 with rural poverty being at 33.9 per cent and urban poverty at 20.5 per cent10. In 2004-05 the total poverty rate in the state was 34.4 per cent – the rural poverty rate being 36.4 percent and urban being 21.8 per cent.
The HDR survey collected information on household level consumption expenditures both on food and non-food items. The average MPCE on food is found to be INR 710.22 in the state. The urban MPCE on food is found to be INR 1,185.71 which is almost twice the MPCE on food in rural areas (INR 622.12). The average total MPCE (food and non-food) in the state is found to be INR 1,284.32; that of rural areas being INR 1,060.74 and of urban areas INR 2,491.15. It may be noted that the average MPCE in the lowest decile is found to be even lower – only INR 436 in rural and INR 478 in urban areas. Further, data show that, in rural areas, households spend 58.6 per cent of the total expenditure on food and, in urban areas, the proportion is 47.6 per cent. Moreover, there are wide district variations as well (Table 3A.7, Statistical Appendix).
Given this pattern of consumption expenditure, the HDR survey estimates the poverty headcount ratio in the state at 37 per cent11. Estimates reveal that poverty is substantially high in rural areas at 40.5 per cent compared to
9 See “Consumption and Human Development” by Anand and Sen, accessible at http://hdr.undp.org/sites/default/files/sen-amartya_anand-sudhir_consumption.pdf (accessed on 6 October 2014).10 Using the Tendulkar Method. For comparability and consistency, the analysis is based on the Tendulkar Method. 11 Poverty levels are calculated as HCR by taking the Tendulkar Committee recommendations on the Poverty Line. If the more recent Rangarajan Committee recommendations are used then poverty rates would be higher.

57
Employment, Income and Standard of LivingGainful Employment is Central to Decent Life
just 17 per cent in urban areas. Poverty is also higher among STs compared to the general caste households (Figure 3.2).
In case of spatial diversity categories, it is observed that poverty is the highest in the hill blocks, followed by Char blocks (Figure 3.3).
Figure 3.2: Poverty rates in assam by rural-urban and social category (%)
Source: HDR Survey, 2013
– – – – – – – –
45 –
30 –
15 –
0 –Total Rural Urban SC ST
Social Group
OBC GEN
36.036.5
40.537.5
17.0
40.537.0

58
Assam HDR: Managing Diversities, Achieving Human Development
Figure 3.3: Poverty rates in Assam by spatial diversity categories (%)
Source: HDR Survey, 2013
Assam Total
Others
Christian
Muslim
Hindu
General Block
Multi-diversity Block
Border Block
Tea Garden Block
Hill Block
Flood-affected Block
Char Block
Relig
ious
Gro
ups
Geo
-spa
tial R
egio
n
| | | | |
10.0 20.0 30.0 40.0 50.0
42.6
36.4
44.7
37.6
38.9
40.8
39.5
33.4
39.7
44.0
26.5
37.0
0.0

59
Employment, Income and Standard of LivingGainful Employment is Central to Decent Life
Figure 3.4: Asset poverty in Assam: rural and urban (% households)
Source: HDR Survey, 2013Note: HH: household.
Contrary to the common perception, poverty is found to be relatively low in flood-affected blocks. The flood-affected areas of the state show large-scale outmigration of people for employment12 and this might have dampened the poverty impact. Besides, poverty is also found to be higher among religious minorities, that is, Christians and Muslims compared to Hindus.
It is further revealed that there are significant variations in poverty rates across districts. Poverty is significantly higher in Darrang (45.5 per cent), Marigaon (44.5 per cent), Golaghat (43.5 per cent), Udalguri (43.0 per cent), Karbi Anglong (42.5 per cent), Dhubri (41.5 per cent), Chirang (41.5 per cent), Baska (41.0 per cent) Sonitpur (40.5 per cent) and Goalpara (40.5 per cent). On the other end, poverty is relatively lower than the state average in Kamrup Metro (3.5 per cent), Bongaigaon (31.5 per cent),
Cachar (31.5 per cent), Dibrugarh (31.5 percent) and Sibsagar (32.0 per cent) (Table 3A.8, Statistical Appendix).
3.3.1 Asset Poverty
While poverty measures through income and/or consumption levels are widely used and universally acknowledged, this is by no means an exhaustive measure, especially in developing societies plagued with multi-dimensional deprivations. As such, deprivations in other dimensions of standard of living such as a lack of specific household assets, land ownership, proper housing, and housing amenities like electricity, drinking water, toilet, etc., are also needed to be considered to assess the extent of deprivation and overall standard of living. It is believed that asset poverty reflects long-term poverty in a household13.
12 Das, K. and Chutia, D. (2011) Outward Bound, The Assam Tribune, 6 February. 13 Mckay, A. (2009) Assets and Chronic Poverty, Background Paper, Working Paper No. 100, Chronic Poverty Research Centre, University of Sussex, Brighton.
Aggr
egat
e
No Financial Asset
No HH Appliances
No Transport Asset
No Nonagricultural Asset
No Agricultural Asset
No Financial Asset
No HH Appliances
No Transport Asset
No Nonagricultural Asset
No Agricultural Asset
No Financial Asset
No HH Appliances
No Transport Asset
No Nonagricultural Asset
No Agricultural Asset
Urb
anRu
ral
| | | | | |
20.0 40.0 60.0 80.0 100.0 120.0
26.9
23.8
85.5
64.5
35.7
97.0
96.4
26.9
7.1
16.8
69.6
87.2
24.3
23.8
32.8
0.0

60
Assam HDR: Managing Diversities, Achieving Human Development
The HDR survey data reveal that about 10.8 per cent of rural households and 4.5 per cent of urban households do not possess household assets of any kind. This represents the incidence of acute long-term poverty in rural and urban areas of the state. About 65 per cent of rural households do not possess any agricultural asset, such as ploughs, bullock carts, farm equipment, etc. It is also found that 85.5 per cent of rural households do not have any non-agricultural productive assets such as handloom or power-loom either. In urban areas, about 27 per cent of households do not own any vehicle/means of transport including bicycles. This figure is 23.8 per cent in rural
areas. Further, about 35 per cent households in the state as a whole do not have any financial assets or insurance (Figure 3.4).
Among the spatial diversity categories, asset poverty is especially acute in the Char blocks, border blocks, and multi-diversity blocks (Table 3A.10, Statistical Appendix). Besides, the intensity of asset poverty is prominently visibly in the districts of Dhubri, Cachar, Darrang, Hailakandi, Karimganj and Marigaon. It is also seen that intense asset poverty is relatively high in rural areas. However, urban asset poverty is outstandingly visible in Goalpara, Kokrajhar, Nalbari and Lakhimpur (Figure 3.5).
Figure 3.5: Intensity of asset poverty in districts
Source: HDR Survey, 2013
Total Urban Rural
Kamrup (M)Chirang
JorhatGolaghatDhemaji
Karbi AnglongBongaigaon
SibsagarBaksa
LakhimpurSonitpur
DibrugarhNalbari
NagaonKokrajharGoalpara
BarpetaUdalguriKamrupTinsukia
Dima HasaoMarigaon
KarimganjHailakandi
DarrangCacharDhubri
–––––––––––––––––––––––––––
| | | | | | |
0.0 5.0 10.0 15.0 20.0 25.0 30.0

61
Employment, Income and Standard of LivingGainful Employment is Central to Decent Life
Figure 3.6: Agricultural landlessness in rural areas of Assam (% household)
Source: HDR Survey, 2013
3.3.2 Land Holding in Rural Areas
Access to land is extremely critical for income and livelihood security of households, particularly in rural areas. It serves as a
measure of productive capital, collateral for loans, a measure of prestige and power in the villages. Moreover, land ownership is a crucial determinant of socio-economic status.
Nal
bari
Dhu
bri
Cach
ar
Karim
ganj
Baon
gaig
aon
Hai
laka
ndi
Uda
lgur
i
Baks
a
Barp
eta
Soni
tpur
Kam
rup
(M)
Dar
rang
Tins
ukia
Kam
rup
Goa
lpar
a
Ass
am
Dib
ruga
rh
Chira
ng
Nag
aon
Kokr
ajha
r
Dim
a H
asao
Mar
igao
n
Gol
agha
t
Lakh
impu
r
Sibs
agar
Jorh
at
Karb
i Ang
long
Dhe
maj
i
80.0 –
70.0 –
60.0 –
50.0 –
40.0 –
30.0 –
20.0 –
10.0 –
0.0 –

62
Assam HDR: Managing Diversities, Achieving Human Development
From the HDR survey it is found that 48.5 per cent of households in rural Assam do not own any agricultural land. Landlessness is marginally higher in the Char areas and amongst Muslims (Table 3A.14, Statistical Appendix). District-, wise, the incidences of agricultural landlessness are higher in Nalbari, Dhubri, Cachar, Karimganj and Bongaigaon and relatively lower in Dhemaji, Karbi Anglong, Jorhat and Sibsagar (Figure 3.6). It is further observed that average cultivated land per household in rural Assam is about 3.2 bigha (0.4 hectare) while the per capita agricultural land is found to be 0.68 bigha (0.09 hectare). In per capita terms, agricultural land holding is marginally better amongst the STs (Table 3A.16, Statistical Appendix). Small and uneconomic holdings of agricultural land naturally impede productivity growth and income from the sector. In addition, as is evident from the data, it is found that, in all districts, a lack of irrigation is a major constraint in agricultural development in rural areas. It is found that only one-seventh of the per capita holdings has access to irrigation facilities. In addition to the size of the land holding, the quality of land also has become a prime issue in the state. In many flood-affected areas of the state, there are cases of land degradation caused by sand deposition14. Moreover, the use to which land is put has implication for the out turn. The altitude or relief of the land too leads to differentiated returns.
3.4 Standard of Living
Gainful employment and sustained decent income are fundamental in eliminating poverty and improving standards of living. Sustained decent income is not only essential for
improving the standard of living but also quality of life of people reflected in enhanced capability. The foregoing sections discuss some important aspects of employment, income and poverty situations in Assam. In the following sections, some aspects related to the living standard are provided while subsequent chapters propose to deal with long-term improvements in the quality of life of people in the state.
3.4.1 Housing and Household Amenities
Typically, the type and condition of house and amenities available in a household are considered indicative of the living standard. The HDR survey reveals that 22.7 per cent of the population dwells in pucca houses while a majority (43.7 per cent) live in kutcha houses. In rural areas, 48 per cent of people live in kutcha houses. Kutcha houses are predominantly existent in the districts of Karbi Anglong, Dima Hasao, Hailakandi, Golaghat, Darrang, and Udalguri (Table 3A.18 & Table 3A.19, Statistical Appendix)15.
It is further found that 32 per cent of households in Assam are not electrified (Figure 3.7). The proportion of non-electrified households is higher in rural areas (36 per cent). Access to household electricity is particularly poor in Hailakandi (74.1 per cent), Nalbari (57.9 per cent), Sibsagar (58.2 per cent), Marigaon (46.8 per cent), Dhubri (52.8 per cent), Darrang (47.2 per cent) and Goalpara (43.1 per cent). The percentage of non-electrified households is high in the Char blocks (47.1 per cent) and in blocks characterised by multiple diversities (46.4 per cent)16.
14 Das, K. (2012b), Farm Productivity Loss due to Flood Induced Sand Deposition: A Study on Dhemaji, India, South Asian Network for Development and Environmental Economics, Kathmandu.15 Kutcha houses, however, in all circumstances cannot be considered as a major indicator of deprivation. For example, in certain localities of the state and in the hill districts, kutcha houses may be a norm. The house listing operation of Census 2001 of India saw a major shift in approach to account houses as good, liveable and dilapidated. In Census 2011, 10.9 percent of households in the state have been recorded as dilapidated houses. The percentages for Karbi Anglong (4.2), Dima Hasao (4.1), Golaghat districts (7.5) and Udalguri (10.5) are lower than the state average but higher in Hailakandi (16.1) and Darrang (17.2). 16 In Assam, 85.3 per cent of villages have electricity connections (Government of Assam, 2013). A significant percentage of households not having electricity connections raises the issue of affordability to acquire the connection.
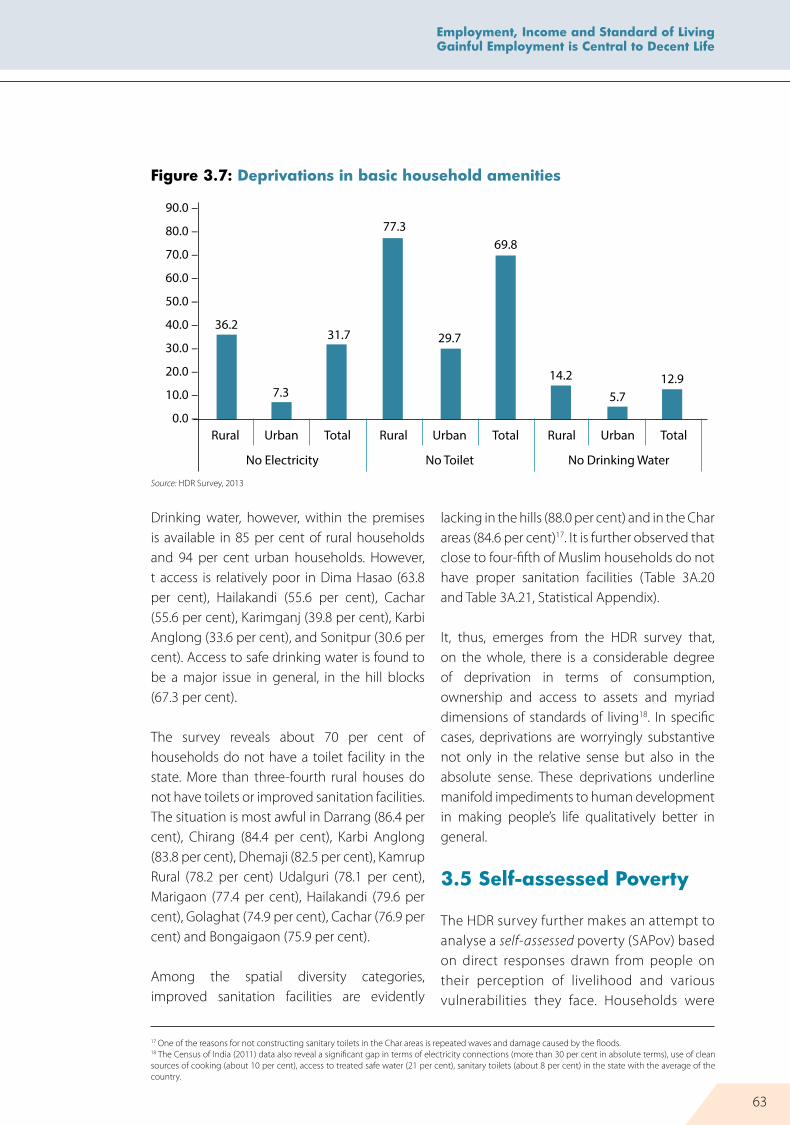
63
Employment, Income and Standard of LivingGainful Employment is Central to Decent Life
17 One of the reasons for not constructing sanitary toilets in the Char areas is repeated waves and damage caused by the floods. 18 The Census of India (2011) data also reveal a significant gap in terms of electricity connections (more than 30 per cent in absolute terms), use of clean sources of cooking (about 10 per cent), access to treated safe water (21 per cent), sanitary toilets (about 8 per cent) in the state with the average of the country.
Figure 3.7: Deprivations in basic household amenities
Source: HDR Survey, 2013
Drinking water, however, within the premises is available in 85 per cent of rural households and 94 per cent urban households. However, t access is relatively poor in Dima Hasao (63.8 per cent), Hailakandi (55.6 per cent), Cachar (55.6 per cent), Karimganj (39.8 per cent), Karbi Anglong (33.6 per cent), and Sonitpur (30.6 per cent). Access to safe drinking water is found to be a major issue in general, in the hill blocks (67.3 per cent).
The survey reveals about 70 per cent of households do not have a toilet facility in the state. More than three-fourth rural houses do not have toilets or improved sanitation facilities. The situation is most awful in Darrang (86.4 per cent), Chirang (84.4 per cent), Karbi Anglong (83.8 per cent), Dhemaji (82.5 per cent), Kamrup Rural (78.2 per cent) Udalguri (78.1 per cent), Marigaon (77.4 per cent), Hailakandi (79.6 per cent), Golaghat (74.9 per cent), Cachar (76.9 per cent) and Bongaigaon (75.9 per cent).
Among the spatial diversity categories, improved sanitation facilities are evidently
lacking in the hills (88.0 per cent) and in the Char areas (84.6 per cent)17. It is further observed that close to four-fifth of Muslim households do not have proper sanitation facilities (Table 3A.20 and Table 3A.21, Statistical Appendix).
It, thus, emerges from the HDR survey that, on the whole, there is a considerable degree of deprivation in terms of consumption, ownership and access to assets and myriad dimensions of standards of living18. In specific cases, deprivations are worryingly substantive not only in the relative sense but also in the absolute sense. These deprivations underline manifold impediments to human development in making people’s life qualitatively better in general.
3.5 Self-assessed Poverty
The HDR survey further makes an attempt to analyse a self-assessed poverty (SAPov) based on direct responses drawn from people on their perception of livelihood and various vulnerabilities they face. Households were
90.0 –
80.0 –
70.0 –
60.0 –
50.0 –
40.0 –
30.0 –
20.0 –
10.0 –
0.0 – Rural Urban Total Rural Urban Total Rural Urban
No Drinking Water
12.95.7
14.2
69.8
29.7
77.3
31.7
7.3
36.2
No ToiletNo Electricity
Total

64
Assam HDR: Managing Diversities, Achieving Human Development
19 The SAPov Index is based on six self-reported indicators: worsening economic condition over the past five years, present indebtedness, having financial stress, facing threat to crops, relative poverty in the village/community, and income insufficiency in meeting basic needs. A household is given a score of 1 if it suffers from any of the aforesaid vulnerabilities. Households with deprivations in more than three indicators are identified as self-assessed poor.
Figure 3.8: Incidence of self-assessed poverty across spatial diversity categories
Source: HDR Survey, 2013
asked to rate themselves in terms of several indicators of stressors and deprivations. Based on these indicators, a SAPov index has been calculated19.
It is found that self-assessed poverty is about twice in rural areas (15.3 per cent) compared to urban areas (7.6 per cent). Intriguingly, the proportion of households self-assessed as poor
Char Block
12.8
18.7
10.513
14.6
19.2
15.5
Flood-affected Block
Hill Block Tea Garden Block
Border Block
Multiple-diversity
Block
General Block
25 –
20 –
15 –
10 –
5 –
0 –

65
Employment, Income and Standard of LivingGainful Employment is Central to Decent Life
are found to be near equal (about 15 per cent) among all social categories. The proportion of rural household self-assessed as poor is distinctively higher in Dhemaji (28.8 per cent), Hailakandi (20.6 per cent) and Sonitpur (19.8 per cent) (Table 3A.22, Statistical Appendix). Also, the SAPov rate is relatively high among Muslims (16.2 per cent) and in flood-affected and multiple-diversity blocks (Figure 3.8).
3.6 Aspects of Inequality
Concern for inequality is very fundamental to the idea of human development. In fact, the capability approach emerged as a response to the fundamental question of “equality of what?” There are three basic approaches of looking at inequality – inequality of outcome, inequality of opportunity and inequality of processes. Here two inequalities have been highlighted – inequality in land holding and inequality in consumption. Both these inequalities are related to the opportunity aspects given their instrumental significances. Income and
consumption can, however, be viewed as outcomes as well. These inequalities have been examined by both Gini Coefficients20 and relative shares of the top and bottom 20 per cent of the population.
3.6.1 Inequality in Land Holding
The HDR survey reveals that holding of land is highly inequitable in rural Assam. It is seen that the top 20 per cent of the rural households own 68.8 per cent of the cultivated land. Since a vast majority of the surveyed population is landless, it was not possible to compute either a ratio between the richest 20 per cent and poorest 20 per cent of landholders21. However, the share of top 20 per cent of the landholders gives us a fairly good idea of the extent of inequality in land holding in the state (Figure 3.9).
It is observed that the share varies from close to 90 per cent in the districts of Dhubri, Nalbari, and Cachar, to close to 55-60 per cent in
20 The Gini Coefficient gives a formal measure of inequality, that is, greater the value greater the inequality. The Gini value lies between 0 and 1. 21 This also prevents estimation of Gini Coefficient in this context.
Figure 3.9: Inequality in Land-holding in rural Assam: Share of the top Quintile
Source: HDR Survey, 2013
100 –
90 –
80 –
70 –
60 –
50 –
40 –
30 –
20 –
10 –
0 – – – – – – – – – – – – – – – – – – – – – – –
Dhu
bri
Nal
bari
Cach
ar
Uda
lgur
i
Goa
lpar
a
Baon
gaig
aon
Tins
ukia
Dar
rang
Soni
tpur
Baks
a
Chira
ng
Ass
am
Nag
aon
Barp
eta
Dib
ruga
rh
Dim
a H
asao
Lakh
impu
r
Gol
agha
t
Mar
igao
n
Sibs
agar
Dhe
maj
i
89.1
87.9
86.1
75.6
75.5
75.4
75.3
74.2
72.7
70.8
70.5
68.8
67.9
67.7
67.6
64.9
64.6
62.5
59.4
59.1
53.7

66
Assam HDR: Managing Diversities, Achieving Human Development
Dhemaji, Kokrajhar, Sibsagar, and Marigaon. This inequality highlights a major deprivation amongst a vast number of rural people who are denied basic productive asset whereas these assets are concentrated only among a few.
3.6.2 Consumption Inequality
The most common measure of inequality is MPCE – typically reflecting inequality in living standards and well-being. It is observed that the top 20 per cent of people in Assam have around 45 per cent share in the MPCE while the share of the poorest 20 per cent is only around 8 per cent. The situation is worse in rural Assam where the share of the top quintile is even higher and that of the bottom quintile is lower. The extent of inequality would be much higher if we look at the relative shares of the richest 20 per cent and the poorest 20 per cent of the population. It emerges that, on an average, the poorest quintile of the population has a consumption level that is approximately one-sixth that of the richest quintile. The disparity is alarmingly high in rural Sonitpur (the top 20 per cent accounts about 68 per cent while the share of the bottom 20 per cent is only 4.7 per cent) and urban Kamrup (top 20 per cent consumes about 53 per cent and bottom 20 per
cent consumes 4.2 percent). This has resulted in substantial inequality – the Gini Coefficients obtained are 0.49 for both rural and urban areas in the state (Table 3A.23 & Table 3A.24, Statistical Appendix).
3.7 Understanding Inter-linkages
Understanding the inter-linkages between poverty, diverse forms of vulnerability and other characteristics is crucial for capability expansion. Two factors that have a bearing on poverty profiles are educational achievement of the individuals and their activity status. Indeed, if we look at the distribution of employment, type of economic activity and poverty status, we find a strong common linkage between them (Table 3.7). It may be observed that the poverty incidence is relatively higher among people with low educational achievement as indicated by a fewer number of years of formal education.
It is also true that, in developing countries, unemployment is lower among the poor as they can hardly afford to remain unemployed. We have to therefore looked into the type, regularity and quality of employment to
Table 3.7: Education-poverty linkage
Level of education Regular Salaried (in percent)
Poverty HCR
Illiterate 4.0 45.0Barely Literate 4.8 41.7Primary passed 3.9 43.2Middle School passed 7.9 39.4Secondary passed 17.7 34.7Hr Secondary passed 32.0 28.9UG Diploma 55.5 24.6Graduate& above 62.5 18.3Technical & Professional 65.9 18.5
Source: HDR Survey, 2013

67
Employment, Income and Standard of LivingGainful Employment is Central to Decent Life
understand the linkage between income, poverty and employment. Analysis carried out of the HDR survey data offers some insights regarding the probability of becoming poor given various household characteristics22. It has been found that agricultural labourers, casual workers, and unemployed persons have almost five times the probability of being ‘poor’23 as compared to regular salaried workers. On the contrary, traders/businessmen and self-employed persons have a lower chance of being poor compared to those who are regular workers. Belonging to a Christian household increases the probability of poverty by about one-and-a-half times that of the Hindus while the probability is about 75 per cent for the
Muslims. People from the hill blocks are more than double as likely to be poor as compared to those from the general blocks while those from the Char blocks are one-and-a-half times as likely. However, the best bet to come out of the poverty trap is found to be education as one additional year of formal education reduces the probability of being poor by 12 per cent (Table 3A.25, Statistical Appendix).
3.8 Employment and Livelihood Quality Index
To understand the overall condition of employment, an Employment and Livelihood
22 The probability of being poor is computed using a Logistic Regression where the dependent variable is whether the person belongs to a poor household and the causal factors are years of formal education, employment types, religion, and spatial diversities.23 As per the official poverty line

68
Assam HDR: Managing Diversities, Achieving Human Development
Quality Index (ELQI) has been constructed for the districts as well as for the state. This index consists of employment parameters reflecting labour market situations, and income parameters reflecting the sustainability of livelihoods. Obviously, higher income indicates a fruitful livelihood while low income indicates an unsustainable livelihood. The index is constructed based on: a) proportion of workers having regular salaried employment; b) percent of workers in non-agricultural sectors; and c) average per capita income from different sources. These three components are combined24 to arrive at the Employment and Livelihood Score for each district. After that, these scores are converted to ELQI using the goalpost method.
It is observed that the value of the index is highest for the Kamrup Metro, followed by Jorhat, Sibsagar, Nalbari, and Bongaigaon districts. Districts at the bottom are Kokrajhar,
Figure 3.10: Employment and livelihood quality index for districts
Source: HDR Survey, 2013
Marigaon, Dhemaji, Chirang, and Darrang (Figure 3.1). General blocks and tea garden blocks are at the top of the ladder while hill blocks and border blocks are at the bottom (Table 3A.26, Statistical Appendix).
How does the ELQI relate with the characteristics of the districts? It is generally believed that various social and economic characteristics such as the proportion of marginal social groups in the total population, level of education, dependency on agriculture, etc., are linked with the quality of livelihoods in a district. The EQLI is observed to have a strong negative correlation with the proportion of population being SC/ST, 7+ illiterate, proportion of children being out of school, and proportion of workers dependent on casual work. These inter-linkages offer useful policy directions for improving the quality of employment and livelihood in the state in an inclusive manner.
24 The method used is Principal Component Method (Modified), Kundu, A. (1980). Measurement of Urban Processes: A Study in Regionalisation, Popular Prakashan, Mumbai.
1.2 –
1.0 –
0.8 –
0.6 –
0.4 –
0.2 –
0.0 – – – – – – – – – – – – – – – – – – – – – – –
Kam
rup
(M)
Jorh
at
Nal
bari
Sibs
agar
Cach
ar
Dib
ruga
rh
Tins
ukia
Baon
gaig
aon
Soni
tpur
Kam
rup
Nag
aon
Karim
ganj
Goa
lpar
a
Hai
laka
ndi
Barp
eta
Lakh
impu
r
Uda
lgur
i
Gol
agha
t
Dim
a H
asao
Dhu
bri
Dar
rang
Chira
ng
Baks
a
Dhe
maj
i
Karb
i Ang
long
Mar
igao
n
Kokr
ajha
r
1.00
0.53
0.51
0.50
0.44
0.40
0.40
0.38
0.31
0.29
0.27
0.27
0.24
0.22
0.21
0.21
0.20
0.19
0.16
0.16
0.16
0.090.11
0.12
0.12
0.01
0.00

69
Employment, Income and Standard of LivingGainful Employment is Central to Decent Life
3.9 Summing up
It, thus, emerges that the lack of productive and remunerative work opportunities is a cause of major concern in the state. An ever-increasing labour force faced with low employment opportunities increases unemployment. The unemployment rates among female and educated youth are becoming particularly alarming in the state. So far as those employed are concerned, the quality of employment and earnings are emerging as major issues. While a majority of people is engaged in the farm sector and casual employment, income from these activities is meagre. The relative income shares from these two sources are abysmally low, though together they account for more than three-fourth of the total employment.
This typifies a low level equilibrium situation in the labour market. This low level equilibrium has a severely limiting impact on the income dimension of human development. Given the instrumental significance of income in capability expansion, this low level equilibrium witnessed in the employment and livelihood sector constricts opportunities for people to make choices and impedes qualitative improvements of their lives. Enhancing capability and improving the quality of life of people needs, therefore, to overcome this low level equilibrium trap by providing gainful employment to people entering the labour force. This invariably emphasises a strong role of the state in intervening and breaking the low level equilibrium trap currently characterising the labour market in the state.

70
Assam HDR: Managing Diversities, Achieving Human Development
Literacy and EducationGoing to and Staying in School Matters4

71
Literacy and Education:Going to and Staying in School Matters
4.1 Introduction
The literacy rate and level of educational attainment of people are two key indicators of a country’s development. Literacy and level of education influence a person’s daily life and help her/him perform a range of activities, which are not possible without the ability to read, write and communicate in the social sphere. The quality of life of a person, therefore, depends on educational achievements which inter alia, depends on the proper provisioning and governance of the education system as well as personal and social contexts. Most importantly, the enhancement of literacy and level of education presupposes a set of enabling conditions ensuring adequate and equitable opportunities and scope for creative engagement through a system of quality education.
An assessment of literacy and educational attainment within the framework of human development, thus, needs to adequately account for the complexities that abound in various processes related to the system of education as a whole. This requires a surfeit of evaluative information offering insights on the status of literacy and educational achievements and also conditions that seem to influence such achievements.
4.2 Literacy and Level of Education
4.2.1 Literacy Rate
The Census 2011 records the proportion of literates in Assam as 73.18 per cent, placing the state at 26th among the 35 states and union territories in the country. The state has,
however, gained about 10 per cent in the total literacy rate over the last Census (63.25 in 2001).
Three important particulars emerge from Census 2011 data. First, female literacy rates in the state – total, rural as well as urban – are better than the national average. Besides, the gap between male-female literacy in the state has been lower than the national average (that is, 11.5 in the state against 16.2 in the country). Further, the male-female gap in literacy has reduced by one-third during 2001-11. Most importantly, the reduction in the male-female gap in literacy has been across all districts and sectors, that is, rural and urban. The gap which was hugely dispersed across districts in 2001 has become considerably uniform in 20111.
Second, in contrast to the male-female gap in literacy, the decline in the rural-urban gap in the state has been rather slow – it has declined by only about one fifth during 2001-11. The range in the gap across districts also remained quite stagnant2.
Third, data further reveal sizable inter-district variations in literacy rates in the state – total, rural as well as urban. In 2001, the range in total literacy rates in the districts was about 40 (maximum 88, minimum 48) which became 30 (maximum 89, minimum 59) in 2011. Similarly, the range in the rural literacy rate has narrowed from 38 to 25. Interestingly, however, the range in the urban literacy rate across districts has increased from 17 to 28. It is, moreover, seen that while the range in literacy rates among urban females has reduced by one third, amongst males it has, in fact, doubled during 2001-11. This emerging inequality in urban male literacy across districts has significant implications for various labour market outcomes.
1 The range in the male-female gap in literacy across districts, for instance, has come down from 58 (maximum 72, minimum 14) in 2001 to 12 (maximum 17, minimum 5) in 2011. 2 The range has been 22.9 (maximum 25.3 and minimum 2.5) in 2011 against 26.7 (maximum 34.6 and minimum 7.9) in 2001.
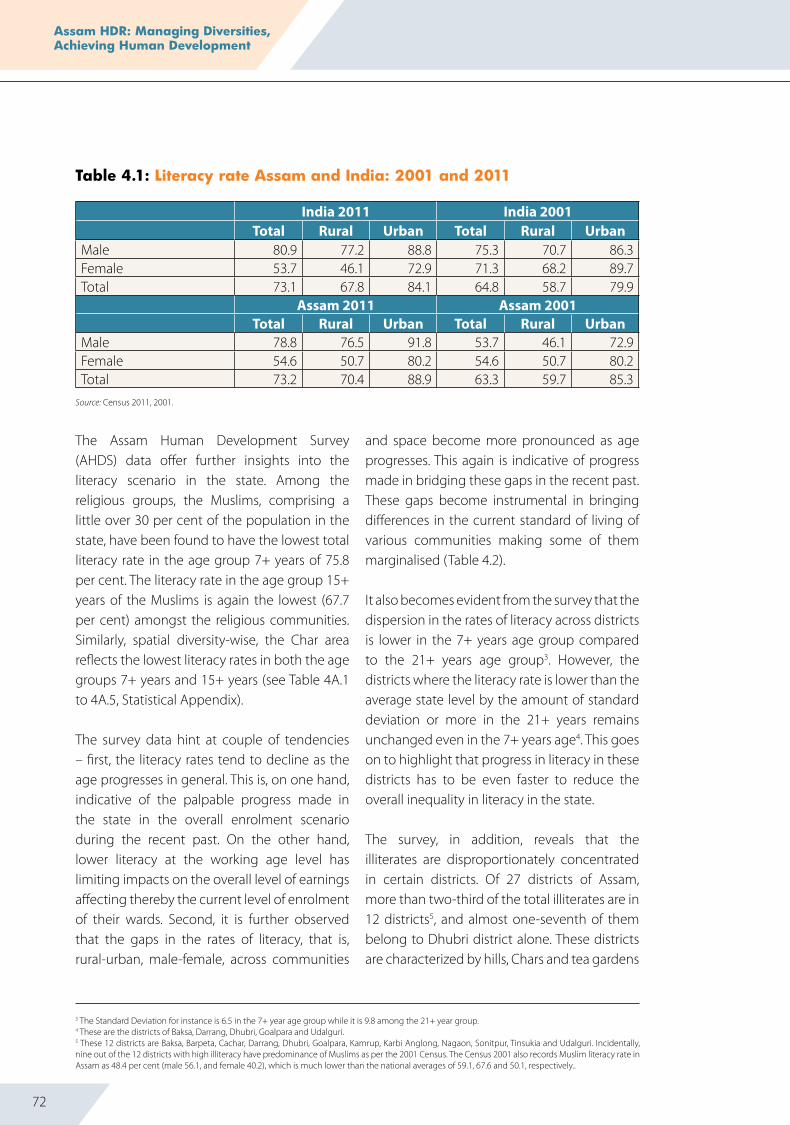
72
Assam HDR: Managing Diversities, Achieving Human Development
The Assam Human Development Survey (AHDS) data offer further insights into the literacy scenario in the state. Among the religious groups, the Muslims, comprising a little over 30 per cent of the population in the state, have been found to have the lowest total literacy rate in the age group 7+ years of 75.8 per cent. The literacy rate in the age group 15+ years of the Muslims is again the lowest (67.7 per cent) amongst the religious communities. Similarly, spatial diversity-wise, the Char area reflects the lowest literacy rates in both the age groups 7+ years and 15+ years (see Table 4A.1 to 4A.5, Statistical Appendix).
The survey data hint at couple of tendencies – first, the literacy rates tend to decline as the age progresses in general. This is, on one hand, indicative of the palpable progress made in the state in the overall enrolment scenario during the recent past. On the other hand, lower literacy at the working age level has limiting impacts on the overall level of earnings affecting thereby the current level of enrolment of their wards. Second, it is further observed that the gaps in the rates of literacy, that is, rural-urban, male-female, across communities
Table 4.1: Literacy rate Assam and India: 2001 and 2011
India 2011 India 2001Total Rural Urban Total Rural Urban
Male 80.9 77.2 88.8 75.3 70.7 86.3Female 53.7 46.1 72.9 71.3 68.2 89.7Total 73.1 67.8 84.1 64.8 58.7 79.9
Assam 2011 Assam 2001Total Rural Urban Total Rural Urban
Male 78.8 76.5 91.8 53.7 46.1 72.9Female 54.6 50.7 80.2 54.6 50.7 80.2Total 73.2 70.4 88.9 63.3 59.7 85.3
Source: Census 2011, 2001.
and space become more pronounced as age progresses. This again is indicative of progress made in bridging these gaps in the recent past. These gaps become instrumental in bringing differences in the current standard of living of various communities making some of them marginalised (Table 4.2).
It also becomes evident from the survey that the dispersion in the rates of literacy across districts is lower in the 7+ years age group compared to the 21+ years age group3. However, the districts where the literacy rate is lower than the average state level by the amount of standard deviation or more in the 21+ years remains unchanged even in the 7+ years age4. This goes on to highlight that progress in literacy in these districts has to be even faster to reduce the overall inequality in literacy in the state.
The survey, in addition, reveals that the illiterates are disproportionately concentrated in certain districts. Of 27 districts of Assam, more than two-third of the total illiterates are in 12 districts5, and almost one-seventh of them belong to Dhubri district alone. These districts are characterized by hills, Chars and tea gardens
3 The Standard Deviation for instance is 6.5 in the 7+ year age group while it is 9.8 among the 21+ year group.4 These are the districts of Baksa, Darrang, Dhubri, Goalpara and Udalguri.5 These 12 districts are Baksa, Barpeta, Cachar, Darrang, Dhubri, Goalpara, Kamrup, Karbi Anglong, Nagaon, Sonitpur, Tinsukia and Udalguri. Incidentally, nine out of the 12 districts with high illiteracy have predominance of Muslims as per the 2001 Census. The Census 2001 also records Muslim literacy rate in Assam as 48.4 per cent (male 56.1, and female 40.2), which is much lower than the national averages of 59.1, 67.6 and 50.1, respectively..

73
Literacy and Education:Going to and Staying in School Matters
Table 4.2: Literacy rates in different age groups
(7+ Years) (15+ Years) (18+ Years) (21+ Years) (24+ Years)Total 82.3 78.2 76.6 74.7 72.6SectorRural 80.8 76.1 74.3 72.2 69.9Urban 90.8 89.3 88.6 87.8 86.7SexMale 86.7 83.7 82.6 81.2 79.7Female 77.6 72.3 70.4 68.0 65.1Social CategorySC 83.4 79.7 78.2 76.3 73.9ST 81.9 78.0 76.3 74.0 71.5OBC 84.3 81.1 79.8 78.3 76.4ReligionHindu 85.4 82.6 81.4 79.9 78.2Muslim 75.8 67.7 64.9 61.8 58.6Christian 78.8 73.4 71.1 68.6 66.2Spatial DiversityChar 75.0 67.4 65.0 62.3 59.6Flood 86.0 83.0 81.8 80.2 78.5Hills 77.7 72.5 70.4 67.7 64.6Tea 82.5 78.9 77.4 75.7 73.9Border 80.9 76.2 74.3 72.0 69.3Multiple 78.5 72.7 70.5 68.2 66.0
Source: HDR Survey, Assam (2013).
6 ‘Odd ratio’ is a useful measure of probability of occurrence of an outcome given a condition relative to its occurrence when the condition is absent. Here, when the ‘odd ratio’ is less than 1, the chances of Muslims being literate is less than that of non-Muslims. When it is greater than 1, the chances of Muslims being literate are greater than that of non-Muslims.7 Found to be highly significant, that is, significant at 1 per cent level of significance.
predominantly inhabited by Muslims together with Adivasis and tribals. The rate of illiteracy, on the other hand, has been highest in Baksa and Darrang (each with a rate at 29.3 per cent), followed by Goalpara (28 per cent) and Dhubri (26 per cent).
Muslims, however, cannot be regarded as a homogeneous group in the state. District wise religious breakup of literacy data among Hindus and Muslims shows that literacy among Muslims is higher or marginally lower than that of their Hindu counterparts in the upper Assam districts of Dhemaji, Dibrugarh, Golaghat, Jorhat, Lakhimpur, Sibsagar, Sonitpur and the two hill districts besides Cachar. The maximum
difference in literacy between Muslims and non- Muslims is observed in the districts of Darrang, Goalpara, Kamrup and Morigaon (Table 4A.6, Statistical Appendix). Notably, the Muslims in these districts are predominantly composed of immigrant settlers of erstwhile East Bengal and East Pakistan origin.
Intriguingly, the overall ‘odd ratio’6 calculated from the district-wise distribution of 7+ years literacy rates among Muslims against non-Muslims is found to be 0.5527, indicating that the chances of Muslims being literate, in general, in the state is almost half of that of non-Muslims being literate. However, there prevail wide variations in odd ratios across districts. In certain

74
Assam HDR: Managing Diversities, Achieving Human Development
Map 4.1: Plot of ‘odd ratios’ of literacy (7+ years) of Muslims against non-Muslims
Odd Ratio
Below 0.3, Very Low
0.3 - 0.5, Low
0.5 - 1.0, Moderately Low
1.0 - 2.0, High

75
Literacy and Education:Going to and Staying in School Matters
districts, such as Baksa, Chirang, Dibrugarh, Golaghat, Jorhat, Karbi Anglong and Sibsagar, the odd ratios of being literate are in favour of Muslims. Similarly, the chances of Muslims being literate are only marginally lower in the districts of Cachar, Dhemaji, Sonitpur and Tinsukia. But, the odd ratios are rather low in lower Assam districts and the lowest in Marigaon (Table A4.7, Statistical Appendix). In Marigaon, the chance of Muslims being literate is just one-fifth that of non-Muslims. Disaggregated analysis further reveals that the odds are further lower for women within Muslims where Muslims have lower odds of literacy in general.
The disaggregated analysis presented above, thus, underlines the significance of bridging myriad gaps in literacy within the districts and sectors, that is, rural and urban, male-female and communities, in improving overall literacy in the state. This necessarily emphasises the strategy of improving averages by lowering
all possible dispersions for inclusive human development in the state.
4.2.2 Levels of Formal education
The level of education (measured by formal years of schooling) of the total eligible members in the sample households8 has been found to be rather low in the HDR survey. The level attained by most turns out to be middle school, that is, class VIII, followed by primary and secondary school. Only 11 of 100 persons are reported to have reached the Higher Secondary level, while only seven are reported to have completed the graduation level and above. Evidently, there is not much difference in levels of education between rural and urban areas (Figure 4.1).
It has been observed that there is not much difference in levels of education, in general, among various social categories, religious communities and spatial diversities.
8 Eligible household members include literates above seven years of age.
Figure 4.1: Distribution of population by levels of education (in %)
Source: HDR Survey, Assam (2013)
30.0 –
25.0 –
20.0 –
15.0 –
10.0 –
5.0 –
0.0 –Informal
Schooling
Rural Urban Total
Below Primary
Primary Middle Secondary Higher Secondary
Any Diploma
Graduate Post Graduate
Technical Degree
– – – – – – – – – –

76
Assam HDR: Managing Diversities, Achieving Human Development
9 MYS, the average number of completed years of education of a population, is a widely used measure of a country’s stock of human capital.10 The Pearson Chi-Square test is found significant at 1 per cent level of significance.11 The Net Enrolment Ratio, however, is less than 100 indicating that a section of children in the 6-14 years age group is not in age-appropriate classes.
However, levels of education have been found to be somewhat negatively skewed for SCs, Muslims and Christians and also in the Char areas (Tables A4.8, A4.9, A4.10; Statistical Appendix). This only confirms that the level of educational attainment in the state has been pervasively “middle heavy”. This, consequently, implies MYS9 of individuals in general. Clearly, more the number of years spent in school, higher will be the level of educational attainment.
The survey data also clearly brings out the instrumental value of education as the nature of occupational engagement of people varies with levels of education. It is observed that higher the level of education, greater is the possibility of being absorbed in permanent salaried work10 (Table 4.3).
Thus, whether it is literacy or level of educational attainment, the forgoing discussion is potentially indicative of ‘basic capability failure’. Some capabilities are so basic (education is surely one of them) to human well-being that their deprivation leads to inability at both individual and community levels to make crucial choices in life.
4.3 School Education
4.3.1 enrolment in Schools
The latest District Information System for Education (DISE) data (2013-14) puts the Gross Enrolment Ratio (GER) in Assam at the primary level (I-V) at 113.4 and that at the level of upper primary (VI-VIII) at 93.1. The DISE data reveal that, during the last decade, the GER in the state both at the primary and upper primary levels have improved markedly. In 2005-06, the GER at the primary level was 96.7 and at the upper primary level was only 37.73. The major success is, thus, found at the level of upper primary in terms of gross enrolment which marks a significant improvement11.
The DISE data further reveal that this improvement in enrolment has come from the rise in the transition rate from primary to upper primary together with a fall in the dropout rates. In 2005-06, the transition rate from primary to upper primary was 86 per cent which has increased to 93 per cent in 2013-14. At the same time, the dropout rate at the primary level has come down from 11.2 in 2005-06 to 6.24 in 2013-14. Notwithstanding this, the dropout
Table 4.3: Occupational engagement by level of education (in %)
Levels of education
Agriculture &
Livestock
CasualWork
PermanentSalaried
Work
Self employed
in non farm
Total
Not Literate 28.35 57.65 4.00 10.00 100.00Up to Middle 30.77 44.93 5.82 18.48 100.00Up to Higher Secondary
26.04 24.85 22.73 26.38 100.00
Diploma/ Degree 8.99 12.39 55.40 23.22 100.00Above Graduation 4.65 11.05 62.40 21.90 100.00Total 27.38 39.90 13.60 19.12 100.00
Source: HDR Survey, Assam (2013).

77
Literacy and Education:Going to and Staying in School Matters
rate at the primary level in the state continues to be higher than the national rate of 4.67. The dropout rate at the upper primary level also is higher than the national level –7.2 against 3.1 – which is more than double the national level. One striking feature of the dropout rate emerging from the DISE data is that the dropout rate in class I remained almost sticky during 2005-14 whereas it declined in all other classes. The dropout rate in class I was 13.6 in 2005-14 which DISE 2013-14 puts at 11.9. This marks an important policy concern for the state.
The HDR survey data offers a few more insights. It is found that about 93 per cent of children in the age group of 6-14 years in the state are currently enrolled, which indicates that the state is yet to achieve universal elementary education. The proportion of those enrolled in the age group 6-11 years is 96 per cent while that of 12-14 years is 89 per cent. Within the age group 6-24 years, about half of the individuals are found to be pursuing some form of education; however, the proportion of males is higher than females.
Even though initially at lower age groups, more girls are enrolled in school; their presence gets reduced with age, in the subsequent higher levels. Consequently, the Gender Parity Index (GPI) (ratio of the number of female students enrolled to the number of male students enrolled) exhibits a decline for successive age groups. It is also a serious concern that for
both males and females more than half of the post-secondary school age children are not pursuing education, while at least one-fourth of the secondary school age students are not in school (Table 4.4).
These figures are largely in conformity with the secondary sources showing declining enrolment with age irrespective of the level of education. The Age Specific Enrolment Ratio (U-DISE 2013-14) indicates that while the enrolment is 87.99 per cent in the age group of 11-13 years, the proportion decreases to 69.10 per cent for 14-15 years and further to 36.79 per cent for 16-17 years age group in Assam. The corresponding national averages are 89.92, 66.43 and 45.71 per cent, respectively. The HDR survey also reveals that the situation is particularly worrisome in the districts of Cachar, Darrang, Dhubri, Goalpara, Hailakandi, Karimganj and Marigaon, where the literacy rate in general is poor. In these districts about three out of five children in the age group of 17-18 years are not pursuing an education of any kind (Table 4A.11, Statistical Appendix). These districts have a substantial Muslim population and amongst the Muslim enrolments at the secondary (17-18 years) and beyond are particularly low (Table 4A.14, Statistical Appendix). Among the social categories, a higher percentage of ST students is enrolled in all the four age groups, which is a positive development (Tables A4.12, Statistical Appendix).
Table 4.4: Age specific enrolment rates
Male Female GPI Rural Urban Total6 to 14 years 93.59 94.13 0.95 93.56 96.28 93.8515 to 16 years 71.17 78.49 0.87 73.17 84.62 74.5717 to 18 years 53.24 52.07 0.82 50.16 69.62 52.7119 to 24 years 20.33 15.19 0.79 15.47 30.32 17.706 to 24 years 54.84 53.28 0.92 65.33 69.22 54.07
Source: HDR Survey, Assam (2013).Note: Total sample between 6-24 age group: 90,699 (male: 46,472 female: 44,227).

78
Assam HDR: Managing Diversities, Achieving Human Development
Spatial diversity impacts children’s enrolment as well (Table 4A.13, Statistical Appendix). The Char areas bring in a lot of vulnerabilities requiring the inhabitants to shift their homes at frequent intervals. The area suffers from communication deficits, lack of adequate schooling facilities beyond Primary, girl child marriage, poverty and illiteracy and lack of awareness of parents about the value of education. Another segment of population categorised as ‘multiple diversity group’ as their lives are bound by multiple disadvantages of flood, border, the Chars, etc., making them more vulnerable, also reflects low level of enrolment.
4.3.2 Out of School Children
Household level information on out of school children in the AHDR helped to observe closely the pattern of children remaining out of school, which is difficult from a school-based analysis. Of the total 6-16 year old children in the households, 6.45 per cent are found to be out of school12. Of the total of school children, more than 28 per cent have actually never been enrolled; more than three-fourth of those who were enrolled have dropped out of school at different classes and a smaller proportion of them, although they have not formally given up school, do not go to school either (Table 4.5).
12 Out of school children here are those between 6-16 years of age, who have never been enrolled in any school or after enrolment has left school for ever, never to return and the ones who have been enrolled in school but currently do not go to school.
Table 4.5 shows that the majority of out of school children is school drop-outs. So far as the never enrolled children are concerned, the highest numbers are found in Kamrup district, followed by Nalbari, Tinsukia, Darrang, and Dhubri, where this group constitutes more than 30 per cent. Rural diversity wise, it is the Char areas where a high proportion of children (33.21 per cent) have never been enrolled in school. Since the Char areas are mostly inhabited by the Muslim community, the weight is pulled by children belonging to Muslim families (Table 4A.15 to 4.18, Statistical Appendix).
What is most striking is that a high dropout rate prevails in educationally forward districts such as Sibsagar, Lakhimpur, Jorhat, Dibrugarh, Dhemaji and Bongaigaon. The rate is also high in border areas, where almost eight out of 10 students leave school without completing schooling. A similar scenario exists in the hills. The class from which students drop out most frequently in the state is class VIII. It is revealed that girl students remain in school for a longer period than the boys although, as Table 4.5 indicates, girls have a higher share of non-enrolment compared to boys. While boys in general left school in class III or IV, girls continued till class IX.
Table 4.5: Distribution pattern of out of school children of age 6-16 (in %)
Out of school children* Rural Urban Male Female TotalNever enrolled 28.97 16.02 24.98 32.35 28.14Left after enrolment 66.18 81.22 70.02 63.30 67.14Enrolled but does not go to school 4.63 2.21 4.81 4.02 4.47Goes to informal school 0.23 0.55 0.19 0.33 0.25Total percent 100 100 100 100 100
Source: HDR Survey, Assam (2013).*Total out of school children of 6-16 years: 2,839; total children of 6-16 years: 44,023.

79
Literacy and Education:Going to and Staying in School Matters
Students dropping out of school is a serious issue in the state. The current dropout rate in the state at the primary level is 6.24, at upper primary level 7.20, at secondary level 26.77 and at higher secondary level 4.69. Baring the last one, for which the all India dropout rate not available, in all the other levels, Assam’s dropout rate is much higher than the national averages of 4.67, 3.13 and 14.54, respectively. The highest dropout at the Primary level takes place in the district of Goalpara, followed by Dhubri and Barpeta (U-DISE 2013-14).
The reason why children leave school without completing the cycle is highly complex and contextual because dropping out of school is not an event, rather a process. The HDR survey reflects that almost one-third of the dropout children leave school to support family income, another third give up because of disinterest in
studies and one-tenth because they failed in examinations (Table A4.20 to A4.23, Statistical Appendix).
4.4 Access to School and School Facilities
Opportunities to get enrolled in a school can come to children only when it is available within a reasonable distance. Infrastructural bottlenecks and poor transport and communication, especially in rural areas including the Char and border areas, often make access to school difficult for children. Further, recurring floods, continuous erosion and difficult terrain in the hills also create barriers to access to school. Besides, a host of other factors such as poverty, frequent conflicts and violence, discrimination of diverse sorts, etc., also come in children’s way of accessing schools.

80
Assam HDR: Managing Diversities, Achieving Human Development
4.4.1 Availability of School
As with other states of the country, access to school in Assam too has improved during the last decade or so. The total number of schools in the state has increased to about 64,000 in 2013-14 over about 40,000 in 2002-03 (DISE 2013-14, 2002-03). Consequently, the school village ratio has doubled from 1.5 to 2.9 during 2002-14. Notwithstanding this, Assam is yet to fulfil the mandate of providing primary schools within a distance of 1 km and upper primary schools within a distance of 3 km in all habitations13 (Table 4.6).
District-wise, access to primary school is particularly low in the districts of Baksa, Darrang, Kamrup, Nalbari and Sonitpur. Access to upper primary school is again very low in the districts of Baksa, Chirang and Dima Hassi where more than 50 per cent of the schools are located
at the distance of beyond 3 km (Table 4A.24, Statistical Appendix).
Access to secondary schools is even more difficult (Table 4.7), especially for the rural children. More than one-third of households have secondary schools located at a distance of 2 to 5 km, approximately another 12 per cent of the households have a secondary school at a distance of 5 km, making access extremely difficult. Commuting this distance mostly on foot in rural areas, especially during monsoons, is challenging. For girls, wearing mekhala chaddar/saree or dakhana while walking this distance becomes all the more tiring and such daily travails lead girls to drop out of school altogether.
It may further be mentioned that the ratio between primary to upper primary; upper primary to secondary; and secondary to
13 The National Council of Educational Research and Training documents on educational surveys reveal that the primary, upper primary, secondary and higher secondary stage schooling facilities in India should be made available within a distance of 1, 3, 5 and 8 km, respectively.
Table 4.6: Distance of primary and upper primary school from habitation, Assam
Primary School Upper Primary SchoolWithin
habitationWithin 1 km
but not within
habitation
Beyond 1 km
Withinhabitation
Within 3 kmbut not within
habitation
Beyond 3 km
Assam 48.36 38.15 13.49 19.50 57.45 23.05India 58.35 31.67 9.98 28.69 56.73 14.58
Source: 8th All India School Education Survey, 2009.
Table 4.7: Households by distance from secondary school (in %)
State/Country Distance from Schools with Classes IX-XLocation < 2km 2-5 km >5 km
Assam Rural 49.9 38 11.9Urban 82.8 13.9 3.3
India Rural 47.3 35.5 17.1Urban 90.7 8.1 1
Source: Education in India: Participation and Expenditure, NSS 64th Round, 2007-08.

81
Literacy and Education:Going to and Staying in School Matters
higher secondary schools in Assam is 3.14, 2.28 and 4.36, respectively. The all India figures are, on the other hand, 2.04, 2.60 and 2.19, respectively. On the whole, therefore, it appears that there is a shortage of schools at the higher levels compared to the lower, indicating a mismatch leading to increasing deficient access to school in the state.
4.4.2 School Infrastructure
The all India education survey has shown that, as in India, the schooling infrastructure in Assam has also improved, but good school building is yet to be a reality for all. The state is lagging behind the country as whole in terms
of the quality of school building, also marked by large rural-urban disparities (Table 4.8).
Notwithstanding this, there has been marked improvement in school facilities owing to the Sarva Sikhsa Abhiyan (SSA). In terms of various facility indicators such as student-class room ratio, drinking water provisioning, sanitation, boundary wall, etc., the situation has improved considerably (Table 4.9).
The HDR survey presents the current status of school facilities as reported by children’s households. Notwithstanding the support provided by SSA, it is found that at least one-10th of the schools are short of rooms for each class,
Table 4.8: School building by type, rural and urban (in %)
Levels of school Type of building*Rural Urban
Pucca Partly Pucca
Kuchcha Pucca Partly Pucca
Kuchcha
Primary 69.84 23.96 5.74 77.61 20.97 1.35(88.20) (7.88) (2.14) (89.06) (8.51) (1.17)
Upper Primary 46.62 35.12 17.96 67.22 29.26 3.52(89.39) (8.70) (1.38) (91.51) (7.39) (0.79)
Secondary 37.92 49.37 12.63 64.64 29.78 5.58(84.45) (12.24) (2.53) (92.66) 6.14) (0.86)
Higher Secondary 57.70 38.52 3.77 75.42 24.17 0.42(90.49) (8.31) (0.89) (94.93) (4.60) (0.26)
Note: Figures in parenthesis () indicate all India figures,* Schools in tents and open spaces are not included.Source: 8th All India School Education Survey, 2009.
Table 4.9: Improvement in school facilities in Assam (2005-14)
Facility Indicators 2005-06 2013-14Student Classroom ratio 44 28Schools with drinking water 70.6 79.7Schools with Boys’ Toilet - 78.8*Schools with Girls’ Toilet 9.6 59.3*Schools with Boundary Wall 30.3 26.4Schools with Ramps 10.9 89.6**Schools with Computers 4.1 7.7
Source: DISE, Relevant Years*Single toilet in co-educational schools is considered as boys’ toilet and multiple toilets as toilets for both boys and girls.**Schools required and have ramps.
82
Assam HDR: Managing Diversities, Achieving Human Development
and around an equal number have a dearth of adequate numbers of desks and benches for students. Drinking water facilities are yet to be made universally available in all schools. The most glaring deficiency is noticed in non-availability of electricity. While the situation seems to be little better in private schools, it is worse in government schools with barely one-third having electricity connections. More than three-fifth of the schools is without girls’ toilets and one-fourth without boundary walls. Overall, private schools appear to have better school facilities. District-wise data further reveal that there exists wide inter district variations in provisioning of facilities (Table 4A.25 Statistical Appendix).
4.4.3 How Regular are the Students in Attending Schools?
The mean age at which children start going school in Assam is five to six years. The HDR survey recorded a child’s attendance in primary schools in past one week. A child’s attendance in school is one of the most important indicators of success of the schooling environment. In rural Assam, on an average, more than 90 per cent of households reported that children regularly go to school. However certain districts turned out to be outliers. District Dima Hasao had 66 per cent of children attending school for less than five days a week. Hailakandi reported 34 per cent attending school for less than five days a week. In the urban areas, child attendance estimates were higher than rural. But urban areas of some districts showed low child attendance rates in primary schools such as in Cachar, Dhubri, Dima Hasao, Hailakandi, Karbi Anglong, Karimganj and Tinsukia.
4.4.4 Do the Students Face Discrimination in School?
Life in school for some can be delightful and for others it can be distasteful. Teachers’ behaviour in school can make an enormous difference in a child’s life. Any discriminatory and exclusionary behaviour can leave children’s psyche irrevocably scarred. This issue is extremely important in the context of Assam, with diverse population groups representing diverse ethnicity, caste and religion. The HDR survey, Assam (2013), tried to elicit responses from the households regarding whether they perceive any discrimination being faced by their wards in schools.
In the survey, discrimination based on race/caste or religion was reported by about 6 per cent of the households. Among those who reported discrimination, 95 per cent belong to the rural areas. Comparatively, reported discrimination is higher in the border, tea garden, flood affected and the Char areas14.
It is reported that 10 per cent of schools are still engaged in beating children and this occurs more in government schools and in rural areas. Similarly, meting out punishment for not doing homework is also reported in more than 26 per cent of households. Interestingly, punishment for not doing homework and for being absent in school is reported to be higher in the private schools with 32.31 per cent and 30.53 per cent compared to the government schools with 25.85 per cent and 27.33 percent, respectively (Table 4A.26).
14 Lashmi (age 15, name changed), a girl belonging to the tea community and studying in Class IX in a government school, expressed her experience of discrimination of students belonging to their community in school during a Focus Group Discussion. “When we go for admission they ask if we are bangaali’ (meaning people from the tea community). Teachers go and teach student of their caste but they will not teach us. They don’t respect us. We will respect elders when they respect us. If elders don’t call us nicely and don’t talk properly then why will we like or talk. Many students leave school because teachers use foul language, which they do not do to others.” (Excerpt from a Focus Group Discussion with children in a tea garden in Lakhimpur, 1 September 2013.)

83
Literacy and Education:Going to and Staying in School Matters
4.4.5 On Being educated: Quality of Learning
The quality of learning is equally important with going to and staying in schools. Merely being in schools or completing school years does not guarantee accomplishment of the desired learning and accompanying social skills. Various national level surveys, indeed, reveal that the quality of learning across all levels of the education system in the country is abysmally low, including in Assam. For instance, the recent all India survey on the status of education in the country (ASER, 2013) indicates a declining trend in reading and arithmetic ability among students of class I to VIII. As per the report, in Assam, at least 54 out of a 100 students studying in class III to V (lower primary level) cannot read class I level text and 47 out of 100 students in class VI to VIII (upper primary level) cannot read class II level text. The situation is even more perilous in the case of arithmetic. At least 70 out of 100 students studying in class III to V cannot do simple subtraction and 81 per cent of those who are in class VI to VIII cannot do simple division. The report identifies Assam as one of the lowest performing states next to Jharkhand and Madhya Pradesh in reading ability at the primary level and only next to Chhattisgarh in the same ability among the upper primary students. In arithmetic skills, Assam is next to the lowest level in Puducherry in the primary section and the lowest in the country among students in the upper primary level.
Such poor learning outcomes result in entrenched inequalities in society which are perpetuated historically. Although, some differences in learning outcomes may be attributed to differential parental investment in education which is, of course, a miniscule section, the vast majority of students have different contexts for the low level of
attainment and consequent educational deprivation. A host of contextual factors such as classroom environment, curriculum and pedagogy, teachers’ quality and engagement with students, lived experiences of students – all impact learning outcomes.
4.5 Parental Awareness and Involvement at the Primary Level Learning
Parental involvement in children’s education and their awareness and engagement with school plays a major role in a child’s performance in school. Information related to parental involvement with the children’s school-related activities, such as attending meetings of the Parents-Teachers Association (PTA), being aware of the child’s performance in school, their level of satisfaction with the child’s performance or the quality of education that they receive, and nature of help accorded to the child at home in his or her studies, etc., speak of their involvement in the child’s education.
The HDR survey findings show a distinct line of demarcation between rural and urban parents and parents of children going to private school and government schools. Clearly, urban parents and parents of children attending private schools are more involved in their children’s education at the Primary level (Table 4.10).
4.5.1 Future Plan of Study
Another measure of parental aspiration is the future plan of study for the child. More than 90 per cent of households expected to enrol students in higher secondary schools and colleges. Sending of children to schools and colleges outside the district was reported by 6 per cent of the households (Table 4.11).

84
Assam HDR: Managing Diversities, Achieving Human Development
4.6 Public and Private: the Growing Divide
Of the 39,998 households surveyed in the HDR survey, 29,953 reported having at least one child in primary school. It is found that six to 14 year old students predominantly study in government schools. There is, however, a distinct pattern indicating that more rural students compared to urban attend government schools (Table 4.12).
Information was also gathered from parents about the reasons for sending children to private schools. The specific reasons cited were better schooling infrastructure, quality of teaching,
regularity of classes, teacher attendance and care taken of the students by the school. On an average, more than one-third (close to 33 per cent) of the households in all districts mentioned good schooling infrastructure as the reason for sending children to private schools (Table 3A.29, Statistical Appendix).
Paid tuition is another phenomenon impinging on the education system in general. The ASER 2013 brings out an interesting observation that, while children from both government and private schools take help of paid tuition in rural Assam, the proportion of students (12.2 per cent) going for tuition remained constant in the case of government schools students studying
Table 4.11: Reported future plan of study for children (in %)
Sector LocalHigher
Secondary/College
School/Collegeoutside
thedistrict
School/Collegeoutside
thestate
Professional/Vocational
Colleges
Noplans
Willnot
studyfurther
Total
Rural 90.0 6.3 0.1 0.2 2.9 0.5 100
Urban 90.8 4.6 0.9 0.5 2.9 0.2 100Total 90.1 6.1 0.3 0.2 2.9 0.5 100
Source: HDR Survey, Assam (2013).
Table 4.10: Parents’ involvement in children’s education and study (in %)
Nature of involvement Rural Urban Govt.School
Pvt.School
Total
Attend PTA meeting 68.5 76.9 65.6 91.9 69.5Aware about child's performance in school
77.6 88.3 75.8 96.1 78.8
Satisfied with child's performance at school
73.2 83.6 71.0 94.4 74.4
Satisfied with quality of education at school
74.6 85.3 72.6 94.8 75.8
Study help to child at home: No help
44.0 24.5 46.4 14.6 41.7
Parents help 29.1 35.5 26.9 46.8 29.8Elder sibling help 14.1 11.6 14.8 8.2 13.8Neighbor help 2.5 1.1 2.5 1.0 2.3Private tutor help 10.3 27.4 9.4 29.4 12.3
Source: HDR Survey, Assam (2013).

85
Literacy and Education:Going to and Staying in School Matters
in classes I-V during 2010 to 2013 but increased from 28 per cent in 2010 to 30.9 per cent in 2013 in the case of private school students.
On the other hand, the proportion of students studying in classes VI-VIII having support of paid tuition (22.3 per cent) reduced to 18 per cent, while that of their counterparts studying in private schools increased by more than 10 per cent from 28.8 per cent to 38.9 per cent. This could be because of the fact that students who study in private schools mostly belong to the affluent class, which is also ready to spend some more on private tutoring for better results. However, with the introduction of new textbooks of higher standards, several people in the rural areas reported that there were not many people in the locality who can teach their wards. The growing divide comes out very clearly when we compare students without any tuition in government and private schools. While more than 70 per cent of the former fall into this category, it is just 14 per cent in the latter.
The present survey also attempt at providing an estimate of annual average per capita expenditure on education at the household level. While the annual per capita expenditure in the government schools15 is INR 2 426 (rural INR 2,143 and urban INR 5,235), in private schools it is INR 11,787 (rural INR 9,111 and
Table 4.12: 6 to14 year students by type of schools currently attended (in %)
Type of School Rural Urban TotalMale Female Total Male Female Total
Govt. 86.70 89.40 88.01 55.80 61.68 58.66 84.61Private 13.30 10.60 11.99 44.20 38.32 41.34 15.39Assam 100.00 100.00 100.00 100.00 100.00 100.00 100.00
Source: HDR Survey, Assam (2013).Note: Government and private schools include government and private Madrassas, respectively
urban INR 17,680). In addition, there exists wide rural-urban disparity; wide variations are seen across districts.
4.7 Higher Education Scenario
Currently, there are 14 universities in the state, including four state public universities, one state open university, two central universities, two institutions of national importance, and five private universities. Four out of the five private universities are recent additions during 2012 to 2014. There are altogether 511 colleges, of which 306 colleges are government colleges. There was a phenomenal increase in the number of colleges during 2012-13, with the addition of 11 private and 123 government colleges to the list. However, access to higher education (14 per lakh population in the18-23 age groups) is yet below the all India average of 25 colleges.
In total, around 12.81 per cent of persons in the age group of 18-23 years in Assam is enrolled in higher education institutions in the state, which is lower than the enrolment rate of 13.38 per cent two years back and much lower than the current all India average of 21 per cent. Among the social categories, ST students are better placed with a higher GER (13.8 per cent) than SC students with a GER of 10.9 per cent,
15 Up to secondary level of schooling.
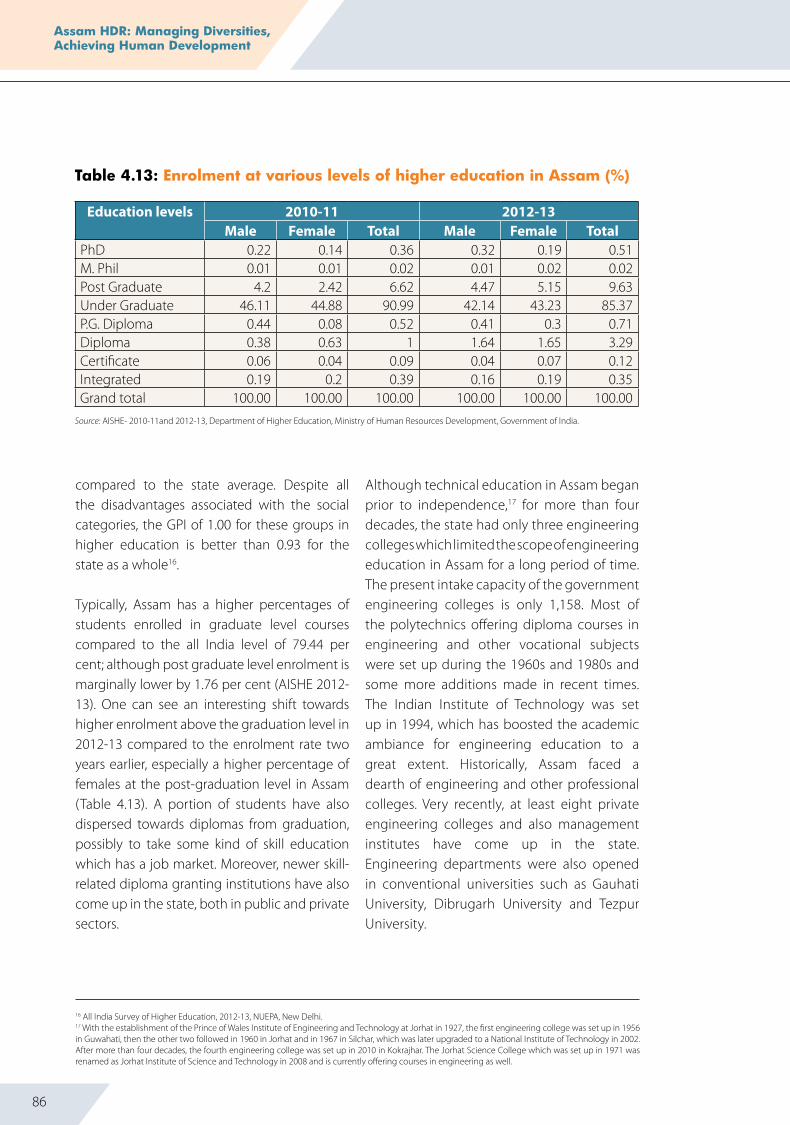
86
Assam HDR: Managing Diversities, Achieving Human Development
compared to the state average. Despite all the disadvantages associated with the social categories, the GPI of 1.00 for these groups in higher education is better than 0.93 for the state as a whole16.
Typically, Assam has a higher percentages of students enrolled in graduate level courses compared to the all India level of 79.44 per cent; although post graduate level enrolment is marginally lower by 1.76 per cent (AISHE 2012-13). One can see an interesting shift towards higher enrolment above the graduation level in 2012-13 compared to the enrolment rate two years earlier, especially a higher percentage of females at the post-graduation level in Assam (Table 4.13). A portion of students have also dispersed towards diplomas from graduation, possibly to take some kind of skill education which has a job market. Moreover, newer skill-related diploma granting institutions have also come up in the state, both in public and private sectors.
Although technical education in Assam began prior to independence,17 for more than four decades, the state had only three engineering colleges which limited the scope of engineering education in Assam for a long period of time. The present intake capacity of the government engineering colleges is only 1,158. Most of the polytechnics offering diploma courses in engineering and other vocational subjects were set up during the 1960s and 1980s and some more additions made in recent times. The Indian Institute of Technology was set up in 1994, which has boosted the academic ambiance for engineering education to a great extent. Historically, Assam faced a dearth of engineering and other professional colleges. Very recently, at least eight private engineering colleges and also management institutes have come up in the state. Engineering departments were also opened in conventional universities such as Gauhati University, Dibrugarh University and Tezpur University.
16 All India Survey of Higher Education, 2012-13, NUEPA, New Delhi.17 With the establishment of the Prince of Wales Institute of Engineering and Technology at Jorhat in 1927, the first engineering college was set up in 1956 in Guwahati, then the other two followed in 1960 in Jorhat and in 1967 in Silchar, which was later upgraded to a National Institute of Technology in 2002. After more than four decades, the fourth engineering college was set up in 2010 in Kokrajhar. The Jorhat Science College which was set up in 1971 was renamed as Jorhat Institute of Science and Technology in 2008 and is currently offering courses in engineering as well.
Table 4.13: Enrolment at various levels of higher education in Assam (%)
education levels 2010-11 2012-13Male Female Total Male Female Total
PhD 0.22 0.14 0.36 0.32 0.19 0.51M. Phil 0.01 0.01 0.02 0.01 0.02 0.02Post Graduate 4.2 2.42 6.62 4.47 5.15 9.63Under Graduate 46.11 44.88 90.99 42.14 43.23 85.37P.G. Diploma 0.44 0.08 0.52 0.41 0.3 0.71Diploma 0.38 0.63 1 1.64 1.65 3.29Certificate 0.06 0.04 0.09 0.04 0.07 0.12Integrated 0.19 0.2 0.39 0.16 0.19 0.35Grand total 100.00 100.00 100.00 100.00 100.00 100.00
Source: AISHE- 2010-11and 2012-13, Department of Higher Education, Ministry of Human Resources Development, Government of India.

87
Literacy and Education:Going to and Staying in School Matters
With only three medical colleges till 2009, Assam suffered from a lack of facilities for medical education for a long time, despite its history of having the seeds of medical education in 1900 AD18. It is only recently that three more medical colleges were established, making it six, with a total intake capacity of 626 seats. Including these and one dental college, there are at present 19 medical institutions catering to pharmacy, nursing and paramedical education in the state. Assam faces a dearth of health professionals especially in the rural areas. As a response, the Government of Assam initiated a course called a Diploma in Medicine and Rural Health Care in 2004.
It is a big challenge for the state that, despite recent attempts at increasing the educational facilities in the state, each year there is a large-scale migration of students to other parts of India, notably, New Delhi, Bengaluru, Mumbai, Pune, Chennai, Hyderabad, and Kolkata, and so on, in search of better education. The lack of quality facilities and scope, inadequate opportunities of employment along with the educational environment have been pointed out as possible reasons for educational out migration in the state.
4.8 People’s Perception about Education
People’s perception about education reflects what people value in education. The HDR survey tried to assess the level of satisfaction of people with the kind of education system that is prevalent in Assam. Respondents were encouraged to express their level of satisfaction with education on four different dimensions: satisfaction with the education system as a
whole; satisfaction with the quality of education that they themselves received; satisfaction with educational opportunities that they needed; and satisfaction with the type of education that their children are getting. What came out very strikingly is that a relatively larger proportion of the urban population expressed satisfaction with all the four dimensions compared to their rural counterparts. In comparison, the rural people expressed an indifference to the four dimensions of education mentioned above and also a larger number of them did not know what to say about satisfaction with education (Table A4.30, Statistical Appendix).
4.9 Summing Up
Assam with its heterogeneous population with diverse socio-cultural, ethnic and political dynamics combined with its difficult terrain and geo-spatial diversities faces immense challenges for the smooth functioning of the education system. Issues which are generic to the state, such as conflicts and disasters and floods and erosion, including other governance-related issues, add to the deficiencies and difficulties which are endemic to the present education system in general. Although initiatives in recent times have led to some improvement in terms of infrastructure and enrolment of students, Assam is yet to achieve the desired level in education.
Secondary data at the national level as well as the extensive household survey conducted in 2013 show that literacy and level of education in Assam are lower than the national average, and particularly low among certain groups such as Muslims and people suffering from multiple spatial disadvantages. But Muslims are
18 British Philanthropist Sir John Berry White, a retired brigadier of the British army and later a surgeon in erstwhile Lakhimpur district in 1870, contributing his lifetime earnings to establish the ‘Berry White Medical School’ in 1900, which was upgraded to Assam Medical College in 1947. After more than a decade, the second and third medical colleges were set up in Guwahati and Silchar in 1960, while the last three were set up only recently in 2009, 2012 and 2013 in Jorhat, Barpeta and Sonitpur, respectively.

88
Assam HDR: Managing Diversities, Achieving Human Development
heterogeneous groups and disaggregated data show that, in nine districts, the level of literacy among Muslims is comparable to their Hindu counterparts. The maximum difference in literacy is observed in four districts, where the Muslim community is composed predominantly of immigrants from erstwhile East Bengal and East Pakistan, that is, the present Bangladesh. Moreover, the presence of 7 per cent of illiterate youths, besides others disadvantages constricts employment possibilities.
Universal enrolment is still an issue in the state, as only 93 per cent of the children in 6- 14 age groups in the households are currently enrolled in school. A large number of children are out of school, accounting for 6.45 per cent of the total Elementary school age children.
An analysis of data from secondary sources indicate that Assam is still deficient in providing all schools within the specified walking distance from habitations as per the Government of India norms at all levels, Primary, Upper Primary, Secondary and Higher Secondary, making access difficult. However, the state government is actively mapping areas to identify locations where more Primary, Upper Primary and Secondary schools are required in the state using Global Positioning System (GPS) and Geographic Information System (GIS) technology. In terms of school infrastructure, although considerable progress has been made, provisioning of good quality buildings, electricity, sanitation and drinking water need efforts.
Although the present exercise did not look at the educational attainment of students, different national surveys reveal that the quality of learning across all levels of the education system in the country is very low, including in Assam. What has become a serious concern for the state is the declining trend in educational attainment. The imbalances reflected in the
HDR survey in terms of educational facilities and outcome need further probe to understand the different contexts for children being out of school, low level of attainment and educational deprivations among certain sections of people.
The teacher component of school education in Assam needs urgent attention. While low level of qualification and professional training has been a historical fact and played its role in the state, the recent introduction of the Teacher Eligibility Test (TET) also could not bridge the gap to the expected level. There is an urgent need to make an assessment as to why the TET qualified teachers cannot play their role and what needs to be done.
The Elementary school age children in the households predominantly go to government schools, but there is a distinct pattern indicating that rural compared to the urban and females compared to the males attend government schools. Despite increasing expenditure on public education, people’s preference for private schools is growing, which is definitely a failure on the part of the government. The preference for private schools is reported to be mainly because of schooling infrastructure, quality of teaching, regularity of classes, teacher attendance and care taken of the students by the school. Although Elementary education is supposed to be free in government schools, households are spending some amount on schooling. Again inequality in the spending pattern on account of education is pervasive across districts reflecting higher spending in households in urban areas and on children attending private schools. This can have deeper implications leading to differential access to education.
In case of higher education, the current enrolment of only 12.81 per cent of youth between 18-23 age groups in higher education is low. It is a big challenge for the
89
Literacy and Education:Going to and Staying in School Matters
state that, despite the recent attempts at increasing the educational facilities in the state, each year there is large-scale migration of students to other parts of India, notably, New Delhi, Bengaluru, Mumbai, Pune, Chennai, Hyderabad, and Kolkata, and so on, in search of better education. Students who study outside the state mention numerous deficiencies in higher education in Assam. Besides, there is a felt mismatch between demand in the job market and potential of the local educational system to meet the requirements of new economy occupations and professional service sector. There is a general perception that educational opportunities are superior in those cities, which will help in securing better job opportunities.
Against this backdrop, certain grey areas emerge: what causes educational disparities
among different groups including the Muslims and non-Muslims? How can the distinct divide between private and government facilities be bridged? What needs to be done to raise the quality of learning at each level of education? Why has higher education in the state failed to be attractive to the youth?
It must be noted that all sources of educational inequalities as revealed in the present report needs differential approaches. The homogenising tendency of educational policies currently being pursued, in all probability, will fail to deliver the desired outcomes. What matters most is a proactive state role in provisioning universal and uniform schooling at the elementary level along the lines of a Common School system as envisaged by the Indian Education Commission way back in 1964-66.

90
Assam HDR: Managing Diversities, Achieving Human Development
Health and NutritionBetter Health of Children Holds a Better Future5

91
Health and NutritionBetter Health of Children Holds a Better Future
5.1 Introduction
Health is a core component of human development. A healthy and long life, free from risks of untimely death or disability apart from being an elementarily valued end in itself is also instrumental in attaining other relevant and valued functionings and, hence, forms a crucial basis of personal well-being. This chapter attempts to investigate some selected aspects of the health and nutrition scenario in Assam, with a perspective of equity and inclusiveness as well as a responsive public health system. In doing so, some vital indicators of health status and access to services are discussed, with specific consideration to issues of disparate performance among the socio-economically and spatially diverse and vulnerable groups. Based on the findings and emerging patterns, imminent priorities are highlighted towards achieving universal and equitable health outcomes and coverage in the state.
5.2 Health Scenario in Assam: Recent Trends
To begin with conventional health indicators put Assam in the band of poor-performing states along with the other such states of north and central India. However, the highly pluralistic socio-cultural milieu and considerable spatial diversity across the state makes the case of Assam unique. Given the scale of diversity, reaching out through appropriate health services influencing the critical health outcomes, understandably, calls for high levels of efficiency and enormous effort.
In this section, a disaggregated picture of the key health indicators of the state is presented highlighting the changes taking place during
recent years. A discussion is also attempted to understand differentials in the average levels of attainment in terms of the state’s demographic, socio-economic and spatial characteristics.
5.2.1Mortality and Causes of Death
Among conventional health indicators, levels and patterns of mortality – across age and sex– is considered as one of the best summary indicators of the overall health status of the population. In fact, indicators such as early-childhood (neonatal, infant and under-five) mortality rates and maternal mortality ratios belong to the wider family of development indicators such as the Millennium Development Goals (MDGs)while adult mortality and causes of death are valuable in assessing the prevailing epidemiological scenario and changing dynamics of diseases.
5.2.1.1 Childhood Mortality
According to the SRS, the Infant Mortality Rate (IMR), that is, the number of children dying before their first birthday, for Assam has fallen from 67 infant deaths per 1,000 live births in 2003 to 55 in 20121. The IMR in the state is, however, constantly declining since the early 1990s (Figure 5.1). Notably IMR levels in urban areas have been consistently lower – about half the rural levels – during the last two decades. In terms of a sex bias in IMR, male infants had greater mortality risks till about the late 1990s, but since then the pattern has somewhat reversed with the male-female gap in infant mortality narrowing(Figure 5.1).
The long-term decline in IMR in the state, as evident from the SRS data (1990-2012), has been steady but at a slower pace than the national average. While, for India, the IMR
1 Child mortality rates such as IMR and Under 5 Mortality Rate (U5MR) have not been estimated from the HDR survey because of a fewer number of reported deaths. However, it may be mentioned that the derived life table based on survey data yields an IMR of 34 for the state as a whole.

92
Assam HDR: Managing Diversities, Achieving Human Development
declined during 1990-2012 from 80 to 42 – a fall of about 47 percent, or at a Compounded Annual (negative) Growth Rate (CAGR) of 2.8 percent – for Assam, the rate of decline was almost half – a fall of 28 percent during the last two decades, or at an annual rate of about 1.4 percent (Figure 5.2). The slow rate of decline in IMR in Assam is a definite cause of concern. Results from the last NFHS-3(2005-06), reiterate the influence of a few well-acknowledged determinants on high levels of infant mortality (71, as per NFHS-3) such as household wealth, mother’s education and age at childbirth, and identified higher mortality risks for higher birth-order children, and for those with shorter birth intervals.
The Annual Health Survey (AHS)2 has so far produced results for two years on district-level key population health outcomes for Assam. Amongst the most critical health outcomes the child survival assumes the utmost priority. Table 5.1 presents the IMR levels of the districts
for 2011-12 and 2012-133. The range of IMR varies from a maximum of 74 in Kokrajhar to a minimum of 40 in Dhemaji in 2011-12. While the maximum of 74 remains unchanged, the minimum declined to 37 in Dhemaji in 2013. According to the 2012-13 figures, 11 of the 23 districts have IMR higher than the state average (Table 5.1). It may be noted that, in some of these districts such as Kokrajhar, Darrang, Dhubri and Karimganj, IMR continues to be at the level where Assam’s state average was about a decade ago. The AHS results serve as a concurrent information source to monitor district-level progress in reducing IMR.
Typically a significant proportion of infant deaths occur during the neonatal period, that is, the first 28 days after the child is born. Accordingly, reducing Neonatal Mortality Rate(NNMR) is considered as a key strategy to reduce infant mortality. The performance of Assam in reducing neonatal mortality, however, presents an intriguing picture.
2 AHS – modelled along the line of SRS – has been initiated in 2010 in nine states of India by the Office of the Registrar General of India.3 AHS provides data only for 23 districts of Assam.
Figure 5.1: IMR by residence and sex, Assam: 1990-2012
Source: SRS, Various Years
Overall Urban Rural Male Female
– – – – – – – – – – – – – – – – – – – – – – –
100 –
90 –
80 –
70 –
60 –
50 –
40 –
30 –
20 –
10 –
0 –
1990
1991
1992
1993
1994
1995
1996
1997
1998
1999
2000
2001
2002
2003
2004
2005
2006
2007
2008
2009
2010
2011
2012

93
Health and NutritionBetter Health of Children Holds a Better Future
Table 5.1: Infant Mortality Rates across districts in Assam, 2011-12 and 2012-13
Districts 2011-12 2012-13Total Male Female Total Male Female
Kokrajhar 74 76 71 74 78 71Darrang 73 70 75 70 69 71Dhubri 68 67 69 69 67 70Karimganj 68 63 74 65 61 69Marigaon 66 68 64 63 65 60Sonitpur 65 64 66 61 60 63Nagaon 64 62 66 62 60 63Nalbari 59 59 60 58 58 58Golaghat 59 56 62 56 55 57Karbi Anglong 59 51 67 60 51 70Goalpara 56 55 56 53 53 53Sibsagar 56 53 60 56 54 59Dima Hasao 56 52 59 54 50 58Jorhat 55 53 56 50 48 52Cachar 54 52 55 53 52 54Hailakandi 54 55 52 52 56 48Lakhimpur 53 47 59 48 43 53Dibrugarh 52 52 53 51 51 51Tinsukia 51 49 53 50 50 50Bongaigaon 49 49 50 48 47 48Barpeta 46 54 37 43 51 34Kamrup 42 43 41 39 41 38Dhemaji 40 38 42 37 37 37Assam 57 56 58 55 55 56
Source: Annual Health Survey Bulletins, Assam (2011-12 and 2012-13.
Figure 5.2: IMR in Assam and India (2003-12)
Source: SRS, Various Years.
– – – – – – – – – – –
67 66 68 67 67 6461
6058 58 57
Assam India
5553
5047
4442
555558
2003
2004
2005
2006
2007
2008
2009
2012
2011
2012

94
Assam HDR: Managing Diversities, Achieving Human Development
Figure 5.3: NNMR by residence: Assam and India (2000-12)
Source: SRS, Various Years.
Unlike its performance in IMR, trends in NNMR in Assam closely shadow the national average, for both overall as well as rural-urban levels. In other words, the mortality risk of children within the first month of birth in Assam is almost similar to that of an average child born anywhere in India (Figure 5.3).
The striking gap between Assam’s and India’s IMR noted earlier, therefore, points towards the mortality risks possibly arising out of the external environment or other causes4 during the time preceding the first month when infant mortality risks are actually the highest. However, in this context, Assam appears again to be a case in point – as is evident from successive SRS data during the last decade, with the exception of Kerala, the percentage of neonatal deaths to total infant deaths is the lowest in Assam among all major states. For example, in 2012, neonatal deaths in Assam accounted for about 58percent of the total infant deaths in the state as compared to the national average of 69percent. This pattern
in the distribution of deaths in the neonatal period for children in Assam – taken together with its relatively better performance in terms of trends in NNMR – suggests that mortality risks for children in Assam is more likely to be stronger in the post-neonatal period than the first month after birth, with an indication towards a greater influence of external causes such as household and community environment, prevalence of pathogens and common infections, and other child-care practices impacting survival risks.
5.2.1.2 Maternal Mortality
Maternal mortality, or death due to causes related to pregnancy and childbirth, is another key health outcome indicator considered to have wider capability implications. The scenario of maternal mortality typically summarises the status of women’s health, health system preparedness and responsiveness, prevailing socio-economic characteristics including general status of women in the society.
4 That is, non-medical causes.
– – – – – – – – – – – – – –
60.0 –
50.0 –
40.0 –
30.0 –
20.0 –
10.0 –
0 –
2000
2001
2002
2003
2004
2005
2006
2007
2008
2009
2010
2011
2012
Assam-T Assam-R Assam-U
India-T India-R India-U

95
Health and NutritionBetter Health of Children Holds a Better Future
The Maternal Mortality Ratio (MMR)5 is one of the few health outcome indicators where India as a whole continues to perform rather poorly. India accounts for a fifth of total maternal deaths occurring in the world6. Presently Assam with an MMR of 328 has the highest MMR in the country (RGI, 2013). Assam’s current MMR, in fact, is even higher than the national average almost a decade ago(Figure 5.4). Besides, the rate of reduction in MMR in Assam (33percent) during 2001-12 has been slower than the national rate of decline (41 percent) during the same period.
The two recent rounds of the AHS – based on a much larger sample than SRS – are, perhaps, a better source to examine the maternal mortality scenario is Assam, and also its variation across regions7. Evidently, MMR has fallen in the state
from 381 in 2010-11 to 301 in 2012-13; region-wise maternal death risks appear to be the higher in the four districts in upper Assam, which also happen to be tea garden districts (Table 5.2).
Not withstanding the declining trend in MMR in the state in recent years, believed to be largely induced by the increase in institutional deliveries consequent on Janani Suraksha Yojana (JSY), the relatively high MMR still continues to be a major concern for the state. Consequently, the Chief Minister’s Vision for Women and Children in Assam targets reducing MMR to 210 by 2016 as a key goal8 through a combination of strategies9. However, much depends on how best the state can take on board different stakeholders with defined roles in such programmatic measures.
5 Expressed as a ratio of maternal deaths per 100,000 live births.6 World Health Organization (2012).7 Given the sample size and design, the HDR survey (2013) is not suitable for robust estimates of MMR.8 Visit http://nedan.in/Chief%20Ministers%20Vision%20for%20Women%20and%20Children%202016.pdf (accessed 6 August 2014).9 These strategies include pregnancy tracking using the Mother and Child Tracking System (MCTS), introducing iron sucrose injections for anaemic women, strengthening quality antenatal care to help identify high-risk pregnancies and complications, strengthening health facilities through 24X7 primary health centres and sub-centre delivery points, emphasising night C-sections using adequate number of specialists.
Figure 5.4: Maternal mortality ratios in Assam and India (2001-12)
Source: RGI, Relevant Years.
Assam India
2001-03 2004-06 2007-09 2010-12
– – – – –
490
301
480
254
390
212 178
328

96
Assam HDR: Managing Diversities, Achieving Human Development
5.2.1.3 Life expectancy and Adult Mortality
Expectation of life at birth is one of the most widely used indicators to summarise population health status largely because of its ability to provide a snapshot of the prevailing mortality and health scenario in a population. It has, therefore, been a core component of HDI since the beginning.
Life expectancy at birth has been steadily improving in the state. During 2002-10 life expectancy at birth in the state increased from 59 years (58.6 years for males and 59.3 years for females) to 62 years (61 years for males and 63.2 years for females). While this denotes considerable improvement in the overall health status in the state, it needs to be noted it is also the lowest among the Indian states; and considered separately by males and females, at a near-equal level with states such as Uttar Pradesh, Madhya Pradesh and Orissa, known to have poor health indicators in general. In fact, the mortality disadvantage of an average Assamese continues over the life-course – age specific life expectancy being relatively lower at all levels compared to other states. Life expectancy in the range of 60-70 is also suggestive of higher inequalities
Table 5.2: MMR in Assam and Administrative Divisions (2010-13)
State/Region 2010-11 2011-12 2012-13Assam (all regions) 381 347 301Hills and Barak Valley Division(Karbi Anglong, North Cachar Hills, Cachar, Karimganj, Hailakandi)
342 288 281
Lower Assam Division(Kokrajhar, Dhubri, Goalpara, Darrang, Bongaigaon, Barpeta, Kamrup, Nalbari)
366 325 254
North Assam Division(Marigaon, Nagaon, Sonitpur, Lakhimpur, Dhemaji)
367 314 251
Upper Assam Division (Tinsukia, Dibrugarh, Sibsagar, Jorhat)
430 436 404
Source: Annual Health Survey, Relevant Years
characterised by a negatively skewed distribution in general.
Other measures of mortality, such as death rates or age-specific death rates also present a similar scenario in the state. Although death rates have steadily fallen in the last decades from 8.0 in 2003 to 7.9 in 2012, the rate continues to be above the national level of (that is,7.0).
5.2.2 Health Status and Burden on Diseases: Through the Lens of Social Determinants
While levels, trends and patterns of mortality in a population provide important snapshots of the prevalent general health conditions, a proper assessment of the population health status requires careful scrutiny of the burden of diseases, the relative contribution of different diseases into it, and prevailing levels of morbidity or ill-health. Better still is to have some information based on broad-based health measures that goes beyond conventional disease surveillance or morbidity statistics.
Several national-level datasets such as the NFHS and the District Level Household Survey (DLHS), morbidity and health care surveys

97
Health and NutritionBetter Health of Children Holds a Better Future
10 The most common limitation is the small sample size preventing robust estimation of parameters at various levels of disaggregation. 11 See Zimmer, Z., Natividad, J., Lin, H.S., Chayovan, N. (2000).12 WHO-SAGE (2009) used a five point scale ranging from ‘very good’ to ‘very bad’. The HDR survey, however, has used a three point scale.
undertaken by the NSSO, the India Human Development Survey (IHDS) conducted by the National Council of Applied Economics and Research (NCAER), and the two surveys by the World Health Organization (WHO) – the World Health Survey (India) during 2003 and its follow-up named as Survey on Ageing and Adult Health (SAGE) in 2009-10 – contain information on Assam’s health scenario, which allows some amount of analysis albeit with a number of limitations10. Given this, the Assam HDR survey was designed and conducted to address some of these shortcomings and this section largely draws on the survey data.
5.2.2.1 Self-Assessed Health
While objective measures such as presence or absence of any ailments or functional limitations serve as important indicators of health status, subjective measures are also considered to be equally important in the health status in a population. In fact, subjective measures, often based on Self-Assessed Health (SAH) status either in absolute terms or relative to the community or peer-groups, are considered as an indicator of physical well-being. Such measures not only embrace physical, psychological and social aspects of health, but also provide a good account of functional ability, life satisfaction, family factors, etc. Moreover, they are also sensitive to variations in objective health11.
As is evident from Table 5.3, a majority (84 percent) reported their current health status as ‘good’ while about 10per.cent rated their health as ‘poor’. If compared roughly with the WHO-SAGE survey (2009) results, similar patterns are evident: 83percent considered their health as either ‘good’ or ‘moderate’, but with a slightly
higher proportion rating their health as ‘bad’ or ‘very bad’ (14percent)12.
It is interesting to note that the proportion of respondents rating their health as ‘poor’ is the highest in the flood-affected areas (19percent), followed by those in the border areas (11percent), while the least is reported in the hilly areas (8percent). The proportion of people rating their health as ‘good’ or ‘poor’, however, does not change across the MPCE quintiles while a rating of ‘excellent’ demonstrates a weak yet gradual increase along with improvement in the household economic status (Table 5.3). The gradient is more pronounced along educational attainment of the respondents, with the proportion rating their current health as ‘poor’ among illiterates (13percent) being more than twice that of those with at least college-level education (6percent). In terms of demographics, females are found to be having a marginally higher reported ‘poor’ health status, while the tendency denoting poorer health status, in general, increases progressively with age.
The HDR survey also collected information on two other dimensions of health perceptions, closely related to health-related functionality aspects of life. These include whether the respondent’s current physical health prevents her/him from doing things which she/he ‘feels like doing’, and another on satisfaction with the ability to carry out daily activities. The two have been combined to derive a simple additive ‘index of self-rated physical functionality’.
It was found that only about 4percent of the respondents have ‘poor’ physical functionality. Although no differentials in functionality levels has been observed between males and females,

98
Assam HDR: Managing Diversities, Achieving Human Development
it is expectedly higher in the ages 55-64 years (5percent) and among the elderly (65 years and above; 8percent). There is some evidence that the functionality ratings are better among those with better education, or higher incomes. In the hills, a relatively higher extent of self-rated functionality difficulty has been reported. However, across the other spatial diversities, the variations were found to be rather insignificant.
5.2.2.2 Morbidity and Burden of Diseases
NSSO (60th Round, 2004-05) data reveal that per 1,000,82 persons in rural Assam and 83 in urban Assam reported suffering from diseases during the 15 days preceding the survey. Using a common reference period of 12 months, the HDR survey (2013) finds a prevalence rate of short-term common morbidities as 125 per
Table 5.3: Self-assessed health status by select background characteristics
Background Characteristics
excellent Good Poor
Place of Residence Rural 5.9 83.4 10.7Urban 4.5 86.5 9.0
Age Groups 15-24 7.5 86.3 6.225-34 7.7 86.5 5.835-44 6.4 86.7 6.945-54 4.7 85.3 10.055-64 3.7 79.2 17.2
65+ 3.2 71.3 25.5MPCE Quintile 1st 3.3 86.1 10.6
2nd 5.2 84.1 10.73rd 6.2 84.7 9.24th 6.4 82.5 11.05th 7.3 82.1 10.6
Educational Level Illiterate 3.4 83.2 13.3Less than Primary 4.2 83.2 12.5
Completed Primary
5.9 83.3 10.7
Secondary 6.6 86.2 7.2Higher Secondary 8.8 84.7 6.5
College 9.9 83.6 6.4Geophysical Diversity Categories
Char 4.6 87.5 7.9Flood-affected 6.3 74.8 18.9
Hill 1.2 93.7 5.0Tea-garden 6.2 84.6 9.3
Border 5.4 83.5 11.2Multiple diversities 2.8 83.9 13.3
General 10.1 82.2 7.8Total 5.7 83.9 10.4
Source: HDR Survey (2013)

99
Health and NutritionBetter Health of Children Holds a Better Future
13 It was possible from the HDR survey to indirectly compute morbidity prevalence estimates with reference periods comparable to the NSSO survey conducted nearly a decade back, using information collected on the ‘onset of the illness’. However, considering the onset period of ‘within 15 days’, similar to the reference period used in the NSSO survey, leads to much lower morbidity levels for the state overall (24/’000 persons), as well as in urban (11 /’000 persons) and rural (26/’000 persons) areas. It should be noted that these estimates exclude chronic ailments. Even if we add currently ailing individuals for chronic ailments, the ‘combined’ morbidity prevalence – closest in spirit to the NSSO estimates – yields a prevalence of 59 ailing persons overall, and 69 for urban areas and 57 for rural Assam which is indicative of a modest decline.
1,000 persons for the state, with 129 persons in rural and 99 persons in urban areas reporting any illness during the reference period. With some indirect adjustments13, however, it appears that self-reported (which also includes proxy reporting by the respondent on behalf of other household members) morbidity levels in Assam have been on a declining trend over the last decade.
It is, however, important to observe how morbidity or incidence of ill-health is clustered spatially and socio-economically, and how the risks of falling sick correlate with wider social determinants of health. Given a 30-day reference period for short-term morbidities and 12 months for chronic morbidities, it could
be found that the prevalence of short-term ailments is higher among females, and follows the classic J-shaped curve across age-groups, with a higher morbidity burden at the younger and older ages, and lower in the middle ages. Education appears to be strongly associated with reported levels of morbidity;illiterates (54/’000) or those with less than primary-level education (45/’000) have more than twice the level of morbidity as compared to their counterparts with post-secondary (24/’000) or college education (21/’000). However, the economic gradient is found to be rather irregular;nevertheless it appears that the poorest families are more likely to have a higher morbidity burden than richer households (Table 5.4).
Table 5.4: Prevalence of self-reported morbidity by background characteristics
Background attributes Self-Reported Proportion of Ailing Persons (PAP)/’000
Short-term morbidity
Chronic Morbidity
Age-groups
0-14 63.215-24 30.6 8.525-34 31.8 20.635-44 40.2 49.745-54 47.6 91.855-64 53.6 149.7
65+ 51.1 220.4Sex Male 40.8 42.9
Female 51.1 42.6Educational level Illiterate 54.0 81.6
Less than Primary 45.1 67.0Completed Primary 40.8 57.3
Secondary 31.8 46.1Higher Secondary 23.6 33.0
College 21.1 66.3

100
Assam HDR: Managing Diversities, Achieving Human Development
Background attributes Self-Reported Proportion of Ailing Persons (PAP)/’000
Short-term morbidity
Chronic Morbidity
Religion Hindu 42.6 44.9Muslim 42.6 44.9
Christian 50.6 40.5Others 67.0 25.6
33.1 26.5Social Group SC 40.4 45.9
ST 50.9 26.8OBC 48.8 48.0
General 43.5 44.0Activity status Cultivator 42.3 54.2
Wage-labour 35.7 41.0Self-employed 26.1 66.7
Salaried 19.8 55.9Others 45.3 33.3
MPCE quintiles Lowest 42.2 17.5Lower-middle 56.8 32.3
Middle 50.4 37.7Upper-middle 42.9 51.5
Highest 35.5 82.3Source of drinking water
Piped water 31.0Tube-well/covered wells 47.1
Unprotected sources 52.6Type of Toilet Sanitary 42.9
Non-sanitary 44.4Open defecation 60.1
Household environment
Separate kitchen/animal sheds
43.5
No separate kitchen/animal shed
51.8
Place of residence & Geophysical Diversity categories
Urban 27.1 65.3Rural 48.9 39.0Char 46.7 28.7
Flood-affected 35.8 55.0Hill 40.3 26.5
Tea-garden 51.7 44.4Border 58.0 40.1
Multiple diversities 52.6 37.0General 43.3 34.6
All Assam 45.8 42.7
Source: HDR Survey (2013)

101
Health and NutritionBetter Health of Children Holds a Better Future
Apart from these social determinants, morbidity levels are significantly affected by wider dimensions of public health such as source of drinking water and type of toilet and sanitation practices, as well as the household environment. As is evident from Table 5.4, reported levels of acute illnesses are much higher in households relying on unprotected sources for drinking water, other than piped water. Similarly, highest reported levels of morbidity (60/’000) could be identified among households practicing open defecation. Further, morbidity levels tend to be much higher in households without having separate kitchens or animal-sheds. The findings from the survey data on self-reported morbidity in Assam thus clearly suggest that, although poverty itself may not result in ill-health, the socio-economic gradient evidently manifests through intermediate effects of education and living standards such as access to modern, improved sources of drinking water, sanitation and cleaner household environment– most definitively and significantly impacting the
critical health advantages and achievements of individuals.
Table 5.4 also presents reported prevalence levels of chronic diseases, based on self-reported information on certain major chronic diseases14. Notably, the reported near equal levels of prevalence of both short-term and chronic ailments for the state as a whole (that is, the last row of the table) is indicative of a ‘double-burden’ of diseases– the epidemiological scenario where both infectious and communicable diseases (predominating short-term ailments) and non-communicable, lifestyle diseases (predominating chronic ailments) affect simultaneously.
Data of the HDR survey, interalia, allow some useful disaggregation highlighting the association between socio-economic factors and reported levels of chronic ailments. Firstly, unlike in the case for short-term morbidities, reported levels of chronic morbidities appear
Figure 5.5: District wise Prevalence of Short-term and Chronic Morbidities
* denotes figure based on 25-75 observations for short-term morbidities, ** denotes the same for chronic morbidities. Chirang and Dima Hasao are not included for very low sample sizes.
14 These include diabetes, angina/heart ailments/stroke, hypertension, arthritis/joint pains, cancer, asthma/COPD, and diseases of the kidney and liver.
– – – – – – – – – – – – – – – – – – – – – – – – – –
Kokr
ajha
r**
Goa
lpar
a
Soni
tpur
Dhu
bri
Baks
a
Karim
ganj
Tins
ukia
Sibs
agar
Hai
laka
ndi
Kam
rup
Nag
aon
All
Ass
am
Karb
i Ang
long
Jorh
at
Dhe
maj
i
Gol
agha
t
Kam
rup
(M)
Cach
ar
Baon
gaig
aon
Uda
lgur
i*
Dar
rang
*
Dib
ruga
rh
Barp
eta
Lakh
impu
r*
Mar
igao
n*160.00 –
140.00 –
120.00 –
100.00 –
80.00 –
60.00 –
40.00 –
20.00 –
0.00 –
PAP-short term morbidity PAP-chronic morbidity
Person per thousand

102
Assam HDR: Managing Diversities, Achieving Human Development
to be higher amongst economically better-off sections; in fact, the proportion of people reporting chronic morbidities in the richest MPCE quintile is nearly five times more than in the poorest classes, which somewhat supports the long-held notion of chronic ailments being associated with affluence. The observed low prevalence of chronic morbidities amongst the lower MPCE quintiles may also be due to under-reporting since many of them remain undiagnosed. However, a rather irregular pattern is noticed in the prevalence of chronic morbidities with regard to educational levels, and also across type of economic activity. In terms of demographics, quite expectedly, the reported prevalence of the chronic morbidity progressively increases with age, but without any discernible sex bias.
Data on both short-term as well as chronic morbidities in the state reveal considerable variation in their prevalence levels across districts, and also across spatial diversity categories. This, in a way, highlights the unique vulnerabilities arising out of natural topographies and other environmental risks in the state. The highest levels of reported acute illnesses could be noticed in the hills and in the border areas (Table 5.4). It is, however, intriguing that the observed prevalence rate of short-term morbidity is low in the flood-affected regions. In the case of chronic ailments, on the other hand, the order is reversed with the highest prevalence to be found in the flood-prone areas. Overall, it is indicated that, while for rural Assam, acute, short-term ailments are much higher, in the case of urban areas, chronic ailments are almost twice more common. A resonance of such apparent complementarities in terms of the comparative prevalence of both these disease forms could be seen across districts (Figure 5.4).
Malaria is a major public health problem in Assam. Nearly a third of the state’s population lives in malaria-endemic regions, with the state contributing to nearly 5 per cent of the total malaria cases in the country. Prolonged rainfall, high temperature and humidity prevailing throughout the year have been identified as major causes of such high incidence of malaria in the state15. Both Plasmodium falciparum and Plasmodiumvivaxare abundant, but the later –the killer protozoan – is responsible for nearly 60 percent of the cases. Data reveal that malaria is highly endemic in eight districts–Karbi Anglong, Dima Hasao, Goalpara, Hailakandi, and the BTAD districts of Kokrajhar, Chirang, Baksa and Udalguri – together accounting for nearly three-fourths of the total malaria cases in the state. According to the State Programme Implementation Plan (PIP) of the National Health Mission (NHM), during 2012-1316, 629 sub-centres covering a population of about 3.3 million are in the highly endemic regions, with high concentrations in hilly or forest areas, or along the international borders. The Annual Parasite Incidence (API), defined as the number of confirmed cases per thousand of population was ≥2 in all but 10 districts of the state; in the eight districts mentioned above, API ranges within 4-11, denoting an excessively high incidence.
It may be noted that the recent and growing phenomenon of chloroquine resistance, similar to the experience in several other Southeast Asian countries, some of which border or are close to Assam, is emerging as a major concern17. Accordingly, in 2004, there was switch from chloroquine to sulfadoxine-pyrimethamine as the first line of therapy in districts with proven chloroquine resistance; a further switch to the artemisin combination therapy (ACT) took place in2007 as advocated by the National
15 Dev, V., Dash, A.P., Khound, K. (2006). High-risk areas of malaria and prioritizing interventions in Assam, Current Science, 90(1), 10 January 2006.16 The latest PIP (2013-14) has not reported the NVDCP figures for malaria. On availability with the State Health Society, this can be updated. 17 Dev, V., Sharma, V.P., Hojai, D. (2009). Malaria transmission and disease burden in Assam: challenges and opportunities, Journal of Parasitic Disease, (June & December 2009) 33(1&2):13–22.

103
Health and NutritionBetter Health of Children Holds a Better Future
Vector-Borne Disease Control Programme (NVDCP). It is expected, as supported by recent research18, that following the introduction of ACT therapy gradually in most high API areas of the state and greater intensification of the two main personal control efforts indoor residual spraying (IRS) and long-lasting insecticidal nets (LLIN), aided by better monitoring, reporting and overall strengthening of peripheral health facilities and building vector control awareness efforts, could lead to a gradual decline and better outcomes in the state.
It may, further, be noted that specific disease and health conditions have global and national importance given the persistent or emerging challengesrelating to them. These include non-communicable diseases as well as risk-factors such as hypertension, diabetes, and their accompanying public health risks such as smoking, alcohol consumption and physical activity. Common childhood illnesses such as diarrhoea and pneumonia/acute respiratory infections also add a considerable burden of acute illnesses impacting health ‘advantages’ and ‘achievements’ of people. The next section deals with some of these aspects.
5.2.2.3 Common Non-communicable Diseases: Hypertension and Diabetes
Non-Communicable Diseases (NCDs) are the major cause of mortality globally, including in low- and middle-income countries. Over the years, India is witnessing a consistent rise in the incidence of NCDs with a corresponding impact on mortality together with wider economic consequences in treatment, rehabilitation, productivity losses and disability19. Furthermore,
NCDs have ceased to be predominantly ‘diseases of affluence’ with growing evidence in support of significant, if not higher, risks among the poor and other disadvantaged socio-economic status groups20.
It has been observed that hypertension is a major NCD in terms of its prevalence and mortality impacts, as well as other fatal health consequences such as stroke, diabetes, and coronary heart diseases. In India, hypertension is a leading NCD risk and estimated to be responsible for nearly 10percent of all deaths21. Adult hypertension prevalence has risen steadily over the past three decades from 5percent to between 20-40percent in urban areas and 12-17percent in rural areas. Based on blood-pressure measurement data, the prevalence in Assam is found to be 19percent22, slightly above than the national average of 18percent. Interestingly, a higher prevalence of hypertension can be seen in rural Assam (20 percent, standard error 0.013) as compared to urban areas (13 percent, standard error 0.022). Females are found to be marginally higher hypertensive than males in Assam, and the proportion of hypertensive adults rapidly increases with age – a quarter (25percent) in those aged 46-60 years, nearly a third (32percent) in the age-group 61-75 years, and more than half (55percent) in the older ages of 75+ in the state are diagnosed to have high blood pressure(WHO-SAGE, 2009). However, no clear socio-economic gradient – either in terms of the standard MPCE groups or educational levels – is evident in the prevalence of hypertension. The AHS, on the other hand, reports the prevalence of hypertension in the state at 3,999 per 100,000 individuals.
18 Yadav, K., Dhiman, S., Rabha, B., et al (2014).Socio-economic determinants for malaria transmission risk in an endemic primary health centre in Assam, India, Infectious Diseases of Poverty, 3:19 (2014)19 See Thakur, J. S., et. al. (2011) as well as Engelgau, M., Karan, A., Mahal, A. (2012).20 See, for example, Vellakkal S., et al. (2013).21 Patel, V., et al. (2011).22 Following the methodology suggested by Lloyd-Sherlock, et al. (2014), the reported figures for hypertension were calculated based on a level of systolic blood pressure >=140 mm of Hg, and a diastolic blood pressure >=90 mm of Hg, taking the mean of the last two readings (reading # 2 and #3) as provided in the unit record data of WHO-SAGE individual-level data file for India.

104
Assam HDR: Managing Diversities, Achieving Human Development
The HDR survey too attempted to elicit responses on any diagnosed incidence of hypertension. Accordingly, the prevalence rate of hypertension is found to be 10 per 1,000 persons in the state as a whole. The rate, however, is found to be 20 per 1,000 persons in urban areas.
Besides hypertension, the AHS Report (2012-13) also indicates 935 persons per 100,000 in Assam have symptoms of diabetes. According to the WHO-SAGE data, less than 2percent of individuals in Assam (3percent in urban and 1.2percent in rural areas) had reported to be diagnosed with diabetes (or high blood sugar levels). Epidemiological data on diabetes, unfortunately, are rare. Further, it has been observed that undiagnosed diabetes, similar to hypertension, could be substantial. Evidence also suggests that the pattern of diabetes onset has witnessed a change in recent years, affecting more younger people and children; clearly, comprehensive screening programmes for early detection of the disease should be of high priority, followed by provision of the required healthcare services at the primary level.
In this direction, a notable attempt in Assam under the NHM and the aegis of the National Program on Prevention and Control of Cancer, Diabetes, Cardiovascular Diseases and Stroke has been to initiate screening for chronic diseases at the sub-centre level, for the adult population aged 30 and above, in five pilot districts -- Kamrup, Jorhat, Sivasagar, Dibrugarh and Lakhimpur -- under Phase I. Reportedly, male Multi-Purpose Workers have been trained, diagnostic kits provided, and screenings have started since January 2012. According to this facility-based NCD screening system data, nearly 2.2 million screenings have been conducted in the first two-and a-half years of the programme; as the most recent estimates suggest, about 7percent of the people getting themselves screened under the programme
were suspected of having diabetes, and about 9percentof having hypertension, with some variation cross districts.
5.2.2.4 Childhood Illness: Diarrhoea and Acute Respiratory Infections
Evidence suggests that Assam marks an incomplete epidemiological transition, featured by near-equal predominance of both chronic, non-communicable diseases, on the one hand, and infectious, communicable diseases, on the other. Common childhood illnesses such as diarrhoea, pneumonia and other infections still prevail in the state exerting a disproportionate burden on the population, in general, and those marginalised, in particular.
About a decade ago, 7percent of under-fives in Assam reportedly had symptoms of Acute Respiratory Infections (ARIs), 14percent had other unspecified fevers, and 8percent suffered from diarrhoea (NFHS 3, 2005-06). About a couple of years later, another large-scale survey –DLHS-RCH III (2007-08), with a much larger sample of children, estimated 12percent of children having ARI symptoms, but only 4percent suffering from diarrhoea. A higher prevalence of both these childhood morbidities was noticed in the districts of Karimganj, Dhemaji, Cachar, Hailakandi, Sonitpur and Dhubri. None of these surveys, however, could find any regular pattern in terms of conventional vulnerability profiles such as social groups, education or wealth. The mother’s education was indicating a weak relation though.
The next set of results and estimates on these illnesses follow from the recent rounds of the AHS. However, unlike DLHS, this survey included information not only for children but for all household members. Nevertheless, the estimates give some idea about the most recent disease burden of these common illnesses.

105
Health and NutritionBetter Health of Children Holds a Better Future
According to the latest round (2012-13), ARI prevalence in Assam, on the whole, has been estimated at about 5percent, prevalence of diarrhoea at around 1percent, and unspecified fevers at about 4 percent. Among the districts, a higher prevalence of ARI was reported for Nagaon (17percent), Hailakandi (12percent), and Jorhat (11percent); for diarrhoea the higher prevalence districts include Hailakandi (4percent), Cachar (3percent), and Karimganj (3percent).
5.2.2.5 Risk Factors and Preventive Health Behaviours
There has been a wide acknowledgement in the recent past that, faced with the growing, and highly varied burden of diseases – more particularly among the poor and vulnerable groups – relying on curative care is most unlikely to be effective, efficient as well as sustainable. The axis of focus of the health system’s response
23 Notably, among the 14 states having a higher level of tobacco consumption than the national average (35 per cent), eight are from the north-east, with the country’s highest level reported in Mizoram (67 per cent). Assam, in fact, has the lowest prevalence in the north-east.
to both persistent and emerging disease risks is gradually shifting worldwide towards preventive health behaviours and modifiable risk factors. These include a broad spectrum of risky health behaviours – smoking, alcohol consumption, dietary habits, physical activity and lifestyle, use of improved toilets and proper treatment and storage of drinking water, hand-washing and waste-disposal. This section outlines major contour of these aspects. According to the Global Adult Tobacco Survey (GATS, 2009-10) in India, more than a third of adults in Assam (39percent) were found to be current tobacco users23, with 29percent being daily users. Among males, the proportion of tobacco-users is very high at 53percent (against the national average of 48percent - the north-east average being 57percent), and also among the females (25percent, as compared to the national average of 20percent, the north-east average is 31percent). However, a quarter
Figure 5.6: Socio-economic differentials in smoking, males
Source: Calculated from GATS data.
33 33
2119
28 27
23
29
25
30
27
13 13
22
18 18
23
19
Current Smokers
Education Education Education Education
(In percent)
Education Wealth Groups Wealth Groups Wealth Groups
Wealth Groups Residence Residence Residence
Daily Smokers

106
Assam HDR: Managing Diversities, Achieving Human Development
24 See, for example, Lee, I.M., Shiroma, E.J., Lobelo, F., et al. (2012). Physical inactivity is considered as the fourth leading risk factor for global mortality (6 percent of global deaths), and is estimated to be the main cause for approximately 21-25 percent of breast and colon cancers, 27 percent of diabetes and approximately 30 percent of thechaemic heart disease burden (http://www.who.int/dietphysicalactivity/pa/en/)25 Global Strategy on Diet, Physical Activity and Health, WHO (http://www.who.int/dietphysicalactivity/factsheet_adults/en/). These standards are for adults aged 18-64 years.26 This ‘Index of Physical Activity’ combines information on three dimensions: use of bicycles or walking for at least 10 minutes for transport and engaging in any sports, fitness, or leisure/recreational activities (of vigorous or moderate intensity). For the former, time spent per week was also taken into consideration. This ‘index’ excludes physical activity as a part of normal daily ‘work’ or occupation. The three categories used are derived using cut-points from an additive score derived from combining the answers above. Detailed results are available on request. 27 These include: washing hands before eating, washing hands with soap after defecating, keeping food and uncooked rations covered, washing food before cooking, and pouring water from containers using ladles.
(25percent) of the population uses smokeless tobacco, with the proportion of smokers relatively low (7percent only smokers, and 8percent using both forms of tobacco).
In view of the growing emergence and spread of NCDs, there is now an increasing acceptance about the association of NCD risks with lifestyles, and particularly physical activity habits. Little or no physical activity coupled with largely sedentary occupations is considered to be one of the major risk factors for increasing vulnerability to a wide array of NCDs24. The WHO recommends at least 30 minutes of moderate to brisk physical activity such as running, walking, biking, exercises, sports each day, or about 150 minutes per week25. In India, population-based estimates on physical activity patterns remain very rare, with the WHO-SAGE survey being a possible exception. According to a summary measure of physical activity developed from the data26, a little more than a fourth (27percent) of the individuals interviewed in the seven states were found to be engaging in heavy/vigorous physical activity and less than a third (32percent) engaged in moderate forms of such activities. In Assam, the proportion of individuals found to be engaged in little or no physical activity is the highest (51percent) among the seven states included in the survey, with 30percent engaging themselves in moderate forms of physical activity, and 19percent with vigorous forms. Along expected lines, physical activity habits appear to be stronger and more intense in rural rather than in urban areas, with 20percent of the individuals in rural areas as compared to only 8percent in urban areas found to carry out heavy physical activity; in
urban areas, moderate physical activities are generally preferred. Physical activity patterns in Assam also seemed to change with education and incomes: Notwithstanding this, even those with less education or income are found to have a similar sedentary lifestyle hinting at a growing risk of clustering for NCDs among them as well.
The HDR survey offers data on the last of the risk factors related to a set of health and sanitation behaviours27. The data raise concern for two types of habits: washing hands with soap after defecating, and pouring water from storage containers using ladles (and avoiding direct contact of bare hands with water). About a quarter (26percent) of the respondents does not practice hand-washing using soaps after defecating, and 30percent does not use ladles while pouring water (Table 5.5). So far as the socio-economic gradients are concerned, it is found that more than three out of every five individuals with little or no education or formal schooling do not use soaps after defecation (which is most likely in the open), and do not follow appropriate hygiene while drinking water, both of which clearly increases health risks. Clearly, the road to ensure safe, improved basic behaviours of hygiene and sanitation remains long, and there is a strong felt need which goes on to emphasise the engineering of crucial behavioural change in the state.
5.2.3 Nutritional Status of Children in Assam
Besides the issues of early childhood health and survival outcomes, a key component of human development relates to nutritional
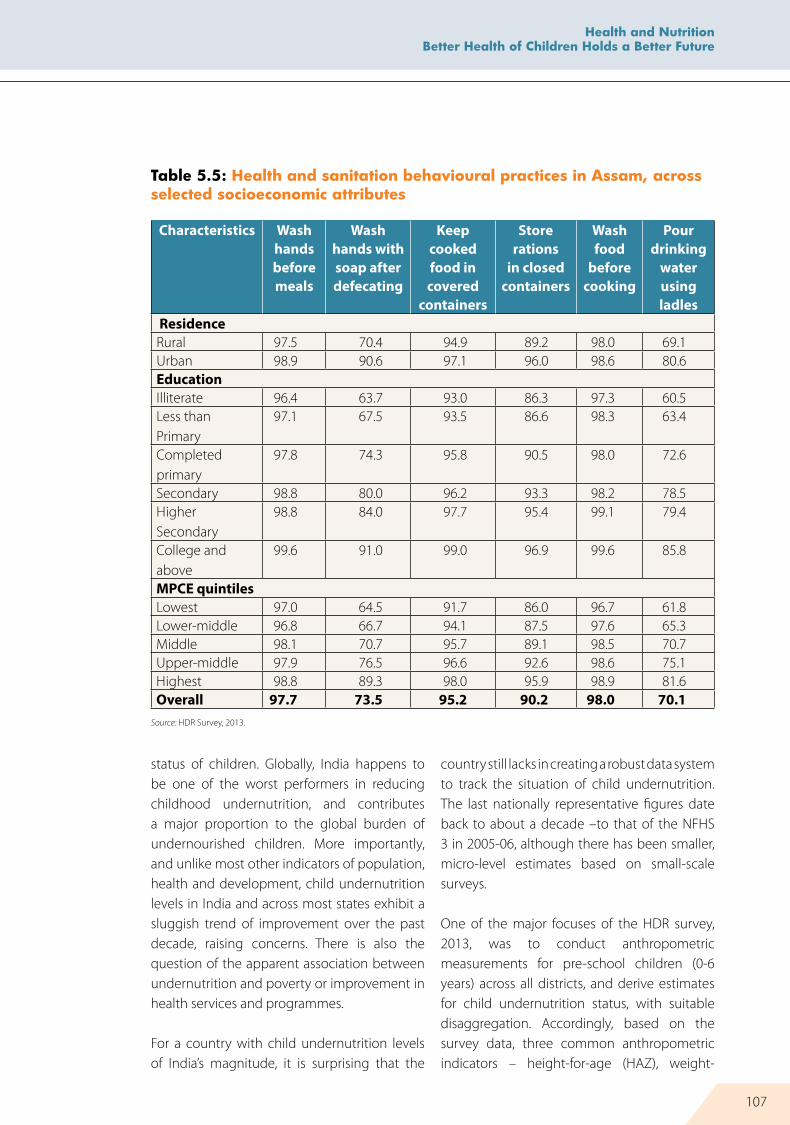
107
Health and NutritionBetter Health of Children Holds a Better Future
status of children. Globally, India happens to be one of the worst performers in reducing childhood undernutrition, and contributes a major proportion to the global burden of undernourished children. More importantly, and unlike most other indicators of population, health and development, child undernutrition levels in India and across most states exhibit a sluggish trend of improvement over the past decade, raising concerns. There is also the question of the apparent association between undernutrition and poverty or improvement in health services and programmes.
For a country with child undernutrition levels of India’s magnitude, it is surprising that the
country still lacks in creating a robust data system to track the situation of child undernutrition. The last nationally representative figures date back to about a decade –to that of the NFHS 3 in 2005-06, although there has been smaller, micro-level estimates based on small-scale surveys.
One of the major focuses of the HDR survey, 2013, was to conduct anthropometric measurements for pre-school children (0-6 years) across all districts, and derive estimates for child undernutrition status, with suitable disaggregation. Accordingly, based on the survey data, three common anthropometric indicators – height-for-age (HAZ), weight-
Table 5.5: Health and sanitation behavioural practices in Assam, across selected socioeconomic attributes
Characteristics Wash hands before meals
Wash hands with soap after defecating
Keep cooked food in covered
containers
Store rations
in closed containers
Wash food
before cooking
Pour drinking
water using ladles
ResidenceRural 97.5 70.4 94.9 89.2 98.0 69.1Urban 98.9 90.6 97.1 96.0 98.6 80.6educationIlliterate 96.4 63.7 93.0 86.3 97.3 60.5Less than Primary
97.1 67.5 93.5 86.6 98.3 63.4
Completed primary
97.8 74.3 95.8 90.5 98.0 72.6
Secondary 98.8 80.0 96.2 93.3 98.2 78.5Higher Secondary
98.8 84.0 97.7 95.4 99.1 79.4
College and above
99.6 91.0 99.0 96.9 99.6 85.8
MPCe quintilesLowest 97.0 64.5 91.7 86.0 96.7 61.8Lower-middle 96.8 66.7 94.1 87.5 97.6 65.3Middle 98.1 70.7 95.7 89.1 98.5 70.7Upper-middle 97.9 76.5 96.6 92.6 98.6 75.1Highest 98.8 89.3 98.0 95.9 98.9 81.6Overall 97.7 73.5 95.2 90.2 98.0 70.1
Source: HDR Survey, 2013.
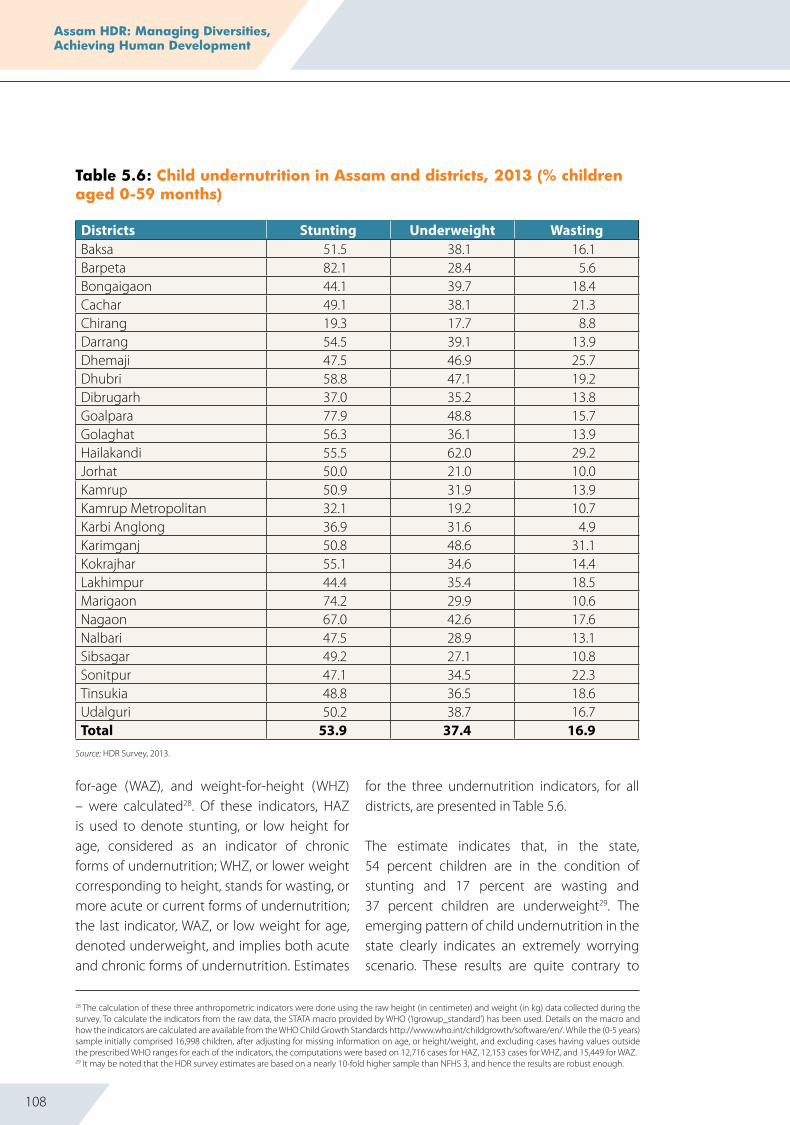
108
Assam HDR: Managing Diversities, Achieving Human Development
for-age (WAZ), and weight-for-height (WHZ) – were calculated28. Of these indicators, HAZ is used to denote stunting, or low height for age, considered as an indicator of chronic forms of undernutrition; WHZ, or lower weight corresponding to height, stands for wasting, or more acute or current forms of undernutrition; the last indicator, WAZ, or low weight for age, denoted underweight, and implies both acute and chronic forms of undernutrition. Estimates
for the three undernutrition indicators, for all districts, are presented in Table 5.6.
The estimate indicates that, in the state, 54 percent children are in the condition of stunting and 17 percent are wasting and 37 percent children are underweight29. The emerging pattern of child undernutrition in the state clearly indicates an extremely worrying scenario. These results are quite contrary to
Table 5.6: Child undernutrition in Assam and districts, 2013 (% children aged 0-59 months)
Districts Stunting Underweight WastingBaksa 51.5 38.1 16.1Barpeta 82.1 28.4 5.6Bongaigaon 44.1 39.7 18.4Cachar 49.1 38.1 21.3Chirang 19.3 17.7 8.8Darrang 54.5 39.1 13.9Dhemaji 47.5 46.9 25.7Dhubri 58.8 47.1 19.2Dibrugarh 37.0 35.2 13.8Goalpara 77.9 48.8 15.7Golaghat 56.3 36.1 13.9Hailakandi 55.5 62.0 29.2Jorhat 50.0 21.0 10.0Kamrup 50.9 31.9 13.9Kamrup Metropolitan 32.1 19.2 10.7Karbi Anglong 36.9 31.6 4.9Karimganj 50.8 48.6 31.1Kokrajhar 55.1 34.6 14.4Lakhimpur 44.4 35.4 18.5Marigaon 74.2 29.9 10.6Nagaon 67.0 42.6 17.6Nalbari 47.5 28.9 13.1Sibsagar 49.2 27.1 10.8Sonitpur 47.1 34.5 22.3Tinsukia 48.8 36.5 18.6Udalguri 50.2 38.7 16.7Total 53.9 37.4 16.9
Source: HDR Survey, 2013.
28 The calculation of these three anthropometric indicators were done using the raw height (in centimeter) and weight (in kg) data collected during the survey. To calculate the indicators from the raw data, the STATA macro provided by WHO (‘igrowup_standard’) has been used. Details on the macro and how the indicators are calculated are available from the WHO Child Growth Standards http://www.who.int/childgrowth/software/en/. While the (0-5 years) sample initially comprised 16,998 children, after adjusting for missing information on age, or height/weight, and excluding cases having values outside the prescribed WHO ranges for each of the indicators, the computations were based on 12,716 cases for HAZ, 12,153 cases for WHZ, and 15,449 for WAZ. 29 It may be noted that the HDR survey estimates are based on a nearly 10-fold higher sample than NFHS 3, and hence the results are robust enough.

109
Health and NutritionBetter Health of Children Holds a Better Future
Table 5.7: Nutritional status of children in Assam, selected characteristics
Attributes Stunting Wasting UnderweightSexMale 55.0 17.7 39.0Female 52.9 16.1 35.7Age Groups0-12 53.5 19.4 48.713-24 58.5 18.7 40.525-36 56.4 18.4 38.037-48 50.3 17.8 32.649-60 48.9 15.3 28.2ResidenceRural 55.0 17.1 38.2Urban 44.3 15.6 30.4Geophysical Diversity CategoriesChar 61.8 14.7 37.9Flood-affected 49.7 17.3 33.7Hill 36.6 4.9 28.3Tea-garden 46.8 18.2 33.6Border 47.4 22.3 39.8Multiple diversities 55.1 24.6 45.8General 66.1 12.6 37.7MPCe Quintiles1st 57.8 16.1 39.32nd 55.4 17.4 38.43rd 52.7 16.4 36.64th 50.9 17.8 36.55th 41.2 15.6 29.8
Source: HDR Survey, 2013.
the reduction in poverty, improvements in education as well as considerable expansion of health and other social services across the state.
As for the districts in the state, the proportion of underweight children, which we may consider as a summary indicator of child undernutrition, is very high in the districts of Hailakandi, Goalpara, Karimganj, Dhubri, Dhemaji, Nagaon, Bongaigaon and Cachar, where two out of every five children in the age-group of 0-5 years are underweight. Even for other districts, the scenario is far from encouraging: in 10 other districts at least a third of the children are underweight. The overall scenario appears
to be relatively better in Chirang, Kamrup Metro, Jorhat, Sibsagar, Nalbari, Karbi Anglong, Dibrugarh, Lakhimpur and Tinsukia.
A considerable variation in the proportion of undernourished children could also be noticed across other geographical diversity categories, and other socio-economic parameters (Table 5.7). Adverse nutritional outcomes are higher among male children, and lower among older children. In fact, it is noted with great concern that nearly half the infants (below 1 year) are underweight, likely indicating an impact of maternal undernutrition leading to low birth-weights. Expectedly, all three forms of nutritional

110
Assam HDR: Managing Diversities, Achieving Human Development
indicators indicate a higher burden in rural areas, but even urban levels are substantial. In the same vein, it is noted that, although the difference in proportion of undernourished children is considerable between the two extremes of economic status denoted by the lowest and highest MPCE quintile, average levels of undernutrition are considerable even among the wealthiest; three children in 10, in the top most quintile are found to be underweight, signalling factors other than income, education and living standards to be playing a significant role in shaping nutritional outcomes among children in Assam, underlying areas for further deep probing.
5.3 Coverage of Health and Nutrition Services and Equity in Access
In line with the renewed global commitment to ensure ‘Health for All’, there has been a marked move in the national health policy towards Universal Health Coverage (UHC). Evidently, UHC embodies a vision to ensure the availability and accessibility of health services at affordable costs, which, in turn, lead to health outcomes that are equitable across income groups, social status, occupations/livelihoods, religion and ethnicity, or any other disaggregation. The underlying objective is to improve health outcomes across population groups, reduce financial risks associated with ill-health, and ensure equity in access. The UHC vision in India proposes that every citizen be entitled to essential primary, secondary and tertiary healthcare services, guaranteed by the state30. Within this vision, the government is mandated to act as not only the provider of health and related services, but also the guarantor and enabler.
In this context, Assam appears to be uniquely poised with several pioneering steps, capped by the promulgation of the Public Health Act 2011.
5.3.1 Availability and Adequacy of Health Services in Assam
5.3.1.1 Government Health Facilities
The health system in Assam is organised in a similar manner as in the rest of India. Typically, the government healthcare system is organised in hierarchically, starting with the Sub-Health Centres sequentially leading to a network of Primary Health Centres (PHCs) and Block Primary Health Centres (BPHCs), Community Health Centres (CHCs), and the District Hospitals (DHs). The CHCs and DHs constitute the secondary level of healthcare services, with medical college hospitals, regional centres and other specialty hospitals bringing up the tertiary level. The system also comprises informal medical care providers with little or no formal knowledge and training. In urban areas, self-medication tends to be rife with drug-stores and pharmacies often assuming the role of a dispensing chemist. The pluralist system is completed by both qualified as well as unqualified practitioners in traditional systems of medicine such as unani and ayurveda as well as homeopathy.
Assam currently has 5,736 public health institutions, comprising six medical colleges, 25 DHs, 13 sub-divisional hospitals (at the level of CHCs), 108 CHCs, 975 PHCs and 4,609 Sub-Health Centres (Table 5.8). Among these facilities, in 2014, there were 1,088 hospitals with 7,504 beds in rural areas of the state, and 49 hospitals in urban areas with 5,877 beds, thereby leading to a population per
30 Recommendations of the High-Level Expert Group (HLEG) on Universal Health Coverage, 2011

111
Health and NutritionBetter Health of Children Holds a Better Future
Table 5.8: Public health infrastructure in Assam
District Medical College
DH SDCH CHC PHC Sub-Health Centre
Total No. of Health
Institutions Barpeta 1 1 1 6 50 264 323Baksa 0 1 0 4 39 157 201Bongaigaon 0 1 0 2 30 57 90Cachar 1 1 0 1 30 270 303Chirang 0 1 0 2 25 83 111Darrang 0 1 0 4 30 170 205Dhemaji 0 1 0 3 21 98 123Dhubri 0 1 1 6 43 246 297Dibrugarh 1 0 0 5 25 231 262Goalpara 0 1 0 2 41 151 195Golaghat 0 1 1 4 40 144 190Hailakandi 0 1 0 2 12 105 120Jorhat 1 0 2 4 42 144 193Kamrup(metro) 2 1 0 3 25 51 82Kamrup 0 1 1 9 70 280 361Karbi Anglong 0 1 1 5 47 152 206Karimganj 0 1 0 2 27 221 251Kokrajhar 0 1 1 4 45 159 210Lakhimpur 0 1 1 5 28 156 191Marigaon 0 1 0 2 33 123 159Nagaon 0 1 0 11 74 357 443Nalbari 0 1 0 7 45 121 174Dima Hasao 0 1 0 2 11 65 79Sibsagar 0 1 2 2 42 219 266Sonitpur 0 1 2 3 53 274 333Tinsukia 0 1 0 5 23 164 193Udalguri 0 1 0 3 24 147 175Assam 6 25 13 108 975 4,609 5,736
Source: State Health Society, National Health Mission, Assam.
31 Ministry of Health and Family Welfare (2013).‘Health Infrastructure’ in National Health Profile – 2014, Central Bureau of Health Intelligence, Director-General of Health Services, Ministry of Health and Family Welfare, Government of India. Available online at http://www.cbhidghs.nic.in/writereaddata/mainlinkFile/Health%20Infrastructure-2013.pdf(accessed on 11 August 2014).32 R See Ministry of Health and Family Welfare(2012). Rural Health Statistics in India 2012. Available online at http://mohfw.nic.in/WriteReadData/l892s/8551027042RHS%202012.pdf (accessed on 11 August 2014).
hospital figure of 27,545, with one hospital bed available for an average of 2,341 individuals of the state31. This indicates considerable progress in a short time-span of four years by the state government in adding more beds to existing facilities, as in 2010 each government hospitals served a population of 19,486, with one bed per 3,911 individuals.
Some additional insights on the adequacy of the available health facilities in the public sector could be gleaned from Rural Health Statistics
in India – 2012. According to this report, only about half the PHCs (52percent) in Assam have at least four beds – a requirement under the Indian Public Health Standards and the National Rural Health Mission (NRHM) – and 60percent of the CHCs have at least 30 beds. The national average remains considerably high at 67percent of the PHCs and 71percent of the CHCs having the recommended infrastructure in terms of availability of the beds32. Furthermore, there is a 21percent shortfall in the number of sub-centres and 54percentin CHCs in the state, as

112
Assam HDR: Managing Diversities, Achieving Human Development
per the number required based on population coverage norms.
5.3.1.2 Health Human Resources
There are about 1,500 physicians available across the 975 PHCs in Assam, and 275 specialists posted in the 109 CHCs33. According to Rural Health Statistics 2012, of the 975 PHCs in Assam, 78 had four or more doctors, 102 had three, 379 had two, and 416 ran with only one doctor. However, in 373 of these PHCs, no female doctors were available. Moving up towards a higher facility level, against the 109 required positions of surgeons across the CHCs, only 24 positions were filled, leaving more than two-third of these facilities without the services of a surgeon. The scenario is marginally better in the case of obstetricians/gynaecologists; about two-third of the CHCs (60) have specialists. It may be noted that although such shortfalls may constitute a crucial handicap for Assam – more so because of the state is a high maternal mortality area – the state’s figures are much better than the national average.
The scenario for other paramedical and technical staff, as well as health workers, at different levels of government health facilities in Assam presents a mixed picture. Across the 109 CHCs, 256 medical officers, 65 radiographers (a shortfall of 44 from the sanctioned positions), 1,303 pharmacists (a surplus of 46 positions), 1,243 lab technicians (a surplus of nearly 400 technicians) are in place (2012). Regarding nurses, against the sanctioned strength of 2,798 at the combined PHC and CHC levels, 2,795 nurses are in position. At lower levels of health facilities, and for the cadre of health workers, a considerable surplus manpower, against the recommended and sanctioned strength except for male
health workers, is in place. An important achievement for the health administration in the state has been to have a strong Information Technology (IT)-supported health management information system to keep track of the manpower situation at the district level, with a constantly updated database. Assam has also been a pioneering case in the country to roll out a unique programme to address the critical gap of qualified, trained physicians at the village or sub-centre level, which often forces people to resort to treatment from alternative, informal sources. Backed by the Assam Rural Health Regulatory Authority Act, 2004, the government decided to train educated youth from rural areas with a sandwich training programme to impart basic skills and knowledge on primary healthcare. There are about 400such trained youth already working in the villages. This has huge potential for emerging as a solution to the chronic lament regarding inadequate coverage of formal healthcare at the grassroots.
5.3.2 Service Utilization Patterns and Barriers to Access
5.3.2.1 Health Service Usage and Choice of Health Care Providers
The pattern of usage for different types of healthcare providers – public health facilities, private physicians, clinics and hospitals, untrained medical practitioners, drug stores, traditional healers – provides a good understanding about healthcare utilisation patterns in a community, with the underlying reasons useful in assessing any barriers to access, or ‘forced choices’, if any. In India, the system is marked by a predominance of the private sector for outpatient care, and that of
33 Ministry of Health and Family Welfare(2013).‘Human Resources in Health Sector’ in National Health Profile – 2013, Central Bureau of Health Intelligence, Director-General of Health Services, Ministry of Health and Family Welfare, Govt. of India. Available online at http://www.cbhidghs.nic.in/writereaddata/mainlinkFile/Human%20Resources%20in%20Health%20Sector-2013.pdf (accessed on 11 August 2014).
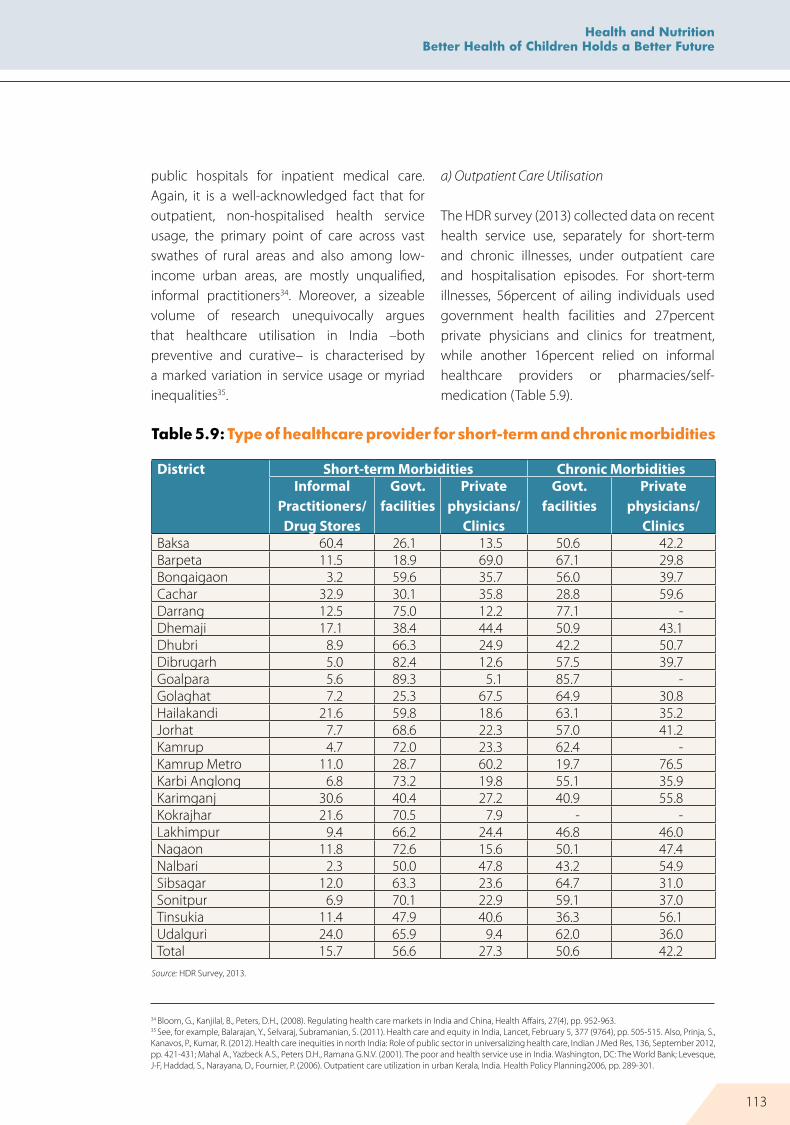
113
Health and NutritionBetter Health of Children Holds a Better Future
public hospitals for inpatient medical care. Again, it is a well-acknowledged fact that for outpatient, non-hospitalised health service usage, the primary point of care across vast swathes of rural areas and also among low-income urban areas, are mostly unqualified, informal practitioners34. Moreover, a sizeable volume of research unequivocally argues that healthcare utilisation in India –both preventive and curative– is characterised by a marked variation in service usage or myriad inequalities35.
a) Outpatient Care Utilisation
The HDR survey (2013) collected data on recent health service use, separately for short-term and chronic illnesses, under outpatient care and hospitalisation episodes. For short-term illnesses, 56percent of ailing individuals used government health facilities and 27percent private physicians and clinics for treatment, while another 16percent relied on informal healthcare providers or pharmacies/self-medication (Table 5.9).
34 Bloom, G., Kanjilal, B., Peters, D.H., (2008). Regulating health care markets in India and China, Health Affairs, 27(4), pp. 952-963. 35 See, for example, Balarajan, Y., Selvaraj, Subramanian, S. (2011). Health care and equity in India, Lancet, February 5, 377 (9764), pp. 505-515. Also, Prinja, S., Kanavos, P., Kumar, R. (2012). Health care inequities in north India: Role of public sector in universalizing health care, Indian J Med Res, 136, September 2012, pp. 421-431; Mahal A., Yazbeck A.S., Peters D.H., Ramana G.N.V. (2001). The poor and health service use in India. Washington, DC: The World Bank; Levesque, J-F, Haddad, S., Narayana, D., Fournier, P. (2006). Outpatient care utilization in urban Kerala, India. Health Policy Planning2006, pp. 289-301.
Table 5.9: Type of healthcare provider for short-term and chronic morbidities
District Short-term Morbidities Chronic MorbiditiesInformal
Practitioners/Drug Stores
Govt. facilities
Private physicians/
Clinics
Govt. facilities
Private physicians/
ClinicsBaksa 60.4 26.1 13.5 50.6 42.2Barpeta 11.5 18.9 69.0 67.1 29.8Bongaigaon 3.2 59.6 35.7 56.0 39.7Cachar 32.9 30.1 35.8 28.8 59.6Darrang 12.5 75.0 12.2 77.1 -Dhemaji 17.1 38.4 44.4 50.9 43.1Dhubri 8.9 66.3 24.9 42.2 50.7Dibrugarh 5.0 82.4 12.6 57.5 39.7Goalpara 5.6 89.3 5.1 85.7 -Golaghat 7.2 25.3 67.5 64.9 30.8Hailakandi 21.6 59.8 18.6 63.1 35.2Jorhat 7.7 68.6 22.3 57.0 41.2Kamrup 4.7 72.0 23.3 62.4 -Kamrup Metro 11.0 28.7 60.2 19.7 76.5Karbi Anglong 6.8 73.2 19.8 55.1 35.9Karimganj 30.6 40.4 27.2 40.9 55.8Kokrajhar 21.6 70.5 7.9 - -Lakhimpur 9.4 66.2 24.4 46.8 46.0Nagaon 11.8 72.6 15.6 50.1 47.4Nalbari 2.3 50.0 47.8 43.2 54.9Sibsagar 12.0 63.3 23.6 64.7 31.0Sonitpur 6.9 70.1 22.9 59.1 37.0Tinsukia 11.4 47.9 40.6 36.3 56.1Udalguri 24.0 65.9 9.4 62.0 36.0Total 15.7 56.6 27.3 50.6 42.2
Source: HDR Survey, 2013.

114
Assam HDR: Managing Diversities, Achieving Human Development
A strong economic gradient, highlighting higher usage of public facilities, is evident among the poorer economic classes; about two-thirds of the ailing individuals from the two poorest quintiles (67percent and 66percent) reported use of public facilities as against about every alternate individual (50percent) in the fourth quintile and about a third in the richest class (35percent). A converse trend is evident for private care providers. In urban areas, the service mix appears evenly split between public and private facilities (44percent and 45percent), but the share of the former was higher in rural areas (58percent, with 25percent using private services). A considerable variation in the use of public facilities could be noticed across districts (Table 5.9).
Table 5.10 shows the disaggregation across the spatial diversity categories. As seen earlier, in more vulnerable areas such as flood-affected areas or in Chars, with higher illness burdens, a mixed utilisation pattern with a relatively higher usage of public health facilities could be noted. However, close to one in every five ailing persons in border areas or in flood-affected areas resorted to informal providers, which suggests unmet needs in these vulnerable pockets.
For chronic ailments requiring outpatient care, the usage patterns were broadly similar but
with a tendency towards higher private care usage. Among the spatial diversity categories, in all areas except the Chars, usage of private physicians has been evident, particularly in the border areas. In urban areas, more than two-third of the cases of chronic illnesses are treated by private providers;even in rural areas, two out of every five individuals suffering from chronic ailments visit private providers. However, in terms of economic capacities, a clear rich-poor divide is evident in the service usage pattern.
In short, patterns evident from the HDR survey data for outpatient care reveal considerable reliance on government health facilities in Assam, more among the poorer socio-economic groups and in rural areas. Notably, while some degree of preference for informal providers could be seen for common, short-term ailments, formal private physicians were preferred for chronic ailments. Apparently, the utilisation pattern seems quite progressive.
The HDR survey also allows assessment of the reasons for choice of healthcare providers. The results are revealing, and reinforce established facts: users of public facilities for outpatient care do so because of lower costs of treatment, while their counterparts opting for private care instead are more influenced by strong perceptions of better quality of treatment
Table 5.10: Type of healthcare provider by spatial diversity categories
Diversity Category
Short-term Morbidities Chronic MorbiditiesInformal
Practitioners/Drug Stores
Govt. facilities
Private physicians/
Clinics
Informal Practitioners/Drug Stores
Govt. facilities
Private physicians/
ClinicsChar 9.7 59.6 30.4 3.4 62.0 34.6Flood-affected 19.7 62.6 17.5 6.3 56.8 36.9Hill 7.0 77.0 16.0 6.7 59.3 34.0Tea-garden 10.8 64.3 24.4 4.9 60.2 34.9Border 19.7 56.6 23.1 5.3 48.8 45.9Multiple diversities
10.5 60.1 29.5 6.7 49.3 44.1
General 26.5 46.1 27.1 4.6 49.6 45.9
Source: HDR Survey, 2013.

115
Health and NutritionBetter Health of Children Holds a Better Future
being available from private providers. For users of the third type of healthcare provider – the informal practitioners and drug stores – there appears to be a near-equal split across both quality and cost concerns with less than a fifth stating having no other alternative as the main reason to explain their treatment-seeking behaviour (Figure 5.8).
b) Hospitalisation
The HDR survey data further reveal that hospitalisation in Assam is predominantly in
public hospitals with only about 11percent being admitted in private hospitals. However, utilisation patterns are suggestive of a likely ‘crowding-out’ of the poor by the wealthier groups from accessing public hospitals. Usage of public hospitals in the two bottom MPCE quintiles (88percent for the lowest quintile, and 86percent in the lower-middle group) is lower than the two highest quintiles (92percent in the fourth, 89percent in the richest quintile). Such a pattern is suggestive of inequity in inpatient care in Assam, which contradicts the principle of benefit incidence of public services in high-
Figure 5.7: Utilisation of government health facilities for outpatient care in Assam
Figure 5.8: Reasons for healthcare provider choices for outpatient care in Assam
Urban Rural
54
30
58
44
36
13
69
50
2724
2922
40
26
NSSO (42nd Round) -
1986-87
NSSO (52nd Round) - 1995-96
NSSO (60th Round) -
2004
NFHS-3 (2005-06)
WHO-SAGE (2009)
ASHDR Survey(2013-14) - Short-term
illnesses
ASHDR Survey (2013-14) - Chronic illnesses
Informalproviders/ drug
stores
Govt. facilities
Private physicians/
clinics
Informal providers/ drug
stores
Govt. facilities
Private physicians/
clinics
39
16
21
24
6
74
19
76
2
19
44
37
15
18
73
8
91
54
Short-term Morbidities Chronic ailmentsBetter quality Cost is less Non-availability of alternatives Others
(In percent)

116
Assam HDR: Managing Diversities, Achieving Human Development
cost medical care such as hospitalisation to be oriented more towards the poor. Also, as is reviewed in the following section, such inequities can unsettle the desired benefits and impact of public hospital-based financial risk protection schemes. The data also suggest that, while use of and reliance on public hospitals for inpatient stays has been consistently high across all geographical diversity areas of the state, it is found to be lowest in the case of the Charareas, most likely due to seasonal inaccessibility and other barriers to access, which needs to be adequately addressed, again for equity concerns.
5.3.2.2 Health Service Utilisation for Maternal and Child Health Care
The chapter began by highlighting high MMR and IMR in the state. In view of such a high-burden setting, the scenario of Maternal and Child Health (MCH) care in the state and uptake of services being offered as a part of government programmes, remains a key
source of assessment, and is a useful metric to monitor progress in ensuring universal access to services. a) Institutional Delivery
Assam had been lagging in terms of coverage of institutional deliveries for pregnant women. Nearly decade-old estimates from the NFHS-3 (2005-06) had placed Assam among five states with lowest coverage of deliveries in health facilities. However, the state made consistent progress in terms of increasing coverage of institutional deliveries as well as safe deliveries (that is, deliveries at institutions plus those attended by any skilled health personnel) (Figure 5.9).
Notwithstanding this, the HDR survey indicates that nearly half of pregnant women in the state (43percent overall, and 46percent in rural areas) continue to deliver their babies at home36, thus constituting a significant proportion of out-of-coverage women, with potential risk of adverse
Figure 5.9: Trends in delivery care coverage in Assam (2005-14)
36 Based on pregnancy histories for 15,823 childbirths occurring to 10,281 women in five years (2008-09 to 2013-14) in the state.
58
67
8185
76
18
32
5863
54
22
35
6166
5761
7268
40
31
58
6965
37
27
79
8886
71
62
Urban Rural Total Urban Rural Total
Safe DeliveryInstitutional Delivery
NFHS-3 (2005-06) DLHS-RCH III (2007-08) AHS (2011-12) AHS (2012-13 ASHDR Survey (2013-14)
(In percent)

117
Health and NutritionBetter Health of Children Holds a Better Future
health and survival outcomes. Apart from urban-rural and inter-district variations in the proportion of in-facility deliveries, a differential likelihood of accessing institutional facilities for childbirth could be noticed across the diverse spatial categories. The HDR data reveal that the institutional delivery rate is extremely low in the hills (24percent) and also in the Char regions (48 percent) with accessibility appearing to be a major bottleneck. The proportion of institutional deliveries is also lower in border areas (58percent), and in areas with multiple geophysical diversities (53percent), but found to be better in tea garden areas (70percent). A finding that emerges from the analysis is the profound importance of mother’s education;a woman with secondary-level education or above is nearly twice as likely to deliver her babies in health facilities rather than at home.
From the perspective of the ‘continuum of care’ for MCH services, inadequate and inequitable coverage of institutional care for childbirth could be traced to gaps in ensuring equitable and universal coverage of Ante-Natal Care (ANC) services and screening during pregnancy or, for that matter, establishing a formal contact of the pregnant woman with the health system. For the common service indicator for ANC, Assam’s performance is deplorable at best. As per AHS (2012-13) figures, less than one in every five women (18percent) in Assam receives full ANC check-ups, with even a little more than one in every four women (27percent) in urban areas receiving such services. Clearly, a significant scaling-up of ANC coverage among pregnant women should constitute the core strategy to establish the much-valued contact with the women by the health system, and influence deliveries being conducted in health facilities. The recently launched nationwide Mother and Child Tracking System can form a useful basis for such continuous screening and contact, as a strong commitment towards ensuring universal coverage of MCH services in the state.
b) Child Immunisation
The other key indicator of MCH care utilisation and coverage is immunisation of children against vaccine-preventable illnesses. However, similar to delivery care, Assam’s performance in extending universal immunisation coverage is far from encouraging. In 2005-06, Assam had the lowest levels of full immunisation (31percent) – children aged 12-23 months receiving all recommended dosages of vaccines – in the country (IIPS 2008). The scenario somewhat improved within a couple of years, corresponding to the initial years of the NRHM, as the DLHS-RCH III (2007-08) indicates that nearly half the children received all vaccinations, with a higher reported level among children with better-educated mothers, or from wealthier households (IIPS &MoH&FW 2010). The more recent AHS data indicate that full immunisation coverage in Assam had climbed up to 64percent in 2012-13.
5.3.2.3Utilisation of Anganwadi Centres and Quality of Services
In view of the observation made earlier in this chapter on the high burden of child undernutrition in Assam, it is imperative to assess the role of public interventions – the foremost being the Anganwadi Centres (AWCs) under the Integrated Child Development Services (ICDS) scheme – which aims at mitigating all risks through proper care, provision of supplementary nutrition, use of behaviour change communications, and ensuring proper medical care and rehabilitation for the severely malnourished children.
According to the HDR survey data, nearly three-fourths of the households having children have enrolled their wards at the local AWC. The enrolment patterns also appear to be equitable, with the proportion of children enrolled being higher in households with lower incomes.

118
Assam HDR: Managing Diversities, Achieving Human Development
Notably, enrolment rates were much lower in districts in which undernutrition rates were found to be high. These include Karimganj (54percent) and Dhubri (64percent), apart from Nalbari (67percent), Cachar (68percent) and Bongaigaon (69percent). Those who have not enrolled children in the AWCs cite poor quality of services and non-functional centres as the main reasons.
Respondents or care-givers to the children were asked in the HDR survey about their perceptions on a few aspects of services their children have received from the AWCs, based on their observations during visits to the AWCs during three months prior to the survey. Regarding the overall quality of services, 51percentratedthem as good quality, 46percentaverage and only about 2percentas bad. Similarly, most children (88percent) reportedly received hot, cooked food as supplementary nutrition or as take-home rations, and three-quarters of the respondents reported having received an explanation about the growth charts of their children. However, it is evident that, in terms of providing key behavioural messages such as food to be given to the children – in terms of both quality and quantity – and appropriate to the child’s age, identifying danger signs of undernutrition, or hygienic practices to be followed while cooking/preparing meals, not enough is being done. Only about 65percent received all the relevant messages, while nearly a fifth (18percent) received none. This remains a largely neglected dimension of the ICDS programme, and it may be noted that being the only programmatic response against child undernutrition, this aspect of behavioural changes must be accorded high importance as a crucial strategy to address the issue.
5.4 Financing Healthcare and Financial Risk Protection against Health Shocks
Besides ensuring equitable access to and coverage of healthcare services, a core aspect of health system responsiveness is to reduce barriers to financial accessibility and extension of adequate, effective risk protection against the financial impact arising from illness. This section deals with the major components of health financing in Assam, and assesses the adequacy of financial risk protection mechanisms among the poor, in particular. A useful starting point is to examine the government spending pattern on health and healthcare services in the state.
5.4.1 Public Spending on Health and Healthcare Services
Public spending on health and related services in Assam accrues from two major sources—directly from the state government and as support from the central government for centrally-sponsored schemes or national programmes such as the various schemes nested under the NHM umbrella.
Based on the details of revenue and capital expenditure provided by the Reserve Bank of India (RBI), outlays on medical and public health and family welfare, as a percentage of the state’s total social sector budgetary expenditure, reveal a decline from 16percent in 2008-09 to 11percent in 2012-13, including other related sectors such as drinking water and sanitation, and nutrition from 27percent to 17percent in the state. Similarly, as a proportion of the state’s total development sector outlay, the

119
Health and NutritionBetter Health of Children Holds a Better Future
state government’s expenditure on health has also fallen from 9percent to about 7percent37. A comparative account of state expenditure patterns over the years provided by the RBI also indicates a similar trend in public spending on medical and public health and family welfare in Assam. Since 2000-01, the share of this sector as a ratio to the state’s aggregate expenditure averaged around 4.2percent, primarily due to three consecutive spike years from 2008-11, where the outlays were over 5percent.
A major component of public expenditure in the health sector in the recent years has been the flow of funds to the states under the NRHM. Funds are directed by the centre to the State Health Society, with the state contributing to 15percent of the annual approved budget. Funds under NRHM are mostly linked with specific sub-sectors within the health sector such as reproductive and child health, child immunisation, infrastructure and maintenance and a flexi-pool of funds. An analysis of the NRHM funds flowing to Assam during five years shows that the annual outlays have increased between 2009-10 to 2013-14 by a modest 27percent (including the state’s shares) - from INR 10.03 billion in 2009-10 to INR 12.73 billion in 2013-14.
The absence of a regular system of National Health Accounts (NHA) in India prevents any comparisons of the relative role of public financingvis-à-vis private, mostly out-of-pocket spending on health and healthcare services. The most recent NHA published in 2009 pertain to data till 2004-05, when the last National Health Survey (containing private health expenditure data) was conducted by the NSSO(60th Round). According to this report, per capita public expenditure in Assam was 162 as of 2004-
05, with private expenditure on health being much higher at 61238. Recently, the Ministry of Health and Family Welfare, Government of India, had provided some estimates of the per capita ‘health expenditure’, according to which Assam’s was at INR 471, as compared to the national average of INR 50339.
5.4.2 Private Spending on Health and Healthcare Services
In India, the dominant mode of healthcare financing is private, and largely borne out of pocket. For the poor, evidence suggests ‘distress financing’ of healthcare in the wake of unforeseen – and often hefty – expenditures on medical treatment, and resort to informal credit or, at times, usurious credit from moneylenders, or selling of assets. Such risky means of financing healthcare can wreak havoc on consumption flows and lead to wider welfare outcomes: dropouts from schools, postponement of marriage and other social obligations are not uncommon among the poor.
According to the HDR survey, households in Assam spend about INR 4,517 on an average annually on medical care, with the average for in-patient care going up to INR23,784, and that for outpatient consultations being INR1,898. Considerable variations exist across districts, with expenditures tending to be high in the upper Assam districts (Table 5.11).
Adjusting healthcare expenditures for the levels of aggregate consumption expenditure, and non-food consumption expenditure across the households, is more insightful in order to compare their differentials across socio-economic groups, and across geographic regions. An analysis of the HDR data indicates
37 Based on RBI’s annual publication, State Finances: A Study of Budgets. Available online at http://www.rbi.org.in/scripts/AnnualPublications.aspx?head=State+Finances+%3a+A+Study+of+Budgets38 Health Finance Indicators, 2013: National Health Profile 2013. See http://cbhidghs.nic.in/writereaddata/mainlinkFile/Health%20Finance%20Indicators-2013.pdf39 http://pib.nic.in/newsite/erelease.aspx?relid=56240.(Accessed 15 August 2014).

120
Assam HDR: Managing Diversities, Achieving Human Development
that, on an average, people in Assam spend about 13percent of the annual earnings on medical care, with slightly higher proportional outlays noticed in rural (14percent) as compared to urban (11percent) areas. However, across the MPCE quintiles, proportional healthcare expenditures were seen to fall slowly with an increase in income, but rising up to the highest level at the richest quintile. According to the geophysical regions, no significant differentials
could be observed, except that it tends to be high in tea-garden and border areas (about 15percent in each case).
It is also revealed that cutting across income classes, the dominant form of financing cost of healthcare in Assam is out of pocket (Table 5.12). However, for about a fifth of cases, with a marginally higher incidence among the poorest, borrowing from friends and neighbours could
Table 5.11: Household healthcare expenditure in Assam and districts (INR)
Districts In-patient care expenditure
Out-patient care expenditure
Aggregate Healthcare
expenditureBaksa 33,670 2,020 4,789Barpeta 24,313 1,093 1,218Bongaigaon 27,160 2,375 6,344Cachar 16,681 2,190 4,406Darrang 22,342 926 3,204Dhemaji 29,412 2,236 9,722Dhubri 18,131 1186 2,494Dibrugarh 22,627 2165 7,285Goalpara 13,200 1154 1,377Golaghat 15,500 1787 4,487Hailakandi 18,944 2156 7,002Jorhat 21,131 1,614 4,127Kamrup 29,476 2,820 4,755Kamrup (M) 45,375 4,182 12,585Karbi Anglong 9,385 2,153 2,934Karimganj 16,459 1,655 2,719Kokrajhar 72,967 827 1,847Lakhimpur 29,014 3,378 17,075Marigaon 18,300 964 2,733Nagaon 30,846 1,380 3,554Nalbari 13793 3,256 5,796Sibsagar 28928 2,239 7,622Sonitpur 22525 3,571 5,878Tinsukia 12,694 2,175 3,940Udalguri 11,768 1,251 3,133Total 23,784 1,898 4,517
Source: HDR Survey, 2013.
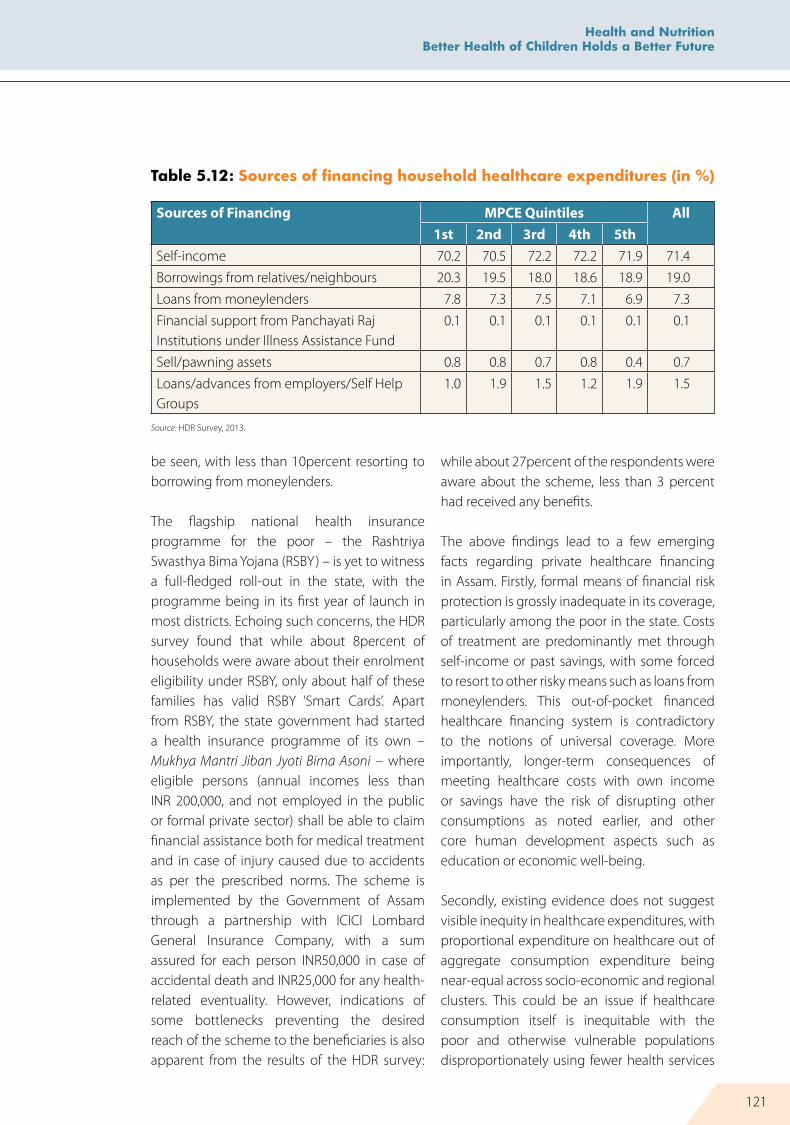
121
Health and NutritionBetter Health of Children Holds a Better Future
be seen, with less than 10percent resorting to borrowing from moneylenders.
The flagship national health insurance programme for the poor – the Rashtriya Swasthya Bima Yojana (RSBY) – is yet to witness a full-fledged roll-out in the state, with the programme being in its first year of launch in most districts. Echoing such concerns, the HDR survey found that while about 8percent of households were aware about their enrolment eligibility under RSBY, only about half of these families has valid RSBY ‘Smart Cards’. Apart from RSBY, the state government had started a health insurance programme of its own –Mukhya Mantri Jiban Jyoti Bima Asoni – where eligible persons (annual incomes less than INR 200,000, and not employed in the public or formal private sector) shall be able to claim financial assistance both for medical treatment and in case of injury caused due to accidents as per the prescribed norms. The scheme is implemented by the Government of Assam through a partnership with ICICI Lombard General Insurance Company, with a sum assured for each person INR50,000 in case of accidental death and INR25,000 for any health-related eventuality. However, indications of some bottlenecks preventing the desired reach of the scheme to the beneficiaries is also apparent from the results of the HDR survey:
while about 27percent of the respondents were aware about the scheme, less than 3 percent had received any benefits.
The above findings lead to a few emerging facts regarding private healthcare financing in Assam. Firstly, formal means of financial risk protection is grossly inadequate in its coverage, particularly among the poor in the state. Costs of treatment are predominantly met through self-income or past savings, with some forced to resort to other risky means such as loans from moneylenders. This out-of-pocket financed healthcare financing system is contradictory to the notions of universal coverage. More importantly, longer-term consequences of meeting healthcare costs with own income or savings have the risk of disrupting other consumptions as noted earlier, and other core human development aspects such as education or economic well-being.
Secondly, existing evidence does not suggest visible inequity in healthcare expenditures, with proportional expenditure on healthcare out of aggregate consumption expenditure being near-equal across socio-economic and regional clusters. This could be an issue if healthcare consumption itself is inequitable with the poor and otherwise vulnerable populations disproportionately using fewer health services
Table 5.12: Sources of financing household healthcare expenditures (in %)
Sources of Financing MPCe Quintiles All1st 2nd 3rd 4th 5th
Self-income 70.2 70.5 72.2 72.2 71.9 71.4Borrowings from relatives/neighbours 20.3 19.5 18.0 18.6 18.9 19.0Loans from moneylenders 7.8 7.3 7.5 7.1 6.9 7.3Financial support from Panchayati Raj Institutions under Illness Assistance Fund
0.1 0.1 0.1 0.1 0.1 0.1
Sell/pawning assets 0.8 0.8 0.7 0.8 0.4 0.7Loans/advances from employers/Self Help Groups
1.0 1.9 1.5 1.2 1.9 1.5
Source: HDR Survey, 2013.

122
Assam HDR: Managing Diversities, Achieving Human Development
than required, given the ‘need’ or burden of diseases or ill-health.
5.5 Summing up
This chapter has discussed at length the current health and nutritional status of the state’s population and brought out disparities in terms of socio-economic classes, regions and the unique geophysical diversities of the state, which have a strong impact on shaping livelihoods of the population in these clusters. Recent trends and performance in terms of the key indicators of health outcomes and health service coverage have also been examined. Drawing on data from a large number of sources, and combining official data with household survey data, the scenario of present and emerging challenges for the health system, and gaps in service provision, has been mapped. Lastly, the few notable innovations and achievements in Assam, which have strong potential to significantly improve the overall performance and responsiveness of the health system and address the unique challenges faced by the state have been showcased. Some of the major findings highlighted in this chapter are as follows:
The persistence of high levels of infant mortality, with slower rates of decline as compared to the national average, is posing a major challenge to the state. Very high levels of IMR noted in some districts, call for specific assessments of causes for such high risks. Notably, Assam’s unique feature of higher post-neonatal mortality as opposed to the general pattern of higher infant deaths clustered in the first month of birth, indicates the predominance of exogenous risks and influences of living standards and household environments.
Assam has the highest levels of maternal mortality nationally, and one of the highest levels
globally in specific regions such as the Upper Assam districts. While official policy documents and PIPs reiterate the state’s commitment to reduce avoidable deaths and high-risk pregnancies through a slew of measures combining pregnancy screening, emergency transportation and strengthening of first referral units to provide emergency obstetric care, gaps remain. While inadequate demand for maternal healthcare – reflected in very low rates of ante-natal care-seeking behaviour and persisting low levels of institutional deliveries in some regions – has been a major barrier to increase the health system’s coverage in this high-priority area, comprehensive strengthening of the reproductive and child health programme in the state remains yet to be achieved.
The scenario of burden of diseases in the state, and its differentials across socio-economic groups and geographic regions, indicates that Assam is uniquely poised in the midst of an epidemiological transition with the co-existence of both communicable and non-communicable diseases. However, while the former are more prevalent among the lower-income groups, the wealthier groups are found to suffer from very high prevalence of NCDs. Notably, in areas such as those affected by floods and in tea-garden areas, a high prevalence of NCDs could be observed. The chapter has also noted a high, growing prevalence of chronic conditions such as hypertension and diabetes, denoting higher risks for a host of NCDs; that such conditions are spreading at an equally strong pace in rural areas and among lower income groups, places tough challenges on the health system to respond effectively and efficiently, in order to smoothen both physiological and economic impacts of these health conditions with long-term consequences. In this connection, the strong influence of health behaviours such as smoking, diets and physical activity habits is noted, with huge ground to be covered

123
Health and NutritionBetter Health of Children Holds a Better Future
in changing unhealthy behaviours in a comprehensive, prevention-oriented NCD management strategy.
Child undernutrition levels in Assam signify a cause of concern, and evidence little progress in the last decade. More than a third of the children in the state remain underweight, with very high levels of underweight children identified in Hailakandi, Goalpara, Karimganj, Dhubri, Dhemaji, Nagaon, Bongaigaon and Cachar. On a significant note, the results from the nutrition survey conducted as a part of the HDR exercise find a high burden of childhood undernutrition even in urban areas, and economically better-off households. Given that use of ICDS services is near-satisfactory, the likely gaps exist in influencing behaviours related to infant feeding, diets and other care practices as well as frequency of childhood illnesses.
The utilisation pattern of health services in the state reveals modestly high reliance on public health services for outpatient care, and very high for hospitalisation. Notably, for treatment
of chronic conditions and NCDs – for which the state had embarked upon a large-scale ambitious programme of screening at both the population and primary care levels – use of the private sector was high. Reliance on government health facilities is found to be higher in the Chars, flood-affected and tea garden areas, while in border areas private physicians enjoyed a higher usage.
A major area of concern, however, is the lack of formal, institutional insurance and risk-protection mechanisms extending the much-required coverage against health shocks and illnesses, which can be costly and, hence, difficult to be financed solely out of pocket. Although, the survey results do not indicate a higher, disproportionate financial burden arising out of illnesses among the poor, risks of consumption shortfalls and wider human development concerns cannot be ruled out. Coverage of both national as well as state-specific health insurance schemes happen to be low, with a huge scope for scaling-up coverage and encouraging use for priority groups.

124
Assam HDR: Managing Diversities, Achieving Human Development
Gender Dimensions of Human Development From Differentials to Inequalities 6
125
Gender Dimensions of Human Development From Differentials to Inequalities
6.1 Introduction
Gender is a primary marker of social and economic stratification as well as myriad exclusions. However, differences in choices made by women and men and, consequently, observed differences in levels of achievements are not always reflective of unequal opportunities faced by them. While trying to examine the gender differentials in achievements, the differential outcomes emanating from differences in personal preferences have to be distinguished from those resulting from a more fundamental denial of opportunities for making choices.1 Understanding the gender dimension of human development, thus, needs to focus fundamentally on inequalities rather than the apparent differentials.
Typically, the question of gender equality within the human development framework is addressed by means of the Gender Development Index (GDI) and the Gender Inequality Index (GII). The GDI captures the gap in achievement levels of women and men in three basic dimensions of human development – health, education and income – while the GII provides a measure of inequalities in opportunities among women and men that have a bearing on their ultimate well-being. This chapter aims to highlight some important aspects of underlying gender inequality in the state besides presenting the two indices.
6.2 Gender in Assam - A Background
Although Assam has been eulogised as a society where women enjoy a better position compared to the rest of Indian societies, the historical evidence on the social structures
prevalent during pre-Ahom rule, that is, before the 12th century, is, indeed, limited. However, later writings of historians indicate that the tribal way of life was preeminent in Assam Valley during pre-Ahom rule where shifting cultivation was a way of life and women and men were equal partners in economic and social affairs. It was the advent of wet rice cultivation during Ahom rule that brought about changes from a ‘shifting’ to ‘settled’ form of agriculture based on the pike system. The shift impacted the pattern of land distribution and had far-reaching repercussions on access to productive resources of women and men in the society2. Later, under British colonial rule, social processes in Assam witnessed even stronger re-configurations3. In short, while the tribal and hill people continued with their semi-nomadic life, people in the valley gradually became accustomed to an agrarian set up where a growing predominance of occupational rights over agricultural land marginalised the position of women in society. The social formations that prevailed during Ahom rule restrained some of the appalling Hindu practices such as ‘sati’, infanticide, ‘kulinism’ and dowry system in the Brahmaputra Valley. Unlike in other states or regions in India, the caste system could not get a stronghold in the Brahmaputra Valley, perhaps because of the tribal influence and also due to the emergence of neo-Vaishnavism. Though the caste Hindu societies in the valley were exposed to the growing influences of Brahminism since Ahom rule, the practices of child marriage and prohibition of widow remarriage practices did not gain a firm footing in the state. Social practices such as widow remarriage and divorce were permitted among certain communities and marriage by consent of mutual partners was prevalent among the tribal communities of Kacharis, Tiwas and
1 Kabeer, N. (1999).2 See Guha, A. (1980).3 See Guha, A. (1967).

126
Assam HDR: Managing Diversities, Achieving Human Development
other plains tribals in Assam. Nevertheless, the prevalence of the caste system was far stronger in Surma Valley (present day Barak Valley) as it had been largely a part of East Bengal.
The economic well-being of women in the state was determined by contemporary social processes. Unlike in the Surma Valley, women from indigenous Hindu cultivator families in the Brahmaputra Valley, except in the districts of Goalpara and Kamrup, worked regularly in the fields4. Though women in the Brahmaputra Valley worked hard in the fields with their male counterparts, especially during transplanting and harvesting, their work went unrecognised as economic activity.5 However, women were paid workers on tea plantations. Although, women’s work continued to be an integral part of the production processes in Assam, the colonial definition of work left a long-lasting impact on society. Recognition of certain activities of women such as spinning and weaving, rice pounding and husking as economic activities while excluding a host of other activities performed by women, particularly those in agriculture, the colonial classification of ‘work’ constituted elements of gender stereotyping. The question of gender differential and inequality in Assam has to be contextualised within this historical process of social change in the state.
6.3 Women and their Well-being
Differential achievements of men and women often go beyond their biological differences. Individual beliefs, values and perceptions, together with social structures, shape gender-specific roles in society which may limit the freedom of individuals in making choices. This
conditions the most elementary ground of inequality in society. The inequality arising out of such conditions is reflected in a range of activities and related levels of achievements attained by men and women on a daily basis or in their lives as a whole.
The freedom to lead a long, healthy and productive life is one of the fundamental requirements of human development. This necessitates a set of entitlements that ensures the survival as well as certain basic minimum quality of life for individuals. These entitlements are represented by a few summary indicators. Among them, life expectancy, sex ratio, fertility and mortality rates are considered as the most fundamental. It is well recognised that women’s education and work, autonomy in making reproductive choices and their relative status in the family and community have significant influence on these indicators.
6.3.1 Female Life expectancy at Birth
In India, both male and female life expectancies at birth have been witnessing steady improvements over the years. The female life expectancy in the country has remained above that of males for quite some time (2002-10) – both for rural and urban areas. A similar trend is also observed in Assam (Table 6.1), even though the female life expectancy at birth continues to be one of the lowest among the major states in India. It is also seen that the rate of increase in the female life expectancy (in percentage term) between 2002-06 to 2006-10 – total, rural and urban – has been more than those of the country’s. Notwithstanding this, female life expectancy for rural areas in Assam is the lowest in the country.
4 Report of the Assam Provincial Banking Enquiry Committee, 1929-30. 5 Census 1931, for instance, considered them only as ‘helpers’ and hence, ‘dependents’ (Census of India, 1931, Assam Part-1 Report, p.122).

127
Gender Dimensions of Human Development From Differentials to Inequalities
Higher life expectancy at birth for females reflects better survival conditions for women across all ages (that is, age specific mortality pattern), which indirectly improves the sex ratio for the population in general.
6.3.2 Overall Sex Ratio
The sex ratio is often taken to be an indicator of women’s health, nutrition and survival status. The sex ratio in Assam has shown a significant improvement over the last one decade (2001-11) especially in the urban areas which can be partly attributed to improvement in female life expectancy (Table 6.2). There has also been a significant improvement in the overall sex ratios for the ST and SC population even though the sex ratios for STs and SCs in rural areas are lower than the national average. Despite the sex ratio for the STs in the state being higher than the total sex ratio in the state, in the two ST majority districts of Dima Hasao (70.9 percent
ST population, Census 2011) and Karbi Anglong (56.3 percent ST population, Census 2011), the sex ratio is not only lower than the ST state average but also less than the total sex ratio in the state.
There has been, however, a significant variation in sex ratios across districts. The sex ratio as per Census 2011 has been found to be worryingly low in Dima Hasao. The HDR survey estimates the sex ratio for the state at 950. The sex ratio in rural areas is found to be953 against that of urban at929. The HDR data estimate sex ratios for Dima Hasao, Kokrajhar, Chirang at particularly low levels (Table 6A.1, Statistical Appendix).
6.2.3 Child Sex Ratio
Even though the overall sex ratio in the state has improved during the last decade, the child (0-6 years) sex ratio during the same period
Table 6.1: Life expectancy at birth by gender, rural-urban
Place Year Total Rural Urban
Total Male Female Total Male Female Total Male Female
Assam 2002-06 58.9 58.6 59.3 57.9 57.7 58.3 67.6 67.1 68.3
2006-10 61.9 61.0 63.2 61.0 60.2 62.1 68.8 66.9 71.1
India 2002-06 63.5 62.6 64.2 62.1 61.2 62.7 68.8 67.1 70.0
2006-10 66.1 64.6 67.7 64.9 63.5 66.5 69.6 68.0 71.4
Source: SRS, Registrar General of India, Abridged Life Tables, Various Years.
Table 6.2: Sex ratio in Assam and India (2001-11)
Year All Population ST Population SC PopulationTotal Rural Urban Total Rural Urban Total Rural Urban
2001 (Assam)
932 940 878 972 974 929 935 936 929
2011 (Assam)
958 960 946 985 984 996 948 945 963
2001 (India)
933 946 900 978 981 944 936 937 927
2011 (India)
943 949 929 990 991 980 945 945 946
Source: Census 2001, 2011, Registrar General of India.

128
Assam HDR: Managing Diversities, Achieving Human Development
has seen a decline6. Given the overall decline in the share of child population in the state from 16.87 percent in 2001 to 14.86 percent in the year 2011, the decline in the sex ratio from 965 (2001) to 962 (2011) reflects that all is not well for the girl child in Assam. There are significant variations across districts and six districts --Kamrup (M) (946), Dhemaji (950), Cachar (954), Hailakandi (954), Kokrajhar(954) and Marigaon (956)-- have child sex ratio less than the sex ratio for the total population in the state (Table 6A.2, Statistical Appendix).
The decrease in the sex ratio in this age group has a cascading effect on the population over a period of time which contributes to a gradual decrease in total sex ratio. Migration, which significantly influences the total sex ratio, has but a negligible influence on the child sex ratio. On the contrary, factors that influence the child sex ratio include fertility rates and survival rates for children.
The HDR survey data estimates the child sex ratio in the state at 947. The child sex ratio in urban areas (932) has been found to be lower than that of rural areas (948). The sex ratios of Dima Hasao, Kokrajhar, Kamrup (M) and Chirang have been found to be lower than 900. In terms of the child sex ratio, Dima Hasao (579) and Kokrajhar (735) present a worrisome scenario (Table A5.2, Statistical Appendix). Survey data also reveal that the sex ratio among Muslims (933) is found to be much lower than that of
Hindus (957). Sex ratios in the hills (909) and in Char areas (933) are found to be lower than other categories of spatial diversity. It was also found that there is an age group-wise variation in sex ratios.
6.2.4 Fertility Rate for the Women in Assam
The fertility rate in Assam has shown a gradual decline over the years. The SRS (2013) data show that the Total Fertility Rate (TFR) in the state is at par with the national level, the TFR for rural (2.4) and urban (1.5) areas in the state is lower than the all India figure for rural (2.5) and urban (1.8) areas. This decline in the fertility rate is also a contributory reason for a decrease in the share of child population in the state.
It is a well-known fact that fertility decreases with higher levels of educational attainment for women, as women with higher capability have greater opportunities for work participation which, in turn, brings about a change in the fertility behaviour of women. The TFR exhibits a clear gradient with the level of education both in the country and the state (Table 6.4).
As per the SRS data, there is also a significant variation in the fertility rates among rural and urban females besides their educational status. The fertility rate for urban literates is 1.5 and for rural areas it is just below the replacement rate. The decrease in the fertility rate below the
6 Sex ratio at birth (that is, at 0 age) in India is 910 and 954 in Assam as per Census 2011, single age population data.
Table 6.3: Child sex ratios (0-6) in Assam and India (2001-2011)
Place 2001 2011Total Rural Urban Total Rural Urban
Assam 965 967 943 962 964 944India 927 934 906 914 919 902
Source: Census 2001, 2011, Registrar General of India.

129
Gender Dimensions of Human Development From Differentials to Inequalities
replacement rate is also likely to have an adverse impact on the future population composition and workforce participation rate in the state, especially for women.
The estimated TFR7 from the HDR data brings out further divides in fertility. It indicates that TFR – which is the average number of children a woman can expect to have in her life given
7 Method relied on Hauer M., Baker J., Brown, W. (2013). Indirect Estimates of Total Fertility Rate Using Child Woman/Ratio: A Comparison with the Bogue-Palmore Method. PLoS ONE 8(6): e67226. doi:10.1371/journal.pone.0067226.
Table 6.5: Indirectly estimated TFR: Assam
TFRAssam 2.0Rural 2.2Urban 1.4ReligionHindu 1.7Muslim 2.9Christian 1.8Diversity CriteriaChar 2.8Flood 2.0Hills 1.8Tea 1.8Border 2.1Multiple 2.5General 2.0
Source: HDR Survey, Assam (2013).
Table 6.4: Total fertility rate Assam and India (2013)
Place Illiterate Literate
Total literate
Without any
formal education
Below primary
Primary Middle Class X Class XII
Graduate and above
INDIA
Total 3.1 2.1 3.2 2.8 2.5 2.2 1.8 1.6 1.7
Rural 3.2 2.3 3.3 2.9 2.6 2.3 2.0 1.7 1.8
Urban 2.5 1.7 2.7 2.4 2.0 1.8 1.6 1.4 1.6
ASSAM
Total 3.7 2.0 3.4 2.6 2.6 2.2 1.7 1.2 1.1
Rural 3.7 2.1 3.6 2.7 2.6 2.3 1.7 1.3 1.1
Urban 2.1 1.5 1.1 1.9 2.1 1.7 1.4 1.0 1.1
Source: SRS, Abridged Table; 2013.

130
Assam HDR: Managing Diversities, Achieving Human Development
the current pattern of fertility – tends to be on a higher side in rural areas, particularly in the Char areas and among Muslims (Table 6.5).
As far as the age-specific fertility schedule is concerned, the highest fertility rates for both Assam and India have been found in the age cohort of 20-24 years. However, the age-specific marital fertility schedule indicates that highest marital fertility in Assam is recorded in the teen age cohort of 15-19 years while that in the country happens to be the 20-24 age cohorts (SRS, 2013).
The issue of early marriage and teenage motherhood has also been highlighted by the AHS2012-13. The report shows that 7.4 percent of women in the state reported that they got married before the age of 18 and most of them become mothers quite early. Girls in the age group 15-19 are still adolescents and their physical capability to bear children is fragile.
The HDR survey makes the gender bias more conspicuous in the incidence of early marriage in the state. While about 20 percent of boys get married by 24 years, the proportion is as high as 75 percent for girls (Table 6.6). The percentage of girls getting married within the age group of 15-19 years is higher in rural areas, the Chars in particular and also among Muslims, and
Table 6.6: Age group-wise married men and women (as % within age cohorts)
Age Male Female15 - 19 1.5 14.620 - 24 18.8 60.225 - 29 52.8 81.830 - 34 76.9 89.535 - 39 89.9 91.240 - 44 94.5 87.945 - 49 95.4 84.9Total 55.4 70.2
Source: HDR Survey, 2013.
gradually declines with the level of education (Table 6.7). The incidence of early marriage among females is the highest in the district of Dhubri. Of the state’s total married women in the age group 15-19, eight districts share more than 50 percent. Two districts -- Dhubri and Nagaon -- share the highest percentage with 11.2 percent each (Table 6A.3.4, Statistical Appendix).
Early marriage and teenage motherhood indicate that quite a considerable number of females are deprived of their fair chance to complete education beyond secondary or higher secondary levels. This also increases the risk of child mortality and malnutrition together with maternal mortality in the state. The high incidence of teenage marriage coupled with high teenage pregnancy among females thus poses a major challenge for the well-being of women in the state. It is, thus, obvious that immediate attention is required to bring down the adolescent fertility rate in the state and continuation of girls’ education, at least up to the higher secondary level, should occupy policy priority.
While the fertility rate shows the average number of children born to a woman, it is more important to understand women’s control over their fertility behaviour. The AHS (2012-13) data on family planning methods currently used by

131
Gender Dimensions of Human Development From Differentials to Inequalities
Table 6.7: Married women in 15-19 age group by different categories (in %)
Categories Percent WomenRural 15.6Urban 7.6ReligionHindu 11.1Muslim 23.3Christian 8.6Buddhist 7.5Social CategorySC 12.9ST 12.1OBC 12.8General 17.1Spatial DiversityChar 25.3Flood Affected 13.5Hills 11.6Tea Garden 11.4Border 15.9Multiple Diversities 16.2General 13.5education levelIlliterate 38.5Up to Middle 34.4Up to Higher Secondary 33.7Above Higher Secondary 20.0
Source: HDR Survey, 2013.
both men and women in respect of currently married women (15-49) points towards the gendered dimension in control over fertility and sexual behaviour. The data reveal that while 13 percent of females have undergone sterilisation and the percentage for males is only 0.2. Besides, only 3.0 percent of males use condoms but 18.3 percent women consume pills and 1.3 percent women have used Copper-T to restrict unwanted pregnancy. The data are clearly indicative of male preference and control of sexual and fertility behaviour of women.
6.2.5 Maternal Mortality
The grievous scenario of maternal mortality in the state has already been highlighted in the preceding chapter (chapter 5). Several factors contribute to high maternal mortality in the state. As has been pointed out, early marriage and teenage motherhood are possibly two significant contributing factors of the high maternal mortality burden in the state. The other proximate factor could be the prevalence of anaemia among women.

132
Assam HDR: Managing Diversities, Achieving Human Development
Anaemia has been a major cause of concern in the state for quite some time. Successive rounds of NFHS(I, II and III) have shown that about three-fourth of the women in the state are anaemic. Anaemia is more pronounced among women in the age group of 15-19 years which reflects the high risk associated with teenage motherhood in the state. Anaemic condition of mothers also lead to low birth-weight of children and AHS-2012-13 results indicate that of 66 percent new borns who were weighed at birth, a little over quarter (about 23 percent) of the children weighed less than 2.5 kg at birth with no rural-urban differences.
Therefore, early marriage and pregnancy coupled with anaemic condition stand as a major challenge to the physical and overall well -being of females in the state; low educational attainment of females has compounded the problem further.
6.2.6 Child Mortality and Vulnerability of Girl Child
Assam has the highest IMR in the country along with Madhya Pradesh. The female IMR
in the state is also the highest (55) in the country along with Madhya Pradesh. Besides, there is also a wide rural urban difference in IMR for both males and females8 in the state and female IMR for rural Assam is the highest for rural areas across different districts. Also the age-specific death rate for females below one year of age in rural Assam (60) is higher than her male (57.1) counterpart but, in urban areas, for male children (32.7) it is higher than female children (31.7). However, one must appreciate the fact that IMR in general and among girls has come down substantially over a 10-year period (2002 -13) (Table 6.8). The decline in IMR in the state has largely been made possible due to intervention of the NRHM especially through improvement in institutional delivery, ANC and immunisation coverage.
Along with the IMR, the U5MR also continues to be very high in the state particularly in rural areas. The female to male ratio in under-five mortality in the state is 1.01 while it is 1.14 at the national level (Table 6.9).
8 IMR (rural): 56, IMR (rural female):58, IMR (rural male):55; IMR (urban): 32, IMR (urban female): 32, IMR (urban male): 31. SRS, 2013; Registrar General of India, 2013.
Table 6.8: Infant mortality rate Assam and India
State 2000 2010 2013
Persons Males Females Persons Males Females Persons Males Females
Assam 74.5 65.9 82.9 58 56 60 54 53 55
India 67.8 66.8 68.9 47 46 49 40 39 42
Source: SRS, 2013.
Table 6.9: Under five mortality rate by gender, Assam and India
Place Total Rural Urban
Total Male Female Total Male Female Total Male Female
India (2012)*
52 49 56 58 54 62 32 31 34
Assam (2013)**
71 71 72 77 77 78 36 34 39
Source: **AHS, 2011 (Updated series 2012-2013) and *SRS, 2012.

133
Gender Dimensions of Human Development From Differentials to Inequalities
6.2.7 Child Nutrition
It has been held that one of the primary reasons for increased risk of child mortality is the low birth-weight of the new born. The proportion of babies with birth weight of less than 2.5 kg to the total number of babies born shows that Assam ranks third from the bottom among states in India with almost a quarter of the new borns weighing less than 2.5 kg9. Also the proportion of still births in Assam is second highest (2.61) in the country next to Odisha (2.62)10.
The NFHS successive rounds indicate a worsening of malnourishment among children in Assam. Undernutrition among female children has serious implications for the overall demography and health status of the people in the state. As malnourishment becomes structurally embedded with more female children being malnourished, the chances of poor reproductive health with the probability of higher maternal mortality and infant and child mortality are also likely to be high.
The present report reveals (Chapter 5) that there has been a considerably high prevalence of undernutrition among children in the state. However, a comparative status on the estimates of undernutrition for male and female children shows that higher proportions of male children compared to their female counterparts suffered from chronic undernutrition (indicated by being underweight) in the state. Notwithstanding this, the wider coverage of Reproductive and Child Health (RCH) under the NRHM and an increase in general awareness on child health, especially for the girl child through the Accredited Social Health Activist (ASHA) campaign in the state, the overall situation of child health and nutrition needs serious introspection.
6.3 General Morbidity and Gender Patterns
The HDR survey also hints at a gendered pattern in morbidity in the state. While the incidence of short-term morbidity is more common among females than males, so far as chronic morbidities are concerned, the prevalence
9 Source: Ministry of Health, Government of India, State-wise Performance of Selected Indicators, Financial Year 2012-13, State wise Status, October 2012. 10 Ibid.
Table 6.10: Prevalence of chronic morbidities (% individuals reporting cases)
Diseases Male FemaleDiabetes 62.16 37.84Heart Problems 56.31 43.69Hypertension 47.70 52.30Arthritis/Joint Pain 43.48 56.52Cancer 65.56 34.44COPD 55.31 44.69Kidney Problems 57.53 42.47Liver 52.45 47.55Others 53.12 46.88
Source: HDR Survey, 2013.

134
Assam HDR: Managing Diversities, Achieving Human Development
rate is higher in male. A recent study on out-of-pocket expenditure on health also found that females have a higher incidence of short-term morbidity compared to males in the state with the reported short-term morbidity being higher in rural areas11.
Table 6.10 presents the morbidity profile of males and females in the state. The profile reflects the overall lifestyle of women. Significantly, bone-related diseases such as arthritis and joint pain are more common among women from the minority concentrated, flood prone districts of Cachar, Karimganj, Dhubri, Nagaon along with the tea district of Tinsukia while hypertension has been more common among women in Kamrup, Nagaon, Sonitpur, Sibsagar, Nalbari, Jorhat and Dibrugarh, which incidentally have a higher share of urban population.
The overall health scenario in the state suffers from visible deficiencies in various dimensions of RCH and inadequate nutritional support to mothers and children. These impacts overall human development in the state, both individual and social.
6.4 Women and Educational Outcome
It is an undeniable fact that access to education is most elementary for making informed choices, participating in political and economic processes, using new technologies and protecting oneself against exploitation. An important underlying cause in the gendered differentials in outcomes, especially in respect of access to resources and decision making, emanates from differences in the levels of education among males and females. The foregoing chapters sufficiently underline the criticality of education in enhancing capability and, hence, human development.
The fact that the female literacy in Assam has made significant improvement over 2001-11, leading to a closing of the gender gap in the literacy rate in the state has been already pointed out in Chapter 4 of the report. The declining gender parity in enrolment as age progresses has also been highlighted.
So far as female literacy is concerned, the HDR survey data offer a useful insight. They reveal that, of the total illiterates, 61.63 percent are female and a quarter of the female illiterates come from the border areas, 20 percent belong to the Char areas and 14 percent are from the tea blocks. This points to both physical and socio-cultural factors impacting literacy outcome of females.
The HDR survey also shows that currently 3.6 percent of female children as against 3.9 percent of male children in the age group 6-14 years are either dropouts from school or have never enrolled for elementary education. The discontinuation in studies is even sharper when we take the entire span of school years (6-16 years) and the HDR survey (2013) revealed that 6.45 percent of children12 in the age group 6-16 years are currently out of school, of which females account for 43 percent and males constitute 57 percent. There are also subtle gendered elements in the reasons for children remaining out of school. The need to support the family by earning and disinterest in studies are the two primary reasons for children remaining out of school but, significantly, more female children were disinterested in studies compared to male children. Besides, while a majority (11 percent) of female dropouts left school “to work at home”, a majority (26 percent) of male dropouts had to “work for supplementing the family income”. Moreover, fewer females in the state aspire for technical and professional education and discontinuation
11 Out-of-Pocket Expenditure on Health for Assam OKDISCD, August 2014. 12 There are a total of 44,023 children in the age group 6-16 years and, of them, 2,839are currently out of school.

135
Gender Dimensions of Human Development From Differentials to Inequalities
of education by females becomes largely prominent from the secondary level itself. This discontinuation of education by females leaves girls with fewer opportunities to find gainful opportunities of employment.
On the whole, the distinct difference in educational outcomes of males and females is possibly best summarised in the difference of between MYS of both the sexes. The HDR survey estimates MYS for males at 6.97 years against 5.32 years for females. This simply means that whereas males, on the average, gets an opportunity to receive education till Class VII (upper primary level), the opportunity for females, on the average, is limited to Class V(primary level) in the state. This gap in educational outcome has a distinct bearing on labour market outcomes of females.
6.5 Women and Work
Relative disadvantages of women in the labour market marked by a low female work participation rate and labour force participation rate together
with a substantially high female unemployment rate have already been stressed upon in the report (Chapter 3). The participation of women in the workforce, the quality of work allotted to them and their contribution to the GDP are indicators of the extent of their being mainstreamed into the economy13. Bringing women into economic spheres in terms of increasing their participation in the production process is vital not only for economic growth in general but also for individual capability enhancement.
The HDR survey offers a synoptic view of women’s work in the state. It is found that, of the total only about 15 percent of women belong to the labour force and 85 percent remain outside the labour force. Of those in the labour force, only 17 percent are employed, leading to a high rate of female unemployment of 38.3 percent in the state. The profile of women’s work as a proportion of those employed in the state obtained from the HDR survey is given in Figure 6.1.
Women typically tend to be employed in low-paid, low-earning, casual work with either
13 XII Five Year Plan Report of the Working Group on Women’s Agency and Empowerment, Ministry of Women and Child Development, Government of India.
Figure 6.1: Profile of women’s work in Assam (in %)
Source: HDR Survey, 2013.
Live stock
51
Agriculture
9
Self-employment
8
Permanent worker
25
Casual worker
16
60 –
50 –
40 –
30 –
20 –
10 –
0 –

136
Assam HDR: Managing Diversities, Achieving Human Development
limited or no social security benefits. These factors inevitably lead to differential wages and income for females compared to males. The HDR survey provides information on differential income/earning of males and females (Table 6.11). The gap in male-female earning is pervasive across all occupations.
6.7 Women and Socio-political Participation
Just as access to and control over resources are viewed to be ways to mitigate the gendered differences across various spheres of social and economic lives of women, deepening the process of democratic decentralisation and political participation of women in the process of political decision making and governance is also perceived to be instrumental in eliminating gendered differences in society. However, in reality, effective women’s participation in political decision making continues to be an unfinished agenda in the country.
The 73rd and 74th Amendments to the Constitution are important steps in deepening the process of democratic decentralisation in the country and statuorily recognising the grassroots
institutions of governance as part of the formal structure of governance. The reservation of women in the grassroots institutions of governance undoubtedly brought more than one million women into the leadership role in the political process of the country. However, effective political empowerment still continues to be a distant goal.
In Assam, 33 percent reservation for women in Panchayati Raj Institutions preceded the 73rd and 74th Amendments, which has been subsequently and progressively increased to 50 percent. The percentage of elected women representatives in Assam in the state legislature is just a little over 10 percent. But, in practice, the actual exercise of power remains a challenge because women representatives are always expected to adjust and cooperate with the existing form of patriarchal domination14. Besides political participation, women’s engagement in other social groupings and organisations also reflect the overall social space enjoyed by women in the state. Although direct participation in electoral politics for women in Assam continues to be low, they are almost equally participatory as men in social activities and are members of fairly diverse
Table 6.11: Differential learning of male and female
Median earning (INR) Mean earning (INR)Male Female Male Female
Total 2,000.0 0.0 4,250.7 1,746.8Activity StatusAgriculture & Allied 0.0 0.0 239.5 189.3Agricultural Labourer 3,400.0 2,000.0 3,122.4 2,117.0Daily Wage Earner 4,000.0 2,000.0 3,897.1 2,192.0Petty Business/Self-employed 5,000.0 2,000.0 6,919.6 3,455.7Trade/Business 6,000.0 3,000.0 9,081.7 5,898.2Salaried Service (Regular) 18,000.0 3,500.0 19,937.8 11,785.5Salaried but casual 4,000.0 1,800.0 5,533.8 4,179.2Others 0.0 0.0 1,600.7 743.2
Source: HDR Survey, 2013.
14 Sarmah, Bhupen; Rejuvenating Panchayati Raj; Ideology Indian State and Lessons from the Periphery, Akansha Publishing House, New Delhi, 2006.

137
Gender Dimensions of Human Development From Differentials to Inequalities
groups and bodies such as Mahila Samity, Self Help Group, and caste-based and religious organisations (HDR survey, 2013). In fact, women have been found to be more active in Self Help Groups, religious organisations and caste-based organisations. The involvement of women in these groupings can be taken as a positive signal in the overall social and political situation in the state. Women’s engagement in social and caste-based organisations can be more effective and appealing in addressing the issues of social exclusion based on caste and gendered differences.
6.8 Women and their Physical Security
Though Assam had been historically known to be a state where women never faced the threat of violence, yet, over the years, there has been an increase in incidence of violence on women (Figure 6.2). The state has witnessed an increase in incidences of rape, molestation, domestic violence, and dowry deaths (Table 6.13).
Table 6.12: Percentage share of male and female elected representatives in Assam
Participation Total Seats in the State
Total Women Contestants
Total Winners
Rate of Winning
% of Women Representative
16th Lok Sabha Election(2014)
14 16 2 12.5 14.29
15th Lok Sabha Election(2009)
14 11 2 18.2 14.29
13th State Legislative Election(2011)
126 85 14 16.5 11.11
14th State Legislative Election(2006)
126 70 13 18.6 10.32
PRIs 26,844 - 9,903 - 36.89
Source: Election Commission of India and State Election Commission, Assam.
Figure 6.2: Percentage of reported cases of violence in Assam against women
Source: National Crime Information Bureau, New Delhi.
2008
15.23
2009
17.57
2010
18.74
2011
17.24
2012
17.44
2013
18.52

138
Assam HDR: Managing Diversities, Achieving Human Development
Among all forms of violence, cruelty by the husband and his relatives is the highest among the types of violence against women in the state. The perpetuation of violence on women by the husband and his family reflects the patriarchal domination in social settings of the state. The data reveal that a majority of women do not perceive beating of their wife by a husband as an act of violence and 45 percent of women as against 25 percent men in Assam believed that men are justified in beating/hitting their wives(NFHS 3, 2005-06). This brings the issue of “subjectivity of women” underlying women’s sanction to certain patriarchal values that helps reinforcement and perpetuation of patriarchy itself in the society.
Women in Assam are vulnerable to marital violence and almost 40 percent ever married women in Assam suffered from physical violence of which 82 percent was by the husband.
Besides, 15 percent of married women suffered from sexual violence. Besides marital violence, 18 percent girls in Assam in general have been reported to have experienced physical violence (NFHS 3, 2005-06).
Violence related to unmet demands for dowry is one of the common reasons for marital violence. Even though dowry in Assam is traditionally not practiced, incidences of dowry-related deaths have increased in recent times (Table 6.13). It may be seen that there has been more than a two-fold increase in rape and dowry cases in Assam during 2001-12 while cases of dowry-related death have increased almost three fold.
There has also been a discernible increase in registered cases of rape and abduction of women in the state. Another growing incidence of crime in Assam is witch hunting. Cases of witch hunting tend to exhibit a strong gender bias.
Table 6.13: Percentage of crimes against women in the total crimes in the state
Types of crime 2013 2012 2011 2010 2009 2008Rape (Sec.376 IPC) 2.23 2.21 2.55 2.79 2.95 2.70
Kidnapping and Abduction (Sec.363-369,371-373 IPC)
4.47 4.33 4.78 4.49 3.78 3.35
Dowry deaths (Sec. 304B IPC) 0.20 0.18 0.18 0.28 0.31 0.19
Cruelty by husband or his relatives (Sec.498A IPC)
8.78 8.25 7.86 8.77 7.95 6.52
Assault on women with intent to outrage her modesty- Molestation (sec.354IPC)
2.64 2.37 1.79 2.27 2.43 2.39
Insult to the modesty of women-Sexual Harassment (Eve-teasing) (Sec.509IPC)
0.02 0.01 0.01 0.03 0.02 0.00
Importation of Girls from Foreign Country (Sec. 366B IPC)
0 0.003 0.003 0 0.002 0.000
Immoral Traffic(p) act, 1956 0.07 0.04 0.03 0.04 0.07 0.05
Indecent representation of women(P) act, 1986
0 0.004 0.001 0 0 0.004
Dowry Prohibition act,1961 0.11 0.05 0.03 0.06 0.07 0.02
Total 18.52 17.44 17.24 18.74 17.57 15.23
Total crimes in the State 86975 77682 66714 61668 55313 53333
Percentage of crimes against women 18.52 17.44 17.24 18.74 17.57 15.23
Source: National Crime Information Bureau, New Delhi.

139
Gender Dimensions of Human Development From Differentials to Inequalities
Box 6.1 Curious Cases of Witch Hunting
A `witch’ or its Assamese translation `daini’ in Assam is used to identify a male or female who is alleged to have magical powers that it uses to bring evil to the community. ’Witches‘ are, in most cases, women who alleged use their evil powers to harm others. In fact, however, many of those accused of witchcraft are simply vulnerable women and children, the elderly or the mentally ill, and are sometime victims of an accuser’s personal grudge. In many cases, they are killed with impunity. Witch hunting is killing of a `witch’, a superstitious evil practice quite common among the communities Rabha, Hajong, Mishing, Bodo, Adivasi, etc.
Once a woman(or man or a family) is ̀ identified’ and branded as a witch, she will be summoned before the whole community and process of her confirmation of as a witch will start. Generally, two methods are adopted in Assam. Firstly, if there is death of people in the village due to unknown diseases and a woman is suspected and later accepted by everyone as witch. Secondly, the woman branded as a witch is covered with a fish net and tortured brutally with the teeth of a pig. Sometime, anill person is also tortured in the same way to compel her or him to spell out the name of the witch. Usually, a sick person in his or her state of illness spells out the name of the person against whom he or she has a personal grudge. During such a practice of torture, the woman usually breaks down and accepts herself as witch to get stop the torture. Once confirmed, the woman is either killed or chased away from the village.
Box 6.2 Human Trafficking
The combination of poverty, ethnic conflict, unemployment, gender inequality (the low status of girl children), inadequate legislation and law enforcement enables trafficking in girls to thrive in the North East. It is a general practice of poor families to send their children work in wealthy families in urban or rural areas. Today, this practice has been exploited by traffickers to lure the children, especially girls, to supply to wealthy families looking for domestic labour. These children generally do not have access to any kind of education or freedom and work long hours in the poor unhygienic conditions with primarily no pay.
The practice of luring women and children in the name of providing domestic work in metro cities is growing, particularly in conflict-affected areas such as Bodoland Territorial Council, Assam. Over 100 girls were lured from the relief camps of Srirampur gate under Kokrajhar district of BTC, Assam, for domestic work in many parts of the country and outside of the country in Bhutan and Nepal. The growing number of girls working as bar or restaurant girls in many trans-border areas of the North East do so due to conflict, poverty and floods in addition to their aspiration for glamour. Many girls move to urban areas to earn, and then find themselves living in insecure areas and most are targets of exploitation, especially commercial sexual exploitation. In some cases, children’s movement is facilitated, usually by a family friend, relative, acquaintance or distantly known person to the girls. Many such girls are kept in highly exploitative conditions of work (prostitution or domestic labour) suffering non-payment (or under payment) of wages, sexual and physical abuse, long hours and no days off in a year. Trafficked children frequently suffer rape, physical abuse, are not paid or underpaid by their exploiter.
Trafficking & HIV/AIDS, North East Report, Nedan Foundation, Kokrajhar.
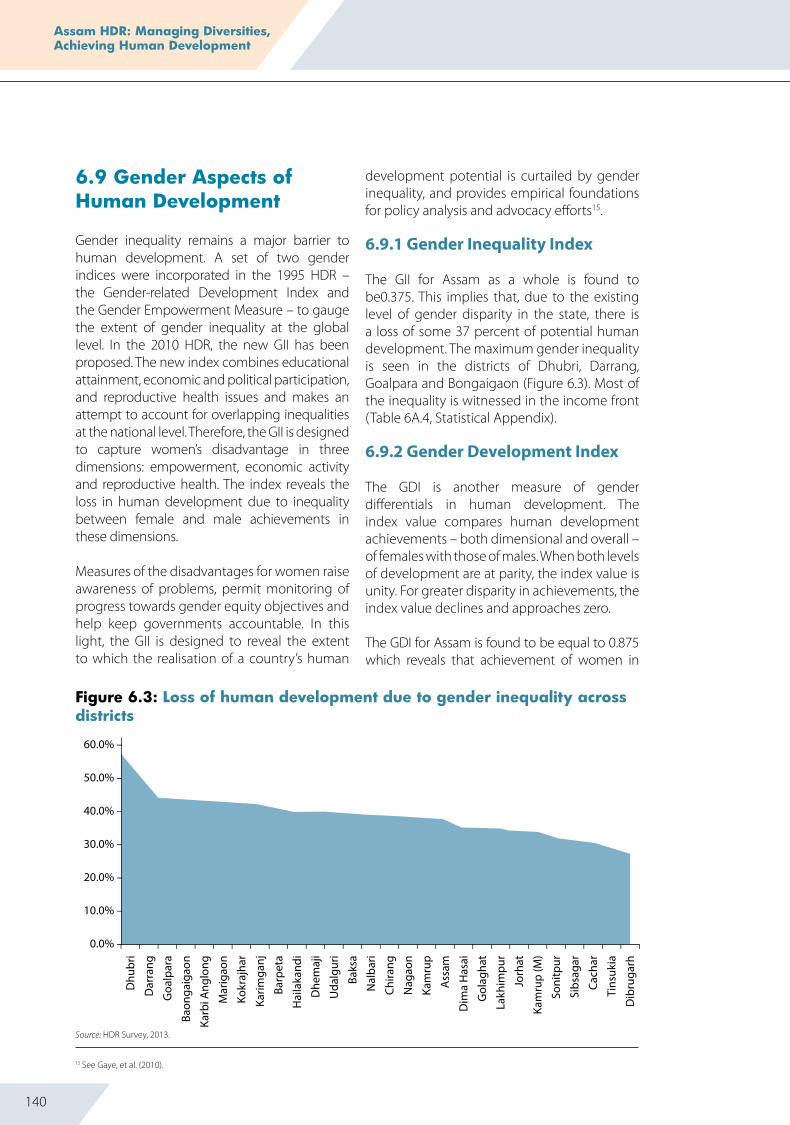
140
Assam HDR: Managing Diversities, Achieving Human Development
Figure 6.3: Loss of human development due to gender inequality across districts
Source: HDR Survey, 2013.
15 See Gaye, et al. (2010).
6.9 Gender Aspects of Human Development
Gender inequality remains a major barrier to human development. A set of two gender indices were incorporated in the 1995 HDR – the Gender-related Development Index and the Gender Empowerment Measure – to gauge the extent of gender inequality at the global level. In the 2010 HDR, the new GII has been proposed. The new index combines educational attainment, economic and political participation, and reproductive health issues and makes an attempt to account for overlapping inequalities at the national level. Therefore, the GII is designed to capture women’s disadvantage in three dimensions: empowerment, economic activity and reproductive health. The index reveals the loss in human development due to inequality between female and male achievements in these dimensions.
Measures of the disadvantages for women raise awareness of problems, permit monitoring of progress towards gender equity objectives and help keep governments accountable. In this light, the GII is designed to reveal the extent to which the realisation of a country’s human
development potential is curtailed by gender inequality, and provides empirical foundations for policy analysis and advocacy efforts15.
6.9.1 Gender Inequality Index
The GII for Assam as a whole is found to be0.375. This implies that, due to the existing level of gender disparity in the state, there is a loss of some 37 percent of potential human development. The maximum gender inequality is seen in the districts of Dhubri, Darrang, Goalpara and Bongaigaon (Figure 6.3). Most of the inequality is witnessed in the income front (Table 6A.4, Statistical Appendix).
6.9.2 Gender Development Index
The GDI is another measure of gender differentials in human development. The index value compares human development achievements – both dimensional and overall – of females with those of males. When both levels of development are at parity, the index value is unity. For greater disparity in achievements, the index value declines and approaches zero.
The GDI for Assam is found to be equal to 0.875 which reveals that achievement of women in
– – – – – – – – – – – – – – – – – – – – – – – – – – – – –
Dhu
bri
Dar
rang
Goa
lpar
a
Baon
gaig
aon
Karb
i Ang
long
Mar
igao
n
Kokr
ajha
r
Karim
ganj
Barp
eta
Hai
laka
ndi
Dhe
maj
i
Uda
lgur
i
Baks
a
Nal
bari
Chira
ng
Nag
aon
Kam
rup
Ass
am
Dim
a H
asai
Gol
agha
t
Lakh
impu
r
Jorh
at
Kam
rup
(M)
Soni
tpur
Sibs
agar
Cach
ar
Tins
ukia
Dib
ruga
rh
60.0% –
50.0% –
40.0% –
30.0% –
20.0% –
10.0% –
0.0% –

141
Gender Dimensions of Human Development From Differentials to Inequalities
the dimensions of human development taken together is less than that of men by about one-10th times. Most unequal gender development can be found in Karimganj, Dhubri, Marigaon, Darrang, Udalguri and Cachar. Contrarily, in Kamrup (M), Chirang, Sonitpur, Sibsagar, Dibrugarh and Jorhat, the gender disparity in human development is observed to be relatively equal (Figure 6.4, Table 6A.5, Statistical Appendix).
6.10 Summing Up
The gendered differences in social and economic well-being of women and their lives are a result of the coincidence of several phenomena. There is perceptible difference between males and females in Assam in their overall living conditions and social spaces enjoyed. The social and cultural practices greatly influence women’s autonomy in the economic sphere as well and together these factors have also accentuated the differences between males and females in different spheres of life. The burden of a high percentage of teenage motherhood and associated high child mortality, especially of the girl child, pose serious challenge to the overall survival status of the young female and the female child. The situation is worse in minority and SC concentrated districts in the state. The higher incidence of teenage motherhood deprives the girl of her right to complete her education
Figure 6.4: GDI across districts
Source: HDR Survey, 2013.
and find meaningful economic engagement. Female educational achievement continues to lag behind, particularly after the secondary level, and the norms of gendered roles in the domestic sphere and higher marital fertility among adolescent girls further accentuate her restriction in labour market participation. Females in Assam also have lower educational achievements in technical and vocational skills and this is a major challenge for women in the context of a rapidly urbanising economy with tertiarisation that demands higher technical and vocational skills. Women, consequently, are more disadvantaged in obtaining a gainful employment opportunity and the differences and disadvantages become more prominent across religious minority groups and the SC population and in areas with spatial attributes such as the Char and flood-affected areas. Employment of women is a necessity but as long as her work in the domestic sphere remains unrecognised and is considered as a private matter and a woman’s responsibility, women will always continue to face conditions of extreme social and economic vulnerability beside threats of violence, both physical and psychological. Gendered inequality may not be costless in terms of its effects on society and overall well-being because such inequality is likely to contribute to social exclusion and marginalisation in an ethnically diverse state like Assam.
Karim
ganj
Dhu
bri
Mar
igao
n
Karb
i Ang
long
Dar
rang
Uda
lgur
i
Cach
ar
Lakh
impu
r
Baks
a
Bong
aiga
on
Barp
eta
Goa
lpar
a
Hai
laka
ndi
Dim
a H
asao
Dhe
maj
i
Nag
aon
Kam
rup
Kokr
ajha
r
Ass
am
Nal
bari
Tins
ukia
Gol
agha
t
Jorh
at
Dib
ruga
rh
Sibs
agar
Soni
tpur
Chira
ng
Kam
rup(
M)– – – – – – – – – – – – – – – – – – – – – – – – – – – – –
1.000 –
0.900 –
0.800 –
0.700 –
0.600 –
0.500 –
0.400 –
0.300 –
0.200 –
0.100 –
0.00 –

142
Assam HDR: Managing Diversities, Achieving Human Development
Environment and Sustainability Negotiating Externalities, Ensuring Sustainability7

143
Environment and Sustainability Negotiating Externalities, Ensuring Sustainability
7.1 Human Development, Environment and Vulnerabilities
Recent HDRs1 have indicated that the main threat to maintaining progress in human development comes from increasingly evident unsustainable production and consumption patterns. In this context, along with the issue of use of exhaustible resources and clean energy2, degradation of our land and forest resources3 caused by excessive and unplanned development also come to the forefront of discussion. The issue of the trade-off between economic well-being and environmental sustainability is now apparent, but the changing environment, resultant on natural as well as anthropogenic factors, also creates constraints and impedes well-being of people. Exhaustion, degradation or deterioration of resources creates multiple forms of negative externalities4, which limit or adversely affect the capabilities of the people to ensure their well-being.
Various HDRs prepared in the world, national and regional contexts have already started to address climate change and water scarcity issues5. The task is now how we shall account for environmental indicators (temperature, water availability, clean air, etc.) and assess them in a locality-specific context at a time series interval. Forest cover changes and use
of unclean energy act as prime determining factors in the depletion and degradation of the quality of natural resources (land, water and air), cause ecological inequality or inequality in the distribution of social costs6 or in deriving equal benefits from the environment in a living space - affecting the inherent capabilities of the people even in the short run. The economic outcomes that vary because of ecological inequality7 would critically affect the ‘means’ to perform valued functionings such as providing education to children, thus hindering the human development process. This can, indeed, be particularly detrimental to human well-being in a state where public provisioning of basic services is grossly inadequate.
The argument that takes centre stage in a changing environment is that of weak sustainability of our resources or even irreversibility of our available resources8. No amount of man-made capital or provisioning would be adequate if natural resources are depleted beyond a critical point. This tends to intensify our interest in the valuation of environment and ecosystem services9.
UNDP HDR 2007-08 had identified five key transmission mechanisms through which climate change (high variability in rainfall and temperature) could stall and then reverse the human development process. These are: agriculture production and food security, water
1 For instance, the HDR2010 (UNDP, p.81).2 A large number of environmental problems are associated with the production and combustion of coal. The same is the case for petroleum. Numerous studies across the world have assessed the negative externalities caused by these two resources. 3 Land and forest are non-exhaustible and renewable resources, and need effective working plans and regulations to sustain the returns. 4 These are in the form of increases in air temperature, pollution, high water runoff on the surface and subsequent impacts of flood and erosion, crisis in water supply, health outcomes and fallouts would never end. 5 Water scarcity is caused by poor rainfall as well as the inability of the land and failure of human beings to preserve it. Two factors -- unclean energy sources and forest degradation -- would explain a large part of our environmental crisis; forest degradation, for example, diminishes the soil’s water retention capacity. 6 See Torras (2006).7 For example, in the flood and sand deposition afflicted Dhemaji district of Assam, paddy yield (1,290 kg/hectare, 2009-10) is much lower than the state average of 1,765 kg/hectare. In such circumstances, the issues of resilience and adaptability of affected people become irrelevant because of repeated adversities caused by floods and irreversibility of the damages. 8 Coarse sand depositions in the agriculture field and river erosion are some forms of weak sustainability and irreversibility of the damages done. 9 This is needed because environmental resources offer a number of services for human well-being, which are ordinarily not accounted for in regular market transactions. As the benefits from environmental services and costs of depletions are not always immediately obvious or because they are not priced, they tend to be ignored with serious consequences for human health and well-being. See Haque, et al. (ed.) (2011), p2.

144
Assam HDR: Managing Diversities, Achieving Human Development
stress and water insecurity, rising sea levels and exposure to climate disasters (intensive storms and landslides), ecosystems and bio-diversity, and human health. It posits that climate change affects rainfall, temperature and water availability for agriculture. In a localised context, too, however, we can observe certain negative fallouts resultant on degradation of the environment and ecosystem leading to a climate change-like situation (decline in agriculture production, unavailability of potable water and poor health outcomes10), even though the climate does not show variations. Moreover, as mentioned earlier, excessive use and consumption of certain resources, even in a small locality, release pollutants to create substantial stress on the local level air quality and potable water.
This offers a useful backdrop to construct a few indicators and assess the prevailing environmental situation in Assam and link them to human development outcomes–an understanding on how environmental stress affects the capabilities of the people.
7.1.1 environment and Capabilities
The capabilities achieved or possessed by the human being are, to a large extent, determined by the physical environment people live in. This is, however, only one part of the scenario(the case of environmental determinism11 and adaptation). The other part of the explanation is that, even in the short run, the negative externalities created by the degradation of the environment reduce or limit the capabilities already possessed by human beings and subsequently affect the quality of life12.
In this context the need for evaluating the environmental arrangements emerges; how the opportunities are set or constrained in a new environment and subsequently influence the activities of the people13 and how people try to cop and finally adapt to the changed situation. People’s capability to cope and adapt to the crisis is also determined by provisioning of certain basic services, appropriate regulations and governance of the state. There are ample cases where people struggle with persistent deprivation and then finally becoming accustomed to such situations, however, fail to attain the basic necessities of life and make a decent living. Life is so occupied with struggle that there is no space to sense whether the work being done is meaningful, remunerative and whether they have time for leisure or learning. Children who lose school days because of floods or are compelled to fetch water from long distances because of unavailability of quality water near their homes, miss the opportunities forever to make the best use of their opportunities which, in turn, prevents expansion of their capabilities in the long run.
Such situations are now very much prevalent in the state of Assam. Prior to a detailed analysis on the present status of the environment, a brief note on the environmental history of the state would help to understand the situation better.
7.2 A Brief Environmental History of Assam
Forest cover changes and loss of quality forests in Assam (and in the surrounding states), to a large extent, have shaped the present
10 The rising temperature also creates disaster on the health front. Major killer diseases such as malaria and encephalitis now have expanded their coverage and take atoll where public provisioning of the healthcare system is poor in a developing country like India.11 A 19th and early 20th century approach to the study of geography that the physical environment affects and even causes human activities and culture. 12 In flood-affected areas, people often cannot attend work and children miss school for several days during the year. Such circumstances create an uneven playing field, particularly for children. 13 Outmigration for lower end jobs is one of the crisis indicators in this context. The argument or issue of resilience, however, is non-applicable in such circumstances if the changing environment displaces people, although temporarily.

145
Environment and Sustainability Negotiating Externalities, Ensuring Sustainability
ecology and ecosystem of the state14. In each forested region in India, the first era of massive deforestation occurred shortly after it was absorbed into the British Empire, at a time of transition in the area’s political economy15. By 1947, India’s forests were depleted not only by expanding crop production but also by commercial timber exploitation and plantation cropping for the world market16. The state of Assam saw the combined surge of tea plantations and immigrant peasant frontiersmen17. The tiny tribal population in the hills of the region, though engaged in shifting cultivation, did not pose a threat to the forests and ecology of the region as the market orientation of the colonial regime did. Records and studies indicate massive conversion of forested land in Assam, but we lack evaluation and data to show the extent to which the fallouts had led to a deterioration of the environmental indicators of the state or maintained them at the borderline. The effort of the British, however, was seen in adoption of working plans18 for planned extraction of forest produce to sustain the ecology of the region.
The 20th century experienced massive growth of population in the state from a mere 3.3 million in 1901 to 26.7 million in 2001 and 31.2 million in 2011 which put tremendous pressure on its resources – land and forests. The ideas and issues involved in forest conservation started to take shape since the last quarter of the 19th century with the adoption of acts and regulations for the conservation by the colonial state19; positive fallouts of which,
however, did not continue to the present times. Moreover, the World Wars helped to expand the activities centred on Assam’s forest land and tea industry20. The great depression further hit the tea industry hard, forced the industry to fire many of its indentured workers. Many of the redundant workers squatted in adjacent government forests and used (‘damaged’21) the forest and land to ensure their livelihood.
Overall, the combined interests of the tea planters, imported (indentured) workers, and immigrant farmers placed a heavy and escalating pressure on the forest of Assam22. Even though the effective use of land under the patronage of the colonial system continued, it is yet to be ascertained who is the ultimate beneficiary or loser in the present ecological system.
7.2.1 The Post-independence Scenario
The common perception is that the rising intensity of floods and river erosion in Assam is a direct repercussion of deforestation and construction of dams to tap the immense hydroelectric potential of the rivers in the sub-Himalayan belt of Arunachal Pradesh and Bhutan23. Two factors – flood and erosions (and sand deposition)–resulted in the effective loss of resources, compelling a section of peasant communities to forcefully assert their claim over state-owned forest lands24. The data on the encroachment of forest and vanishing forests and wetlands in the state largely reveal
14 The high run-off of water from the neighbouring hills, particularly from Arunachal Pradesh and Bhutan, now carries coarse sand and changes the course of many tributaries of the River Brahmaputra – Jiadhal and Aie, to name a few. Consequently, the ecology and ecosystem in small pockets of the state of Assam are now severely affected. Moreover, there are cases of loss and destruction of rich wetlands of the state. The impacts and values of loss in economy and ecosystem services could be determined by micro case studies. 15 Tucker (2012), p. 142.16 Ibid, p 168.17 Ibid, p 170.18 Saikia (2011), p157.19 Ibid, p12, p 83.20 Saikia 2011:189; Tucker 2012:172.21 As the word used by Tucker 2012: 172.22 Ibid, p 174.23 Gohain (2008).24 Saikia 2011:1.

146
Assam HDR: Managing Diversities, Achieving Human Development
this phenomenon. The conversion of forests and wetlands to agrarian and settlement zones has contributed to a vicious cycle of ecological crisis in the state25.
The state, on the other hand, through acts and regulations (Wildlife Protection Act, 1972; Forest (Conservation) Act, 1980, etc.) continued to assert its authority over the forest, restricting people’s access and dependence on it. Everyday requirements, namely, grazing, shifting cultivation, collection of firewood and Non-Timber Forest Products (NTFPs) or fishing inside the forest came under a regime of strict restrictions26. Regulations along with the degradation of forests and wetlands reduced people’s access to common property resources, affecting their well-being. Access to such a pool of resources helps to generate employment (even in a sustainable manner) and fulfil household energy requirements. Well-being issues of many fringe villages of forests (and wetlands) to, a significant extent, depends on such access, when other opportunities are almost non-existent27.
Moreover, there is clear evidence that unsustainable use and destruction of forest resources have robed people of sustainable jobs28. The Supreme Court of India’s verdict in 1996 banning felling of trees induced a negative impact on livelihoods of a large section of people in the state as well. Hundreds of saw mills and plywood units in the state have been closed down since December 1996. There was a possibility that the resources could have been used in a sustainable manner with working plans of forests.
The issue of forests, though, comes into prominence in environmental debates in Assam; the state at present has more than 140,000 hectare (ha) of wetlands (more than 100,000 ha of beels and 39,000 ha of swamps; Economic Survey, Assam 2011-12) providing significant ecological and economic services. Till date, though, there is no tangible valuation of the services provided by the wetlands in the state; ecologists and environmental scientists are of the opinion that the value of a healthy wetland could be several times more productive than that of a forest of an equal size29. There is evidence that wetlands of the state are being squeezed and so are the ecological and economic benefits derived by the people dependent on them. The wetlands of the state are shrinking due to both natural and anthropogenic reasons. In addition to the massive amount of silt carried by the river and flood water, construction of dykes and embankments along the river banks also contributed to the deterioration of the water bodies. Now it is noticeable that rampant expansions of human settlements and industrial activities have created a disaster so far as the services of the wetlands are concerned. Studies indicate that anthropogenic stress on the wetlands leads to a depletion in fish fauna which result in a loss of direct and indirect benefits to society including livelihoods of the fishermen30.
The sudden and intense pressure of population over space over the past one century and concomitant ecological crises resulting out of ineffective regulations and governance of different political regimes now have led to
25 Along with a surge in this trend during colonial times that put the state on the borderline of ecological crisis (it is believed so), the present surge of anthropogenic activities (cutting down of forest for livelihood to conversion of land for tea smallholdings) along the fragile lower Himalayan zones and forested belts also aggravated the crisis of sustainability. Case studies report such incidences (Box 6.3), but detailed studies are required to assess the impacts in the micro environments.26 Saikia 2011: p. 309.27 Jodha (1990).28 Das 2012 a; p. 10.29 Opinion of Prof. P.C. Bhattacharrya; Call to protect wetlands of Assam, The Assam Tribune, 18 April 2012.30 Baishya and Bordoloi (2007).

147
Environment and Sustainability Negotiating Externalities, Ensuring Sustainability
conflicts of multiple forms. The poor peasantry (including people displaced by floods and erosion) now assert their claims over forests and other natural resources to make a living, which has created intense conflict with the state on settlements and evictions31. More compelling is the fact that there appear to be no effective plans and programmes to address the crises. The outcome anticipated from this scenario is that the poor would fail to access the basic necessities of life and, consequently, their opportunities to choose a valued life would, perhaps, be lost (see the case study on Matmora in this chapter).
Table 7.1 presents the changes of land use in the state in the past 30 years. The decline of areas under forest, barren land, uncultivated fallow and fallow reveal the pressure on land. The pressure on the land is also reflected by an increase in the net sown area along with the double cropped area (doubled cropped area in the state has increased by about 600,000 ha, from 754,000 ha in 1980-81 to 1349,380 ha in 2010-11). Considering that the uncultivated fallow and fallow lands are now put into
agriculture uses – the decline in acreages under these two categories (146,397 ha) is still larger than the increase of net sown area (104,597 ha). The indication could be that a proportion of cultivable land was eroded, degraded and/or converted for non-agriculture uses32. This phenomenon is also supported by NSSO data, showing a decline in rural persons engaged in agriculture33 from 86.4 percent in 1993-94 to 75.6 percent in 2009-10.
7.3 Prime Environmental Stressors in the State
7.3.1 Flood, Sand and River erosion
a) Flood and the Damages
Admittedly, there are certain positive impacts of floods, if flood water deposits alluvial (silt) which nourishes agricultural fields. Damages caused by floods are, however, enormous with destruction of standing crops, houses and assets, loss of life and livelihood, and deposition of sandy layers over cultivable land, which outweigh all positive impacts.
31 Invasion of anthropogenic activities into the forests has also induced conflict with animals, particularly elephants. The result is that from1980 to 2003 about 1,000 human lives were lost along with 370 elephants in Assam. Moreover, there are numerous cases of crop damage and economic loss. There are recommendations on creation and protection of the elephant habitats and corridors, prevention of encroachment and commercial exploitation of forest areas (Choudhury, 2004) but all have faced serious challenges with the rising pressure of population. On the other hand, families affected by conflict with animals (elephants), along with economic losses, face consequences of untreated psychiatric morbidity. A study (Jadhav and Barua, 2012) captured the hidden mental health dimensions of human-elephant conflicts. There is scope to argue that the trauma thus faced significantly affects the people’s capability attainment process. 32 Detailed studies are required on what the extent such changes in land use have induced ecological instability of the region. 33 The rise is population and subsequent pressure on the land is, however, one of the many determinants of the shift of workforce from the agriculture sector.
Table 7.1: Land use changes in Assam
1980-81 2010-11 ChangesForest 1984,000 1853,260 -130,740Land not available for cultivation 914,000 1217,503 303,503Barren 1541,000 1408,042 -132,958Uncultivated fallow 172,000 128,164 -43,836Fallow 535,000 432,439 -102,561Net sown area 2706,000 2810597 104,597
Source: Figures are in hectare. **Source – Statistical Handbook of Assam, 1984 and 2013.

148
Assam HDR: Managing Diversities, Achieving Human Development
The National Flood Commission of the Ministry of Water Resources had estimated the area vulnerable to floods in Assam at 31.50 lakh ha34 against 335.06 lakh ha for the whole of India35. Assam thus accounts for 9.4 per cent of the total flood prone area of the country. The Flood Hazard Atlas of Assam, (ISRO, 2011) indicates that in nine districts, namely, Dhemaji, Lakhimpur, Jorhat, Sibsagar, Nagaon, Marigaon, Darrang, Nalbari and Barpeta, floods affect more than 40 percent of the geographical area. Floods displace(at least temporarily) about 6 million people of Assam’s population36. Floods in the year 2012 had breached embankments in 53 locations. The recurrence of floods and erosion continues to be the major obstacle towards development of the largely agrarian economy of the state. Floods also washes away the nutrient rich top soil when the flood waters recede and it leaves behind many problems relating to health and reconstruction activities to put the livelihood systems back in motion.
Weibe (2006) had estimated flood damage in the state annually at INR 6,521 per ha during the period 1999-2005. The Government of Assam (2009)37 estimated the annual flood damage at INR 14,590 per ha in the Dhemaji district, one of the most flood prone districts in the state. The annual compound growth rate of production of autumn paddy, rapeseed and mustard, sugarcane, jute, winter paddy and potato had declined significantly in the state, though summer paddy showed a high compound growth rate at 9.25 percent38. The flood, in the year 2004, affected 30 percent of the total geographical area and 15 percent of the gross cropped area; the value of
crop loss was estimated at INR 3,747 million, one of the highest so far recorded in the state. The flood in the year 2000 affected 9.5 percent of the gross cropped area at an estimated loss of INR 1,735 million39. The state faces three to five waves of floods during the year with the peaks return with massive destruction from year to year – 1998, 2002, 2004, 2008, 2012 and 2013–being the most destructive40.
A study conducted by OKDISCD41 estimates the number of days all members of a household lost to reconstruct and clean the house, and days they were forced to remain absent from work and schools (Table 7.2). It emerges that people in flood-affected villages of Assam are compelled to spend, on an average, 25 days to clean and re-construct their homes, lose about 47 workdays and, more importantly, lose 45 days of schooling during the year. The cumulative implications on all fronts – from opportunity costs to capability deprivation – are, hence, well implied.
The present HDR survey reveals that in the districts of Barpeta, Marigaon, Goalpara, Dhemaji, Sibsagar, Lakhimpur, Jorhat, Hailakandi and Cachar more than 25 percent households reported an impact on their agriculture land because of floods. The survey data also reflect that the total annual income per ha from agriculture in the sample households of most of these districts –Marigaon (INR2,491), Goalpara (INR4,334), Dhemaji (INR1,257), Lakhimpur (INR1,420), Jorhat (INR2,023), Hailakandi (INR5,031) and Cachar (INR3,517) – is lower than the state average of INR6,205.
34 The total geographical area of Assam is 78.5 lakh hectares and the net sown area is 28.1 lakh hectares (Government of Assam 2010-11). It indicates that all flood affected areas of the state are not cropped area. Flood Hazard Atlas of Assam, ISRO (2011) indicates about 9 percent of total geographical area of Assam is moderate to very highly affected by flood. 35 Government of India (2011) Report of the Working Group on Flood Management and Region Specific Issues for XII Plan, Planning Commission, New Delhi 36 Extracted from South Asian Network on Dams, River and People post June 15, 2013 on 2012 Assam Flood. 37 Government of Assam (2009) Report on damage of flood released by the Dhemaji district administration for the year 2007-08, dhemaji.nic.in- extracted on 25/6/2009)38 Mandal R (2014) 39 Mandal, R. (2010).40 Newspaper reportage and State Disaster Management Plan, Assam, Assam Disaster Management Authority, Government of Assam (undated).41 OKDISCD (2014). Non-structural measures of flood disasters mitigation in Assam, sponsored by the Indian Council of Social Science Research, New Delhi.

149
Environment and Sustainability Negotiating Externalities, Ensuring Sustainability
b) River erosion
The Assam valley part of the Brahmaputra River has lost approximately 7.4 percent (4,000 km2) of its land area because of river bank erosion and channel migration during recent history. River erosion wiped out more than 2,500 villages affecting nearly 500,000 people42. In addition to the River Brahmaputra, many of its tributaries too have created havoc by eroding their banks. The villagers who have lost land because of river erosion consider erosion as the prime environmental stressor. There are possibilities and ways to adapt to the conditions of recurrent floods, but with erosion of land people lose their resources forever and also their identity. There is no provisioning for the compensation for loss of land in such circumstances. It also places challenges on the state for resettlement of the people.
The Water Resources Department, Government of Assam, has identified 25 vulnerable and severe river bank erosion sites. The major erosion-affected areas are Rohmoria in Dibrugarh district (eroded areas 8,435 ha), Palasbari in Kamrup district (16,037 ha) and Matmora in Lakhimpur district (3,640 ha)43. Estimates of OKDISCD (2014) study reveal that in the villages along the Brahmaputra River of Lahorighat and Moirabari blocks of Marigaon district, households have lost, on an average, 15 big has (2 ha) of land because of erosion. The reported erosion was also found to be significant in Fekamari block of Dhubri district (average eroded area in the sampled households 11.1 bigha or 1.5 ha) and Kaliapani block of Janjimukh area of Jorhat district (7.6 bigha or 1 ha).
42 Phukan, et al. (2012). River Bank Erosion and Restoration in the Brahmaputra River in India, The Clarion, 1 (1) 1, 1-7.43 Water Resource Department (2008). “North Eastern Integrated Flood and River Bank Erosion Management Project: Feasibility Study (PPTA, Phase II)” Unpublished report of Water Resources Department,
Table 7.2: Flood impact on attainment of capability in flood-affected villages
Number of HH Visited in Flood
Affected Villages
Average Days Spent to Re-
construct and Clean the House
Average Workdays Lost
Average Schooldays
Missed
Bongaigaon 60 23 40 23
Darrang 60 19 59 24
Dhemaji 60 36 51 53
Dhubri 30 24 90 57
Dibrugarh 30 23 57 55
Golaghat 30 7 13 18
Jorhat 40 26 32 39
Kamrup 30 30 50 41
Lakhimpur 60 38 51 51
Marigaon 60 26 38 56
Sibsagar 50 16 29 56
Sonitpur 30 32 63 79
Source: Field work 2013-14, OKDISCD study.

150
Assam HDR: Managing Diversities, Achieving Human Development
c) Sand Deposition
The damage caused by deposition of a sandy layer in agriculture fields is not very common44 but, once it happens, this damage is irreversible45. This factor finds little space in the discourse on the flood havoc and related policy prescriptions and mitigation plans in the flood ravaged state of Assam. The HDR survey (2013) finds that, in the district of Dhemaji, some 21.5 percent and a significant section of households in Lakhimpur, Goalpara and Marigaon districts reported sand deposition in agriculture fields (Table 7.3). In the Char blocks (13.34 percent) and in the blocks with multiple diversities
(flood, Char and border, 23.5 percent), a significant section of the households reported sand deposition in their agriculture fields.
7.3.2 Deforestation and the Outcomes
The recorded forest cover of Assam in 2005 was 27,645 km2 of which 1,444 km2 (5.2 percent) was Very Dense Forest (VDF) and 11,387 km2
(41.2 percent) was Moderately Dense Forest (MDF) and the rest was Open Forest (OF). The percentage of the total geographical area of the state under forest cover was 35.2 percent. Forest cover in the year 2013 though shows
Box 7.1 River bank erosion and the externalities
Many villages along the Brahmaputra in the Kathani and Tulsibari Panchayats of Lahorighat Block in Marigaon district have lost all their land resources because of erosion and are forced to take shelter on the embankment. The present embankment too bears the threat of being eroded away, and has retreated by few km(reconstructed several times) in past few decades. The people in these villages basically have lost their identity and live in constant fear and anxiety. In the temporary hutments on the embankment, one could find only women, children and the elderly; the younger generation is forced to move out for jobs to distant places. In addition, some small tributaries of the Brahmaputra too have caused extensive damage. In past few years, Aie River in Bongaigaon district has caused massive bank erosion and the river itself is now shallower, causing extensive damage after every wave of floods. People are of the opinion that, once the main river channel becomes shallower, water currents place pressure on the banks leading to erosion. The issue of heavy sedimentation of the river beds in now widely reported across the state, particularly in the north bank of the Brahmaputra. The villagers at Nachanguri, Huramara, and BalarGudam have reported that the River Aie, over the years, has gone beyond control. Most households of BalarGudam village have lost their land and homes because of erosion. On whatever agriculture land is left with the villagers, it is not possible to plant winter paddy because of severe water logging problems. The problem of water logging, in many part of the flood-affected areas of the state, is now thought to be a result of the construction of the structure (embankment) along the river and not ensuring adequate channels to drain the water out.
Source: OKDISCD (2014).
44 Reddy (2003).45 This statement is based on the observation of massive piling of sand in the paddy field in the Jiadhal basin of Dhemaji district and Aie and Beki river basin in Bongaigaon and Barpeta districts. In subsequent years, however, deposition of finer silts over the sandy layers could help to reclaim land to an extent and obtain some agriculture return.

151
Environment and Sustainability Negotiating Externalities, Ensuring Sustainability
an increase by 26 km2; the gain, however, is at the cost of MDF. The VDF though remained the same during the period, the MDF declined by 42 km2 and there was a gain of OF by 68 km2. The loss of quality forest has serious repercussions in the effort on climate change mitigation.
The HDR survey (2013) reveals that, in the districts of Lakhimpur (34.7 percent), Bongaigaon (21.6 percent), Dibrugarh (19.6 percent), Dima Hasao (18.2 percent), Karbi Anglong (14.7 percent), Chirang (11.4percent) and Golaghat (10.6 percent), more than 10 percent sample households have reported degradation of forests (Table 7.3). It shows that some of the districts with reported high forest
degradation also have very high concentration of forest covers and tribal population. The district of Dima Hasao has forest coverage of 87.4percent of its total geographical area and 70.9 percent of the population of the district is tribal. Karbi Anglong district has 76.3percent forest coverage and 56.3 percent tribal population. The Forest Survey of India, 2014 also indicates that the tribal districts of Assam have lost 48 km2 of forest during 2011-13.
Encroachment of forest area in Assam totalled 3,304km2 as in February, 201346. This represents 12 percent of recorded forest in Assam. In 2004, about 11 percent forest area in the state was encroached. Encroachment can be considered
Box 7.2 Sand deposition and poverty among farm households
Dhemaji district, once the rice bowl of Assam, is now transformed into a virtual desert due to sand deposition as a result of flooding from the Himalayan tributaries of the Brahmaputra River. Satellite imagery of 1999 reveals that over 11,247 ha have been rendered unproductive by sand deposition in the district. Further, between 1992 to 2004-05, the net sown area of the district decreased by 7,689 ha and fallow and uncultivated land has increased by more than 8,013 ha as reported in the statistical handbooks of Assam. These figures indicate that land degradation is significant in the district which has a total cultivable area of about 160,000 acres. A study has indicated that, in the sand deposited villages of Dhemaji district, paddy yield has declined by 1,900 kg to 2,500 kg per ha, monthly return from agriculture is estimated to be only INR 305. The decline in agricultural income has triggered large-scale migration of residents to distant places such the plywood factories and rubber plantations in Kerala and private security jobs in Tamil Nadu. State support for coping with the situation is found to be negligible; the average number of workdays people were granted under the Mahatma Gandhi Rural Employment Guarantee Scheme was just 14 days in the study villages as opposed to the stipulated provision of 100 days. The conditions of Dhemaji put into stark relief the need to strengthen the social security net of the state. Effective implementation of rural development and employment programmes might be one way to ameliorate the distress. State expenditure on the construction and reinforcement of embankments, which has been the main strategy to control floods, has not been beneficial because of frequent breaching. Any attempt to improve water management would be helpful to farmers. Sandy soil cannot retain water and assurance of water would improve yield.
Source: Extract from the study Das (2012b).
46 Lok Sabha question number 397, dated 22 April 2013.

152
Assam HDR: Managing Diversities, Achieving Human Development
as a better indicator than the change in forest cover to understand the crisis of deforestation and human development issues. Encroachment data would not only reflect loss of forest cover, but also the livelihood crises in a locality as well as inefficiency of the state to make effective and efficient use of the forest resource.47
About 26 percent households in the HDR survey (2013) found it relevant to answer the question whether their access to forest resources is now restricted. Among them, 38 percent households reported unrestricted access to the forest. Reported unrestricted access was found to be higher than the state average percentage in the districts of Darrang, Nalbari, Barpeta, Baksa, Dhemaji, Jorhat, Golaghat, Kamrup, Marigaon, Dhubri and Udalguri. These districts have a relatively low proportion of area under forest cover and the hill districts of Karbi Anglong and Dima Hasao, though, which have a much higher proportion of forest coverage to their geographical areas, did not reveal ample unrestricted access to the resource. About 74 percent respondents in Karbi Anglong and 91 percent in Dima Hasao reported that their access to forests is restricted. The explanation may be that, in the districts having higher concentration of forest, the conservation efforts of the state are more focussed.
Altogether 6,665 households (16.7 percent of the total covered for the survey) reported on the nature of restriction on access to forest resources. Among them 91 percent reported that it was of a formal nature. Altogether 67 percent households are of the opinion that the nature of restriction now has become more stringent. It is also revealed by the question on NTFP collection. Of the 10,564 households (26.4 percent) that found it relevant to answer
the question on NTFP collection, about 40 percent said their access and collection of NTFP have decreased. Among districts that show significant decline in access are Lakhimpur, Sonitpur, Dibrugarh, Tinsukia, Bongaigaon, Cachar, Chirang and Dima Hasao; notably Chirang and Dima Hasao districts have a significant proportion of tribal populations. In the hill blocks of the state, about 46 percent households indicated a decline in the collection of NTFP. Forest degradation (reported by 43 percent households) was cited as the prime reason for a decline in NTFP collection. Stringent regulation (reported by 15 percent) though now has contributed to the decline in access; some positive developments such as a shift to other forms of works(18 percent) and alternative fuel (4 percent) also act as contributory factors.
7.3.4 Access to Clean Water and Air
The HDR survey (2013) reveals that about 53 percent households are satisfied with access to water in the state. The level of satisfaction is low in the flood-affected districts (Table 7.3). In the flood blocks, only 43 percent households reported satisfaction over access to water. In the flood-affected districts, people face a serious crisis over drinking water and, even when the flood water recedes, it leaves behind damage of water sources. Moreover, in the hill district of Karbi Anglong, only 36 percent households reported satisfaction on access to quality water. For the hill blocks as a whole, the level of satisfaction over water access is about 39 percent48.
Regarding the water quality, altogether 33.7 percent households reported problems of excess iron and 8.8 percent reported turbidity
47 Das (2011).48 A report of the Central Ground Water Board reveals the major groundwater problem in Dima Hasao district is higher concentration of iron in scattered pockets, with the possibility of treatment for domestic purposes. The report, however, emphasised the problem of approachability considering the road conditions and location of the habitations (Ground Water Information Booklet Technical Report Series: D No: 22/2008-09North Cachar Hills District, Assam Central Ground Water Board, North Eastern Region Ministry of Water Resources, Guwahati, November 2008).
153
Environment and Sustainability Negotiating Externalities, Ensuring Sustainability
in their water sources. The problem of arsenic is reported in some (0.3 percent) households. It may be that iron content and turbidity of water can be assessed by common knowledge, which is not so in the case of arsenic (see Box 7.4 on magnitude of the problem of arsenic in Assam). Problems of iron are found to be acute in the districts of Barpeta (77 percent), Nalbari (63.5 percent), Dhemaji and Marigaon (53 percent each) and Karbi Anglong (52 percent). The case of turbidity of water is prominent in the Barak valley districts of Cachar (22.3 percent), Hailakandi (46.4 percent) and Karimganj (24 percent) and in Nagaon district (17.6 percent). Spatial diversity wise data reveal iron concentration is higher in the Char (46.7 percent) and general blocks (45.4 percent). Turbidity is found mostly in flood (17.8 percent) and border blocks (12.7 percent).
Industrial pollution, however, has not emerged as a major issue in the state but, in some districts, people have started reporting degradation of land due to industrial pollutants. For example, in Kamrup, 6.1 percent and in Karbi Anglong
4.7 percent households have reported that industrial pollutants have degraded their paddy fields.
Air pollution and breathing problems, however, have emerged as major problems in the state. Altogether 21.2 percent households have reported experiencing air pollution in their localities. The higher proportion of households reporting air quality problems are found in Kamrup Metro (51 percent) while in Goalpara, Nalbari, Nagaon, Marigaon, Chirang, Karbi Anglong, Golaghat, Cachar and Sibsagar more than 25 percent households reported air pollution as a problem. The rising number of registered vehicles in the state in past decade can be considered as one of the prime causes. For instance, significant congestion of registered vehicles can be seen only in Kamrup Metro district (130 per 100 people as on 2011, the next district by rank is Sibsagar with 40 vehicles per 100 people). In addition to the vehicles, the rising number of registered industries along with population density and congestions could also explain the situation. Moreover, about 6.5
Box 7.3 Deforestation and the outcomes
The villages of Udalguri district along the Bhutan border show massive deforestation. Interactions with the local people helped to ascertain a few reasons for this. It is relatively an easy way to ensure a living from selling logs, as the activity of cutting down trees does not require specific skills or capital investments. The people living along the belt are illiterate or have very low level of educational attainment. The impoverished villagers are used by the intermediaries to cut down the trees; the logs find a ready and remunerative market as well as illegal processing facilities in the locality. The expansion of small tea gardens in the district has also contributed to the vanishing forests. People have reported certain drastic changes in their locality in recent years. The two rivulets in the locality, Kaal and Chamrang, originating in the Bhutan Himalayas, run off with high velocity immediately after a heavy rainfall, but dry up soon after. There is no water in the rivulets during the off-monsoon period, which was not the case a decade earlier. Even during the monsoon, the area now experiences water scarcity in the agriculture fields. Moreover, the rivulets now carry sand and pebbles and deposit them in the paddy fields.
Source: Field interaction with the villagers, 2014.

154
Assam HDR: Managing Diversities, Achieving Human Development
percent households reported experiencing breathing problem in the state. The proportion of people reporting breathing problems is very high in the districts of Marigaon (33.2 percent), Kamrup Metro (20.7), Hailakandi (19.9), Udalguri (14.9) and Bongaigaon (14.1). The concentration of motor vehicles and industries could explain the problems in Kamrup Metro, Hailakandi and Bongaigaon districts, but explanations could be different for Udalguri (highly deforested) and Marigaon (flood affected) districts.
7.3.5 Unusual Weather and Rainfall Variability
About 42 percent households in the HDR survey (2013) feel that the weather of the state has become ‘unusual’49 in recent years. Such concern is higher in the districts of Hailakandi (72.9 percent households reported), Cachar (61 percent) and Baksa (62 percent), and low in the
districts of Darrang (4 percent), Sibsagar (15 percent) and Udalguri (20 percent). The border districts of Hailakandi and Cachar are located in the southern part of the state and closer to the Tropic of Cancer, so warmer than the rest of the state. Block-wise data also reveal that reporting on unusual weather is higher in the border blocks (reported by 57 percent)
7.4 Concern for the Environment–is Poor Environmental Knowledge a Stressor on Sustainability?
As per the HDR survey (2013), about 78 percent households in the sample feel that the environment they live in is important for them. Such a feeling is high in the districts of Dibrugarh (94.1percent) and Kamrup
Box 7.4 Arsenic and fluoride contamination in Assam
Twenty out of 27 districts in groundwater-dependent Assam are arsenic and fluoride contaminated. Two separate reports – one tabled in the Assembly and the other following a survey – have established this. The Public Health Engineering Department Minister said that the arsenic content in the groundwater ranged between 50 parts per billion (ppb) and 996 ppb in 19 districts. This translates into 0.05-0.996 milligram (mg) of arsenic per litre (l) of water. The permissible limit for arsenic established by WHO is 0.01 mg/l.
Prolonged arsenic contamination is known to cause cancer and skin diseases besides affecting reproductive health. A survey report by the Northeast Institute of Science and Technology also established high fluoride content in the groundwater in six districts, five of which are also arsenic affected. These districts include Kamrup Metro, where Guwahati is situated. Groundwater in central Assam’s Karbi Anglong was found to have a fluoride content of 15-20 mg/l while, in certain areas of Guwahati and its outskirts, it went up to 6.88 mg/l. The WHO permissible limit is 1.5 mg/l. Ingestion of 10-20 mg of fluoride per day for more than 10 years leads to crippling skeletal fluorosis, the report said. Inhabitants of at least half a dozen villages in Karbi Anglong district suffer from fluorosis in varying degrees.
Source: as reported in “Assam water contaminated with Arsenic, Fluoride”; The Hindustan Times, 14 March 2013.
49 Unusual weather was seen as change in time, duration of heat or rain cycle, intensity in rain or heat, etc.

155
Environment and Sustainability Negotiating Externalities, Ensuring Sustainability
Box 7.5 Failure to ensure environmental quality: Does technology adoption cost more than the health outcomes?
The residents of Bokajan in Karbi Anglong district reported lime dust from the Cement Corporation of India’s Bokajan factory had polluted the environment and posed health hazards. According to the factory source, the existing dust control concept - electrostatic precipitator - would soon be upgraded at a cost of around INR7.5 crores and the new system might reduce the lime dust (Source: The Telegraph, 13 September 2010).
Pollution Control Board (PCB), Assam sources said that, in addition to the 570 brick kilns which are operating after obtaining its permission, there are an additional 5,000 brick kilns, many of them are illegal, operational in the state. Although some of these brick kilns have managed to get the ‘no objection certificate’ from the PCB, Assam, most of them are flouting environmental regulations mentioned in the Air (Pollution Control and Prevention) Act, 1981. The brick kilns should not be located close to water bodies or water sources, roads, hospitals, schools and human habitations. However, this rule has been violated in many instances. The brick kilns are highly resource and energy intensive as well as a polluting industry, which is mostly due to obsolete and traditional production techniques used in India. The clusters of brick kilns are a source of local air pollution affecting the population, agriculture and vegetation. The pollutants from the brick kilns are carbon dioxide, carbon monoxide, sulphur dioxide, nitrogen oxides and suspended particulate matter. Moreover, traditional brick manufacturing uses considerable land area and top soil.
Source: Extract from the article“Brick Kilns Posing Serious Threats”, The Sentinel, 23 December 2013.
Box 7.6 People need to be informed on extreme forms of hazards
In contemporary times, the cholinesterase test helps to determine, to a large extent, whether a worker is physically fit to apply pesticides. The action of cholinesterase inhibitors is insidious. By the time the symptoms appear, irreparable damage may already have been done to the health of the worker concerned. Therefore, it is now necessary to take advantage of medical research and use laboratory analysis of body fluids to determine the level of cholinesterase activity in the body. A study on pesticide appliers in tea plantations of Assam finds reported discomfort of muscular and body ache (in 57 percent workers), constant weakness (49 percent), headache (32 percent), chest pain (23 percent), respiratory problems (63 percent), eye irritation (15 percent), skin irritation (13 percent), excessive sweating, chapped hands; most of these symptoms could be because of overexposure to cholinesterase inhibitors.
Source: Das (2012 c).
Metro (92.4 percent), but poor in Udalguri (32.3percent) and Darrang(64.0percent). Altogether 53.6 percent households showed their concern for environmental degradation.
This concern is high in Dibrugarh (89.5 percent) and Kamrup Metro (81.2 percent), but low in Marigaon (18.2percent), Barpeta (23.2 percent) and Udalguri (26.5 percent). About 49 percent

156
Assam HDR: Managing Diversities, Achieving Human Development
Table 7.3: Indicators of environmental stressors in state (%reporting HH)
Districts Agri. Land Affected by
Flood
Agri. Land Affected by
Sand
Agri. Land Affected by
erosion
Agri. Land Affected by Industrial Pollutants
Forest Loss Problem in Water
Facing Air Pollution
Baksa 7.2 5.9 4.3 0.2 0 41.6 13.1
Barpeta 54.3 7.1 15.2 0 0 78.5 3.2
Bongaigaon 11.8 4.7 5 2 21.6 44.4 18.2
Cachar 27.2 1.3 1.9 0.2 5.1 40.4 25.4
Chirang 22.4 5.4 2.4 3.5 11.4 29.2 27.9
Darrang 3.7 0.9 0.4 0 0 42.6 1.9
Dhemaji 37.2 21.5 8.2 1.1 0.5 64.3 17
Dhubri 23.2 9.7 11.8 0.4 0 35.3 14.2
Dibrugarh 8.9 4.9 1.5 0.4 19.6 31.3 3.3
Dima Hasao 0 0 0 0 18.2 6.3 2.2
Goalpara 39.7 15.5 12.6 0 0 8.9 47.2
Golaghat 7.6 1.6 2.1 0.2 10.6 31.7 26.9
Hailakandi 28.2 0.8 2.5 0.4 0.1 55.5 21.5
Jorhat 31.1 2.1 12.4 0.3 1.5 45.2 6.3
Kamrup 19.3 5.7 3.8 6.1 1.2 39.8 22.5
Kamrup M 2.4 0.3 0.5 2 1.8 40.6 50.7
Karbi Anglong
2.4 0.8 1.9 4.7 14.7 64.3 27.8
Karimganj 13.2 0.1 0.8 0.1 0.06 43 7.8
Kokrajhar 0.4 0.2 0.4 0 0.18 2.9 23.2
Lakhimpur 31.5 15.9 16.3 2 34.7 36.1 7
Marigaon 43.2 14.9 18.7 0.4 0.09 60.4 35.1
Nagaon 19.8 2 1.8 0.5 2.65 54.5 35.5
Nalbari 4.5 2.7 0.9 0.3 0 65.7 42.3
Sibsagar 34 2.2 1.6 0.3 0 53.3 28.2
Sonitpur 15.3 4.8 4.7 0.7 2.3 36.5 11.8
Tinsukia 8.2 2.3 1.1 0.2 1.06 35.3 20.8
Udalguri 0.7 0.2 1.1 0.2 0.09 42.6 18.8
Source: HDR Survey (2013).
people in the state feel responsible for the conservation of the environment. This feeling, however, varies significantly from the districts of Kamrup Metro (78 percent) and Jorhat (73 percent) to around 20 percent in the districts of Udalguri and Dhubri. About 67 percent people in the state feel that they would be very much happier if the environment around them was better. This concern is higher in the districts of Goalpara (86.8 percent) and Dibrugarh (87.4 percent) and very low in Marigaon (30.4percent) and Udalguri (32.2 percent).
Feelings on the importance of the environment (overall 76 percent rural respondents and 84 percent urban), concern for degradation (52 percent rural and 62 percent urban) and responsibility for conservation (47 percent rural and 57 percent urban) are found to be higher among urban residents.
The above responses of the people reflect ample variations on environmental knowledge and concern for a good environment. A large section of people, though, desire a good

157
Environment and Sustainability Negotiating Externalities, Ensuring Sustainability
environment and feel that it is important for their overall well-being; but, on the concern and responsibility fronts, their responses have taken an escapee mode. The indication is that a significant section of people in the state are unaware on the issues on environment or have poor environmental knowledge. Environmental concern is found to be poorest in the Char areas (38.4 percent) followed by flood-affected blocks (43.5 percent). The district of Udalguri reflecting poor environmental concern, though, falls in border areas and is free from floods.
Awareness and knowledge about environmental issues and factors leading to degradation of the environment limiting sustainability issues are extremely important. The state administration, in recent times, has organised awareness drives against the use of plastic bags and their negative externalities generated from choking of water channels to the problems created in solid waste management. It now appears that convenience, along with poor environmental knowledge of the citizens, has taken an upper hand over concern and responsibility to ensure a better environment. Such behaviours, which are avoidable, could take a heavy toll on the environment in the long run. In addition to such practices on the home front, people in general are aware on certain health hazards caused by emissions from industrial units. However, in certain cases, people are not informed or aware of outcomes of certain type of exposure. For example, a symptom or simple form of headache or muscle pain or skin irritation of workers engaged in pesticides application cannot be treated as general ailments, which is often done. The outcome is that the tea plantation workers along with the agriculture workers, which constitute a significant section of the workforce in Assam, are exposed to serious kinds of health hazards.
Recent developments on certain issues, however, reveal people’s concern on the anticipated negative externalities of
development initiatives of the state. There are reflections that anticipation on externalities generates enormous anxiety among people.
7.5 Anxieties over River Dams
The river valley projects planned and initiated by the state in the lower Himalayan belt surrounding Assam have been a bone of contention for the negative externalities generated in the Assam valley. One of the issues seriously debated over a decade is the Lower Subansiri Hydro Electric Project. The Subansiri river valley project was planned and initiated in the mid-1990s, primarily to address the issues of floods, erosion and resource utilisation problems in Assam. Accordingly there was a plan to extend the river valley projects to other mountainous Himalayan rivers in the northeast region. Later the focus of the project shifted to generation of hydro-electricity and, in 2000, it was handed over to the National Hydroelectric Power Corporation. It now appears that projects initiated in the region have ignored downstream impacts and try to concentrate on power generation. As indicated earlier, people have now started blaming the rising intensity of flash floods in the state on the upstream activities of the neighbouring hills. People’s protests led to the formation of an Experts Committee by the Government of Assam in 2006 to look at the issues associated with the construction of the river dam on Subansiri.
In addition to the Lower Subansiri Project, flash floods caused by the Ranganadi Hydel Power Project since 2008 in the neighbouring valley of the Subansiri river (both in the Lakhimpur district) have become a cause of people’s discontent on the state’s approaches on large river dams for power generation and water resource management. The catastrophes created by flood waters (or water released) have led people to believe that large dams are

158
Assam HDR: Managing Diversities, Achieving Human Development
anti-people. Similar cases of flash floods are also reported from the excess water released from Kurisho Hydro Power Project in Bhutan and its downstream impacts in the districts of Bongaigaon and Barpeta. There is a feeling that transparency in approaches in the context of construction of the river dams could have made the situation avoidable50.
The Expert Committee in its recommendations in 2010 suggested a thorough review and redesign of the 115-metre high dam for 2,000 megawatt (MW) of power generation on the Subansiri River. The report of the committee expressed reservations over the dam, saying it could adversely impact downstream areas. The report says that the spillway for releasing floodwaters has been designed incorrectly for a maximum discharge of 12,024 cubic metre per second (cumec), whereas the maximum discharge recorded on 11 July 1971 was more than 21,230 cumec. The recommendations also state that, if the present design parameters are followed, the dam will impact biodiversity and lead to siltation51. To minimise dam-induced flash floods, the report has recommended flood cushioning in the reservoir (Reduce Subansiri dam height: panel; Down to Earth, 31 July 2010).
It now appears that the state or the concerned authorities need to convince people on the technicalities and structural front that the dams have adequate flood cushioning to store extra water. This, however, has not been happening in the context of the state. The Expert Committee report and conviction of one section of people on the probable damages have led to an intensification of anti-dam protests.
The protest against dams was so intense that its construction had to be stopped in December
2011. As of November 2011, the dam had reached an elevation of 138 metre, just below the spillway elevation of 145 metre as it was designed. There is now an indication that the Ministry of Power, government of India, has gone slow on river dams projects on upstream Brahmaputra. It requires detailed and authentic studies on environment impact assessments to make decisions. The Ministry is also aware of the constraints of availability of space for storage of additional water and absorption of the shocks, land acquisition and rehabilitation issues and law and order problems52.
Assam, at present, is experiencing an average peak power demand of 1,100 MW. This is more than twice what it was five years ago. Since no power generation project has been commissioned in recent times, the gap between demand and supply is widening. The total availability of power in the state is around 800 MW of which 540 MW is the allocation from the central sector power generation station and 260 MW is from own generation of the state53. Overall, power is needed to make improve the life of the people in the state. The concern raised, however, is that the gain from such initiatives could be less than what people would lose in the time to come.
7.6 Identifying Risk Zones of Environmental Vulnerability
Development outcomes on certain fronts are visible in the areas of floods, sand and river erosion. As discussed earlier, there is a drop in agricultural income in the flood-affected districts, loss of workdays and schooldays. Moreover, in the flood-affected blocks, just 8
50 Extracts of newspapers on river dam and hydro-electricity powers in Assam(The Assam Tribune, 20 August 2011).51 Das (2012 b) indicates that the flood-affected Dhemaji district produces numerous indigenous varieties of paddy reflecting its rich bio-diversity. In the 15 villages covered in Das (2012 b) study, 13 indigenous varieties of paddy are recorded.52 Power Ministry to go slow on NE projects on upstream Brahamaputra, The Assam Tribune, 20August 2011. 53 For a detailed note on the power supply situation, see the website of APDCL -www.apdcl.gov.in/.

159
Environment and Sustainability Negotiating Externalities, Ensuring Sustainability
percent of the total population has attained education beyond Class X, compared to the state average of 15.3 percent.
Information on SAPov reveals that, in the flood-affected district of Dhemaji, 20 percent households reported a worsening of their economic conditions in the past five years compared to the state average of 8.5 percent. In the three flood-affected districts of Barak valley (Cachar 13.5 percent, Hailakandi 19.3 percent and Karimganj 21.9 percent), a significant proportion of households reported a worsening of economic conditions. Block wise information reveals that, in the flood-affected and border blocks (the three districts of Barak valley share the national as well as international border), a very high proportion (24.4 percent) of people reported a worsening of their economic condition.
The household survey across the state captured responses on certain indications of the environmental crises and the data thus generated help us to construct an index of the vulnerability in the state. The information on the crisis of floods, sand deposition, river erosion, industrial pollutions, air pollution, access to potable water and deforestation presented in Table 7.3 are used to construct an index of environmental vulnerability54, and the rank the most vulnerable districts in the state and their characteristics. The values of the index generated are presented in Table 7.4.
From the analysis, Marigaon has emerged as the most insecure district in the index. This district
is severely affected by floods, erosion, sand deposition in the agriculture fields and has a crisis in accessing quality water. The situation is the same in the second ranked district of Dhemaji. Along with the flood havoc, access to quality water and air pollution has emerged as a crisis in the fourth ranked district of Sibsagar. However, in Nalbari (ranked third), access to quality water and air is the major form of crisis reported by the people. The thinly populated and hilly and forested district of Karbi Anglong is largely free from flood havoc and expected to enjoy good quality of air and water. The survey, however, did not indicate this (see Box 7.4 and 7.5).
The indicators used to construct the index could be influenced by many factors – natural, provisioning made by the state as well as how the state regulates the natural and provisioned public resources, that is, the various process aspects. Moreover, population growth, density of population, urban congestion, proportion of child and elderly population, level of educational attainment, access to health, water and sanitation facilities, average rainfall, proportion of flood hazards area, and forested area in the districts also influence the pattern of vulnerability in the districts55.
The index put certain severely flood-affected districts of the state, namely, Barpeta, Darrang and Dhubri, in a better position. One explanation could be that the people in these lower Assam districts are more resilient to the adversities of floods. Changes in the cropping season and pattern is one part of this explanation (see section 7.6.3).
54 The formula used to derive the HDI by the UNDP prior to 2010 is adopted to calculate the vulnerability index of the state. However, the weights given to the seven indicators are based on how the respondents during the household survey in the respective district perceived and reported on these crisis indicators (Table 7.2). Accordingly, access to quality water got the highest weight (0.4), followed by flood and air pollution (0.2 each) and sand, erosion, industrial pollution and degraded forest got weight of 0.05 each. It is a well-established fact that floods, industrial pollution, forest degradation all act as determinants in deterioration of water quality. 55 Also see ASDMA (undated) State Disaster Management Plan, Assam, p45.

160
Assam HDR: Managing Diversities, Achieving Human Development
Table 7.4: Environmental vulnerability: ranking the districts
Rank Districts Index Rank Districts Index
1 Marigaon 0.638 15 Dhubri 0.3652 Dhemaji 0.555 16 Golaghat 0.3093 Nalbari 0.526 17 Sonitpur 0.3074 Sibsagar 0.512 18 Baksa 0.3045 Karbi Anglong 0.506 19 Tinsukia 0.2916 Nagaon 0.501 20 Karimganj 0.2887 Hailakandi 0.475 21 Udalguri 0.2878 Goalpara 0.433 22 Darrang 0.2469 Cachar 0.412 23 Dibrugarh 0.23610 Lakhimpur 0.410 24 Kamrup M 0.23011 Bongaigaon 0.402 25 Kokrajhar 0.09112 Jorhat 0.399 26 Barpeta 0.06313 Chirang 0.392 27 Dima Hasao 0.04614 Kamrup 0.376
Source: Based on HDR survey (2013).
7.7 Mitigation Measures and their Effectiveness
There are inconclusive debates on how the environmental crisis faced by the state can be at least reduced, if not wholly mitigated. As is evident from earlier discussions, intense pressure of the population, vanishing forests and ineffectiveness on the part of the state to enforce regulations contributed to degradation of the overall environment leading to environmental vulnerabilities in districts with varying degrees (Table 7.4).
Forest re-generation is one of the options to mitigate environmental hazards. As indicated by the Department of Environment and Forest, Government of Assam, during the period 2003-04 to 2010-11, the state raised the forest cover in 52,499 ha (525 km2) under the National Afforestation Programme involving a cost of INR 715.9 million. The categories of areas afforested primarily include aided naturally regenerated (31.4 percent), artificially regenerated (39.0
percent), bamboo plantations (15.5 percent) and mixed plantation of minor forest produce (11.1 percent). Studies are required to determine whether the extent of outcomes under the National Afforestation Programme is enough. Moreover, micro studies on the intervention areas would help to assess the benefits derived.
It is now well perceived that unplanned anthropogenic activities in some of the neighbouring hill states also have contributed to the ecological crisis of Assam. To regulate the externalities originated in the separate administrative space, support on regulatory measures from the central government is required. Moreover, it appears that control of pollution and hazardous elements released by vehicular traffic and industries is still not effective, despite the presence of provisioning through different acts and regulations.
Coming to specific interventions to mitigate the hazards of floods and erosion, the state’s measures could take the following forms.

161
Environment and Sustainability Negotiating Externalities, Ensuring Sustainability
7.7.1 Structural Measures - embankments, Dykes and Channelling
At present, the state has 449 embankments covering a stretch about 4,459 km. The Water Resource Department has already identified 3,340 km of embankments as vulnerable. After the massive flood in June and July 2012, the state government had placed a demand of INR 3,460 crores to the central government to raise and strengthen embankments across the state. This reveals the priority of the government on structural measures to manage the havoc of the floods. Exploration of information in the
flood-affected districts of the state would reveal that, till date, the district administrations have spent millions of rupees annually in relief operations and mitigation plans. Mitigation plans mostly revolve around construction of embankments, which are often breached by the fury of floods56. In recent years, the rising magnitude of floods and the subsequent damage raise the question as to what extent embankments help to prevent and minimise flood damage. The embankment approach, however, has been intensely debated for several decades in the country57, for its ineffectiveness and involvement of huge costs in construction and maintenance.
56 For examples, in the severely flood-affected district of Dhemaji in the state, till date, 40 embankments and dykes have been constructed and another six are sanctioned, all involved a whopping cost of INR 1,016.38 million (information acquired from the district administration in August 2009 by submitting an application under the Right to Information Act, 2005). 57 Ray (1954).58 A pilot project of utilisation of geo-tubes as submerged dykes was undertaken in 2006 to protect shoreline erosion at many vulnerable sites along the Malaysian coast.
Box 7.7 New experiments with protection structures: Geo tube embankments in Matmara, Lakhimpur district
In recent years, international financial institutions have started recommending embankments as a way of solving problems caused by floods. The positive experiences58 from Malaysia influenced the Asian Development Bank to suggest geo-tube embankments in severely flood-affected areas of Matmora. Altogether 146 geo-tubes were laid at Matmara in 2008 to strengthen a 5-km-stretch of the existing weakened dyke. However, in 2009, a completed 3.5 km stretch was swept away by the surging waters. The state, however, took the initiative to re-construct the embankment.
The rational for using geo-tubes to support embankments is that the soil available for earthen embankments on the northern bank Brahmaputra is basically sandy which lacks the required cohesion and stability, so cannot sustain flood water pressure. Contrary to this, the use of geo-tubes (soil in geo-tubes is made up of geo-textile materials with a fill height of 2.5 metres) provides sufficient strength and stability. The construction of the embankment has been completed at a cost of INR1,100 million (Economic Survey, Assam, 2010-11).
The people of Matmora, who had faced massive destruction from floods and sand deposition, now express some kind of relief because of the geo-tube embankment. Yet anxiety persists as the channels of the Brahmaputra have now come closer to the embankment and pose a threat. The river brings an enormous quantity of sand and silt; heavy siltation is one of the causes that prevents free flow of water, ultimately putting pressure on the river to carry water and strike the embankments.
Source: Filed Experience and Focus Group Discussion

162
Assam HDR: Managing Diversities, Achieving Human Development
Contrary to such opinions on the ineffectiveness of embankments, on the political front, arguments and opinions, however, were different even in the 1950s. The chief minister of Assam too had remarked in September, 1954,“ We hope to take up immediately a scheme for running embankments along the Brahmaputra, from a point near the foothills to the point where it reaches the border of the state”59. The outcome of such perceptions is now obvious with the construction of embankments along most of the rivers in the state, changing the structure of the landscape60. Evidence and interactions with flood-affected people too reflect peoples’ preference and confidence in embankment as a protective structure.
7.7.2 Non-structural Measures (People’s Knowledge System- Living with Floods - Coping and Adaptation
Providing absolute protection to all flood-prone areas against all magnitudes of floods is neither practically possible nor economically viable61. The goal of the non-structural approach of flood disaster mitigation is to organise and enhance the existing coping mechanism and capacities of the local communities and minimise the losses to livelihood provisioning. Such an approach is inexpensive; costs involve largely dissemination of information on probable hazards, technology disseminations to cope and adapt with the situations, and on administration of the measures.
The Assam State Disaster Management Authority (ASDMA) is implementing the flood early warning scheme since 2009. The issue is to what extent the system of early warning helps in raising the efficacy of the state to manage the disaster and govern flood-affected spaces
better with timely and concentrated effort? The data on loss of human lives indicate that there is reduction of flood-related deaths in Assam in recent times. A study by OKDISCD (2014) also finds an indication on this. However, people show their discontent on the approaches of the state administration on rescue operations and distribution of relief and mitigation measures. It is often reported that relief material never reaches on time when it is most needed. However, it seems that people are not prepared on their own (or incapable) to face the seasonal havoc, unless it is sudden62. We, however, see massive campaigns from ASDMA and the district administration to prepare people to face the fury of floods by taking/adopting certain precautionary measures.
7.7.3 Planning for Water Resources, Land Use and Cropping Pattern in Risk Zones
Most of the lower Assam districts adopted cultivation of summer paddy to compensate for the constraints and economic returns set by the floods. The proportion of area under summer paddy to total paddy in the state was 21.4 percent during 2012-13, an increase from 17.1 percent in 2002-03. The intensity of cultivation of summer paddy in the districts of Dhubri, Goalpara, Bongaigaon, Barpeta, Nalbari, Kamrup and Marigaon has increased in the past one decade63. It indicates a form of coping and use of land resources in an effective way. Such an approach is, however, not visible in the flood prone districts of upper Assam, except to an extent in Lakhimpur. The flood-prone districts of lower Assam now also show a surge of cultivation of horticulture crops.
Apart from paddy, adoption of high-value crops would also help to mitigate economic
59 Ibid, p 1123.60 There are examples that many river valleys in the state of Assam are now shielded by huge embankments from the flowing rivers. There are cases that rainwater now gets trapped inside the embankments leading to deterioration in the characteristics and conditions of soil, and returns from agriculture (Box 6.1).61 Government of India (2011), see note 32.62 There are cases of certain unanticipated severe flood havoc in the state. These are sudden release of water by the river dams or reservoirs.63 Information extracted from the Statistical Handbook, Assam 2013 and 2004, Directorate of Economics and Statistics, Guwahati.

163
Environment and Sustainability Negotiating Externalities, Ensuring Sustainability
crisis in the flood-affected districts of the state. Area-specific cropping plans including identification of suitable crops and varieties, supply of seeds and inputs, soil and water management practices would help. The efforts of farmers, however, need to be supported by road connectivity to markets and provisioning of water sources during the off-monsoon period. The lower Assam districts largely depend on groundwater for Rabi crops. Most energy efficient motors, engines and pumps should help to economise conventional energy consumption in such endeavours.
7.8 Summing Up
The phenomenon of floods appears to be unavoidable in the state. However, farmers also welcome the floods as a traditional mechanism to upgrade their soil allowing silt deposition64. It appears that river bank erosion and sand deposition, and not the floods create more stress on the people. To mitigate the externalities of erosion, sand deposition and high run-off of water, certain parts of the state (and the hills of neighbouring states) would call for effective planning on land uses and even reversal of changes of the land use pattern. So long the negative externalities of irreversible damages such as erosion and sand casting continue or return at regular intervals, the initiatives of the people to adapt to the adversities get weakened. Mapping of the hazardous and risks-prone zones at micro administrative units (blocks) would help in order to initiate preventive measures. Overall, one would agree that afforestation in identified vulnerable zones would help to minimise negative impacts.
The state also needs to have long-term plans while planning for natural resource based as well as other economic activities, to ensure
sustainability. Discontinuation or closure of economic units, whatever may be the reasons including of ineffective regulatory provisions related to environmental standards or exhaustion of resources, creates shocks among the involved people leading to serious impacts on their households65. Like the effects of devastating floods, such developments also erode the capabilities of the people. The need for a similar type of planning also applies in the context of access and use of NTFP, as the well-being of many households living in fringe villages of forests depends on how effective are the plans to ensure distributive justice and sustainability.
It has also emerged that poor environmental knowledge of the people places stress on the environment and development of the state. Segregation of waste at the household level into bio-degradable, non-degradable and toxic elements not only reduces the burden of the municipal authorities (quantum of manpower used to segregate the waste, finding of space for disposal or for re-cycling, etc.) in solid waste disposal, but also helps to keep the surroundings clean, with positive outcomes on health. The support or effort could come from the people, after an awareness drive. Otherwise, there emerges the need for imposition of stringent regulations.
Along with ensuring the effectiveness of regulatory measures, the state also needs to strengthen the provisioning of basic services on education and public health, and ensure that the regular livelihood activities and even schooldays of the children do not get affected amidst the crisis. Livelihood sustainability and a clean environment, so that there are no negative health outcomes, would ensure, sustain and raise the capability of the people in a space.
64 For more on this, see section Mud Values in D’Souza, (2006) Drowned and Dammed: Colonial Capitalism and Flood Control in Eastern India, Oxford. 65 The issue is that can a person engaged in a saw mill or cement factory or brick kiln be assured that her livelihood is secured for the next 30 years or such activities would sustain to the next generation?

164
Assam HDR: Managing Diversities, Achieving Human Development
Subjective Well-being Processes are Critical to Outcome8

165
Subjective Well-being Processes are Critical to Outcome
8.1 Introduction: Why Subjective Well-being Matters
The foregoing chapters indicate that, for a holistic evaluation of ‘development’, it is also necessary to measure its subjective outcomes through the experiences of people and their communities. This can be carried out by measuring people’s ‘capability’, which essentially aims at minimising critical deprivations of human life. The objective outcomes of development such as reducing income poverty, illiteracy, mortality and morbidity would still occupy the central theme in a development agenda but these should be considered to constitute the basic elements of the capability of individuals that expand their opportunities to choose a life they value. Thus, expanding the ‘freedom’ of the people to make diverse choices becomes the ultimate outcome or the ‘ends’ of development efforts.
The notion of ‘freedom’ embodied in capability has two connotations:(i) freedom from within, that is, individuals are to be freed from internal limitations due to basic deprivations in terms of ill health, ignorance and poverty to exercise choices over given opportunities; and (ii) freedom from limitations imposed by external conditions in exercising their choices. The first, that is, the ‘opportunity aspect’ of freedom relates to the level of achievement, while the second relates to the ‘process aspect’ of freedom, that is, how the realised level of well-being is actually achieved. A normative framework of evaluation must examine, not only the achievements, but it should also carefully assess the processes by which the achievements have been realised. In the capability approach, the first type of achievement – achievement without taking
note of the processes involved is usually called ‘culmination outcome’. The other type – achievements considered along with processes involved is formally called ‘comprehensive outcome’.1 The relation between these two aspects of freedom is of fundamental significance in a capability approach.
In this report, the idea of subjective well-being is wholly concerned with the valuation of processes. It is subjective because it takes note of qualitative aspects of various processes involved including governance and service delivery. The valuations of various processes – social, political, ecological and personal – have been attempted by considering people’s level of satisfaction over them, where ‘satisfaction’ is taken to be reflective of the implicit preferences of people over the existing processes. If a person is unsatisfied with any aspect of the processes, it simply implies that the process under consideration is surely not of the kind that he or she would prefer and would, therefore, value. This is the general perspective about ‘satisfaction’ with which the present chapter attempts to analyse subjective well-being of the people of Assam.
In the light of the foregoing discussion, the present chapter attempts a clear value addition by emphasising ‘comprehensive outcomes’. This emphasis on ‘comprehensive outcome’ enlarges the scope of analysis and also widens the perspective of the progress of development. For instance, while an increase in income is a definite achievement in the culmination sense, it can make a household worse off by reducing the time spent with family and friends. To ‘enjoy a social life’ is, of course, an important functioning of human life. Similarly, more work time can fetch more income but may well accompany
1 See Sen (2002), particularly chapter 4 and chapter 21 on these aspects.

166
Assam HDR: Managing Diversities, Achieving Human Development
more distress, and probably less nutrition, particularly among children, when their parent’s inability to spare time for them creates pressure points concerning nutrition and other essential forms of human nourishment. In this sense, by including the aspects of subjective well-being, the report extends its scope to the evaluation of ‘comprehensive outcomes’ instead of limiting itself to the usual evaluation of ‘culmination outcomes’.
8.2 The Well-being Framework
Assam’s well-being framework2 combines eight domains related to various process aspects of personal, social, political, cultural and ecological lives of individuals. These domains are normatively selected and considered intrinsically important for both individuals and society as a whole. Each domain consists of a set of indicators, disaggregated into specific sets of variables or questions. The framework on the whole comprises eight domains and 94 variables based on personal, collective and relational questions (Table 8.1). Note that not all the 94 variables are shown in the table. This mix recognises that well-being consists of multiple, inter-connected and complementary factors, and that they work in two ways – row as well as column wise – as in the case of multidimensional poverty models.3
The domains and their indicators are assigned equal weights, because each is normatively considered to be equal in importance for subjective well-being. Note that this allowance is necessary to account for diversities which the report intends to highlight. Moreover, only qualitative aspects have been focused on
in each of the domains, which are generally applicable to all individuals so as to capture subjective valuation of individuals.
8.3 Subjective Well-being Sufficiency: Identification and Aggregation
To identify those enjoying subjective well-being one has to rely on appropriate sufficiency cut-offs. The sufficiency cut-off or thresholds of subjective well-being used in the Assam well-being framework are based on the Alkire-Foster methodology4. This involves cut-offs at two levels – known as ‘dual cut-offs’. The first level cut-off is applied to define ‘sufficiency’ for each individual variable representing the indicators of a domain shown in Table 8.1. Then an aggregative sufficiency cut-off is applied at the level of each domain, that is, cut-offs are applied both row wise and column wise. The second level cut-off is applied at the domain level, where sufficiency is defined as satisfaction in at least two-thirds of the variables for each domain.
Finally, at the aggregate level comprising all the eight domains, we look at the number of domains in which a person is satisfied. Depending on the number of domains (from 0 to 8) in which a person is satisfied, a Likert-type scale is devised denoting the specific levels of subjective well-being of individuals. Here, ‘sufficiency’ is not seen in absolute terms, rather it is viewed in terms of particular intensities of ‘satisfaction’ or ‘dissatisfaction’ across all domains.
As sufficiency is seen as relative in the present framework, instead of having only dichotomous
2 The Assam well-being system draws on the Gross National Happiness system pioneered by Bhutan. There are differences but these are less significant than the similarities. 3 See Alkire and Foster (2009).4 See Alkire and Foster (2009).

167
Subjective Well-being Processes are Critical to Outcome
categories of ‘satisfied’ and ‘dissatisfied’, the specific levels of subjective well-being of individuals are classified as follows:
(i) Intensively dissatisfied, if a person remains dissatisfied in all domains;
(ii) Moderately dissatisfied, if a person is satisfied only up to any three domains;
(iii) Neither satisfied nor dissatisfied, if a person is satisfied in any four domains;
(iv) Moderately satisfied, if a person is satisfied in any five to seven domains;and
(v) Intensively satisfied, if a person is satisfied in all eight domains.
This also enables us in obtaining the intensity, that is, the average number of domains in which people experience ‘satisfaction’ or ‘dissatisfaction’.
It is, therefore, evident that the Assam well-being framework marks a significant departure from the standard Alkire-Foster method. While the Alkire-Foster method provide an ‘index’ of
Table 8.1: Domains and indicators/variables of the Assam well-being framework
Domain Indicator/Variable
Psychological and Emotional Well-being
Sense of satisfaction, meaning in life, social support, stress, non-material responsiveness, emotional experience, suicidal thought and attempt
Physical Health Disability and activity limitations, healthy days and short-term activity limitation, clinic or hospital services satisfaction, barriers to satisfaction.
Education Historical literacy, cultural literacy, civic literacy, ecological literacy, historical literacy, food and nutrition literacy, health literacy, indigenous knowledge, formal education.
Cultural Diversity and Resilience
Languages, core values, participation in community events, engagement with local customs and traditions, value changes
Community Vitality
Length of residence, volunteering, donations, sense of belonging, sense of trust, community vitality, family relationships, crime and safety.
Governance Political participation, perceptions of: performances of government at national and local level, leadership performance, government institutions, electoral process, judicial independence, fairness, speediness and affordability, respect for fundamental human rights, perception of police, media freedom/independence, access and quality, trust in institutions and leaders, accountability, perception of corruption.
Ecological Diversity and Resilience
Transportation, climate change awareness, consumption of wild foods and firewood, quality of agricultural land and other inputs, agricultural constraints, agricultural predators.
Living Standards
Absolute income, debt, perception of relative income status, anticipation of financial security, food security, housing, in-kind income, assets ownership, household expenditure.

168
Assam HDR: Managing Diversities, Achieving Human Development
sufficiency or deprivation defined as a product of head count ratio and intensity, the Assam well-being framework gives a range of head counts and related intensities.5 In the present framework, however, the status of subjective well-being at various levels of aggregation has been evaluated by the ‘average number of domains’ where people are found to be ‘satisfied’.6
The Assam well-being framework allows decomposability. This means that the methodology permits mathematically breaking down the summary index according to specific characteristics of the population to offer valuable insights to policy makers. The results can be decomposed to various levels –district, rural-urban, sex, age-group, educational attainment, spatial diversity, and so on. Further, it is also possible to examine the domain-wise contribution to subjective well-being and its internal drivers for understanding the specific aspects of the process.
8.4 Key Results of Subjective Well-being Analysis
It is found that 56.4 percent of the people of Assam are enjoying subjective well-being – they are either ‘moderately satisfied’ or ‘intensively satisfied’. This simply means that about half of the population in Assam finds most7 of the process aspects ‘satisfactory’, that is, on average, they find the processes as they would prefer them to be. It is also seen that 24.6 percent of the people are not yet enjoying subjective well-being defined in this sense. The remaining 19 percent of the people are ‘neither satisfied nor dissatisfied’ (Figure 8.1). This last category stems from the Likert-type scale used in the framework. As mentioned, the scale has values ranging from ‘intensively dissatisfied’ to ‘intensively satisfied’, with a midpoint category of ‘neither satisfied nor dissatisfied’. Likert-type scales acknowledge the fact the people’s
5 It is, thus, possible to obtain five indices of Alkire-Foster type, instead of one in the Assam well-being framework.6 The detailed method is provided in Technical Appendix 3.7 At least five out of eight domains.
Figure 8.1: People enjoying subjective well-being in Assam (in %)
Source: HDR Survey, 2013.
Intensively dissatisfied Moderately dissatisfied
Neither satisfied nor dissatisfied Moderately satisfied
Intensively satisfied
53.1
19.0
24.3
0.33.3

169
Subjective Well-being Processes are Critical to Outcome
attitudes are characteristically ambivalent. It is, therefore, essential to accommodate a scenario where a person is less than certain in some aspect of life. So, while the people who are satisfied in any four out of eight domains may be considered as not being satisfied in general, by the same logic they are not explicitly dissatisfied either.
The head count ratio of ‘satisfied’, comprising the ‘moderately satisfied’ and ‘intensively satisfied’, in rural areas is found to be less (54.9 percent) than that in the urban areas (64.7 percent). The percentage in the indecisive category (‘neither satisfied nor dissatisfied’) is found to be almost the same in both rural and urban areas (19.4 percent and 17.1 percent, respectively).
The gender difference in the level of overall satisfaction ( ‘moderately satisfied’ or ‘intensively satisfied’) is not that pronounced, with 57.4 percent of males and 54.6 percent females found to enjoy subjective well-being.
In terms of social categories, only the STs are found to have a lower head count ratio of satisfied people (50.4 percent). All other categories SC, OBCs and general castes have head count ratios that are very similar to the state average. In terms of religion, the head count of satisfied people is found to be lower among Muslims (52 percent) compared to that among Hindus (59 percent). Across the spatial diversity categories, the head count ratios of satisfied people are found to be rather low in the hills (26.3 percent) and flood-affected areas (39.9 percent).
At the district level, the highest head count of satisfied people is found in Jorhat (82.4 percent), followed by Goalpara (78.4 percent), Dibrugarh (71.5 percent), Kamrup (71.1 percent) and Kamrup Metro (70.0 percent). The lowest head count, on the other hand, is found in Marigaon (18.1 percent). The other three districts with lower head counts are Karbi Anglong (24.3 percent), Cachar (35.8 percent) and Sonitpur (38.3 percent) (Figure 8.3).
Figure 8.2: People enjoying subjective well-being by diverse categories (%)
Source: HDR Survey, 2013.
Rura
l
Urb
an
Mal
e
Fem
ale SC ST
OBC
Gen
eral
Hin
du
Mus
lim
Chris
tian
Budd
hist
Sikh
Oth
ers
Char
Floo
d A
ffect
ed
Hill
s
Tea
Gar
den
Bord
er
Mul
tiple
Div
ersi
ties
Gen
eral
70.0 –
60.0 –
50.0 –
40.0–
30.0 –
20.0 –
10.0 –
0.0 –
Sector Sex Social Category Religion Spatial Category

170
Assam HDR: Managing Diversities, Achieving Human Development
From the domain level analysis, it is observed that the key drivers of subjective well-being in Assam are ecological stewardship and cultural vitality and diversity. It could be found that, on the whole, about 86 percent of people are ‘satisfied’ in these domains. Ecological stewardship has special significance in the era of climate change. The ecology domain turning out to be a key driving force of well-being in the state suggests that people are mostly ‘satisfied’ with the environmental quality in general, and remain unaffected by adverse environmental consequences including unusual weather8. Besides, people have also shown a very high degree of concern for environmental protection and importance9. Due to the combination of all these positive aspects, the level of satisfaction in the ecology domain, in aggregate terms, has tended to be on the higher side.
The domain ‘cultural vitality and diversity’, on the other hand, points to the rich and diversified
cultural heritage and legacy that people enjoy in the state. The value of and participation in cultural life have been considered important in people’s lives. People perceive language and cultural identity as important aspects of life and continuation of these is equally significant10. Although, due to these positive aspects, the cultural domain, as a whole, exhibits high ‘satisfaction’, people seem to be quite dissatisfied with the way these aspects are being encouraged and nurtured by the government.11 It may, however, be noted that there is a wide variation in the percentage of people ‘satisfied’ in the ecological and cultural domains (Figures 8.5 and 8.6). There are also differences among spatial categories. People in the hills are more satisfied in the ecology domain (92.7 percent) compared to the people in the Char areas (71.8 percent). In the flood-prone blocks, satisfaction in the culture domain is found to be the lowest (77 percent).
8 It is found that about 80 percent of people in the state do not face adverse consequences of floods, erosion and sand deposition, about 53 percent people have access to clean and safe drinking water, about 78 percent people have access to clean air and about 60 percent people reported to have witnessed no unusual weather in the recent past.9 77 percent of people realise the importance of environment in one’s life, about 53 percent express concern for environmental degradation and 72 percent feel responsible for environmental protection.10 87 percent of people feel that religious identity is important, 83 percent consider ethnic identity as important and 82 percent believe the continuation of cultural identity matters. 11 75 percent expressed their dissatisfaction over this issue.
Figure 8.3: People enjoying subjective well-being across districts (in percent)
Jorh
at
Goa
lpar
a
Dib
ruga
rh
Kam
rup
Kam
rup
(M)
Chira
ng
Bong
aiga
on
Nal
bari
Barp
eta
Lakh
impu
r
Gol
agha
t
Sibs
agar
Dhe
maj
i
Dar
rang
Ass
am
Nag
aon
Uda
lgur
i
Dhu
bri
Dim
a H
asao
Tins
ukia
Karim
ganj
Hai
laka
ndi
Baks
a
Kokr
ajha
r
Soni
tpur
Cach
ar
Karb
i Ang
long
Mar
igao
n
– – – – – – – – – – – – – – – – – – – – – – – – – – – – –
90.0 –
80.0 –
70.0 –
60.0 –
50.0 –
40.0 –
30.0 –
20.0 –
10.0 –
0.0 –

171
Subjective Well-being Processes are Critical to Outcome
12 Only 45 percent in Barpeta and 58 percent in Marigaon are reported to have no adverse impact of floods.
Figure 8.4: Drivers of well-being in Assam (% satisfied)
Figure 8.5: District-wise percentages of people satisfied in the domain of ecology
Source: HDR Survey, 2013.
Source: HDR Survey, 2013.
Low satisfaction in the ecology domain in the districts of Marigaon, Barpeta and Udalguri (Figure 8.5) are caused mostly by adverse environmental impacts of floods and erosion12. Besides, reported experiences of unusual weather are also high in the two districts. Further, the concern for environmental degradation is found
to be rather low in the districts. Only 18 percent in Marigaon and 23 percent of people in Barpeta have reportedly expressed concerns about the degrading environment. Notably, environmental concerns have been on the much higher side in the districts of Dibrugarh (89.5 percent), Jorhat (78.5 percent) and Tinsukia (79 percent).
100 –
80 –
60 –
40 –
20 –
0 –Psychological
and emotional
domain
Ecology domain
Cultural domain
Living standard domain
Community vitality domain
Health domain
Education domain
Governance domain
– – – – – – – –
14
86 85
15
32
68
36
64
38
62
44
56
45
55
77
23
Dissatisfied Satisfied
Dib
ruga
rh
Jorh
at
Dim
a H
asao
Tins
ukia
Kokr
ajha
r
Kam
rup
(M)
Chira
ng
Bong
aiga
on
Hai
laka
ndi
Lakh
impu
r
Baks
a
Kam
rup
Karb
i Ang
long
Sibs
agar
Goa
lpar
a
Gol
agha
t
Dhe
maj
i
Karim
ganj
Cach
ar
Nag
aon
Dar
rang
Soni
tpur
Nal
bari
Dhu
bri
Uda
lgur
i
Barp
eta
Mar
igao
n
– – – – – – – – – – – – – – – – – – – – – – – – – – – –
100.00% –
80.00% –
60.00% –
40.00% –
20.00% –
0.00% –

172
Assam HDR: Managing Diversities, Achieving Human Development
On the cultural front, the level of satisfaction is found to range from 71 percent to 98 percent in the districts (Figure 8.6). Although high levels of satisfaction across the districts indicates pervasiveness of the importance of culture in the attainment of subjective well-being, relatively low levels of cultural satisfaction have been observed in Lakhimpur, Sonitpur, Nagaon and Darrang (Figure 8.6). A more detailed analysis reveals that people are mostly dissatisfied (about 75 percent) on account of the government’s effort to preserve and promote cultural aspects, which people consider valuable and important for their well-being. Strikingly, it could also be found that flood-affected areas reportedly have lower satisfaction in the cultural domain (Table 8A.7, Statistical Appendix).
The three major downward pull factors of subjective well-being in the state are found to be governance, education and health (Figure 8.4). The issues related to governance in the state have surfaced quite sharply from the
analysis. The level of satisfaction in the domain of governance has been low across all spatial categories with an abysmally low level of 2.6 percent in the hills (Table 8A.7, Statistical Appendix). Barring the districts of Bongaigaon and Lakhimpur, the maximum percentage of people satisfied in the governance domain is found to be only 35.7 percent. This implies that about two-thirds of the people in the state are dissatisfied with most of the key processes in governance. The percentage is really low in the districts of Goalpara (only 2 percent satisfied), Karbi Anglong (3 percent), Dima Hasao (5.2 percent), Cachar (5.6 percent), and Kokrajhar (only 6 percent). These awfully low levels of satisfaction suggest some serious problems with the critical processes of governance in these districts, in particular, and, perhaps, in the state in general (Figure 8.7).
The satisfaction in the governance domain was measured in terms of confidence in government, provisioning of social goods, social protection programmes, public safety
Figure 8.6: District-wise percentages of people satisfied in the domain of culture
Source: HDR Survey, 2013.
Barp
eta
Hai
laka
ndi
Dim
a H
asao
Bong
aiga
on
Kam
rup
Jorh
at
Mar
igao
n
Chira
ng
Dib
ruga
rh
Uda
lgur
i
Sibs
agar
Kam
rup
M
Kokr
ajha
r
Dhe
maj
i
Cach
ar
Nal
bari
Tins
ukia
Gol
agha
t
Goa
lpar
a
Baks
a
Dhu
bri
Karim
ganj
Karb
i Ang
long
Dar
rang
Nag
aon
Soni
tpur
Lakh
impu
r– – – – – – – – – – – – – – – – – – – – – – – – – – – –
100.00% –
80.00% –
60.00% –
40.00% –
20.00% –
0.00% –

173
Subjective Well-being Processes are Critical to Outcome
and security, observance of basic rights such as freedom of speech and corruption-free good governance. Besides, people’s participation in various institutions and processes of governance, their responsibility towards fulfilment of citizens’ obligations were also considered under the domain of governance. Accordingly, confidence in the government13 in Goalpara is found to be extremely low (only 5.4 percent). Similarly, confidence in the government in Dima Hasao is just 31 percent. It is further seen that people are, indeed, grossly dissatisfied with provisioning of social goods. Except Bongaigaon (49.7 percent), in all other districts the percentage of satisfied people is extremely low (less than 25 percent). In 13 districts, the percentage is less than even 10 percent. In Goalpara, it is as low as 0.16 percent. Thus, it is evident that provisioning of social goods and service delivery is a major area of dissatisfaction expressed by people. As far as spatial diversities are concerned, governance is pervasively low across the categories, with
the lowest in the hills (Table 8A.7, Statistical Appendix).
Satisfaction levels on health and education are found to be about 55 percent. Satisfaction in health is found to be the lowest in Karbi Anglong (29 percent) while that in education is in Marigaon (only 26 percent) (Table 8A.9, Statistical Appendix). Spatial category wise, the levels of satisfaction in health and education are found as the lowest in the hills (Table 8A.7, Statistical Appendix).
The intensity of satisfaction or dissatisfaction in the present framework is measured by the average number of domains where people are found to be satisfied14. It is seen that, on an average, people in Assam are satisfied in 4.7, rounded up to five, domains out of eight. The general intensity is found to be the highest in Jorhat where the people are satisfied in 5.57 or six domains out of eight, and the lowest in Marigaon where the people are satisfied in 3.15
Figure 8.7: District-wise percentages of satisfied people in the governance domain
Source: HDR Survey, 2013.
13 Confidence was measured in three areas: in providing jobs, provisioning basic services and controlling prices.For details, see the methodology given in Technical Appendix 5. 14 For details, see the methodology given in Technical Appendix 5.
Bong
aiga
on
Lakh
impu
r
Karim
ganj
Barp
eta
Jorh
at
Dib
ruga
rh
Gol
agha
t
Nag
aon
Chira
ng
Dhu
bri
Dhe
maj
i
Soni
tpur
Dar
rang
Nal
bari
Kam
rup
Sibs
agar
Kam
rup
M
Uda
lgur
i
Hai
laka
ndi
Tins
ukia
Baks
a
Mar
igao
n
Kokr
ajha
r
Cach
ar
Dim
a H
asao
Karb
i Ang
long
Goa
lpar
a
– – – – – – – – – – – – – – – – – – – – – – – – – – – –
70.00% –
60.00% –
50.00% –
40.00% –
30.00% –
20.00% –
10.00% –
0.00% –

174
Assam HDR: Managing Diversities, Achieving Human Development
or only in three out of eight domains. Further, the group of districts consisting of Kokrajhar, Sonitpur, Cachar, Baksa, and Hailakandi are considered to be neither satisfied nor dissatisfied. As previously noted, this is explained by the fact that we used a Likert-type scale which deliberately factors in the likelihood that a person is less than certain in her/his attitude towards life matters. Similarly, the districts of Marigaon and Karbi Anglong can be categorised as grossly ‘dissatisfied’ requiring serious reviews of the workings of the various processes in the two districts (Figure 8.8).
The average number of domains in which the people are enjoying subjective well-being
across various spatial categories is given in Figure 8.9. It could be seen that the spatial categories carry implications for intensities of satisfaction. All the categories are found to have a lower intensity of satisfaction than the general category, with the hills and the flood-affected areas turning out to be indifferent to satisfied. The other spatial categories seem to be witnessing ‘moderate satisfaction’.
It is interesting to observe that, like the headcounts, the intensities of ‘satisfaction’ (and consequently ‘dissatisfaction’) also exhibit differentials across sex, sector, religion and social categories. Remarkably, however, the intensities follow the same trend as that of the
Figure 8.8: District-wise intensity of subjective well-being(number of average domains)
Source: HDR Survey, 2013.
–––––––––––––––––––––––––––––
JorhatGoalparaKamrupBarpeta
Kamrup MBongaigaon
NalbariGolaghat
DibrugarhLakhimpur
SibsagarChirang
DhemajiDarrang
Dima HasaoAll AssamUdalguriNagaonDhubri
TinsukiaKarimganjHailakandi
BaksaCachar
SonitpurKokrajhar
Karbi AnglongMarigaon
5.575.46
5.365.34
5.215.185.175.13
5.05
4.985.03
4.964.91
4.764.734.714.694.694.68
4.554.50
4.434.23
4.013.973.97
3.413.15
1.000.00 2.00 3.00 4.00 5.00 6.00
– – – – – – –

175
Subjective Well-being Processes are Critical to Outcome
Box 8.1 Examples of Indicators and Questions in the Well-being Survey
Indicator: Perceptions of education: Questions: How satisfied are you with the education system as a whole? How satisfied are you with the quality of education your child is receiving? How satisfied are you with the quality of education that you received? How satisfied are you with the opportunities for education that you needed?
Indicator: Health finance and insurance: Questions: Have you found that you are eligible and, if so, are they affordable? Are you satisfied with the overall healthcare services you are receiving?
Indicator: Anti-corruption: Questions: What are your perceptions of the involvement of government officials and political workers in corruption? Are you eligible for and/or aware of public social protection programmes?
Indicator: Social protection and public programs: Questions: Are you eligible for and/or aware of public social protection programmes? Are you satisfied with the overall healthcare services you are receiving? How confident are you/trustworthy do you find the courts – to deliver justice and in time? How confident are you/trustworthy do you consider public servants/officials to listen properly and address your problems/queries well?
Indicator: Free from discrimination: Questions: [related to the public distribution systems]: Do you feel you have equal access to social programmes? Do you feel discriminated against on the grounds of caste, tribe, sex, religion, language, etc.?
Indicator: Knowledge/information: Questions: How confident are you/trustworthy do you consider the media/newspapers – to provide unbiased information?
Indicator: Absolute wealth satisfaction: Questions: How well does your total income meet your everyday needs for food, shelter, and clothing? In the past 12 months, did any of the following happen to you [related to financial distress]?
Indicator: Calling on others: Questions: If you/any household member is in need of money, in general who would you first approach? If you/any household member is in need of advice/suggestions on any matter of importance, who would you first approach? If you/any household member experience any emergency, either due to any threat or sudden contingency, who would you first approach? Do you have anyone for support if you were to experience illness?
general headcounts (Figure 8.10). This clearly has two-way policy implications – increasing subjective well-being of people requires general improvements in all domains and all sections of the society.
Two other remarkable trends could be observed from the analysis. The first one suggests that there is a district gradient involved with the level of educational achievement (objective ‘achievement’ in capability measured by MYS)

176
Assam HDR: Managing Diversities, Achieving Human Development
Figure 8.9: Average number of domains in which the people are satisfied according to spatial categories
Figure 8.10: Gaps in intensity of satisfaction along with headcounts
Source: HDR Survey, 2013.
General
5.12
Char Tea Garden Border Multiple Diversities
Flood Affected
Hills
3.53
4.02
4.594.704.724.75
6.00 –
5.00 –
4.00 –
3.00 –
2.00 –
1.00 –
0.00 –
Mal
e
Fem
ale
Rura
l
Urb
an
Hin
du
Mus
lim
Chris
tian
Budd
hist
Sikh
Oth
ers
SC ST
OBC
Gen
eral
Ass
am
80.0 –
70.0 –
60.0 –
50.0 –
40.0–
30.0 –
20.0 –
10.0 –
0.0 –
– 6.00
– 5.00
– 4.00
– 3.00
– 2.00
– 1.00
– 0.00
Sex Sector Religion Spatial Category
Headcount Intensity

177
Subjective Well-being Processes are Critical to Outcome
Figure 8.11: Subjective well-being gradients with educational attainment
Source: HDR Survey, 2013.
in relation to both headcount and intensity of subjective well-being. This only reiterates the complementarities between opportunity and process aspects of freedom, that is, well valued processes result in better realised achievements (Figure 8.11).
The second trend relates to the age-specific gradient of subjective well-being. It is observed that the subjective well-being gradient reflects a ‘convex’ shape implying the highest hopes and confidence in the early middle periods of life, declining gradually with age thereafter(Figure 8.12).
Figure 8.12: Age gradient of subjective well-being
Source: HDR Survey, 2013.
Illiterate
90.0 –
80.0 –
70.0 –
60.0 –
50.0 –
40.0–
30.0 –
20.0 –
10.0 –
0.0 –
– 6.00
– 5.00
– 4.00
– 3.00
– 2.00
– 1.00
– 0.00Literate with
no formal schooling
Below Primary
Primary Middle School
Secondary Higher Secondary and Above
Headcount Intensity
30 and less
4.73
31 to 44 45 to 59 60 and above
4.52
4.64
4.794.85 –
4.80 –
4.75 –
4.70 –
4.65 –
4.60 –
4.55 –
4.50 –
4.45 –
4.40 –
4.35 –

178
Assam HDR: Managing Diversities, Achieving Human Development
8.5 Using Subjective Well-being Analysis
The essential utility of the subjective well-being analysis presented here lies in its treatment of ‘comprehensive outcome’ which entails a scrutiny of capability achievements along with an understanding of the processes involved in realising the achievements. The conventional capability approach acknowledges the instrumental significance of the processes, but takes them as given. The present report, while admitting the importance of the role of processes in producing differential outcomes, also tries to explore the complementarities between the two. The key message of the report, evidently, is to set the processes right in accordance with what people would like them to be so that opportunities offered by an expansion of capabilities become accessible to and productive for people15. The report highlights the fact that process aspects of individual freedom greatly vary even within a state, implying advantages in capability and achievements. Differential human development outcomes – in terms of their culmination –are, thus, contingent on differential processes involved in achieving them. Therefore, human development outcomes viewed in a comprehensive perspective carry much greater policy significance, a point the present report tries to emphasise.
The fundamental significance of the present ‘comprehensive’ approach relates to its recognition that an evaluation of any social arrangement is naturally multi-dimensional in character. As such, there are ‘multiple reasons’ for an outcome to emerge rather than a ‘single big underlying cause’. This requires a comprehensive information base to
examine the multiplicity of reasons and their social, economic and political contexts. The present report attempts to offer such detailed information to allow one to evaluate human development advantages and achievements in a comprehensive perspective.
The underlying idea of this kind of comprehensive understanding is that it goes well beyond the exercise of simple ranking by focusing on lower level data to look at a multitude of intervening factors through a ‘cluster-type’ analysis. For example, the Assam well-being framework allows us to combine the processes by which opportunities are made available, for example, access to health finance and insurance, with the subjective outcomes, for example, of discovering ineligibility or non-affordability. It then enables the explanation to go even further by combining these findings with the outcomes that are collected at a level that policy-makers could trust, for example, self-reported number of days that a person had been sick or incapacitated. Therefore, not only would we know that a person’s ineligibility or non-affordability was preventing his or her access to health finance and insurance, but also that ineligibility or non-affordability was associated with an identified number of days that the person had been sick or incapacitated. An example will clarify this point.
The Assam well-being framework enables a deeper inquiry into each domain. For instance, it produces answers to questions like whether males or females enjoy more well-being in health. The HDR survey findings show that men reported slightly higher satisfaction (57 percent) in health compared to women (54 percent). Similarly, on the question of whether women or men reported long-term physical
15 see Sabina Alkire (2005). ‘Measuring the freedom aspects of capabilities’ available as pdf file at https://www.aeaweb.org/assa/2005/0107_1430_0104.pdf (accessed on3 August 2014).

179
Subjective Well-being Processes are Critical to Outcome
or mental illness, the findings reveal that 6.9 percent of men and 7.6 percent of women reported long-term physical or mental illness. With further regards to health as a case of in-depth inquiry using the well-being data, the following example draws on multiple (five) cross-checking survey questions. When reduced to a common point of this inquiry, the five questions ask respondents to self-report on how satisfied they are on certain health aspects of their life. The responses are shown below.
Question 1: How satisfied are you with health aspects of your life?
Satisfaction Percentage response
Satisfied 58.9Somewhat satisfied 34.0Not satisfied 6.5Extremely dissatisfied 0.6Total 100.0
Question 2: In general, would you say your health is (excellent, Good, Poor).
Health status Percentage response
Excellent 5.7Good 83.9Poor 10.4Total 100.0Total 100.0
Question 3: Do you have any household member suffering from any type of long-term physical or mental disability?
Sex Whether any member has long term physical/mental
illnessYes (%) No (%) Total (%)
Male 6.9 93.1 100
Female 7.6 92.4 100Total 7.1 92.9 100Total 100.0
Question 4: Do you think that your present physical health prevents you from doing things you feel like doing?
Physical health prevents from doing things
Percentage response
Not at all 38.9A little 28.5Moderately 24.4Very much 5.3To a great extent 0.5Cannot say 2.4
Question 5: Do you have any member suffering from any type of long-term physical or mental disability?
Place of residence
Whether any member has long term physical/mental
illnessYes (%) No (%)
Rural 7.0 93.0Urban 7.7 92.3
We can estimate with a level of certainty that at least 90 percent of the people of Assam are satisfied with their present health status (based on responses to questions 2, 3, 4 and 5). This is a reassuring result. On the other hand, it is disconcerting to note from the responses to the self-reported health question that only 38.9 percent of the people think that their present physical health does not prevent them from doing things they feel like doing (question 4). In other words, 61.1 percent of respondents feel that their physical health prevents them from doings things that they feel like doing. This response factor, when combined with the inference (from questions 2, 3, 4 and 5) that 10 percent of respondents are dissatisfied with their health, makes it essential that

180
Assam HDR: Managing Diversities, Achieving Human Development
policy-makers seek answers in regard to the experiences of those who are not yet enjoying well-being in terms of health. Are they eligible for healthcare services, for example? Can they afford them? Do they suffer discrimination if they attempt to access services? Do corrupt practices hinder their healthcare access?
The following analysis presents just one example of how such inquiries could be carried out by means of the well-being framework. For the purposes of this particular example, the grouping of dissatisfied persons will include (question 1 above), the ‘not satisfied’ and the ‘extremely dissatisfied’ respondents. In addition to these two groupings, we will add the large group of people (34 percent) who self-reported that they were ‘somewhat satisfied’ with the health aspects of their lives (question 1). Although this group does not meet the two-thirds cut-off for well-being, one may be interested from the example that follows to target just the most vulnerable of those who did not satisfy the well-being threshold for the question on self-reported health status. For this reason, the following metrics are focused on the 7.3 percent of people (2,904 respondents) who, in the survey question on self-reported satisfaction with health, responded that they were ‘dissatisfied’.
Where are these people more likely to live, district-wise? The analysis shows that Dima Hasao, Karimganj and Cachar have a significantly high concentration of the 2,904 ‘vulnerable persons’ who comprise the 7.3 percent dissatisfied group health wise (Figure 8.13).
The result of the cross-tabulation of the responses of the 7.3 percent of people (2,904 in number) who reported satisfaction with healthcare service provisioning yields further interesting insights. It is important to delve into the issue of satisfaction with healthcare services for respondents whose self-reported health status show that their physical health condition requires healthcare.
Several policy messages emerge from Table 8.2. With regard to the large percentage of ‘can’t say’ responses in regards to satisfaction with healthcare services;this needs further investigation that goes beyond the scope of this chapter. However, two preliminary explanations could be put forward here: firstly, a significant group of respondents has formal access to in-house healthcare services, that is, their experience lies outside of the meaning of the survey question. This refers to tea garden workers who account for just under 20 percent
Figure 8.13: Distribution of the proportion of the vulnerable people in each district
Source: HDR Survey, 2013.
Dim
a H
asao
Karim
ganj
Cach
ar
Hai
laka
ndi
Dhu
bri
Nal
bari
Dhe
maj
i
Soni
tpur
Uda
lgur
i
Sibs
agar
Jorh
at
Baks
a
Tins
ukia
Kam
rup
Gol
agha
t
Kokr
ajha
r
Bong
aiga
on
Kam
rup
M
Karb
i Ang
long
Nag
aon
Dib
ruga
rh
Dar
rang
Goa
lpar
a
Chira
ng
Mar
igao
n
Barp
eta
Lakh
impu
r– – – – – – – – – – – – – – – – – – – – – – – – – – – –
30.0% –
25.0% –
20.0% –
15.0% –
10.0% –
5.0% –
0.0% –

181
Subjective Well-being Processes are Critical to Outcome
of the population of Assam. Further investigation is needed of the healthcare seeking behaviour of this population group, given research that documents the denial of healthcare services in tea garden environments16.
A second preliminary point of explanation for the ‘can’t say’ responses is based on a 2005 WHO study focused on ‘Reducing out-of-pocket expenditures in the context of Millennium Development Goal 1’17. That study found that people from poorer states, including Assam, have low health seeking behaviour. The various reasons include poor availability of healthcare services (for reasons that include terrain, etc.) as well as non-affordability due to a high share of food expenditure relative to the total consumption expenditure. In short, income poverty – and thus affordability – is likely to be directly related to healthcare seeking behaviour in Assam.
Moving on from ‘can’t say’ responses, a crucial point from Table 8.2 is that the biggest group among those who self-reported dissatisfaction with their own health are also dissatisfied with healthcare services. (This includes those who responded ‘somewhat satisfied’, since that response fails to satisfy the cut-off for satisfaction.) Significantly, this is the group of people in Assam who are most likely to need healthcare. The next level of enquiry raised by this example of analysis would be to investigate
‘why they are dissatisfied’. Is this because of long waiting times, poor service, unaffordable service, discrimination, systemic corruption or other reasons? The well-being framework can again come handy in locating the possible reasons for people’s ‘dissatisfaction’. The well-being framework, thus, facilitates an exploration of various layers of reasoning and valuation of people and, hence, a comprehensive understanding.
In order to claim that this sort of comprehensive understanding, indeed, is facilitated by a well-being analysis, one needs to have a statistically robust framework. To rely on the insights offered by such an analysis, the framework used must merit adequate reliability and validity. It may be mentioned that the reliability analysis conducted over the 94 variables used in the framework indicates a fairly good level of reliability (Cronbach’s Alpha is 0.79). The validity of the framework is evident from the fact that the average domain where people are taken to be satisfied resulting from the framework, that is, 4.71, which represents 5 (moderately satisfied), matches remarkably well with the average of the direct self-rating score of individuals on overall satisfaction, which is found to be 5.33 or 5 (moderately satisfied). This evidence suggests that the subjective well-being framework presented here is sufficiently robust to rely upon for policy decisions.
Table 8.2: Satisfaction with healthcare services of people who self-reported dissatisfaction with their health (N=2,904)
Satisfaction with overall health service(%)
Self-rating on health (%)
Not satisfied extremely dissatisfied
Not at all satisfied 1.8 0.4Somewhat satisfied 12.4 21.3Satisfied 6.7 3.7Highly satisfied 0.5 0Can’t say 78.4 74.6
16 Kakali Hazarika (2012). Tea Tribes are lagging behind in the Process of Urbanization. A Study on Selected Tea Gardens of Jorhat District, Assam.Pdf. available http://www.academia.edu/5274841/Tea_Tribes_Are_Lagging_Behind_In_The_Process_Of_Urbanization_A_Study_On_Selected_Tea_Gardens_Of_Jorhat_District_Assam (accessed on 22 December 2014).17 Charu C. Garg and A. K. Karan (2005). ‘Health and Millennium Development Goal 1: Reducing out-of-pocket expenditures to reduce income poverty - Evidence from India’. EQUITAP Project: Working Paper #15. Pdf. file online http://www.equitap.org/publications/docs/EquitapWP15.pdf (accessed 19 December 2014).

182
Assam HDR: Managing Diversities, Achieving Human Development
Conclusions and Way Forward Need for Differentiated Approach9

183
Conclusions and Way ForwardNeed for Differentiated Approach
Assam, during the last decade or so, has made remarkable progress in terms several key parameters. The decade, inter alia, has witnessed a visible turnaround in the rate of growth in the state’s GDP – the state’s rate of growth being higher than the national level consecutively since 2009-10. The turn around observed in the growth of the state’s domestic product is to be seen in the larger perspective of human development, which essentially requires looking at how this growth has been able to make a qualitative difference in the lives of its people. In this context, the present report assumes utmost significance.
The report offers most valuable insights regarding the various aspects of human development in the state. In presenting these insights, the report adopts two unique approaches largely complementing each another. First, the report underscores the differential human development outcomes across districts like all other state HDRs produced in the country. However, the present report makes a significant departure in accounting for the differential human development outcomes of the districts in terms of various– spatial, demographic and socio-economic – diversities faced by the districts thereby emphasising the fact that addressing the concerns of human development in the state, in general, requires specific and differentiated approaches. Second, the present report considers the human development outcome in the most comprehensive sense – by taking into consideration various processes involved in enhancement of capabilities of individuals.
These two aspects are summarised by two sets of indices. The first set – the standard human development indices depict the average human development scenario in the state. With the value of HDI at 0.557, the present report clearly points out that, in terms of the progress in overall human development,
Assam is at the halfway point in achieving the desired goal. Most importantly, the progress is almost similar, that is, around halfway in all three key dimensions, although the dimension of education has a slight edge over the other two dimensions, that is, health and income. The report further points out that differential human development achievement witnessed in the state across districts and other socio-spatial categories is contingent upon myriad diversities of the state in varying degrees; these diversities, more often than not, overlap one another and thereby reinforce the differences in human development attainments further. The value of HDI is particularly lowered by the income dimension, stressing the importance of securing livelihoods in improving the level of human development in the state. This also offers insights as to the desired process of growth in the state.
It has been observed that, besides income and consumption poverty, the people of the state are also deprived in other dimensions as well and some one-third of the population is multi-dimensionally poor. Moreover, about 16 percent is vulnerable to be multi-dimensionally poor. It has also been underlined that multiple spatial diversities tend to cast a stronger influence over multi-dimensional poverty.
The report further finds that about half of the people are satisfied with the various processes underlying human development achievements. The drivers of satisfaction are culture, ecology and community aspects. On the contrary, the drivers of dissatisfaction have been governance and living standards. It is, therefore, intriguing that, while the state has multiple forms of political autonomy operating at different levels, governance, that is, the processes involved in providing various opportunities continues to be far from being effective. The report emphasises the point that by making a space for democratisation

184
Assam HDR: Managing Diversities, Achieving Human Development
and people’s effective participation the issues related to poor governance can be addressed. The report, therefore, makes a strong case for inclusive institutions ensuring people’s participation in different processes involved. In this overall context, the broad summary and key messages of the report are as follow:
9.1 Gainful Employment is Fundamental
The HDR survey reveals that the overall labour force participation rate in the state is 37 percent, characterised by a huge male-female difference – for males the rate is 59 percent and for females it is just 15 percent. Data further uncover that the overall unemployment rate in the state is 14 percent. The total female unemployment rate is close to 39 percent. Rates of unemployment also tend to be high in tea-garden and flood-affected blocks.
The youth unemployment rate (age of 15-35 years) is even higher than the total unemployment rate in the state which stands at close to 25 percent. The rate is adversely favourable to females at 70 percent.
Given the high unemployment rate in general and adversely favourable rate to females in particular, on one hand, the nature of work of those employed, on the other, reveals that a majority, that is, about 40 percent is engaged in casual work. Given the fact that the wage rate for casual work increasing only marginally, the obvious fallout therefore is low income generated by these types of work.
This is reflected in the poverty scenario in the state. The HDR survey estimates overall consumption poverty in the state at 37 percent. The poverty ratio is particularly high
in rural areas, amongst minorities and STs, and within hills and Char blocks. Besides, the overall poverty impacts living conditions. Close to 70 percent households lack proper sanitation in the state. Further, consumption inequality has emerged most conspicuously in the HDR survey. It emerges that, on the average, the poorest quintile of population has just one-sixth of the consumption enjoyed by the richest quintile.
Improving the quality of life of a vast majority of people, thus, rests on the nature of employment of people. Analyses show that agricultural labourers, casual workers and unemployed persons have five times greater probability of being poor relative to permanent salaried workers. Therefore, ensuring gainful employment is fundamental in improving the quality of life of people.
The creation of gainful employment opportunities in the state, thus, holds the key to improving human development. The report underlines the significance of reducing the overall unemployment rate in general and youth unemployment rate in particular. Besides, it places emphasis on making the labour market more favourable to women. The analysis interestingly indicates that one additional year of formal education reduces the probability of being poor by 12 percent. It is, therefore, important to recognise the criticality of education in breaking the poverty trap. Linking education with gainful employment would call for comprehensive manpower planning. The report thus, emphasises the effective role of the state in employment planning, going beyond output planning driven by mere growth targeting. There is a need to make the growth broad-based for greater inclusion where gainful employment ought to top the priority as a development strategy.

185
Conclusions and Way ForwardNeed for Differentiated Approach
9.2 Going to and Staying in School Indeed Matters
The significance and criticality of education in improving the quality of life of people is undeniable. The Census data clearly show that, during the decade 2001-2011, there has been about 10 percent gain in the overall literacy rate in the state; besides the male-female gap in literacy is also closing from 16.7 percent to 11.5 percent. However, the state still remains at the bottom of the list of states ranked in terms of literacy rates.
The HDR survey reveals that illiterates are disproportionately concentrated in select districts. More than two-thirds of the illiterates in the state are located in 12 districts and almost one-seventh of them belong to Dhubri district alone. Illiteracy is found to be high in the Char blocks and amongst Muslims. An analysis shows that, on the average, the probability of a Muslim being literate is just half of that of non-Muslims in the state, although there is a wide variation across districts.
The HDR survey indicates that 93 percent of children within the 6-14 year age group are enrolled in school. The state, therefore, is yet to achieve 100 percent enrolment of 6-14 year-old children. Interestingly, the enrolment rate declines to about 18 percent for 19-24 year olds. The decline is even sharper for females and, therefore, gender parity becomes adverse as age progresses.
The decline in net enrolment rates secondary level onwards suggests that students go to school but do not remain in school for long. As a result, the educational attainment in the state in general is skewed towards middle level schooling with most people completing only up to Class VIII of formal schooling. It is important, in this context, to recall that the Annual Status of Education Report 2013 shows that learning
quality of students in Class I- VIII in the state has indeed been on a declining trend. The educational attainment of a majority of people in the state, therefore, remains inadequate.
The reasons for leaving school after middle level, however, vary widely. They include, inter alia, the issue of accessibility. Relative to primary schools, the number of secondary schools in the state is evidently wanting. Besides, NSSO data tell us that more than 50 percent of secondary schools are located beyond the distance of 2 km. Given the specific geo-spatial conditions of the state, access becomes difficult especially for girls. The report, therefore, clearly underlines the fact that while going to school is essential, staying in school a little longer is critical for human development. Notwithstanding this, the quality of learning is to be ensured to get the benefit of staying longer in school.
The report further highlights the growing divide in government and private schooling facilities. Most importantly, the report shows that the annual average per capita expenditure on education in private school is about five times higher than that of government schools. The report, therefore, strongly advocates for provisioning of universal and uniform schooling preferably up to secondary level, at least up to elementary level, with an adequate infrastructure and assured quality. This should emerge as one of the main priorities of the state.
9.3 Better Health of Children Holds a Better Future
Despite significant improvements in the IMR, Assam continues to be the state with the highest IMR in the country. The decline in IMR in the state has been steady but at a slower pace than the national average. The NNMR, however,

186
Assam HDR: Managing Diversities, Achieving Human Development
closely shadows the national levels in the state. Therefore, the high IMR needs to be addressed by looking at post-neonatal death risks arising out of external causes, including household and community environment, prevalence of pathogens and common infections and other child care practices affecting survival risks.
The MMR is another area of concern in the state. Although the MMR has fallen considerably, the rate of decline has been slower than the national level. The state’s current MMR is higher than the country’s MMR almost a decade ago. The strategy to reduce MMR emphasises the improvement of rates of institutional delivery. The report, quite interestingly, highlights the fact that, despite high institutional delivery rates, the upper Assam districts are reporting much higher MMR.
Successive round of SRS data reveal that the adult mortality rate in the state has been gradually falling. This contributes to improving the overall life expectancy at birth. Although the state’s life expectancy has improved quite a lot, it is the lowest in the country.
The HDR survey provides a prevalence rate of short-term morbidity of 125 per 1,000 persons. The rate is higher in rural areas and among females. The rate follows a classic J shaped curve with ages. The rate indicates a strong education gradient but a very irregular gradient with respect to income. The rate has been found to be associated with the source of drinking water and sanitation facilities.
The report highlights the ‘double burden’ of diseases – both short-term, that is, infectious and communicable diseases, and chronic, that is, lifestyle diseases – in the state. Short-term morbidity exhibits a higher prevalence in the flood-affected and tea garden blocks.
The report depicts a worsening picture of child nutrition in the state. During the last nine years, the proportion of children with stunting has increased from 46 to 54 percent, that of wasting has increased from 14 to 17 percent and the proportion of underweight children has increased from 36 to 37 percent. Very clearly, the proportion of underweight children in blocks with multiple diversities has been as high as 46 percent. It may be noted that underweight is an indicator of both acute and chronic forms of undernutrition.
The report estimates that, on an average, people in Assam spend about 13 percent of their annual income on healthcare. Almost all healthcare spending is self-financed.
Given these findings, the report favours a fresh look at the strategy to reduce IMR and MMR, provisioning of universal quality public healthcare services and institutional mechanism for risk protection. Against the backdrop of worrisome under-nutritional scenario of the state’s children, the report emphasises the key message – better health of children holds a better future.
9.4 Environment: Negotiating Externalities Ensures Sustainability
The capabilities achieved or possessed by the human being are, to a large extent, determined by the physical environment people live. This is, however, only one part of the scenario. The other part of the explanation is that, even in the short run, the negative externalities created by the degradation of the environment reduce or limit the capabilities already possessed by human beings and subsequently affect the quality of life. In this context, the need for evaluating the environmental arrangements emerges: how

187
Conclusions and Way ForwardNeed for Differentiated Approach
the opportunities are set or constrained in a new environment and subsequently influence the activities of the people and how people try to cop and finally adapt to the changed situation.
The report highlights that there have been significant changes in the land cover in the state over the last 30 years. The decline of area under forest, barren land, uncultivated fallow and fallow land reveals the pressure on the land. There is evidence that wetlands of the state are being squeezed and so are the ecological and economic benefits derived by the people dependent on them. The wetlands of the state are shrinking due to both natural and anthropogenic reasons. In addition to the massive amount of silt carried by the rivers and flood water, construction of dykes and embankments along the river banks also contributed to the deterioration of the water bodies.
The report identifies floods, erosion and sand deposition as the three prime environmental stressors in the state. Some 32 lakh ha of land in the state is prone to recurring floods which accounts for nearly 10 percent of the total flood prone area in the country. The floods account for a huge direct cost in terms of land and crops lost and life and properties destroyed. They also come with huge indirect costs in terms of number of workdays lost and school days missed besides the post-flood burden of diseases.
In recent times, Assam has lost approximately 7.4 percent of its total land area because of river bank erosion and channel migration. Erosion has wiped out more than 2,500 villages affecting nearly 500,000 people.
Besides these obvious stressors, the report also highlights the issue of clean water and air in the state. Drinking water accessibility is a major issue in the flood-affected blocks. The issue of
water quality is fast emerging in Assam with large parts of the state facing contamination of water with fluoride and arsenic apart from excess iron.
Given all these, the report focuses on negotiating with environmental externalities for sustainable human development. It emphasises the fact that, so long as the negative externalities of irreversible damage such as erosion and sand casting continue or return at regular intervals, the initiatives of the people to adapt to the adversities are weakened. Mapping of the hazardous and risk-prone zones at micro administrative units (blocks) would help to initiate preventive measures. Overall, one would agree that afforestation in identified vulnerable zones would help to minimise the negative impacts.
It has also emerged that poor environmental knowledge of the people places stress on the environment and development of the state. The state, therefore, needs to have long-term plans while planning for natural resource based as well as other economic activities, to ensure sustainability.
9.5 Gender: Inequalities Matter more than Differences
Both female life expectancy at birth and child sex ratio – the two critical indicators of gender development – are found adverse towards the women of the state. Despite steady progress, the female life expectancy at birth continues to be the lowest in the country. From the Census data, it has been known that, while the total sex ratio in Assam has improved during 2001-2011, the child sex ratio (0-6 years) in the state has deteriorated. The decline in the child sex ratio has a cascading effect on the population over a period of time which contributes to a gradual
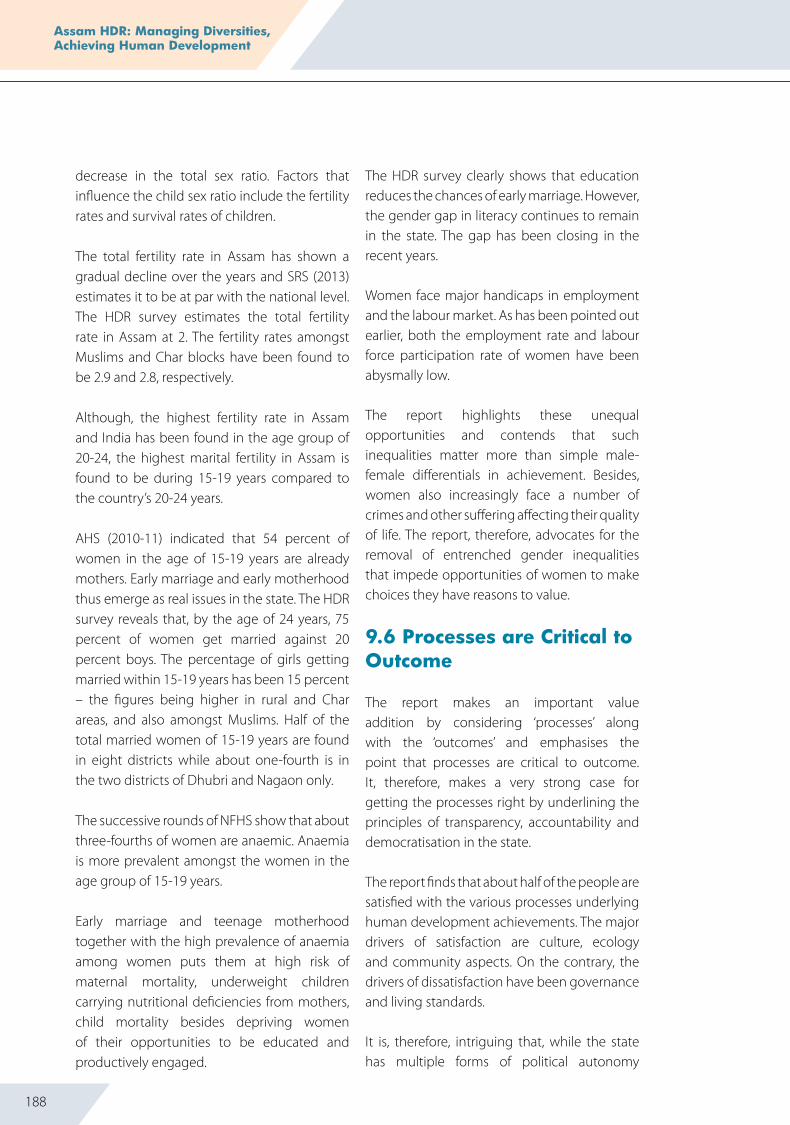
188
Assam HDR: Managing Diversities, Achieving Human Development
decrease in the total sex ratio. Factors that influence the child sex ratio include the fertility rates and survival rates of children.
The total fertility rate in Assam has shown a gradual decline over the years and SRS (2013) estimates it to be at par with the national level. The HDR survey estimates the total fertility rate in Assam at 2. The fertility rates amongst Muslims and Char blocks have been found to be 2.9 and 2.8, respectively.
Although, the highest fertility rate in Assam and India has been found in the age group of 20-24, the highest marital fertility in Assam is found to be during 15-19 years compared to the country’s 20-24 years.
AHS (2010-11) indicated that 54 percent of women in the age of 15-19 years are already mothers. Early marriage and early motherhood thus emerge as real issues in the state. The HDR survey reveals that, by the age of 24 years, 75 percent of women get married against 20 percent boys. The percentage of girls getting married within 15-19 years has been 15 percent – the figures being higher in rural and Char areas, and also amongst Muslims. Half of the total married women of 15-19 years are found in eight districts while about one-fourth is in the two districts of Dhubri and Nagaon only.
The successive rounds of NFHS show that about three-fourths of women are anaemic. Anaemia is more prevalent amongst the women in the age group of 15-19 years.
Early marriage and teenage motherhood together with the high prevalence of anaemia among women puts them at high risk of maternal mortality, underweight children carrying nutritional deficiencies from mothers, child mortality besides depriving women of their opportunities to be educated and productively engaged.
The HDR survey clearly shows that education reduces the chances of early marriage. However, the gender gap in literacy continues to remain in the state. The gap has been closing in the recent years.
Women face major handicaps in employment and the labour market. As has been pointed out earlier, both the employment rate and labour force participation rate of women have been abysmally low.
The report highlights these unequal opportunities and contends that such inequalities matter more than simple male-female differentials in achievement. Besides, women also increasingly face a number of crimes and other suffering affecting their quality of life. The report, therefore, advocates for the removal of entrenched gender inequalities that impede opportunities of women to make choices they have reasons to value.
9.6 Processes are Critical to Outcome
The report makes an important value addition by considering ‘processes’ along with the ‘outcomes’ and emphasises the point that processes are critical to outcome. It, therefore, makes a very strong case for getting the processes right by underlining the principles of transparency, accountability and democratisation in the state.
The report finds that about half of the people are satisfied with the various processes underlying human development achievements. The major drivers of satisfaction are culture, ecology and community aspects. On the contrary, the drivers of dissatisfaction have been governance and living standards.
It is, therefore, intriguing that, while the state has multiple forms of political autonomy

189
Conclusions and Way ForwardNeed for Differentiated Approach
operating at different levels, governance, that is, the processes involved in providing various opportunities, continues to be far from being effective. The report stresses the point that making a space for democratisation and people’s effective participation can result in issues related to poor governance being addressed. The report, therefore, makes a strong case for inclusive institutions ensuring people’s participation in different processes involved.
The overarching broad message of the report is that, given the multi-layered and multi-faceted complexities emanating out of unique diversities of the state, no generic set of policies would be able to bring about overall human development; rather there is a need for a focussed, specific set of policies to deal with the issues discussed in the report.
9.7 Inequality is a Real Concern
The report highlights the critical significance of bridging inequalities across various spaces. It has been shown that inequality in achievements
in crucial dimensions of human development does matter as about one-third of potential human development has been found to be lost due to inequalities in underlying distributions. Further, it can be seen that the loss is the highest in income dimension followed by health and education. A similar inequality prevails along the gender dimension as well where females are found to be disadvantaged as they seem to enjoy about two-third of the opportunities enjoyed by their male counterparts. Unequal opportunities faced by females are eminent in the income dimension negatively affecting the human development achievement of females in general.
Given these findings, the report concludes that, given the multi-layered and multi-faceted complexities and diversities of the state, there cannot be a generic set of policies, rather there is need for a focussed, specific set of policies to address the issues of human development. The present report holds critical and analytical insights for drawing up such a differentiated approach towards inclusive human development in the state.

190
Assam HDR: Managing Diversities, Achieving Human Development
Statistical Appendix

191
Statistical Appendix
Table 2A.1: Key Dimensional Achievements in Assam (District Level)
District Life expectancy
at Birth
Mean Yearsof Schooling
expected Years
of Schooling
AnnualPer Capita
incomeBaksa 42.13 4.49 11.87 18192Barpeta 69.93 6.33 12.30 21828Bongaigaon 54.42 6.21 11.97 25164Cachar 40.76 6.26 11.40 23052Chirang 68.52 5.82 12.57 21504Darrang 60.27 3.77 11.44 17892Dhemaji 51.25 6.50 12.27 17568Dhubri 53.12 4.29 11.33 16836Dibrugarh 53.68 7.07 12.08 23364Dima Hasao 68.62 7.19 10.99 26604Goalpara 66.69 4.65 11.88 22404Golaghat 55.29 6.51 12.14 19788Hailakandi 43.82 5.48 10.98 16632Jorhat 58.17 8.00 12.41 38664Kamrup 71.88 5.72 11.90 23316Kamrup (M) 55.98 9.16 12.42 63444Karbi Anglong 68.27 5.34 12.14 23076Karimganj 43.39 5.67 11.38 19152Kokrajhar 55.04 5.19 12.26 18048Lakhimpur 59.79 6.60 12.29 22248Marigaon 67.42 6.54 11.98 17196Nagaon 58.24 6.64 12.03 25884Nalbari 52.24 7.24 12.48 27516Sibsagar 53.89 8.44 12.39 37104Sonitpur 48.89 5.16 11.52 27240Tinsukia 47.63 5.90 11.15 23340Udalguri 55.00 4.90 11.40 20436Assam 54.00 6.17 11.85 24660
Source: HDR Survey, 2013
Table 2A.2: Key Dimensional Achievements in Assam
(Spatial Diversity Category wise) Spatial Diversity Category
Life expectancy
at Birth
Mean Yearsof Schooling
expected Years
of Schooling
AnnualPer Capita
incomeChar 63.80 4.76 11.76 21516Flood Affected 50.22 6.54 11.90 23604Hills 67.42 5.25 11.87 18060Tea Garden 49.10 6.13 11.66 21588Border 50.34 5.46 11.75 17988Multiple Diversities 52.37 5.30 11.66 18324General 56.26 6.15 12.10 26016
Source: HDR Survey, 2013

192
Assam HDR: Managing Diversities, Achieving Human Development
Table 2A.4: Dimensional and Human Development Indices of Districts
District DimensionalIndex: Health
DimensionalIndex:
education
DimensionalIndex: Living
Standard
HDI
Baksa 0.340 0.606 0.404 0.437Barpeta 0.768 0.684 0.462 0.624Bongaigaon 0.530 0.667 0.507 0.564Cachar 0.319 0.647 0.479 0.463Chirang 0.746 0.677 0.457 0.614Darrang 0.620 0.566 0.399 0.519Dhemaji 0.481 0.688 0.393 0.507Dhubri 0.510 0.579 0.380 0.482Dibrugarh 0.518 0.700 0.483 0.560Dima Hasao 0.748 0.662 0.525 0.638Goalpara 0.718 0.612 0.470 0.591Golaghat 0.543 0.684 0.431 0.543Hailakandi 0.366 0.605 0.376 0.437Jorhat 0.587 0.744 0.643 0.655Kamrup 0.798 0.648 0.483 0.630Kamrup (M) 0.554 0.783 0.800 0.703Karbi Anglong 0.743 0.645 0.480 0.612Karimganj 0.360 0.627 0.420 0.456Kokrajhar 0.539 0.645 0.402 0.519Lakhimpur 0.612 0.693 0.468 0.583Marigaon 0.730 0.678 0.386 0.576Nagaon 0.588 0.684 0.516 0.592Nalbari 0.496 0.721 0.535 0.576Sibsagar 0.521 0.758 0.630 0.629Sonitpur 0.444 0.615 0.532 0.526Tinsukia 0.425 0.625 0.483 0.505Udalguri 0.538 0.602 0.441 0.523Assam 0.523 0.661 0.501 0.557
Source: HDR Survey, 2013
Table 2A.3: Dimensional Inequalities in Assam (Spatial Diversity Category wise)
Spatial Diversity Category InequalityIn Health
InequalityIn education
InequalityIn Living Standard
Char 0.273 0.095 0.439Flood Affected 0.337 0.073 0.474Hills 0.243 0.075 0.530Tea Garden 0.333 0.093 0.479Border 0.309 0.089 0.349Multiple Diversities 0.385 0.106 0.357General 0.315 0.085 0.383
Source: HDR Survey, 2013

193
Statistical Appendix
Table 2A.5: Ranks of Dimensional and Human Development Indices of Districts
District Rank:Health
Rank:education
Rank:Living
Standard
Rank:HDI
Baksa 26 23 21 26Barpeta 2 9 16 6Bongaigaon 16 13 8 14Cachar 27 16 13 24Chirang 4 12 17 7Darrang 8 27 23 19Dhemaji 21 7 24 21Dhubri 19 26 26 23Dibrugarh 18 5 9 15Dima Hasao 3 14 6 3Goalpara 7 22 14 10Golaghat 13 8 19 16Hailakandi 24 24 27 27Jorhat 11 3 2 2Kamrup 1 15 11 4Kamrup (M) 12 1 1 1Karbi Anglong 5 17 12 8Karimganj 25 19 20 25Kokrajhar 14 18 22 20Lakhimpur 9 6 15 11Marigaon 6 11 25 13Nagaon 10 10 7 9Nalbari 20 4 4 12Sibsagar 17 2 3 5Sonitpur 22 21 5 17Tinsukia 23 20 10 22Udalguri 15 25 18 18
Source: HDR Survey, 2013

194
Assam HDR: Managing Diversities, Achieving Human Development
Table 2A.6: Inequalities in Dimensional Achievements in districts
District Inequality: Health
Inequality: education
Inequality: Living Standard
Baksa 0.365 0.065 0.369Barpeta 0.206 0.074 0.354Bongaigaon 0.315 0.060 0.423Cachar 0.375 0.083 0.418Chirang 0.177 0.049 0.241Darrang 0.321 0.112 0.318Dhemaji 0.310 0.094 0.379Dhubri 0.435 0.087 0.266Dibrugarh 0.369 0.083 0.448Dima Hasao 0.314 0.045 0.333Goalpara 0.252 0.110 0.363Golaghat 0.304 0.120 0.384Hailakandi 0.292 0.072 0.413Jorhat 0.318 0.094 0.484Kamrup 0.182 0.085 0.433Kamrup (M) 0.307 0.069 0.381Karbi Anglong 0.261 0.087 0.593Karimganj 0.314 0.079 0.340Kokrajhar 0.208 0.115 0.286Lakhimpur 0.320 0.103 0.456Marigaon 0.208 0.069 0.452Nagaon 0.266 0.079 0.406Nalbari 0.344 0.089 0.382Sibsagar 0.332 0.071 0.537Sonitpur 0.306 0.106 0.579Tinsukia 0.302 0.084 0.491Udalguri 0.396 0.073 0.392Assam 0.321 0.088 0.441
Source: HDR Survey, 2013

195
Statistical Appendix
Table 2A.7: Inequality Adjusted Dimensional Indices and HDI (IHDI) for Districts
District Inequality Adjusted
Health Index
Inequality Adjusted
education Index
Inequality Adjusted
Income Index
IHDI
Baksa 0.216 0.567 0.255 0.315Barpeta 0.610 0.633 0.298 0.487Bongaigaon 0.363 0.628 0.293 0.405Cachar 0.200 0.593 0.279 0.321Chirang 0.614 0.644 0.347 0.516Darrang 0.421 0.502 0.272 0.386Dhemaji 0.332 0.624 0.244 0.370Dhubri 0.288 0.529 0.278 0.349Dibrugarh 0.327 0.642 0.267 0.383Dima Hasao 0.513 0.633 0.350 0.484Goalpara 0.537 0.544 0.299 0.444Golaghat 0.378 0.602 0.265 0.392Hailakandi 0.260 0.561 0.220 0.318Jorhat 0.401 0.674 0.332 0.448Kamrup 0.653 0.593 0.274 0.473Kamrup (M) 0.384 0.729 0.496 0.518Karbi Anglong 0.549 0.589 0.195 0.398Karimganj 0.247 0.577 0.277 0.341Kokrajhar 0.427 0.570 0.287 0.412Lakhimpur 0.416 0.622 0.255 0.404Marigaon 0.578 0.631 0.212 0.426Nagaon 0.432 0.630 0.307 0.437Nalbari 0.325 0.657 0.331 0.413Sibsagar 0.348 0.704 0.292 0.415Sonitpur 0.308 0.550 0.224 0.336Tinsukia 0.297 0.573 0.246 0.347Udalguri 0.325 0.558 0.268 0.365Assam 0.355 0.603 0.280 0.391
Source: HDR Survey, 2013

196
Assam HDR: Managing Diversities, Achieving Human Development
Table 2A.8: Loss in Human Development due to Inequality (in percent)
District Loss inHealth
Loss ineducation
Loss inIncome
Loss in TotalHuman
Development
Coefficientof
InequalityBaksa 36.48 6.54 36.88 27.91 26.63Barpeta 20.58 7.43 35.41 21.98 21.14Bongaigaon 31.53 5.98 42.26 28.10 26.59Cachar 37.45 8.32 41.81 30.64 29.20Chirang 17.75 4.95 24.12 15.97 15.60Darrang 32.12 11.19 31.84 25.66 25.05Dhemaji 30.97 9.37 37.86 27.01 26.07Dhubri 43.49 8.68 26.64 27.66 26.27Dibrugarh 36.89 8.30 44.78 31.63 29.99Dima Hasao 31.38 4.45 33.28 24.09 23.04Goalpara 25.18 11.03 36.35 24.89 24.19Golaghat 30.43 12.02 38.38 27.75 26.94Hailakandi 29.16 7.20 41.30 27.20 25.89Jorhat 31.79 9.42 48.38 31.67 29.86Kamrup 18.22 8.53 43.29 24.86 23.35Kamrup (M) 30.67 6.93 38.06 26.34 25.22Karbi Anglong 26.13 8.67 59.33 35.02 31.37Karimganj 31.37 7.85 34.04 25.28 24.42Kokrajhar 20.78 11.54 28.65 20.63 20.32Lakhimpur 32.02 10.28 45.55 30.75 29.29Marigaon 20.76 6.93 45.18 26.06 24.29Nagaon 26.61 7.93 40.58 26.23 25.04Nalbari 34.44 8.95 38.17 28.27 27.19Sibsagar 33.24 7.14 53.67 34.02 31.35Sonitpur 30.63 10.64 57.85 36.07 33.04Tinsukia 30.18 8.43 49.10 31.22 29.24Udalguri 39.55 7.29 39.19 30.15 28.68Assam 32.15 8.85 44.12 29.82 28.37
Source: HDR Survey, 2013
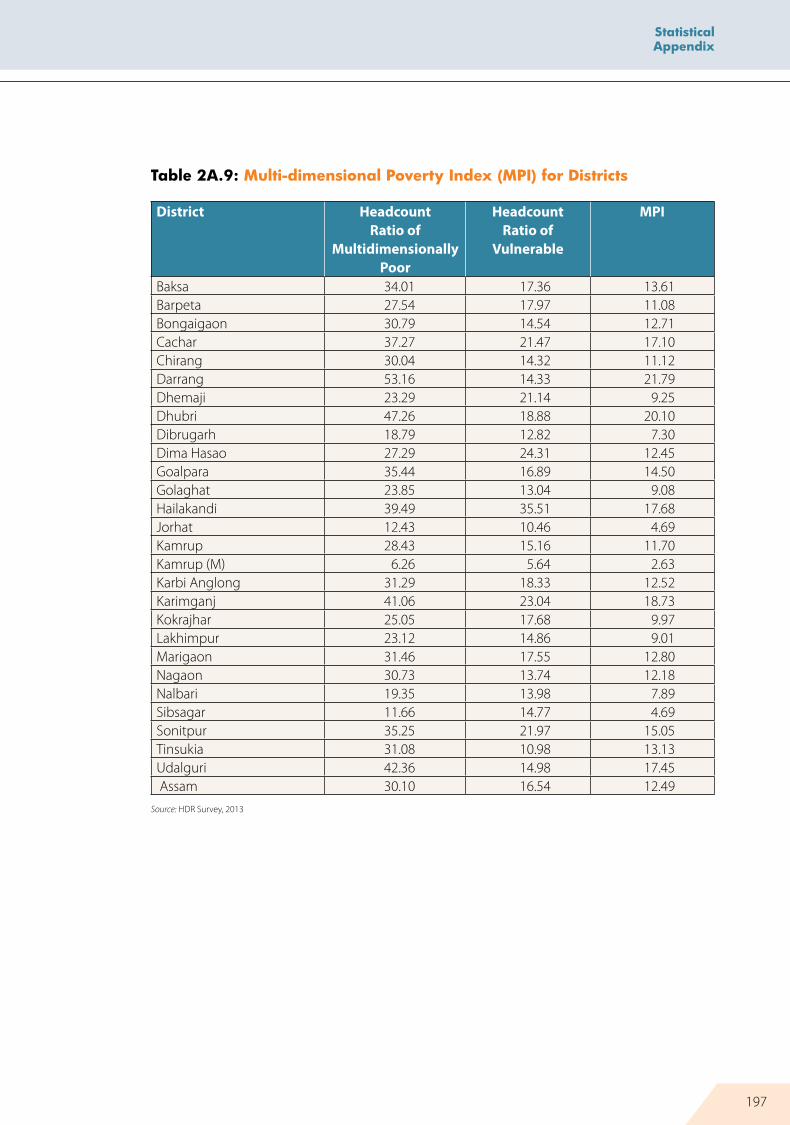
197
Statistical Appendix
Table 2A.9: Multi-dimensional Poverty Index (MPI) for Districts
District HeadcountRatio of
MultidimensionallyPoor
HeadcountRatio of
Vulnerable
MPI
Baksa 34.01 17.36 13.61Barpeta 27.54 17.97 11.08Bongaigaon 30.79 14.54 12.71Cachar 37.27 21.47 17.10Chirang 30.04 14.32 11.12Darrang 53.16 14.33 21.79Dhemaji 23.29 21.14 9.25Dhubri 47.26 18.88 20.10Dibrugarh 18.79 12.82 7.30Dima Hasao 27.29 24.31 12.45Goalpara 35.44 16.89 14.50Golaghat 23.85 13.04 9.08Hailakandi 39.49 35.51 17.68Jorhat 12.43 10.46 4.69Kamrup 28.43 15.16 11.70Kamrup (M) 6.26 5.64 2.63Karbi Anglong 31.29 18.33 12.52Karimganj 41.06 23.04 18.73Kokrajhar 25.05 17.68 9.97Lakhimpur 23.12 14.86 9.01Marigaon 31.46 17.55 12.80Nagaon 30.73 13.74 12.18Nalbari 19.35 13.98 7.89Sibsagar 11.66 14.77 4.69Sonitpur 35.25 21.97 15.05Tinsukia 31.08 10.98 13.13Udalguri 42.36 14.98 17.45 Assam 30.10 16.54 12.49
Source: HDR Survey, 2013

198
Assam HDR: Managing Diversities, Achieving Human Development
Table 2A.10: Multi-dimensional Poverty Index (MPI): Spatial Diversity Categories
District HeadcountRatio ofMulti-
dimensionallyPoor
HeadcountRatio of
Vulnerable
MPI
Char 44.59 17.60 18.57Flood Affected 27.74 17.78 11.70Hills 33.70 21.21 13.86Tea Garden 30.09 15.57 12.44Border 32.87 19.25 13.78Multiple Diversities 37.48 18.48 15.73General 29.40 18.06 11.75Total 30.10 16.54 12.49
Source: HDR Survey, 2013

199
Statistical Appendix
Table 3A.1: Work Participation Rate and Unemployment Rates
District Work Participation Rate Unemployment RateMale Female Total Male Female Total
Baksa 54.9 6.0 30.6 6.5 48.4 13.2Barpeta 53.8 8.9 32.1 5.0 23.8 8.0Bongaigaon 51.5 6.6 29.6 8.8 41.8 14.1Cachar 48.7 7.3 27.8 10.8 53.7 20.5Chirang 52.0 8.5 31.5 7.7 31.1 11.5Darrang 52.8 5.6 30.1 8.0 41.3 12.4Dhemaji 49.7 6.1 28.4 11.1 43.5 16.1Dhubri 51.5 4.6 28.7 9.8 38.7 13.0Dibrugarh 56.1 14.8 35.7 10.3 42.4 19.4Dima Hasao 63.2 17.5 41.8 4.7 34.4 12.4Goalpara 54.5 6.1 31.0 7.6 46.5 13.4Golaghat 55.3 11.1 32.7 9.5 37.7 15.8Hailakandi 50.3 8.2 29.9 9.1 36.4 14.0Jorhat 57.6 13.0 36.1 7.4 33.4 13.3Kamrup 56.3 6.3 31.8 6.8 45.3 12.7Kamrup (M) 57.6 10.2 35.1 6.9 30.9 11.1Karbi Anglong 52.4 10.6 32.0 7.6 35.0 13.3Karimganj 50.0 4.9 27.5 8.2 57.6 16.6Kokrajhar 58.0 7.4 34.3 8.5 45.7 14.4Lakhimpur 54.2 11.1 33.3 8.8 37.9 15.2Marigaon 56.7 4.3 31.4 6.5 56.0 13.0Nagaon 54.0 8.8 31.8 6.3 33.6 11.1Nalbari 54.1 5.6 30.2 9.4 48.6 15.3Sibsagar 55.3 11.2 34.1 8.9 33.0 13.7Sonitpur 54.7 13.6 34.1 7.6 33.0 14.1Tinsukia 52.8 17.7 35.1 10.6 27.4 15.6Udalguri 55.3 8.1 31.6 5.2 33.8 10.1Assam 53.9 9.0 31.9 8.1 38.3 13.9
Source: HDR Survey, 2013

200
Assam HDR: Managing Diversities, Achieving Human Development
Table 3A.2: Labour Force Participation Rate (Male, Female, Total)
District HDR Survey 2013Male Female Total
Baksa 58.7 11.5 35.2Barpeta 56.6 11.6 34.9Bongaigaon 56.4 11.4 34.4Cachar 54.6 15.7 35.0Chirang 56.3 12.3 35.6Darrang 57.4 9.5 34.4Dhemaji 55.9 10.8 33.9Dhubri 57.1 7.5 33.0Dibrugarh 62.5 25.7 44.3Dima Hasao 66.4 26.6 47.8Goalpara 59.0 11.3 35.8Golaghat 61.1 17.7 38.8Hailakandi 55.3 12.9 34.8Jorhat 62.2 19.5 41.6Kamrup 60.4 11.6 36.5Kamrup (M) 61.9 14.8 39.5Karbi Anglong 56.7 16.3 36.9Karimganj 54.4 11.5 33.0Kokrajhar 63.4 13.6 40.0Lakhimpur 59.4 17.8 39.2Marigaon 60.7 9.8 36.1Nagaon 57.6 13.2 35.7Nalbari 59.7 10.9 35.7Sibsagar 60.7 16.7 39.5Sonitpur 59.1 20.3 39.7Tinsukia 59.0 24.4 41.6Udalguri 58.4 12.2 35.2Assam 58.6 14.7 37.0
Source: HDR Survey, 2013

201
Statistical Appendix
Table 3A.3: Types of works in Assam (in percentage employed)
District Casual worker
Permanent worker
Self-employed
Agriculture Livestock
Baksa 37.4 7.7 19.4 35.4 0.1Barpeta 34.5 11.9 20.1 33.3 0.1Bongaigaon 38.8 17.5 20.4 23.3 0.0Cachar 47.4 17.7 23.7 11.2 0.0Chirang 36.8 5.4 22.5 30.2 5.1Darrang 42.7 6.5 24.5 26.0 0.3Dhemaji 36.8 9.6 14.8 38.7 0.2Dhubri 57.5 5.6 13.9 22.9 0.1Dibrugarh 50.8 17.1 15.4 16.7 0.0Dima Hasao 16.9 12.4 23.0 47.7 0.0Goalpara 39.8 11.2 20.9 28.0 0.2Golaghat 35.6 14.7 10.6 39.1 0.1Hailakandi 50.5 8.0 23.4 17.9 0.2Jorhat 32.0 23.6 15.9 28.4 0.2Kamrup 46.1 12.0 18.0 23.8 0.0Kamrup (M) 28.7 31.8 34.6 4.7 0.2Karbi Anglong 18.2 11.5 17.5 52.3 0.7Karimganj 52.1 9.3 21.8 16.6 0.1Kokrajhar 30.8 7.1 10.5 50.6 1.1Lakhimpur 34.1 12.5 18.2 35.1 0.1Marigaon 33.5 6.4 11.9 48.1 0.0Nagaon 34.4 11.5 25.6 28.4 0.1Nalbari 39.7 22.4 22.3 15.6 0.1Sibsagar 32.6 21.0 20.2 26.2 0.0Sonitpur 49.3 10.9 16.5 23.2 0.1Tinsukia 39.9 21.0 14.9 24.2 0.0Udalguri 49.0 10.0 11.3 29.8 0.0Assam 39.9 13.6 19.1 27.2 0.2
Source: HDR Survey, 2013Note: Casual Workers include Daily Wage Earners only.

202
Assam HDR: Managing Diversities, Achieving Human Development
Table 3A.4: Types of works in Assam by Spatial Diversity and Religion
Casual worker
Regular Salaried worker
Self-employed
Agriculture Livestock
Spatial Diversity CategoryChar Block 42.4 8.1 16.3 33.1 0.1Flood-affected Block 36.5 12.8 19.6 31.0 0.1Hill Block 17.2 8.8 15.2 58.2 0.6Tea Garden Block 48.0 16.4 12.2 23.4 0.1Border Block 42.9 7.9 15.0 33.7 0.6Multiple-diversity Block
43.6 11.4 13.4 31.5 0.1
General Block 39.5 13.5 17.7 29.2 0.1Religious groupsHindus 36.7 16.4 19.7 26.9 0.3Muslims 47.2 6.9 19.0 26.8 0.1Christians 44.4 11.6 8.7 35.3 0.0Others 35.0 15.2 19.3 30.5 0.0
Source: HDR Survey, 2013Note: Casual Workers include Daily Wage Earners only.

203
Statistical Appendix
Table 3A.5: Income and Source of Income of Households: District Wise
District AveragePCI
Proportion of HH Income fromAgriculture & Farming
Livestock Self-employment
Casual jobs
Salaries Transfer Income
Baksa 1516 15.2 2.3 22.4 22.2 30.3 7.6Barpeta 1819 11.2 2.7 24.1 23.9 35.5 2.4Bongaigaon 2097 5.5 1.1 17.5 24.6 47.2 4.1Cachar 1921 5.8 1.0 19.3 24.6 38.1 11.2Chirang 1792 23.2 5.3 18.6 28.1 20.9 3.8Darrang 1491 26.6 2.3 25.8 29.3 15.6 0.4Dhemaji 1464 26.7 3.1 14.6 30.5 20.1 5.1Dhubri 1403 13.8 1.8 15.0 48.3 18.7 2.3Dibrugarh 1947 5.5 1.6 20.5 32.1 35.9 4.3Dima Hasao 2217 15.2 3.8 27.9 10.9 41.8 0.4Goalpara 1867 9.0 2.6 21.5 39.5 25.9 1.4Golaghat 1649 22.8 3.9 13.4 21.8 33.5 4.7Hailakandi 1386 8.3 0.5 24.2 43.5 18.6 4.9Jorhat 3222 9.3 1.4 13.0 16.8 53.8 5.8Kamrup 1943 8.6 2.3 18.0 37.5 29.8 3.8Kamrup (M) 5287 0.5 0.4 28.1 13.5 44.5 13.0Karbi Anglong 1923 15.8 4.0 30.2 19.8 28.8 1.3Karimganj 1596 10.2 1.0 21.8 38.3 24.4 4.3Kokrajhar 1504 25.5 11.1 13.0 25.0 21.6 3.8Lakhimpur 1854 10.5 2.3 16.9 30.4 38.5 1.3Marigaon 1433 15.8 2.1 18.8 40.5 22.1 0.7Nagaon 2157 13.8 2.2 31.2 22.0 25.2 5.6Nalbari 2293 5.4 1.7 17.2 24.2 46.5 4.9Sibsagar 3092 8.1 2.6 19.2 12.4 53.2 4.5Sonitpur 2270 8.9 2.0 21.6 18.3 43.0 6.2Tinsukia 1945 16.5 0.9 27.5 16.4 35.9 2.9Udalguri 1703 20.6 2.0 15.8 31.9 26.4 3.5Assam 2055 11.1 2.1 21.6 24.9 34.9 5.2
Source: HDR Survey, 2013

204
Assam HDR: Managing Diversities, Achieving Human Development
Table 3A.6: Income and Source of Income of Households: Diversity and Religion
District AveragePCI
Proportion of HH Income fromAgriculture & Farming
Livestock Self-employment
Casual jobs
Salaries Transfer Income
Spatial DiversityChar Block 1793 14.6 2.6 18.4 30.6 32.0 1.9Flood-affected Block
1967 11.9 2.1 20.5 26.1 33.2 6.1
Hill Block 1505 23.8 6.0 16.3 22.5 30.5 0.9Tea Garden Block
1799 13.2 2.4 17.9 25.6 37.1 3.9
Border Block 1499 17.8 3.6 16.7 35.0 22.9 4.0Multiple-diversity Block
1527 18.1 2.9 11.3 37.6 27.9 2.3
General Block 2168 14.4 2.5 18.0 25.6 33.8 5.6Religious groupsHindus 2341 9.7 1.9 21.8 20.4 40.3 6.0Muslims 1519 14.8 2.5 22.2 39.1 18.5 2.8Christians 1339 22.2 5.1 10.9 32.6 26.3 2.9Others 2131 10.6 2.5 26.7 18.7 37.2 4.3
Source: HDR Survey, 2013

205
Statistical Appendix
Table 3A.7: Average MPCE rural and urban, District Wise
District Average MPCe Food (Rs.) Average MPCe Total (Rs.)Rural Urban Total Rural Urban Total
Baksa 590.31 968.97 595.03 949.70 2703.89 971.57Barpeta 557.41 972.75 596.46 915.32 1778.56 996.47Bongaigaon 750.29 1608.76 896.70 1328.25 2758.73 1572.22Cachar 858.24 1234.18 928.64 1275.53 2187.30 1446.27Chirang 483.20 518.18 486.02 899.46 1106.38 916.15Darrang 508.09 1005.33 541.66 782.68 1607.02 838.33Dhemaji 570.09 849.71 592.67 1066.02 1757.73 1121.90Dhubri 583.51 972.82 624.88 854.85 1660.47 940.46Dibrugarh 625.75 1007.34 702.20 1093.25 1859.55 1246.78Dima Hasao 573.87 721.84 620.08 761.34 1277.33 922.47Goalpara 612.40 933.71 659.64 921.29 1310.99 978.59Golaghat 430.06 1077.43 494.94 790.84 1974.21 909.43Hailakandi 740.57 1170.85 772.02 1295.44 2030.30 1349.15Jorhat 588.42 1428.59 776.08 1080.60 2782.83 1460.82Kamrup 543.20 851.00 572.79 987.44 1864.07 1071.72Kamrup (M) 591.71 1565.77 1424.48 1049.05 3945.31 3525.22Karbi Anglong 465.95 1049.78 545.40 951.48 1647.52 1046.20Karimganj 816.99 1142.82 848.03 1138.02 1720.20 1193.48Kokrajhar 507.76 523.22 508.80 946.64 1362.53 974.49Lakhimpur 582.30 699.21 594.70 1138.25 1727.25 1200.71Marigaon 524.94 841.49 553.62 789.53 1235.04 829.89Nagaon 521.82 895.52 576.38 904.81 1686.73 1018.96Nalbari 579.62 1068.76 635.52 1081.37 2070.34 1194.40Sibsagar 568.47 865.23 599.92 1357.05 2428.93 1470.64Sonitpur 1041.47 1180.95 1056.05 1830.92 2657.53 1917.34Tinsukia 586.35 1323.40 747.96 1057.80 2735.54 1425.67Udalguri 596.52 775.69 605.47 812.18 1112.58 827.19Assam 622.12 1185.71 710.22 1060.74 2491.15 1284.32
Source: HDR Survey, 2013

206
Assam HDR: Managing Diversities, Achieving Human Development
Table 3A.8: Poverty Ratios in Assam: District Level by Sector and Social Category
District 2004-2005 (NSSO) 2013 (Primary Data) 2013 (Primary Data)Rural Urban Total Rural Urban Total SC ST OBC GeN
Baksa 41.5 19.5 41.0 40.5 40.0 43.5 37.0
Barpeta 39.9 6.0 37.3 41.0 17.5 39.0 29.5 37.0 29.0 39.5Bongaigaon 33.0 0.9 29.1 36.0 8.0 31.5 30.5 28.0 28.5 33.5Cachar 33.5 0.7 28.9 35.5 15.0 31.5 34.5 29.5 31.5 30.0Chirang 42.0 34.5 41.5 41.0 40.0 44.0 43.5Darrang 0.1 0.0 0.1 47.0 26.5 45.5 46.5 48.5 41.0 46.0Dhemaji 0.0 0.0 0.0 37.5 26.0 36.5 35.5 37.0 37.0 30.5Dhubri 42.4 4.2 37.9 43.5 24.0 41.5 38.5 42.0 36.5 42.5Dibrugarh 19.2 3.9 16.3 34.0 20.0 31.5 27.5 30.0 32.0 31.5Dima Hasao 44.5 32.0 41.0 42.5 43.0 40.0Goalpara 33.9 6.8 31.7 42.0 30.5 40.5 41.5 35.5 34.5 42.0Golaghat 25.5 8.1 24.0 46.0 20.5 43.5 39.5 46.0 44.5 40.0Hailakandi 7.0 2.6 6.6 35.0 13.5 33.5 38.0 40.5 29.0 34.0Jorhat 27.5 3.8 23.4 38.5 15.0 34.0 30.0 39.5 37.5 25.0Kamrup 22.3 2.9 15.3 39.5 25.0 38.5 40.5 40.0 32.5 38.5Kamrup (M) 36.5 3.5 9.5 19.0 28.5 12.5Karbi Anglong
26.5 0.0 23.5 45.0 28.5 42.5 37.0 46.5 41.5 29.5
Karimganj 40.9 14.3 39.0 38.0 28.0 37.0 35.5 37.5 33.5 39.0Kokrajhar 35.7 3.0 33.4 39.0 29.0 38.0 42.0 39.0 38.0 35.5Lakhimpur 1.4 1.2 1.4 38.0 29.0 37.0 36.5 40.5 37.0 33.5Marigaon 21.5 0.0 20.5 45.5 36.0 44.5 42.0 45.5 39.5 45.5Nagaon 25.3 9.1 23.4 41.5 21.5 39.0 41.5 44.0 37.5 37.5Nalbari 15.0 0.8 14.7 35.0 17.5 33.0 38.0 46.5 32.5 32.0Sibsagar 20.3 7.1 19.1 34.0 13.5 32.0 35.0 37.0 31.0 31.0Sonitpur 3.6 0.7 3.3 43.0 14.5 40.5 40.5 42.5 43.0 37.0Tinsukia 14.4 2.6 12.1 41.5 14.0 36.0 36.5 32.0 40.0 25.5Udalguri 43.5 40.5 43.0 48.5 39.0 40.5 45.5Assam 22.1 3.6 19.7 40.5 17.0 37.0 37.5 40.5 36.5 36.0
Source: 2004-2005 (NSSO) estimates are obtained from Siladitya Chaudhuri, Nivedita Gupta (2009): “Levels of living and poverty patterns: a District-wise analysis for India”, Economic & Political Weekly, Vol. XLIV, No 9Estimates for 2013 are based on HDR Survey (2013)
Table 3A.9: Poverty Ratios in Assam by Spatial Diversity and Religious Groups
Spatial Diversity Category Poverty RatioChar Block 42.6Flood-affected Block 36.4Hill Block 44.7Tea Garden Block 37.6Border Block 38.9Multi-diversity Block 40.8General Block 39.5Religious GroupsHindu 33.4Muslim 39.7Christian 44.0Others 26.5
Source: HDR Survey, 2013

207
Statistical Appendix
Table 3A.10: Asset Poverty in Assam by Spatial Diversity and Religion (percent)
No Agricultural
Asset
No Non-agricultural
Asset
No Transport
Asset
No HH Appliances
No Financial
Asset
No Insurance
CoverSpatial Diversity CategoriesChar Block 69.4 24.4 36 91.1 42.5 83.3Flood-affected Block
64.7 21.9 23.3 82.1 34.1 75.7
Hill Block 53.4 28.2 21.6 74.1 27 81.1Tea Garden Block
66 18.1 24.1 85.3 28.7 74.5
Border Block 61.4 30.2 25.5 84 41.9 81.1Multiple-diversity Block
60.6 31.4 34 87.9 42.1 83.2
General Block 67.1 15.6 23.1 86.6 25.7 75.6Religious GroupsHindu 68.9 20.4 19.6 82.1 28 71.6Muslim 72.5 33.6 32.5 98.4 43 84Christian 56.7 20.1 30.7 91.6 39.9 85.7Others 62.2 26.9 28.2 95.5 34.6 70.5
Source: HDR Survey, 2013

208
Assam HDR: Managing Diversities, Achieving Human Development
Table 3A.11: District Level Asset Poverty in Assam (percent HH) (Rural)
District No Agricultural
Asset
No Non-agricultural
Asset
No Transport
Asset
No HH Appliances
No Financial
AssetBaksa 65.5 72.5 11.6 23.8 40.6Barpeta 65.8 93.4 14.8 30.1 35.4Bongaigaon 70.9 84.6 13.9 18.5 10.2Cachar 85.5 97.8 54.7 34.0 49.4Chirang 55.0 88.3 8.0 16.5 17.9Darrang 67.4 93.8 31.7 47.8 65.3Dhemaji 37.0 64.2 25.0 21.4 51.5Dhubri 75.2 97.8 44.8 40.5 54.6Dibrugarh 70.4 77.4 16.1 21.1 22.7Dima Hasao 46.5 58.9 93.0 29.2 23.8Goalpara 56.1 90.2 12.7 29.0 26.4Golaghat 41.3 75.1 10.1 22.8 26.2Hailakandi 79.2 99.3 70.7 27.5 33.3Jorhat 55.8 70.7 8.4 23.2 18.1Kamrup 73.0 84.3 19.5 22.7 36.0Kamrup (M) 83.4 86.0 22.6 10.2 30.9Karbi Anglong 54.8 77.4 16.3 20.4 28.1Karimganj 79.2 97.9 66.8 23.2 42.8Kokrajhar 42.5 88.2 16.6 21.3 43.0Lakhimpur 45.5 85.1 12.7 29.0 36.1Marigaon 45.0 68.3 20.9 36.4 62.8Nagaon 66.8 92.4 13.3 25.8 27.8Nalbari 86.9 61.8 15.0 16.9 17.5Sibsagar 57.5 74.3 12.9 14.3 13.9Sonitpur 60.6 85.0 12.0 27.0 34.8Tinsukia 66.5 88.0 24.0 30.2 40.6Udalguri 67.4 92.2 17.4 28.6 36.3Assam 64.5 85.5 23.8 26.9 35.7
Source: HDR Survey, 2013
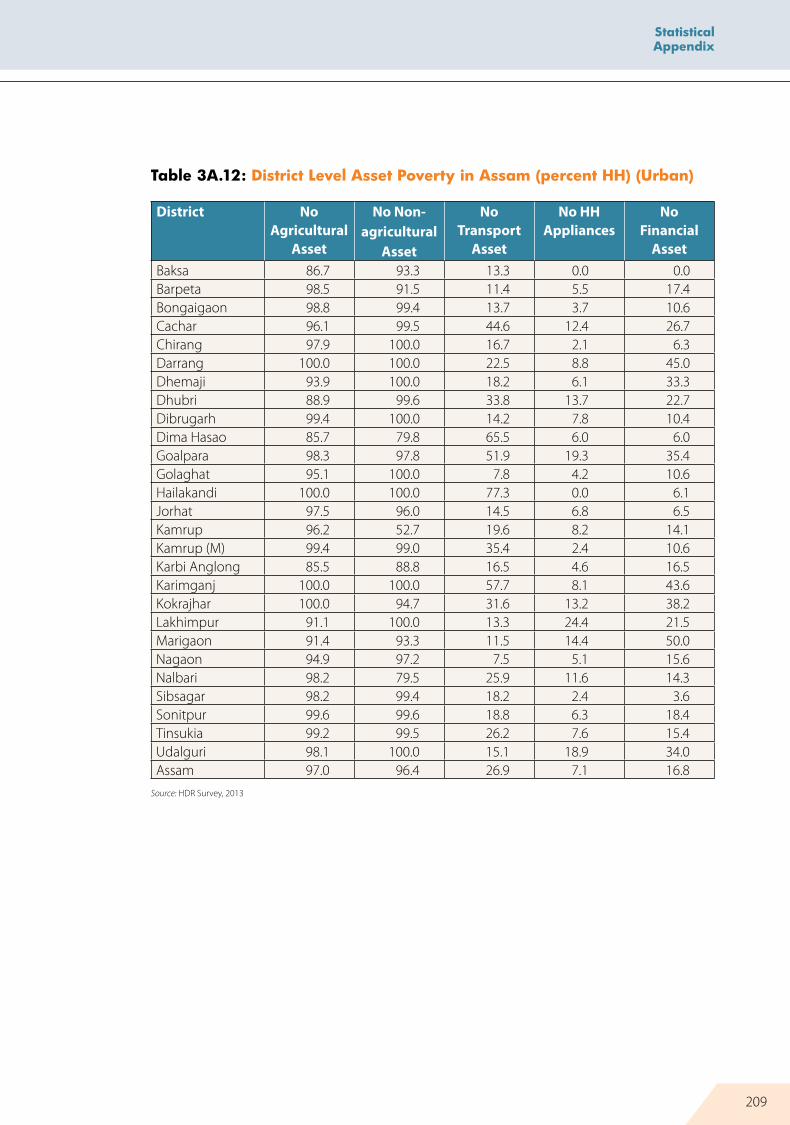
209
Statistical Appendix
Table 3A.12: District Level Asset Poverty in Assam (percent HH) (Urban)
District No Agricultural
Asset
No Non-agricultural
Asset
No Transport
Asset
No HH Appliances
No Financial
AssetBaksa 86.7 93.3 13.3 0.0 0.0Barpeta 98.5 91.5 11.4 5.5 17.4Bongaigaon 98.8 99.4 13.7 3.7 10.6Cachar 96.1 99.5 44.6 12.4 26.7Chirang 97.9 100.0 16.7 2.1 6.3Darrang 100.0 100.0 22.5 8.8 45.0Dhemaji 93.9 100.0 18.2 6.1 33.3Dhubri 88.9 99.6 33.8 13.7 22.7Dibrugarh 99.4 100.0 14.2 7.8 10.4Dima Hasao 85.7 79.8 65.5 6.0 6.0Goalpara 98.3 97.8 51.9 19.3 35.4Golaghat 95.1 100.0 7.8 4.2 10.6Hailakandi 100.0 100.0 77.3 0.0 6.1Jorhat 97.5 96.0 14.5 6.8 6.5Kamrup 96.2 52.7 19.6 8.2 14.1Kamrup (M) 99.4 99.0 35.4 2.4 10.6Karbi Anglong 85.5 88.8 16.5 4.6 16.5Karimganj 100.0 100.0 57.7 8.1 43.6Kokrajhar 100.0 94.7 31.6 13.2 38.2Lakhimpur 91.1 100.0 13.3 24.4 21.5Marigaon 91.4 93.3 11.5 14.4 50.0Nagaon 94.9 97.2 7.5 5.1 15.6Nalbari 98.2 79.5 25.9 11.6 14.3Sibsagar 98.2 99.4 18.2 2.4 3.6Sonitpur 99.6 99.6 18.8 6.3 18.4Tinsukia 99.2 99.5 26.2 7.6 15.4Udalguri 98.1 100.0 15.1 18.9 34.0Assam 97.0 96.4 26.9 7.1 16.8
Source: HDR Survey, 2013

210
Assam HDR: Managing Diversities, Achieving Human Development
Table 3A.13: District Level Asset Poverty in Assam (percent HH) (Total)
District No Agricultural
Asset
No Non-agricultural
Asset
No Transport
Asset
No HH Appliances
No Financial
AssetBaksa 65.8 72.7 11.6 23.5 40.1Barpeta 68.9 93.2 14.5 27.8 33.7Bongaigaon 75.6 87.1 13.9 16.0 10.3Cachar 87.5 98.2 52.8 30.0 45.1Chirang 58.5 89.2 8.7 15.3 17.0Darrang 69.6 94.2 31.1 45.2 64.0Dhemaji 41.6 67.1 24.5 20.2 50.1Dhubri 76.7 98.0 43.7 37.7 51.2Dibrugarh 76.3 81.9 15.7 18.4 20.3Dima Hasao 58.7 65.4 84.4 21.9 18.2Goalpara 62.3 91.3 18.4 27.5 27.7Golaghat 46.7 77.6 9.9 21.0 24.6Hailakandi 80.7 99.3 71.2 25.5 31.3Jorhat 65.2 76.4 9.8 19.5 15.5Kamrup 75.2 81.3 19.5 21.3 33.9Kamrup (M) 97.0 97.2 33.6 3.5 13.6Karbi Anglong 59.0 79.0 16.3 18.3 26.5Karimganj 81.2 98.1 65.9 21.7 42.9Kokrajhar 46.3 88.6 17.6 20.8 42.6Lakhimpur 50.4 86.7 12.7 28.5 34.6Marigaon 49.2 70.6 20.0 34.4 61.7Nagaon 70.9 93.1 12.4 22.8 26.0Nalbari 88.2 63.8 16.2 16.3 17.1Sibsagar 61.9 76.9 13.4 13.0 12.9Sonitpur 64.7 86.6 12.7 24.8 33.1Tinsukia 73.7 90.5 24.5 25.2 35.1Udalguri 68.9 92.6 17.3 28.1 36.2Assam 69.6 87.2 24.3 23.8 32.8
Source: HDR Survey, 2013

211
Statistical Appendix
Table 3A.14: Landlessness by Spatial Diversity and Religious Groups (Percent HH)
No Homestead Land
No Cultivatable Land
No IrrigatedLand
Spatial DiversityChar Block 0.8 50.6 79.3Flood-affected Block 1.2 44.5 90.8Hill Block 1.4 29.4 93.9Tea Garden Block 1.5 48.2 98.9Border Block 0.4 49.3 89.0Multiple-diversity Block 1.1 48.1 93.7General Block 0.4 52.4 87.1Religious groupsHindus 4.9 54.9 93.9Muslims 2.0 59.3 83.9Christians 1.2 42.3 95.5Others 3.8 57.1 91.7
Source: HDR Survey, 2013

212
Assam HDR: Managing Diversities, Achieving Human Development
Table 3A.15: Landlessness District-wise (Percent HH)
District No HomesteadLand
No CultivatableLand
No IrrigatedLand
Baksa 0.6 54.5 75.8Barpeta 0.3 53.3 67.2Bongaigaon 0.5 60.3 85.4Cachar 1.5 63.8 92.6Chirang 0.0 45.3 75.7Darrang 0.3 51.0 80.5Dhemaji 0.4 22.9 99.1Dhubri 1.0 65.9 77.6Dibrugarh 3.9 46.4 100.0Dima Hasao 0.0 41.1 71.9Goalpara 0.1 48.7 92.1Golaghat 0.4 33.7 98.9Hailakandi 0.8 58.0 76.7Jorhat 0.2 29.0 98.9Kamrup 0.2 49.5 93.3Kamrup (M) 0.8 52.1 90.6Karbi Anglong 1.8 27.8 97.9Karimganj 0.6 63.2 93.3Kokrajhar 0.5 42.7 83.7Lakhimpur 0.5 32.1 99.7Marigaon 0.1 35.2 83.4Nagaon 1.4 43.0 88.0Nalbari 0.4 68.8 95.9Sibsagar 0.6 30.7 98.1Sonitpur 1.0 53.2 97.4Tinsukia 0.4 50.4 99.5Udalguri 1.2 54.7 94.2Assam 0.8 48.5 89.5
Source: HDR Survey, 2013

213
Statistical Appendix
Table 3A.16: Average Land Holding in Rural Areas (in Bigha)
Districts Per Capita Cultivated Land Per Capita Irrigated LandSC ST OBC General Total SC ST OBC General Total
Baksa 0.4 0.9 0.7 0.5 0.7 0.2 0.5 0.4 0.2 0.4Barpeta 0.3 1.1 0.4 0.6 0.6 0.1 0.9 0.3 0.4 0.4Bongaigaon 0.3 0.5 0.6 0.4 0.4 0.1 0.2 0.1 0.1 0.1Cachar 0.3 0.3 0.4 0.3 0.4 0.1 0.1 0.1 0.1 0.1Chirang 0.8 1.2 0.7 0.5 0.9 0.3 0.8 0.2 0.0 0.4Darrang 0.7 0.9 1.0 0.5 0.6 0.2 0.2 0.3 0.2 0.2Dhemaji 0.8 1.5 1.3 1.1 1.3 0.0 0.0 0.0 0.1 0.0Dhubri 0.3 0.1 0.6 0.3 0.4 0.1 0.0 0.3 0.2 0.2Dibrugarh 0.6 0.7 0.6 0.3 0.6 0.0 0.0 0.0 0.0 0.0Dima Hasao 0.0 0.7 0.4 0.0 0.6 0.0 0.3 0.2 0.0 0.2Goalpara 0.3 1.1 0.7 0.5 0.6 0.0 0.0 0.1 0.1 0.1Golaghat 0.7 1.1 1.0 0.8 0.9 0.0 0.0 0.0 0.0 0.0Hailakandi 0.2 0.7 0.3 0.4 0.4 0.1 0.0 0.2 0.2 0.2Jorhat 0.6 1.1 0.7 0.9 0.8 0.0 0.0 0.0 0.0 0.0Kamrup 0.4 0.6 0.4 0.5 0.5 0.1 0.0 0.0 0.1 0.1Kamrup (M) 0.5 0.7 0.8 0.6 0.7 0.2 0.1 0.3 0.1 0.2Karbi Anglong
0.6 1.1 0.8 0.4 0.9 0.1 0.0 0.0 0.0 0.0
Karimganj 0.5 0.7 0.4 0.4 0.4 0.2 0.0 0.1 0.0 0.1Kokrajhar 0.7 2.1 1.5 1.4 1.7 0.1 0.4 0.4 0.5 0.4Lakhimpur 0.7 1.2 0.9 0.8 1.0 0.0 0.0 0.0 0.0 0.0Marigaon 1.3 1.2 0.4 0.6 0.8 0.1 0.3 0.0 0.1 0.1Nagaon 0.7 0.9 0.7 0.8 0.8 0.2 0.0 0.0 0.1 0.1Nalbari 0.2 0.4 0.3 0.5 0.4 0.0 0.0 0.0 0.1 0.0Sibsagar 0.4 0.9 0.8 0.6 0.8 0.0 0.0 0.0 0.0 0.0Sonitpur 0.8 1.4 0.6 0.5 0.7 0.1 0.1 0.0 0.0 0.0Tinsukia 0.4 0.8 0.6 0.4 0.6 0.0 0.1 0.0 0.0 0.0Udalguri 0.6 1.2 0.7 0.5 0.7 0.0 0.2 0.1 0.0 0.1Assam 0.5 1.1 0.7 0.5 0.7 0.1 0.2 0.1 0.1 0.1
Source: HDR Survey, 2013

214
Assam HDR: Managing Diversities, Achieving Human Development
Table 3A.17: Size class distribution of operational holding (percent HH)
District Marginal(< 7.5 bigha)
Small(7 to 15 bigha)
Medium(15 to 21 bigha)
Large(> 21 bigha)
Baksa 81.9 14.6 2.2 1.3Barpeta 86.9 11.7 1.0 0.4Bongaigaon 90.9 8.7 0.3 0.1Cachar 95.1 4.7 0.2 0.1Chirang 77.3 18.5 2.6 1.6Darrang 90.2 6.8 2.0 1.0Dhemaji 59.8 28.5 7.6 4.1Dhubri 93.0 5.5 1.3 0.1Dibrugarh 91.1 7.8 0.6 0.5Dima Hasao 83.2 16.8 0.0 0.0Goalpara 88.3 9.5 1.2 1.0Golaghat 76.2 19.4 2.7 1.7Hailakandi 94.3 4.7 0.5 0.6Jorhat 82.3 15.1 1.2 1.3Kamrup 91.3 7.2 0.9 0.6Kamrup (M) 85.7 10.6 1.9 1.9Karbi Anglong 75.3 19.9 3.6 1.1Karimganj 89.6 8.6 1.2 0.6Kokrajhar 51.0 29.8 15.9 3.3Lakhimpur 75.0 19.3 4.0 1.7Marigaon 86.7 11.4 0.9 1.1Nagaon 78.7 16.3 3.1 2.0Nalbari 90.9 7.4 1.3 0.5Sibsagar 86.5 12.4 0.6 0.5Sonitpur 82.5 13.1 2.5 1.8Tinsukia 86.3 11.0 1.4 1.3Udalguri 84.4 12.2 2.1 1.3Assam 84.3 12.3 2.2 1.1
Source: HDR Survey, 2013

215
Statistical Appendix
Table 3A.18: Status of Housing in Assam: Rural-Urban District Wise (percent HH)
District Rural Urban TotalKutcha Semi-
puccaPucca Kutcha Semi-
puccaPucca Kutcha Semi-
puccaPucca
Baksa 55.7 38.2 6.1 20 26.7 53.3 55.3 38.1 6.7Barpeta 35.8 44.8 19.4 11.4 33.3 55.2 33.5 43.7 22.8Bongaigaon 44.3 36.5 19.2 4.4 17.4 78.3 37.5 33.3 29.2Cachar 44.9 35.8 19.3 27.6 22.5 49.9 41.6 33.3 25.1Chirang 36.9 51.9 11.2 2.1 66.7 31.3 34.1 53.1 12.8Darrang 59.8 23.4 16.7 36.3 11.3 52.5 58.2 22.6 19.2Dhemaji 37.2 53.7 9.2 13.6 47 39.4 35.3 53.1 11.6Dhubri 40.2 47.8 12 15.1 49.3 35.6 37.5 47.9 14.5Dibrugarh 59.3 18.1 22.7 43.8 19.4 36.8 56.2 18.4 25.5Dima Hasao 69.2 29.2 1.6 19.1 28.6 52.4 53.5 29.0 17.5Goalpara 50.4 32.1 17.5 37.6 20.4 42.0 48.5 30.4 21.1Golaghat 63.9 26.8 9.3 25.4 12.7 62.0 60.1 25.4 14.5Hailakandi 65.5 20.6 14 30.3 27.3 42.4 62.9 21.0 16.1Jorhat 45.7 36.7 17.6 14.8 18.8 66.5 38.8 32.7 28.5Kamrup 57.8 24.4 17.8 27.7 32.1 40.2 54.9 25.1 20.0Kamrup (M) 44.5 27.2 28.3 8.5 18.6 73.0 13.7 19.8 66.5Karbi Anglong
83.4 9.3 7.3 53.3 19.1 27.6 79.3 10.7 10.0
Karimganj 31.5 37.2 31.4 16.1 34.2 49.7 30.0 36.9 33.1Kokrajhar 39.4 51.6 9.1 4.0 43.4 52.6 37.0 51.0 12.0Lakhimpur 46.1 39.5 14.4 48.2 34.1 17.8 46.4 38.9 14.8Marigaon 37.2 38.9 24 26.9 20.2 52.9 36.2 37.2 26.6Nagaon 47.6 36.0 16.3 25.1 33.7 41.2 44.3 35.7 20.0Nalbari 55.5 22.2 22.2 28.6 20.5 50.9 52.5 22.0 25.5Sibsagar 33.4 41 25.7 10.9 23.6 65.5 31.0 39.1 29.9Sonitpur 40.7 44.1 15.3 12.2 19.2 68.6 37.7 41.5 20.8Tinsukia 53.1 31.7 15.2 20 17 63.1 45.8 28.5 25.7Udalguri 59.5 27.1 13.4 43.4 20.8 35.9 58.7 26.8 14.5Assam 48.1 35.3 16.6 20.2 24.3 55.6 43.7 33.6 22.7
Source: HDR Survey (2013)

216
Assam HDR: Managing Diversities, Achieving Human Development
Table 3A.19: Status of Housing in Assam: Spatial Diversity, Religion wise
Kutcha Semi-pucca PuccaSpatial Diversity CategoryChar Block 53.4 35.0 11.7Flood-affected Block 42.0 35.7 22.4Hill Block 81.3 12.4 6.3Tea Garden Block 47.7 34.0 18.3Border Block 44.9 39.0 16.1Multiple-diversity Block 42.7 46.0 11.3Religious groupsHindus 39.6 33.7 26.7Muslims 51.2 33.7 15.0Christians 60.5 30.9 8.6Others 53.2 29.5 17.3
Source: HDR Survey, 2013
Table 3A.20: Deprivation in Basic Amenities: Spatial Diversity, Religion wise
Without electricity
Without Safe Drinking Water
Without Toilet
Spatial Diversity CategoryChar Block 47.1 3.9 84.6Flood-affected Block 31.8 19.7 73.1Hill Block 26.8 38.6 88Tea Garden Block 29.9 12.5 74.5Border Block 37.4 19.9 77.2Multiple-diversity Block 46.4 5.9 77.7General Block 29.7 11.7 73.4Religious groupsHindus 24.4 12.1 64.8Muslims 47.4 13.9 80.6Christians 39.2 19 77.4Others 34 11.5 76.3
Source: HDR Survey, 2013

217
Statistical Appendix
Table 3A.21: Deprivation in Basic Amenities: Rural-Urban, District wise
District HH Without electricity HH Without Toilet HH Without Drinking WaterRural Urban Total Rural Urban Total Rural Urban Total
Baksa 34.7 13.3 34.4 72.8 13.3 72.1 23.3 13.3 23.2Barpeta 43.5 5.0 39.9 71.7 28.9 67.7 1.2 1.0 1.2Bongaigaon 28.2 6.2 24.5 86.2 25.5 75.9 10.9 1.9 9.3Cachar 47.4 17.9 41.9 82.0 54.7 76.9 55.6 9.4 47.0Chirang 28.7 0.0 26.4 85.9 66.7 84.4 0.9 0.0 0.8Darrang 50.1 6.3 47.2 89.7 41.3 86.4 0.1 0.0 0.1Dhemaji 48.2 4.6 44.7 85.4 50.0 82.5 6.1 0.0 5.6Dhubri 57.0 17.3 52.8 73.6 47.8 70.8 2.0 4.7 2.3Dibrugarh 30.2 7.5 25.7 74.2 22.9 63.9 0.9 0.0 0.8Dima Hasao 30.8 1.2 21.6 86.5 29.8 68.8 63.8 0.0 43.9Goalpara 45.3 29.8 43.1 76.6 44.8 71.9 3.5 0.6 3.1Golaghat 26.6 2.1 24.1 81.5 15.5 74.9 7.2 1.4 6.6Hailakandi 79.1 10.6 74.1 83.6 28.8 79.6 55.6 33.3 53.9Jorhat 21.4 1.9 17.0 72.7 16.9 60.3 9.0 4.3 8.0Kamrup 21.3 3.3 19.5 80.8 54.4 78.2 7.2 2.2 6.7Kamrup (M) 76.6 3.1 13.8 65.7 11.8 19.7 14.0 4.6 6.0Karbi Anglong
25.6 5.9 22.9 88.1 56.6 83.8 33.6 12.5 30.7
Karimganj 43.3 25.5 41.6 79.4 37.6 75.4 39.8 32.2 39.1Kokrajhar 46.0 15.8 44.0 75.3 29.0 72.2 14.4 21.1 14.8Lakhimpur 16.4 11.9 16.0 75.7 74.8 75.6 9.1 5.9 8.8Marigaon 50.1 13.5 46.8 80.9 41.4 77.4 0.0 0.0 0.0Nagaon 14.8 3.9 13.2 73.5 33.7 67.7 8.9 0.0 7.6Nalbari 64.9 3.6 57.9 74.9 47.3 71.7 0.7 0.0 0.6Sibsagar 64.7 3.0 58.2 65.7 8.5 59.7 4.5 0.0 4.0Sonitpur 15.1 6.7 14.2 75.3 24.3 70.0 30.6 33.7 31.0Tinsukia 28.3 2.7 22.7 74.9 24.0 63.8 3.2 0.5 2.6Udalguri 0.0 11.3 0.6 79.8 47.2 78.1 7.6 1.9 7.4Assam 36.2 7.3 31.7 77.3 29.7 69.8 14.2 5.7 12.9
Source: HDR Survey (2013)

218
Assam HDR: Managing Diversities, Achieving Human Development
Table 3A.22: Proportion of Self-assessed Poor Households
District Rural Urban SC ST OBC GeNBaksa 17.5 0.2 20.4 15.6 15.2 20.9Barpeta 5.6 3.0 10.4 0.5 5.1 5.4Bongaigaon 13.1 4.8 9.0 0.6 10.6 13.3Cachar 18.0 10.3 18.5 10.1 11.4 21.2Chirang 0.6 0.2 0.6 0.6 0.3 0.6Darrang 8.1 0.3 0.5 11.3 8.1 7.5Dhemaji 28.8 5.7 23.7 27.8 28.7 22.6Dhubri 12.2 13.9 10.9 0.6 6.9 13.9Dibrugarh 6.6 0.6 5.8 14.1 4.8 4.6Dima Hasao 0.3 0.1 0.1 0.3 0.1 0.1Goalpara 3.7 2.5 5.3 0.4 2.6 3.4Golaghat 10.5 5.9 12.3 8.9 10.6 9.1Hailakandi 20.6 0.6 13.8 0.3 17.0 22.9Jorhat 9.5 3.7 9.5 6.8 10.1 8.7Kamrup 11.5 11.7 15.7 12.5 8.7 10.6Kamrup (M) 16.7 2.4 8.4 13.9 10.3 2.0Karbi Anglong 12.6 11.9 18.5 9.0 18.2 13.0Karimganj 18.7 0.6 16.6 13.1 19.0 17.0Kokrajhar 8.9 0.5 6.9 7.3 7.0 10.6Lakhimpur 8.5 0.1 2.4 7.4 9.8 4.7Marigaon 3.9 0.5 0.6 0.6 2.8 3.0Nagaon 13.7 4.8 8.0 12.6 11.5 14.9Nalbari 9.7 3.4 10.7 0.6 9.2 8.7Sibsagar 11.5 0.5 4.9 4.9 10.7 12.0Sonitpur 19.8 6.3 18.9 12.7 22.1 18.5Tinsukia 13.2 1.6 14.1 13.9 14.6 7.8Udalguri 13.6 16.5 9.7 13.2 14.2 12.9Assam 15.3 7.6 15.5 13.9 15.0 14.4
Source: HDR Survey, 2013

219
Statistical Appendix
Table 3A.23: Inequality in Living Standard (MPCE): Rural
Share of Bottom 20%
Share of upper 20%
T20/B20 Ratio
Gini Coefficient
Baksa 8.6 41.3 4.8 0.4Barpeta 9.1 40.3 4.4 0.4Bongaigaon 7.2 50.2 7.0 0.6Cachar 7.5 44.2 5.9 0.5Chirang 7.6 43.4 5.7 0.5Darrang 7.1 43.9 6.2 0.5Dhemaji 8.1 43.6 5.4 0.5Dhubri 7.8 40.2 5.2 0.5Dibrugarh 8.1 41.3 5.1 0.5Dima Hasao 9.8 33.6 3.4 0.3Goalpara 9.0 37.1 4.1 0.4Golaghat 9.3 37.9 4.1 0.4Hailakandi 7.0 45.9 6.6 0.6Jorhat 7.5 46.5 6.2 0.5Kamrup 7.3 45.7 6.2 0.5Kamrup (M) 7.5 43.2 5.8 0.5Karbi Anglong 6.9 51.0 7.4 0.6Karimganj 7.6 45.4 6.0 0.5Kokrajhar 9.6 37.4 3.9 0.4Lakhimpur 6.5 50.8 7.9 0.7Marigaon 9.6 35.7 3.7 0.4Nagaon 7.9 43.5 5.5 0.5Nalbari 7.3 44.6 6.1 0.5Sibsagar 6.0 52.0 8.7 0.7Sonitpur 4.7 67.8 14.5 0.9Tinsukia 7.3 47.6 6.5 0.6Udalguri 7.2 44.4 6.1 0.5Assam 8.0 47.5 6.0 0.5
Source: HDR Survey, 2013

220
Assam HDR: Managing Diversities, Achieving Human Development
Table 3A.24: Inequality in Living Standard (MPCE): Urban
Share of Bottom 20%
Share of upper 20%
T20/B20 Ratio
Gini Coefficient
Baksa 9.4 45.4 4.9 0.4Barpeta 6.3 42.6 6.8 0.6Bongaigaon 7.5 42.2 5.7 0.5Cachar 7.7 40.8 5.3 0.5Chirang 8.3 39.8 4.8 0.4Darrang 7.1 48.1 6.8 0.6Dhemaji 7.9 43.1 5.5 0.5Dhubri 6.9 44.6 6.4 0.6Dibrugarh 7.9 40.1 5.1 0.5Dima Hasao 8.1 39.6 4.9 0.4Goalpara 10.2 30.8 3.0 0.3Golaghat 7.2 42.6 5.9 0.5Hailakandi 12.0 28.2 2.4 0.3Jorhat 5.9 46.6 7.9 0.7Kamrup 4.2 52.8 12.7 0.8Kamrup (M) 6.7 45.3 6.7 0.6Karbi Anglong 7.3 47.3 6.5 0.6Karimganj 8.0 38.4 4.8 0.4Kokrajhar 8.8 39.3 4.5 0.4Lakhimpur 5.7 52.8 9.3 0.8Marigaon 11.0 40.9 3.7 0.4Nagaon 7.1 43.7 6.1 0.5Nalbari 4.6 44.1 9.6 0.8Sibsagar 7.2 45.3 6.3 0.5Sonitpur 6.2 42.8 6.9 0.6Tinsukia 5.7 47.2 8.3 0.7Udalguri 8.0 39.6 4.9 0.4Assam 8.7 42.5 4.9 0.5
Source: HDR Survey, 2013

221
Statistical Appendix
Table 3A.25: Chance of being Poor (Result of Logistic Regression Analysis)
Affecting Variable B-coeff exp (B) Change in Chanceof being Poor (%)
education1 year increase in formal education
-0.125 0.882 – 12
employment Typea
Cultivator 0.998 2.713 + 171 Agricultural Lab 1.596 4.933 + 393 Daily Wage Earner 1.489 4.431 + 343 Self-employed -0.169 0.844 – 16 Trade/Business -0.803 0.448 – 55 Casual Worker 0.587 1.799 + 80 Unemployed 1.552 4.723 + 372 Religionb
Muslim 0.574 1.775 + 77 Christian 0.951 2.587 + 159 Others 0.286 1.331 + 33 Spatial Diversityc
Char Block 0.403 1.496 + 50 Flood-affected Block -0.300 0.741 – 26 Hill Block 0.736 2.087 + 109 Tea Garden Block -0.174 0.841 – 16 Border Block -0.017 0.984 – 2 Multi-diversity Block 0.143 1.153 + 15
Source: HDR Survey, 2013a – Regular Salaried workers are Reference Groupb – Hindus are Reference group; c – General block is the Reference group

222
Assam HDR: Managing Diversities, Achieving Human Development
Table 3A.26: Employment and Livelihood Index (ELI)
Districts eLI RankBaksa 0.15 20Barpeta 0.27 12Bongaigaon 0.48 5Cachar 0.48 6Chirang 0.10 24Darrang 0.10 23Dhemaji 0.09 25Dhubri 0.12 22Dibrugarh 0.43 7Dima Hasao 0.27 13Goalpara 0.24 17Golaghat 0.24 16Hailakandi 0.17 19Jorhat 0.66 2Geo-spatial RegionChar Block 0.46 4Flood-affected Block 0.79 3Hill Block 0.00 7Tea Garden Block 1.00 1Border Block 0.03 6Multiple-diversity Block 0.33 5General Block 0.79 2Kamrup 0.30 10Kamrup (M) 1.00 1Karbi Anglong 0.12 21Karimganj 0.25 15Kokrajhar 0.00 27Lakhimpur 0.29 11Marigaon 0.01 26Nagaon 0.26 14Nalbari 0.59 4Sibsagar 0.63 3Sonitpur 0.40 9Tinsukia 0.43 8Udalguri 0.20 18Assam 0.34
Source: HDR Survey, 2013

223
Statistical Appendix
Table 4A.1: Percent literates (7 + years), Male-Female, Rural-Urban
District Male Female Rural Urban TotalBaksa 78.07 63.21 70.51 87.04 70.69Barpeta 87.87 77.45 81.99 91.55 82.87Bongaigaon 84.24 76.14 77.63 94.29 80.30Cachar 87.72 78.84 82.01 88.22 83.21Chirang 87.02 75.94 80.94 92.27 81.81Darrang 75.91 64.99 69.68 85.20 70.70Dhemaji 87.54 78.28 82.83 85.17 83.01Dhubri 78.16 69.16 72.78 81.99 73.78Dibrugarh 92.28 82.83 87.37 88.67 87.62Dima Hasao 90.62 80.54 81.45 96.47 85.86Goalpara 76.00 67.37 71.67 73.12 71.88Golaghat 92.74 84.68 87.56 98.90 88.72Hailakandi 86.27 75.80 80.20 93.20 81.21Jorhat 93.90 86.99 89.02 97.31 90.60Kamrup 81.96 71.70 76.16 86.27 77.04Kamrup (M) 93.78 87.21 82.26 92.50 90.69Karbi Anglong 83.66 70.44 76.92 79.92 77.35Karimganj 88.90 81.30 84.44 91.32 85.11Kokrajhar 86.55 74.22 80.37 86.17 80.73Lakhimpur 92.18 84.38 87.66 94.96 88.39Marigaon 92.72 87.79 89.98 94.03 90.34Nagaon 90.00 84.67 86.00 95.81 87.42Nalbari 90.33 80.11 84.70 90.00 85.29Sibsagar 94.98 90.06 92.47 94.11 92.63Sonitpur 81.54 70.88 74.61 92.48 76.19Tinsukia 86.97 73.92 77.60 91.16 80.40Udalguri 79.59 68.07 73.41 83.84 73.88Assam 86.72 77.56 80.81 90.75 82.26
Source: HDR Survey, Assam (2013

224
Assam HDR: Managing Diversities, Achieving Human Development
Table 4A.2: Percent literates (15 + years) Male- Female, Rural- Urban
District Male Female Rural Urban TotalBaksa 73.34 55.41 64.10 85.71 64.37Barpeta 84.56 71.17 76.75 90.36 78.15Bongaigaon 79.91 69.25 70.85 93.14 74.72Cachar 84.77 73.93 77.54 86.01 79.25Chirang 83.27 70.31 75.82 90.74 77.03Darrang 69.07 54.81 60.55 82.89 62.23Dhemaji 84.63 72.24 78.31 82.72 78.67Dhubri 71.67 58.92 63.84 77.99 65.51Dibrugarh 90.78 79.67 84.90 86.81 85.27Dima Hasao 88.75 77.18 77.39 96.00 83.17Goalpara 69.64 58.58 63.87 67.12 64.35Golaghat 91.42 81.12 84.82 98.71 86.32Hailakandi 82.49 69.24 74.55 92.03 76.06Jorhat 92.93 84.87 87.15 96.92 89.07Kamrup 78.19 65.90 70.92 84.68 72.24Kamrup (M) 92.86 85.17 78.43 91.43 89.27Karbi Anglong 79.88 63.55 71.50 75.54 72.09Karimganj 85.79 75.86 80.01 88.57 80.84Kokrajhar 83.64 68.73 76.11 83.40 76.57Lakhimpur 90.48 80.48 84.77 93.76 85.68Marigaon 90.79 84.53 87.23 92.90 87.78Nagaon 87.79 81.13 82.59 95.26 84.56Nalbari 88.81 76.50 82.10 88.08 82.76Sibsagar 93.99 88.19 90.95 93.25 91.20Sonitpur 76.98 64.00 68.18 91.41 70.45Tinsukia 84.82 69.55 73.38 90.18 77.11Udalguri 74.77 59.33 66.43 81.29 67.17Assam 83.74 72.34 76.13 89.26 78.18
Source: HDR Survey, Assam (2013

225
Statistical Appendix
Table 4A.3: Percent literates in the 7 + and 15+ age category, by Social Category
District 7+literacy 15+literacyMale Female Total Male Female Total
SC 87.85 78.63 83.36 85.31 73.83 79.72ST 86.94 76.69 81.91 84.11 71.60 77.96OBC 89.03 79.28 84.25 86.88 75.19 81.13General 84.98 76.53 80.89 81.21 70.35 75.96Assam 86.72 77.56 82.26 83.74 72.34 78.18
Source: HDR Survey, Assam (2013)
Table 4A.4: Percent literates in the 7 + and 15+ age category, by Religious Group
Religion 7+literacy 15+literacyMale Female Total Male Female Total
Hindu 89.79 80.72 85.35 87.89 77.04 82.59Muslim 80.29 70.87 75.75 73.91 83.62 67.69Christian 83.91 73.51 78.83 79.88 66.55 73.36Buddhist 81.56 72.14 77.01 76.54 66.67 71.56Sikh 96.00 89.74 93.26 95.00 88.89 92.11Others 88.89 76.83 83.43 95.00 88.89 92.11Assam 86.72 77.56 82.26 87.34 70.77 78.18
Source: HDR Survey, Assam (2013)
Table 4A.5: Percent Literates in the 7 + and 15+ age category, by Spatial Diversity
Diversity Category
7+literacy 15+literacyMale Female Total Male Female Total
Char 79.30 70.28 74.96 73.24 61.01 67.37Flood Affected 89.38 82.43 86.01 87.10 78.63 82.97Hills 84.01 70.65 77.68 80.23 64.02 72.51Tea Garden 87.87 77.03 82.54 85.27 72.31 78.85Border 85.75 75.96 80.92 82.34 69.83 76.18Multiple Diversities
83.48 73.43 78.52 79.17 65.89 72.66
General 87.14 77.94 82.65 84.22 73.04 78.75Assam 86.72 77.56 82.26 83.74 72.34 78.18
Source: HDR Survey, Assam (2013)

226
Assam HDR: Managing Diversities, Achieving Human Development
Table 4A.6: District wise Muslim population and literacy, Hindus and Muslims
Districts %
Muslim
7+ literacy rate 15+literacy rate 15-24 literacy rateHindu Muslim Diff Hindu Muslim Diff Hindu Muslim Diff
Baksa 6.36 71.00 72.31 -1.32 64.76 65.70 -0.95 91.19 90.77 0.42Barpeta 59.71 88.87 78.41 10.45 87.07 70.21 16.85 98.26 92.84 5.41Bongaigaon 53.42 85.65 75.54 10.10 82.71 66.58 16.13 96.52 90.22 6.30Cachar 39.73 83.74 82.27 1.47 80.65 76.77 3.88 93.05 96.07 -3.02Chirang 17.45 80.52 83.80 -3.28 75.71 77.96 -2.24 94.38 86.36 8.01Darrang 70.81 83.19 65.21 17.99 80.38 52.81 27.57 96.73 82.09 14.63Dhemaji 2.20 83.08 80.72 2.36 78.85 73.33 5.52 95.21 100.00 -4.79Dhubri 74.85 82.39 70.86 11.53 78.38 60.62 17.76 95.49 84.31 11.18Dibrugarh 6.26 87.77 89.82 -2.05 85.46 88.32 -2.86 95.15 99.12 -3.96Dima Hasao 2.67 85.16 100.00 -14.84 82.06 100.00 -17.94 94.78 100.00 -5.22Goalpara 59.09 82.08 64.45 17.63 78.71 52.42 26.29 94.65 78.54 16.11Golaghat 5.35 89.17 88.86 0.32 86.97 86.09 0.88 96.59 97.33 -0.75Hailakandi 54.95 83.07 79.47 3.60 79.77 72.43 7.34 94.92 92.89 2.03Jorhat 3.60 90.79 92.79 -2.01 89.32 91.49 -2.17 97.18 97.73 -0.55Kamrup 33.11 82.46 65.78 16.67 79.31 55.67 23.64 95.00 78.25 16.75Kamrup (M) 16.34 92.57 80.62 11.95 91.51 76.99 14.51 98.18 93.75 4.43Karbi Anglong 4.21 76.96 78.14 -1.18 71.50 71.34 0.16 90.38 91.84 -1.46Karimganj 59.73 89.75 81.86 7.89 87.97 75.01 12.96 97.94 93.69 4.25Kokrajhar 24.02 82.71 71.66 11.05 79.29 66.16 13.13 98.61 92.43 6.18Lakhimpur 8.98 89.12 85.89 3.22 86.70 80.80 5.89 97.28 99.05 -1.77Marigaon 39.85 96.15 81.04 15.11 95.40 73.56 21.85 99.63 93.89 5.74Nagaon 35.75 90.82 82.23 8.59 89.23 76.14 13.09 96.86 93.52 3.34Nalbari 25.16 88.49 75.54 12.95 86.87 68.56 18.31 99.02 89.24 9.78Sibsagar 6.51 92.44 96.16 -3.73 90.97 95.40 -4.43 98.17 100.00 -1.83Sonitpur 17.04 77.56 74.15 3.41 72.74 65.15 7.59 89.59 91.53 -1.94Tinsukia 2.81 81.01 79.90 1.11 77.92 76.28 1.63 91.03 85.71 5.32Udalguri 30.85 76.46 69.00 7.46 71.57 56.87 14.70 92.78 85.24 7.54Assam 30.74 85.35 75.75 9.60 82.57 67.69 14.88 95.19 89.41 5.77
Source: HDR Survey, Assam (2013)

227
Statistical Appendix
Table 4A.7: Odds of Literacy (7+ years) of Muslims against Non-Muslims
State/District Odds Ratio Std. err. z P>z [95% Conf.
Interval]
Baksa 1.089 0.143 0.650 0.519 0.841 1.409Barpeta 0.455 0.028 -12.760 0.000 0.404 0.514Bongaigaon 0.523 0.043 -7.890 0.000 0.445 0.614Cachar 0.897 0.052 -1.880 0.060 0.801 1.005Chirang 1.182 0.169 1.170 0.242 0.893 1.564Darrang 0.390 0.031 -11.910 0.000 0.334 0.455Dhemaji 0.854 0.240 -0.560 0.574 0.491 1.483Dhubri 0.536 0.030 -11.220 0.000 0.481 0.598Dibrugarh 1.265 0.202 1.470 0.142 0.924 1.730Dima Hasao*Goalpara 0.399 0.027 -13.580 0.000 0.349 0.455Golaghat 1.015 0.182 0.080 0.936 0.714 1.442Hailakandi 0.779 0.066 -2.950 0.003 0.661 0.920Jorhat 1.349 0.355 1.140 0.255 0.805 2.261Kamrup 0.411 0.023 -16.220 0.000 0.369 0.457Kamrup (M) 0.333 0.031 -11.650 0.000 0.277 0.401Karbi Anglong 1.048 0.177 0.280 0.779 0.754 1.459Karimganj 0.524 0.039 -8.620 0.000 0.453 0.607Kokrajhar 0.497 0.040 -8.640 0.000 0.424 0.582Lakhimpur 0.782 0.109 -1.770 0.076 0.595 1.026Marigaon 0.171 0.020 -15.160 0.000 0.136 0.215Nagaon 0.507 0.025 -13.660 0.000 0.460 0.559Nalbari 0.405 0.037 -9.850 0.000 0.338 0.484Sibsagar 2.064 0.536 2.790 0.005 1.241 3.433Sonitpur 0.877 0.054 -2.120 0.034 0.777 0.990Tinsukia 0.968 0.174 -0.180 0.856 0.681 1.376Udalguri 0.701 0.051 -4.900 0.000 0.608 0.808Assam 0.552 0.007 -44.560 0.000 0.538 0.567
Source: HDR Survey, Assam (2013)*Estimates could not be provided because of small sample size of Muslims in the district

228
Assam HDR: Managing Diversities, Achieving Human Development
Table 4A.8: Levels of Education by Social Categories (in percent)
Level of education SC ST OBC General TotalInformal Schooling 2.2 2.7 2.4 2.3 2.4Below Primary 7.3 7.1 6.9 6.7 6.9Primary 26.9 20.4 21.3 24.9 23.3Middle 29.0 27.6 28.6 25.5 27.1Secondary 20.0 25.7 22.0 19.8 21.4Higher Secondary 9.3 11.4 11.5 11.2 11.1Any Diploma 0.3 0.2 0.4 0.2 0.3Graduate 4.2 4.2 5.8 7.4 6.1Post Graduate 0.6 0.5 0.7 1.2 0.9Technical Degree 0.3 0.2 0.5 0.7 0.5Total 100.0 100.0 100.0 100.0 100.0
Source: HDR Survey, Assam (2013)
Table 4A.9: Levels of Education by Religion (in percent)
Level of education Hindu Muslim Christian Buddhist Sikh Others TotalInformal Schooling 2.0 3.5 2.5 3.3 9.8 2.4Below Primary 6.1 8.9 9.6 9.9 6.6 10.9 6.9Primary 19.9 32.7 30.1 21.6 13.1 21.7 23.3Middle 27.0 27.3 28.6 24.9 29.5 17.4 27.1Secondary 23.2 16.0 19.0 20.1 24.6 19.6 21.4Higher Secondary 12.5 7.3 7.6 12.3 18.0 14.1 11.1Any Diploma 0.3 0.2 0.1 0.9 2.2 0.3Graduate 7.1 3.5 1.8 5.7 8.2 3.3 6.1Post Graduate 1.1 0.4 0.5 1.5 1.1 0.9Technical Degree 0.7 0.2 0.1 0.5Total 100.0 100.0 100.0 100.0 100.0 100.0 100.0
Source: HDR Survey, Assam (2013)
Table 4A.10: Levels of Education by Religion (in percent)
Level of education Char Flood Affected
Hills Tea Garden
Border Multiple Diversities
General Total
Informal Schooling 3.5 2.0 1.7 3.0 2.8 5.4 0.9 2.4Below Primary 8.3 5.2 6.1 9.1 7.8 9.3 6.6 6.9Primary 31.6 23.3 26.5 19.8 26.4 21.8 26.2 23.3Middle 23.7 33.7 25.3 26.6 29.6 30.1 25.3 27.1Secondary 17.3 19.7 28.3 24.6 20.0 16.1 22.6 21.4Higher Secondary 9.9 9.9 8.7 11.0 9.5 9.9 11.7 11.1Any Diploma 0.1 0.4 0.2 0.3 0.2 0.2 0.2 0.3Graduate 4.9 5.0 2.5 4.9 3.2 6.3 5.7 6.1Post Graduate 0.5 0.7 0.5 0.5 0.4 0.7 0.6 0.9Technical Degree 0.2 0.2 0.2 0.2 0.2 0.3 0.3 0.5Total 100.0 100.0 100.0 100.0 100.0 100.0 100.0 100.0
Source: HDR Survey, Assam (2013)

229
Statistical Appendix
Table 4A.11: Age group wise students currently pursuing education (in percent)
6-14 years
GPI 15-16 years
GPI 17-18 years
GPI 19-24 years
GPI
Baksa 94.21 0.92 78.01 1.00 50.00 0.74 19.71 0.68Barpeta 96.00 0.93 84.75 0.88 66.86 0.69 18.08 0.79Bongaigaon 94.72 1.03 72.28 1.32 50.00 0.63 15.72 0.43Cachar 92.91 1.00 64.43 0.88 39.95 0.78 14.89 1.08Chirang 97.93 0.76 89.15 0.77 65.35 0.63 19.10 1.20Darrang 91.83 0.89 68.98 1.04 44.89 0.61 11.22 0.62Dhemaji 95.98 1.11 85.37 0.75 60.44 0.77 20.00 0.80Dhubri 91.09 1.02 61.17 1.01 39.03 0.64 11.85 0.63Dibrugarh 95.64 0.93 80.07 0.81 60.00 1.02 16.86 0.81Dima Hasao 89.91 0.78 49.09 0.69 43.14 0.69 22.16 0.78Goalpara 94.95 0.94 76.45 0.78 39.22 0.85 14.12 0.55Golaghat 93.98 1.10 83.49 1.13 57.10 0.85 15.42 0.94Hailakandi 89.80 0.90 53.93 0.81 36.11 0.86 12.45 0.87Jorhat 94.46 0.88 80.38 0.94 63.54 0.71 21.63 0.93Kamrup 92.68 0.88 71.18 1.13 51.46 1.20 18.99 0.76Kamrup (M) 95.59 0.90 87.33 0.91 77.97 0.79 34.49 0.71Karbi Anglong 92.91 0.91 81.67 0.88 68.73 0.73 29.83 0.76Karimganj 93.39 0.97 64.11 0.88 40.85 1.11 13.04 0.87Kokrajhar 98.07 0.86 82.27 0.70 54.93 0.86 12.72 0.37Lakhimpur 96.50 1.01 86.18 0.83 63.10 0.94 17.29 0.65Marigaon 96.46 0.91 67.77 0.68 32.61 0.55 6.76 0.62Nagaon 94.40 0.94 74.33 1.02 47.96 0.83 18.61 0.86Nalbari 96.76 0.99 89.25 1.24 69.65 0.97 24.09 0.80Sibsagar 96.77 0.87 80.90 0.82 60.81 0.91 20.03 0.87Sonitpur 93.79 0.98 71.06 1.21 52.11 0.99 16.01 0.93Tinsukia 87.13 0.95 68.53 1.22 54.39 0.84 17.15 0.81Udalguri 92.01 1.03 73.42 1.09 49.52 0.65 18.10 1.15Assam 93.85 0.95 74.57 0.95 52.71 0.82 17.70 0.79
Source: HDR Survey, Assam (2013)

230
Assam HDR: Managing Diversities, Achieving Human Development
Table 4A.12: Age group wise students currently pursuing education by social groups
Social Groups 6-14 years
GPI 15-16 years
GPI 17-18 years
GPI 19-24 years
GPI
SC 94.54 0.96 75.27 0.89 45.68 0.97 15.31 0.81ST 94.99 0.95 81.40 0.92 61.00 0.81 22.57 0.87OBC 93.48 0.95 75.92 0.95 55.21 0.81 16.83 0.81General 93.60 0.95 71.42 0.98 49.76 0.81 17.08 0.73Assam 93.85 0.95 74.57 0.95 52.71 0.82 17.70 0.79
Source: HDR Survey, Assam (2013)
Table 4A.13: Age group wise students currently pursuing education by spatial diversity (in percent)
Diversity 6-14 years
GPI 15-16 years
GPI 17-18 years
GPI 19-24 years
GPI
Char 93.33 0.95 57.49 0.85 41.32 0.93 11.62 0.62Flood Affected 94.67 0.89 66.81 0.86 50.43 0.85 16.17 1.01Hills 92.09 0.86 68.86 0.79 61.57 0.83 24.15 0.69Tea Garden 91.85 0.91 65.36 0.94 51.11 1.03 14.26 0.85Border 93.97 0.99 65.31 0.91 49.05 0.94 15.63 0.79Multiple Diversities
91.39 1.02 63.80 0.81 47.41 0.84 14.37 0.73
General 95.70 0.92 70.94 1.11 57.66 0.86 17.78 0.92Assam 93.85 0.95 74.57 0.95 52.71 0.82 17.70 0.79
Source: HDR Survey, Assam (2013)
Table 4A.14: Age group wise students currently pursuing education by religion (in percent)
Religion 6-14 years
GPI 15-16 years
GPI 17-18 years
GPI 19-24 years
GPI
Hindu 94.46 0.96 79.41 0.96 59.22 0.83 20.66 0.83Muslim 93.10 0.94 65.77 0.94 37.84 0.77 10.38 0.61Christian 93.11 0.94 72.26 0.87 56.54 0.90 19.28 0.69Buddhist 87.58 0.68 68.57 1.67 41.67 1.14 17.57 1.60Sikh 100.00 0.30 100.00 75.00 0.50 25.00 0.50Others 93.02 0.90 85.71 0.50 70.00 0.75 40.00 1.50Assam 93.85 0.95 74.57 0.95 52.71 0.82 17.70 0.79
Source: HDR Survey, Assam (2013)

231
Statistical Appendix
Tab
le 4
A.1
5: Chi
ldre
n w
ho a
re o
ut o
f sc
hool
, M
ale
-Fem
ale
and
Rur
al-
Urb
an
(in p
erce
nt)
Dis
tric
tN
ever
enr
olle
dLe
ft a
fter
enr
olm
ent (
drop
outs
)en
rolle
d bu
t do
not g
o to
sch
ool
Mal
eFe
mal
eRu
ral
Urb
anTo
tal
Mal
eFe
mal
eRu
ral
Urb
anTo
tal
Mal
eFe
mal
eRu
ral
Urb
anTo
tal
Baks
a10
.85
6.98
17.8
317
.83
47.2
931
.01
78.2
978
.29
0.78
2.33
3.10
3.10
Barp
eta
13.2
113
.21
26.4
226
.42
47.1
723
.90
70.4
40.
6371
.07
1.26
1.26
2.52
2.52
Bong
aiga
on7.
964.
4212
.39
12.3
957
.52
23.8
971
.68
9.73
81.4
21.
773.
545.
315.
31Ca
char
4.44
11.9
415
.28
1.11
16.3
939
.44
38.8
966
.11
12.2
278
.33
2.22
2.50
4.17
0.56
4.72
Chira
ng14
.29
7.14
21.4
321
.43
39.2
928
.57
67.8
667
.86
3.57
7.14
10.7
110
.71
Dar
rang
20.2
110
.88
31.0
931
.09
46.1
120
.21
61.6
64.
6666
.32
1.04
1.55
2.59
2.59
Dhe
maj
i8.
968.
9613
.43
4.48
17.9
143
.28
32.8
471
.64
4.48
76.1
24.
481.
495.
975.
97D
hubr
i18
.25
12.3
029
.17
1.39
30.5
652
.58
13.6
958
.93
7.34
66.2
72.
380.
602.
982.
98D
ibru
garh
5.26
6.02
10.5
30.
7511
.28
43.6
138
.35
77.4
44.
5181
.95
2.26
4.51
6.77
6.77
Dim
a H
asao
4.00
2.00
6.00
6.00
52.0
042
.00
84.0
010
.00
94.0
0G
oalp
ara
17.8
86.
6216
.56
7.95
24.5
043
.05
30.4
657
.62
15.8
973
.51
0.66
0.66
1.32
1.32
Gol
agha
t6.
565.
7412
.30
12.3
040
.98
31.9
768
.03
4.92
72.9
58.
206.
5613
.93
0.82
14.7
5H
aila
kand
i6.
547.
9414
.49
14.4
947
.20
35.0
579
.91
2.34
82.2
41.
870.
932.
802.
80Jo
rhat
7.25
11.5
917
.39
1.45
18.8
439
.13
31.8
863
.77
7.25
71.0
12.
907.
2510
.14
10.1
4Ka
mru
p22
.11
16.5
838
.19
0.50
38.6
938
.19
18.0
950
.25
6.03
56.2
84.
520.
505.
035.
03Ka
mru
p (M
)6.
154.
626.
154.
6210
.77
50.7
732
.31
36.9
246
.15
83.0
86.
154.
621.
546.
15Ka
rbi A
nglo
ng10
.00
18.1
827
.27
0.91
28.1
847
.27
23.6
463
.64
7.27
70.9
10.
910.
910.
91Ka
rimga
nj2.
985.
308.
288.
2847
.02
40.0
781
.13
5.96
87.0
91.
323.
314.
644.
64Ko
kraj
har
8.11
6.76
14.8
614
.86
39.1
944
.59
83.7
883
.78
1.35
1.35
1.35
Lakh
impu
r7.
6110
.87
18.4
818
.48
46.7
429
.35
70.6
55.
4376
.09
2.17
2.17
2.17
Mar
igao
n4.
462.
687.
147.
1457
.14
35.7
184
.82
8.04
92.8
6N
agao
n11
.17
9.54
20.1
60.
5420
.71
42.2
325
.61
58.8
68.
9967
.85
7.63
3.81
10.6
30.
8211
.44
Nal
bari
20.0
015
.56
33.3
32.
2235
.56
35.5
622
.22
46.6
711
.11
57.7
84.
444.
444.
44Si
bsag
ar11
.11
6.17
17.2
817
.28
41.9
838
.27
74.0
76.
1780
.25
2.47
2.47
2.47
Soni
tpur
9.59
15.8
924
.66
0.82
25.4
836
.44
30.1
464
.11
2.47
66.5
85.
212.
747.
957.
95Ti
nsuk
ia13
.50
19.2
931
.51
1.29
32.8
035
.05
31.5
161
.74
4.82
66.5
60.
320.
320.
640.
64U
dalg
uri
18.4
810
.87
29.3
529
.35
36.9
631
.52
67.9
30.
5468
.48
1.63
0.54
2.17
2.17
Assa
m11
.31
10.7
621
.14
0.93
22.0
743
.88
29.1
866
.41
6.65
73.0
62.
721.
914.
480.
154.
63

232
Assam HDR: Managing Diversities, Achieving Human Development
Table 4A.16: Children who are out of school by spatial diversity (in percent)
District Never enrolled Left after enrolment (dropouts)
enrolled but do not go to school
Char 33.21 62.35 4.20Flood Affected 23.63 70.02 6.13Hills 22.60 76.71 0.68Tea Garden 23.89 70.20 5.91Border 15.97 78.99 4.71Multiple Diversities 29.95 67.15 2.90General 14.58 78.33 6.46Group Total 22.07 73.06 4.63
Source: HDR Survey, Assam (2013)
Table 4A.17: Children who are out of school by social category (in percent)
Social Category Never enrolled Left after enrolment (dropouts)
enrolled but do not go to school
SC 15.92 78.77 5.31ST 18.54 76.82 4.64OBC 21.41 73.18 5.41General 24.36 71.52 4.12
Source: HDR Survey, Assam (2013)
Table 4A.18: Children who are out of school by religion (in percent)
Religion Never enrolled Left after enrolment (dropouts)
enrolled but do not go to school
Hindu 20.46 74.92 4.62Muslim 24.03 71.46 4.52Christian 19.50 72.96 7.55Buddhist 32.14 67.86Others 33.33 66.67Total 22.12 73.23 4.64
Source: HDR Survey, Assam (2013)

233
Statistical Appendix
Tab
le 4
A.1
9: Re
aso
ns f
or d
rop
pin
g o
ut o
f sc
hool
: M
ale
-Fem
ale
, A
ssam
(per
cent
of
child
ren)
Dis
tric
tW
ork
at h
ome
Nee
d to
sup
port
ear
ning
Faile
d in
exa
mCa
nnot
aff
ord
Not
inte
rest
ed in
stu
dies
Mal
eFe
mal
eTo
tal
Mal
eFe
mal
eTo
tal
Mal
eFe
mal
eTo
tal
Mal
eFe
mal
eTo
tal
Mal
eFe
mal
eTo
tal
Baks
a3.
813.
817.
6220
.95
6.67
27.6
25.
7110
.48
16.1
93.
813.
817.
6221
.90
11.4
333
.33
Barp
eta
5.22
4.35
9.57
26.0
96.
9633
.04
4.35
3.48
7.83
1.74
0.87
2.61
22.6
110
.43
33.0
4Bo
ngai
gaon
4.08
12.2
416
.33
43.8
89.
1853
.06
6.12
2.04
8.16
2.04
2.04
14.2
96.
1220
.41
Cach
ar3.
3713
.13
16.5
020
.54
6.73
27.2
74.
715.
7210
.44
6.73
12.7
919
.53
11.7
87.
7419
.53
Chira
ng4.
554.
5518
.18
9.09
27.2
722
.73
22.7
345
.45
Dar
rang
24.2
49.
0933
.33
12.1
23.
7915
.91
6.82
1.52
8.33
3.79
5.30
9.09
18.9
410
.61
29.5
5D
hem
aji
23.6
41.
8225
.45
3.64
3.64
7.27
10.9
19.
0920
.00
10.9
112
.73
23.6
4D
hubr
i2.
583.
446.
0236
.96
3.15
40.1
13.
440.
864.
3010
.89
2.87
13.7
523
.21
7.16
30.3
7D
ibru
garh
6.03
6.03
29.3
119
.83
49.1
47.
765.
1712
.93
1.72
1.72
3.45
12.9
312
.07
25.0
0D
ima
Has
ao36
.17
19.1
555
.32
2.13
2.13
12.7
723
.40
36.1
7G
oalp
ara
1.77
4.42
6.19
28.3
221
.24
49.5
610
.62
6.19
16.8
117
.70
9.73
27.4
3G
olag
hat
0.94
0.94
1.89
16.9
812
.26
29.2
57.
555.
6613
.21
2.83
2.83
27.3
619
.81
47.1
7H
aila
kand
i1.
702.
273.
9825
.00
5.68
30.6
82.
844.
557.
3919
.32
17.0
536
.36
5.11
3.41
8.52
Jorh
at3.
578.
9312
.50
14.2
912
.50
26.7
95.
365.
3610
.71
25.0
019
.64
44.6
4Ka
mru
p10
.08
3.36
13.4
514
.29
6.72
21.0
115
.97
10.9
226
.89
4.20
0.84
5.04
21.8
54.
2026
.05
Kam
rup
(M)
10.5
310
.53
14.0
48.
7722
.81
12.2
88.
7721
.05
8.77
5.26
14.0
415
.79
10.5
326
.32
Karb
i Ang
long
5.13
3.85
8.97
35.9
08.
9744
.87
1.28
2.56
3.85
1.28
1.28
2.56
17.9
511
.54
29.4
9Ka
rimga
nj1.
813.
255.
0526
.71
2.89
29.6
06.
147.
2213
.36
1.81
8.66
10.4
714
.08
15.8
829
.96
Kokr
ajha
r1.
593.
174.
7625
.40
19.0
544
.44
1.59
12.7
014
.29
1.59
1.59
15.8
715
.87
31.7
5La
khim
pur
1.39
1.39
6.94
2.78
9.72
1.39
1.39
2.78
2.78
50.0
026
.39
76.3
9M
arig
aon
0.98
2.94
3.92
39.2
215
.69
54.9
01.
960.
982.
943.
923.
9217
.65
13.7
331
.37
Nag
aon
4.12
2.41
6.53
22.6
811
.00
33.6
84.
474.
819.
281.
030.
691.
7224
.40
13.0
637
.46
Nal
bari
3.57
3.57
14.2
97.
1421
.43
17.8
67.
1425
.00
25.0
017
.86
42.8
6Si
bsag
ar4.
629.
2313
.85
30.7
715
.38
46.1
51.
544.
626.
156.
153.
089.
2310
.77
6.15
16.9
2So
nitp
ur2.
217.
019.
2314
.39
5.54
19.9
34.
803.
698.
494.
434.
809.
2326
.57
17.3
443
.91
Tins
ukia
3.35
9.57
12.9
218
.18
7.18
25.3
65.
744.
3110
.05
2.39
5.26
7.66
19.6
215
.31
34.9
3U
dalg
uri
2.31
2.31
16.1
58.
4624
.62
13.0
816
.15
29.2
324
.62
13.0
837
.69
Assa
m3.
665.
218.
8823
.87
8.23
32.0
95.
645.
0410
.68
4.34
4.62
8.96
19.4
412
.06
31.5
0
Sour
ce: H
DR
Surv
ey, A
ssam
(201
3)

234
Assam HDR: Managing Diversities, Achieving Human Development
Tab
le 4
A.2
0: Re
aso
ns f
or d
rop
pin
g o
ut o
f sc
hool
: Rur
al-
Urb
an, A
ssam
(per
cent
chi
ldre
n)
Dis
tric
tW
ork
at h
ome
Nee
d to
sup
port
ear
ning
Faile
d in
exa
mCa
nnot
aff
ord
Not
inte
rest
ed in
stu
dies
Rura
lU
rban
Tota
lRu
ral
Urb
anTo
tal
Rura
lU
rban
Tota
lRu
ral
Urb
anTo
tal
Rura
lU
rban
Tota
lBa
ksa
7.62
7.62
27.6
227
.62
16.1
916
.19
7.62
7.62
33.3
333
.33
Barp
eta
8.70
0.87
9.57
33.0
433
.04
7.83
7.83
2.61
2.61
33.0
433
.04
Bong
aiga
on15
.31
1.02
16.3
347
.96
5.10
53.0
68.
168.
161.
021.
022.
0416
.33
1.35
20.4
1
Cach
ar16
.16
0.34
16.5
023
.23
4.04
27.2
76.
064.
3810
.44
17.8
51.
6819
.53
14.8
163
.64
19.5
3Ch
irang
4.55
4.55
27.2
727
.27
45.4
545
.45
Dar
rang
33.3
333
.33
12.8
83.
0315
.91
8.33
8.33
8.33
0.76
9.09
26.5
27.
2729
.55
Dhe
maj
i20
.00
5.45
25.4
57.
277.
2720
.00
20.0
023
.64
23.6
4
Dhu
bri
5.73
6.02
37.8
22.
2940
.11
3.72
0.57
4.30
12.6
11.
1513
.75
24.6
417
.24
30.3
7
Dib
ruga
rh6.
036.
0347
.41
1.72
49.1
412
.07
0.86
12.9
32.
590.
863.
4523
.28
4.26
25.0
0
Dim
a H
asao
44.6
810
.64
55.3
22.
132.
1336
.17
36.1
7
Goa
lpar
a6.
196.
1937
.17
12.3
949
.56
11.5
05.
3116
.81
23.8
93.
7727
.43
Gol
agha
t1.
891.
8922
.64
6.60
29.2
513
.21
13.2
12.
832.
8347
.17
47.1
7
Hai
laka
ndi
3.98
3.98
30.6
830
.68
7.39
7.39
34.0
92.
2736
.36
7.95
1.79
8.52
Jorh
at12
.50
12.5
023
.21
3.57
26.7
910
.71
10.7
139
.29
2.52
44.6
4
Kam
rup
13.4
513
.45
18.4
92.
5221
.01
24.3
72.
5226
.89
4.20
0.84
5.04
21.8
58.
7726
.05
Kam
rup
(M)
8.77
1.75
10.5
37.
0215
.79
22.8
17.
0214
.04
21.0
55.
268.
7714
.04
15.7
97.
6926
.32
Karb
i Ang
long
7.69
1.28
8.97
41.0
33.
8544
.87
3.85
3.85
2.56
2.56
26.9
20.
7229
.49
Karim
ganj
5.05
5.05
28.1
61.
4429
.60
12.2
71.
0813
.36
10.1
10.
3610
.47
26.3
515
.87
29.9
6
Kokr
ajha
r4.
764.
7644
.44
44.4
414
.29
14.2
91.
591.
5931
.75
31.7
5
Lakh
impu
r1.
391.
398.
331.
399.
721.
391.
392.
782.
7870
.83
3.92
76.3
9M
arig
aon
3.92
3.92
50.9
83.
9254
.90
2.94
2.94
3.92
3.92
26.4
71.
7231
.37
Nag
aon
6.53
6.53
29.9
03.
7833
.68
7.56
1.72
9.28
1.37
0.34
1.72
31.6
260
.71
37.4
6N
alba
ri3.
573.
5710
.71
10.7
121
.43
25.0
025
.00
35.7
13.
0842
.86
Sibs
agar
13.8
513
.85
41.5
44.
6246
.15
6.15
6.15
9.23
9.23
15.3
80.
3716
.92
Soni
tpur
8.86
0.37
9.23
19.1
90.
7419
.93
8.49
8.49
9.23
9.23
42.0
72.
3943
.91
Tins
ukia
12.9
212
.92
22.9
72.
3925
.36
8.61
1.44
10.0
57.
180.
487.
6632
.06
4.62
34.9
3U
dalg
uri
2.31
2.31
24.6
224
.62
29.2
329
.23
36.9
20.
0337
.69
Ass
am8.
680.
208.
8828
.99
3.10
32.0
99.
441.
2410
.68
8.20
0.76
8.96
28.2
33.
2731
.50
Sour
ce: H
DR
Surv
ey, A
ssam
(201
3)

235
Statistical Appendix
Table 4A.21: Reasons for dropping out of school: Rural diversities, Assam (percent)
Diversity Work at home
Need to support earning
School too far
Failed in exam
Cannot afford
Not interested in studies
Ill health
Char 13.51 35.83 2.81 8.07 4.13 29.83 1.13Flood Affected 5.85 30.41 2.63 18.13 13.45 24.56 2.34Hills 5.36 47.32 4.46 2.68 0.89 33.93 0.89Tea Garden 12.10 29.00 1.25 8.54 7.47 34.70 2.67Border 7.96 29.74 3.73 11.39 10.18 31.55 1.61Multiple Diversities 8.97 27.93 3.10 6.90 17.59 29.66 2.41General 9.11 34.98 1.23 11.33 6.90 31.28 1.23Assam 8.88 32.09 2.51 10.68 8.96 31.50 1.72
Source: HDR Survey, Assam (2013)
Table 4A.22: Reasons for dropping out of school: religion wise, Assam (percent)
Religion Work at home
Need to support earning
School too far
Failed in exam
Cannot afford
Not interested in studies
Got married
Ill health
Hindu 8.40 31.31 1.69 11.78 7.26 33.28 2.24 2.03Muslim 9.69 33.16 3.57 9.63 11.03 28.44 2.17 3.28Christian 6.25 28.91 1.56 7.81 7.81 43.75 0.78 1.65Buddhist 5.56 44.44 5.56 11.11 33.33 1.37 Assam 8.88 32.09 2.51 10.68 8.96 31.50
Source: HDR Survey, Assam (2013)
Table 4A.23: Reasons for dropping out of school: social category wise, Assam
Category Work at home
Need to support earning
School too far
Failed in exam
Cannot afford
Not interested in studies
Got married
Ill health
SC 8.35 36.71 2.28 11.39 6.33 30.38 1.27 2.03ST 6.28 29.78 2.73 9.84 7.38 35.25 3.83 3.28OBC 8.46 30.86 1.55 12.28 8.26 33.85 2.06 1.65General 9.73 32.22 3.02 9.84 10.23 29.74 2.09 1.37 Assam 8.88 32.09 2.51 10.68 8.96 31.50 2.17 1.72
Source: HDR Survey, Assam (2013)

236
Assam HDR: Managing Diversities, Achieving Human Development
Table 4A.24: Availability of Schooling Facilities (Primary and Upper Primary)
District Total No. of habitations
Primary (in percent) Upper Primary (in percent)Within
HabitationWithin 1 KM
Beyond 1 KM
Within Habitation
Within 3 KM
Beyond 3 KM
Barpeta 2808 54.84 36.43 8.73 26.21 62.46 11.32Baska 2875 40.49 30.64 28.87 15.72 27.76 56.52Bongaigaon 1373 52.22 33.94 13.84 29.50 49.82 20.68Cachar 3114 53.05 33.43 13.52 14.55 53.31 32.15Chirang 1157 69.23 16.16 14.61 17.55 25.84 56.61Darrang 2089 36.86 43.13 20.01 10.63 66.54 22.83Dhemaji 2698 52.15 34.51 13.34 34.43 46.07 19.50Dhubri 2771 52.29 34.75 12.96 29.56 46.08 24.36Dibrugarh 2937 54.00 37.08 8.92 28.80 52.37 18.83Goalpara 2503 50.66 36.64 12.70 20.42 61.77 17.82Golaghat 2635 44.97 35.37 19.66 17.08 60.95 21.97Hailakandi 1482 54.12 37.38 8.50 26.92 60.32 12.75Jorhat 3464 51.27 42.09 6.64 18.42 69.40 12.18Kamrup 5675 46.73 43.82 9.44 19.88 58.68 21.44Karbi Anglong 3608 38.25 38.89 22.87 11.14 50.11 38.75Karimganj 2060 59.56 29.85 10.58 15.49 69.90 14.61Kokrajhar 2259 64.67 29.08 6.24 16.56 63.66 19.79Lakhimpur 3011 53.54 43.21 3.25 25.34 68.65 6.01Marigaon 1683 57.34 25.01 17.65 24.78 45.22 30.01Nagaon 6133 38.55 47.43 14.02 12.13 66.77 21.10Nalbari 2158 41.52 36.05 22.43 34.38 40.18 25.44N C Hills 660 98.48 0.45 1.06 17.88 27.58 54.55Sibsagar 4244 50.19 48.21 1.60 15.10 81.20 3.70Sonitpur 3341 32.09 43.94 23.97 8.11 58.28 33.61Tinsukia 2223 36.48 44.80 18.71 9.04 67.12 23.84Udalguri 2088 49.04 32.52 18.44 32.33 40.76 26.92Assam 71049 48.36 38.15 27.89 19.50 57.45 23.05India 1307519 58.35 31.67 9.98 28.69 56.73 14.58
Source: 8th All India School Education Survey, 2009

237
Statistical Appendix
Tab
le 4
A.2
5: Re
por
ted S
choo
l faci
litie
s
Dis
tric
tSc
hool
s ha
ving
(in
perc
ent)
Sepa
rate
Cla
ss ro
omSu
ffici
ent D
esk/
Benc
hel
ectr
icit
yD
rink
ing
Wat
erG
irls
' Toi
let
Boun
dary
Wal
lG
ovt.
Pvt.
Tota
lG
ovt.
Pvt.
Tota
lG
ovt.
Pvt.
Tota
lG
ovt.
Pvt.
Tota
lG
ovt.
Pvt.
Tota
lG
ovt.
Pvt.
Tota
lBa
ksa
72.2
98.2
77.3
95.0
98.2
95.6
30.6
81.2
40.5
94.5
95.9
94.8
58.5
85.3
63.8
14.6
81.8
27.8
Barp
eta
91.7
100.
092
.592
.310
0.0
93.0
13.2
62.0
17.9
93.9
98.4
94.4
73.4
85.6
74.6
9.6
45.5
13.1
Bong
aiga
on89
.797
.991
.087
.094
.488
.232
.787
.342
.596
.595
.196
.237
.081
.044
.911
.985
.925
.2Ca
char
75.4
97.3
79.3
85.9
97.9
88.1
20.9
69.8
29.7
69.8
86.7
72.8
53.9
86.4
59.7
15.4
57.4
23.0
Chira
ng97
.810
0.0
97.8
94.9
100.
095
.128
.972
.230
.498
.810
0.0
98.8
83.9
83.3
83.9
47.6
94.4
49.2
Dar
rang
65.7
97.8
68.5
64.3
95.6
67.1
13.5
68.9
18.4
98.9
100.
099
.064
.666
.764
.88.
932
.211
.0D
hem
aji
71.7
94.1
77.0
89.8
92.9
90.4
17.6
49.7
25.1
89.5
94.7
90.7
65.3
80.5
68.8
15.1
52.7
23.9
Dhu
bri
93.3
98.8
93.6
77.2
96.3
78.4
42.8
68.1
44.5
96.1
95.1
96.0
45.4
66.9
46.8
19.5
49.1
21.4
Dib
ruga
rh98
.299
.198
.495
.097
.895
.651
.192
.259
.798
.599
.198
.777
.491
.080
.251
.583
.258
.1D
ima
Has
ao79
.110
0.0
81.1
94.2
100.
094
.75.
894
.414
.281
.450
.078
.49.
983
.316
.83.
583
.311
.1G
oalp
ara
99.1
100.
099
.296
.110
0.0
96.3
26.2
75.5
28.9
98.0
100.
098
.195
.194
.395
.033
.590
.636
.6G
olag
hat
95.3
99.0
96.2
97.8
99.0
98.1
27.3
74.4
38.6
95.6
96.6
95.8
95.6
96.1
95.7
20.2
56.7
29.0
Hai
laka
ndi
77.6
96.0
80.5
95.6
93.7
95.3
10.4
38.9
15.0
62.3
63.5
62.5
43.1
60.3
45.8
9.5
23.0
11.7
Jorh
at89
.599
.391
.398
.610
0.0
98.9
57.8
93.4
64.5
97.4
98.7
97.7
74.3
92.1
77.6
48.2
80.9
54.3
Kam
rup
86.8
99.3
88.2
88.9
100.
090
.223
.983
.631
.197
.198
.097
.260
.387
.063
.516
.459
.621
.7Ka
mru
p (M
)93
.499
.296
.792
.910
0.0
96.9
78.2
99.6
90.2
94.0
99.2
96.9
62.2
90.3
78.0
60.6
96.9
81.0
Karb
i Ang
long
97.0
100.
097
.693
.296
.393
.834
.783
.144
.996
.997
.497
.072
.095
.277
.021
.770
.932
.1Ka
rimga
nj74
.594
.277
.780
.593
.482
.533
.870
.039
.985
.880
.984
.853
.163
.054
.713
.436
.217
.2Ko
kraj
har
92.9
98.8
93.5
82.7
98.8
84.3
17.7
96.3
25.5
94.0
97.5
94.4
52.9
91.4
56.7
24.3
95.1
31.3
Lakh
impu
r84
.799
.286
.696
.210
0.0
96.7
19.7
68.6
26.0
88.7
95.0
89.6
81.2
90.1
82.3
13.5
50.4
18.2
Mar
igao
n75
.910
0.0
76.4
89.2
100.
089
.532
.295
.033
.698
.710
0.0
98.7
63.1
95.0
63.8
38.9
90.0
40.0
Nag
aon
94.0
99.6
94.6
96.4
99.6
96.8
63.4
96.6
67.0
96.3
99.3
96.6
60.3
93.2
64.0
33.6
80.5
38.8
Nal
bari
95.7
98.8
96.5
95.7
97.1
96.1
44.2
79.0
53.2
99.4
98.8
99.2
87.9
84.2
87.0
47.7
60.8
51.1
Sibs
agar
76.0
100.
080
.696
.598
.997
.053
.693
.961
.299
.099
.599
.157
.787
.363
.342
.966
.947
.5So
nitp
ur89
.298
.990
.690
.898
.992
.032
.083
.039
.497
.497
.197
.362
.279
.464
.716
.360
.322
.7Ti
nsuk
ia99
.010
0.0
99.3
89.7
98.8
91.8
41.6
92.9
53.9
97.9
98.4
98.0
86.0
94.9
88.1
46.4
89.8
56.8
Uda
lgur
i90
.497
.291
.296
.495
.396
.322
.278
.528
.897
.895
.397
.563
.587
.966
.329
.468
.234
.0As
sam
87.3
98.5
89.0
89.6
97.9
90.9
33.5
80.9
40.8
93.2
94.9
93.5
63.9
85.2
67.2
24.6
67.7
31.3
Sour
ce: H
DR
Surv
ey, A
ssam
(201
3)

238
Assam HDR: Managing Diversities, Achieving Human Development
Table 4A.26: Reported teacher behaviour towards child at school, by school type (percent)
School type Discrimination(By Race/Religion/
Caste/Gender)
Beaten by
teacher
Punished for
homework
Punished for
absence
Praised for performance
Teacher busy with
MDM and not taking class
Government Aided
5.8 10.9 25.8 27.2 46.7 4.9
Private 4.9 10.0 32.3 30.7 61.4 3.5School run by NGO
4.0 2.0 14.0 34.0 64.0 2.0
Government Madrassa
1.4 6.8 56.8 8.1 64.9 8.1
Private Madrassa
9.6 19.2 32.7 21.2 55.8 1.9
Cannot Say 0.0 0.0 16.7 16.7 33.3 0.0Total 5.7 10.7 26.9 27.7 49.0 4.7
Source: HDR Survey, Assam (2013)
Table 4A.27: 6-14 year olds currently studying (in percent)
District Government schools* Private Schools
Rural Urban Male Female Total Rural Urban Male Female Total
Baksa 81.3 40.0 48.6 51.4 81.1 18.7 60.0 64.3 35.7 18.9
Barpeta 92.2 69.6 51.5 48.5 91.0 7.8 30.4 55.5 44.5 9.0
Bongaigaon 89.9 34.3 48.3 51.7 82.5 10.1 65.7 60.0 40.0 17.5
Cachar 84.0 74.7 49.5 50.5 82.5 16.0 25.3 54.2 45.8 17.5
Chirang 96.2 100.0 56.7 43.3 96.4 3.8 0.0 55.6 44.4 3.6
Darrang 92.2 60.0 52.6 47.4 91.2 7.8 40.0 58.6 41.4 8.8
Dhemaji 79.2 56.8 46.0 54.0 77.7 20.8 43.2 54.7 45.3 22.3
Dhubri 94.7 83.9 49.1 50.9 93.8 5.3 16.1 61.8 38.2 6.2
Dibrugarh 83.3 65.4 51.8 48.2 80.2 16.7 34.6 52.9 47.1 19.8
Dima Hasao 98.7 63.4 57.0 43.0 91.0 1.4 36.6 58.8 41.2 9.0
Goalpara 96.1 85.2 51.4 48.6 94.6 3.9 14.8 52.9 47.1 5.4
Golaghat 79.0 55.0 47.8 52.2 76.6 21.0 45.0 57.1 42.9 23.4
Hailakandi 84.9 57.1 51.4 48.6 83.6 15.1 42.9 65.9 34.2 16.4
Jorhat 89.3 42.2 53.4 46.6 81.6 10.7 57.8 56.6 43.5 18.4
Kamrup 89.6 72.3 50.9 49.1 88.7 10.4 27.7 55.7 44.3 11.4
Kamrup (M) 85.3 34.7 48.8 51.2 45.3 14.7 65.4 55.4 44.6 54.8
Karbi Anglong 83.8 59.1 50.4 49.6 80.1 16.2 40.9 60.0 40.0 19.9
Karimganj 84.3 75.7 48.8 51.2 83.4 15.7 24.3 57.9 42.1 16.6
Kokrajhar 90.8 78.1 54.7 45.3 90.1 9.2 22.0 45.0 55.0 9.9
Lakhimpur 89.5 68.3 49.2 50.8 87.1 10.5 31.7 56.0 44.0 12.9
Marigaon 98.3 95.3 52.8 47.2 98.1 1.7 4.7 64.7 35.3 1.9
Nagaon 91.5 74.5 52.0 48.0 89.3 8.6 25.5 53.8 46.2 10.7
Nalbari 79.5 54.3 47.6 52.4 76.6 20.5 45.7 54.2 45.8 23.4
Sibsagar 84.9 44.4 50.7 49.3 81.2 15.1 56.1 61.1 39.0 18.8
Sonitpur 88.6 52.0 49.7 50.3 86.6 11.4 48.0 59.8 40.2 13.4
Tinsukia 83.2 47.1 51.0 49.0 77.0 16.8 53.5 54.2 45.8 23.0
Udalguri 89.4 72.0 50.1 49.9 88.9 10.6 28.0 45.9 54.1 11.1
Assam 88.6 60.2 50.6 49.4 85.3 11.4 39.9 56.6 43.4 14.7
Source: HDR Survey, Assam (2013);Note: *Government schools include Government Madrassa

239
Statistical Appendix
Table 4A.28: Children (6-14 years) currently in schools by various categories (percent)
Government schools Private schools TotalReligionHindu 80.96 19.04 100.00Muslim 91.46 8.54 100.00Christian 83.94 16.06 100.00Buddhist 84.31 15.69 100.00Sikh 50.00 50.00 100.00Others 74.36 25.64 100.00Social categoriesSC 89.29 10.71 100.00ST 84.91 15.09 100.00OBC 81.78 18.22 100.00General 85.83 14.17 100.00Diversity groupsChar 93.52 6.48 100.00Flood Affected 86.78 13.22 100.00Hills 85.30 14.70 100.00Tea Garden 86.14 13.86 100.00Border 86.78 13.22 100.00Multiple Diversities 87.48 12.52 100.00General 86.65 13.35 100.00
Source: HDR Survey, Assam (2013)

240
Assam HDR: Managing Diversities, Achieving Human Development
Table 4A.29: Reported reasons for going to private schools (in percent)
District GoodInfrastructure
Quality Teachers
Regular Classes
Student Care
extra Activity
Others
Baksa 40.91 30.52 21.43 3.25 0.65 3.25Barpeta 25.43 5.20 11.56 53.76 1.73 2.31Bongaigaon 28.89 19.26 22.22 22.22 2.22 5.19Cachar 35.48 39.35 7.74 9.35 2.90 5.16Chirang 22.22 61.11 5.56 11.11Darrang 27.59 1.15 18.39 47.13 4.60 1.15Dhemaji 20.67 35.33 18.00 12.67 9.33 4.00Dhubri 25.66 4.61 22.37 23.03 10.53 13.82Dibrugarh 24.76 8.57 15.24 50.00 0.48 0.95Dima Hasao 58.82 23.53 17.65Goalpara 17.65 31.37 15.69 31.37 3.92Golaghat 38.62 13.23 12.70 34.39 1.06Hailakandi 32.52 23.58 34.96 8.94Jorhat 36.55 16.55 12.41 33.10 1.38Kamrup 38.93 11.45 19.85 24.43 2.29 3.05Kamrup (M) 35.36 11.71 6.98 40.77 2.48 2.70Karbi Anglong 35.88 30.59 23.53 5.88 4.12Karimganj 19.58 43.33 17.08 5.00 3.75 11.25Kokrajhar 46.25 33.75 5.00 5.00 8.75 1.25Lakhimpur 35.34 49.14 3.45 1.72 10.34Marigaon 76.47 17.65 5.88Nagaon 39.44 8.37 6.37 41.04 2.39 2.39Nalbari 33.10 0.70 6.34 56.34 3.52Sibsagar 59.30 19.19 8.14 7.56 0.58 5.23Sonitpur 20.48 17.67 28.51 20.88 4.42 8.03Tinsukia 26.69 24.15 17.80 27.12 2.54 1.69Udalguri 32.65 13.27 25.51 23.47 5.10Assam 32.37 20.59 14.86 25.05 2.75 4.41
Source: HDR Survey, Assam (2013)

241
Statistical Appendix
Table 4A.30: Perception about quality of education received by child (in percent)
District Name Satisfied Indifferent Dissatisfied Don’t Know TotalBaksa 55.2 13.8 0.7 30.3 100Barpeta 44.5 20.0 0.7 34.8 100Bongaigaon 58.1 18.5 1.3 22.1 100Cachar 48.7 12.8 0.7 37.8 100Chirang 72.6 11.3 0.5 15.6 100Darrang 41.5 13.2 0.9 44.3 100Dhemaji 66.7 12.6 1.3 19.3 100Dhubri 43.8 13.8 2.4 40.0 100Dibrugarh 70.3 14.1 0.2 15.4 100Dima Hasao 48.0 4.8 0.0 47.2 100Goalpara 76.4 1.1 0.0 22.5 100Golaghat 43.1 8.8 0.4 47.6 100Hailakandi 36.2 33.7 7.4 22.7 100Jorhat 63.6 14.1 2.3 20.0 100Kamrup 58.1 5.6 0.2 36.1 100Kamrup M 59.7 9.4 0.4 30.5 100Karbi Anglong 36.3 23.1 1.4 39.1 100Karimganj 54.4 15.8 2.7 27.0 100Kokrajhar 37.8 16.8 1.9 43.4 100Lakhimpur 55.1 14.9 2.3 27.7 100Morigaon 10.9 57.5 0.3 31.3 100Nagaon 48.1 16.3 1.7 33.9 100Nalbari 48.5 24.9 1.2 25.4 100Sibsagar 65.6 13.4 0.8 20.1 100Sonitpur 47.9 10.5 1.0 40.6 100Tinsukia 53.2 15.1 1.2 30.5 100Udalguri 42.0 23.4 0.5 34.1 100All 51.1 15.7 1.3 31.9 100
Source: HDR Survey, Assam (2013)

242
Assam HDR: Managing Diversities, Achieving Human Development
Table 6A.1: Sex Ratio in Assam and its Districts (2001-2011)
District/State 2001 2011 2013*Baksa NA 974 970Barpeta 941 953 930Bongaigaon 945 966 953Cachar 945 959 1013Chirang NA 969 887Darrang 943 954 921Dhemaji 936 953 946Dhubri 944 953 948Dibrugarh 923 961 975Dima Hasao 883 932 877Goalpara 955 964 922Golaghat 945 964 994Hailakandi 933 951 936Jorhat 903 962 923Kamrup 894 949 938Kamrup (M) NA 936 886Karbi Anglong 992 951 925Karimganj 944 963 970Kokrajhar 945 959 882Lakhimpur 952 968 938Marigaon 945 967 932Nagaon 939 962 940Nalbari 937 949 968Sibsagar 926 954 922Sonitpur 942 956 1000Tinsukia 909 952 1012Udalguri NA 973 982Assam 932 958 950India 933 943 –
Source: Census of India 2001, 2011. *HDR Survey (2013)Note: NA- Not Available

243
Statistical Appendix
Table 6A.2: Child Sex Ratios (0-6 years) in Assam and its Districts (2001-2011)
District/State 2001 2011 2013*Total Rural Urban Total Rural Urban Total Rural Urban
Baksa NA NA NA 966 966 949 853 860 500Barpeta 964 964 949 961 961 965 986 1008 650Bongaigaon 978 981 945 969 973 933 990 928 1696Cachar 956 957 951 954 954 952 905 913 861Chirang NA NA NA 968 969 961 864 868 800Darrang 974 975 954 969 970 932 969 960 1231Dhemaji 957 958 954 950 951 930 886 908 609Dhubri 984 986 956 968 971 935 951 962 796Dibrugarh 954 959 918 962 968 931 990 1052 726Dima Hasao 951 942 981 967 966 969 579 815 NAGoalpara 975 973 1004 963 963 960 979 970 1051Golaghat 965 966 953 964 968 948 1000 1007 920Hailakandi 903 900 959 954 954 963 947 935 1500Jorhat 901 895 932 964 968 948 1004 934 1586Kamrup 939 959 888 967 968 944 1093 1093 1095Kamrup (M) NA NA NA 946 980 936 907 902 908Karbi Anglong
973 975 953 959 962 932 1030 1015 1156
Karimganj 979 980 940 969 970 962 847 854 744Kokrajhar 955 955 941 954 954 947 735 730 1000Lakhimpur 962 965 921 959 961 933 884 885 867Morigaon 965 966 934 956 957 937 935 928 1059Nagaon 981 982 967 964 964 961 948 935 1078Nalbari 962 963 917 967 968 958 914 952 583Sivasagar 966 970 914 960 962 944 1010 1033 750Sonitpur 983 984 957 966 966 959 949 940 1083Tinsukia 964 971 922 960 967 917 1017 998 1167Udalguri NA NA NA 973 972 994 989 1000 571Assam 965 967 943 962 964 944 947 948 932India 927 934 906 914 919 902
Source: Census of India 2001, 2011 *HDR Survey (2013)Note: NA- Not Available

244
Assam HDR: Managing Diversities, Achieving Human Development
Table 6A.3: Percent of married women in 15-19 years and district share
District Percent married women Share of districtBaksa 13.6 2.88Barpeta 17.2 5.51Bongaigaon 20.3 3.75Cachar 11.8 4.63Chirang 17.8 1.92Darrang 20.6 3.27Dhemaji 21.0 3.27Dhubri 29.2 11.18Dibrugarh 9.2 2.72Dima Hasao 10.6 0.56Goalpara 22.1 4.55Golaghat 9.7 2.88Hailakandi 17.6 3.27Jorhat 8.5 1.92Kamrup 15.3 4.79Kamrup (M) 6.5 1.28Karbi Anglong 10.1 2.32Karimganj 17.1 5.67Kokrajhar 10.5 2.00Lakhimpur 12.3 2.80Marigaon 12.1 1.76Nagaon 18.1 11.18Nalbari 7.4 1.36Sibsagar 10.8 2.48Sonitpur 13.1 6.47Tinsukia 11.6 3.83Udalguri 9.2 1.76Assam 14.6 100.00
Source: HDR Survey (2013)

245
Statistical Appendix
Table 6A.4: Gender Inequality Index (GII) for Districts
District Rate of Institutional
Delivery
LFPR Male LFPRFemale
AdolescentFertility
Rate*
Percent Male with
above Secondary schooling
Percent Female
with above Secondary schooling
Gender Inequality
Index
Baksa 63.3 58.7 11.5 0.020 59.20 40.80 0.394
Barpeta 61.5 56.6 11.6 0.016 61.53 38.47 0.412Bongaigaon 37.7 56.4 11.4 0.015 56.54 43.46 0.437Cachar 51.2 54.6 15.7 0.033 52.44 47.56 0.303Chirang 72.8 56.3 12.3 0.016 60.61 39.39 0.390Darrang 29.3 57.4 9.5 0.016 64.25 35.75 0.498Dhemaji 62.5 55.9 10.8 0.018 57.37 42.63 0.399Dhubri 28.3 57.1 7.5 0.010 67.20 32.80 0.566Dibrugarh 81.9 62.5 25.7 0.023 58.02 41.98 0.271Dima Hasao 28.9 66.4 26.6 0.032 65.40 34.60 0.354Goalpara 62.5 59.0 11.3 0.013 62.58 37.42 0.438Golaghat 59.4 61.1 17.7 0.019 57.89 42.11 0.348Hailakandi 40.6 55.3 12.9 0.021 60.14 39.86 0.402Jorhat 53.1 62.2 19.5 0.021 57.99 42.01 0.340Kamrup 69.2 60.4 11.6 0.022 57.98 42.02 0.379Kamrup (M) 81.0 61.9 14.8 0.022 57.47 42.53 0.337Karbi Anglong 23.9 56.7 16.3 0.020 62.94 37.06 0.428Karimganj 31.7 54.4 11.5 0.023 58.44 41.56 0.420Kokrajhar 55.7 63.4 13.6 0.018 65.48 34.52 0.424Lakhimpur 79.9 59.4 17.8 0.015 59.73 40.27 0.348Marigaon 71.0 60.7 9.8 0.015 57.64 42.36 0.427Nagaon 62.1 57.6 13.2 0.017 57.40 42.60 0.383Nalbari 65.9 59.7 10.9 0.022 58.44 41.56 0.392Sibsagar 81.7 60.7 16.7 0.022 54.86 45.14 0.311Sonitpur 64.3 59.1 20.3 0.019 56.79 43.21 0.318Tinsukia 68.1 59.0 24.4 0.019 55.31 44.69 0.290Udalguri 69.0 58.4 12.2 0.016 60.34 39.66 0.397Assam 56.4 58.6 14.7 0.018 58.45 41.55 0.375
Source: HDR Survey (2013) except * based on F series data from Census 2001

246
Assam HDR: Managing Diversities, Achieving Human Development
Table 6A.5: Gender Development Index (GDI) for Districts
Part 1 District IMR
MIMR
FeYS M
eYF F
MeS M
MeS F
Wage M
Wage F
eA M
eA F
Baksa 53 48 11.74 12.02 5.48 3.50 3727 3633 90.5 9.5Barpeta 51 34 12.18 12.43 7.30 5.29 5081 2198 86.0 14.0Bongaigaon 47 48 11.61 12.34 7.00 5.40 6511 5050 89.0 11.0Cachar 52 54 11.53 11.27 6.92 5.62 5904 3765 86.6 13.4Chirang 57 35 12.56 12.57 6.72 4.85 3979 2018 83.4 16.6Darrang 69 71 11.06 11.88 4.59 2.87 3497 3137 90.7 9.3Dhemaji 37 37 12.17 12.37 7.42 5.46 3239 3919 88.8 11.2Dhubri 67 70 10.70 12.06 5.08 3.51 4046 3291 91.6 8.4Dibrugarh 51 51 12.10 12.07 7.90 6.22 5127 3679 79.5 20.5Dima Hasao 50 58 11.01 10.97 8.23 6.05 4599 2916 80.0 20.0Goalpara 53 53 11.70 12.09 5.43 3.82 5235 5299 90.8 9.2Golaghat 55 57 12.04 12.25 7.27 5.74 3447 3591 82.9 17.1Hailakandi 56 48 10.87 11.11 6.28 4.60 4135 2938 86.8 13.2Jorhat 48 52 12.47 12.35 8.73 7.22 7735 6167 82.7 17.3Kamrup 41 38 11.66 12.17 6.54 4.84 5168 5654 90.5 9.5Kamrup (M) 41 38 12.31 12.54 9.88 8.35 12980 12264 86.4 13.6Karbi Anglong
51 70 12.07 12.21 6.34 4.21 4844 4406 84.3 15.7
Karimganj 61 69 11.34 11.41 6.36 4.97 5000 3755 90.6 9.4Kokrajhar 78 71 12.35 12.15 6.27 3.99 2659 2380 90.1 9.9Lakhimpur 43 53 12.19 12.39 7.42 5.68 4997 3545 83.5 16.5Marigaon 65 60 11.83 12.15 7.21 5.82 3638 3881 93.7 6.3Nagaon 60 63 11.86 12.22 7.19 6.05 5396 4545 86.3 13.7Nalbari 58 58 12.34 12.62 8.24 6.17 6359 7650 89.8 10.2Sibsagar 54 59 12.37 12.41 9.05 7.79 7695 7768 84.2 15.8Sonitpur 60 63 11.48 11.56 5.95 4.34 5520 5396 80.0 20.0Tinsukia 50 50 11.18 11.12 6.75 5.04 5048 2683 74.6 25.4Udalguri 69 71 11.22 11.59 5.92 3.85 4125 3161 87.4 12.6Assam 55 56 11.72 11.99 6.97 5.32 5343 4495 86.0 14.0
Source: HDR Survey (2013) Expect *IMR from Annual Health Survey, 2013-14IMR: Infant Mortality RateEYS: Expected Years of SchoolingMYS: Mean Years of SchoolingWage: Share in Wage BillEA: Economically Active Population (i.e. those who are working)

247
Statistical Appendix
Table 6A.5: Gender Development Index (GDI) for Districts
Part 2District Female
Shareof Wage
MaleShare
of Wage
MalePopulation
FemalePopulation
HDI ofFemale
HDI ofMale
GenderDevelopment
IndexBaksa 0.093 0.907 2792 2708 0.523 0.639 0.820Barpeta 0.066 0.934 5300 4927 0.568 0.686 0.828Bongaigaon 0.087 0.913 2363 2251 0.581 0.703 0.827Cachar 0.090 0.910 5148 5217 0.535 0.673 0.796Chirang 0.092 0.908 1503 1333 0.615 0.651 0.945Darrang 0.084 0.916 2830 2607 0.406 0.531 0.765Dhemaji 0.132 0.868 2241 2121 0.631 0.731 0.863Dhubri 0.069 0.931 6116 5799 0.382 0.543 0.704Dibrugarh 0.156 0.844 3997 3896 0.631 0.690 0.914Dima Hasao 0.137 0.863 699 613 0.588 0.692 0.850Goalpara 0.093 0.907 3024 2789 0.538 0.649 0.829Golaghat 0.177 0.823 3418 3399 0.594 0.652 0.912Hailakandi 0.098 0.902 2312 2163 0.520 0.615 0.845Jorhat 0.143 0.857 3437 3172 0.684 0.749 0.913Kamrup 0.104 0.896 4586 4303 0.624 0.718 0.868Kamrup (M) 0.130 0.870 3760 3333 0.805 0.824 0.977Karbi Anglong 0.145 0.855 2990 2765 0.507 0.672 0.754Karimganj 0.072 0.928 3947 3830 0.414 0.606 0.683Kokrajhar 0.089 0.911 2636 2326 0.428 0.493 0.869Lakhimpur 0.123 0.877 3213 3015 0.591 0.722 0.818Marigaon 0.067 0.933 2644 2463 0.443 0.590 0.752Nagaon 0.118 0.882 8827 8294 0.555 0.640 0.868Nalbari 0.120 0.880 2342 2268 0.593 0.672 0.883Sibsagar 0.159 0.841 3668 3382 0.659 0.716 0.920Sonitpur 0.196 0.804 5716 5716 0.578 0.621 0.930Tinsukia 0.153 0.847 4162 4214 0.607 0.672 0.902Udalguri 0.099 0.901 2490 2446 0.442 0.555 0.795Assam 0.121 0.879 96161 91350 0.578 0.661 0.875
Source: HDR Survey (2013)

248
Assam HDR: Managing Diversities, Achieving Human Development
Table 6A.6: Crimes reported to be committed against women in Assam: 2001 (No.)
District Rape Kidnapping & Abduction
Dowry deaths
Assault with intent to outrage modesty
Cruelty by husband
& his relatives
Total
Barpeta 28 88 10 29 95 250Bongaigaon 20 21 1 22 26 90Cachar 45 74 7 80 216 422Darrang 48 47 9 56 37 197Dhemaji 42 20 26 88Dhubri 43 51 5 49 111 259Dibrugarh 35 37 3 41 19 135Goalpara 35 35 1 54 64 189Golaghat 30 40 23 26 119Guwahati City 37 64 5 67 98 271Hailakandi 24 34 2 27 28 115Jorhat 42 28 2 44 48 164Kamrup 21 65 2 42 27 157Karbi Anglong 5 15 4 5 8 37Karimganj 33 8 1 9 30 81Kokrajhar 14 12 37 20 83Lakhimpur 64 62 22 93 241Morigaon 23 37 6 28 94Dima Hasao 2 4 2 7 15Nagaon 51 109 1 117 132 410Nalbari 30 27 3 16 15 91Sibsagar 47 64 28 139Sonitpur 53 80 1 43 99 276Tinsukia 41 48 2 9 21 121Total 817 1070 59 854 1258 4058
Source: ncrb.nic.in/CD-CII2012/Statistics2012.pdf accessed on 21.12.2014

249
Statistical Appendix
Table 6A.7: Crimes reported to be committed against women in Assam: 2005 (No.)
District Rape Kidnapping & Abduction
Dowry deaths
Assault with intent to outrage modesty
Cruelty by husband
& his relatives
Total
Baksa 9 15 8 8 40Barpeta 56 66 8 25 105 260Bongaigaon 38 28 3 15 66 150Cachar 51 99 4 165 334 653Chirang 17 16 7 6 16 62Darrang 47 30 4 65 45 191Dhemaji 52 20 4 31 67 174Dhubri 101 63 10 56 201 431Dibrugarh 57 51 4 41 53 206Goalpara 40 69 3 2 144 258Golaghat 54 70 27 91 242Guwahati City 38 93 6 37 114 288Hailakandi 18 33 1 7 32 91Jorhat 29 40 40 42 151Kamrup 73 53 26 152Karbi Anglong 8 15 2 5 10 40Karimganj 28 29 9 8 71 145Kokrajhar 36 29 2 17 53 137Lakhimpur 69 110 4 34 125 342Morigaon 52 47 3 76 65 243Dima Hasao 1 8 2 1 12Nagaon 149 181 2 35 291 658Nalbari 27 29 2 39 19 116Sibsagar 38 73 2 68 81 262Sonitpur 77 106 3 2 146 334Tinsukia 42 61 10 20 16 149Udalguri 21 15 6 57 13 112Total 1238 1456 99 918 2209 5920
Source: ncrb.nic.in/CD-CII2012/Statistics2012.pdf accessed on 21.12.2014

250
Assam HDR: Managing Diversities, Achieving Human Development
Table 6A.8: Crimes reported to be committed against women in Assam: 2012
District Rape Kidnapping & Abduction
Dowry deaths
Assault with intent to outrage modesty
Cruelty by husband
& his relatives
Total
Baksa 33 50 3 4 15 105Barpeta 98 224 5 67 638 1032Bongaigaon 50 59 6 15 169 299Cachar 94 163 19 11 551 838Chirang 24 30 11 78 143Darrang 88 168 9 246 387 898Dhemaji 74 61 2 17 82 236Dhubri 159 305 13 219 729 1425Dibrugarh 50 75 138 316 579Goalpara 65 68 3 97 323 556Golaghat 60 154 1 72 226 513Guwahati City 78 326 9 90 237 740Hailakandi 56 65 6 52 125 304Jorhat 42 95 1 53 254 445Kamrup 54 107 5 70 172 408Karbi Anglong 31 62 6 33 132Karimganj 32 85 11 4 262 394Kokrajhar 27 65 3 31 86 212Lakhimpur 62 97 25 19 203Morigaon 58 88 4 25 115 290Dima Hasao 5 13 18Nagaon 173 348 10 248 875 1654Nalbari 34 89 3 83 131 340Sibsagar 78 153 5 134 269 639Sonitpur 97 220 11 39 124 491Tinsukia 64 142 1 43 137 387Udalguri 23 38 8 41 46 156Total 1716 3360 140 1845 6407 13468
Source: ncrb.nic.in/CD-CII2012/Statistics2012.pdf accessed on 21.12.2014

251
Statistical Appendix
Table 8A.1: Rural-Urban Head Counts as per Level of Overall Satisfactions (in percent)
Level of overall satisfaction in life TotalIntensively dissatisfied
Moderately dissatisfied
Neither satisfied
nor dissatisfied
Moderately satisfied
Intensively satisfied
Rural 0.34 25.43 19.36 51.61 3.27 100.00Urban 0.19 17.99 17.11 61.32 3.37 100.00Assam 0.32 24.27 19.01 53.13 3.28 100.00
Source: HDR Survey (2013)
Table 8A.2: Male-Female Head Counts as per Level of Overall Satisfactions (in percent)
Level of overall satisfaction in life TotalIntensively dissatisfied
Moderately dissatisfied
Neither satisfied
nor dissatisfied
Moderately satisfied
Intensively satisfied
Male 0.20 23.42 18.99 53.96 3.42 100.00Female 0.52 25.82 19.04 51.60 3.03 100.00Assam 0.32 24.27 19.01 53.13 3.28 100.00
Source: HDR Survey (2013)
Table 8A.3: Social Category wise Head Counts of Overall Satisfactions (in percent)
Level of overall satisfaction in life TotalIntensively dissatisfied
Moderately dissatisfied
Neither satisfied
nor dissatisfied
Moderately satisfied
Intensively satisfied
SC 0.28 24.13 19.34 54.03 2.22 100.00ST 0.36 30.88 18.40 48.19 2.16 100.00OBC 0.19 22.69 18.56 55.58 2.98 100.00General 0.39 23.21 19.40 52.95 4.05 100.00Assam 0.32 24.27 19.01 53.13 3.28 100.00
Source: HDR Survey (2013)

252
Assam HDR: Managing Diversities, Achieving Human Development
Table 8A.4: Religion wise Head Counts of Overall Satisfactions (in percent)
Level of overall satisfaction in life TotalIntensively dissatisfied
Moderately dissatisfied
Neither satisfied
nor dissatisfied
Moderately satisfied
Intensively satisfied
Hindu 0.25 22.85 18.40 55.27 3.23 100.00Muslim 0.40 27.28 20.36 48.46 3.50 100.00Christian 0.69 27.30 18.48 51.00 2.53 100.00Buddhist 1.92 19.23 21.79 53.85 3.21 100.00Sikh 0.00 0.00 25.00 65.00 10.0 100.00Others 0.00 21.95 29.27 48.78 0.00 100.00Assam 0.32 24.27 19.01 53.13 3.28 100.00
Source: HDR Survey (2013)
Table 8A.5: Spatial diversity wise Head Counts of Overall Satisfactions (in percent)
Level of overall satisfaction in life TotalIntensively dissatisfied
Moderately dissatisfied
Neither satisfied
nor dissatisfied
Moderately satisfied
Intensively satisfied
Char 0.07 23.78 19.21 52.37 4.57 100.00Flood Affected
0.84 40.53 18.68 38.75 1.20 100.00
Hills 0.09 54.70 18.96 26.17 0.09 100.00Tea Garden
0.48 21.37 20.10 55.44 2.61 100.00
Border 0.41 23.07 18.96 54.99 2.58 100.00Multiple Diversities
0.08 23.69 24.19 50.68 1.36 100.00
General 0.15 18.43 17.74 56.82 6.87 100.00Assam 0.32 24.27 19.01 53.13 3.28 100.00
Source: HDR Survey (2013)

253
Statistical Appendix
Table 8A.6: Domain wise Head Counts of Satisfied People (in percent)
Domain Dissatisfied Satisfied Psychological and Emotional Domain 31.94 68.06 Health Domain 44.44 55.56 Education Domain 45.06 54.94 Cultural domain 14.87 85.13 Governance domain 76.99 23.01 Community vitality domain 37.96 62.04 Ecology Domain 14.11 85.89 Living Standard Domain 64.03 35.97
Source: HDR Survey (2013)
Table 8A.7: Spatial Diversity wise Headcounts of Satisfied People on Domains (percent)
Psyc
holo
gica
l an
d em
otio
n
Hea
lth
educ
atio
n
Cult
ure
Gov
erna
nce
Com
mun
ity
ecol
ogy
Livi
ng S
tand
ard
Ove
rall
Char 66.2 64.6 48.6 86.5 22.5 76.0 71.8 38.6 56.9Flood Affected 51.4 47.7 45.6 77.2 18.2 51.7 84.2 25.6 40.0Hills 49.2 33.5 34.9 83.9 2.6 29.4 92.7 26.8 26.3Tea Garden 64.1 56.4 62.7 85.2 27.7 56.6 90.5 28.9 58.1Border 69.3 55.5 52.5 85.7 25.8 57.4 88.8 34.8 57.6Multiple Diversities 70.9 48.1 56.1 78.4 12.8 79.2 81.3 31.7 52.0General 71.5 58.4 57.4 90.9 32.4 72.0 86.5 42.5 63.7Assam 68.1 55.6 54.9 85.1 23.0 62.0 85.9 36.0 56.4
Source: HDR Survey (2013)

254
Assam HDR: Managing Diversities, Achieving Human Development
Table 8A.8: District wise Head Counts of Overall Satisfactions (in percent)
Level of overall satisfaction in life TotalIntensively dissatisfied
Moderately dissatisfied
Neither satisfied
nor dissatisfied
Moderately satisfied
Intensively satisfied
Baksa 1.08 28.18 27.68 42.39 0.67 100.00Barpeta 0.00 19.13 14.36 53.84 12.68 100.00Bongaigaon 0.00 13.77 18.33 66.10 1.80 100.00Cachar 0.26 35.86 28.07 35.47 0.34 100.00Chirang 0.00 11.26 20.17 68.40 0.17 100.00Darrang 0.08 21.86 17.72 57.64 2.70 100.00Dhemaji 0.12 18.12 21.30 56.55 3.92 100.00Dhubri 0.15 23.39 21.67 50.65 4.13 100.00Dibrugarh 0.00 9.93 18.52 69.57 1.97 100.00Dima Hasao 0.00 12.64 33.46 52.42 1.49 100.00Goalpara 0.00 8.53 13.08 77.90 0.49 100.00Golaghat 0.00 12.77 23.50 59.92 3.81 100.00Hailakandi 0.22 29.90 22.26 46.73 0.89 100.00Jorhat 0.07 6.46 11.07 75.67 6.74 100.00Kamrup 0.21 13.79 14.94 63.43 7.63 100.00Kamrup (M) 0.11 12.92 17.02 66.01 3.94 100.00Karbi Anglong
0.09 59.44 16.20 24.08 0.18 100.00
Karimganj 0.51 28.45 19.76 49.42 1.85 100.00Kokrajhar 0.09 41.15 19.12 39.21 0.44 100.00Lakhimpur 0.00 15.08 19.32 62.29 3.30 100.00Marigaon 0.17 60.02 21.69 18.12 0.00 100.00Nagaon 0.89 29.02 13.79 52.81 3.48 100.00Nalbari 0.00 14.49 18.37 63.06 4.08 100.00Sibsagar 0.06 19.14 18.30 57.55 4.95 100.00Sonitpur 1.72 38.66 21.32 37.31 0.98 100.00Tinsukia 0.12 27.01 18.97 53.66 0.24 100.00Udalguri 0.38 23.47 20.45 49.10 6.60 100.00Assam 0.32 24.27 19.01 53.13 3.28 100.00
Source: HDR Survey (2013)

255
Statistical Appendix
Table 8A.9: District wise Headcounts of Satisfied People on Domains (percent)
Psyc
holo
gica
l an
d em
otio
n
Hea
lth
educ
atio
n
Cult
ure
Gov
erna
nce
Com
mun
ity
ecol
ogy
Livi
ng S
tand
ard
Ove
rall
Baksa 56.4 45.4 59.0 83.0 9.8 57.6 90.4 21.4 43.1Barpeta 74.6 49.3 51.7 98.9 35.4 95.4 67.8 60.5 66.5Bongaigaon 80.2 53.8 65.4 93.8 59.2 29.6 92.6 43.1 67.9Cachar 77.7 35.9 51.8 85.1 5.6 38.5 82.1 24.5 35.8Chirang 69.2 52.3 72.3 92.4 25.9 38.3 94.1 51.3 68.6Darrang 58.1 69.8 46.4 78.2 22.0 93.5 81.3 26.6 60.3Dhemaji 77.2 53.0 67.1 85.4 25.5 61.9 85.6 34.9 60.5Dhubri 77.6 53.2 39.9 83.0 25.6 77.3 79.9 31.8 54.8Dibrugarh 55.8 66.8 87.4 91.2 33.4 51.9 99.1 19.3 71.5Dima Hasao 94.8 68.4 48.3 95.5 5.2 4.8 97.8 58.0 53.9Goalpara 67.1 79.9 77.3 83.3 2.0 97.4 86.8 52.0 78.4Golaghat 78.8 57.7 51.6 83.6 31.5 78.8 85.9 45.4 63.7Hailakandi 39.3 59.8 37.8 97.6 14.8 60.4 91.3 41.9 47.6Jorhat 82.5 66.1 68.1 93.4 34.1 77.5 98.1 36.9 82.4Kamrup 81.3 63.9 62.6 93.6 20.4 78.3 90.2 46.1 71.1Kamrup (M) 85.9 62.7 73.0 87.1 15.8 54.2 96.8 45.6 70.0Karbi Anglong 44.8 29.0 35.6 79.5 3.0 34.5 90.1 24.5 24.3Karimganj 75.9 42.8 56.9 81.1 35.7 41.6 85.2 30.6 51.3Kokrajhar 54.1 57.5 20.4 86.1 6.0 42.5 97.5 32.5 39.6Lakhimpur 75.5 60.7 63.6 71.7 59.1 42.3 90.8 39.0 65.6Marigaon 24.5 44.1 26.4 93.3 6.9 31.5 64.8 23.4 18.1Nagaon 61.4 60.8 51.6 75.1 30.8 70.9 81.8 36.3 56.3Nalbari 76.5 67.1 52.6 84.9 20.6 96.1 80.0 39.4 67.1Sibsagar 74.0 50.8 68.4 87.6 17.1 71.0 88.0 41.2 62.5Sonitpur 45.8 45.0 53.0 72.9 24.5 51.9 80.3 23.7 38.3Tinsukia 73.2 58.8 50.7 84.8 11.3 49.8 97.8 28.2 53.9Udalguri 80.3 68.7 40.4 88.1 14.9 58.2 72.5 46.2 55.7Assam 68.1 55.6 54.9 85.1 23.0 62.0 85.9 36.0 56.4
Source: HDR Survey (2013)

256
Assam HDR: Managing Diversities, Achieving Human Development
Table 8A.10: Average number of domains where people are satisfied
No. of Domains in general No. of Domains only those satisfied
Baksa 4.2 5.6Barpeta 5.3 6.4Bongaigaon 5.2 6.0Cachar 4.0 5.5Chirang 5.0 5.6Darrang 4.8 5.9Dhemaji 4.9 5.9Dhubri 4.7 5.9Dibrugarh 5.0 5.7Dima Hasao 4.7 5.6Goalpara 5.5 6.0Golaghat 5.1 6.0Hailakandi 4.4 5.7Jorhat 5.6 6.0Kamrup 5.4 6.2Kamrup (M) 5.2 6.0Karbi Anglong 3.4 5.6Karimganj 4.5 5.9Kokrajhar 4.0 5.5Lakhimpur 5.0 5.9Marigaon 3.1 5.2Nagaon 4.7 6.1Nalbari 5.2 6.0Sibsagar 5.0 6.0Sonitpur 4.0 5.8Tinsukia 4.5 5.8Udalguri 4.7 5.9Assam 4.7 5.9
Source: HDR Survey (2013)
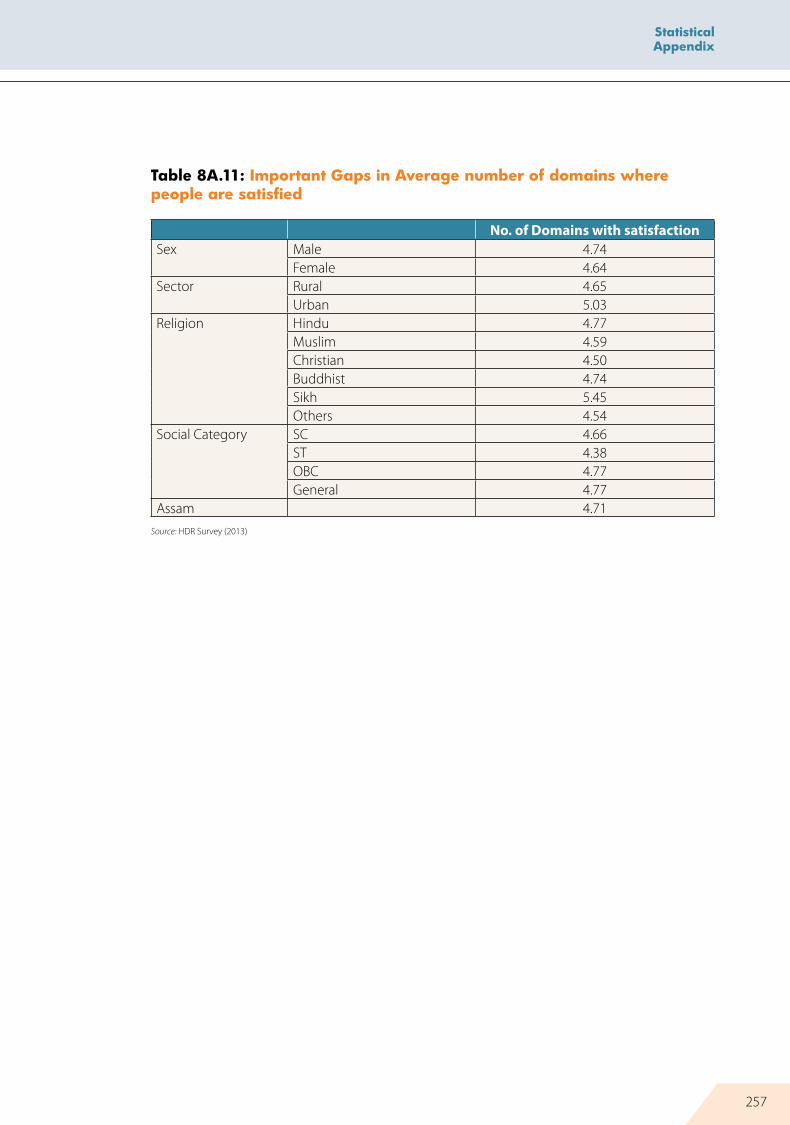
257
Statistical Appendix
Table 8A.11: Important Gaps in Average number of domains where people are satisfied
No. of Domains with satisfactionSex Male 4.74
Female 4.64Sector Rural 4.65
Urban 5.03Religion Hindu 4.77
Muslim 4.59Christian 4.50Buddhist 4.74Sikh 5.45Others 4.54
Social Category SC 4.66ST 4.38OBC 4.77General 4.77
Assam 4.71Source: HDR Survey (2013)
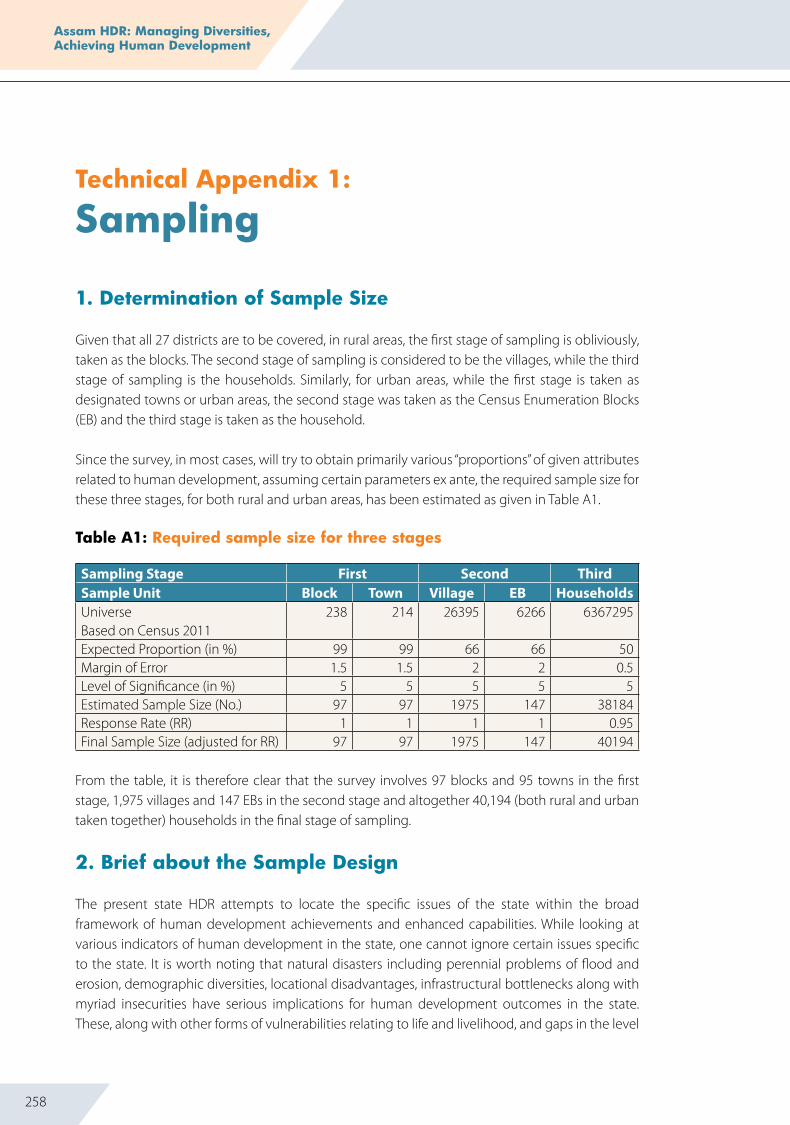
258
Assam HDR: Managing Diversities, Achieving Human Development
1. Determination of Sample Size
Given that all 27 districts are to be covered, in rural areas, the first stage of sampling is obliviously, taken as the blocks. The second stage of sampling is considered to be the villages, while the third stage of sampling is the households. Similarly, for urban areas, while the first stage is taken as designated towns or urban areas, the second stage was taken as the Census Enumeration Blocks (EB) and the third stage is taken as the household.
Since the survey, in most cases, will try to obtain primarily various “proportions” of given attributes related to human development, assuming certain parameters ex ante, the required sample size for these three stages, for both rural and urban areas, has been estimated as given in Table A1.
Table A1: Required sample size for three stages
Sampling Stage First Second ThirdSample Unit Block Town Village eB HouseholdsUniverse Based on Census 2011
238 214 26395 6266 6367295
Expected Proportion (in %) 99 99 66 66 50Margin of Error 1.5 1.5 2 2 0.5Level of Significance (in %) 5 5 5 5 5Estimated Sample Size (No.) 97 97 1975 147 38184Response Rate (RR) 1 1 1 1 0.95Final Sample Size (adjusted for RR) 97 97 1975 147 40194
From the table, it is therefore clear that the survey involves 97 blocks and 95 towns in the first stage, 1,975 villages and 147 EBs in the second stage and altogether 40,194 (both rural and urban taken together) households in the final stage of sampling.
2. Brief about the Sample Design
The present state HDR attempts to locate the specific issues of the state within the broad framework of human development achievements and enhanced capabilities. While looking at various indicators of human development in the state, one cannot ignore certain issues specific to the state. It is worth noting that natural disasters including perennial problems of flood and erosion, demographic diversities, locational disadvantages, infrastructural bottlenecks along with myriad insecurities have serious implications for human development outcomes in the state. These, along with other forms of vulnerabilities relating to life and livelihood, and gaps in the level
Technical Appendix 1:
Sampling

259
Statistical Appendix
of capabilities across diverse socio-economic and demographic groups including people living in the Char areas and tea gardens, need to be highlighted clearly in the HDR to place the overall level of human development of the state in the right perspective.
Given this overall approach and perspective, a multi-stage stratified random sampling design is followed in formulating the household survey and the sample design is briefly explained in the following paras.
The Primary Sampling Unit (PSU) being the households, which are to be sampled across all 27 district in such a way as to reflect the myriad “specificities” and “diversities” potentially impacting various indicators of human development, it is desired that all possible “specificities” and “diversities” are mapped properly. Since all 27 districts are to be covered, clearly, no sampling is needed for districts.
A district may be divided into two sectors – rural and urban. Each of these sectors has different concerns and, therefore, may be considered as a distinct sample frame. It is, thus, required that both these sample frames need to be stratified according to various “specificities” and “diversities”.
2.1 Stratification Scheme for Rural
In a district, the most appropriate sub-district (rural) unit is the development block. The blocks cover quite a substantial area and are fairly heterogeneous. However, blocks represent wide-scale geographical diversity within a district. Therefore, based on five spatial characteristics representing unique specificities with respect to human development outcomes of people therein, all blocks (in all districts) have been stratified. Five spatial characteristics used for stratification of the blocks are: hills, border (inter-state as well as international), tea garden, flood-affected and Char. The blocks without any of these five spatial characteristics have been referred to as “general blocks” and considered as “control”.
For identification of the blocks as per these spatial characteristics the Census Administrative Atlas (used 2001 version as 2011 was not published at that time, updated for BTAD configurations and geo-referenced as per Survey of India Toposheets) was used as the base. This immediately facilitated the identification of hill and border blocks. Char blocks were identified using the latest available Directory of Char Areas (2009) published by the Government of Assam. For identification of flood-prone blocks, time series flood hazard maps (1998-2007) of the National Remote Sensing Centre have been utilised. For identification of tea garden blocks, LANDSAT TM images of 30 metre resolution have been used.
After identification of blocks as per the five spatial characteristics, a simple map overlay was carried out to see the unique typologies of blocks in all districts. This resulted in 14 typologies of blocks in the state as a whole, each forming a unique stratum. These strata are referred to as the First Stage Strata (FSS). The 14 typologies are given in Table A2.

260
Assam HDR: Managing Diversities, Achieving Human Development
Table A2: Typologies of blocks
Stratum Serial No.
Diversity Type
1 Char Block2 Flood-affected Block3 Hill Block4 Tea Garden Block5 Border Block6 Flood and Char Block7 Flood and Border Block8 Flood and Tea Garden Block9 Char and Border Block10 Hill and Border Block11 Tea Garden and Border Block12 Flood, Char and Border Block13 Flood, Border and Tea Block14 General Block
This First Stage Stratification helps to capture the “spatial diversities” of a district in a much better way. For instance, if a district has 10 blocks in total, spread across say, three typologies and we need to select only three, then the entire spread can be represented by selecting one block from each of the three strata.
In the second stage, the villages of the selected block (from the first stage) were stratified according to “demographic” diversities. Accordingly, three strata were formed: (1) predominantly Scheduled Caste village with more than 50 per cent of the total population being SCs; (2) predominantly Scheduled Tribe village with more than 50 per cent of the total population belonging to STs; and (3) general villages which included all remaining villages of the block.
It may, however, be noted that due to non-availability of Census Village Directory of 2011, the Second Stage Stratification for the present survey was done on the basis of the Census Village Directory of 2001 after making necessary adjustments to district boundaries to account for changes caused due to the creation of four new districts under BTAD affecting 14 districts in total and their boundaries. These adjustments were carried out on the Census Administrative Atlas after appropriately geo-referencing according to Survey of India Top sheets.
In the third stage, households, that is, the PSUs, were stratified according to “economic” criterion. The Third Stage Stratum (TSS) refers to the MPCE category of the household which is defined based on NSSO 66th round survey on consumer expenditure for rural areas in Assam as shown in Table A3.

261
Statistical Appendix
Table A3: Third Stage Stratum consumer expenditure
MPCe (in INR) Third Stage Stratum
Category
< 610 1 Low Expenditure Households611 - 912 2 Middle Expenditure Households> 912 3 High Expenditure Households
For accomplishing the TSS, a complete house-listing of the sample village is suggested along the lines of NSSO surveys, with a pre-defined House-listing Schedule (Schedule 0) with all necessary information for stratification.
To sum up, the sampling scheme for rural areas involves three stages entailing three different stratifications, that is, spatial in the first, demographic in the second and economic in the third stage, which is assumed to reflect the various “specificities” and “diversities” of the state.
2.2 Stratification in Urban
In case of urban areas, the FSS is taken as per the civic status of the towns and their size classes to represent the “specificities/diversities” since these two aspects bear significant importance in governance and access to urban infrastructure impacting upon human development outcomes. Accordingly, like the rural areas, depending on information of Census 2011, 13 types of diversities are codified as shown in Table A4.
Table A4: Types of diversities
Serial No.
Diversity Type Stratum CodeCivic Status Size Class
1 MC I 012 MB I 023 MB II 034 MB III 045 MB IV 056 TC III 067 TC IV 078 TC V 089 TC VI 0910 CT III 1011 CT IV 1112 CT V 1213 CT VI 13
*MC= Municipal Corporation, MB=Municipal Board, TC=Town Committee CT=Census Town

262
Assam HDR: Managing Diversities, Achieving Human Development
3. Allocation of Units
At each stage, allocation was done proportionally. All selections were done at random. For selecting the households, a complete listing was carried out to apply TST over the households. Then final selection of the households was conducted at random using a fixed random number table from the listing frame. To facilitate urban listing of households, Census EB maps were used with special permission from the Registrar General of India.
The sample distribution, which thus emerged, is shown in Table A5.
Table A5: Sample distribution
District No of Sampleblocks
No ofSample
Town
TotalSample
HH
RuralSample
HH
UrbanSample
HHBAKSA 3 1 1204 1188 16BARPETA 4 4 2137 1936 201BONGAIGAON 2 2 949 788 161CACHAR 6 8 2323 1889 434CHIRANG 1 1 614 566 48DARRANG 2 1 1187 1107 80DHEMAJI 2 2 818 752 66DHUBRI 6 4 2618 2340 278DIBRUGARH 3 4 1723 1378 345DIMA HASAO 2 2 271 186 85GOALPARA 3 5 1247 1066 181GOLAGHAT 3 3 1419 1278 141HAILAKANDI 2 1 906 840 66JORHAT 3 5 1472 1148 324KAMRUP 6 7 1927 1733 194KAMRUP METRO 2 5 1833 267 1566KARBI ANGLONG 4 3 1117 965 152KARIMGANJ 3 3 1561 1412 149KOKRAJHAR 4 2 1137 1062 75LAKHIMPUR 4 2 1283 1148 135MARIGAON 3 3 1171 1067 104NAGAON 9 8 3540 3031 509NALBARI 3 5 981 869 112SIVASAGAR 4 3 1559 1394 165SONITPUR 6 4 2442 2187 255TINSUKIA 3 6 1694 1323 371UDALGURI 4 1 1061 1008 53TOTAL 97 95 40194 33928 6266
4. Sample Weight
Since the proportional allocation rule was followed at each stage, the design becomes self-weighted, thus requiring no sample weight to account for design effect.

263
Literacy and Education:Going to and Staying in School Matters
The estimation procedures followed in the report are based on UNDP’s new methodology (2010), however, with some modifications to overcome data limitations. The procedures are explained in the following paras.
1. estimation of HDI
The HDI is based on three dimensions:
Long and Healthy Life measured by life expectancy at birthKnowledge measured by mean years of schooling and expected years of schoolingStandard of Living measured by per capita annual income
Life expectancy at birth at the district level was estimated based on five-year death-age data obtained from HDR survey by using Chiang’s method. The mean years of schooling and expected years of schooling were estimated from the HDR survey data. The first is based on the number of years to complete a particular level and actual level of educational attainment of individuals obtained from the survey and the second is based on enrolment ratios. Instead of using district domestic product, the report uses directly obtained household income data from the survey.
The goal posts used for normalisation are as follow:
Indicators Minimum Maximum Life Expectancy 20 85 MYS 0 15 EYS 0 13Income 5090 119032
Only in case of EYS, the maximum is used as 13 instead of 18 since, in India, the right to education ensures 6-14 years of education; the rest are the same as UNDP’s. The income bounds are chosen from the per capita income of the states with minimum being one-third of the minimum of Bihar and the maximum is for Goa as per 2013-14 GSDP data series.
In the next step, the usual UNDP method has been applied to obtain the HDI (see HDR, UNDP, 2014).
Technical Appendix 2:
Estimation Procedures

264
Assam HDR: Managing Diversities, Achieving Human Development
2. Inequality Adjusted HDI
The method followed for IHDI is the same as the UNDP method.
3. Gender Inequality Index
The GII in the report is based on UNDP’s method, however, with a couple of changes. Since the present HDR sample size does not allow robust district level estimates of MMR, the indicator is replaced by a correlated variable rate of institutional delivery which is obtainable from the HDR survey.
Similarly, the adolescent fertility rate was estimated using 2001 Census F Series data by the Brass Method assuming fertility change to be a fairly long-term phenomenon given the fact that Census 2011 F series is not yet released.
Female participation in politics has been dropped as there is no representative data for all districts. Therefore, the GII formula was on based on the following two:
1/2
31
F F FG ID SE LFPRAFR
= × × ×
3 1M F FG SE LFPR= × × The rest of the procedures are the same as the UNDP method.
3. Gender Development Index
The GDI estimation in the report is same as that of the UNDP but with only one change. Since it requires producing HDI for both males and females, all indicators are to be segregated accordingly. This was done for all following UNDP’s procedure except for life expectancy. Due to lack of data, the male and female life expectancy at birth could not be ascertained. Therefore, the child survival ratio taken as additive inverse of IMR was considered with AHS 2013-14 data. The AHS provides IMR for only 23 districts. The data for four districts were interpolated by population weighted average of their constituent districts based on Census 2011 population figures. The rest follows the UNDP method.
4. Multi-dimensional Poverty Index
The MPI estimates in the report follow the UNDP method except a change in one indicator of health deprivations. Instead of nutrition, it uses the direct response to the question ‘whether treatment has been stopped to want of money” as a substitute. The rest of the method is as per UNDP’s method.

265
Literacy and Education:Going to and Staying in School Matters
1.1. The methodology used to measure subjective well-being in the report is largely dependent on the assumption that the variables of interest are ordinal or rarely categorical variables, which contrasts with HDI data that are predominantly cardinal. The categorical variable of interest is gender. The difference between the categorical and the ordinal variables is that ordinal data contain a clear ordering of the variables (low, medium and high). So, we can put people in the categories of dissatisfied/satisfied but also we can order the categories as low, medium and high.
1.2. The Alkire-Foster methodology is the basis of the current measurement1. In this system,
the step of identifying who falls into the category of dissatisfied/satisfied uses two forms of cut-off: one within each dimension to determine the category (dissatisfied/ satisfied) with respect to each variable in that dimension, and a second cut-off (a nominal one) that is done across dimensions. This nominal cut-off identifies dissatisfied people by ‘counting’ the dimensions in which a person is dissatisfied. The step of summarising the different statistics (nominal, ordinal, categorical) – aggregation – uses the Foster Alkire measures, appropriately adjusted (ranging from 1-5) to account for variance in dissatisfaction. The identification method is well suited for use with ordinal data, as is the first of our measures, the adjusted headcount ratio of dissatisfied persons.
1.3. Measuring “well-being” at each domain level. The two-thirds rule is applied for calculations at each of the eight domains. For example, there are 18 variables in the Psychological and Emotional domain. This means that the maximum score an individual could get in this domain is 18 (that is, if he/she scores 1 in each variable) and the minimum could be 0 (that is, if he/she scores 0 in each variable). Applying the two-thirds rule, an individual would need to score a minimum of 12 (which is two-thirds of 18) to be considered as satisfied. The domain is than recoded as “0” for “Dissatisfied” (those who scored less than 12) and “1” for “satisfied” (those who scored at least 12). Thus, the number of respondents would be distributed between a score of 0 and a score of 1. In this way, each domain will have a distribution of respondents between 0 and 1.
1.4. A Likert-type scale is used with values ranging from “strongly dissatisfied” to “strongly satisfied”, with a midpoint of “neutral”. Since we cannot be sure that the intervals between each of these (five) values are the same, then we cannot say that this is an interval variable, but we
Technical Appendix 3:
Methodology of Measuring Subjective Well-being
1 See Alkire and Foster (2009).

266
Assam HDR: Managing Diversities, Achieving Human Development
can say that it is an ordinal variable. Why does it matter that predominantly we use ordinal variables? It would not make sense to compute an average ‘dissatisfaction’. An average of a categorical variable does not make much sense because there is no intrinsic ordering of the levels of the categories. Moreover, if an attempt was made to compute the average of healthcare service experience, the result would be meaningless.
1.5. Recoding each variable: Responses for each variable were re-coded into binary categories: “1” “Satisfied”; “0” “Dissatisfied”.
1.6. “Missing Data”: variables which include responses like “Don’t know”, “Can’t say”, “Not Applicable”, were examined on a case by case basis to identify whether to assign “1” or “0” to their responses. The majority of these responses were re-coded “0” (“Dissatisfied”). Variables V26, V31, V70 and V71 were deleted from the analysis for the reason that the Not applicable responses were very large in number (which indicates a possible issue with the survey question or how it was interpreted, etc.). Variable V19 (Spirituality level) was also deleted from the analysis as it could not be clearly established from the responses whether there is any specific relationship between the level of spirituality reported in the survey and people’s well-being (that is, it is an unreliable variable for policy purposes). We have included three variables from the household schedule for the purposes of the head count. These were not specifically within any domain but we assigned them specific domains depending on the type of the variable. These variables are: Self rating on health (V100), Financial security (V101) and Family relations (V102). For the head count analysis, V100, V101 and V102 are now included in the domains on Health, Standard of Living and Community Vitality respectively.
1.7. Measuring the “level of life satisfaction” (for all domains combined): A person could score 0 in all eight domains, 0 in seven domains and 1 in one domain, 0 in six domains and 1 in two domains, 0 in five domains and 1 in three domains, and so on ….., or 1 in all eight domains. Thus, we can organise nine boxes for each of the scores ranging from 0 through 8. We can then put a person scoring 0 in each of the individual eight domains in the box marked 0, a person scoring 0 in seven domains and 1 in one domain in the box marked 1, a person scoring 0 in six domains and 1 in two domains in the box marked 2 and so on, until a person scoring 1 in all the eight domains is entered in the box marked 8. This will give a distribution of the respondents according to various levels of satisfaction. A person scoring a 1 in each of the eight domains will be considered totally satisfied with life, a person scoring 0 in each of the eight domains will be considered totally dissatisfied with life. The scores in between may be classified into moderate levels of satisfaction or dissatisfaction. As mentioned above, the individual boxes may be considered as a nine-point scale. However, for convenience, these nine individual boxes are categorised as follows:
(0= extensively dissatisfied), (1 to 3= moderately dissatisfied) (4 = neither satisfied nor dissatisfied), (5 to 7= moderately satisfied) and (8= extensively satisfied).
These categories represent an ordinal scale but not an interval scale, as the differences contained by the categories are not equal. As such, a summary index in the form of a statistical mean cannot

267
Literacy and Education:Going to and Staying in School Matters
be calculated, but a median can certainly be calculated. However, if the respondents are distributed according to individual values of 0 through 8, we can calculate the average number of domains in which a person is satisfied. This could be another summary index of life satisfaction.
Based on the distribution of the respondents according to individual values of 0 through 8 as mentioned above (that is, the number of respondents satisfied in no domain, satisfied in one domain, satisfied in two domains, and so on), a mean value of individual scores for each district is calculated to show the average number of domains in which the respondents of each district are satisfied (that is, intensity of satisfaction). This may be expressed as a percentage. The complement of this percentage would indicate the percentage of respondents who are dissatisfied, since the policy-makers should be concerned with improving the situation of the ‘dissatisfied’ group. This mean number of domains of satisfaction (or dissatisfaction) is ranked to give a comparative picture of the districts surveyed in this study. Apart from the ranking, the mean value can also be interpreted as follows: for example, a mean value of 5.8 for Jorhat will mean that, on an average, the individuals of Jorhat district are satisfied in 6 of the 8 domains.
However, we can also get a comparative picture by just comparing the combined percentages of extensively satisfied and moderately satisfied (calling it satisfied) for each district.

268
Assam HDR: Managing Diversities, Achieving Human Development
Bibliography and References
Alkire, S. (2002). Valueing Freedoms: Sen’s Capability Approach and Poverty Reduction. Oxford University Press, Oxford.
Alkire, S. (2010). Human Development: Denitions, Critiques, and Related Concepts. UNDP.
Alkire, S., & Foster, J. (2009). Counting and Multidimensional Poverty Measurement. Working Paper No 32, OPHI.
Allendorf, K. (2007). Do women’s land rights promote empowerment and child health in Nepal? World Development, 353(11), 1975–1988.
Anand, S., & Sen, A. K. (1994). Human Development: Methodology and Measurement. UNDP.
Anand, S., & Sen, A. K. (2000). The Income Component of Human Development Index. Journal of Human Development, 1(1), 83–106.
Arrow, K. J. (1951). Social Choice and Individual Values. Wilely, New York.
Ballet, J., Dubois, J., & Mahieu, F. (2007). Responsibility for Each Other’s Freedom: Agency as the Source of Collective Capability. Journal of Human Development, 8(2), 185–201.
Bhagabati, A. (2001). Biodiversity and Associated Problems in the Islands of the Brahmaputra, Assam. Geographical Review of India, 63(4).
Bhatt, C. M. et. al. (2013). Satellite images for extraction of flood disaster footprints and assessing the disaster impact: Brahmaputra floods of June–July 2012, Assam, India. Current Science, 104(12), 1692–1700.
Bloom, G., Kanjilal, B., & Peters, D. H. (2008). Regulating health care markets in India and China. Health Affairs, 27(4), 952–963.
Cahill, M. B. (2005). Is the Human Development Index Redundant? Eastern Economic Journal, 31(1), 1–5.
Chacraborty, A. (2011). Human Development: How Not to Interpret Change. Economic and Political Weekly, XLVI(51), 16–19.
Chacraborty, G. (2012). The “Ubiquitous” Bangladeshis. Economic and Political Weekly, XLVII(38).
Chowdhury, O. H. (1991). Human Development Index: A Critique. The Bangladesh Development Studies, 19(3), 125–127.
Clark, C. (1941). The Conditions of Economic Progress. London: Macmillan.
Clark, D. A. (2005a). Sen’s Capability Approach and Many Spaces of Human Well-being. Journal of Development Studies, 41(8), 1339–1368.
Clark, D. A. (2005b). The Capability Approach: Its Development, Critiques and Recent Advances. Global Poverty Research Group.

269
Literacy and Education:Going to and Staying in School Matters
Das, K. (n.d.). Constructing a human security governance index for northeast India. Human Security from Concept to Practice,. Singapore: World Scientifc.
Dean, H. (2009). Critiquing capabilities: The distraction of a beguiling concept. Critical Social Policy, 29(2).
Desai, S., & Thorat, A. (2012). Social Inequalities in Education’, India Infrastructure Report 2012. India Infrastructure Report, Routledge.
Dreze, J., & Sen, A. (1995). India: Economic Development and Social Opportunity. Oxford University Press, New Delhi.
Dreze, J., & Sen, A. (2013). An Uncertain Glory: India and Its Contradictions. London: Allen Lane.
Engelgau, M., Karan, A., & Mahal, A. (2012). The Economic impact of Non-communicable Diseases on households in India. Globalization and Health, 8(9).
Fukuda-Parr, S. (2003). Operationalizing Sen’s Ideas on Capabilities. Feminist Economics, 9(2-3), 301–317.
Gasper, D. (n.d.). Is Sen’s Capability Approach an Adequate Basis for Consiering Human Development. Reveiw of Political Economy, 14(4), 435–461.
Gaye, A., & Jha, S. (2010). A Review of Conceptual and Measurement Innovations in National and Regional Human Development Reports, 1998-2009. UNDP.
Gohain, H. (n.d.). Big Dams, Big Floods: On Predatory Development. Economic and Political Weekly, 43(30).
Guha, A. (n.d.-a). Colonisation of Assam: Second Phase 1840-1859. Indian Economic and Social History Review, 4, 289.
Guha, A. (n.d.-b). Assamese Agrarian Society in the Late Nineteenth Century: Roots, Structures and Trends. Indian Economic and Social History Review, 17, 35.
Haque, A. K. E. (2011). Environmental Valuation in South Asia. New Delhi: Cambridge.
Herrero, C. et al. (2010). Improving the Measurement of Human Development. UNDP.
Himanshu. (2011). Employment Trends in India: A Re-examination. Economic and Political Weekly, XLVI(10), 43–59.
I Ivanova. (1999). An Assessment of the Measurement Properties of the Human Development Index. Social Indicators Research, 46(2), 157–179.
Ibrahim, S. S. (2006). From Individual to Collective Capabilities: The Capability Approach as a Conceptual Framework for Self-help. Journal of Human Development, 7(3), 397–416.
Indrayan, A. et al. (1999). 3-Decade Trend in Human Development Index in India and Its Major States. Social Indicators Research, 46(1), 91–120.
Jodha, N. S. (n.d.). Common Property Resources - Contributions and Crisis. Economic and Political Weekly, (June 30), A65–A78.
Kabeer, N. (1999). Resources, Agency, Achievements: Reflections on the Measurement of Women’s Empowerment. Development and Change, 30, 435–464.

270
Assam HDR: Managing Diversities, Achieving Human Development
Kelley, A. C. (1991). The Human Development Index: “Handle with Care.” Population and Development Review,, 17(2), 315–324.
Klugman, J. et al. (2011). The HDI 2010: New Controversies, Old Critiques. UNDP.
Kovacevic, M. (2010). Measurement of Inequality in Human Development - A Reveiw. Human Development Reaserch Paper, 35, UNDP.
Kuznets, S. (1966). Modern Economic Growth. Rate, Structure, and Spread. New Haven: Yale University Press.
Kynch, J., & Sen, A. (1983). The Indian Women: Well-Being and Survival. Cambridge Journal of Economics, 7.
Lee, I. M., Shiroma, E. J., & Lobelo, F. (2012). Effect of physical inactivity on major non-communicable diseases worldwide: an analysis of burden of disease and life expectancy. The Lancet, 380(9838), 219–229.
Lind, N. C. (1992). Some Thoughts on the Human Development Index. Social Indicators Research, 27(1), 89–101.
Lind, N. C. (2004). Values Reflected in the Human Development Index. Social Indicators Research, 66(3), 283–293.
Lloyd-Sherlock, P., Beard, J., & Minicuci, N. (2014). Hypertension among older adults in low- and middle-income countries: prevalence, awareness and control. International Journal of Epidemiology.
Maddox, b. (2008). What Good is Literacy? Insights and Implications of the Capabilities Approach. Journal of Human Development, 9(2), 185–204.
Mandal, R. (2014, March). Cropping Pattern Choice and Risk Mitigation in Flood Affected Agriculture, A Study of Assam Plains, India. Working Paper No. 14-03, Department of Economics and International Business, Sam Houston State University.
Mandal, R. (n.d.). Cropping Pattern and Risks Management in the Flood Plain of Assam. Economic and Political Weekly, 45(33), 78–81.
Mazumdar, I., & Neetha, N. (2011). Gender Segregations: Employment Trends in India, 1993-94 to 2009-10. Occassional Paper No 56, Centre for Women’s Development Studies;
Moser, C. O. N. (n.d.). Gender Planning and Development: Theory, Practice and Training. London and New York: Routledge.
Nussbaum, M. (1995). Human Capabilities, Female Human Beings. Women, Culture and Development. Clarendon Press, Oxford.
Nussbaum, M. (2000). Women and Human Development: The Capability Approach. Cambridge University Press, Cambridge.
Patel, V., Chatterji, S., Chisholm, D., Ebrahim, S., Gopalakrishna, G., & Mathers, C. (2011). Chronic diseases and injuries in India. Lancet, (377), 413–428.
Phukan, A. et al. (2012). River Bank Erosion and Restoration in the Brahmaputra River in India. The Clarion, 1(1), 1–7.
271
Literacy and Education:Going to and Staying in School Matters
Qizilbash, M. (1996). Capabilites, Well-being and Human Development: A Survey. Journal of Development Studies, 33(2), 143–62.
Quisumbing, A. et. a. (2008). Helping Women Respond to the Global Food Price Crisis. Policy Brief 7. Washington, DC: International Food Policy Research Institute (IFPRI).
Ray, K. B. (1954). Flood Prevention in the Rivers of Bihar, North Bengal and Assam. The Economic Weekly, (October 9).
Reddy, V. R. (2003). Land Degradation in India: Extent, Costs and Determinants. Economic and Political Weekly, 38(44), 4700–4017.
Rigotti, J. I. R. et. al. (2013, November). A R-examination of the Expected Years of Schooling: What Can It Tell Us? Working Paper No 117, Centre for Inclusive Growth.
Robeyns, I. (2000). An Unworkable Idea or a Promising Alternative? Sen’s Capability Approach Reexamined. Discussion Paper 00.30, Centre for Economics Studies, , Kathololieke Universiteit leuven.
Robeyns, I. (2003). Sen’s Capability Approch and Gender Inequality: Selecting Relevant Capabilities. Feminist Economics, 9(2-3), 61–92.
Robeyns, I. (2005). Capability Approach: A Theoretical Survey. Journal of Human Development, 6(1), 93–114.
Robeyns, I. (2006). Three models of education. Rights, capabilities and human capital. Theory and Research in Education, 4(1), 69–84.
Saikia, A. (2011). Forest and Ecological History of Assam, 1826-2000. New Delhi: Oxford University Press.
Saito, M. (2003). Amartya Sen’s Capability Approach to Education: A Critical Exploration. Journal of Phylosophy of Education, 37(1).
Sakiko, F.-P. (2003). The Human Development Paradigm: Operationalizing Sen’s Ideas on Capabilities. Feminist Economics, 9(2-3), 301–317.
Sarmah, B. (2006). Rejuvenating Panchayati Raj; Ideology Indian State and Lessons from the Periphery. New Delhi: Akansha Publishing House.
Sen, A. (1982). Equality of What. Choice, Welfare and Measurement (p. 353). Oxford University Press, New Delhi.
Sen, A. (1985). Well-Being, Agency and Freedom: The Dewey Lectures. The Journal of Philosophy, 82(4), 169–221.
Sen, A. (1987a). Freedom of Choice: Concept and Content. WIDER Working Paper 25, The United Nations Univrsity.
Sen, A. (1987b). Commodities and Capabilities. Oxford University Press, New Delhi.
Sen, A. (1989). Development as Capability Expansion. Journal of Development Planning, 19(1), 41–58.
Sen, A. (1995). Inequlity Reexamined. Oxford University Press, New Delhi.
272
Assam HDR: Managing Diversities, Achieving Human Development
Sen, A. (1999). Capability and Well-being. The Quality of Life (2nd ed.). Oxford University Press, New Delhi.
Sen, A. (2000). Development as Freedom. Oxford University Press, New Delhi.
Sen, A. (2002a). Opportunities and Freedom. Rationality and Freedom (pp. 581–622). Oxford University Press, New Delhi.
Sen, A. (2002b). Processes, Liberty and Rights. Rationality and Freedom (pp. 623–658). Oxford University Press, New Delhi.
Sen, A. (2003). Rationality and Freedom. Oxford University Press, New Delhi.
Shiv Kumar, A. K. (1991). UNDP’s Human Development Index: A Computation for Indian States. Economic and Political Weekly, 26(41), 2343–2345.
Stewart, F. (2004). Groups and Capabilities. Paper presented at 4th Conference on Capability Approach: Enhancing Human Security, Held in University of Pavia, Italy, Sept 5-7.
Thakur, J. S., Prinja, S., Garg, C. C., Mendis, S., & Menabde, N. (2011). Social and Economic Implications of Non-communicable diseases in India. Indian Journal of Community Medicine, 36, 13–22.
Torras, M. (2006). Ecological inequality in assessing well-being: Some implications. Policy Sciences, 38(4), 205–224.
Tucker, R. P. (2011). A Forest History of India. New Delhi: Sage.
Vellakkal, S., Subramanian, S. V., Millett, C., Basu, S., & Stuckler, D. (n.d.). Socioeconomic Inequalities in Non-Communicable Diseases Prevalence in India: Disparities between Self-Reported Diagnoses and Standardized Measures. PLoS One, 8(7), 2013.
Walker, M. (2006). Towards a capability-based theory of social justice for education policy-making. Journal of Education Policy, 21(2), 163–185.
Walker, M., & Unterhalter, M. (2007). Amartya Sen’s Capability Approach and Social Justice in Education. New York: Plagrave Macmillan.
Weibe, H. (2006). River Flooding and Erosion in North East India: Exploratory Consideration of Key Issues (mimeo). North West Hydraulic Consultants, Alberta, Canada.
WHO. (n.d.). Trends in Maternal Mortality: 1990 to 2010: WHO, UNICEF, UNFPA, and the World Bank Estimates. WHO, Geneva, Switzerland.
Zambrano, E. (2011). Functionings, Capabilities and the 2010 Human Development Index. UNDP.
Zimmer, Z., Natividad, J., Lin, H. S., & Chayovan, N. (2000). A cross-national examination of the determinants of self-assessed health. Journal of Health and Social Behavior, 41(4), 465–481.

OKD Institute of Social Change and Development (www.okd.in)
Institute for Human Development (www.ihdindia.org)
