national inventory forest service and assessment …the u.s. department of agriculture (usda) forest...
TRANSCRIPT

NATIONAL INVENTORY
AND ASSESSMENT
PROCEDURE—For IdentifyingBarriers to Aquatic Organism Passageat Road-Stream Crossings Online tutorial now available at:
http://www.fs.fed.us/pnw/pep/PEP_inventory.html
United StatesDepartment ofAgriculture
Forest Service
NationalTechnology andDevelopmentProgram
7700—Transportation MgmtNovember 2005
FOREST SERVICE
DEP A R T MENT OF AGRICUL T U R
E


Kim Clarkin—Project ManagerNational Technology and Development CenterSan Dimas, CA.Anne ConnorUSDA FS Clearwater National Forest, Orofino, IDMichael J. FurnissUSDA FS Pacific Northwest Research Station, Corvallis ORBob GubernickUSDA FS Tongass National Forest, Petersburg, AKMichael LoveMichael Love and Associates, Eureka, CAKathleen MoynanUS Fish and Wildlife Service, Region 1, Portland, ORSandra WilsonMusserUSDA FS Region 6, Portland, OR
NATIONAL INVENTORY
AND ASSESSMENT
PROCEDURE—For IdentifyingBarriers to Aquatic OrganismPassage at Road-Stream Crossings
U.S. Department of Agriculture Forest ServiceNational Technology and Development Program444 E. Bonita AvenueSan Dimas, CA 91773
By:
Information contained in this document has been developed for the guidance of employees ofthe U.S. Department of Agriculture (USDA) Forest Service, its contractors, and cooperatingFederal and State agencies. The USDA Forest Service assumes no responsibility for the inter-pretation or use of this information by other than its own employees. The use of trade, firm, orcorporation names is for the information and convenience of the reader. Such use does notconstitute an official evaluation, conclusion, recommendation, endorsement, or approval of anyproduct or service to the exclusion of others that may be suitable.
The U.S. Department of Agriculture (USDA) prohibits discrimination in all its programs andactivities on the basis of race, color, national origin, age, disability, and where applicable, sex,marital status, familial status, parental status, religion, sexual orientation, genetic information,political beliefs, reprisal, or because all or part of an individual’s income is derived from anypublic assistance program. (Not all prohibited bases apply to all programs.) Persons with dis-abilities who require alternative means for communication of program information (Braille, largeprint, audiotape, etc.) should contact USDA’s TARGET Center at (202) 720–2600 (voice andTDD).
To file a complaint of discrimination, write to USDA, Director, Office of Civil Rights, Room 326-W, Whitten Building, 1400 Independence Avenue, S.W., Washington, D.C. 20250-9410, or call(800) 795–3272 (voice) or (202) 720–6382 (TDD). USDA is an equal opportunity provider andemployer.

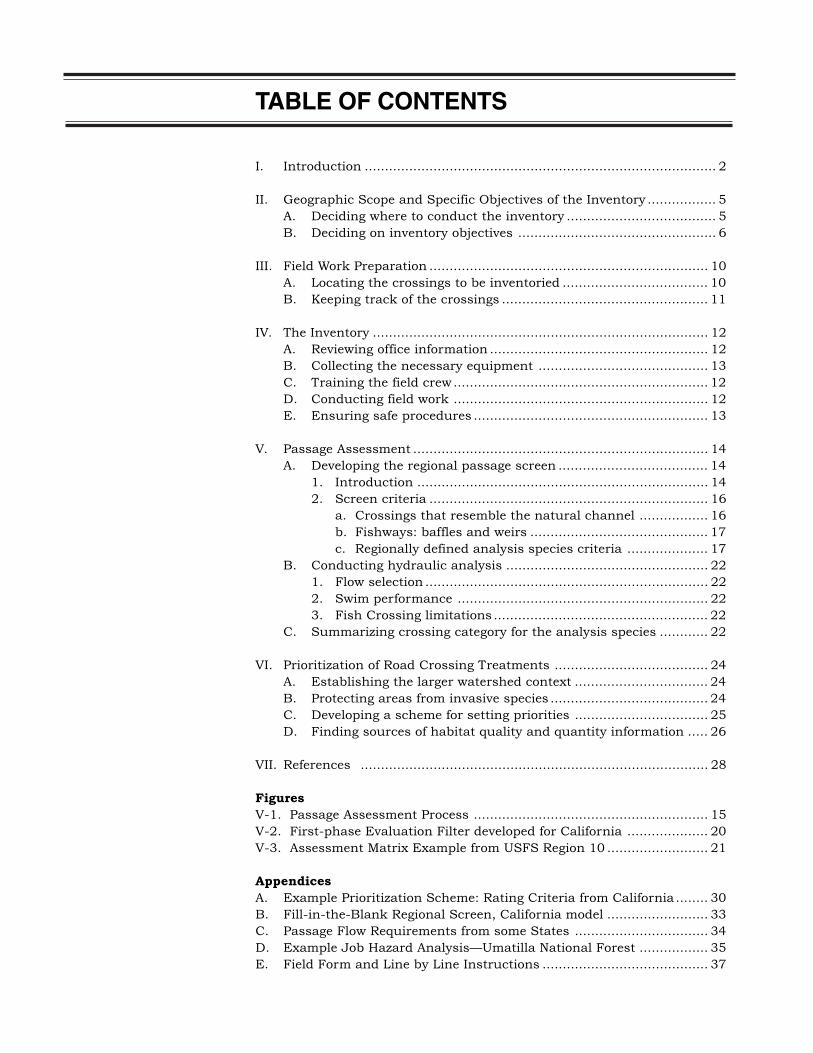
TABLE OF CONTENTS
I. Introduction ....................................................................................... 2
II. Geographic Scope and Specific Objectives of the Inventory ................. 5A. Deciding where to conduct the inventory ..................................... 5B. Deciding on inventory objectives ................................................. 6
III. Field Work Preparation ..................................................................... 10A. Locating the crossings to be inventoried .................................... 10B. Keeping track of the crossings ................................................... 11
IV. The Inventory ................................................................................... 12A. Reviewing office information ...................................................... 12B. Collecting the necessary equipment .......................................... 13C. Training the field crew............................................................... 12D. Conducting field work ............................................................... 12E. Ensuring safe procedures .......................................................... 13
V. Passage Assessment ......................................................................... 14A. Developing the regional passage screen ..................................... 14
1. Introduction ........................................................................ 142. Screen criteria ..................................................................... 16
a. Crossings that resemble the natural channel ................. 16b. Fishways: baffles and weirs ............................................ 17c. Regionally defined analysis species criteria .................... 17
B. Conducting hydraulic analysis .................................................. 221. Flow selection ...................................................................... 222. Swim performance .............................................................. 223. Fish Crossing limitations ..................................................... 22
C. Summarizing crossing category for the analysis species ............ 22
VI. Prioritization of Road Crossing Treatments ...................................... 24A. Establishing the larger watershed context ................................. 24B. Protecting areas from invasive species ....................................... 24C. Developing a scheme for setting priorities ................................. 25D. Finding sources of habitat quality and quantity information ..... 26
VII. References ...................................................................................... 28
Figures
V-1. Passage Assessment Process .......................................................... 15V-2. First-phase Evaluation Filter developed for California .................... 20V-3. Assessment Matrix Example from USFS Region 10 ......................... 21
Appendices
A. Example Prioritization Scheme: Rating Criteria from California ........ 30B. Fill-in-the-Blank Regional Screen, California model ......................... 33C. Passage Flow Requirements from some States ................................. 34D. Example Job Hazard Analysis—Umatilla National Forest ................. 35E. Field Form and Line by Line Instructions ......................................... 37


ACKNOWLEDGMENTS
This procedure is based on several other fish passage evaluation proceduresincluding: Taylor and Love (2001), USDA Forest Service Region 10 (2001)and USDA Region 6. We have also incorporated ideas from the WashingtonDepartment of Fish and Wildlife’s manuals on fish passage design andbarrier assessment (Washington Department of Fish and Wildlife 2000).Those sources are not responsible for any errors or misinterpretations herein.
1

I. INTRODUCTION
This inventory procedure is designed to be a nationally applicable, consistentmethod of identifying crossings that impede passage of aquatic organismsin or along streams. It is a how-to manual for approaching answers to twoquestions raised in United States Department of Agriculture (USDA) ForestService Roads Analysis, [1999, p. 67, AQ(10)]: “How and where does theroad system restrict the migration and movement of aquatic organisms;what aquatic species are affected and to what extent?”
Full answers to these questions are essential to managing roads andplanning for restoration. A transportation plan must consider and bedesigned to mitigate the road network’s effects on aquatic ecosystemsand their continuity. And planning for restoring watersheds and settingpriorities cannot logically proceed without considering how fragmented theaquatic habitat is and how important it is relative to the suite of restorationneeds of the whole watershed.
The inventory protocol is data-intensive because it is designed to produceenough information from a single site visit to answer the following questions:• Are crossing conditions are adequate for specific species and life stages?• What is the approximate cost of replacement?The inventory does not yield all the information needed to determine whichcrossings should be prioritized for replacement. Generally, data on speciespresence and habitat quality are needed in addition to the physical datacollected here. The inventory also does not yield enough information fordesign of a replacement structure. Depending on the site, the designprocess may require much more information, such as a full site surveyand a geomorphic assessment.
The site assessment procedure begins with an evaluation of the degree towhich a crossing resembles the adjacent stream form and function.Crossings that maintain stream functions are essentially invisible to thestream, and so are more likely to pass the resident species inhabiting thestream. The research that could confirm the hypothesis that crossingsresembling the adjacent stream pass all resident aquatic and semi-aquaticspecies has not been done. Given that direct evidence is unavailable, andcrossing assessment and restoration will proceed, it is reasonable toassume that species movement needs will be accommodated by crossingsthat do not disrupt the stream channel’s form and function.
If a crossing does not resemble the adjacent stream channel, then regionallydefined measurable criteria (hereafter referred to as regional screens) areused for preliminary assessment of passage for a particular species, lifestage, or species group. For fish, a hydraulic model is available when theregional screen fails to determine whether a crossing provides adequateconditions for the analysis species. The model we use is FishXing, whichcompares crossing hydraulics to swimming and leaping capabilities ofindividual fish species and life stages. Regardless of whether the analysis
2

is completed using the screen or the model, the process results in a defininga crossing category for each of the analysis species (see section V.C. forcategory definitions). Consistent identification of crossing category forindividual species will permit unambiguous data aggregation across regionsand the nation.
Streams and roads that cross affect each other in important, potentiallydestructive ways. Until recently, these two networks have been managedrelatively independently by different groups of resource specialists. Thesometimes destructive results have led to the realization that managingstreams and road must consider the needs and character of both, somethingbest accomplished by interdisciplinary teamwork. As noted in RoadsAnalysis (USDA-FS 1999 p. 67), a successful approach to these problemsmust draw from fisheries and wildlife biology, hydraulics, engineering,geomorphology and hydrology. Ideally an interdisciplinary team of trainedspecialists will be used to collect the data and interpret it in ways thataddress management questions.
In most cases, fisheries issues usually prompt culvert inventories. Butmany other aquatic and semi-aquatic species also use stream crossings andare affected by even low volume roads: amphibians, reptiles, invertebratesand small mammals. Information on passage needs and capabilities forthese groups is scarce, but some information can be found atwww.wildlifecrossings.info.
The following summarizes the barrier inventory-assessment process andhighlights important recommendations.
• Build and overlay maps of streams, roads, land ownership, analysisspecies distributions, aquatic habitat types, and habitat quality.
• Population and habitat information from field surveys is highly preferredbecause the assumptions used to estimate these variables from mapsare often inaccurate.
• Develop analysis species lists and criteria with the assistance of aquaticexperts and in collaboration with a group of stakeholders including landmanagement and regulatory agencies, as well as other interested parties(such as, tribes, Departments of Transportation).
• Document assumptions and rationale.
• Include crossings on all land ownerships if possible; otherwise, conductthe analysis recognizing the gaps in knowledge.
• Collect the entire suite of variables on all crossings to permit laterreevaluation if needed
• Use interdisciplinary teams to collect and interpret the data
Inventory andAssessmentProcedure Overview
Establish thewatershed context
Collaborativelyestablish criteria forregional screens
Conduct the fieldinventory
3

• Use regional screens for rapid field assessment of natural channelsimulation and barrier category.
• Use hydraulic analysis where screens fail to determine barrier category.• Understand the limitations of the analytic procedure, such as:
o For many species, movement capabilities and needs are unknown.o Estimates of culvert velocity are based on imprecise roughness
values and may not accurately reflect the flow conditions faced by fish.
• Set priorities for replacements aimed at maximum biological benefit inconjunction with logistical considerations.
• Collaborate with partners and other stakeholders to set priorities.
Determine barriercategory: naturalchannel resemblanceor species-specificcrossing category
Map barrier locations andoverlay on habitat-qualitymaps to set priorities forrestoring connectivity
4

II. GEOGRAPHIC SCOPE AND SPECIFICOBJECTIVES OF THE INVENTORY
Unless resources are available to cover an entire area of interest, (such asthe whole forest), or funding is designated for a certain area, priorities mustbe set among areas to inventory. Ideally, watershed analyses are complete,and the road analyses are underway or complete. If so, answers to thefollowing questions will already be available. If not, an interdisciplinaryteam should gather the background information needed to answer thequestions. It is essential to think in terms of watersheds, rather than justabout road systems, because the main issue is one of upstream-downstreamcontinuity for the local biota.
One of the functions of the barrier inventory is to identify the mostbiologically beneficial improvements. To meet this objective, we need abasic understanding of the needs of the biota and the condition of theaquatic ecosystem in the general area. We need to answer questions like:What spatial and temporal habitat needs are related to the life-historyrequirements of the species? What are the general conditions of thewatershed’s habitats as related to species requirements? Do road andtopographic conditions in the watershed pose a risk to high quality habitats?For example, are there miles of infrequently maintained unclassified orlegacy roads on steep lands, where crossing failures during floods coulddamage downstream habitat?
This information can then be used to identify watersheds that are highpriority for barrier inventories. Some examples of watershed characteristicsthat may lead to high priority for inventory are:
• Watersheds that are important refugia for certain species or aquaticcommunities
• Watersheds that create a connected block of habitats needed to supportthe life history requirements of species in the general area
• Watersheds with critical or essential habitat for one or more threatenedor endangered aquatic species or have species with economic orcultural value.
• Watersheds with high native biological diversity• Watersheds with known barriers excluding species from critical habitats• Watersheds with habitat quality problems that could result in greater
species effects if barriers exist (such as, high temperature, lowdissolved oxygen, or low food productivity)
• Watersheds where barriers may be desired to exclude invasive exoticspecies.
Other logistical or practical considerations may also focus an effort on aparticular watershed. For example, existing major road maintenance orreconstruction needs, and existing or potential partnerships with otherlandowners could also be criteria for selecting a watershed for inventory.
A. Deciding where toconduct theinventory
1. Which watershed(s)should be surveyedfirst?
5

Building a general picture of the watershed before planning the inventory isessential for many reasons. An extensive coordination effort may be neededto inventory crossings in an area with multiple jurisdictions. Generally, oneagency or entity spearheads the effort, with various amounts of commitmentfrom other landowners. Additional opportunities may be found for leveragingfunding from various sources when several landowners are cooperating toassess barriers.
If cooperation cannot be secured, landowners may agree to inventory onlycrossings on their own land or under their own jurisdiction. Information onhabitat quality and quantity—and on upstream and downstream barriers—would still be needed for areas in the watershed under other ownership orjurisdiction. Without that information, the importance of removing barrierson any one jurisdiction may be hard or impossible to determine.
This inventory and assessment procedure supports one core objective andthree additional objectives.
The core objective is to determine the crossing category for each analysisspecies.
The protocol includes two methods for achieving this objective. One methoduses species and lifestage specific criteria in a flow chart (see section V.A.Regional Passage Screen); the other uses the hydraulic model FishXing (Seesection V.B. Hydraulic Analysis). Headings in bold on the inventory datasheets indicate the data are related to the core objective.
The additional objectives are to: 1) prioritize passage improvementprojects, 2) develop replacement project budget cost estimates, and 3) fieldvalidate flows used to evaluate passage in FishXing. Headings in regularfont indicate the data are related to the additional objectives, and optional.
There may also be other objectives for conducting the inventory. For example,a possible complementary objective is to assess crossings for risk of failureduring floods, and their probable consequences on downstream areas. See#5 below for more information about this objective. The full set of objectivesshould be identified prior to going into the field in order to ensure the dataneeded to achieve those objectives are collected.
The field protocol described in this document will produce the informationneeded to accomplish the core objective and the additional three objectiveslisted above. To prioritize passage improvement projects, the inventory datawill need to be combined with an understanding of up-and downstreamhabitat quantity and quality.
2. Will crossings on allownerships beinventoried?How will jurisdictionalboundaries behandled?Are there anypotential partners?
B. Deciding oninventory objectives
6

1. Is the objective simplyto map sites that arebarriers?Will you requireadditional informationto help prioritizepassage restorationprojects?
The objectives for the inventory may be limited to defining the extent of thebarrier problems in a watershed. More often, they will be broader, andinclude gathering information needed to prioritize crossings for treatment.While there are likely to be a wide variety of prioritization criteria developedby different administrative units, most will probably include informationabout the quantity and quality of the habitat that would be opened up whenthe site is improved. Both upstream and downstream movements can beimpeded by crossing structures depending on the species (Warren andPardew 1998), so it is important to understand the movement patternsof the analysis species (and life stages) to determine which movements needto be considered for prioritization. See section VI for more detail about howhabitat information is used in the prioritization process.
Unless an ecological reason exists for excluding species, the ideal crossingis one that passes all aquatic and terrestrial species that require stream orstreamside zones to move8. Although definitive data are lacking, we believeit is reasonable to assume that the aquatic and semi-aquatic organisms thatnormally move through an area will be able to pass through crossings thatclosely resemble the adjacent natural channel reaches. Such crossingsgenerally do not require species-specific analyses. [See section V.A.2.a forcriteria that can be used to determine if the crossing resembles the adjacentnatural channel.] Most crossings, however, do not mimic the adjacentstream, and they require other methods of passage evaluation, includingcomparing conditions at the crossing to regionally developed species-specificcriteria. For fish species with known swim performance, hydraulicassessments can be conducted.
Information about how to assess road crossings for passage by amphibians,reptiles, invertebrates, and small mammals is limited. These non-fishspecies groups may or may not be a focus of the inventory; where they are,passage determinations should be based on inferences from informationabout the basic capabilities and needs of the species, and professionaljudgments of experienced technical experts.
The Analysis Species—Passage determinations are based on criteria developedfrom swimming and leaping capabilities of individual species, life stages(size), or species groups with similar morphology or known swimming abilityand behavior (hereafter collectively referred to as the analysis species). Theprocedure described in this document provides enough data to assesspassage for many fish species in many situations. Your list of analysisspecies may be broader and include species other than fish, however.Because additional data might need to be collected for these non-fishspecies, we recommend identifying specific analysis species in the planningstages. These are the species, life stages, or species groups for whichregional screens will need to be developed.
2. For what species, lifestages, or life stagegroups will passagebe evaluated?
8 Road construction and maintenance in streams is often permitted under the Corps of Engineers nationwide permitthat includes the following General Condition [65 FR March 9, 2000, page, 112893; Section C.4 Aquatic Life Movements]“No activity may substantially disrupt the movement of those species of aquatic life indigenous to the waterbodyincluding those species which normally migrate through the area É Culverts placed in streams must be installed tomaintain low flow conditions”.
7

The following steps are recommended in choosing analysis species:• Make a list of the species currently or historically present in the
inventory area that require passage.• Contact state and federal agencies to determine if any species have
established passage requirements or recommendations.• Review available information about the movement requirements of the
species on the initial list.• Determine which species, life stages, or species groups have the
greatest movement limitations or are the species of concern in yourinventory area. These species should serve as the analysis species forpassage evaluations.
• Document the rationale for your choice(s) in the analysis species,lifestage, or species group comment section on the field form, page 7(such as, the weakest swimming species, lifestage, or species group,an ESA-listed species, a culturally or economically important species,an indicator species).
Although most crossings in the United States are culverts, crossings alsoinclude fords, vented fords, and various types of bridges. Bridges are generallyassumed to be passable by all aquatic and most if not all riparian-dependentspecies; but there may be instances where there are passage issues. Someexamples include: a short bridge that constricts channel width and increaseswater velocity, or where rip-rap placed for scour protection results in rockcascades that inhibit or prevent passage. Some structures that look likebridges may in reality be a series of embedded box culverts.
Even though fords are low profile crossings, they can be and often arebarriers to aquatic species. For example, they may be:• Low-flow barriers because of insufficient water depth, if the ford is too
wide at streambed elevation;• Velocity barriers at moderate to high flows, if the floor of the ford lacks
sufficient roughness;• Jump barriers, if perches have developed in the channel as a geomorphic
adjustment to the flow acceleration across the smooth surface.
Given the core objective, the inventory should include at least a qualitativeevaluation of passage at fords. The FishXing software does not addresslow-water crossings, except for the culvert of a vented ford. True fords canbe hydraulically modeled by using open-channel flow models, but usuallylow-water crossings will require field observations to determine withconfidence whether aquatic species can pass at the relevant times of year.The field-form instructions indicate which measurements may pertain tofords and how they are taken.
FishXing is the preferred software for assessing fish passage at culvertsbecause it not only models flow conditions over a range of flows throughoutthe length of the structure, but it also compares those flow conditions to theswimming and leaping abilities of fish species and life stages for whichinformation is available. The results identify the type and location ofmigration barriers. FishXing is public domain software, well documentedand able to handle many culvert situations (see section V. B. for FishXinglimitations). This inventory protocol is designed to produce the data needed
3. Will all crossingtypes be evaluated?
4. What hydraulicassessment tool(s)will be used toevaluate crossings’barrier category?
8
to analyze passage using FishXing. If another hydraulic model will be used(such as HEC-RAS), additional input data are required.
Several issues other than those related to aquatic species could beaddressed in the crossing inventory, and they should be considered insetting improvement priorities. For instance:• Flood conveyance capacity (to ensure that crossings are sized to handle
the design flood);• Crossing condition and maintenance needs; and• Crossing failure risk and consequences of failure. An undersized culvert
in a steep stream moving large amounts of woody debris might be rankedhigher as a replacement priority because of its potential for plugging.It would rate even higher if it has a high fill, has a high risk of failingand could damage downstream aquatic habitat if it fails in a flood.
• Passage status for terrestrial wildlife that habitually use riparian areasfor movement.
This procedure includes data needed for flood conveyance capacity andrequires some observations of crossing condition and maintenance. Onlysome simple components of a failure risk and consequences assessmentare included here. The reason is that a full assessment of failure risk andconsequences must be based on an understanding of geomorphic processesthroughout the watershed. In addition, the set of crossings where failurewould cause serious consequences to downstream resources is likely tobe different from (although it may substantially overlap) those that affectaquatic species passage. For these reasons, combining inventories wouldincrease the amount of time and effort needed, which does not mean thetwo should not be coordinated when feasible and efficient. For backgroundinformation on designing a failure risk and consequences assessment, seeFlanagan and others (1998).
The habits of terrestrial animals should be considered when evaluatingcrossings. While salamanders swim or crawl in shallow-water margins andbetween rocks and logs, some terrestrial animals seem to prefer to keeptheir feet dry. The latter may prefer to climb up and over the fill, even if theycan walk through a culvert. This may be fine on a low volume road, butundesirable on high traffic roads, where jersey barriers are placed at theroad edge, or where the fill is very high.
5. What other issuesbesides aquaticanimal passage willbe addressed inconjunction with thepassage inventory?
9

III. FIELD WORK PREPARATION
After the objectives, scope, and analysis species are defined, the next stepis to locate the set of crossings to assess in the inventory area. You mightinclude all crossings in the area, but more likely it will be a subset basedon your objectives and the resources available.
To identify the subset of crossings that affect the analysis species, overlaymaps of their distributions on a reliable map of road-stream intersections.Geographical information systems (GIS) can be used to locate theseintersections, but only if the road and stream layers are sufficientlyreliable. Users are cautioned to have a clear understanding of the accuracyof any GIS layers they use. Check the GIS road layer against aerial photos,digital ortho-photographs, or satellite imagery to determine if some roadswere missed or were not correctly located.
Species distribution information may be available from several sources,such as State and Federal agencies, Tribal governments, commerciallandowners or non-profit organizations. It should be remembered thatsurveys for species presence have not always included smaller streams.Species distribution maps may show a species is absent on small streams,but this is not necessarily true, and it is a good practice to check speciespresence up-stream during the crossing inventory. If no species presenceinformation is available, then it may be possible to estimate distributionusing criteria developed from areas which have been surveyed. For instance,many units in the Pacific Northwest have assumed that fish do not occurabove stream gradients of 20 percent, and have not conducted passageinventories on crossings on steeper streams. If you do this, be aware that:1) your assumptions about habitat preferences may be incorrect, and2) the topographic or other data used to screen out some crossings maybe inaccurate or low resolution. Experience in the Pacific Northwest showsthat fish are often in areas where biologists did not expect to find them.Note also that not finding fish in one sampling event does not necessarilymean they do not use the habitat at some time during the year.
It will be difficult to prioritize crossing restoration or determine where tobegin and end crossing surveys if species distribution information is notavailable. Wherever possible a species inventory should accompany acrossing inventory when species distribution information is unknown orcannot be reliably predicted.
A final concern in identifying the subset of crossings to be assessed is landownership. As noted above, in areas of multiple land ownership, the owneror road maintenance agency should be identified for each crossing. Makesure each landowner has been contacted and ensure you have permissionto access the crossings on the dates of the inventory.
A. Locating thecrossings to beinventoried
10

All National Forest system crossings should be identified by the INFRAcontrol number if the crossing is already entered in INFRA. However, theinventory will usually include unclassified or unnumbered roads, and anaming or numbering scheme needs to be developed so that each crossinghas a unique identifier. Because crossings missed on the maps are frequentlyfound in the field, having a contingency plan for numbering these missedcrossings is advisable. For example, all crossings might be numberedconsecutively as they are inventoried. Labels identifying watershed or districtor some other logical division so that the field forms can be easily sorted bywatershed are also a good idea. A field map should be maintained with allthe site locations and numbers.
B. Keeping trackof the crossings
11

IV. THE INVENTORY
Already completed broad-scale planning and assessment documents(watershed and road analyses, road-management plans) may includeguidance for future management of the road or watershed to be inventoried.These should be identified and reviewed.
Page 7 of the inventory form includes information on the location of othercrossings on the same stream, their barrier category, and the extent ofblocked habitat upstream. These data provide context for future projectplanning. If any of this is unknown, you may want to gather thisinformation during the crossing inventory to facilitate prioritization.
Use this list (modified from Taylor and Love, 2002) to be sure you have theequipment you need:
• Maps with site locations.• GPS unit.• Self-leveling level and tripod, acceptable instruments depend on the
site characteristics (see discussion above).• Tapes (two): 300 ft and 100 ft in 1/10 ft increments.• Clamps (to secure tapes for longitudinal profiles and cross-section
surveys).• Leveling rod: 25 ft in 1/100 ft increments.• Pocket leveling rod (to measure breaks-in-slopes within smaller
diameter culverts).• Camera, film, and extra batteries.• Compass.• Waders, hip boots, and wading shoes (felt-soled).• Safety vests if working on road with traffic.• Hardhat.• Flashlight or headlamp.• First-aid kit.
Optional Equipment:• Brush-clearing tools.• Traffic cones.
Crews must consist of at least two people, although three would be ideal.Higher production rates are obtained with a three-person crew, but moreimportantly, there is a third person to help explore the details of the siteand bring additional skills to the team. Expect to spend one to two hourssurveying each crossing, depending on the difficulty of the survey and theexperience of the crew. Productivity will depend largely on travel time.
Since this inventory procedure brings several very different scientific fieldstogether for one task, there is a great opportunity to forge partnershipsacross disciplines working in the same administrative unit. Ideally, the
A. Reviewing officeinformation
C. Training the fieldcrew
B. Collectingthe necessaryequipment
12
D. Conductingfield work
inventory team will be interdisciplinary and include crewmembers withfisheries, hydrology/geomorphology and engineering survey experience.Each of these disciplines brings important skills to the survey. Fisheriesbiologists can evaluate species habitat use, hydrologists orgeomorphologists have expertise in river mechanics and stream behavior,and engineers are best qualified to accurately survey the terrain. Field crewscan become familiar with the protocols by participating in a trainingsession, and by conducting test runs at specific sites to compare resultsand discuss the methods. Results from several teams can then be used totest measurement repeatability.
A survey crew should be ready to begin the inventory after hands-on trainingby experienced personnel. Instruction should include techniques in surveyingprofiles and cross-sections using an instrument at least as accurate as asurveyor’s self-leveling level. Training should also include how to determinewhat points to survey in order to accurately measure the topographic pontesessential to categorizing crossing status. Note that hand instruments suchas hand levels, clinometers and abney hand levels do not possess theaccuracy necessary for this survey. Use of a higher order of hand instrumentsuch as a Rhodes Arc would also be questionable depending on siteconditions. Acceptable instruments depend on site characteristics (such as,slope, site complexity, and need for turning points). The flatter the slopeand the more complex the site, the more accuracy is needed.
Fieldwork consists of visiting each crossing and collecting the physicalmeasurements needed to assess passage. The protocol also includes notes,site sketches, and photographs describing the type and condition of eachcrossing structure and illustrating adjacent channel and habitat conditions.The inventory procedure is primarily designed to identify culverts thatobstruct or delay movement of on or more species and life stages. Pertinentmeasurements and observations should also be taken for fords, unless theinventory objectives exclude them.
Data sheets and instructions for the crossing inventory are located inAppendix E. It is a good practice to regularly photocopy data sheets toprovide back-ups, and to regularly enter data into electronic databasesso that mistakes or missed data can be quickly noticed and corrected.
A job hazard analysis (JHA) is required before the inventory begins(see example in Appendix D). Each crewmember should review the analysisduring training and in weekly safety meetings.
Use proper safety equipment and carefully assess the specific characteristicsof each crossing before conducting surveys. If the survey is being conductedon a road open to traffic, consider placing signs (such as “Survey Party”)to announce your presence to oncoming traffic from both directions.Crewmembers should also wear bright orange vests to increase visibility.Two-way radios provide effective communication between crew membersin spite of noise from road traffic and stream flow (Taylor and Love 2002).
Note: Field forms and instruction can be found in Appendix E.
E. Ensuring safeprocedures
13

V. PASSAGE ASSESSMENT
The assessment begins with a determination of whether the crossingresembles the adjacent natural channel. The top box in Figure V-1 listsspecific criteria used to make this determination. The criteria are intendedto distinguish crossings that allow a wide variety of species to pass the crossingincluding: amphibians, reptiles, some invertebrates, and numerous speciesand life stages of fish. They are based on the presumption that if the culvertphysically resembles the adjacent channel, then flow and substrate conditionswithin the culvert will be similar enough to allow passage at the same timesanimals are moving in the natural channel. If a species has a critical movementwindow of only a few days, and this happens to coincide with above-bankfullflows in a specific year, these criteria would not assure passage.
When crossings do not resemble the natural channel they are taken to thenext step in the screen. In this step, the crossing is compared to regionallyor locally developed screen criteria that specifically address the passage needsof the analysis species. Examples of these screens are shown in Figures V-2and V-4. The screening procedure is designed to quickly classify crossingsinto passage categories for each analysis species, species group, or lifestage.
The screen will not cover all possible scenarios. Some crossings havecharacteristics that may hinder passage but are not included in thescreen—for example, debris or sediment blockages, debris screens andtrash racks, and drop-inlets. We recommend using the screen criteria tocategorize the crossing before leaving the site to permit the field crew tovalidate the result based on their observations.
FishXing would be used when the result of the screen places the crossing inthe “indeterminate” category (that is, when screen criteria can not determinewhether the crossing conditions are adequate or inadequate). There aresome situations, such as culverts with baffles, weirs or other fishways,where the crossing category cannot be determined by either the regionalscreens or FishXing. These situations require field monitoring or detailedmathematical modeling.
A. Developing theregional passagescreen
1. Introduction
14

Figure V-1. Passage assessment process
Does the crossing structure currently
simulate stream conditions
(width, gradient and substrate)?
Criteria: Inlet width >
bankfull
S t r eambed Channel No perch
Subs t ra te width or oulet
throughout jumpan
d
an
d
Does the crossing structure meet regionally defined,
species-specif ic thresholds?
Criteria that may be useful in defining passability:
Inlet width to active channel or bankfull width ratio
Perch or outlet drop
S lope
Backwater or residual inlet depth (low flow depth in crossing
greater or equal to low flow depth in adjacent channel)
Inlet gradient
% blockage
baffles / weirs (undetermined)
See figures V-2 and V-4 for examples of regional criteria
Use FishXing software to model crossing
hydraulics and compare to species capabilities
Field Study / Direct Observation/Mathematical Modeling
Yes
Yes
No
Resemb le s
natural channel
P a s s a g e
conditions
adequate for
analysis species
P a s s ab l e
conditions
adequate for
analysis species
Indeterminate by model
(weirs / baffles / some fords) /
Indeterminate using regional criteria
P a s s a g e
conditions
inadequate
for analysis
spec i e s
P a s s a g e
conditions
inadequate
for analysis
spec i e s
15

a) Crossings that resemble the natural channel
Characteristics that indicate that the crossing resembles the naturaladjacent channel include:• Streambed substrate is continuous throughout the crossing and the
streambed slope, particle size and arrangement are similar to theadjacent channel;
• The crossing does not constrict the bankfull channel width. To meetthis criterion, the inlet width must at least match the natural channelbankfull width, usually measured upstream of the structure and awayfrom its zone of influence.
Note that these criteria are not necessarily the ones that would be used todesign ‘stream simulation’ crossings.
Streambed substrate continuity—For crossings to resemble the naturalchannel, they must be able to transport all watershed products moving inthe stream channel at least up to bankfull flow. Where this goal is met, bedmaterial size, arrangement, and slope profile inside the structure are eithersimilar to the adjacent channel sections, or they are designed to provide asimilar rate of energy loss. In the field, evidence of similarity in embeddedstructures that have been in place for several years is: lack of bedload ordebris accumulation upstream of the structure (caused by the structure),lack of downstream scour, and low flow depths similar to those in thenatural channel. Upstream of the structure, look for unusual bank erosion,and for finer bed material and lower slopes than in adjacent sections(evidence of aggradation). Downstream, look for abrupt slope changes andlarger bed material (evidence of degradation). Keep in mind that nearbytributaries can modify streambed particle sizes as well. Also keep in mindthe age of the structure. If it is new, the channel may still be adjusting toinstallation, so determining whether the crossing will function like theadjacent natural channel may not be possible.
On slopes lower than about 3 percent, bed material size, arrangementand slope profile in the structure are expected to be identical to the nearbystream sections. On higher slopes, bed material may be larger than in thenatural channel, in order to resist movement during larger than bankfullflows. To qualify in this category, however, the bed material must bearranged into stable bedforms that provide for flow diversity, energydissipation, and continuity of bedload transport through the structure.For the purposes of this inventory, it is recommended that crews rely onthe observations outlined above to make that determination.
Bankfull channel width—Compare the average of the adjacent bankfullchannel widths recorded on page four of the field form to the width of thestructure opening. Where channel types differ above and below the crossing,you will need to judge which width should be matched. Bedslope, bedforms,and width must all work together to maintain continuity of transportthrough the reach.
Regional adjustment of these criteria for natural channel resemblance willprobably not be required.
2. Screen Criteria
16

b) Fishways: baffles and weirs
Many culverts have been modified or retrofit with baffles or weirs for fishpassage. Baffles and weirs typically act to reduce velocities, provide restingpools, and consolidate low flows to provide more suitable depth. Thesestructures are sometimes installed to retain streambed material inside thepipe. Where these are completely embedded the crossing can be consideredto have continuous substrate. Baffled culverts that are not completelyembedded are not easy to screen because the hydraulics can be complicated—even unsolvable. Many baffled culverts require field study to determine theirpassage category and are initially put in the ‘indeterminate’ category.
c) Regionally defined analysis species criteria
If the structure does not simulate the natural channel, then continue throughthe portion of the flow chart (Figure V-1) that includes the regionally developedanalysis species criteria. Regional analysis species criteria are thresholdsthat reflect the species, life stage, or species group’s ability to swim throughor leap into crossing structures. If a culvert meets the regional analysisspecies criteria, then the passage conditions are categorized as adequate.If the regional criteria are not met, then either passage is inadequate orindeterminate using the screen. If it is indeterminate, then other analyses(eg. FishXing, monitoring) are needed.
The screening procedure should quickly classify crossings into one of fourcategories:• Crossing resembles adjacent channel: passage assumed for aquatic species• Meets criteria: passage conditions are adequate for the analysis species
for which the screen is designed• Fails criteria: passage conditions are inadequate for the analysis
species for which the screen is designed• Indeterminate barrier category: requires hydraulic or other analysis.
These barrier categories are species specific, so it is possible for a crossingto be in more than one category (eg. adequate for adults, indeterminate forjuveniles).
The benefit of developing regional screens is that they speed up the processof categorizing many crossings. Where we can define certain observablecharacteristics (such as perch height) that make a crossing impassable formost individuals of the analysis species, this method is more efficient thanhydraulic analysis. The risk, of course, is that we may not have all theinformation to select solid criteria, and so best professional judgment mustfrequently be used. Thus we are always at some risk of placing crossings inthe wrong category.
It is important to remember that barrier determination is not an exact science.As with all biological characteristics, a range in swim performance is foundwhen individuals are tested. Also, field conditions may vary considerablyfrom those in a laboratory where much of the swim performance data aregathered. Swim performance data should be considered as a guidepost andyou must use judgment to construct the screens.
17
If the screen criteria are based on the lowest numbers in the range reportedfor swim or leap performance for the analysis species, then some of thecrossings will be placed in the “passage condition inadequate” category whenthey are actually passable to most individuals. If the criteria are based onthe upper end of the range, then more crossings will fall in the “indeterminate”category, requiring the use of the hydraulic model. Inventory, analysis, andrepair of culverts are expensive, and restoration dollars are limited. It is,therefore, important to consider the consequences of choosing criteria fromvarious portions of the swim performance ranges reported in the literature.It is our recommendation that screens be tested on a sample of crossingsthat cover the full range of categories. A group of experienced professionalsshould be familiar with the test crossings and agree about their category.Testing will help to make sure the screens are performing as expected.
At least three screens have been developed to identify fish-passable crossingswithout a hydraulic analysis. Two are described here as examples, alongwith some discussion of the logic behind the criteria. Each of these screensis the result of substantial experience in assessing culverts for salmonidpassage. The examples presented here may not be appropriate outside theregions for which they were developed. Remember that these screens weredeveloped by regional teams representing agencies and organizations withinterest in fish passage. If passage for non-fish species is important in yourarea, you may develop several screens for a broader range of analysisspecies. Regional screen development teams should include fish and wildlifemanagement agencies and road managers of all jurisdictions. If this is done,barrier determinations will rest on a consensus definition that meets legalstandards, and the data can be aggregated across the various ownershipsin a watershed. Certainly, decisions about variables and values within anyregional screen should be justified and documented.
The screen referred to above, but not presented here as an example, isincluded in the Washington Department of Fish and Wildlife’s Fish PassageBarrier and Surface Water Diversion Screening Assessment and PrioritizationManual, August 2000. See page 17 at www.wa.gov/wdfw/hab/engineer/fishbarr.htm.
Example 1: California’s first-phase passage evaluation filter
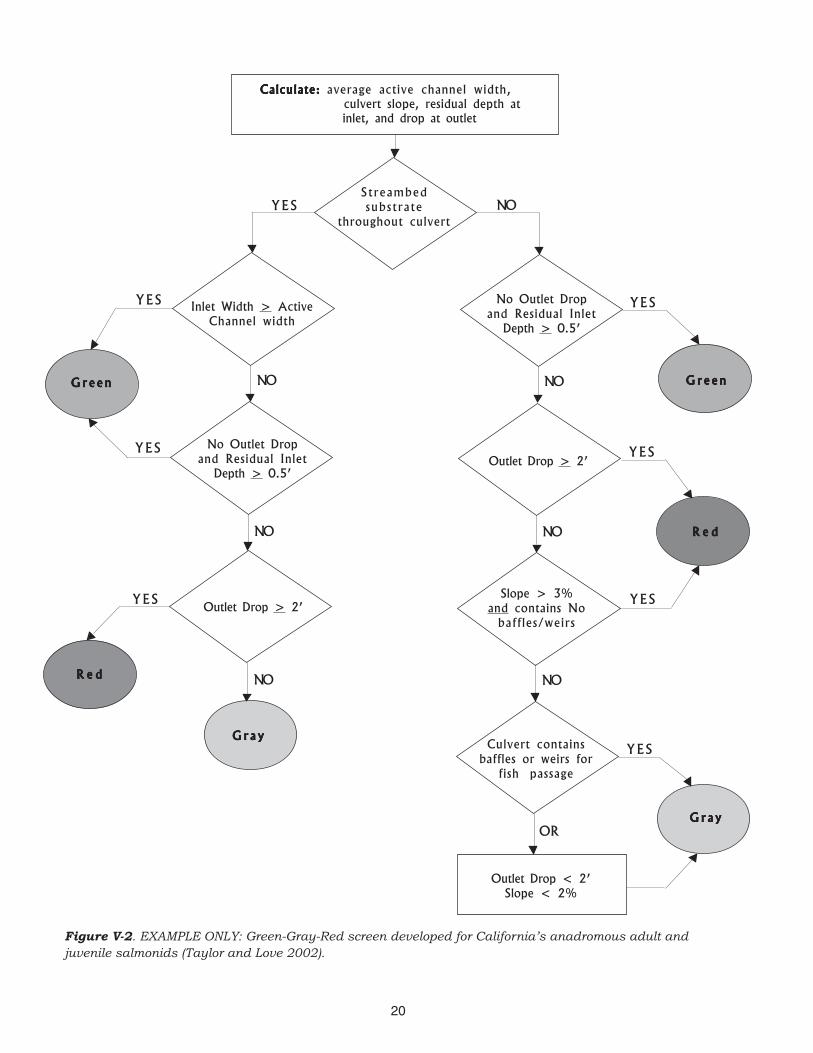
The flowchart screen (Figure V-2) is from Taylor and Love (2002). It is designedto cover both adult and juvenile anadromous salmonids. It puts crossings intothree categories: red, gray, and green. Definitions in this scheme are as follows:
• Green: Conditions are assumed adequate for passage of all salmonids.Even the weakest swimming lifestage (juveniles) can pass the crossingduring the entire period of migration.
• Gray: Conditions may not be adequate for all salmonid species or lifestages presumed present. Additional analyses are required to determineextent of the barrier for each species and lifestage.
• Red: Conditions do not meet passage criteria over the entire range ofmigration flows for even the strongest swimming species and lifestage(adults) presumed present. Assume ‘passage condition inadequate’.
The crossings that resemble the adjacent natural channel are categorized asgreen (see the left-hand side of this screen). They have streambed substrate
18

throughout and inlets as wide as the active channel. If either one of thosecriteria are not met, a crossing can still be considered “green”, but onlywhen its entire length is backwatered at extreme low flows (see Figure E-14for illustration of ‘residual inlet depth’). These criteria are designed so thateven the weakest lifestage can pass a green crossing. Criteria leadingto a red call are an outlet drop of 2 feet or greater, or a steep slope withoutbaffles or weirs to modify velocity and depth. Other crossings are partialor unknown barriers, and the barrier category is undefined until hydraulicanalysis is completed.
In this screen, the values assigned to critical variables are conservative, toaccommodate passage by weaker-swimming individuals. Stronger (larger)individual fish can often pass successfully upstream through a red culvertunder certain flows. The values also incorporate current National MarineFisheries Service guidelines and California Department of Fish and Gamedesign standards.
A benefit of using a flow-chart model is that values of specific variables canbe easily changed to judge the sensitivity of the model to data sets. Butbecause the California model covers all crossing structure types with oneset of criteria, it does not allow the user to distinguish crossings that maypermit easier passage than others (for example, larger corrugations onmetal pipes). The California flowchart also includes all species of concern(namely, adult and juvenile coho salmon) in one flow chart, which results ina number of gray culverts. It would be possible to reduce the number ofgray culverts and the required additional analysis by constructing twoflowcharts, one for adult and one for juvenile fish. With two flowchartsmany culverts would probably be red for juveniles (needing no moreadditional analysis) and gray for adults (needing additional analysis withFishXing).
For regional teams wanting to use the flow-chart model to develop regionalspecies or species-group criteria for an initial screen, we have included afill-in-the-blank version in Appendix B. Brief explanations of the criteria areincluded there. Note that the example variables may or may not beappropriate for all species. Other types of information may be required forpassage of amphibians, reptiles, invertebrates, or small mammals.
19
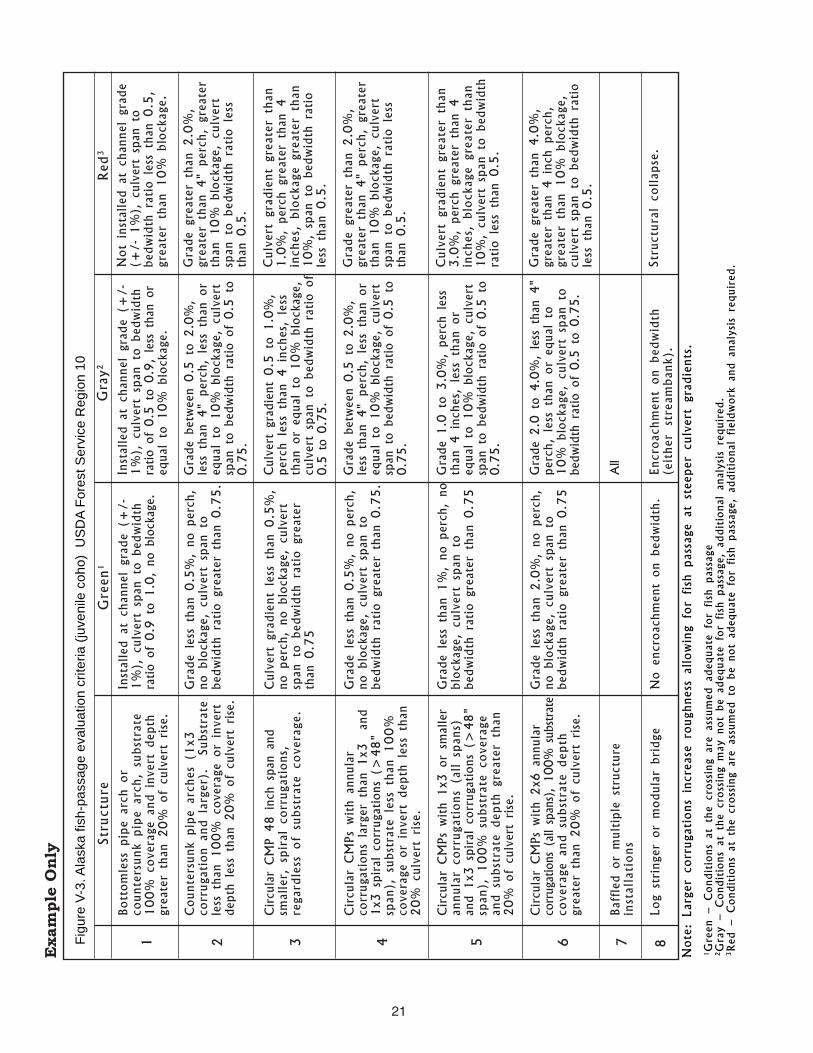
Example 2: Alaska’s initial screen
The screening matrix developed in Alaska (by a group comprising USFSRegion 10, the Alaska Department of Fish and Game, Alaska Departmentof Transportation, the Environmental Protection Agency, and the FishXingdevelopment team) is for juvenile coho salmon only. It is applied for juvenilesof all species in southeast Alaska (Figure V-4). This matrix explicitlyrecognizes the mix of characteristics that, if present together, permit passagefor juvenile fish through the various listed crossing types. Building a detailedmatrix like this one obviously requires considerable information on themovement of the analysis species and direct experience observing movementthrough many different crossing structure types. Note that crossingspassable by adult but not juvenile fish are red, unlike in California wherethey would be gray.
YES
Figure V-2. EXAMPLE ONLY: Green-Gray-Red screen developed for California’s anadromous adult and
juvenile salmonids (Taylor and Love 2002).
20
NOYES
YES
YES
YES
YES
YES
YES
NO
NO
NO
OR
NO
NO
NO
Calculate:Calculate:Calculate:Calculate:Calculate: average active channel width,
culvert slope, residual depth at
inlet, and drop at outlet
S t reambed
subs t ra te
throughout culvert
No Outlet Drop
and Residual Inlet
Depth > 0.5’
Outlet Drop > 2’
Slope > 3%
and contains No
baff les/weirs
Culvert contains
baffles or weirs for
fish passage
Outlet Drop < 2’
Slope < 2%
G r a yG r a yG r a yG r a yG r a y
R e dR e dR e dR e dR e d
G r e e nG r e e nG r e e nG r e e nG r e e n
G r a yG r a yG r a yG r a yG r a y
R e dR e dR e dR e dR e d
G r e e nG r e e nG r e e nG r e e nG r e e n
Inlet Width > Active
Channel width
No Outlet Drop
and Residual Inlet
Depth > 0.5’
Outlet Drop > 2’
Fig
ure
V-3
. Ala
ska
fish-
pass
age
eval
uatio
n cr
iteria
(ju
veni
le c
oho)
US
DA
For
est S
ervi
ce R
egio
n 10
Bott
om
less
pip
e arc
h or
co
unte
rsunk p
ipe arc
h,
subst
rate
10
0%
covera
ge and in
vert
depth
gre
ate
r th
an 2
0%
of
culv
ert
ri
se.
Counte
rsunk pip
e arc
hes
(1
x3
co
rrugati
on and
la
rger)
. Subst
rate
less
th
an 1
00
% covera
ge or
invert
depth
le
ss th
an 2
0%
of
culv
ert
ri
se.
Cir
cula
r C
MP 4
8 in
ch sp
an and
small
er,
sp
iral
co
rrugati
ons,
regard
less
o
f su
bst
rate
co
vera
ge.
Cir
cula
r C
MPs
wit
h annula
rcorr
ugati
ons
larg
er
than 1
x3
and
1x3
sp
iral
corr
ugati
ons
(>4
8"
span),
subst
rate
le
ss th
an 1
00
%covera
ge or
invert
depth
le
ss th
an
20
% culv
ert
ri
se.
Cir
cula
r C
MPs
wit
h 1
x3
or
smaller
annula
r co
rrugati
ons
(all
sp
ans)
and 1
x3
sp
iral
corr
ugati
ons
(>4
8"
span),
10
0%
su
bst
rate
co
vera
ge
and
su
bst
rate
d
ep
th gre
ate
r th
an
20
% of
culv
ert
ri
se.
Cir
cula
r C
MPs
wit
h 2
x6
annula
rcorr
ugations
(all sp
ans)
, 1
00
% su
bst
rate
co
vera
ge and
su
bst
rate
d
ep
thgre
ate
r th
an 2
0%
of
culv
ert
ri
se.
Baff
led or
mult
iple
st
ructu
rein
stall
ati
on
s
Log st
ringer
or
modula
r bri
dge
Str
uctu
re
Gre
en
1G
ray
2R
ed
3
1 2 3 4 5 6 7 8
Inst
alled at
channel
gra
de (+
/-
1%
),
culv
ert
sp
an to
bedw
idth
rati
o of
0.9
to
1
.0,
no blo
ckage.
Gra
de le
ss th
an 0
.5%
, no perc
h,
no blo
ckage,
culv
ert
sp
an to
bedw
idth
ra
tio gre
ate
r th
an 0
.75
.
Culv
ert
gra
die
nt
less
th
an 0
.5%
,no perc
h,
no blo
ckage,
culv
ert
span to
bedw
idth
ra
tio gre
ate
rth
an 0
.75
Gra
de le
ss th
an 0
.5%
, no perc
h,
no blo
ckage,
culv
ert
sp
an to
bedw
idth
ra
tio gre
ate
r th
an 0
.75
.
Gra
de le
ss th
an 1
%,
no perc
h,
no
blo
ckage,
culv
ert
sp
an to
bedw
idth
ra
tio gre
ate
r th
an 0
.75
Gra
de le
ss th
an 2
.0%
, no perc
h,
no blo
ckage,
culv
ert
sp
an to
bedw
idth
ra
tio gre
ate
r th
an 0
.75
No encro
achm
ent
on bedw
idth
.
Inst
alled at
channel
gra
de (+
/-
1%
),
culv
ert
sp
an to
bedw
idth
rati
o of
0.5
to
0
.9,
less
th
an or
equal
to 1
0%
blo
ckage.
Gra
de betw
een 0
.5 to
2
.0%
,le
ss th
an 4
" perc
h,
less
th
an or
equal
to 1
0%
blo
ckage,
culv
ert
span to
bedw
idth
ra
tio of
0.5
to
0.7
5.
Culv
ert
gra
die
nt
0.5
to
1
.0%
,perc
h le
ss th
an 4
in
ches,
le
ssth
an or
equal
to 1
0%
blo
ckage,
culv
ert
sp
an to
bedw
idth
ra
tio of
0.5
to
0
.75
.
Gra
de betw
een 0
.5 to
2
.0%
,le
ss th
an 4
" perc
h,
less
th
an or
equal
to 1
0%
blo
ckage,
culv
ert
span to
bedw
idth
ra
tio of
0.5
to
0.7
5.
Gra
de 1
.0 to
3
.0%
, perc
h le
ssth
an 4
in
ches,
le
ss th
an or
equal
to 1
0%
blo
ckage,
culv
ert
span to
bedw
idth
ra
tio of
0.5
to
0.7
5.
Gra
de 2
.0 to
4
.0%
, le
ss th
an 4
"perc
h,
less
th
an or
equal
to1
0%
blo
ckage,
culv
ert
sp
an to
bedw
idth
ra
tio of
0.5
to
0
.75
.
All
Encro
achm
ent
on bed
wid
th(eit
her
stre
am
bank).
Not
inst
alled at
channel
gra
de
(+/-
1%
), culv
ert
sp
an to
bedw
idth
ra
tio le
ss th
an 0
.5,
gre
ate
r th
an 1
0%
blo
ckage.
Gra
de gre
ate
r th
an 2
.0%
,gre
ate
r th
an 4
" perc
h,
gre
ate
rth
an 1
0%
blo
ckage,
culv
ert
span to
bedw
idth
ra
tio le
ssth
an 0
.5.
Culv
ert
gra
die
nt
gre
ate
r th
an
1.0
%,
perc
h gre
ate
r th
an 4
inches,
blo
ckage gre
ate
r th
an
10
%,
span to
bedw
idth
ra
tio
less
th
an 0
.5.
Gra
de gre
ate
r th
an 2
.0%
,gre
ate
r th
an 4
" perc
h,
gre
ate
rth
an 1
0%
blo
ckage,
culv
ert
span to
bedw
idth
ra
tio le
ssth
an 0
.5.
Culv
ert
gra
die
nt
gre
ate
r th
an
3.0
%,
perc
h gre
ate
r th
an 4
inches,
blo
ckage gre
ate
r th
an
10
%,
culv
ert
sp
an to
bedw
idth
rati
o le
ss th
an 0
.5.
Gra
de gre
ate
r th
an 4
.0%
,gre
ate
r th
an 4
in
ch perc
h,
gre
ate
r th
an 1
0%
blo
ckage,
culv
ert
sp
an to
bedw
idth
ra
tio
less
th
an 0
.5.
Str
uctu
ral
co
llap
se.
Exam
ple
On
ly
No
te:
Larg
er
co
rrugati
ons
i ncre
ase
ro
ughness
al l
ow
i ng fo
r fi
sh p
ass
age at
steep
er
cul v
ert
gra
di e
nts
.
1G
reen –
C
ond
i ti o
ns
at
the cro
ssi n
g are
ass
um
ed
ad
equate
fo
r fi
sh p
ass
age
2G
ray –
C
ondi t
i ons
at
the cro
ssi n
g m
ay not
be adequate
fo
r fi
sh pass
age,
addi t
i onal
anal y
sis
requi r
ed.
3R
ed –
C
ondi t
i ons
at
the cro
ssi n
g are
ass
um
ed to
be not
adequate
fo
r fi
sh pass
age,
addi t
i onal
fiel d
work
and anal y
sis
requi r
ed.
21

When the status of a crossing cannot be determined by applying the regionalscreens, hydraulic modeling can often be used to determine if the crossinghas adequate passage characteristics for the analysis species.
Hydraulic models require the user to select the pertinent flows. Designingroad crossings to pass fish at all flows is impractical (NMFS 2000; Robisonand others, 2000; WDFW SSHEAR 1998). Most aquatic species take refugeduring larger flood events. Conversely, during low flow periods shallow waterdepths in many small streams can make the channel itself impassable.Generally there will be an upper and a lower flow threshold beyond whichpassage need not be accommodated. In some areas, fish management orregulatory agencies have defined the range of flows where movement mustbe accommodated (See appendix C).
The field data needed to support the FishXing software are gathered duringthis inventory. FishXing is available on line at www.stream.fs.fed.us/fishxing.The current version (2.2) calculates velocities and depths throughout thepipe for a specific flow and then compares them to default or user-inputvalues for fish swim speeds and depth requirements. The default valuesshould not be assumed appropriate across regions. Developing a regionalmodel should include selecting user-input values for swimming ability. Theprogram identifies the locations of velocity and lack-of-depth barriers in thepipe, and the jump height barriers at perched outlets.
FishXing models a limited set of the most common culvert shapes It doesnot model complex crossing structures such as multiple pipes, aprons,fords or culverts with internal grade breaks, (although multiple runs cansometimes simulate this condition). The software calculates a compositeroughness value for pipe bed and walls at each node in the pipe (aboutevery 3 feet) based on water depth (the solution is iterative because depthand composite roughness are interdependent variables). FishXing assumesthat embedded and open bottom culverts have flat homogeneous beds.This frequently results in a “passage condition inadequate” determination,because true low flow depth is underestimated. For this reason, FishXingshould be used with extreme care, if at all, when there is continuousstreambed material through the crossing structure.
Other hydraulic evaluation models include CulvertMaster (http://www.haestad.com), the Federal Highways Culvert program HY-8 and HEC-RAS. The Federal Highway Administration Bridge Technology website http://www.fhwa.dot.gov/bridge/hydsoft.htm) includes links to several of thesesoftware packages. These models do not incorporate the swim performanceinformation that FishXing offers, and additional calculations comparing fishswim performance to the hydraulic properties in the pipe are required.
Some crossings block all species and life stages at all flows, others blocksome species and life stages only at certain flows, and still others blocksome species and life stages at all flows. These characteristics can be crucialfor prioritizing passage restoration projects. While it is tempting to describecrossings as “partial” or “total” barriers, the meaning of these terms has not
B. Conductinghydraulic analysis
1. Flow selection
2. Swim Performance
3. Fish CrossingLimitations
C. Summarizingcrossing categoryfor analysisspecies
22

been standardized. Important information is lost when these terms areused; for example: what does partial mean? Is it a barrier some of the timefor all species present, or all of the time for some of the species present?Because these terms are vague and easily misinterpreted, we recommendthat summaries be limited to tables that list the analysis species and itscrossing category from the screening process (such as, passage conditionadequate, passage conditions inadequate, indeterminate). Consistent use ofthese terms by units using this protocol will permit information exchangeand prioritization across units and jurisdictions. [The meanings of theseterms are essentially the same as the green, red, and grey used by previousinventory protocols. Each protocol uses different regional criteria to definegreen, grey and red, just as different geographic regions will need to usedifferent criteria to define adequate, inadequate and indeterminate.]
23

VI. PRIORITIZATION OF ROADCROSSING TREATMENTS
Stream restoration projects, such as removing passage barriers, are mosteffective when they are planned and priorities are set based on an understandingof the watershed’s condition, use by resident biota, its production potential,and its relation to the larger basin. For example, two streams similar in sizeand type of barrier problems could have very different priorities if one istributary to an area of high fish production, while the other is not. To fullyunderstand passage restoration needs in a drainage system, we need tounderstand the ecology of the local biota. What role does the blocked areaplay in the life history of individual animals, and in the structure anddynamics of populations or communities? What are the biologicalconsequences of not restoring passage? The nature and importance ofecological consequences of a barrier is the standard against which passagerestoration costs must be weighed. An understanding of the other restorationneeds within the watershed is also crucial. For example, fixing passagebarriers may be less important if water or habitat quality is low. A watershedapproach (McCammon et al 1998) should be taken to ensure that prioritiesare set based on a full assessment of watershed conditions, not on a limitedsite-scale view.
Where transportation plans are completed, they are an important part ofestablishing the context for restoration. The long term plans for the roadcan inform decisions about whether or not to restore passage at the culvert.It may be that the road is planned for removal or upgrade; if so, passageissues can be addressed when the removal or upgrades are done.
Before any treatment planning starts, consider these questions: Are exoticinvasive species present in the area? Should barriers be maintained?In freshwater ecosystems, non-native invasions are one the primary causesof species extirpations and population declines (Miller and others 1998, Allanand Flecker 1993). Crossings sometimes inhibit upstream spread of non-nativeor undesirable species. However, if exclusion is truly desired, an obstructionshould be designed to keep the specific invader from moving upstream.Crossings often function as incomplete barriers to upstream movement.Passage may be possible during certain infrequent flow events, or largerindividuals may be able to pass at some flows. Also, while it may be possibleto protect a native species by retaining a crossing barrier, this may also havethe undesirable effect of increasing that population’s extinction probability.Barriers can prevent re-colonization of the upstream reaches after catastrophicdisturbances (Brown 1986, Frissell 1993, Angermeier 1995). The tradeoffsrelated to improving access at road crossings when non-native species arepresent should be very carefully considered.
A. Establishing thelarger watershedcontext
B. Protecting areasfrom invasivespecies
24

This discussion relies heavily on Taylor and Love (2002).
Because sufficient funding in any one fiscal year to correct all passageproblems is unlikely, setting priorities is usually necessary. Some federal,state and local agencies, tribes, and watershed councils may already havedeveloped methods for setting priorities based on local issues and speciesneeds. If your local area does not already have a plan, what follows can helpyou and your partners develop a method that ranks road-crossingtreatments by whatever combination of criteria is most critical.
When you develop your scheme for ranking treatment of road crossingsconsider the following:• Quantity and quality of upstream and downstream habitat that would
be made accessible.Example 1: A somewhat shorter but higher quality habitat may be moreimportant to open up than a lower quality, but longer, habitat area.Example 2: Seasonal water-quality problems may increase theimportance of ensuring access between stream sections because aquaticspecies’ survival may depend on their ability to move in response toseasonal changes in water quality. For example, juvenile salmonidsmay need to move to cooler tributaries when mainstream channeltemperatures rise in summer.
• Species statusPassage problems affecting ESA-listed species should rank higher thanthose affecting species not currently imperiled.
• Crossing failure riskPotential adverse effects to aquatic systems will be avoided by replacingcrossings at high risk of failing because they are undersized or in poorcondition.
• Presence of upstream and downstream barriers (movement requirementsvary by species and life stage).Example 1: For anadromous fish species, the presence of other barriersdownstream is an important issue because their survival depends onhaving accessible stream corridors from the ocean to upstream spawninggrounds. Fixing upstream barriers is less productive when downstreambarriers are still in place. Effective treatments generally proceed in anupstream direction.Example 2: For resident species, individuals need to move in bothdirections to avoid predators, find mates or food, or reduce competitionfor local resources.
• Habitat useOpening corridors to high quality habitat may be more important thanfixing barriers across several drainages.
• Extent to which the barrier blocks native or desirable aquatic species,or alters native biological diversity.Removing a total barrier will assist more species and life stages thanremoving a partial barrier, and so may be more effective in re-establishingthe native biological community. Also, restoration of access in areaswhere native biological diversity is intact may have higher priority thanan area where native biodiversity has already been compromised.When considering which species are excluded, considering the role ofbarriers in preventing exotic species invasion.
C. Developing ascheme for settingpriorities
25
• Known barriers.Restoring passage where attempts to pass frequently fail and wherepredators or poachers congregate to take advantage of the blockedanimals may be more important than other places. These sites alsohave a high probability of fostering immediate recolonization ofupstream habitat.
The objective of setting priorities is to assess the biological risks andconsequences of crossing barriers and to rank them in order of importancefor passage restoration. Naturally, other factors—such as social, economic,or scheduling efficiencies—will enter into the actual scheduling of treatments.For example, equipment move-in costs may make addressing all barriers ona particular road system at the same time more economical, even thoughsome of the crossings are of low biological priority.
Schemes for setting priorities can be simple or complex depending on yourlocal capabilities and needs. Keep the scheme as simple and clear as possiblefor consistent application so that your prioritization decisions can be easilyexplained. An example scheme slightly modified from one being developedin California is shown in Appendix A.
Information about habitat upstream and downstream of culvert locationscan be obtained from previously conducted habitat typing or populationsurveys. Habitat information is often available in reports on file at state Fishand Wildlife agencies, federal (FS, BLM, EPA), or tribal offices. Private sectorbiologists, watershed groups, coordinators, restorationists, and largelandowners can assist in acquiring additional information on drainages intheir jurisdictions.
Information on habitat quality throughout the watershed is needed to providea watershed-scale context for each barrier culvert. Some examples:
• Certain blocked areas may be able to provide high-quality winterrearing in a watershed where that type of habitat is critically short;
• The area downstream of a crossing with a high risk of failure in a floodmight be extraordinary habitat for an endangered species; and
• A barrier culvert may be protecting an endangered amphibian frompredation by introduced fish.
Quantitative field assessments of habitat quality are desirable, but if noneare available then other types of information can be used as indicators ofhabitat quality. Examples include disturbance indicators available on GIScoverages, such as the percentage of watershed area in young vegetativestands (recently harvested), road density, riparian area grazing density,mining disturbance acres, and the amount of impervious surface orurbanization. Note that these indicators are much less reliable than habitatquality variables measured or even estimated in the field. Their relation tohabitat quality is frequently indirect, and real habitat quality may or maynot reflect the assumed relations. At a minimum, we recommend that afisheries biologist or aquatic scientist look at the stream to estimate its quality.
D. Finding sourcesof habitat qualityand quantityinformation
26

Summer water-temperature or other water quality data are helpful inidentifying tributaries that may provide high quality habitat. Knowledge aboutwater quality can help to identify water-quality refuges and non-structuralimpediments to movement from poor quality to higher quality habitats.Such movements are often key to the growth and survival of aquaticorganisms. This information may be available from state environmentalagencies for streams listed on 303(d) lists as having beneficial useimpairment (such as, temperatures outside natural regime, low dissolvedoxygen, elevated toxins).
NOTE: Field forms and instructions are located in Appendix E.
27

VII. REFERENCES
Allan J. D., and A. S. Flecker. (1993) Biodiversity conservation in running
waters. Bioscience 43:32-43.
Angermeier, P. L. (1995) Ecological attributes of extinction-prone species: loss
of freshwater fishes of Virginia. Conservation Biology 9:143-158.
American Association of State Highway and Transportation Officials. (2000)Standard Specifications for Transportation Materials and Methods of Sampling
and Testing Part 1 – Specifications. Twentieth edition. www.aashto.org
American Iron and Steel Institute. (1994) Handbook of Steel Drainage &
Highway Construction Products. 1994. Fifth edition. AISI, Washington, DC.
Brown, K. L. (1986) Population demographic and genetic structure of plains
killifish from the Kansas and Arkansas River basins in Kansas. Transactionsof the American Fisheries Society 115:568-576.
Flanagan, S.A., M.J. Furniss, T.S. Ledwith, S. Thiesen, M. Love, K. Moore,and J. Ory. (1998) Methods for Inventory and Environmental Risk
Assessment of Road Drainage Crossings USDA Forest Service Technologyand Development Program, San Dimas, CA.
Frissell, C. A. (1993) Topology of extinction and endangerment of native
fishes in the Pacific Northwest and California (USA). Conservation Biology7:342-354.
Harrelson, C.C., C.L. Rawlins, and J. P. Potyondy. (1994) Stream ChannelReference Sites: an Illustrated Guide to Field Technique. USDA FS GTR RM-245,Rocky Mountain Forest and Range Experiment Station, Ft Collins, CO. 61 p.
McCammon, B., J. Rector, and K. Gebhardt. (1998) A Framework for Analyzing
the Hydrologic Condition of Watersheds. USDA-FS and USDI-BLM. BLMTechnical Note 405.
Miller, R. R., J. D. Williams, and J. E. Williams. (1989) Extinctions of
North American fishes during the past century. Fisheries 14:22-38.
Moser, M. (1999) Low Light Impediments to Fish Migration with Particular
Emphasis on River Herring. Web Presentation of The CTE/NCDOT ResearchForum. http://carey078.itre.ncsu.edu/fishmigration.html
Normann, J. M., R. J. Houghtalen and W. J. Johnston. (1985) Hydraulic
Design of Highway Culverts Federal Highway Administration, Report No.FHWA-85-15. recently updated: FHWA NHI-01-020 (2001).
Robison, E.G., A. Mirati, and M. Allen. (June 1999) Oregon Road/Stream
Crossing Restoration Guide, Advanced Fish Passage Training Version.www.nwr.noaa.gov/1salmon/salmesa/4ddocs/orfishps.htm.
28

Stream Systems Technology Center, Rocky Mountain Forest and RangeExperiment Station, USDA-Forest Service. A Guide to Field Identification
of Bankfull Stage in the Western United States. (video) www.stream.fs.fed.us.
Taylor, R. N., and Michael Love (August 2001) Fish Passage Evaluation at
Stream Crossings. Prepared for California Dept of Fish and Game.
USDA—FS. (1998) WinXSPRO, A Channel Cross Section Analyzer, User’sManual. Prepared by West Consultants Inc. USDA—FS Rocky MountainExperiment Station, Ft. Collins, CO.
USDA Forest Service. (1999) Roads Analysis: Informing Decisions about
Managing the National Forest Transportation System. Misc. Report FS-643.Washington, DC. USDA Forest Service. 222 p.
USDA Forest Service, Region 6. Fish Passage through Road CrossingsAssessment, with Explanations and Instructions. Unpublished reportavailable through the USDA Forest Service Region 6 regional office.
USDA Forest Service, Region 10. (March 2001) Forest Service Handbook7709.58—Transportation system maintenance handbook. Region 10,Supplement No. 7709.58-2000-1.
USDA Forest Service, Region 10. Tongass Fish Passage Protocol (RiparianMonitoring Question #3. Unpublished report available through the USDAForest Service Region 10 regional office.
Warren, M. L., Jr, and M.G. Pardew. (1998) Road Crossings as Barriers to
Small Stream Fish Movement in Trans Am Fisheries Soc 127:637-644.
Washington Dept of Fish and Wildlife Habitat Program, SSHEAR section.(August 2000) Fish Passage Barrier and Surface Water Diversion Screening
Assessment and Prioritization Manual. http://www.wa.gov/wdfw/hab/engineer/fishbarr.htm.
29

EXAMPLE SCHEME FOR SETTINGPRIORITIES— MODIFIED FROM THECALIFORNIA METHOD
APPENDIX A
This ranking method is slightly generalized from a draft developed for Californiaby Taylor and Love (2002); it is shown here with their permission. Theoriginal was devised primarily for coastal watersheds with potential habitatfor anadromous salmonids. Some terminology has been modified to beconsistent with this document, the emphasis on anadromous fish has beeneliminated, and the extent-of-barrier variable has been simplified (2, below).
The ranking method assigns scores for the following parameters at eachbarrier crossing.
For each road crossing, add up ESA-listing status scores for each speciesknown to be within the stream reach (now or historically). Score:Endangered = 3 points; Threatened = 2 points; not listed = 1 point Consultyour local State Fish and Wildlife agency, USFWS, or NMFS for speciesdistribution and listing status.
For each species and lifestage of concern at the crossing, determinewhether it is a total or partial (passable at some flows) barrier. Add thescores to get a total barrier extent score. Score: Total barrier for a speciesand lifestage= 2 points; partial barrier for a species and lifestage=1 point.
Score length in feet or meters above the road crossing to the limit ofdistribution of the analysis species. Score: We suggest starting at someagreed on minimum (such as, 500 ft); and assign 0.5 points for each sizeclass unit (example: 0 points for <500 ft; 1 point for 1,000 ft; 2 points for2,000 ft; and 5.5 points for 5,500 ft).
Assign a habitat-quality score after reviewing available habitat informationas follows.
• Score: 1.0 = Excellent. Relatively undeveloped, “pristine” watershedconditions. Habitat features include dense riparian zones with mix ofmature native species, frequent pools, high-quality spawning areas,high water quality, near natural water temperature regimes, complexin-channel habitat, channel floodplain relatively intact. High likelihoodof no future human development. Presence of one or more migrationbarriers is obviously the watershed’s limiting factor.
• 0.75 = Good. Habitat is fairly intact, but human activities have alteredthe watershed, and that activity is likely to continue. Habitat stillincludes dense riparian zones of native species, frequent pools, spawning
1. Species diversity
2. Extent of Barrier
3. Habitat quantity
4. Habitat quality
30
gravels, good water quality, near- natural water temperature regimes,complex in-channel habitat, floodplain relatively intact. Presence ofone or more migration barriers is most likely one of the watershed’sprimary limiting factors.
• 0.5 = Fair. Human activities have altered the watershed. Expect continuedor increased human activity that will continue to affect watershedprocesses and features. Habitat effects include riparian zone presentthat lacks mature vegetation and has non-native species, infrequentpools, sedimentation evident in spawning areas (pool tails and rifflecrests). Water quality and water temperature regimes have been alteredto the point that they periodically exceed stressful levels for analysisspecies. There is sparse in-channel complex habitat, floodplain intactor slightly modified. Presence of one or more migration barrier is probablyone of the watershed’s limiting factors (out of several factors).
• 0.25 = Poor. Human activities have significantly altered the watershedwith high likelihood of continued (or increased) activities, with apparenteffects to watershed processes. Habitat effects include intact riparianzones absent or severely degraded, little or no pool formations, excessivesedimentation evident in spawning areas (pool tails and riffle crests),water-quality problems are stressful to lethal to analysis species, lackof in-channel habitat, floodplain severely modified with levees, riprap,and residential or commercial development. Other limiting factors inwatershed most likely have higher priority for restoration thanremediation of migration barriers.
Multiply the scores for habitat quality and habitat quantity for each blockedspecies of concern. Add all the species together to get the total score.
Score each culvert according to the size of flow it was designed to accommodate.Score: sized for at least a 100-year flow at headwater/depth = 1, low risk = 1;sized for at least a 50-year flow = 2; sized for at least a 25-year flow = 3;sized for less than a 25-year flow = 4; sized for less than a 10-year flow = 5.
for each culvert, assign one of the following values. Score: good condition = 1;fair (problems exist but are not likely to cause culvert to fail) = 2;poor (problems could cause failure) = 3.
For each road crossing, enter the scores into a spreadsheet and computethe total. Then, sort the list by “total score” to determine a first-cut ranking.Other sorts can be done to isolate certain kinds of crossing problems. Forexample, sites that have poor habitat quality may be sorted separately sothat ranking at these sites can focus on culvert sizing and risk failure.
The results of the ranking matrix provide a rough, first-cut prioritized listof crossings requiring treatment. Other important factors will be consideredwhen you decide the exact scheduling of remediation efforts.
5. Total habitat score
6. Sizing (riskof failure)
7. Current condition
Additional RankingConsiderations
31

On a site-specific basis, some or all of the following factors should beconsidered in refining the first-cut ranking.
1. Amount of road fill. At structures that are undersized or in poorcondition, consider the volume of fill material in the road prismpotentially deliverable to the stream channel if the culvert were to fail.Also consider diversion potential.
2. Presence or absence of other road crossings. Multiple roads under avariety of management or ownership may cross a single stream. Then,close communication with other road managers is important. Ifmultiple culverts are migration barriers, a coordinated effort is requiredto identify and treat them in a logical sequence.
3. Presence of aquatic organisms attempting to migrate past a barrier.In Northern California, several crossings were ranked higher becauseof the annual presence of adult salmonids below total barriers. Aftertreatments, the upstream habitat was immediately recolonized thefollowing winter.
4. Remediation project cost. You should examine the range of treatmentoptions and associated costs when determining the order in which toproceed and what should be implemented at specific sites. Wherefederally listed fish species are present, costs must also be weighedagainst the consequences of failing to comply with the ESA by notproviding unimpeded passage.
Other limiting factors. Other limiting factors besides migration barriers oftenexist in a watershed and limit production of aquatic species. On a watershedor sub-basin scale, restoration decisions must be made after carefullyreviewing potential limiting factors, the source of the effects, range of restorationoptions available, and what restoration activities are actually feasible.
32

Fill-in-the-Blank Regional Screen,California model
APPENDIX B
Calculate: average active channel width, culvert slope,
residual depth at inlet, and drop at outlet
Streambed substrate
throughout culvert
Inlet width >
bankfull widthNo outlet drop and
residual inlet depth
>___1
No outlet drop and
residual inlet depth
> ___1
outlet drop > ___2
outlet drop > ___2 Slope > ___3 and
contains no
baff les/weirs
Culvert contains
baffles/weirs for
fish passage
outlet drop < ___2
and Slope < ___3
Indeterminate usingIndeterminate usingIndeterminate usingIndeterminate usingIndeterminate using
regional criteria—goregional criteria—goregional criteria—goregional criteria—goregional criteria—go
to hydraulic modelto hydraulic modelto hydraulic modelto hydraulic modelto hydraulic model
P a s s a g eP a s s a g eP a s s a g eP a s s a g eP a s s a g e
c o n d i t i o n sc o n d i t i o n sc o n d i t i o n sc o n d i t i o n sc o n d i t i o n s
i n a d e q u a t ei n a d e q u a t ei n a d e q u a t ei n a d e q u a t ei n a d e q u a t e
P a s s a g eP a s s a g eP a s s a g eP a s s a g eP a s s a g e
c o n d i t i o n sc o n d i t i o n sc o n d i t i o n sc o n d i t i o n sc o n d i t i o n s
a d e q u a t ea d e q u a t ea d e q u a t ea d e q u a t ea d e q u a t e
Resembles NaturalResembles NaturalResembles NaturalResembles NaturalResembles Natural
C h a n n e lC h a n n e lC h a n n e lC h a n n e lC h a n n e l
Passage conditionsPassage conditionsPassage conditionsPassage conditionsPassage conditions
a d e q u a t ea d e q u a t ea d e q u a t ea d e q u a t ea d e q u a t e
P a s s a g eP a s s a g eP a s s a g eP a s s a g eP a s s a g e
c o n d i t i o n sc o n d i t i o n sc o n d i t i o n sc o n d i t i o n sc o n d i t i o n s
a d e q u a t ea d e q u a t ea d e q u a t ea d e q u a t ea d e q u a t e
P a s s a g eP a s s a g eP a s s a g eP a s s a g eP a s s a g e
c o n d i t i o n sc o n d i t i o n sc o n d i t i o n sc o n d i t i o n sc o n d i t i o n s
i n a d e q u a t ei n a d e q u a t ei n a d e q u a t ei n a d e q u a t ei n a d e q u a t e
Indeterminate usingIndeterminate usingIndeterminate usingIndeterminate usingIndeterminate using
regional criteria or modelregional criteria or modelregional criteria or modelregional criteria or modelregional criteria or model
( F i s h x i n g ) — m o n i t o r i n g( F i s h x i n g ) — m o n i t o r i n g( F i s h x i n g ) — m o n i t o r i n g( F i s h x i n g ) — m o n i t o r i n g( F i s h x i n g ) — m o n i t o r i n g
r e q u i r e dr e q u i r e dr e q u i r e dr e q u i r e dr e q u i r e d
Indeterminate usingIndeterminate usingIndeterminate usingIndeterminate usingIndeterminate using
regional criteria—go toregional criteria—go toregional criteria—go toregional criteria—go toregional criteria—go to
hydraulic model—Passagehydraulic model—Passagehydraulic model—Passagehydraulic model—Passagehydraulic model—Passage
maymaymaymaymay not be adequate not be adequate not be adequate not be adequate not be adequate
YES
YES
YES
YES
YES
YES
YES
YES
NO
NO
NO
NO
NO
NO
NO
NO
1 The low flow depth required to allow passage of the analysis species.2 The jump height of the analysis species.3 The culvert slope above which the analysis species cannot pass.
Note: Values 1-3 are to be developed regionally in cooperation with resource
managemen t
Passage inadequate: Crossing does not meet the criteria for the analysis species for which the screen is designed.
Indeterminate barrier category: for analysis species using the screen.
33

34
Ala
ska
Wash
ingto
nO
rego
nN
MFS SW
R
egio
nC
alifo
rnia
D
ept
NM
FS N
W R
egio
nId
ah
o
Fis
h &
G
am
e(d
raft
sa
lmo
nid
gu
idel i
nes)
Q5
0 o
r Q
10
0Q
10
0 w
ith debri
sQ
100
Q1
00
at
Q1
00 at
headw
ate
r/depth
=
1
head
wate
r/d
ep
th
= 1
.5
“Q
2d2
”:
the
10
% exceed
ance
10
%fo
r adult
sa
lmon &
stand
ard
s vary
5%
exceed
ance fl
ow
< 2
-day dela
y
dis
ch
arge
flow
duri
ng
exceed
an
ce
steelh
ead
1
% annual
from
1
%-1
0%
for
peri
od of
duri
ng p
eri
od
24
hours
mig
rati
on p
eri
od
:fl
ow
d
uri
ng
exceed
ance fl
ow
o
rannual
exceed
ance
up
stre
am
m
igra
tio
no
f m
igra
tio
n
befo
re or
specie
s-sp
ecif
icm
igrati
on
50
% Q
2.
For
juveniles,
for
vari
ous
gro
up
s
aft
er
the
perio
d:
10
% annual
of
fish
2-y
r fl
ood
sp
ecie
s-
exceed
ance fl
ow
specif
ic.
Appro
xim
ate
by Q
10
% =
0.1
8*(Q
2)+
36
wh
ere
Q2 >
44
cfs
.
Wh
ere
Q2 <
44
cfs
,
use
Q
2.
No
ne
2-y
r, 7
-day lo
w2-
yr, 7
-day
for
adul
t sal
mon
&st
anda
rds
vary
95%
exc
eeda
nce
flo
wlo
w fl
ow o
rst
eelh
ead,
the
grea
ter
from
50%
-95%
flow
dur
ing
mon
ths
95%
of 3
cfs
or
50%
ann
ual
annu
al e
xcee
danc
eof
ups
trea
m m
igra
tion
exce
edan
ceex
ceed
ance
flow
.fo
r va
rious
gro
ups
flow
for
For
juve
nile
s, th
eof
fish
mig
ratio
ngr
eate
r of
95%
ann
ual
perio
d:ex
ceed
ance
flow
or
spec
ies-
1 cf
ssp
ecifi
c
ST
AT
E A
ND
A
GEN
CY
G
UID
ELIN
ES FO
R FIS
H PA
SSA
GE FLO
WS
ST
AT
E A
ND
A
GEN
CY
G
UID
ELIN
ES FO
R FIS
H PA
SSA
GE FLO
WS
ST
AT
E A
ND
A
GEN
CY
G
UID
ELIN
ES FO
R FIS
H PA
SSA
GE FLO
WS
ST
AT
E A
ND
A
GEN
CY
G
UID
ELIN
ES FO
R FIS
H PA
SSA
GE FLO
WS
ST
AT
E A
ND
A
GEN
CY
G
UID
ELIN
ES FO
R FIS
H PA
SSA
GE FLO
WS
Hig
h Flo
w C
apacit
y (cro
ssin
g m
ust
pass
th
is fl
ow
, but
fish
pass
age is
not
requir
ed)
Hig
h Fis
h Pass
age Flo
w
Lo
w Fis
h Pass
age Flo
w
Hydrology and flow requirementsAPPENDIX CS
ever
al st
ate
s h
ave
def
ined
flo
ws
at
wh
ich
fis
h p
ass
age
shou
ld b
e pro
vided
. E
xce
pt
for
Ala
ska a
nd I
dah
o,
thes
e re
qu
irem
ents
apply
on
ly t
o h
ydra
ulic
des
ign
s (n
ot
stre
am
sim
ula
tion
).
Q100
mea
ns
the
pea
k f
low
equ
ale
d o
r ex
ceed
ed o
n a
vera
ge
on
ce i
n 1
00 y
ears
.
Det
erm
ined
base
d o
n a
nn
ual
pea
k f
low
data
set
.
10%
exceedan
ce f
low
duri
ng t
he m
igra
tion
peri
od
mea
ns
the
daily a
vera
ge
flow
th
at
is e
qu
ale
d o
r ex
ceed
ed 1
0%
of
the
days
in t
he
per
iod t
he
sele
cted
fis
h s
pec
ies
are
movi
ng.
Th
at
per
iod is
usu
ally e
stablish
ed b
y t
he
state
fis
h a
nd w
ildlife
man
agem
ent
agen
cy.
Base
d o
n p
erio
d o
f re
cord
dai ly-f
l ow
data
set
for
the
mi g
rati
on
per
i od.
1%
an
nual
exceedan
ce f
low
mea
ns
the
dai ly a
vera
ge
flow
th
at
i s e
qu
al e
d o
r ex
ceed
ed 1
% o
f th
e days
of
the
yea
r. D
eter
mi n
ed b
ase
d o
n p
eri o
d o
f
reco
rd d
ai ly m
ean
fl o
w d
ata
set
for
the
enti
re y
ear.

Example Job Hazard Analysis fromUmatilla NF
APPENDIX D
JHA provided courtesy of John Sanchez, Umatilla NF
The Occupational Safety and Health Administration has requirementsrelated to working in confined spaces [Safety training and Education –1926.21(b)(6)(i)]. These requirements can be found at their website:www.osha.gov/pls/oshaweb.
U.S. Department of AgricultureForest Service
JOB HAZARD ANALYSIS (JHA)
References-FSH 6709.11 and -12(Instructions on Reverse)
1. WORK PROJECT/ 2. LOCATION 3. UNIT ACTIVITY UMATILLA NATIONAL R6-14
FISH PASSAGE FOREST
CULVERT ASSESSMENT
JUNE/SEPT 2001
4. NAME OF ANALYST 5. JOB TITLE 6. DATE PREPARED J.SANCHEZ FISH BIOLOGIST 05/25/2001
7. TASKS/PROCEDURES 8. HAZARDS 9. ABATEMENT ACTIONS Engineering Controls * Substitution * Administrative Controls * PPE
* Driving on main roads as wellas 4wd and other secondatryroads which are heavily usedby public, working long days
*working in roadway andcrossing the road
*climbing up/down banks,over rock and loose fill inwading boots
*walking in culverts and instreams in wading boots
*potential for heavytraffic/fast vehicles;uneven roads; atv andbike use by recreationists;being tired while driving/lack of concentration ontasks /mental andphysical errors
*high traffic volume onmain roads; sites close tobends in roadwaydecreasing visibility
*poor foot traction inwading boots; easy toslip and fall; kickingloose rocks down ontoworkers below
*culverts and rocks areslippery when wet andcovered with algae;uneven surfaces inculverts and streams;strong flow
*follow safe and defensive driving practices;take rest breaks as needed; change drivers asneeded
*watch for traffic and check both directionsbefore crossing; post a lookout if needed;use caution especially at sites close to bendsin the road. Wear hard hats and safety veststo increase crew visibility to oncoming drivers
* look for safest way down bank; don’t rush;use a pole to help balance; make sure othersare not directly below you as you climb up ordown the bank
*don’t rush; wear wading boots with feltbottoms; use a wading staff for support; beconfident of your footing before taking nextstep in fast moving water
35

7. TASKS/PROCEDURES 8. HAZARDS 9. ABATEMENT ACTIONS Engineering Controls * Substitution * Administrative Controls * PPE
*climbing over/under/aroundtimber and walking overuneven terrain and overvegetation covered ground inwading boots
*working outside in weather(heat/rain/cold/snow/thunderand lightning)
*working outside-encounterswith snakes, bees, wasps,biting flies etc
*conduct tailgate safetymeetings as needed
*use proper department checkin / check out procedures
*driving an all-terrain vehicleon forest roads
* logs are slick when wet;hard to see the ground;unstable snags may fall;debris piles may beunstable; twisted ankles;snagging waders onlimbs and fences
*dehydration; hyper andhypothermia; threat ofstorms
*allergic reations such asanaphylactic shock/rash/swelling etc
*
* find safest and easiest route around logs; goaround or under instead of over; stepcautiously on piles of debris; identifyunstable snags and stay clear; use rod tohelp find stable/unstable spots
*drink plenty of water; dress appropriately forweather; monitor weather reports; carry aradio and extra batteries; keep dry clothes invehicle.
*identify all crew member’s allergies andinform all crew of potential health problems;always carry a first aid kit equipped withantihistamines/epi pin/benadryl asnecessary in vehicle and in packs; discussfirst aid techniques and training for all crewmembers as needed
*follow safe operating procedures for atv;wear all appropriate safety gear (helmut,gloves, boots, long pants and long sleevedshirt); maintain safe and proper speed; scanahead for hazards; keep all items strappeddown tightly to avoid unexpected shifting ofweight; carry a radio and 1st aid kit in case ofemergency
10. LINE OFFICER SIGNATURE 11. TITLE 12. DATE
Previous edition is obsolete (over)
36

Explanations and Instructions forPassage Through Road/StreamCrossings Inventory Form
APPENDIX E
These instructions accompany the Passage Through Crossings Assessmentforms. The inventory collects information required to assess passage of fishand other animals through crossing structures on both roads and trails.The procedure does not handle bridges because most often these structuresdo not obstruct aquatic organisms. The data sheet can be modified if needbe for field convenience. However, it is critical to preserve the definitions ofthe variables and the methods of measurement prescribed in this document.New database structures are being modeled now for storage of this data inForest Service Infrastructure database (INFRA) and Natural Resourcesinformation system (NRIS).
Once the field data have been collected, a passage assessment is made inthe field. First, determine whether the crossing resembles the adjacentnatural channel. If it does, we assume it passes most organisms. The criteriafor making this determination are listed under “Field Passage Evaluation”in these instructions. Second, if the crossing does not resemble the streamchannel, then use the regionally developed species, lifestage, or speciesgroup-specific criteria to determine whether the structure’s passageconditions are adequate, inadequate or are indeterminate.
If you cannot determine whether the crossing is a barrier, and the analysisspecies is a fish for which swim performance information is available, thenhydraulic analysis using FishXing can be conducted for many types ofcrossings. The FishXing software is available on the web at: http://www.stream.fs.fed.us/fishxing. See instructions and help files prior torunning the program.
In addition to the information collected through this inventory the
following inputs are also needed to run FishXing:
• Hydrologic criteria, including low passage flow and high passage flow.
• Fish information, including swimming capabilities and depth requirements.
Although the field assessment form is designed primarily for culverts, fordscan also be inventoried. Instructions for taking measurements on fords areincluded. The survey measurements can support limited open channel flowanalysis, but passage assessments on fords are usually a matter of directlyobserving animal passage. In these cases, more than a single visit may beneeded to adequately assess their passage. Other complex installationsdifficult to model hydraulically, such as baffled culverts, may also requiremultiple visits.
37

38
Data elements in bold are required for Forest Service Infrastructure database (INFRA)/Natural Resource Information System (NRIS) or are needed to evaluate passage at the crossing. Other data are useful for prioritizing culvert restoration, developing pre-proj-ect budget cost estimates, or to field check flow estimates used in FishXing analyses.
The last page of the form (p 7) is not intended for field use. Its purpose is to document biological and watershed context information about the site that is critical to complete the permanent file, and for replacement project prioritization. Usually this form will be filled out in the office, before or after the survey.
A supplemental form is attached for sites where there are more than one pipe or box. In most cases, where there are several pipes in close proximity, only part of this form will be needed. However the complete survey pages are included for cases where side channel culverts are being evaluated separately for passage conditions.
Some of this information can be collected in the office before beginning the field por-tion of the assessment.
Each crossing location should be clearly marked on the best available map, preferably an 8.5 by 11, 1:1 scale photocopy of a USGS 7.5-min. topographic quadrangle. Each map sheet should be labeled with the crossing identification number to help eliminate confusion both during the inventory and when crossing data are linked to GIS cover-ages.
If the culvert installation is already entered in INFRA, use the control number of the culvert installation as the crossing site ID number. Otherwise, this can be any number that uniquely identifies each crossing. It should be entered on each a page of the field form, and it should be used on photograph and map labels.
Where there is only one pipe at a crossing site, the single pipe will be identified as “Structure 1 of 1” and the structure milepost is the site milepost. For crossings with more than one pipe or opening, the crossing ID number identifies the site as a whole, and the individual pipes are numbered “structure 1 of __, structure 2 of __, etc. starting with the pipe closest to the beginning of the road (milepost 0). The principal struc-ture—generally the lowest elevation since that will carry the lowest flows—is de-scribed on the main data sheet “Passage through Crossings Assessment.” Supplemental data sheets with the same crossing ID number are used to describe pipes other than the principal structure. Each additional pipe is described on a separate supplemental form, and its milepost is entered as ʻstructure milepost ̓on that form. (See further explana-tion under Route number and INFRA Milepost.)
If a site has two or more structures (pipe or box) of the same size, materials, elevation, and orientation, measurements are needed only on whichever structure is identified as the principal one. This will be the pipe that conveys most flow. Note the number of other identical openings and their mileposts in the multiple structures box (see Figure E-1). Use the sketch to describe the accompanying culverts; also take photos. Each pipe will be entered in INFRA separately.
Site
Crossing site identification number box
Multiple structures at one site
Line-by-Line Instructions
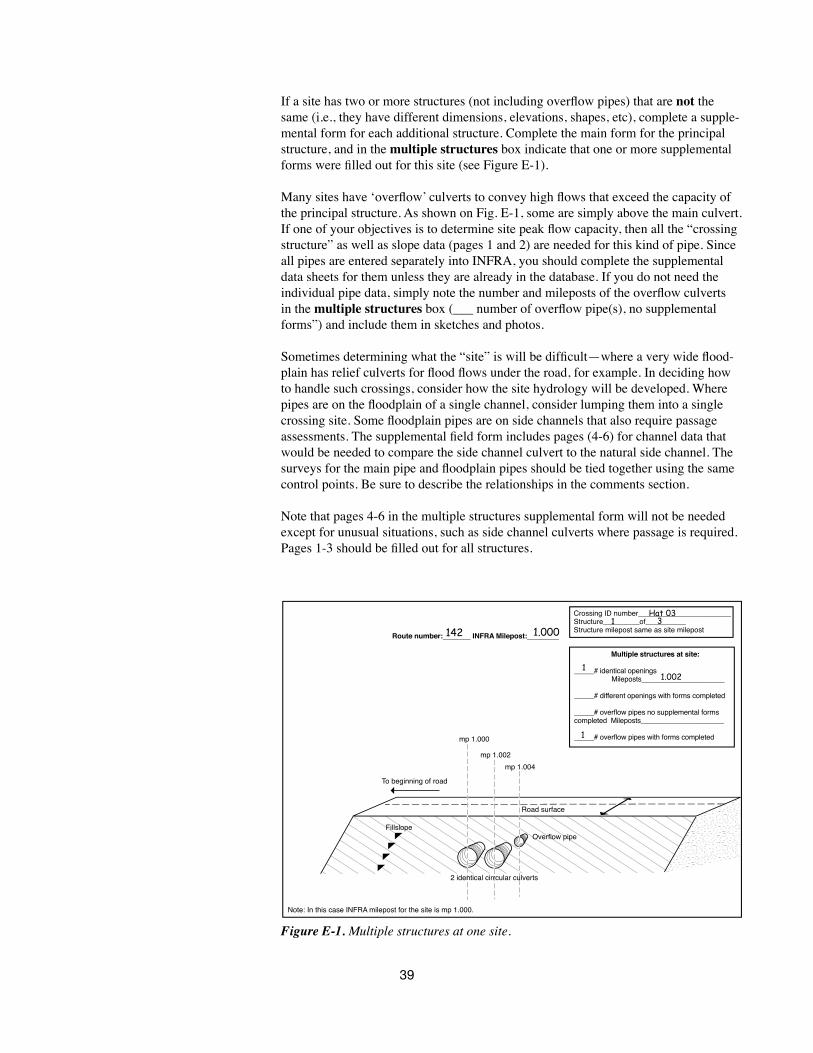
39
If a site has two or more structures (not including overfl ow pipes) that are not the same (i.e., they have different dimensions, elevations, shapes, etc), complete a supple-mental form for each additional structure. Complete the main form for the principal structure, and in the multiple structures box indicate that one or more supplemental forms were fi lled out for this site (see Figure E-1).
Many sites have ʻoverfl ow ̓culverts to convey high fl ows that exceed the capacity of the principal structure. As shown on Fig. E-1, some are simply above the main culvert. If one of your objectives is to determine site peak fl ow capacity, then all the “crossing structure” as well as slope data (pages 1 and 2) are needed for this kind of pipe. Since all pipes are entered separately into INFRA, you should complete the supplemental data sheets for them unless they are already in the database. If you do not need the individual pipe data, simply note the number and mileposts of the overfl ow culverts in the multiple structures box (___ number of overfl ow pipe(s), no supplemental forms”) and include them in sketches and photos.
Sometimes determining what the “site” is will be diffi cult—where a very wide fl ood-plain has relief culverts for fl ood fl ows under the road, for example. In deciding how to handle such crossings, consider how the site hydrology will be developed. Where pipes are on the fl oodplain of a single channel, consider lumping them into a single crossing site. Some fl oodplain pipes are on side channels that also require passage assessments. The supplemental fi eld form includes pages (4-6) for channel data that would be needed to compare the side channel culvert to the natural side channel. The surveys for the main pipe and fl oodplain pipes should be tied together using the same control points. Be sure to describe the relationships in the comments section.
Note that pages 4-6 in the multiple structures supplemental form will not be needed except for unusual situations, such as side channel culverts where passage is required. Pages 1-3 should be fi lled out for all structures.
Figure E-1. Multiple structures at one site.
Road surface
Crossing ID number_______________________Structure_________of__________Structure milepost same as site milepost
Multiple structures at site:
_____# identical openingsMileposts_____________________
_____# different openings with forms completed
_____# overflow pipes no supplemental formscompleted Mileposts_____________________
_____# overflow pipes with forms completedmp 1.000
To beginning of road
mp 1.002mp 1.004
2 identical cirrcular culverts
Note: In this case INFRA milepost for the site is mp 1.000.
Overflow pipeFillslope
Route number:_______ INFRA Milepost:________1421
11.002
1
31.000
Hat 03

40
Record the road or trail number, and the site INFRA milepost, if known. If the installa-tion is not entered in INFRA yet, measure the mileage from the beginning of the route to the center of the first (or only) pipe in the installation (see Road User Board Meeting Notes, Redding CA, 4-2002). The milepost of the first pipe in a multiple-structure installation is always the site milepost.
The supplemental forms (for structure 2 of X, etc.) do not include site milepost, since the site is identified by the crossing ID. Other structure mileposts are entered on the supplemental sheets in the crossing ID box. Mileposts for different structures at the same site should be recorded in 1/1000ths of a mile (for example, culvert 1 = MP 1.000, culvert 2 = MP 1.001).
Where available, use a distance measuring instrument (DMI) attached to the vehicle for accuracy. For more information see http://www.nu-metrics.com. Click on NIT-ESTAR on left column. Approximate cost is around $150-$250 for unit, installation kit, and installation.
Driving from the beginning of the route to the crossing site is the most direct and accu-rate way to get the INFRA milepost. Be aware that if you access the site by another—perhaps shorter—route it may be difficult to accurately locate the site later. If you do take a different road to the site, record the mileage from a clearly identifiable junction on the road you actually drove (for example, 1.5 miles from intersection of road 123 with road 145). Be sure to take a GPS reading at the crossing.
For non-Forest Service land, substitute appropriate administrative units.
Enter the hydrologic unit code (HUC) number of the watershed or sub-watershed. Use the 6th-field HUC where possible.
Get the stream name from USGS 7.5-minute quad or other local sources. If a crossing is on an unnamed stream that is a tributary of a larger sub-basin in a major basin, in-clude all named sub-basins. For example: unnamed, tributary to Davis Creek, tributary to Outlet Creek, tributary to South Fork Eel River, Eel River watershed.
Input the USGS quadrangle name, the land ownership or jurisdiction, the legal descrip-tion (township, range, section), and principal meridian.
Record the X and Y coordinates from the GPS unit for permanent site identification, along with the datum (eg., NAD27). If you use something other than latitude and lon-gitude, note the coordinate system and zone.
Record the surveyors ̓names.
Enter the date the field data are collected.
Route number and (INFRA) milepost (office or field determination)
Milepost from junction of road number (field determination)
Forest and district
Watershed (office determination)
Stream name (office determination)
USGS topographic quad name, ownership, and legal description
Global positioning system location
Surveyors
Field date

41
Choose appropriate type of culvert or ford, and measure dimensions. Depicted below are the barrel cross-sections of common culvert types that can be modeled in FishX-ing.
Figure E-2. Common culvert shapes.
Log culverts, “Humboldt” crossings (porous structure made of stacked logs), irriga-tion diversion structures, and other less common crossings are described under “oth-er”. For analysis in FishXing, select the shape from the four above that most closely resembles the observed pipe, using as criteria similar cross-section area and wetted pe-rimeter at passage flows. Other culvert shapes should be described in enough detail to permit determination of pipe capacity from information provided by the manufacturer or from other sources.
Ford TypesThe two types of low-water fords are unvented (Figure E-3) and vented (Figure E-4). At unvented fords, traffic drives through the stream until increasing flows cause the water to become too deep to traverse. Unvented concrete fords are often barriers to fish passage at low flows because of the shallow flow depth. Some of these have slots of various sizes, with or without grated coverings that may allow fish and amphibian passage.
A vented ford includes a low-flow conveyance structure such as a culvert, so that traf-fic does not travel through the water at low flows. Only at moderate or high flows is the vented ford submerged. The many designs of vented fords include:
• A single pipe or box;
• Multiple round or box culverts that are essentially identical; and
• Multiple round or box culverts with one pipe designed to capture all of the low flow.
In vented fords the vent is described as a culvert for the inventory, and the ford dimen-sions in Figure E-4 (F1, F2, and sag) are also measured. Check both structure shapes on the form. True fords, where vehicles cross at streambed elevation, are “fords”, whether or not they have a slot for aquatic organism passage.
Crossing structureshape

42
Figure E-3. Low water ford (unvented)
Figure E-4. Low water ford (vented)
Record the maximum width (span or diameter measured horizontally) and the height (rise or diameter measured vertically) of the culvert, measured from the inside of the corrugations.
• Circular culverts and pipe arches. Measure both height and width. Pipes are often distorted during and after installation.
• Open-bottom arches. For open-bottom arches, measure the width of the pipe from metal to metal, not from foundation to foundation, unless the streambed is scoured to below the top of the foundation. Then, also measure flow width between foundations and the depth of scour below the top of the foundation at top and bottom of the pipe (in FishXing this configuration may be modeled as a flat-floored rectangular box). Measure the height of the pipe from the stream-bed to the top of the culvert.
• Embedded pipes. If possible, dig or probe to find the depth of substrate at the inlet and add that to the height measured from the bed to the pipe top. If that is not feasible, culvert height can be estimated from width for standard pipe shapes (see AISI 1994 or FishXing). Many structures are manufactured that do not conform to “standard” dimensions, so it is advisable to measure substrate depth directly.
��
��
����
��������������������
���������
Culvert dimensions

43
Ford Dimensions – optional dataAside from the standard culvert or box data on the vents in vented fords, ford dimen-sions only need to be measured if average flow velocities and/or peak flow capacity estimates are desired. FishXing cannot be used for fords during overflow conditions. Open-channel flow equations (e.g., Manningʼs) or weir equations can be used to make velocity and depth estimates where the assumptions specific to each equation are met.
Three measurements are needed to describe the shape of any ford. • F1 is the width (horizontal distance measured parallel to the road) of the top of
the ford; that is, between the points on the road at which the roadway transi-tions out of its vertical curve (see Fig. E-3). This measurement helps determine the structureʼs peak flow capacity.
• F2 is the width (horizontal distance measured parallel to the road) of the bot-tom of the ford. Low-flow depths across the ford will be determined by this width.
• Sag or Height – The vertical difference in elevation between the bottom of the ford and the elevation of the roadway if it were projected across the ford.
Some unvented fords have slots to accommodate fish or amphibian passage during low flows. The dimensions of the slot should be noted and its slope and any perch should be measured during the survey (see The Survey, below).
Rust lineIf the culvert is made of steel it will have a rust line. Measure the height of the rust line above the culvert bottom away from noticeable elevation changes near the inlet or at obstructions. The rust line indicates a persistent high flow. The actual exceedance value or recurrence interval of this flow is expected to vary across the country depend-ing on the local streamflow regime.
If the culvert material does not fall into one of the following categories, give a brief description characterizing its roughness.
• Corrugated metal pipes (CMP) are constructed from single sheets of cor-rugated metal. Spiral culverts have helical corrugations, reducing the culvert roughness. Annular culverts have concentric corrugations.
* Steel = corrugated steel, may show rust line.
* Aluminum = corrugated aluminum, no rust line.
• Structural plate pipes are constructed of multiple plates of corrugated galva-nized steel or aluminum bolted together. They always have annular corruga-tions.
• Plastic may or may not have corrugations.
• Concrete is used in many box and some circular and arch culverts.
• Wood and logs are used to make log stringers, log box culverts, and circular culverts.
Ford surfaces also vary, ranging from natural stream bottom with no improvements to paved road surfacing. The surface designs of most concern for animal passage are those that are smooth; these surfaces tend to reduce water depths at low flows and increase velocities at high flows. In addition, high water velocities across smooth ford
Structural material

44
surfaces cause scour of the natural streambed downstream, usually creating a perch at the outlet of the ford. In ford surface materials under “other” write in natural stream-bed, asphalt, geotextile/gravel, concrete, pit run, or other rock.
Figure E-5. Measuring corrugations.
Measure the width and depth of the corrugations in inches (see Figure E-5). Most CMP under 60 inches in diameter have 2 2/3-inch x 1/2-inch corrugations. CMP greater than or equal to 60 inches in diameter typically have 3-inch x 1-inch corrugations. Structur-al plate pipes (SPP) and structural plate pipe arches (SPPA) often have 6-inch x 2-inch corrugations. The size of the corrugations determines the culvert roughness, which is used in FishXing. Corrugations are measured from crest to crest (width) and valley to crest (depth). Measure them in areas without deformation
Mark all inlet descriptions that fit (see Figure E-6). The culvert inlet type determines the headloss coefficient at the inlet of the pipe. This coefficient is a measure of the en-ergy loss as water enters the pipe, and is required for the hydraulic analysis performed in FishXing.
Figure E-6. (from Normann et al 2001). Inlet type examples (clockwise from top left): projecting, headwall and wingwall, mitered and metal or cement end section. Wing-wall measurement is illustrated here.
Corrugations
Inlet type
������
�����
����������������������
���������
����
����
�����������������

45
Many inlet types are not included either here or in the FishXing defaults. See Nor-mann and others (1985) for head loss coefficients associated with several other types. Also use “other” for drop inlets, beaver excluders, and so on.
Measure the angle (<90 degrees) between the road centerline and a line perpendicular to the culvert centerline (Figure E-7). This measurement is required in INFRA. It is not directly relevant to aquatic species passage, although it is related to culvert length (the shortest culvert is not skewed; ie. it is perpendicular to the road). Alignment be-tween the pipe inlet and the upstream channel is important to aquatic species passage. It should be documented on the site sketch, as discussed in section Site Sketch.
Figure E-7. Measurement of culvert skew.
Check the best description of culvert outlet configuration (see Figure E-8). Also use these descriptors for the downstream edges of fords.
• At streambed elevation—No perch at the outlet.
• Cascade over riprap—Culvert outlet flows onto either a rough riprap surface causing turbulence or a riprap or bedrock surface where flow depth decreases as it exits the culvert.
• Freefall into pool—Culvert outlet is perched directly over a pool. Requires migrating fish to jump into culvert from outlet pool.
• Freefall onto riprap—Culvert outlet is perched and exiting water plunges onto riprap or bedrock with no pool.
• Outlet apron—Aprons are usually made of concrete or riprap and installed to prevent or reduce scour. If an apron exists, provide brief a description, includ-ing any low-flow concentration structures (such as curbs), and include a site sketch.
Skew
Outlet configuration

46
Figure E-8. Outlet types.
Outlet Types
Outlet dropor perch.
E8c—Freefall into pool
E8b—Cascade over riprap
E8d—Freefall onto riprap
E8a—At streambed elevation
E8e—Onto outlet apron

47
If the culvert contains baffles, weirs, boulders embedded in concrete, or other fab-ricated structures inside the culvert, give a brief description. Because baffle designs are often not standardized, a sketch with detailed dimensions is needed. Describe the structures ̓location in the pipe, materials, spacing, height, and configuration. Also describe any notch shapes, dimensions, and arrangement.
Identify problems that could cause the culvert to plug or fail and affect resources. Check any of the observed conditions or note any not listed.
• Breaks in slope inside of culvert: Make sure they are actual breaks and not just debris build up. If removing the debris would eliminate the break, it is not a slope break. Estimate horizontal distance to the break from the outlet and estimate the vertical difference.
• Debris plugging inlet (estimate the percentage of inlet that is blocked)
• Fill eroding
• Bent inlet
• Debris plugging inlet
• Bottom worn through
• Debris in culvert
• Water flowing under culvert
• Other (such as, streambed scouring between open-bottom arch foundations)
Many of these elements can also be used to describe unvented fords. Other observa-tions pertaining to fords might be: surface cracked (for concrete or asphalt), water running around edge of ford, ford surface rutted, toe of fill undermined, and so on.
Briefly describe the condition of functioning or needed BMPs such as fillslope vegeta-tion or other erosion controls, downstream grade controls, etc. Show problems in a sketch and photographs.
This is one of the factors influencing the magnitude damage to the stream and road if the crossing should fail. Most decision makers will consider this as they decide which crossings should be replaced first. Streams can be diverted at crossings if the road has “a continuous climbing grade across the stream crossing or where the road slopes downward away from a stream crossing in at least one direction” (Flanagan and others 1998). For a full description of diversion potential assessment please read Flanagan and others (1998) available on the web at: http://www.stream.fs.fed.us/waterroad/ w-r-pdf/diversionpntl.pdf.
These data are optional in INFRA. These measurements are intended to define the prism of soil that would:
1. be removed to reconstruct the crossing (a major component of replacement cost) or
2. be eroded during crossing failure causing potential harm to downstream habitat.
Baffles and weirs
Pipe condition
Diversion potential—(optional data for prioritization)
Fill volume estimate—(optional data for prioritization and cost estimates)

48
This method is taken directly from Flanagan and others (1998), and is meant to gener-ate rough volumes for site comparison during project prioritization. The measurements are also commonly used for project budget cost estimates. However, they can contain signifi cant error and are not adequate for contract development.
Measure or estimate the following:• Lu and Ld: Upstream and downstream fi llslope lengths. Note that Ld often
extends below the culvert outlet.
• Su and Sd: Slope (percent) of upstream and downstream fi llslopes.
• Wr: Width of road.
• Wf: Length of road on fi ll. Measure the road from start to end of fi ll wedge (along the road alignment). At these points, the roadbed transitions from road-cut or natural ground to fi ll material.
• Wc: length of fi ll at bottom of fi ll wedge.
Wf and Wc are intended to be the dimensions of fi ll that would be removed during reconstruction or by crossing failure. If the fi ll is extremely long (as for example in a very wide valley), estimate these dimensions. In a case like this, the data analyst will have to exercise judgment to determine the appropriate lengths to use for the fi ll volume calculation.
Figure E-9. Fill volume measurements
Wr
Sd(°)Su(°)
Hu Hd
Ld
Lu
Bd
Bu
CL
Flow
Slope(°)=arctan( )
Flow
Cross-section
Side view
��
��
�������
Slope %100

49
Crossing fill measurements—solid lines are measured values; dashed lines are calcu-lated. Note that Ld often extends below the culvert outlet (Flanagan et al 1998).
Use the following equations to estimate total fill volume within the channel. Note that slope is in units of degrees. To convert slope percent to degrees, divide percent slope by 100 and take the arctangent.
1. Vu = 0.25 (Wf + Wc)(Lu cos Su)(Lu sin Su) Upstream fill prism
2. Vd = 0.25 (Wf + Wc)(Ld cos Sd)(Ld sin Sd) Downstream fill prism
3. Vr = (Hu +Hd) • (Wf + Wc) • Wr where Hu = Lu sin Su
2 2 Hd = Ld sin Sd
4. Total fill volume = Vu + Vd + Vr
Survey a longitudinal profile at each crossing, using a surveyors ̓level to provide elevation data accurate enough for passage analyses. A clinometer does not have the accuracy needed for evaluating passage. At sites without vehicular access, a hand level mounted on a rod of known elevation may be considered for steeper culverts. Be aware that hand level readings are generally not reliable enough where a hydraulic analysis will be needed. Even if the structure is so short that the entire profile is within sight distance as viewed through a hand level, holding it at exactly the same elevation throughout is very difficult. You may be tempted to accept readings of marginal ac-curacy, but small inaccuracies can make large differences in a hydraulic analysis. If a hand level is used, be sure to state that in the notes, to help explain any data discrepan-cies discovered during data processing or quality checks.
To start the survey, determine the starting point by looking at the channel upstream of the inlet. Ideally, the starting point is the tailwater control for the first upstream hold-ing habitat for a fish exiting the crossing structure (see Figure E-12). If no such feature is obvious, select the starting point to include any potentially adverse exit conditions (such as a steep slope near the crossing inlet).
Place a 300-foot tape down the approximate center of the stream channel. Set the tape to reflect any major changes in channel direction (note “lay of tape” on site sketch). Continue setting the tape through the structure and downstream to a point below the tailwater control of the pool at the structure outlet. The tailwater is the structure (ar-tificial or natural) that controls the water surface elevation at the outlet of the culvert. Tailwater controls can be riffle crests, weir crests, and natural channel constrictions. If several stair-stepped pools lead up to the outlet, set the tape to the riffle crest of the lower-most pool.
Be very careful wading through culverts. In older corrugated steel culverts check the floor carefully for rusted-through areas or jagged edges. A hardhat and flashlight are recommended items for crewmembers setting the tape and holding the rod. Where entering the structure it is not feasible, such as at small diameter or severely rusted culverts, try floating the tape down through the culvert. Otherwise, measure structure length as accurately as possible from the road surface. Make note of these measure-ments and attempt to verify length from existing road databases or from as-built plans.
Set the level to eliminate or minimize the number of times it must be moved to com-plete the survey. Usually, the road surface is optimal, allowing a complete survey to be shot from a single location. At sites with high road prisms or with breaks-in-slope in the structure, however, the best place for the level may be in the stream channel. To
The long profile survey (modified from Taylor and Love, 2002)

50
survey the longitudinal profile, place the rod at the thalweg at various stations along the center tape, capturing noticeable breaks in slope along the stream channel.
Tie all surveyed points, including multiple structures, to a common immovable datum or temporary benchmark. The center of the culvert inlet bottom (invert) is often used, but any point that can be reoccupied in the future will suffice to establish the bench-mark elevation. Where the structure is embedded, the top of the inlet or a point on the road surface can be used. Clearly mark the spot so that elevations can be checked if the level is moved or jarred during the survey, and show the spot on the site sketch. Com-monly, an arbitrary elevation of 100 feet is assigned to the datum. The first rod readingfrom the instrument is entered on the form as a “backsight” to the benchmark. The rod reading is added to the datum to determine the height of the instrument (HI). Remain-ing rod readings are subtracted from the instrumentʼs height to determine elevations. Record rod readings and elevations in the survey table (field form, p. 2). Refer to Figure E-10 for a reminder about how to read elevations from a survey rod.
Figure E-10. Reading the survey rod.
Crossings with large fills or visual obstructions may require two level setups (Figure E-11). A turning point is a temporary benchmark that can be read from both setup loca-tions. Like any benchmark, it should be marked so it can be accurately relocated. Read its elevation from level setup 1 to determine the ground elevation at the point; record the reading as a foresight. Then read it again from setup 2, recording it as a backsight. Determine HI2 by adding the rod reading to the ground elevation of the turning point. It is wise to have more than one turning point to ensure accuracy. Be sure you canread the turning point elevation(s) from setup 2 before moving the level. Figure E-11 shows sample survey calculations for a turning point. More complete instructions for surveying stream channels are in Harrelson (1994). They cover techniques for using a surveyorʼs level, as well as important channel features to capture in the survey (i.e., where to set the rod).
3 321
98
21
98
Rod Reading
Rod Reading
• Rods are divided into: feet = red numbers tenths = black numbers one-hundreths lines
• Each line is 1⁄100' thick• View A = 7.08• View B = 2.27
>>
View A View B
Turning points

51
Figure E-11. Turning point scenario. (Note: is instrument location).
Figure E-12. Long profi le survey points.
At all culverts, the following elevation and distance (feet on tape) measurements are required (see Fig E-12):
• Benchmark—Describe the point used, take a rod reading, and determine the height of instrument by adding the rod reading to the benchmark elevation (by convention, BM1 elevation is usually taken as 100). Take the benchmark eleva-tion before taking any other elevation measurements, and check it at the end of the site survey. On projecting pipes, an easy place to locate the benchmark is the fi rst corrugation at the top of the inlet.
• Inlet gradient control point (P1) and additional upstream point (P0)— The survey includes a short section above the culvert to represent channel condi-tions fi sh will face after exiting the pipe. P1 is the point used to calculate “inlet gradient”. It is usually the tallwater control for the fi rst resting pool above the culvert, where one exists. However, the point should be selected such that local adverse conditions immediately above the culvert are delineated. For example, where a culvert constricts high fl ows, sediment often deposits immediately up-
Road surface
BS = 0.8
FS = 24.7
TP
1
2
SURVEY Station1 BS(+) HI FS(-) Elevation Notes
TP1 24.7 75.3 TP1 read from level set up 1
Move level set up 2
TP1 .8 76.1
105.6 12.9 63.2 P5 water depth = 3.1
107 66.3 WS5
F ig u re E 1 0—Tu n in g p o in t s c e n a rio.
Pool Bottom
Channel bottom
Culvert
Road surface Horizontal leapdistance for
analysis species
Culvert outlet invert
Channel pointdownstream of tailwater
control
Tailwater control P6
P7
P5
P4
P3
P2
P1
First upstream resting pool control
Culvert inlet invert
Water surface at outlet pool WS5

52
stream, creating a steep slope leading into the pipe that can block fish passage (see Figure E-15). Generally, such adverse inlet conditions are found within one culvert diameter upstream of the inlet. To fully represent the aggraded reach in the long profile, more points may be needed upstream of P1. As shown in Figure E-15, those points are numbered P0, P0a, P0b, etc. The same would be true in a step pool channel, if you want to show the height and frequency of natural steps.
If the channel upstream is uniform with no special streambed features, addi-tional points are not needed upstream of P1. For P1, select a point within about 50 ̓of the pipe inlet—perhaps within 1-2 channel widths—that will represent the slope above the inlet.
• Culvert inlet invert (P2)—Used for determining culvert slope and slope at the inlet. Invert is the bottom inside surface of the culvert. If the inlet is embedded, measure the top of the substrate at the inlet.
• Roadway surface (P3)—Only an elevation is needed. Used to determine head-water depth for flood capacity calculations. If fill volume measurements are not taken, this can provide an index of fill removal costs. It can also be used for prioritization on the basis of crossing failure consequences.
• Culvert outlet invert (P4)—Used to determine culvert slope and outlet perch. Some culverts have concrete or riprap aprons lining the stream channel at the inlet or outlet to increase flood capacity and prevent scour at the outlet. Mea-sure the slope of inlet and outlet aprons.
These aprons are often velocity and depth barriers. Measure elevations at the top and bottom of the apron and adjacent points on the thalweg to calculate slope. Number the outlet apron points P4a, P4b, and so on. See Figure E-13.
Figure E-13. Detail of long profile points for outlet apron.
�P4a������������������������������������
P4b�����������������
��P4c �������������������������������������������
P4�
�
����������������������������P4c���������������������������P5�

53
• Pool bottom (P5)—Measure the lowest streambed elevation at a distance from the outlet that is within the leaping distance of the analysis species. If you have more than one analysis species, then you may need to take the elevation at more than one distance from the culvert. For adult salmon, five feet is often the maximum distance that is used; for juvenile fish the distance is a few inches. If a pool is lacking, survey the thalweg (the lowest point of channel cross-section) immediately downstream of the outlet. If the culvert is perched, this measurement determines if the take-off pool depth is adequate for making the jump.
• Water surface at outlet pool (WS5 or WS6)—This elevation can be taken in one of two ways. You can take the water depth at the pool bottom (P5) and then add water depth to the pool bottom elevation - record this elevation as WS5; or, if there is no pool take the measurements at the tailwater control. This mea-surement will usually be easiest to take at waterʼs edge—record this elevation as WS6.
• Outlet pool tailwater control (P6)—Used to determine perch, residual inlet depth, and residual pool depth. If no tailwater control feature is obvious, use the thalweg elevation of the cross-section adjacent to the outlet. Measure the tailwater control at the lowest average elevation of the bedform. See Figure E-14.
• Channel point downstream of tailwater control (P7)—The point should be far enough downstream of the tailwater control to represent water surface slope across and downstream of the control. Used for modeling flow through the tailwater cross-section in FishXing.
• Water surface at P7—Measure this at the waterʼs edge at P7.
Water surface measurements are required for the outlet pool and at P7 because the wa-ter surface slope is a better representation of hydraulic slope across the tailwater cross section than bed slope. Many practitioners take water surface elevations (or water depths) at all profile points as a check on recorded streambed elevations. Water depths can be recorded in the notes field of the profile survey form.
Other survey points may be needed to characterize passage conditions.For example:
• Apparent breaks in slope in the culvert—Older culverts can bend when roadfills slump, creating steeper sections in a culvert. If only inlet and outlet elevations are measured in a sagging culvert, steeper sections that may act as barriers will be missed.
The tailwater cross-section is used to estimate tailwater elevation at various flows by building a stage-discharge rating curve. This method is used in FishXing to determine the water-surface profile in low gradient culverts, and to estimate perch height and pool depths at various flows. The only time a tailwater cross-section is not needed is when a constant tailwater elevation is assumed (such as, lakes, beaver ponds). The tailwater control may be a natural or constructed boulder, cobble or gravel step, or a log structure. Locate the cross-section at the tailwater control, perpendicular to flow.Where no particular structure is controlling the water-surface elevation downstream of the crossing, the bed and bank resistance control tailwater elevations. Then, locate the cross-section very near the outlet. Cross-sections typically start (station 0.0 feet) on the left bank looking downstream. Place a tape securely across the channel no lower than bankfull elevation. If feasible, conduct the cross-section survey without moving
Tailwater cross-section

54
the survey instrument (the instrumentʼs height is the same as for the profile survey). Survey elevations at obvious breaks in slope. Record horizontal distance to each sur-veyed point from the cross-section starting point, and the rod reading. Describe pointlocations, such as bankfull channel margin, edge of water, toe of bank, thalweg, mid-channel bar, edge of rooted vegetation, and so on. See Figure E-14.
Figure E-14. Measuring the tailwater control.
A simplified tailwater-control cross-section with fewer points can be used in FishXing. The data needed are as follows:
• Tailcrest elevation (lowest average elevation of the tailwater control);
• Tailcrest bedwidth;
• Bankfull elevation; and
• Bankfull width.
This method simplifies the tailwater control to a trapezoidal cross-section.
Mark the appropriate line. For a crossing structure to meet the criteria for natural channel simulation, structures must have streambed substrate throughout. A continu-ous layer of substrate, and bedform types similar to those in the adjacent channel help ensure that the organisms moving in the stream can move through the structure. Measurements of the depth of sediment and its location (if sediment does not cover the entire length of the pipe) are made most efficiently during the profile survey. Measure the depth of the streambed substrate at the inlet and the outlet ends of the structure,even if substrate does not extend throughout the structureʼs entire length. Structure height and substrate depth can be difficult to measure in pipe arch and box culverts that contain sediment throughout, and guesswork can cause errors. See discussion of “Culvert Dimensions.”
Streambed substrate retention

55
Rank (1-highest) the first three substrate sizes that occupy the greatest area of the streambed. Take the substrate sizes in three locations:1) in the structure, 2) at the tai water control, and 3) in the channel outside the influence of the crossing. Usually the last observation is taken at the same location as the channel width and slope measure-ments (and reference cross section, if included). Substrate sizes from locations 1) and 2) are needed to calculate Mannings “n” roughness coefficients for FishXing. Sub-strate size around the reference cross-section determines the roughness value used tocalculate flows through that cross-section. All three locations are used to evaluate if the crossing resembles the adjacent natural stream channel and for pre-design replace-ment cost-estimates.
Use the following definitions of substrate particle sizes:• Bedrock = large masses of solid rock;
• Boulder = > 256 mm (>10 inches);
• Cobbles = 64 to 256 mm (2.5 to 10 inches);
• Gravel = 2 to 64 mm (0.08 to 2.5 inches);
• Sand = .06 mm to 2 mm(< 0.08 inches);
• Silt and clay = difficult to differentiate individual grains;
• Organics = muck, organic ooze; and
• Aquatic macrophytes (rooted aquatic vegetation).
Measure the width of the channel at the bankfull level. Five measurements (includ-ing the cross-section, if measured) should be taken across straight stretches of the channel and then averaged. Space the five measurements out over the reach used to measure channel gradient (8-10 channel widths in length), which should be well above any influence the stream crossing may have on channel width or slope. Undersized culverts can influence the channel width for several hundred feet upstream as a result of ponding storm runoff and causing bedload deposition. Because crossings are often near natural slope breaks, look for significant channel changes near the crossing. If upstream and downstream reaches are very different, slope and width should be mea-sured on both reaches.
In many places, bankfull discharge is a high flow occurring every one to two years on average. Bankfull elevation can be tricky to identify in the field, and field person-nel should be thoroughly trained by specialists familiar with the hydrologic regime, stream morphology, and riparian vegetation of the area. Information on how to recog-nize bankfull elevation can be found in “Applied River Morphology” by Dave Ros-gen, “Stream Channel Reference Sites” by C.C. Harrelson and others, and two videos published by the Stream Team: “A guide to Field Identification of bankfull stage in thewestern United States”, and “Identifying bankfull stage in forested streams in the eastern United States” (www.stream.fs.fed.us).
Substrate particle sizes
Bankfull channel widths

56
Figure E-15. Survey calculations.
Calculate the following, using the surveyed elevations and distances (SeeFigure E-15):
• Culvert slope—Culvert slope in percent is the inlet outvert elevation minus the inlet invert elevation divided by the horizontal culvert length, multiplied by 100. In general, culvert slopes and lengths are such that, for assessment pur-poses, slope distance can be used in this calculation. Use streambed elevations for embedded culverts.
• Outlet drop—The outlet drop is the jump at the outlet of the structure that a fi sh must negotiate to enter the structure. At extreme low fl ows the outlet drop is controlled by the substrate elevation at the tailwater of the outlet pool (Figure E-15). The total outlet drop is the elevation difference between the outlet invert and the downstream tailwater control. Tailwater elevations will be higher than the lowest point in the tailwater control, as long as fl ow continues across the control; the outlet drop measurement represents the highest jump possible (the jump that would be needed at zero fl ow). Where hydrologic data indicate that
Survey calculations
��������������P4���P6
����������������������������������
P0
P2
P4
P6
P0a P1
Road SurfaceCulvert InletTailwaterControl
Residual PoolDepth
Residual InletDepth
Water Surface
Slope (+)
Road Fill
P1P2
P6
Inlet gradient = elevation P1 - P2
distance P1 P2
P4
Residual Pool Depth = (P6 - P5)
Residual lnlet Depth = (P6 - P2 )
* 100 Culvert slope = elevation P2 - P4
distance P2 P4 * 100
Backwatered culvert
Perched culvert with sediment accumulation above inlet.
���������������������������P1 ��P2
� ������������������������������������������������������������������������������������������P1����P2* 100

57
flows never approach zero, as in spring-fed streams, this calculation will give an unrealistic overestimate of perch height. In this situation the analyst should make allowance for low-flow water depth.
• Channel gradient—The difference in the elevation of the water surface mea-sured at two points along the natural channel divided by the length of channel between those two points (use up and downstream ends of channel segments, measured under “channel slope”). The measured length should follow the streamʼs course and not the shortest distance between two points. Calculate both upstream and downstream gradients if they are different.
• Inlet gradient—Calculate the gradient immediately upstream of the inlet as an indicator of adverse inlet conditions. Passage may be impaired if channel gra-dient directly above the structure is steeper than the average channel gradient.
• Inlet width to bankfull channel width ratio—For a crossing structure to meet the criteria for stream simulation, this ratio must be 1 or greater. Struc-tures that do not constrict the channel at most flows are generally more suc-cessful at passing fish and other biota.
• Residual inlet depth (P6 – P2)—The residual inlet depth is the depth of water at the inlet of the structure under no or very flow. When the outlet tailwater control elevation is higher than the invert of the inlet, the residual inlet depth will be a positive number and the structure will be backwatered at all flows. A positive residual inlet depth is generally conducive to passage of most species and life stages. Write 0 if the tailwater control is lower than the inlet invert.
• Residual pool depth (P6 – P5)—The residual pool depth is the depth of water in the outlet pool under no or very low flow. Some species, notably salmonids, may be able to negotiate an outlet drop providing there is a jump pool of suf-ficient depth is present.
• Substrate ratio—The substrate ratio is the ratio of the depth of the substrate to the height of an embedded structure. Substrate ratio is important to the func-tion of structures that simulate the stream. The substrate must be deep enough that the channel inside the structure is able to adjust vertically over the range of design flows. Generally 20% depth of embedment is considered a minimum.
Unvented fords that have some accommodation for fish passage may be surveyed if, for example, baseline measurements are desired for later comparison. Channel and ford widths and slopes, as well as any grade breaks, should be the focus of the survey.
Use the following assessment criteria to determine the barrier category ofthe crossing structure.
Check ʻresembles natural channel ̓if:• The streambed substrate is continuous through the structure;
• The inlet width is greater than the channel width (inlet width to channel bank-full width ratio > 1.0);
• No outlet drop exists, and
• No other obvious factors are affecting passage (such as, trash racks or drop inlets) are present.
Field passage evaluation

58
If the structure does not meet these criteria, then use the analysis species regional coarse filter criteria to categorize the crossing. The categories include: passage ad-equate, passage inadequate, or when passage is uncertain, passage indeterminate. List the species, lifestage, or species group that the regional criteria are based on. If your evaluation differs from the coarse filter assessment criteria, be sure to explain why.
Use this section to:• Clarify items that may not be clear in the data, the site sketch, or the photo-
graphs;
• Describe any data-gathering problems;
• Record qualitative notes describing stream habitat immediately upstream and downstream of the crossing;
• Report any fish present at the site; include number, size, and species, if known (remember that rigorous inventory methods are needed to document species absence);
• Note any possible upstream or downstream barriers;
• Bank vegetation near the culvert; and
• Describe any substrate structure inside the pipe (such as, step-pools, meander-ing, presence of a low flow channel, or substrate exposed at low flows that might be usable by crawling species).
• Photograph all culvert locations. At a minimum, photographs of the inlet, out-let, and tailwater control of each culvert are required. We also recommend that a photo be taken from the inlet looking upstream to show streambed conditions and possible obstacles for exiting fish. For low-water crossings, take photos from both upstream and downstream. Where multiple structures are present, photograph all of them to show their locations and arrangements. Also show the driving surface of fords. For information on using spatially referenced pho-tographic techniques to document the survey, see http://csmres.jmu.edu/forest-service.
• Record the global positioning system location of the photo points if desired.
• On the site sketch, mark your photo points so future photographs can be taken from the same places.
• Photograph any unique features about a site, such as steep drops at inlets; perched outlets; breaks-in-slope; poor or damaged condition; outlet pool condi-tions; and habitat above and below the site.
Sketch each stream crossing and the surrounding site, including relevant features of the adjacent stream reaches. The sketch and notes are as important as the data col-lected. Include the following features in site sketches:
• North arrow;
• Direction of stream flow, road number/name, and stream name;
• Alignment of stream channel and culvert inlet;
• Locations of photo points;
• Wingwalls and inlet /outlet aprons and their dimensions;
Comments
Photographs
Site sketch

59
• Locations and designations of multiple structures at one site;
• Baffle configuration, dimensions, and number of sets;
• Weirs and other instream structures;
• Upstream or downstream debris jams;
• Trash racks, screens, standpipes, drop inlets, or any other structure associated with the crossing that may affect passage;
• Damage or obstacle inside structure;
• Location and quantity of riprap for bank armoring or jump pool formation.
How the culvert is aligned with the upstream channel can have very important effects on aquatic species passage and should be well documented on the sketch. A severe angle of approach to the inlet (see Figure E-16) can cause floating pieces of wood to plug the culvert, and can induce sediment deposition, bank erosion and inlet scour in some open-bottom structures. If the inventory will be used for preliminary design, the sketch should also show stream meanders and side channels in the vicinity of the crossing.
Figure E-16. The site sketch should show stream location, with special attention to culvert inlet and outlet. It should include any erosion and deposition features.
Low and high passage flows needed in FishXing are often derived from USGS regres-sion equations with large standard errors of estimation. A reference cross-section can be surveyed to help determine if the results are reasonable. To get an independent estimate of bankfull flow, average cross section velocity and discharge are calculated from the hydraulic slope, cross section geometry and roughness. Several methods are described in detail in the WinXSPRO Userʼs Manual (USDA-FS 1998).
The cross-section should be located outside the area of influence of the culvert—usu-ally upstream—and should be in a relatively uniform, straight channel section. Use the same procedure described for the tailwater cross-section.
Reference cross-section (optional)

60
Slope is needed for the reference cross-section flow calculations. Some practitioners also measure it both up and downstream to establish the crossingʼs context within the longitudinal profile of the natural channel. Often roads are built on slope breaks and the up and downstream gradients are quite different. Determine the natural channel gradient by measuring water surface slope. Take several elevations at the waterʼs edge along a representative segment of stream that is outside the crossingʼs influence. Seg-ments should be at least 8-10 channel widths long and the endpoints should be taken at similar streambed locations, preferably at riffles or runs.
Usually you will need to move away from the crossing to get representative channel slope measurements. If moving the level is awkward because of dense vegetation, you can use a hand level mounted on a rod of known height. With a hand level, several points on the water margin elevations are likely to be needed because the rod cannot be read at long distances. Record rod readings and distances between each measurement. As the two crewmembers move progressively up or down the channel, the next rod reading must be taken from the exact spot the rod was held for the previous reading. Note that when this method is used, the channel slope measurement may not be tied into the survey benchmark.
This sheet documents critical information needed to complete the permanent record of the site survey, and to assist in making prioritization decisions. Field crews do not need this page in the field.
Because passage requirements are specific to species, lifestage (size), or species groups1, so are barrier determinations. The inventory procedure described here results in enough data to assess passage for many fish species, life stages, or species groups in most situations. Your list of species may be broader than fish, however. Therefore, we recommend identifying specific species, life stages, or species groups in the planning stages, to allow for the eventuality that additional data might need to be collected for these non-fish species.
List the species, life stages, or species groups for that will be used in to assess passage at the crossing. In the comment section, note the reason for choosing each species.
Record the length of upstream and downstream habitat that will become accessible by restoring passage at the site. To make this a more complete prioritization tool, also note habitat quality.
Record upstream and downstream crossings separately. If there are upstream crossings in the watershed, record the number. Record the distance in feet to the nearest up-stream crossing (1st crossing) and check yes or no to indicate if it is a known barrier for the selected species. Do the same for the next nearest upstream crossing (2nd crossing). Follow this same procedure for downstream crossings and for other barriers and record the results in the spaces provided.
The presence of other barriers in the drainage network is important information for deciding the amount of benefit that will be gained by restoring passage at the crossing.
Channel slope outside of structure’s influence (Optional)
Biological and watershed information
Analysis species
Length of upstream and downstream habitat (prioritization data)
Upstream and down-stream crossings and other potential barriers (prioritization data)
1 Species group: A group of species with similar morphology, swimming capability and behavior. The capability is used to determine the values in the regionally defined flowchart that classifies the passage status of a crossing.

61
Indicate whether the barrier is to be left in place to limit the upstream expansion of exotic species. This information will be input to INFRA. (Footnotes)
Crossing is a barrier to exotic species

62