national irish bank & northern bank irish bank 10 head office: dublin important market position...
TRANSCRIPT
National Irish Bank & Northern Bank
www.nib.iewww.nbonline.co.uk
Copenhagen, December 14, 2004
2
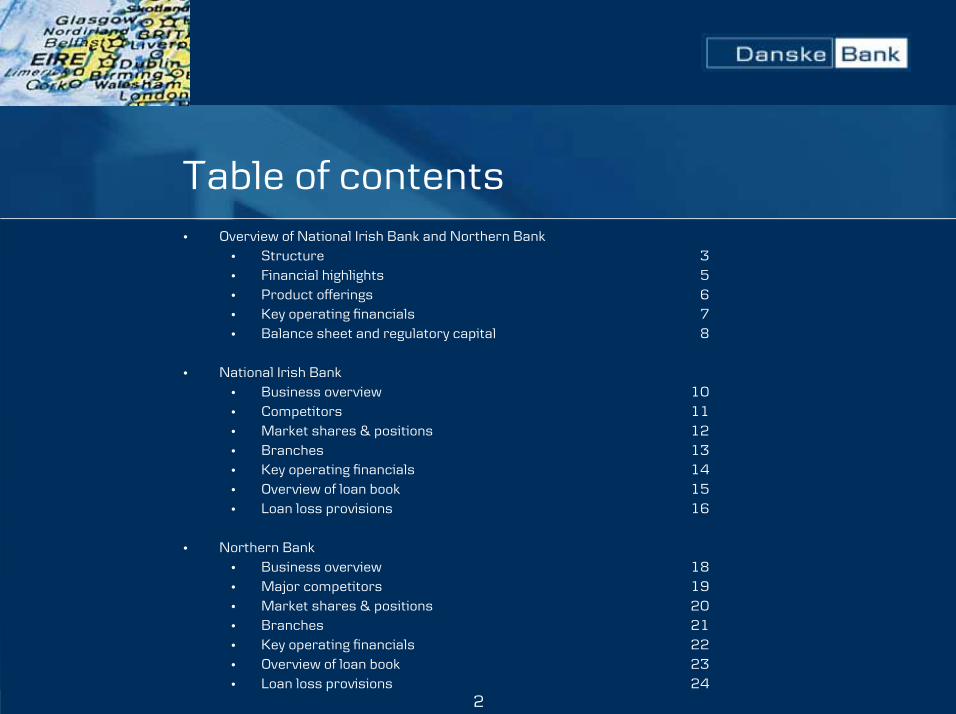
Table of contents� Overview of National Irish Bank and Northern Bank
� Structure 3� Financial highlights 5� Product offerings 6� Key operating financials 7� Balance sheet and regulatory capital 8
� National Irish Bank� Business overview 10� Competitors 11� Market shares & positions 12� Branches 13� Key operating financials 14� Overview of loan book 15� Loan loss provisions 16
� Northern Bank� Business overview 18� Major competitors 19� Market shares & positions 20� Branches 21� Key operating financials 22� Overview of loan book 23� Loan loss provisions 24
3
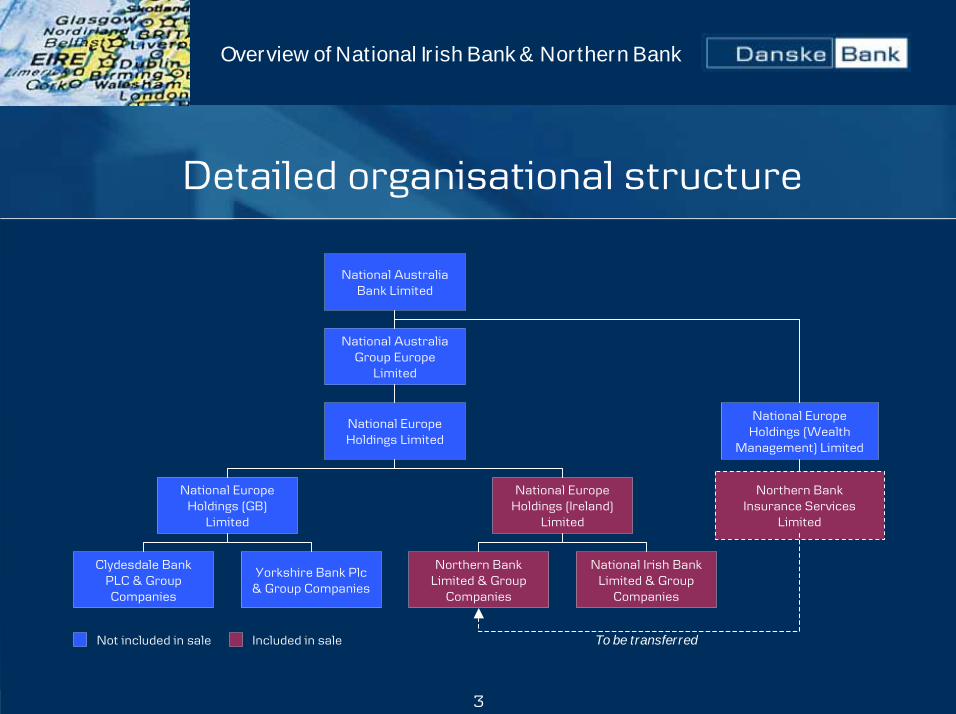
Detailed organisational structure
Northern BankInsurance Services
Limited
National AustraliaBank Limited
National AustraliaGroup Europe
Limited
National EuropeHoldings Limited
Northern BankLimited & Group
Companies
National Irish BankLimited & Group
Companies
Clydesdale BankPLC & GroupCompanies
Yorkshire Bank Plc& Group Companies
National EuropeHoldings (GB)
Limited
National EuropeHoldings (Ireland)
Limited
National EuropeHoldings (Wealth
Management) Limited
To be transferredNot included in sale Included in sale
Overview of National Irish Bank & Northern Bank
4
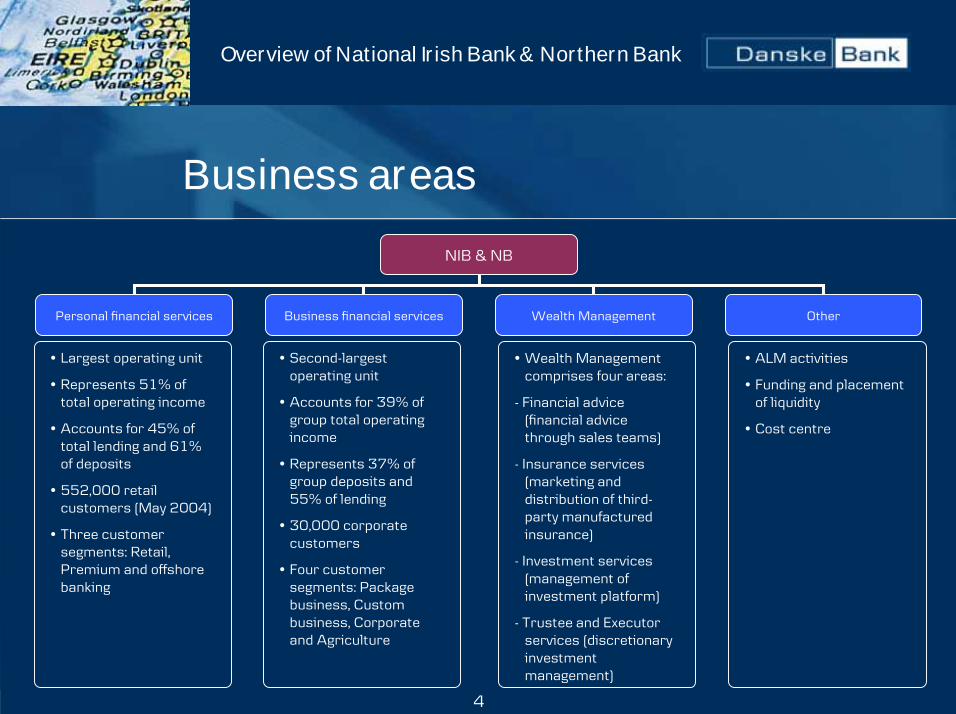
� Largest operating unit
� Represents 51% oftotal operating income
� Accounts for 45% oftotal lending and 61%of deposits
� 552,000 retailcustomers (May 2004)
� Three customersegments: Retail,Premium and offshorebanking
� Second-largestoperating unit
� Accounts for 39% ofgroup total operatingincome
� Represents 37% ofgroup deposits and55% of lending
� 30,000 corporatecustomers
� Four customersegments: Packagebusiness, Custombusiness, Corporateand Agriculture
� ALM activities
� Funding and placementof liquidity
� Cost centre
� Wealth Managementcomprises four areas:
- Financial advice(financial advicethrough sales teams)
- Insurance services(marketing anddistribution of third-party manufacturedinsurance)
- Investment services(management ofinvestment platform)
- Trustee and Executorservices (discretionaryinvestmentmanagement)
Business areas
NIB & NB
Personal financial services Business financial services Wealth Management Other
Overview of National Irish Bank & Northern Bank
5
3
47 49
Contribution(after bad debts)
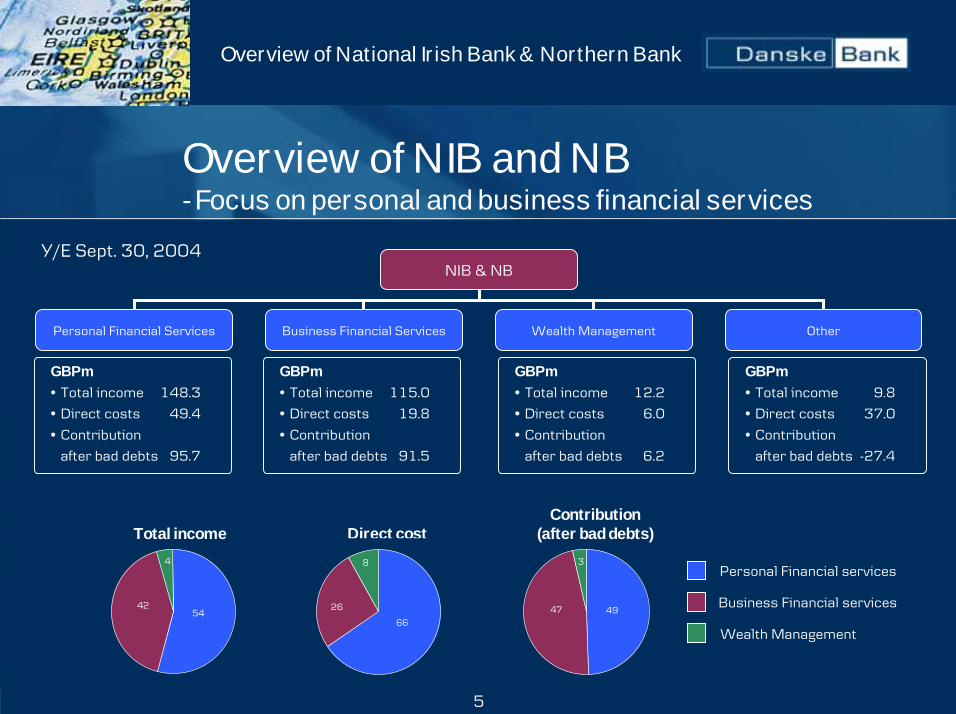
Overview of NIB and NB- Focus on personal and business financial services
NIB & NB
Personal Financial Services Business Financial Services Wealth Management Other
GBPm
� Total income 148.3
� Direct costs 49.4
� Contribution
after bad debts 95.7
GBPm
� Total income 115.0
� Direct costs 19.8
� Contribution
after bad debts 91.5
GBPm
� Total income 12.2
� Direct costs 6.0
� Contribution
after bad debts 6.2
GBPm
� Total income 9.8
� Direct costs 37.0
� Contribution
after bad debts -27.4
Personal Financial services
Business Financial services
Wealth Management
4
4254
Total income Direct cost
66
26
8
Y/E Sept. 30, 2004
Overview of National Irish Bank & Northern Bank
6
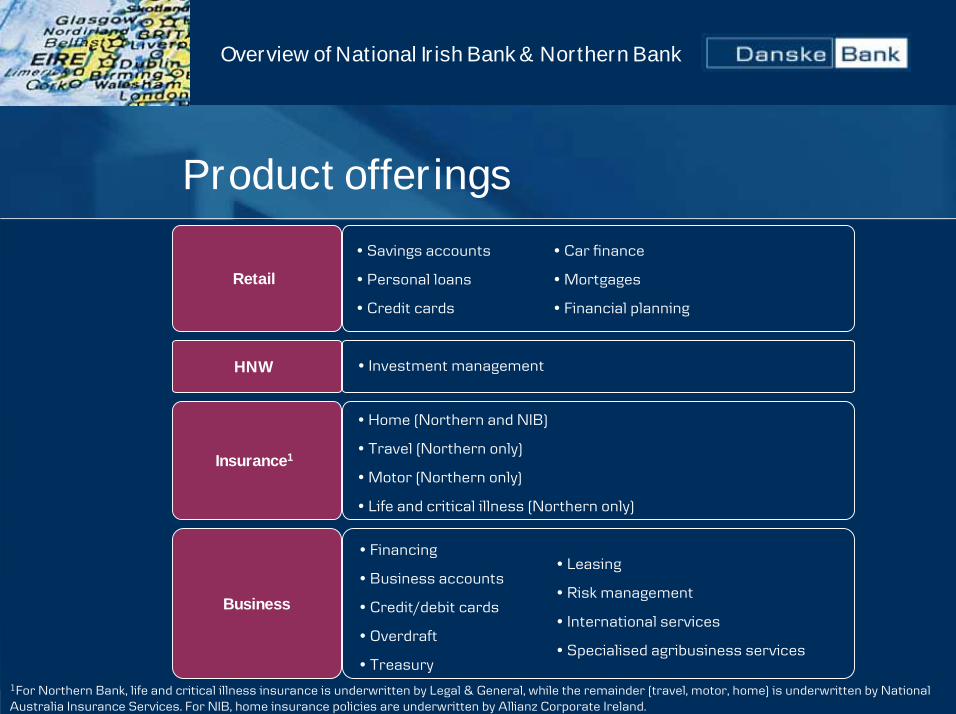
Product offerings
HNW � Investment management
Retail
� Savings accounts
� Personal loans
� Credit cards
� Car finance
� Mortgages
� Financial planning
Business
� Financing
� Business accounts
� Credit/debit cards
� Overdraft
� Treasury
� Leasing
� Risk management
� International services
� Specialised agribusiness services
1For Northern Bank, life and critical illness insurance is underwritten by Legal & General, while the remainder (travel, motor, home) is underwritten by NationalAustralia Insurance Services. For NIB, home insurance policies are underwritten by Allianz Corporate Ireland.
Insurance1
� Home (Northern and NIB)
� Travel (Northern only)
� Motor (Northern only)
� Life and critical illness (Northern only)
Overview of National Irish Bank & Northern Bank
7
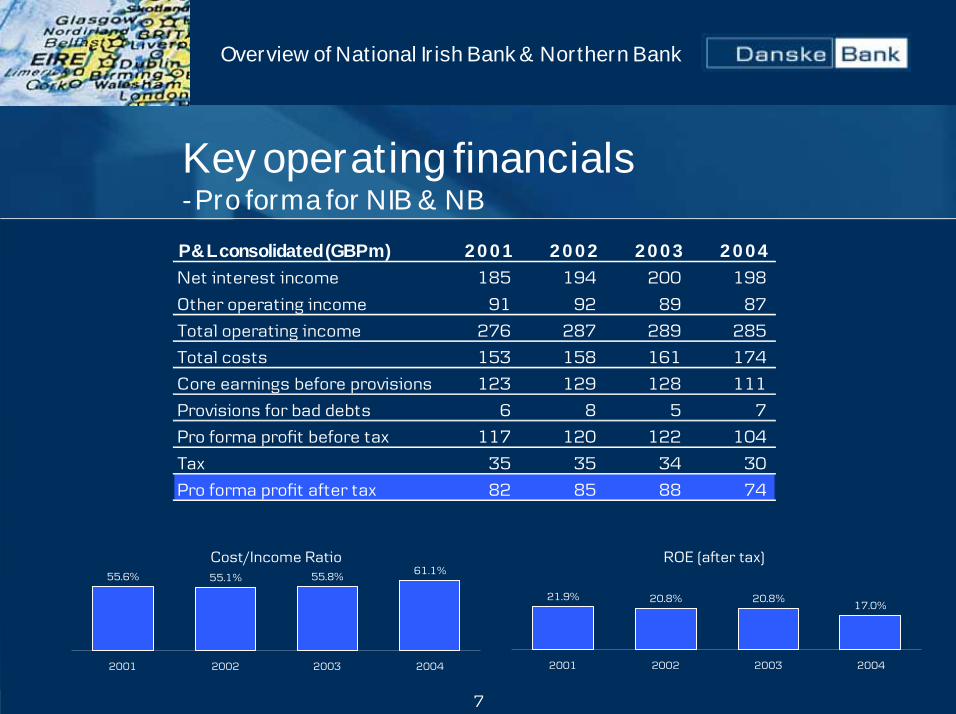
21.9% 20.8% 20.8%17.0%
2001 2002 2003 2004
55.6% 55.1% 55.8% 61.1%
2001 2002 2003 2004
Key operating financials- Pro forma for NIB & NB
Cost/Income Ratio ROE (after tax)
Overview of National Irish Bank & Northern Bank
P&L consolidated (GBPm) 2001 2002 2003 2004
Net interest income 185 194 200 198
Other operating income 91 92 89 87
Total operating income 276 287 289 285
Total costs 153 158 161 174
Core earnings before provisions 123 129 128 111
Provisions for bad debts 6 8 5 7
Pro forma profit before tax 117 120 122 104
Tax 35 35 34 30
Pro forma profit after tax 82 85 88 74

8
Balance sheet & reg. capital- Pro forma for NIB & NB
Consolidated balance sheet (Sept. avg) (GBPm) 2001 2002 2003 2004
Total core lending 4,252 4,476 4,823 5,147
Total assets 5,735 5,960 6,415 7,004
Total core deposits 3,909 4,015 4,362 4,577
Total liabilities 5,341 5,548 5,978 6,551
Shareholders' equity 393 412 436 453
Total liabilities and shareholders' equity 5,735 5,960 6,415 7,004
Consolidated regulatory capital (Sept.) (GBPm) 2001 2002 2003 2004
Tier 1 capital 343 365 395 397
Eligible tier 2 capital 194 196 198 227 Total capital 538 561 592 623 Risk weighted assets 4,056 4,243 4,467 4,673 Tier 1 ratio (%) 8.5 8.6 8.8 8.5 Total capital ratio (%) 13.3 13.2 13.3 13.3
Overview of National Irish Bank & Northern Bank
National Irish Bank
www.nib.ie
10
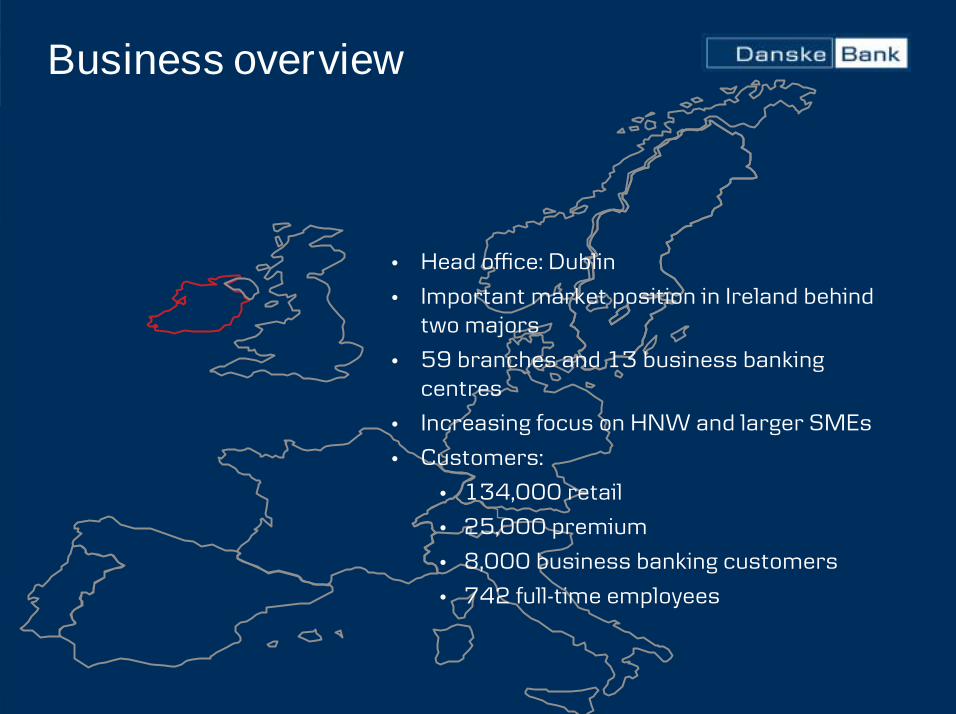
� Head office: Dublin
� Important market position in Ireland behindtwo majors
� 59 branches and 13 business bankingcentres
� Increasing focus on HNW and larger SMEs
� Customers:
� 134,000 retail
� 25,000 premium
� 8,000 business banking customers
� 742 full-time employees
Business overview
11
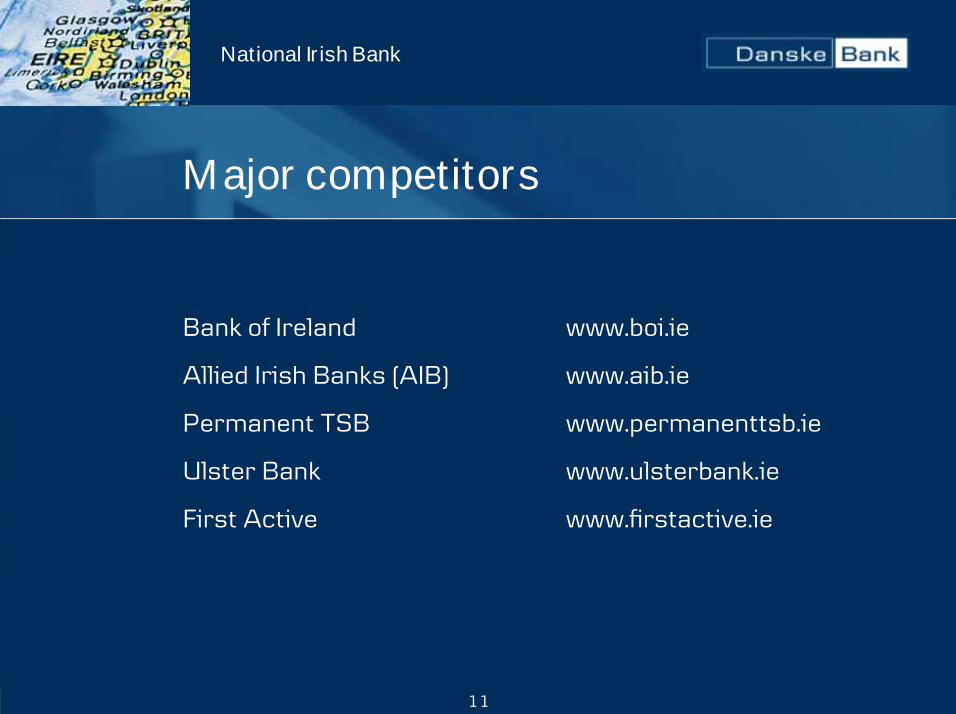
Major competitors
National Irish Bank
Bank of Ireland www.boi.ie
Allied Irish Banks (AIB) www.aib.ie
Permanent TSB www.permanenttsb.ie
Ulster Bank www.ulsterbank.ie
First Active www.firstactive.ie
12
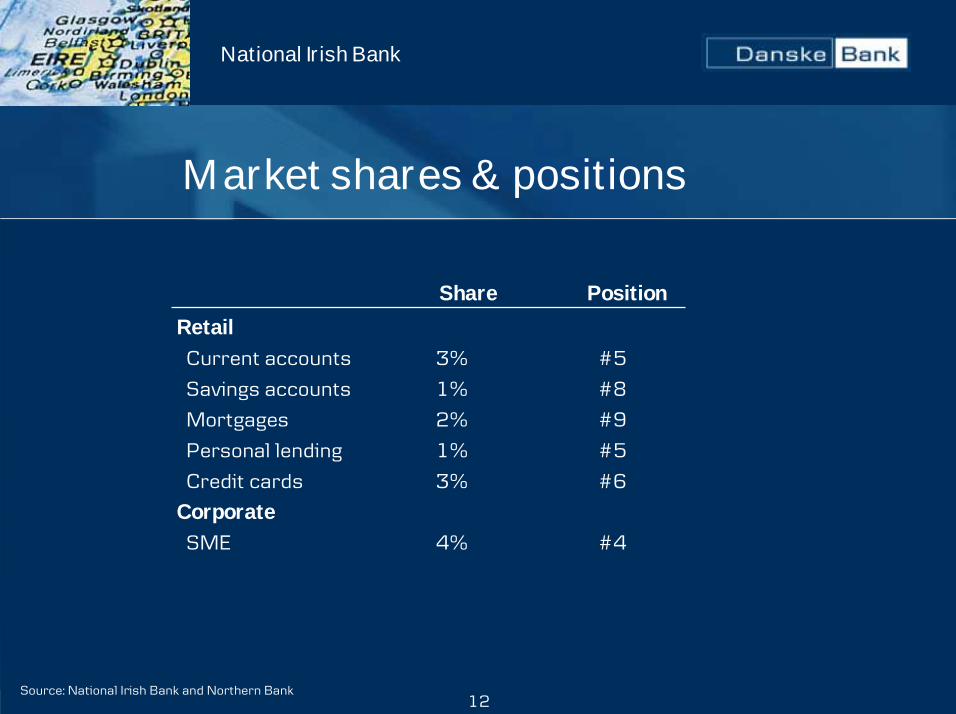
Market shares & positions
National Irish Bank
Share Position
Retail
Current accounts 3% #5
Savings accounts 1% #8
Mortgages 2% #9
Personal lending 1% #5
Credit cards 3% #6
Corporate
SME 4% #4
Source: National Irish Bank and Northern Bank
13
Bank of Ir
elandAIB Perm
anent tsb
Ulster B
ankNatio
nal Irish B
ank
First A
ctive
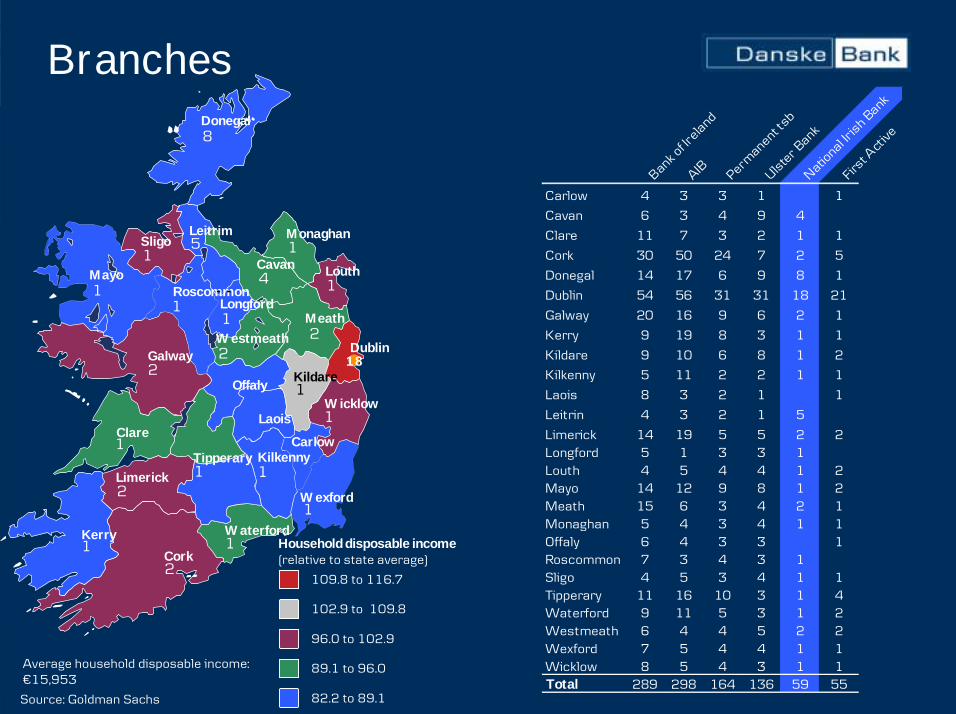
Carlow 4 3 3 1 1
Cavan 6 3 4 9 4
Clare 11 7 3 2 1 1
Cork 30 50 24 7 2 5
Donegal 14 17 6 9 8 1
Dublin 54 56 31 31 18 21
Galway 20 16 9 6 2 1
Kerry 9 19 8 3 1 1
Kildare 9 10 6 8 1 2
Kilkenny 5 11 2 2 1 1
Laois 8 3 2 1 1
Leitrin 4 3 2 1 5
Limerick 14 19 5 5 2 2Longford 5 1 3 3 1Louth 4 5 4 4 1 2Mayo 14 12 9 8 1 2Meath 15 6 3 4 2 1Monaghan 5 4 3 4 1 1Offaly 6 4 3 3 1Roscommon 7 3 4 3 1Sligo 4 5 3 4 1 1Tipperary 11 16 10 3 1 4Waterford 9 11 5 3 1 2Westmeath 6 4 4 5 2 2Wexford 7 5 4 4 1 1Wicklow 8 5 4 3 1 1Total 289 298 164 136 59 55
Donegal
Cavan
Monaghan
Louth
MeathLongford
LeitrimSligo
RoscommonMayo
OffalyKildare
WicklowLaois
Clare
Tipperary Kilkenny
Limerick
Kerry
Cork
Waterford
Wexford
Carlow
- -
Dublin 18Galway
2
11
21 1
1
1
1
2
11
12
4
1
8
1
1
1
109.8 to 116.7
102.9 to 109.8
96.0 to 102.9
89.1 to 96.0
82.2 to 89.1
Household disposable income(relative to state average)
Branches
5
Average household disposable income:�15,953
Source: Goldman Sachs
Westmeath2
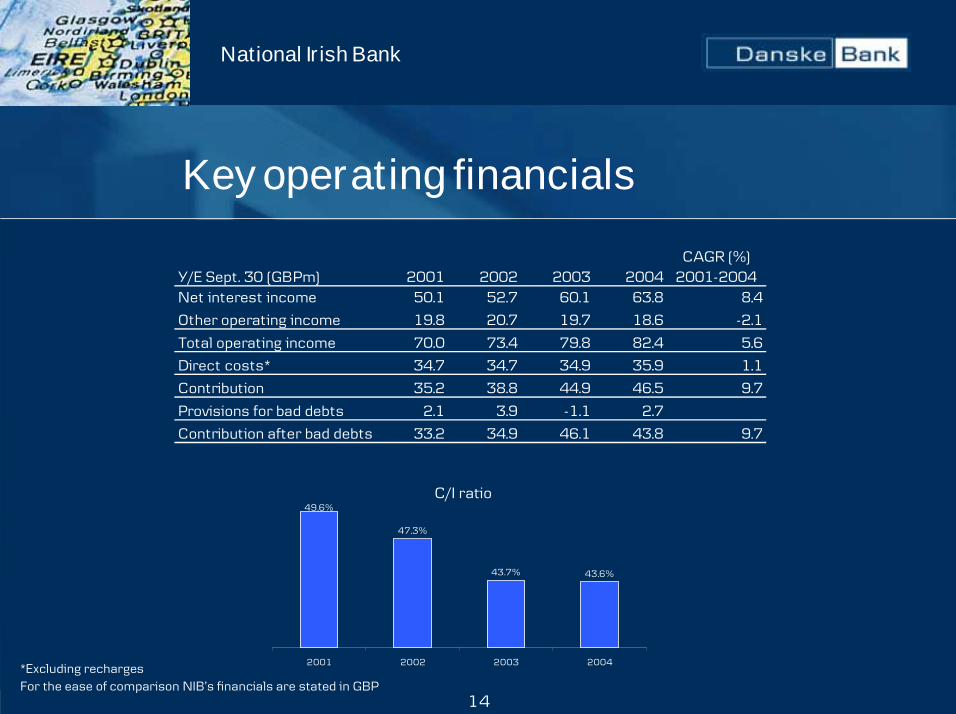
14
49.6%
47.3%
43.7% 43.6%
2001 2002 2003 2004
Key operating financials
C/I ratio
Y/E Sept. 30 (GBPm) 2001 2002 2003 2004CAGR (%)
2001-2004Net interest income 50.1 52.7 60.1 63.8 8.4
Other operating income 19.8 20.7 19.7 18.6 -2.1
Total operating income 70.0 73.4 79.8 82.4 5.6
Direct costs* 34.7 34.7 34.9 35.9 1.1
Contribution 35.2 38.8 44.9 46.5 9.7
Provisions for bad debts 2.1 3.9 -1.1 2.7
Contribution after bad debts 33.2 34.9 46.1 43.8 9.7
National Irish Bank
*Excluding rechargesFor the ease of comparison NIB�s financials are stated in GBP
15
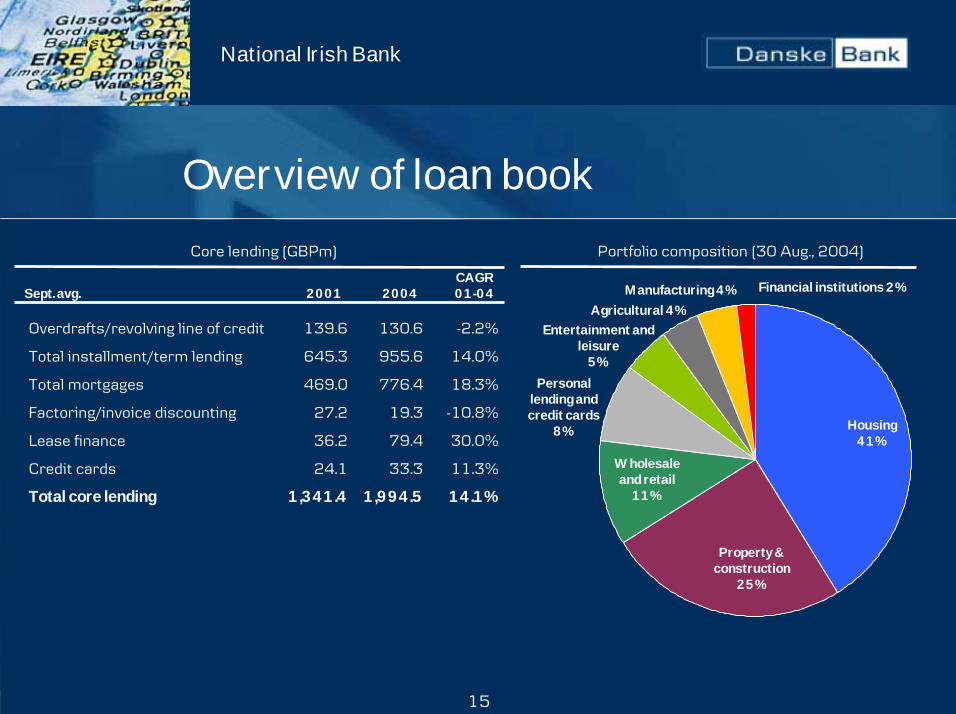
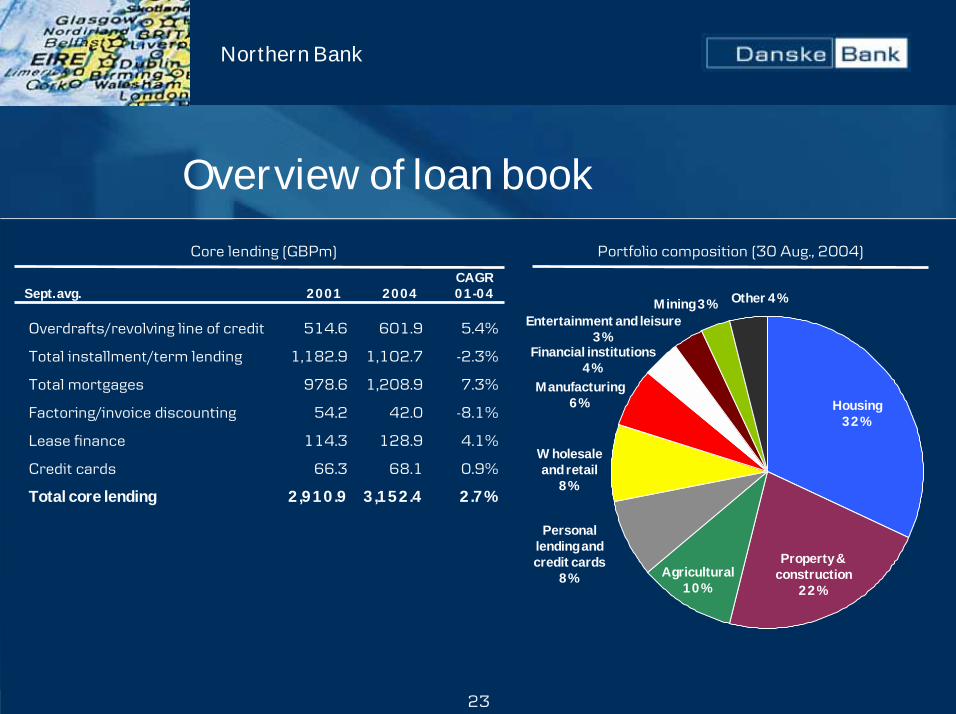
Overview of loan book
Overdrafts/revolving line of credit 139.6 130.6 -2.2%
Total installment/term lending 645.3 955.6 14.0%
Total mortgages 469.0 776.4 18.3%
Factoring/invoice discounting 27.2 19.3 -10.8%
Lease finance 36.2 79.4 30.0%
Credit cards 24.1 33.3 11.3%
Total core lending 1,341.4 1,994.5 14.1%
CAGRSept. avg. 2001 2004 01-04
Core lending (GBPm) Portfolio composition (30 Aug., 2004)
Housing41%
Property &construction
25%
Personallending andcredit cards
8%
Wholesaleand retail
11%
Manufacturing 4% Financial institutions 2%
Entertainment andleisure
5%
Agricultural 4%
National Irish Bank
16
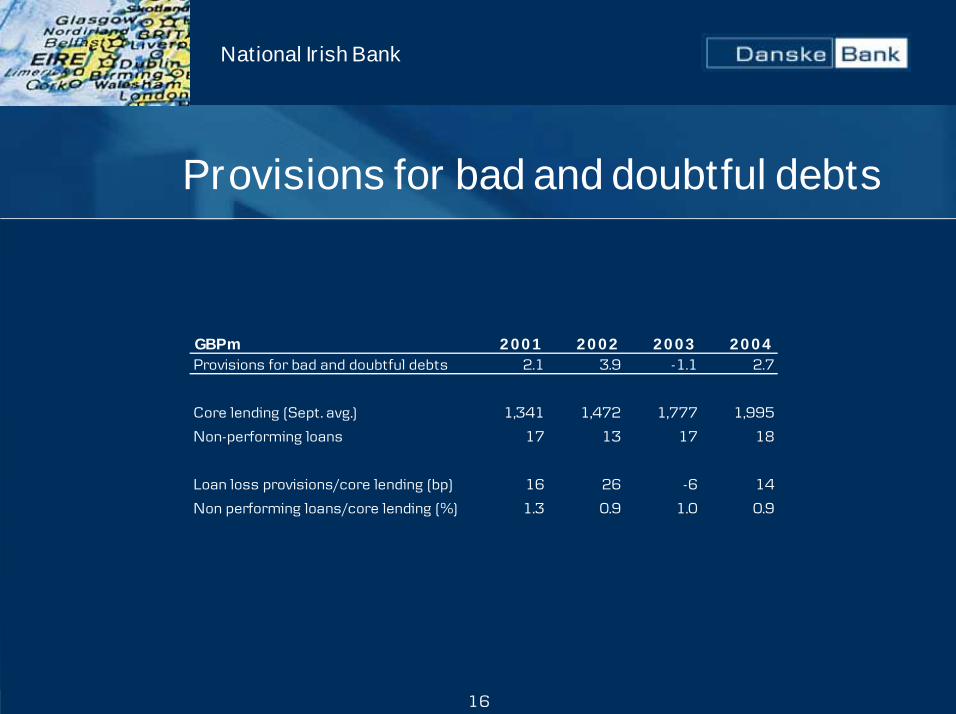
Provisions for bad and doubtful debts
GBPm 2001 2002 2003 2004Provisions for bad and doubtful debts 2.1 3.9 -1.1 2.7
Core lending (Sept. avg.) 1,341 1,472 1,777 1,995
Non-performing loans 17 13 17 18
Loan loss provisions/core lending (bp) 16 26 -6 14
Non performing loans/core lending (%) 1.3 0.9 1.0 0.9
National Irish Bank
Northern Bank
www.nbonline.co.uk
18
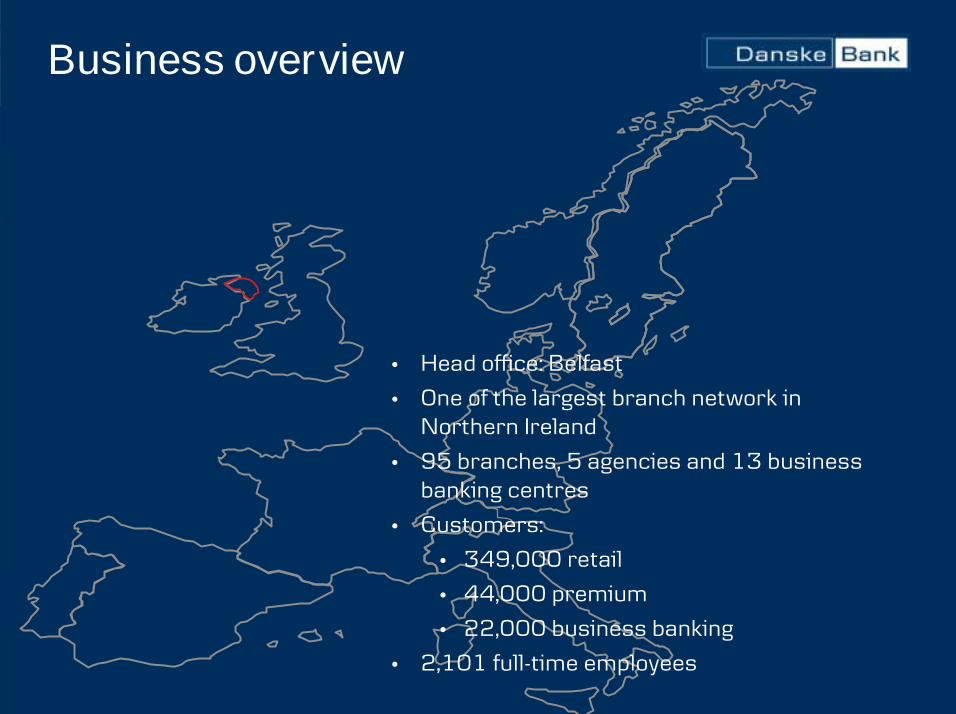
� Head office: Belfast
� One of the largest branch network inNorthern Ireland
� 95 branches, 5 agencies and 13 businessbanking centres
� Customers:
� 349,000 retail
� 44,000 premium
� 22,000 business banking
� 2,101 full-time employees
Business overview
19
Major competitors
Ulster Bank www.ulsterbank.co.uk
First Trust www.firsttrustbank.co.uk
Bank of Ireland www.boi.com
Northern Bank

20
Market shares & positions
Northern Bank
Share Position
Retail
Current accounts 21% #2
Savings accounts 13% #3
Mortgages 5% #6
Personal lending 8% #4
Credit cards 12% #3
Corporate
SME 36% #1
Source: National Irish Bank and Northern Bank
21
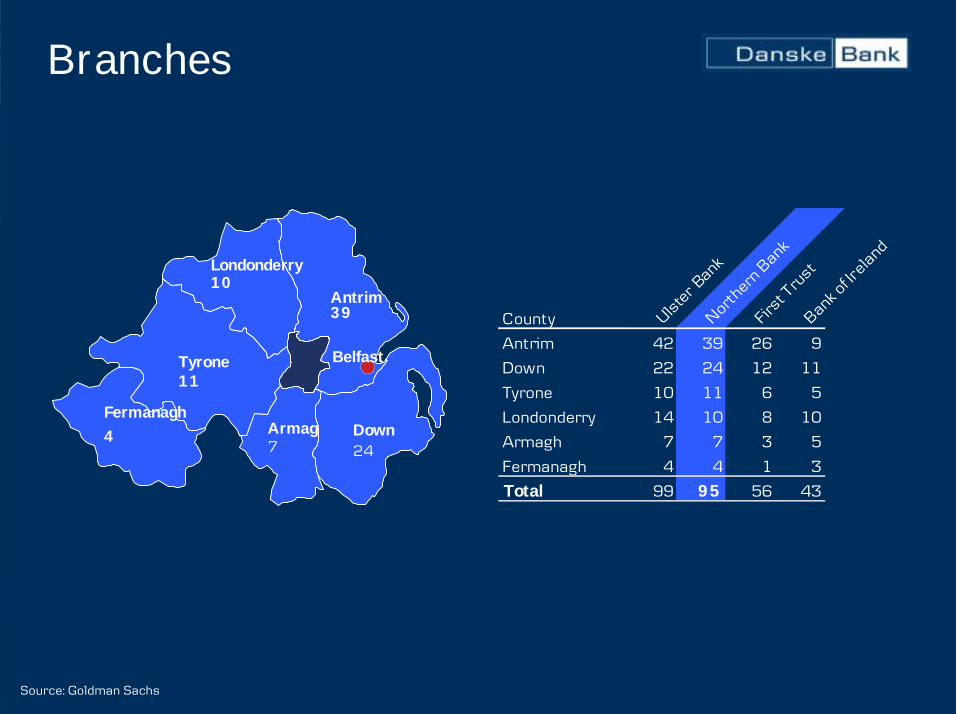
Branches
Armagh
Tyrone
Antrim
FermanaghDown
Londonderry
Belfast
4
11
10
39
247
County Ulster B
ankNorth
ern B
ankFirs
t Tru
stBank o
f Ireland
Antrim 42 39 26 9
Down 22 24 12 11
Tyrone 10 11 6 5
Londonderry 14 10 8 10
Armagh 7 7 3 5
Fermanagh 4 4 1 3
Total 99 95 56 43
Source: Goldman Sachs
22
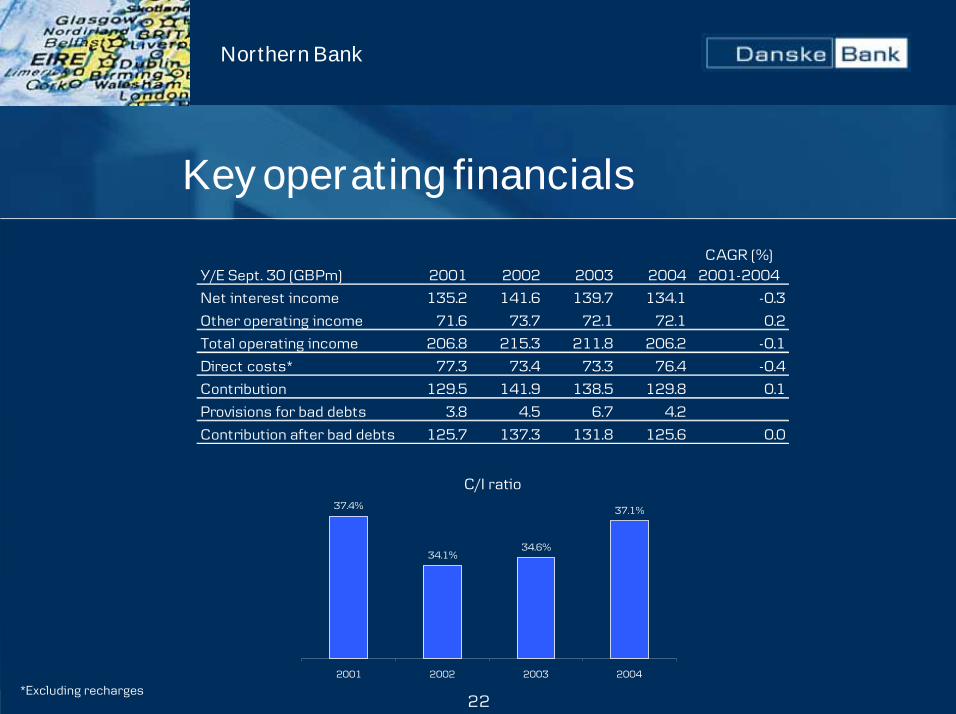
Y/E Sept. 30 (GBPm) 2001 2002 2003 2004CAGR (%)
2001-2004
Net interest income 135.2 141.6 139.7 134.1 -0.3
Other operating income 71.6 73.7 72.1 72.1 0.2
Total operating income 206.8 215.3 211.8 206.2 -0.1
Direct costs* 77.3 73.4 73.3 76.4 -0.4
Contribution 129.5 141.9 138.5 129.8 0.1
Provisions for bad debts 3.8 4.5 6.7 4.2
Contribution after bad debts 125.7 137.3 131.8 125.6 0.0
37.4%
34.1%34.6%
37.1%
2001 2002 2003 2004
Key operating financials
C/I ratio
Northern Bank
*Excluding recharges
23
Overview of loan book
Overdrafts/revolving line of credit 514.6 601.9 5.4%
Total installment/term lending 1,182.9 1,102.7 -2.3%
Total mortgages 978.6 1,208.9 7.3%
Factoring/invoice discounting 54.2 42.0 -8.1%
Lease finance 114.3 128.9 4.1%
Credit cards 66.3 68.1 0.9%
Total core lending 2,910.9 3,152.4 2.7%
CAGRSept. avg. 2001 2004 01-04
Core lending (GBPm) Portfolio composition (30 Aug., 2004)
Housing32%
Property &construction
22%Agricultural
10%
Personallending andcredit cards
8%
Wholesaleand retail
8%
Manufacturing6%
Financial institutions4%
Mining 3% Other 4%
Entertainment and leisure3%
Northern Bank
24
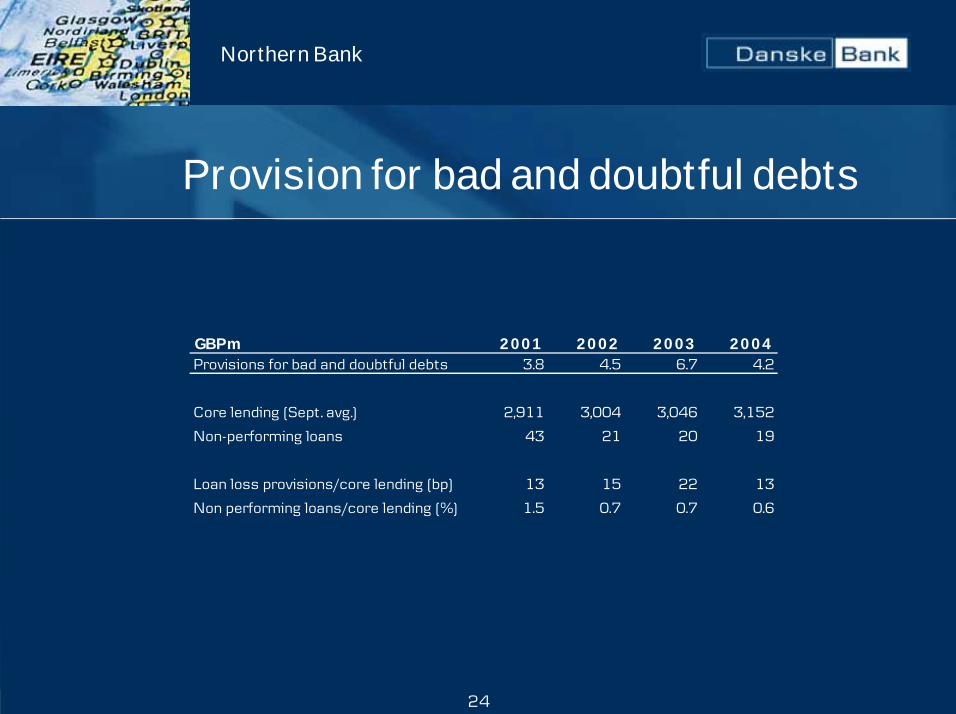
Provision for bad and doubtful debts
GBPm 2001 2002 2003 2004Provisions for bad and doubtful debts 3.8 4.5 6.7 4.2
Core lending (Sept. avg.) 2,911 3,004 3,046 3,152
Non-performing loans 43 21 20 19
Loan loss provisions/core lending (bp) 13 15 22 13
Non performing loans/core lending (%) 1.5 0.7 0.7 0.6
Northern Bank

For more information, please visit
www.danskebank.com/irireland