national malaria strategic plan, vanuatu, 2015-2020
TRANSCRIPT

NATIONAL MALARIA STRATEGIC PLAN, VANUATU, 2015-2020
7th (Final) Draft
NMSP Working Groups, Ministry of Health, Vanuatu
The Vanuatu Ministry of Health aims
to progressively control and eliminate
malaria in all 6 provinces of the
country.
This National Malaria Strategic Plan
for Vanuatu incorporates the findings
of a comprehensive Malaria Program
Review conducted in 2013 and
extensive follow-up discussions with
the national Vector Borne Disease
Control Program, MOH and other
partners, including non-Government
and civil society stakeholders.
To achieve its malaria control and
elimination targets, the VBDCP will
work in close partnership with
provincial health services and local
communities to ensure that universal
access to health promotion,
prevention with long-lasting
insecticidal bed nets, and quality-
assured diagnosis and treatment is
maintained.
Building on experience gained in pilot
elimination activities in Tafea
province, the Program will use indoor
residual insecticide spraying to
accelerate the reduction in malaria
transmission in selected areas.
It will strengthen and maintain
excellent surveillance and apply new
knowledge as it becomes available in
order to achieve malaria elimination
and the prevention of reintroduction.
By 2020, Vanuatu expects to reach an
annual parasite incidence below 1 per
1,000 nationally, and maintain zero
confirmed deaths from malaria. Three
provinces would have entered the
elimination phase (including two
provinces with zero – or close to zero –
local malaria transmission).

NATIONAL MALARIA STRATEGIC PLAN, VANUATU, 2015 – 2020
Version 7 (Final Draft) – 8 April, 2014 i
Table of Contents
Foreword ................................................................................................................................................. iv
Acronyms and Abbreviations ................................................................................................................... v
Acknowledgements ................................................................................................................................ vii
Map of Vanuatu showing provincial composition ................................................................................ viii
Executive Summary ................................................................................................................................. ix
Logic model and theory of change, National Malaria Strategic Plan, Vanuatu, 2015-20 ........................ xiii
1. Introduction ......................................................................................................................................... 1
1.1 Background – malaria in Vanuatu ......................................................................................................... 1
1.2 Malaria in the context of the national health plan ............................................................................... 1
1.3 International context and commitments .............................................................................................. 2
1.4 The planning period and reasons for selecting this period ................................................................... 2
1.5 Malaria Program Review and process of developing the strategic plan ............................................... 2
2. Country Profile ..................................................................................................................................... 4
2.1 Socio-political system ............................................................................................................................ 4
2.2 Geography and demographics .............................................................................................................. 4
2.2.1 Geography .............................................................................................................................................. 4
2.2.2 Population and demographics ............................................................................................................... 4
2.3 Ecosystem, climate and environment ................................................................................................... 5
2.4 Socioeconomic, health and development outcomes ............................................................................ 6
2.5 Health System analysis .......................................................................................................................... 9
2.5.1 Service delivery system, access and equity ........................................................................................... 9
2.5.2 Health work force ................................................................................................................................ 11
2.5.2 Other health system building blocks in relation to the Malaria Program ............................................ 12
3. Malaria Situation Analysis .................................................................................................................. 15
3.1 Epidemiology ....................................................................................................................................... 15
3.1.1 Malaria transmission by province ........................................................................................................ 15
3.1.2 Malaria parasites and seasonality of transmission .............................................................................. 16
3.1.3 Malaria vectors .................................................................................................................................... 17
3.1.4 Historical trends in malaria incidence .................................................................................................. 17
3.1.5 Morbidity and mortality trends by province ........................................................................................ 19
3.1.6 Malaria burden and species by age group ........................................................................................... 20
3.2 Malaria Program Performance ............................................................................................................ 21
3.2.1 Overview .............................................................................................................................................. 21
3.2.2 Vector control ...................................................................................................................................... 23
3.2.3 Diagnosis .............................................................................................................................................. 23
3.2.4 Treatment ............................................................................................................................................ 25
3.2.5 Pilot elimination activities .................................................................................................................... 26
3.2.6 Supply chain management................................................................................................................... 30
3.2.7 Surveillance and information management ........................................................................................ 30
3.2.8 Interaction with other health system elements .................................................................................. 30
3.2.8 Recommendations of the 2013 MPR ................................................................................................... 31

NATIONAL MALARIA STRATEGIC PLAN, VANUATU, 2015 – 2020
Version 7 (Final Draft) – 8 April, 2014 ii
3.3 Introduction of zonal stratification and mapping ............................................................................... 32
4. Strategic Plan Framework .................................................................................................................. 33
4.1 Vision ................................................................................................................................................... 33
4.2 Mission and values .............................................................................................................................. 33
4.2.1 Mission statement ............................................................................................................................... 33
4.2.2 Values ................................................................................................................................................... 33
4.3 Overall strategic directions.................................................................................................................. 34
4.4 Goal and Objectives ............................................................................................................................. 34
4.4.1 Goal ...................................................................................................................................................... 34
4.4.2 Thematic areas and Strategic Objectives ............................................................................................. 34
4.4.3 Health promotion ................................................................................................................................ 36
4.4.4 Operational research ........................................................................................................................... 36
5. Interventions and Implementation Strategies ................................................................................... 37
5.1 Thematic Area 1: Vector control ......................................................................................................... 37
SDA 1.1: Maintain universal LLIN coverage .................................................................................................. 37
SDA 1.2: Achieve full coverage of selected populations with IRS ................................................................. 42
Health promotion for vector control interventions ...................................................................................... 46
Operational research for vector control ....................................................................................................... 47
5.2 Thematic Area 2: Diagnosis and treatment ......................................................................................... 48
SDA 2.1: Maintain quality assured diagnosis by microscopy or RDT ............................................................ 48
SDA 2.2: Ensure prompt and effective treatment according to national Guidelines ................................... 50
Health promotion for case management interventions ............................................................................... 52
Operational research for case management ................................................................................................ 52
5.3 Thematic Area 3: Active surveillance and response in support of elimination .................................. 53
SDA 3.1: Management of malaria transmission foci ..................................................................................... 55
SDA 3.2: Detect and respond to individual cases ......................................................................................... 57
Community engagement and prevention of reintroduction ........................................................................ 58
The “Small Island” strategy: a specific approach for small, isolated communities....................................... 59
Operational research in the context of malaria elimination......................................................................... 59
6. Program Management ....................................................................................................................... 60
6.1 Planning and implementation ............................................................................................................. 60
6.1.1 Functional delineation – policies, standards and advocacy ................................................................. 60
6.1.2 Annual planning cycle .......................................................................................................................... 60
6.1.3 Governance structures and partnership coordination ........................................................................ 60
6.1.4 Provincial level coordination................................................................................................................ 62
6.2 Financial resource management ......................................................................................................... 62
6.2.1 Financial management system ............................................................................................................ 62
6.2.2 Trials of innovative service delivery mechanisms ................................................................................ 62
6.3 Surveillance and information systems ................................................................................................ 63
6.3.1 Malaria information system ................................................................................................................. 63
6.3.2 Progressive harmonisation of MIS with HIS ......................................................................................... 63
6.3.3 Supplementary performance information through surveys ................................................................ 64
6.3.4 Move towards village level micro-stratification .................................................................................. 64
6.4 Procurement and supply management system .................................................................................. 64

NATIONAL MALARIA STRATEGIC PLAN, VANUATU, 2015 – 2020
Version 7 (Final Draft) – 8 April, 2014 iii
6.5 Human resources and technical assistance ......................................................................................... 65
6.5.1 Human resources ................................................................................................................................. 65
6.5.2 Technical assistance ............................................................................................................................. 65
6.6 Risks and risk management ................................................................................................................. 66
7. Monitoring and evaluation ................................................................................................................ 67
7.1 Performance framework ..................................................................................................................... 67
7.2 Tools and measurement ...................................................................................................................... 69
7.3 Mid-term and end-of-Strategy evaluations ......................................................................................... 69
8. Indicative budget and financing plan ................................................................................................. 70
8.1 Budget summary ................................................................................................................................. 70
8.2 Further analysis ................................................................................................................................... 70
8.3 Financing the National Malaria Strategic Plan .................................................................................... 72
References ............................................................................................................................................. 74
Annexes .................................................................................................................................................. 76

NATIONAL MALARIA STRATEGIC PLAN, VANUATU, 2015 – 2020
Version 7 (Final Draft) – 8 April, 2014 iv
Foreword
Minister or DG (to be completed once MOH has endorsed the NMSP) …

NATIONAL MALARIA STRATEGIC PLAN, VANUATU, 2015 – 2020
Version 7 (Final Draft) – 8 April, 2014 v
Acronyms and Abbreviations
ABER Annual blood examination rate
ACD Active case detection
AICEM Australian Initiative for the Control and Elimination of Malaria
ACSM Advocacy, communication and social mobilisation
ACT Artemisinin-based combination therapy
ACT-Malaria Asian Collaborative Training Network for Malaria
AL Artemether-lumefantrine
API Annual parasite incidence
APMEN Asia Pacific Malaria Elimination Network
BCC Behaviour change communication
CCM Global Fund Country Coordination Mechanism
CMO Provincial Chief Medical Officer
CMS Central Medical Stores
CoMBI Community mobilisation for behavioural impact
CQ Chloroquine
DDT Dichlorodiphenyltrichloroethane
DHS Demographic and Health Survey
DOT Directly-observed treatment
FIND Foundation for Innovative New Diagnostics
FSaT Focal screening and treatment
G6PD Glucose-6-phosphate dehydrogenase
GDP Gross domestic product
GIS Geographic / geo-referenced household information system
GNI Gross National Income
GOV Government of Vanuatu
HIS Health information system
HPO Health Promotion Officer
HRH Human resources for health
IEC Information, education and communication
IMR Infant mortality rate
IQK Insecticide Quantification Kit
IRS Indoor residual insecticide spraying
ITN Insecticide-treated bed net
IVM Integrated vector management
KABP Knowledge, attitudes, behaviour and practices
LAMP Loop mediated isothermal amplification for malaria parasites
LLIN Long lasting insecticidal net
LSM Larval source management
M&E Monitoring and evaluation
MAP Malaria Action Plan
MaST Mass screening and treatment
MDA Mass drug administration
MDG Millennium Development Goal

NATIONAL MALARIA STRATEGIC PLAN, VANUATU, 2015 – 2020
Version 7 (Final Draft) – 8 April, 2014 vi
MICS Multiple Indicator Cluster Survey
MIS Malaria information system
MMFO Malaria Management for Field Operations
MMLL Monthly malaria line listing
MNCH Maternal, neonatal and child health
MOH Ministry of Health
MPR Malaria program review
MSC Malaria Steering Committee
NCD Non-communicable disease
NGO Non-government organisation
NMSP National malaria strategic plan
PacMI Pacific Malaria Initiative
PacMISC Pacific Malaria Initiative Support Centre
PCD Passive case detection
PCD+ Enhanced passive case detection
PCR Polymerase chain reaction
PHC Primary (and preventive) health care
POE Point of entry
PPP Purchasing power parity
PQ Primaquine
PR Principal Recipient
QA Quality assurance
QC Quality control
RDT Rapid diagnostic test
SCA Save the Children Australia
SOP Standard operating procedure
SP Sulphadoxine-pyrimethamine
SPC Secretariat of the Pacific Community
TA Technical Assistance
TAG Technical Advisory Group
TES Therapeutic efficacy study
TWG Technical Working Group (under TAG)
U5MR Under-five mortality rate
UQ University of Queensland
USD United States Dollar
VanPHIS Vanuatu Public Health information System
VBDCP Vector Borne Disease Control Program
VCNE Vanuatu College of Nursing Education
VHW Village Health Worker
VUV Vanuatu Vatu
WHO World Health Organization
WHOPES WHO Pesticide Evaluation Scheme
NATIONAL MALARIA STRATEGIC PLAN, VANUATU, 2015 – 2020
Version 7 (Final Draft) – 8 April, 2014 vii
Acknowledgements
This National Malaria Strategic Plan 2015-20 was prepared in late 2013 and early 2014 by Rob
Condon (Consultant Public Health Physician), Charles Delacollette (Consultant Malaria and Public
Health Specialist), Jean-Olivier Guintran (Malaria Medical Officer, WHO Vanuatu), Seyha Ros (Malaria
Technical Officer, WHO Vanuatu), Maxine Whittaker (University of Queensland) and Bill Parr (Health
Financing and Governance Consultant). They worked under the overall direction of George Taleo
(Manager) and Timothy Quai (Acting Manager), Vector Borne Diseases Control Program, Ministry of
Health, Vanuatu.
The drafting team consulted closely with members of the following Working Groups (from national
VBDCP team unless specified otherwise):
Program Management, Structure and Financing: Wesley Donald, Charity Whelan, Harry Iata,
Winch Garae, Guy Emile, Esau Naket, Katimal Kaun (MOH), Saiven Timbaci (MOH)
Diagnosis and Treatment: Esau Naket, Griffith Harrison (Vila Central Hospital), Kalo Kalkoa,
Wesley Donald, Winch Garae, Harry Iata, Nancy Miyake (Save the Children, Australia), Guy
Emile
Vector Control: Timothy Quai, Wesley Donald, Winch Garae, Harry Iata, Nancy Miyake (SCA)
Active Surveillance, Response and Elimination: Timothy Quai, Wesley Donald, Winch Garae,
Kalo Kalkoa, Harry Iata, Simon George (Ministry of Education)
Monitoring and Evaluation: Wesley Donald, Winch Garae, Kalo Kalkoa, Harry Iata
Special thanks to the Acting Director General of Health (Santas Wari), the MOH Finance Manager
(Jameson Mokoroe) and the Provincial Chief Medical Officers (Olive Tanabose, Malampa; Selwyn
Bage, Penama; Johnson Kaso, Tafea; and Graham Patas, Torba) for valuable discussion about Malaria
Program implementation in the evolving context of the health sector reform agenda in Vanuatu.
Eleanor Sullivan (PacMISC Provincial Program Management Support Officer) participated in and
assisted each of the working groups.
Helpful comments and insights were provided in separate meetings or sessions by: Amanda Sanburg
(Central Medical Stores, MOH); Albert Concepción and Semisi Fukofuka (Secretariat of the Pacific
Community); Susan Ivatts and Peter Wallace (World Bank); Ben Rolfe, Kevin Smith and Kendra
Derousseau (Australian Department of Foreign Affairs, Canberra and Port Vila); Jacob Kool, Lasse
Vestergaard, Michael Buttsworth and Rufina Latu (WHO Vanuatu and Western Pacific Regional
Offices); and Gideon Mael (Prime Minister’s Department, Government of Vanuatu).
Valuable discussion and feedback also took place with health sector development partners (through
the Joint Partners Working Group) and a forum for civil society and non-Government partners in
February 2014.
Many of the principles underpinning the new Strategic Plan were first discussed at a preliminary
workshop in March 2013, facilitated by Marcel Tanner (Swiss Tropical Medicine Institute). Marcel
also undertook independent peer review of the final draft of the strategy.
RC, CD and BP were engaged by the University of Queensland through PacMISC / AICEM. They were
closely assisted by the Senior Program Management Support Officers in Port Vila (initially Pat Field,
then Christine Leonard).

NATIONAL MALARIA STRATEGIC PLAN, VANUATU, 2015 – 2020
Version 7 (Final Draft) – 8 April, 2014 viii
Map of Vanuatu showing provincial composition

NATIONAL MALARIA STRATEGIC PLAN, VANUATU, 2015 – 2020
Version 7 (Final Draft) – 8 April, 2014 ix
Executive Summary
Malaria Situation and Existing Program
Malaria has historically been one of the leading causes of ill health in Vanuatu. The whole
population of the country – about a quarter of a million people – is considered at risk of infection.
Since 2004, the Ministry of Health (MOH) and its partners have implemented an intensified program
to progressively control malaria through: widespread access to diagnosis by microscopy or rapid
diagnostic test (RDT); widespread access to highly effective treatment with artemisinin based
combination therapy (ACT); high coverage with long lasting insecticidal bed nets (LLIN); widespread
community engagement; and intensive, targeted technical assistance. All interventions are provided
free of charge to the end-user. This has seen the annual parasite incidence (API) fall from 74 per
1,000 in 2003 to 13.2 per 1,000 in 2012, and the virtual disappearance of confirmed malaria-related
deaths.
Pilot malaria elimination activities commenced in Tafea province in 2009 and have just begun in
Torba, using indoor residual spraying (IRS) of houses and selective larval breeding site management
(LSM) to accelerate reduction in transmission; this is superimposed on a background of 100% LLIN
coverage, universal access to prompt diagnosis and treatment, and enhanced surveillance and rapid
response to identified cases. Tafea achieved close to zero local malaria transmission in 2013 and is
on track to achieve sub-national elimination by 2016.
Malaria services are centrally coordinated and managed, and draw significant development partner
support. At a time when health financing in Vanuatu is under increasing pressure and donors
provide just over one-third of the health budget, the Malaria Program absorbs about one-quarter of
donor financing for health and its human resources represent about one-third of health sector
employees.
Findings from a comprehensive Malaria Program Review conducted in June 2013 have been used as
a basis for developing this revised National Malaria Strategic Plan 2015-20 (NMSP).
Challenges remain in the delivery of anti-malaria interventions in more remote areas, where some
communities continue to have poor access to health and other services. The revised NMSP takes
note of the Government of Vanuatu health sector reforms announced in 2013, which place
additional emphasis on delivering integrated health services directly to the community level (under
predominantly Provincial Health Office management and supervision).
The National Malaria Strategic Plan 2015-20
The MOH aims to progressively control and eliminate malaria in all provinces of the country, with a
view to national level certification of malaria-free status between 2025 and 2028.
The Goal of the new Strategy, which covers the period 2015 to 2020, is:
By the end of 2020, to reduce the annual parasite incidence rate to < 1 per 1,000 nationally and
maintain zero confirmed deaths from malaria.
Under the Strategy, Malaria Program activities are grouped into three thematic operational areas:
Thematic Area 1: VECTOR CONTROL
Strategic Objective: To maintain universal coverage with LLINs for the whole population of
Vanuatu and accelerate reduction in malaria transmission in selected areas using IRS

NATIONAL MALARIA STRATEGIC PLAN, VANUATU, 2015 – 2020
Version 7 (Final Draft) – 8 April, 2014 x
Thematic Area 2: DIAGNOSIS AND TREATMENT
Strategic Objective: To achieve 100% testing of suspected malaria cases by microscopy or RDT
and provide prompt treatment and care for 100% of confirmed malaria cases according to the
national ‘Guidelines for Treatment of Malaria’
Thematic Area 3: ACTIVE SURVEILLANCE AND RESPONSE IN SUPPORT OF ELIMINATION
Strategic Objective: Once a province has entered the elimination phase, to investigate and
manage all malaria cases and identify, investigate and manage foci of infection according to
national ‘Guidelines for Malaria Elimination’
An additional objective addresses PROGRAM MANAGEMENT to maintain core national functions
and support provincial service delivery. The relevant Objective is: To strengthen Malaria Program
leadership and management capacity at provincial and national level to plan, deliver and report on
malaria interventions in a well-coordinated, efficient and timely manner.
Rationale and Implementation Strategies
Building on recent achievements at the national level, the Vector Borne Disease Control Program will
work in close partnership with provincial health services and local communities to ensure that
universal access to health promotion, prevention with LLINs, and quality-assured diagnosis and
treatment is maintained.
In order to reach and maintain universal coverage with LLINs, the Program will undertake systematic
full replacement of LLINs (on the basis of one net per sleeping space) throughout the entire country
on a three-yearly provincial and health zone cycle: this means about 500,000 nets will be delivered
over the 6 years of the Strategy. This will be supported by behaviour change communication to
ensure a high level of net utilisation, and operational research to confirm the useful life span of LLINs
and the best way to use or dispose of expired nets.
Drawing on successes and lessons from the pilot elimination activities in Tafea province, the
Program will apply one, two or three (occasionally more) annual rounds of IRS in selected areas to
accelerate reduction in malaria transmission towards pre-elimination levels; this will be based
initially on stratification at health zone level, but will focus increasingly at the village and community
level to increase precision and efficiency. Operational research will guide the selective use of LSM to
supplement the effects of IRS (in combination with other interventions).
Quality assured diagnosis by microscopy or RDT and prompt, effective treatment of P falciparum and
P vivax according to the national Guidelines are essential components of case management. The
new Strategy seeks to maintain universal access to diagnosis and treatment while, at the same time,
seeking greater efficiency by rationalising the number of microscopy points and ensuring effective
external QA for all diagnostic methods.
Due to uncertainties about the risk and management of severe haemolytic reactions, less than 5% of
P vivax cases are currently prescribed primaquine. To facilitate the safe administration of
primaquine for vivax malaria, G6PD screening will be established in at least one centre pending the
availability of feasible, accurate, cost-effective point-of-care testing.
In areas that have reached low levels of transmission (API < 1 per 1,000), provincial health teams will
maintain excellent malaria surveillance, active case finding and response in order to achieve malaria
elimination and the prevention of reintroduction. Annual blood examination rates by microscopy or
RDT will be maintained at 15% or above; cases will be investigated within 5 days according to
NATIONAL MALARIA STRATEGIC PLAN, VANUATU, 2015 – 2020
Version 7 (Final Draft) – 8 April, 2014 xi
national Guidelines; and known or emerging foci of transmission will be investigated and re-classified
at least annually and recorded on a geographic information system. These functions will be
progressively integrated into the Vanuatu health system as part of overall disease surveillance,
contributing to stronger public health management of other diseases – especially those that are
epidemic prone or targeted for elimination.
To make more efficient use of both malaria-specific and other MOH and donor resources, the
Program and provincial health services will undertake trials of innovative service delivery options at
the community level, providing multiple health interventions during community visits based on cost
sharing between public health programs (which may have different funding streams). This will
involve close partnerships with Village Health Workers and community nurses, with a view to
supporting integrated community outreach more efficiently and effectively.
In “Small Island” or isolated community settings, proactive case detection using mass screening and
treatment (MaST) by RDT may be undertaken for the entire community. Positive cases would be
identified and treated simultaneously under direct observation by a local or visiting health worker.
For operational and cost efficiency, MaST would be undertaken at the same time as bed nets are
distributed, houses sprayed and other community and public health outreach services provided.
Planning, Governance and Management
Stronger harmonisation between national and provincial health planning processes will be achieved
through consultative planning processes and an annual review meeting. The Program and provincial
partners will develop an integrated annual malaria operational plan and budget for the coming year
(national and for each province), ready for inclusion in national health budget submissions.
The Program’s existing governance bodies – the Malaria Steering Committee (MSC) and the
Technical Advisory Group (TAG) – will be retained. The MSC (comprising Government, donor and
technical partner representatives) will provide higher level inputs on the management and overall
strategic directions of the Program, while the TAG will continue to provide technical oversight for
the Program and individual thematic technical working groups, and technical recommendations for
the MSC to consider.
As Vanuatu is considering applying for additional Global Fund assistance from 2015 under the New
Funding Model, the new NMSP for 2015-20 will be used as a basis for that application.
Information Management, Monitoring and Review
Vector control and case management outcomes will be monitored through routine operational data
and a monthly malaria line listing (MMLL). Subject to resources being available, this will be
supplemented by a follow-up malaria indicator survey in 2016 (or a relevant module within the next
Demographic and Health Survey).
Current information management capacity will be strengthened through the addition of one
additional officer based at the national level, working closely with and supporting provincial
information and surveillance officers. Provincial health teams and information managers will collate
data from the MMLL, and will increasingly produce and interpret their own monthly data and
monitor provincial trends for selected indicators.
As better data on malaria incidence by village or community become available, the Program will
move towards stratification of transmission risk at those more local levels. This will provide more
focused guidance for better targeting of interventions and potentially improved cost-effectiveness.

NATIONAL MALARIA STRATEGIC PLAN, VANUATU, 2015 – 2020
Version 7 (Final Draft) – 8 April, 2014 xii
The Program will generate a comprehensive national annual malaria report. Semi-annual reports
will be compiled at provincial, health zone and even facility level to guide and support the planning
and implementation of malaria interventions in the community.
Independent reviews of the Program and Strategy will be conducted in early 2017 (taking advantage
of available survey data from 2016), and in late 2019 or early 2020 to prepare for the next Strategy
and eventual certification of malaria elimination.
Budget and Principal Financial Risks
The cost of implementing the Strategy is estimated at USD 24.35 million across the full 6 years and
USD 11.66 for the first three years (2015-17). Vector control is allocated 29% of the whole-of-
Strategy budget, case management 7%, elimination activities 4% and program management 60%
(including human resources, short- and long-term technical assistance and M&E costs).
An anticipated 90% reduction in Global Fund support and recent contractions in the Australian aid
program budget mean there is likely to be a funding gap of USD 6.56 million for the Strategy for the
period 2015-17.
If the funding gap cannot be closed, a prioritisation exercise has already been undertaken (within the
budget and strategy) to protect the gains made in Tafea province and maintain elements of the
Program that are considered absolutely indispensable. Protection of achievements to date would
also be addressed through a strong focus on ensuring the quality of interventions.
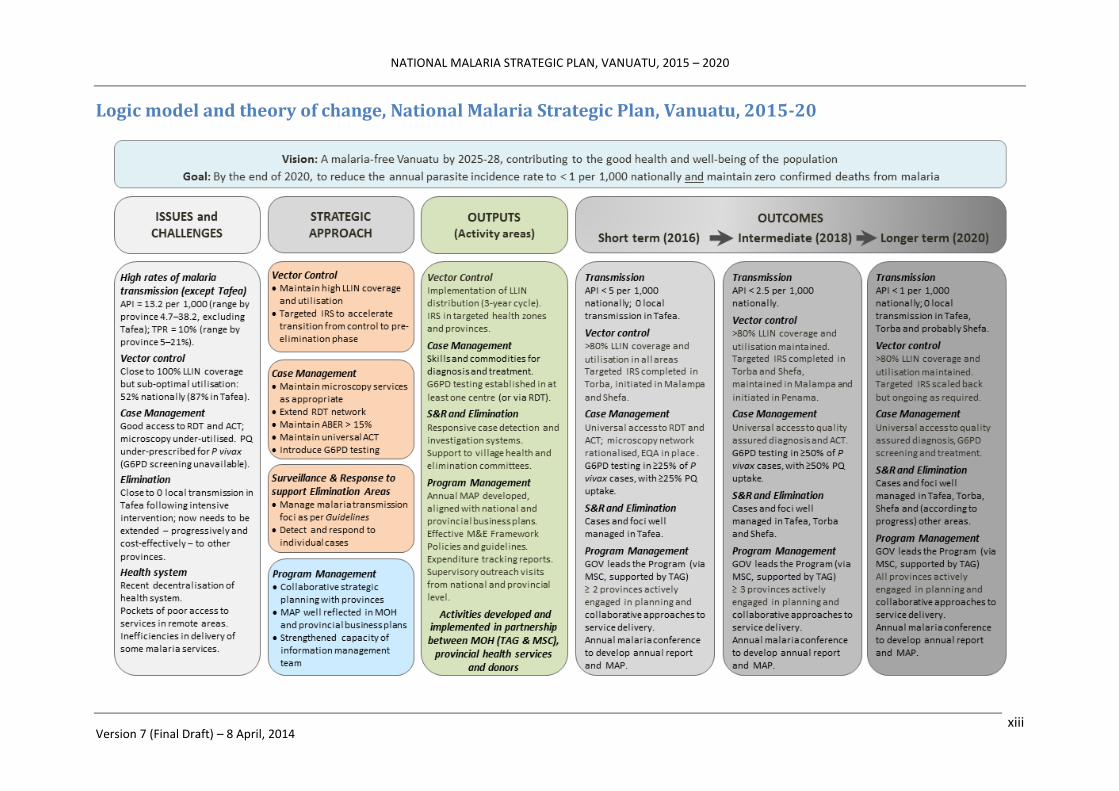
Impact and Outcomes
The logic model and theory of change for the Strategy are summarised in the following diagram
(page xiii).
As a result of implementation of all of the proposed activities, the national API is expected to
decrease progressively to below 5 per 1,000 by the end of 2016 and below 2.5 per 1,000 by the end
of 2018. There should be no confirmed deaths from malaria.
By the end of 2020, the national API is expected to have fallen below 1 per 1,000. At least three
provinces (Tafea, Torba and Shefa) are expected to have entered the elimination phase (provincial
API < 1 per 1,000), and at least two of those provinces (Tafea and Torba) are expected to have
achieved and be maintaining zero local transmission.
NATIONAL MALARIA STRATEGIC PLAN, VANUATU, 2015 – 2020
Version 7 (Final Draft) – 8 April, 2014 xiii
Logic model and theory of change, National Malaria Strategic Plan, Vanuatu, 2015-20

NATIONAL MALARIA STRATEGIC PLAN, VANUATU, 2015 – 2020
Version 7 (Final Draft) – 8 April, 2014 1
1. Introduction
1.1 Background – malaria in Vanuatu
Malaria has historically been one of the leading causes of ill health in Vanuatu. In 1990, it infected an
estimated 198 per 1,000 people and caused many deaths (MOH 2013); as recently as 2010, it was among
the top 5 notifiable diseases nationally (WHO 2011). Malaria is present on all of the 68 inhabited islands
of Vanuatu except for Aneityum (where it was eliminated in the late 1990s) and Futuna (which lies south-
east of the Buxton Line, the natural limit to the range of Anopheles mosquito vectors) (Kaneko 2010).1
The whole population of Vanuatu is considered at risk of malaria infection (WHO 2012a).
Guided by the National Malaria Strategic Vision 2007–16, the national Vector Borne Disease Control
Program (VBDCP) has been implementing a range of strategies and interventions with the aim of:
a) strengthening malaria control throughout the country; b) ensuring that zero deaths occur from
malaria; and c) eliminating malaria from Tafea province by 2016 (VBDCP 2010). These strategies include:
improved diagnosis by microscopic examination of blood slides or rapid diagnostic test (RDT); highly
effective treatment using artemisinin based combination therapy (ACT); protecting people from contact
with infected mosquitos by sleeping inside long lasting insecticidal bed nets (LLIN); widespread
community engagement; and – selectively (in Tafea and, more recently, in Torba province) – indoor
residual spraying (IRS) of houses with insecticide (VBDCP 2010, WHO 2012a).
As a result, the annual parasite incidence (API) has decreased from to 74 per 1,000 in 2003 to 13.2 per
1,000 in 2012; confirmed malaria deaths have fallen from about 7 per 100,000 to less than 1 per 100,000
over the same period (MOH 2013).2 (Malaria epidemiology is discussed in more detail in Section 3.1).
This work has been undertaken in collaboration with the neighbouring Solomon Islands, with strong
support from development partners: the Global Fund to fight AIDS, Tuberculosis and Malaria since 2004,
and the Australian government’s Pacific Malaria Initiative (PacMI) since 2008. Since the original Global
Fund grant was approved, the Global Fund has provided about USD 4.9 million for malaria control in
Vanuatu (SPC 2013). The World Health Organisation (WHO) and the Secretariat of the Pacific Community
(SPC) have provided technical and administrative support, respectively.
1.2 Malaria in the context of the national health plan
Although the Vanuatu Health Sector Strategy 2010-2016 does not specifically mention malaria, it places
a strong emphasis on improving the health status of the population through equitable access to quality
health services at all levels of the community (GOV 2010). Health sector reforms announced in 2013
place additional importance on the role of provincial health offices in strengthening health service
delivery at the community level (GOV 2013). Given the continuing presence of malaria as a public health
problem in Vanuatu, improving service delivery and health status at the community level will logically
require malaria to continue to be addressed as a public health priority.
1 Malaria elimination was achieved in Aneityum (population < 750) using a combination of weekly mass drug administration,
universal bed net coverage, intensive community mobilisation and meticulous surveillance for introduced or relapsing cases. 2 Earlier incidence data may actually under-estimate the true picture: only 10% of health facilities have microscopy, and RDTs
were introduced in late 2008 (and only became widely available in 2010).

NATIONAL MALARIA STRATEGIC PLAN, VANUATU, 2015 – 2020
Version 7 (Final Draft) – 8 April, 2014 2
1.3 International context and commitments
The Vanuatu Health Sector Strategy 2010-2016 includes a strong commitment to the Millennium
Development Goals (MDG). Its MDG-specific targets include child and maternal health outcomes (MDGs
4 and 5) and improved access to safe water supply and sanitation (MDG 7); it does not identify any
malaria- or other disease-specific targets (MDG 6) (GOV 2010).
However, Vanuatu is among 39 “elimination countries” participating in the international Malaria
Elimination Group (Feachem 2009), and receives technical support through the Asia Pacific Malaria
Elimination Network (APMEN). The Australia–Vanuatu Partnership for Development – endorsed by the
Prime Ministers of both countries in 2009 – has an explicit, mutual commitment to “controlling and
progressively eliminating malaria” (GOA-GOV 2009).
1.4 The planning period and reasons for selecting this period
While the Vanuatu Health Sector Strategy and National Malaria Strategic Vision both remain valid to
2016, the recently introduced health sector reforms are likely to see an eventual revision of the national
health sector strategy. In addition, the VBDCP is likely to reach several of its milestones or objectives
before 2016: achievement of zero (or close to zero) local transmission in Tafea province is anticipated
around the end of 2014, and this coincides with the conclusion of the current Global Fund grant.
An application to the Global Fund under its New Funding Model requires a new (or updated) national
malaria strategic plan (NMSP) that will remain valid throughout the period of Global Fund support. As
Vanuatu is considering applying for additional Global Fund assistance from 2015, it is timely to develop a
revised NMSP in advance of that application.
Technically, it is also timely for the VBDCP to review and revise its strategies with a slightly longer time
frame in mind. As malaria transmission and incidence approach very low levels in some parts of the
country, elimination strategies need to be integrated with provincial and community surveillance and
response systems; the VBDCP is well placed to inform and guide the Ministry of Health (MOH) on new
models of service delivery that will deliver integrated disease control and prevention services to the
community in an efficient and effective way.
A preliminary workshop was held in Port Vila in March 2013 to discuss options for a revised NMSP and
recommended that the new strategy covers the 6-year period from 2015 to 2020. This would align with
the anticipated attainment of zero (or close to zero) transmission in several areas of Vanuatu by 2020.
1.5 Malaria Program Review and process of developing the strategic plan
Following the March workshop, a thematic desk review of key documents (VBDCP 2013) was undertaken
in May 2013 followed by an external Malaria Program Review (MPR) in June 2013 (MOH 2013).
An international team visited Vanuatu in October-November 2013 to assist the MOH to revise the NMSP.
They worked closely with WHO and five thematic working groups to examine different aspects of the
Program (program structure and management; diagnosis and treatment; vector control; surveillance,
response and elimination; and monitoring and evaluation [M&E]), review each of the specific
recommendations of the MPR, and identify feasible and affordable options for implementation.
Strategic options were analysed and selected and the draft strategy presented to and reviewed with the
VBDCP team and a small number of development partner representatives on 14 November. Further
NATIONAL MALARIA STRATEGIC PLAN, VANUATU, 2015 – 2020
Version 7 (Final Draft) – 8 April, 2014 3
refinements were incorporated into the strategy document and presented to MOH leaders and decision-
makers, a broader range of key development partners and non-government organisation (NGO)
representatives on 6 February 2014. A final presentation was made to the health sector Joint Partners
Working Group on 19 February.
A detailed costing exercise was undertaken in between late February and early April 2014. The final
costed strategic options (prioritised) and an indicative budget for a range of funding scenarios were
presented to and reviewed with the VBDCP team on 2 and 4 April.

NATIONAL MALARIA STRATEGIC PLAN, VANUATU, 2015 – 2020
Version 7 (Final Draft) – 8 April, 2014 4
2. Country Profile
2.1 Socio-political system
Vanuatu is a lower-middle income country located in the south-west Pacific.3 It is a constitutional
democracy with a republican political system headed by a President (elected by sitting members of
Parliament and presidents of Regional Councils) and a Prime Minister (who is the head of the ruling party
or coalition within Parliament). Members are elected every four years to represent multi-seat
constituencies.
Governments may change more frequently than four-yearly due to shifting alliances within the
Parliament. The most recent election was in 2012, and the current Government was formed on
23 March 2013. The Government is active in driving the current health sector reforms.
2.2 Geography and demographics
2.2.1 Geography
Vanuatu is a Y-shaped archipelago consisting of approximately 82 islands of volcanic origin (65 of them
inhabited). It lies between latitude 13° and 21°S (spanning 1,176 kilometres from north to south) and
longitude 166° and 171°E. Total land area is about 12,274 square kilometres, within a maritime
boundary of approximately 700,000 square kilometres. The highest point of elevation is 1,877 metres.
The country has been divided into six provinces since 1994. The names of the provinces derived from
their constituent islands or island groups (refer Map, page viii). From north to south, they are:
Torba (Torres and Banks Islands).
Sanma (Santo, Malo)
Penama (Pentecost, Ambae, Maewo)
Malampa (Malakula, Ambrym, Paama)
Shefa (Shepherds group, Efate)
Tafea (Tanna, Aniwa, Futuna, Erromango, Aneityum)
2.2.2 Population and demographics
The population of Vanuatu is young and predominantly rural.
Based on projections from the 2009 census, the estimated population in 2013 is 251,784. The median
age is 21 years, with 37.3% of the population aged 0-14 years and just 5.8% aged 60 or above. The
population has a very slight male predominance (51.1%) (SPC 2011).
Almost 80% of the population lives on just 7 islands: Efate (where the capital Port Vila is located), Santo
(the largest island, with the second-largest urban area, Luganville), Tanna, Malekula, Pentecost, Ambae
and Ambrym (Van Met 2007). Approximately 76% of the overall population lives in rural areas – either in
confluent coastal settlements that may span several kilometres, or in reasonably well-defined villages
3 The World Bank’s classification of national economies is based on Gross National Income (GNI) per capita. Lower middle
income countries are currently classified as those with a per capita GNI for 2011 between USD 1,026 and USD 4,035. Vanuatu’s
classification potentially affects its ability to attract funding from some donor organisations – most notably, the Global Fund.

NATIONAL MALARIA STRATEGIC PLAN, VANUATU, 2015 – 2020
Version 7 (Final Draft) – 8 April, 2014 5
ranging in size from a few families to several hundred people. In Pentecost, Tongoa, Tanna and Santo,
the interior is quite density populated.
The estimated annual population growth rate is 2.3–2.6%, with a projected national population for 2015
(the first year of this NMSP) between 260,000 and 277,500. The 24% of the population that lives in
urban areas is growing more rapidly (3.5%) than the rural population (1.9%) (SPC 2011).
The population distribution by province in 2009 and the projected provincial populations for 2015 are
shown in Table 1. The national population is expected to exceed 300,000 by 2020.
Table 1: Provinces of Vanuatu with Population and Growth Rate, 2009 and 2015
PROVINCE No. of main
islands Population
2009
% of 2009 national
population
Annual growth rate
(%)
Estimated population
2015
% of 2015 national
population
Torba 14 9,359 4.0% 1.9 10,091 3.9%
Sanma 11 45,860 19.4% 2.4 50,424 19.5%
Penama 3 30,819 13.1% 1.5 32,710 12.6%
Malampa 17 36,722 15.6% 1.2 38,517 14.9%
Shefa 15 78,723 33.4% 3.7 91,037 35.2%
Tafea 5 32,540 13.8% 1.1 33,996 13.1%
Source: Projected from Vanuatu Census 2009 http://www.vnso.gov.vu/index.php/data-catalog
2.3 Ecosystem, climate and environment
Most of Vanuatu’s islands have a coastal fringe but are otherwise steep and lightly forested, with
unstable soils and little permanent fresh water. An estimated 9% of land is suitable for agriculture (but
only 6.9% is used for permanent crops) (SOPAC 2013).
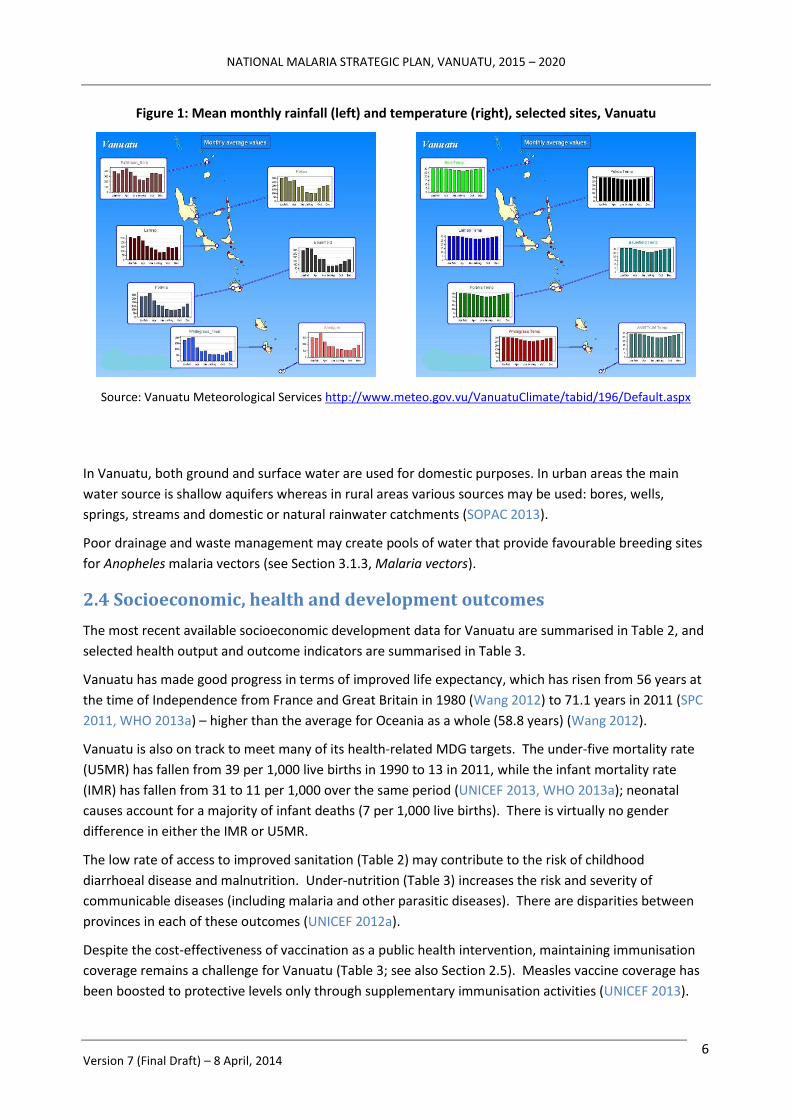
There is a rainfall gradient from the north to the south of the country (Figure 1, left). Rainfall averages
about 2,360 millimetres per year nation-wide, but ranges from around 2,000 mm in the southern islands
(Tafea province) to 4,000 mm in the north (Torba province) (SOPAC 2013). The wet season is from
November to April, and coincides with peak malaria transmission (see Section 3.1, Epidemiology).
The wet season is also associated with cyclone risk; the greatest frequency is in January and February.
Vanuatu receives about between 20–30 cyclones per decade, of which three to 5 may cause severe
damage and extensive disruption of services (SOPAC 2013).
There is also a slight north-south temperature gradient, but this is less pronounced than the rainfall
gradient: Figure 1 (right) shows that Shefa and Tafea provinces have cooler and slightly longer winters
than the more northerly island groups. In coastal areas, daily temperatures average 26°C in the hot
season with an average maximum of 30°C and an average minimum of 24°C; night-time minimum
temperatures in southern coastal areas may reach 13°C in the dry season (Van Met 2007).
NATIONAL MALARIA STRATEGIC PLAN, VANUATU, 2015 – 2020
Version 7 (Final Draft) – 8 April, 2014 6
Figure 1: Mean monthly rainfall (left) and temperature (right), selected sites, Vanuatu
Source: Vanuatu Meteorological Services http://www.meteo.gov.vu/VanuatuClimate/tabid/196/Default.aspx
In Vanuatu, both ground and surface water are used for domestic purposes. In urban areas the main
water source is shallow aquifers whereas in rural areas various sources may be used: bores, wells,
springs, streams and domestic or natural rainwater catchments (SOPAC 2013).
Poor drainage and waste management may create pools of water that provide favourable breeding sites
for Anopheles malaria vectors (see Section 3.1.3, Malaria vectors).
2.4 Socioeconomic, health and development outcomes
The most recent available socioeconomic development data for Vanuatu are summarised in Table 2, and
selected health output and outcome indicators are summarised in Table 3.
Vanuatu has made good progress in terms of improved life expectancy, which has risen from 56 years at
the time of Independence from France and Great Britain in 1980 (Wang 2012) to 71.1 years in 2011 (SPC
2011, WHO 2013a) – higher than the average for Oceania as a whole (58.8 years) (Wang 2012).
Vanuatu is also on track to meet many of its health-related MDG targets. The under-five mortality rate
(U5MR) has fallen from 39 per 1,000 live births in 1990 to 13 in 2011, while the infant mortality rate
(IMR) has fallen from 31 to 11 per 1,000 over the same period (UNICEF 2013, WHO 2013a); neonatal
causes account for a majority of infant deaths (7 per 1,000 live births). There is virtually no gender
difference in either the IMR or U5MR.
The low rate of access to improved sanitation (Table 2) may contribute to the risk of childhood
diarrhoeal disease and malnutrition. Under-nutrition (Table 3) increases the risk and severity of
communicable diseases (including malaria and other parasitic diseases). There are disparities between
provinces in each of these outcomes (UNICEF 2012a).
Despite the cost-effectiveness of vaccination as a public health intervention, maintaining immunisation
coverage remains a challenge for Vanuatu (Table 3; see also Section 2.5). Measles vaccine coverage has
been boosted to protective levels only through supplementary immunisation activities (UNICEF 2013).

NATIONAL MALARIA STRATEGIC PLAN, VANUATU, 2015 – 2020
Version 7 (Final Draft) – 8 April, 2014 7
Table 2: Summary of selected socioeconomic development indicators, Vanuatu
Economy and income
Gross National Income per capita (2011) USD 2,870
Gross National Income per capita (2011; purchasing power parity [PPP] in international dollars)
4
I$ 4,500
Gross Domestic Product (2011; current USD) USD 819.2 million
Demographics
Total population (2011, projected) 251,784
Estimated population growth rate (2011) National Range by province
2.6% (1.1–3.7%)
Median age of population (2011) 21 years
Life expectancy at birth (2011) Total Males
Females
71.1 years 69.6 years 72.7 years
Total fertility rate per woman (2010) 3.5
Proportion of population residing in urban / rural areas (2011) 24% / 76%
Social determinants of health
Total adult literacy rate (%) 2007-2011 83%
Use of improved drinking water sources (2010) Total Urban Rural
90% 98% 87%
Use of improved sanitation facilities (2010) Total Urban Rural
57% 64% 54%
Sources: SPC (Pacific Island Populations 2011), WHO (World Health Statistics 2013),
World Bank (World Development Indicators 2012, Health Financing Options Paper 2013)
The maternal mortality ratio is estimated to have halved from 220 per 100,000 live births in 1990 to 110
per 100,000 in 2010 (UNICEF 2013, WHO 2013a).5 However, low rates of antenatal care and delivery
attendance by a skilled provider (unchanged since 2007), low contraceptive prevalence rate among
women (38% among all married women aged 15-49 years; 21% among those with low educational
attainment) and high rates of teenage marriage may all compromise the rate of further progress in
relation to MDG 5 (UNICEF 2013).
The observed declines in malaria (see Section 3.1) and the 96% tuberculosis treatment success rate
(WHO 2013a) indicate good progress on MDG 6.
4 PPP methods are designed to avoid distortions caused by variations in exchange rates and the costs of goods and services
being lower in one country compared to another (where the actual “purchasing power” of the local currency may differ from
other currencies). PPP uses a notional “international dollar” (I$) rather than the US dollar. 5 Note: The maternal mortality ratio estimate in Table 3 lacks statistical precision due to small numbers and population.

NATIONAL MALARIA STRATEGIC PLAN, VANUATU, 2015 – 2020
Version 7 (Final Draft) – 8 April, 2014 8
Table 3: Summary of selected health indicators, Vanuatu
Neonatal, infant and child health
Immunization coverage among one-year-olds (DPT3, 2011) 68%
Immunization coverage among one-year-olds (Polio3, 2011) 67%
Immunization coverage among one-year-olds (measles, 2011) 52%
Immunization coverage (newborns protected against tetanus, 2011) 75%
Neonatal mortality rate per 1,000 live births (2011) 7 per 1,000
Pre-term birth rate per 100 live births (2010) 13%
Infants exclusively breast fed for first 6 months of life (2005-12) 40%
Underweight children under 5 years of age (2005-12) 11.7%
Infant mortality rate per 1,000 live births (2011) 11 per 1,000
Under five mortality rate per 1,000 live births (2011) 13 per 1,000
Maternal health
Antenatal care from a skilled provider (doctor, nurse and/or midwife), % with at least one visit (2007-12)
84%
Births attended by a skilled provider (doctor, nurse and/or midwife), % of total births (2007-12)
74%
Maternal mortality ratio per 100,000 (2010, adjusted) 110
Lifetime risk of maternal death (2010) 1 in 230
Relative burden of communicable and non-communicable disease
Communicable, maternal, perinatal and nutritional conditions as % of total deaths, all ages (2008)
24%
Proportion of population at risk of malaria (2013) ~100%
Annual malaria parasite incidence (2012) 13.2 per 1,000
Malaria test positivity rate (microscopy and RDT) 10.0%
Confirmed deaths from malaria (2012) 0
Non-communicable diseases (NCDs) as % of total deaths, all ages (2008)
70%
Proportion of population aged 25 to 64 years with three or more NCD risk factors
22.3%
Proportion of population who are overweight (BMI ≥ 25 kg/m2) 50.9%
Proportion of population with elevated fasting blood glucose (≥ 6.1 mmol/L) or currently on diabetes medication
21.2%
Sources: WHO (World Health Statistics 2013, NCD Country Profiles, STEPS survey),
World Bank (World Development Indicators 2012), UNICEF (Vanuatu Statistics)
However, huge challenges are looming in relation to the growing epidemic of non-communicable
diseases (NCD), which threaten to consume a large proportion of available health resources (World Bank
2012). Maternal and infant under-nutrition (Table 3) can initiate irreversible metabolic changes that
carry a future risk of developing NCDs.
Periodic outbreaks of dengue fever continue to occur following importation from other Pacific Island
countries. Despite the clear synergies with malaria surveillance and environmental monitoring, active

NATIONAL MALARIA STRATEGIC PLAN, VANUATU, 2015 – 2020
Version 7 (Final Draft) – 8 April, 2014 9
dengue case surveillance is reported to have ceased in March 2011 due to the concurrent demands of
malaria control and elimination activities (MOH 2012).
2.5 Health System analysis
The Government of Vanuatu (GOV) has identified 5 groups of inter-linked strategic challenges in the
health sector (MOH 2012):
Weak health system (human resources, financial management, health information system [HIS],
leadership and management);
Resource allocation;
Double burden of disease (NCDs superimposed on an existing burden of communicable diseases);
Geographical location of facilities and communities;
Vulnerability to natural disasters.
2.5.1 Service delivery system, access and equity
Government health services in Vanuatu are delivered through a four-tier system: the northern and
southern regional referral hospitals (located in Port Vila and Luganville), Health Centres, Dispensaries and
community-supported Aid Posts (WHO-MOH, 2012).
The type and number of government and community facilities in each province is shown in Table 4.
The provincial health office has overall responsibility for managing health facilities within their
jurisdiction. Each province is divided into several health zones, and each zone has a principal Health
Centre and several Dispensaries (WHO-MOH, 2012).
Table 4: Health facility access (2013) and utilisation (2012), by province, Vanuatu
PROVINCE
Ho
spit
als
He
alth
Cen
tres
Dis
pen
sari
es
Aid
Po
sts
Tota
l Fac
iliti
es
Po
pu
lati
on
(2
013
est
.)
Faci
litie
s p
er
1,0
00 p
op
ula
tio
n
An
nu
al o
utp
atie
nt
con
sult
atio
ns
per
ca
pit
a, 2
012
No
. of
Vill
ages
Vill
ages
per
pri
mar
y ca
re f
acili
ty
TORBA 1 2 6 23 32 9,903 3.23 1.53 34 1.1
SANMA 1 7 6 38 52 49,242 1.06 1.59 403 7.8
PENAMA 1 6 8 42 57 32,227 1.77 2.20 129 2.3
MALAMPA 1 7 14 45 67 38,060 1.76 1.17 N/A —
SHEFA 1 3 7 42 53 87,789 0.60 0.61 N/A —
TAFEA 1 5 6 41 53 33,626 1.58 1.21 245 4.6
TOTAL 6 30 47 231 314 250,847 1.25 1.20 — —
Source: Vanuatu Health Service Delivery Profile (2012); updated using data from VHW Evaluation 2013 and VHW
training program records held by Save the Children Australia. 2012 consultations were derived from the HIS.

NATIONAL MALARIA STRATEGIC PLAN, VANUATU, 2015 – 2020
Version 7 (Final Draft) – 8 April, 2014 10
Aid Posts are the most peripheral level of facility. They are owned, built and maintained by communities,
staffed by volunteer Village Health Workers (VHW) and operate under the oversight of a local Aid Post
Committee; costs are covered through a revolving fund or small direct payments from patients.
The VHW program is a key strategy of the MOH for improving access to primary health care in rural and
remote communities. However, the placement of VHWs is currently determined by the willingness of a
community to support the construction and maintenance of an Aid Post and not by a MOH master plan
for primary and preventive health care (PHC).
VHW training is contracted by the MOH to a NGO, Save the Children Australia (SCA); the MOH supplies
basic medicines and consumables. VHWs receive three months’ training in PHC, focusing mainly on
community health education, treatment of minor ailments and patient referral (Laverack 2013); their
training includes the use of RDTs for diagnosis of malaria and dispensing of ACT for treatment, and the
supervision of patients taking primaquine (PQ) for radical cure of P vivax once they have initiated
treatment under the care of a trained health professional.
In the provinces, VHWs are supervised by provincial health promotion officers (HPO) and/or an area
nurse from the nearest Dispensary or Health Centre; supervisory visits are scheduled for every 6 months
but, in practice, are usually less frequent (Laverack 2013). While VHW protocols and standards continue
to evolve, their articulation with the main health policies and system – and the ability of the VBDCP to
leverage the presence of VHWs to integrate community level delivery of malaria services – is dependent
on the functionality and quality of these supervisory relationships. SCA has developed tools for VHW
supervisors, but these may need to be reviewed or adapted to include malaria-specific or other
community health surveillance functions.
In practice, the quality of care provided through Aid Posts is highly variable. Some have dedicated, long-
serving and experienced VHWs who are well supported by the community; others appear to operate
with minimal or no training for the VHW, little or no supervision, and without a community committee.
Table 4 indicates a considerable variation in the population and number of villages served by each
primary care facility. The ratio of primary care facilities (Aid Posts, Dispensaries and Health Centres) to
the number of villages is close to one in Torba province, where the large number of small islands requires
that model of service delivery. Sanma shows the opposite ratio, with each primary care facility serving
around 1,000 people and up to 8 villages.
Data on actual geographical access to care based on the intended MOH standard (distance to a health
facility no more than one hour’s walk or 5 kilometres) are not available in Vanuatu. Aid posts are not
necessarily strategically located as they depend on community interest to build, fund and maintain them.
Access to health and other services is often inhibited by a lack of road access through mountainous
terrain or the need for boat transport from islands or remote coastal communities in order to reach
health facilities, and will be dependent on the availability of transportation. Only Tanna and, to a certain
extent, Santo have a road network to inland areas; others, including isolated coastal communities, may
need a boat to reach health facilities. People without access to mechanical land or sea transportation
(which may be too expensive for those living outside the cash economy) may need to walk long distances
for health care.
Utilisation of primary care facilities may be used as a proxy measure for access (Table 4). In 2012, the HIS
reported a significant difference in annual per capita outpatient visits – including Aid Posts – between
and within provinces (among the non-urban provinces, ranging from 1.17 in Malampa to 2.2 in Penama).
NATIONAL MALARIA STRATEGIC PLAN, VANUATU, 2015 – 2020
Version 7 (Final Draft) – 8 April, 2014 11
A malaria indicator survey of 4,741 people (all ages) in conducted in 2011 found that just 48.5% of the
933 respondents had the defined level of access to an Aid Post or higher level of health facility; among all
respondents, 49% would seek treatment within 24 hours of the onset of fever or possible malaria
symptoms and 94.6% would seek treatment within 48 hours.
In view of these constraints, the GOV recognises that there are likely to be significant pockets of under-
utilisation of health services among more remote communities (AusAID 2009, GOV PMD 2010) –
especially in Sanma and Malampa provinces (Table 4). This may result in undetected low vaccination
rates among infants and children, low coverage rates for anti-malaria interventions like LLINs, poor
access to malaria diagnosis and treatment, and difficulty conducting outreach interventions like IRS.
2.5.2 Health work force
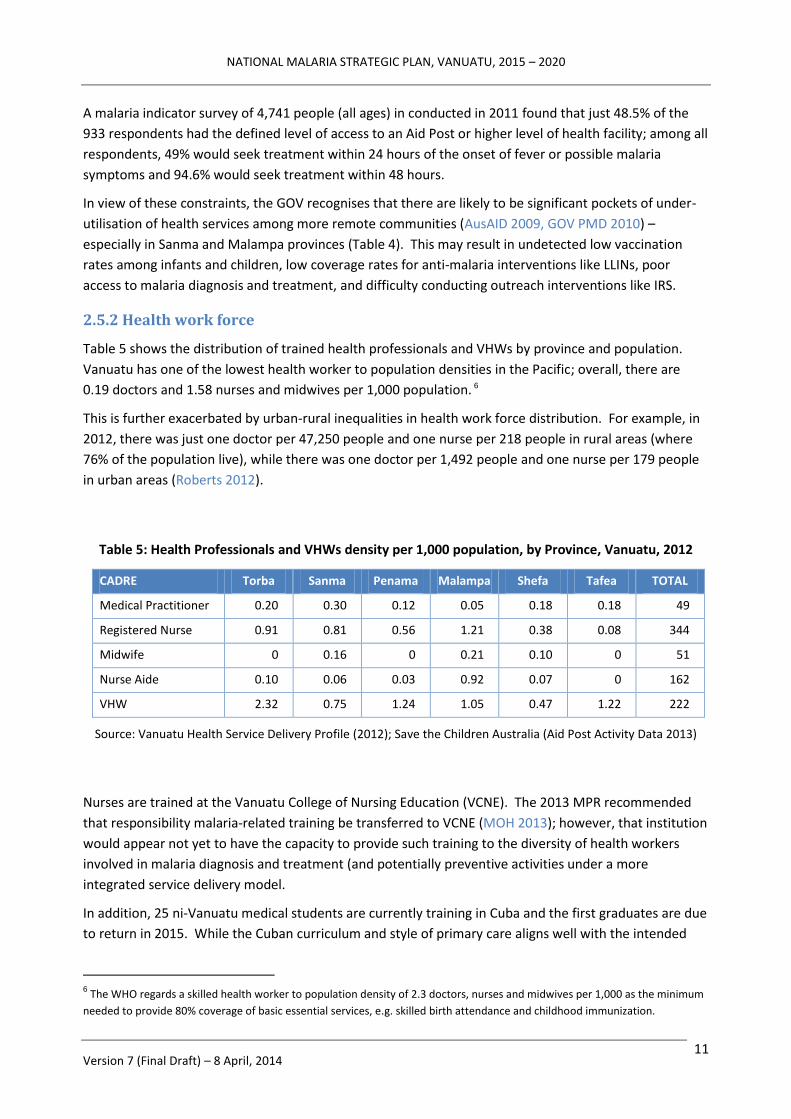
Table 5 shows the distribution of trained health professionals and VHWs by province and population.
Vanuatu has one of the lowest health worker to population densities in the Pacific; overall, there are
0.19 doctors and 1.58 nurses and midwives per 1,000 population. 6
This is further exacerbated by urban-rural inequalities in health work force distribution. For example, in
2012, there was just one doctor per 47,250 people and one nurse per 218 people in rural areas (where
76% of the population live), while there was one doctor per 1,492 people and one nurse per 179 people
in urban areas (Roberts 2012).
Table 5: Health Professionals and VHWs density per 1,000 population, by Province, Vanuatu, 2012
CADRE Torba Sanma Penama Malampa Shefa Tafea TOTAL
Medical Practitioner 0.20 0.30 0.12 0.05 0.18 0.18 49
Registered Nurse 0.91 0.81 0.56 1.21 0.38 0.08 344
Midwife 0 0.16 0 0.21 0.10 0 51
Nurse Aide 0.10 0.06 0.03 0.92 0.07 0 162
VHW 2.32 0.75 1.24 1.05 0.47 1.22 222
Source: Vanuatu Health Service Delivery Profile (2012); Save the Children Australia (Aid Post Activity Data 2013)
Nurses are trained at the Vanuatu College of Nursing Education (VCNE). The 2013 MPR recommended
that responsibility malaria-related training be transferred to VCNE (MOH 2013); however, that institution
would appear not yet to have the capacity to provide such training to the diversity of health workers
involved in malaria diagnosis and treatment (and potentially preventive activities under a more
integrated service delivery model.
In addition, 25 ni-Vanuatu medical students are currently training in Cuba and the first graduates are due
to return in 2015. While the Cuban curriculum and style of primary care aligns well with the intended
6 The WHO regards a skilled health worker to population density of 2.3 doctors, nurses and midwives per 1,000 as the minimum
needed to provide 80% coverage of basic essential services, e.g. skilled birth attendance and childhood immunization.

NATIONAL MALARIA STRATEGIC PLAN, VANUATU, 2015 – 2020
Version 7 (Final Draft) – 8 April, 2014 12
decentralisation reforms, assessment by WHO and Fiji School of Medicine suggests that considerable
planning will be required to enable new graduates from Cuba to re-integrate into Pacific health systems
(WHO SPC 2013). In particular, little malaria is seen in Cuba and it does not feature strongly in the
undergraduate medical curriculum there.
The few private health facilities and practitioners in Vanuatu include 6 private medical clinics and four
private pharmacies. The pharmacies require a prescription in order to dispense anti-malarial
medications. Government regulations prevent the importation of mono-component artemisinin
preparations.
There are also traditional healers, with an estimated density of 3 per 1,000 population. People may
prefer to attend traditional healers because of accessibility and affordability, i.e. where there is difficulty
in accessing mainstream health services (WHO and MOH 2012).
Most malaria activities (including those in the provinces) are currently managed centrally through the
VBDCP team. The malaria work force comprises an estimated one-third of all MOH employees (Toole
2010) – currently 82 Program staff countrywide and 18 in Tafea province (13 funded through the GOV,
the remainder through the Global Fund grant or the bilateral Australian aid program). The VBDCP has a
very flat management structure, and there is no formal organogram that defines lines of delegation or
intermediate reporting (MOH 2013).
2.5.2 Other health system building blocks in relation to the Malaria Program
The planning context within the MOH is summarised at Section 1.2, above. The VBDCP prepares an
annual Malaria Action Plan (MAP) and budget, which provide detailed technical guidance to the national
team and its donors on malaria-specific interventions. However, little detail from the MAP is reflected in
the national MOH and provincial health business plans, restricting the usefulness of either type of plan as
management tools (e.g. to inform synergies with other programs, to guide the collaboration of provincial
counterparts in the implementation of malaria interventions, or to help provincial health managers to
understand the true cost of public health and disease control activities taking place in their jurisdiction).
Malaria Program governance consists of a two-tier arrangement. The technical advisory group (TAG)
comprises Program and technical partners and meets approximately monthly to consider technical and –
increasingly – some management issues. The Malaria Steering Committee (MSC) includes a broader
group of Program, MOH, donor and development partner members; it meets approximately two-
monthly to endorse TAG decisions and directions, make management decisions, authorise budgets and
financial reports, approve annual work plans and consultancy arrangements, and coordinate with other
stakeholders. During a period of Global Fund Country Coordination Mechanism (CCM) inactivity, the
MSC has functioned as an interim CCM; however, a reconstituted CCM is expected to resume its
functions in April 2014.
Overall health financing in Vanuatu is under increasing pressure, with expenditure on health having
exceeded the original Government appropriation every year since 2008. The principal drivers are an
increasing MOH wages bill (despite gaps in the numbers of front line health workers), and an unmet
obligation for retirement payments. Hospital services absorb 48% of total health expenditure – more
than twice the expenditure on community health centres (World Bank 2013).

NATIONAL MALARIA STRATEGIC PLAN, VANUATU, 2015 – 2020
Version 7 (Final Draft) – 8 April, 2014 13
Financial support from development partners heavily underpins the health budget (Table 6). For 2012,
total MOH expenditure was just over VUV 2.4 billion (USD 26.9 million) and, of this, the GOV provided
just under two-thirds and development partners just over one-third.
Table 6: Summary of selected health financing indicators, Vanuatu
Health financing and expenditure
Total health expenditure as % of GDP (2011) 4.11%
Private health expenditure as % of GDP (2011) 0.5%
Public (i.e. GOV + development partner) health expenditure as % of total health expenditure (2011)
87.8%
General government expenditure on health (including external resources) as % total government expenditure (2010)
18.2%
External resources for health as % total health expenditure (2012) 37%
Per capita total health expenditure, current USD (2011) USD 133
Per capita total health expenditure, PPP (2011) I$ 190
Per capita total expenditure on malaria, current USD (2011) USD 12.2
Sources: WHO (Global Health Observatory, World Malaria Report 2012, World Health
Statistics 2013, National Health Accounts Database), World Bank (World Development
Indicators 2012, Health Financing Options Paper 2013)
The cost of achieving the observed reductions in malaria incidence has been significant relative to overall
health expenditure. Malaria attracted just over one quarter of all development partner financing in 2012:
VUV 222 million (USD 2.4 million) (World Bank 2013).
There is a need to maintain and extend the gains already achieved, and risks associated with not doing so
relatively quickly (e.g. the emergence of drug resistance in the malaria parasite) (Feachem 2009). In the
context of the Vanuatu economy, the benefits of malaria reduction and elimination are often expressed
in terms of tourism and a healthy work force; however, there have been no documented cost-benefit
studies to confirm this.
There is also strong MOH and development partner interest in controlling what is perceived as
disproportionate expenditure on malaria – estimated at just over USD 12 per capita in 2011 (WHO 2012b)
– and/or gaining maximum technical efficiency from those resources (World Bank 2010). The MOH
needs to take care to use the malaria budget sensibly to strengthen the health system functions that it
can, but it should not try to use malaria resources to substitute for areas of core MOH activity (MOH
2013). This requires a clear analysis of the functions that naturally lie with the Program at central level,
those that are core MOH functions, and those that can be integrated with public health surveillance and
response close to the community level (consistent with an elimination focus and strategy) (WHO 2007).
There are limitations to the timeliness and accuracy of the national health information system: disease
surveillance and data on health services provided are incomplete; less than half (48.6%) of health

NATIONAL MALARIA STRATEGIC PLAN, VANUATU, 2015 – 2020
Version 7 (Final Draft) – 8 April, 2014 14
facilities submitted the required HIS reporting forms during 2010, and this fraction fell to just 34% in
2011 (World Bank 2013).
The HIS does not record sufficient variables to inform the planning and implementation of the malaria
program, so a malaria information system (MIS) was developed in 2010. Reporting is now through a
monthly malaria line listing (MMLL) which lists diagnostic and case management variables for every
treated case and aggregate data for patient testing and stock control; data entry takes place at provincial
level. Remaining tasks include to roll the MMLL out to hospitals and to strengthen completeness of
reporting from the most peripheral facilities.
Procurement and logistics for malaria pharmaceuticals and commodities are generally funded through
donor resources due to the limited GOV operational budget. SPC procures LLINs, laboratory supplies and
RDTs through non-Government channels using the Global Fund grant; bed nets are distributed over a
three year replacement cycle (with no continuous replenishment). Anti-malarial drugs are currently
funded by AusAID through a direct funding agreement with the GOV and procured through WHO; they
are then distributed by the Central Medical Stores (CMS) through the usual MOH pharmaceutical
logistics system, which tracks stock using the mSupply software. These processes are described further
in Section 3.2.6 under Malaria program performance.
Malaria drug stock-outs are reported to be uncommon,7 although over-supply may occur when the
forecasting system does not recognise the effect of a reducing incidence of malaria. However, a recent
UNICEF study identified significant shortages of essential drugs and other commodities for managing
obstetric conditions and a range of common ailments (UNICEF 2012b).
7 Eighteen (8%) of 223 health facilities visited in 2012.
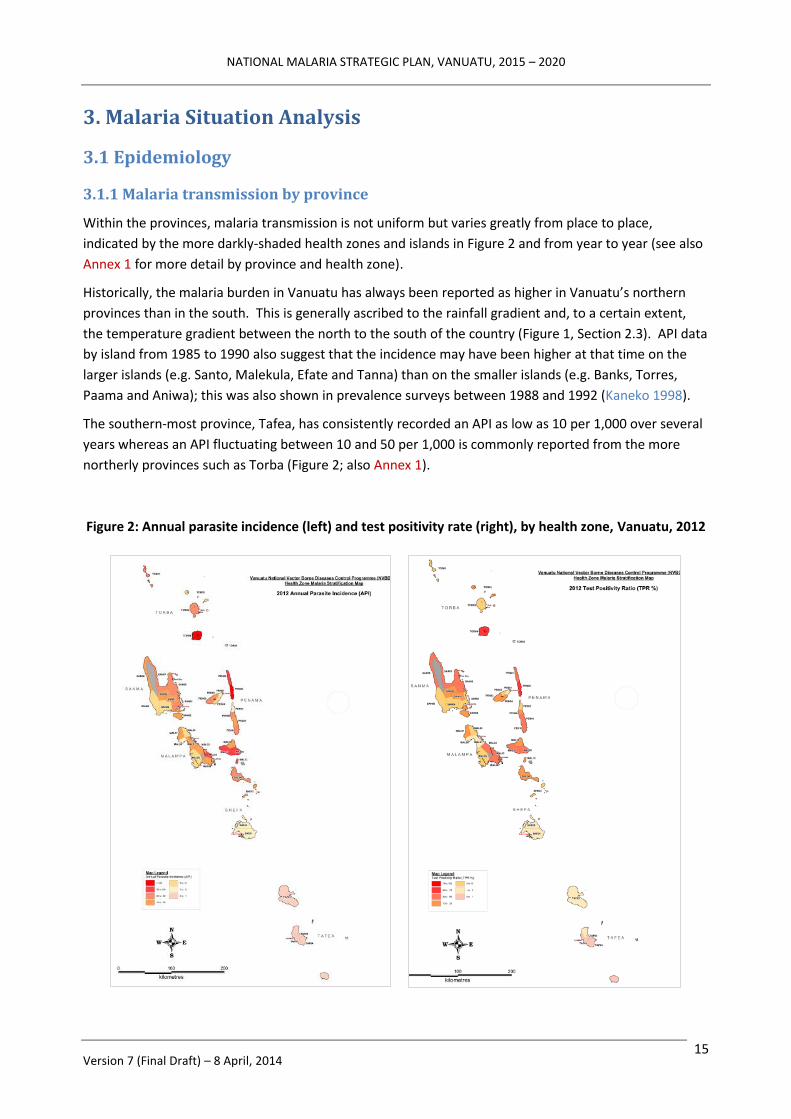
NATIONAL MALARIA STRATEGIC PLAN, VANUATU, 2015 – 2020
Version 7 (Final Draft) – 8 April, 2014 15
3. Malaria Situation Analysis
3.1 Epidemiology
3.1.1 Malaria transmission by province
Within the provinces, malaria transmission is not uniform but varies greatly from place to place,
indicated by the more darkly-shaded health zones and islands in Figure 2 and from year to year (see also
Annex 1 for more detail by province and health zone).
Historically, the malaria burden in Vanuatu has always been reported as higher in Vanuatu’s northern
provinces than in the south. This is generally ascribed to the rainfall gradient and, to a certain extent,
the temperature gradient between the north to the south of the country (Figure 1, Section 2.3). API data
by island from 1985 to 1990 also suggest that the incidence may have been higher at that time on the
larger islands (e.g. Santo, Malekula, Efate and Tanna) than on the smaller islands (e.g. Banks, Torres,
Paama and Aniwa); this was also shown in prevalence surveys between 1988 and 1992 (Kaneko 1998).
The southern-most province, Tafea, has consistently recorded an API as low as 10 per 1,000 over several
years whereas an API fluctuating between 10 and 50 per 1,000 is commonly reported from the more
northerly provinces such as Torba (Figure 2; also Annex 1).
Figure 2: Annual parasite incidence (left) and test positivity rate (right), by health zone, Vanuatu, 2012

NATIONAL MALARIA STRATEGIC PLAN, VANUATU, 2015 – 2020
Version 7 (Final Draft) – 8 April, 2014 16
Transmission is usually highest close to the coastal zone where the primary vector (An farauti) is highly
prevalent (MOH 2013). Inland foci of transmission may also occur, subject to the environment and
ecosystem (natural or modified) providing suitable vector breeding sites.
As noted above (Section 1.1), the island of Futuna in Tafea province has always been malaria-free due to
the absence of Anopheles vectors while the neighbouring island of Aneityum became malaria free in
1991 following an intensive, community-oriented malaria elimination campaign. The whole of Tafea
province is earmarked for elimination by 2016 (described in more detail in Section 3.2.5, Pilot elimination
activities).
3.1.2 Malaria parasites and seasonality of transmission
Both P falciparum and P vivax occur in Vanuatu. Historically, P falciparum transmission is seasonal,
peaking clearly from February to April, whereas P vivax infections have occurred throughout the year
with only slight fluctuations as shown in Figure 3 (Kaneko 1998). The relative proportion of P falciparum
infections has been falling since the large scale introduction of insecticide-treated bed nets (ITN), and
these patterns now appear to be becoming less pronounced (MOH 2013).
Figure 3: Seasonal fluctuation of malaria incidence in Vanuatu: number of microscopically confirmed
malaria cases (passive case detection), January 1987 to December 1990, Vanuatu
Source: Kaneko et al (1998)
Recent parasitological surveys have shown that P vivax is now the dominant species. In a mass blood
survey conducted by the MOH on Tanna Island in 2006, the parasite rate was found to be 3.8%
(125/3,298) with a P falciparum prevalence of 1.7% and P vivax 2.1% (Cooper 2008). A subsequent
prevalence survey of 4,716 children aged 2-12 in Tafea province in 2008 found a prevalence of 1% for P.
falciparum and 2.2% of P. vivax by microscopy and PCR (Reid 2010). A malaria indicator survey (MIS) of

NATIONAL MALARIA STRATEGIC PLAN, VANUATU, 2015 – 2020
Version 7 (Final Draft) – 8 April, 2014 17
4,741 people (all ages) in 2011 recorded a malaria prevalence of 0.6% by microscopy and 2.0% by PCR (of
which 24% were P. falciparum, 71% P. vivax, 5% mixed infections) (MOH 2013).
3.1.3 Malaria vectors
The only vector present in Vanuatu is An farauti (Laveran), which belongs to a complex of seven
isomorphic species (Beebe 1995). Larvae can tolerate organic pollution and up to 70% salinity (Sinka
2011). Breeding sites include swamps, salt marshes, blocked river outlets, river and stream margins with
emergent or surface vegetation, springs, seepage areas, and ponds located near the coast (Russell 2010)
as well as transient ground pools that are maintained by rainfall (Cooper 2008). Flight range is generally
less than 1 km (Sinka 2011).
Entomological investigations on Tanna have shown that the breeding sites are generally within two
kilometres of the coast; the 2006 and 2008 studies also indicated that the highest prevalence of malaria
in Tanna children was among those living near the coast (Cooper 2008, Reid 2010, Russell 2010).
Pending further entomological studies, it is expected that the same distribution occurs on other islands.
Adult females of An farauti readily feed on humans but will feed on other hosts if available. They will
feed outdoors during the early evening and also enter houses to feed, but generally leave the house
shortly after taking a blood meal (Sinka 2011). Adults feed throughout the night, both indoors and
outdoors, with 70-80% of biting taking place while people are indoors (Cooper 2008). Resting places for
males and females include any cool, moist, and shaded spot, including human dwellings (Sinka 2011).
These observations have guided vector control activities during the elimination campaign on Tanna.
There are no data on vector resistance to commonly used insecticides, and no recent data from LLIN or
post-IRS bio-assays. Although pyrethroids are used both in LLINs and for IRS, concurrent agricultural
pesticide use is very low in Vanuatu and selection for pyrethroid resistance is also thought to be low.
3.1.4 Historical trends in malaria incidence
Figure 4 summarises the long term trends in API and annual blood examination rate (ABER) in Vanuatu
since 1977.
Figure 4: Trends in API (line, Y1 axis) and ABER (shaded, Y2 axis), 1977 to 2011, Vanuatu
0
10
20
30
40
50
60
70
80
90
100
0
50
100
150
200
250
1977
1978
1979
1980
1981
1982
1983
1984
1985
1986
1987
1988
1989
1990
1991
1992
1993
1994
1995
1996
1997
1998
1999
2000
2001
2002
2003
2004
2005
2006
2007
2008
2009
2010
2011
API
ABER

NATIONAL MALARIA STRATEGIC PLAN, VANUATU, 2015 – 2020
Version 7 (Final Draft) – 8 April, 2014 18
It should be noted that the criteria for reporting cases have varied over time, and may include both
clinical (i.e. treated without diagnostic confirmation) and confirmed malaria cases.
It is instructive to view the trends in malaria incidence shown in Figure 4 in relation to the malaria
interventions used at the time. IRS with DDT was conducted between 1973 and 1981 and this appears to
have maintained the nation-wide slide positivity rate (SPR) below 20% and an API below 50 per 1,000.
On cessation of DDT use, the incidence climbed quickly until ITNs were introduced in 1988 as part of the
global ITN trials. This saw the SPR, the number of reported cases and the API all decline again from 1990
onwards.
Between 1983 and 1991, three to four times the number of slides was examined each year than in 1981
and the detection rate by microscopy increased accordingly; this strengthened the ability of the Malaria
Program to monitor the impact of interventions.
A gap in donor-funded assistance from 2000 to 2003 negatively impacted ITN coverage and saw a
progressive resurgence of malaria incidence, SPR and the proportion of cases caused by P falciparum
from 2001 to 2005-06. Confirmation of additional malaria financing through the Global Fund from 2003
onward allowed a resumption in distribution of subsidised ITNs – and later, free LLINs – reaching >80%
coverage with LLINs from 2009 onwards.
These trends and influences are summarised in Figure 5, below, where it can be seen that the rebound in
malaria incidence to almost 80 per 1,000 after 2001 (red arrow) coincides with a period of reduced
commitment to malaria control.
Additional interventions like IRS in selected highly endemic areas from 2009 and nationwide availability
of free RDTs and ACT have further reduced malaria incidence. (The small secondary peak in reported
incidence in 2010 [Figure 5; also visible in Figure 2] represents a case ascertainment bias coinciding with
the widespread introduction of RDTs; this is shown in more detail in Figure 9).
Figure 5: Trends in malaria incidence relative to technical and financial commitment to malaria control,
1977 to 2011, Vanuatu

NATIONAL MALARIA STRATEGIC PLAN, VANUATU, 2015 – 2020
Version 7 (Final Draft) – 8 April, 2014 19
The recent impact of ITNs and ACT since 2003 – and especially more recently – on test positivity rate
(TPR) is shown in Figure 6.
Figure 6: Trends in TPR and proportion of cases due to P falciparum (Pf %) in relation to LLIN
distribution, Vanuatu, 2000 to 2012
3.1.5 Morbidity and mortality trends by province
Table 4 shows the annual trends in confirmed malaria cases (API and TPR) by province for 2010-12,
noting also the number of slides and RDTs taken in the population (% detection rate as ABER).
API and TPR differ significantly by province, with the lowest rates in 2012 observed in Tafea (API 0.4 per
1,000, TPR 1%) and the highest in Torba (API 38.2 per 1,000, TPR 21%). Tafea has a well-established
elimination program (see Section 3.2.5) and the ABER there of just 6% presumably reflects a fall in the
incidence of febrile illness in the community (1.5% of Tafea children had a fever in the two weeks prior to
the 2011 malaria indicator survey, compared with an average of 4.4% across all other provinces).
Table 4: Annual Parasite Incidence and Test Positivity Rate, reported confirmed malaria cases,
by province and nationally, 2010 to 2012, Vanuatu
Year
MALAMPA PENAMA SANMA SHEFA TAFEA TORBA VANUATU ABER TPR API ABER TPR API ABER TPR API ABER TPR API ABER TPR API ABER TPR API ABER TPR API
2010 17% 25% 44.1 6% 41% 22.6 26% 21% 53.9 19% 17% 31.5 8% 2% 1.9 24% 12% 29.4 17% 19% 32.6
2011 25% 22% 52.9 12% 29% 35.5 22% 15% 33.1 11% 10% 11.2 5% 1% 0.7 22% 21% 46.2 15% 17% 25.0
2012 16% 13% 20.3 11% 19% 21.2 23% 9% 21.3 10% 5% 4.7 6% 1% 0.4 18% 21% 38.2 13% 10% 13.2

NATIONAL MALARIA STRATEGIC PLAN, VANUATU, 2015 – 2020
Version 7 (Final Draft) – 8 April, 2014 20
Very few malaria attributed deaths have officially been recorded within the national HIS during the last
10 years (from 2 in 2007 to zero in 2012). This might be due to better access to prompt and effective
treatment, but may also reflect factors like the willingness of people to die at home rather than in
hospitals or health care facilities, patients dying while in transit to a referral facility, or a lack of malaria
diagnostic or post mortem capabilities at the referral centre.
The Program interacts with clinicians and HIS colleagues to fine tune the mortality data, and the HIS is
embarking on a program for improving the recording of vital statistics and conducting death audits.
3.1.6 Malaria burden and species by age group
Children under 10 years of age comprise the most at-risk population, as shown in Figures 7 and 8.
Figure 7: Age-specific incidence of reported, confirmed malaria, Vanuatu, 2012
Source: MOH (2013)
Figure 8: Age-specific malaria prevalence in 16 islands of Vanuatu, 1988 to 1992
Source: Kaneko et al (1998)
0
10
20
30
40
0-9 10-19 20-49 50-99
AP
I (c
on
firm
ed
by
mic
rosc
op
y o
r R
DT)
Age group (years)

NATIONAL MALARIA STRATEGIC PLAN, VANUATU, 2015 – 2020
Version 7 (Final Draft) – 8 April, 2014 21
The data on prevalence by age group from 1987 to 1991 show that P vivax infections are most prevalent
in children under 5 whereas P falciparum infections occur more constantly across all age groups (Kaneko
1991). This suggests that children under 10 are the main reservoir of P vivax.8
3.2 Malaria Program Performance
3.2.1 Overview
Since 2009, significant external donor support (Figure 5) has seen a scaling-up of evidence-based
interventions to initiate a malaria elimination strategy in Tafea province (and, more recently, Torba) and
to enhance malaria control in the rest of Vanuatu.
While noting the disadvantages to the health system of a nation-wide, vertically implemented Malaria
Program (see Section 2.5 and 3.2.7), these efforts have contributed significantly to a reduction in the
national malaria burden (API 73 per 1,000 in 2003, 23.3 per 1,000 in 2007 and 13 per 1,000 in 2012;
Figure 9), and have seen the province of Tafea reach almost zero indigenous cases in 2013 (Section 3.2.5).
Figure 9: API trends by year, 2000-12, Vanuatu
Table 5 (page 22) summarises Program performance against key indicators to the end of 2012 data to be
added if possible), showing the achievement of most milestones and targets.9
8 The P falciparum to P vivax ratio in Vanuatu has been consistently around 50% over many years, irrespective of the diagnostic
method or prevailing malaria control interventions. This could be due to a lack of quality microscopy diagnosis, misclassification
of clinically diagnosed cases, the use of different brands of RDT, etc. It is anticipated that, with improved capacity for species
identification (microscopy, RDT and PCR), P vivax infections will become numerically more prominent as overall malaria
incidence falls over time. 9 The results shown in Table 5 need to be qualified by limitations or uncertainties in the data. In particular, in 2012, it was
estimated that the MIS captured around 70% of malaria patients nation-wide (but is improving over time).
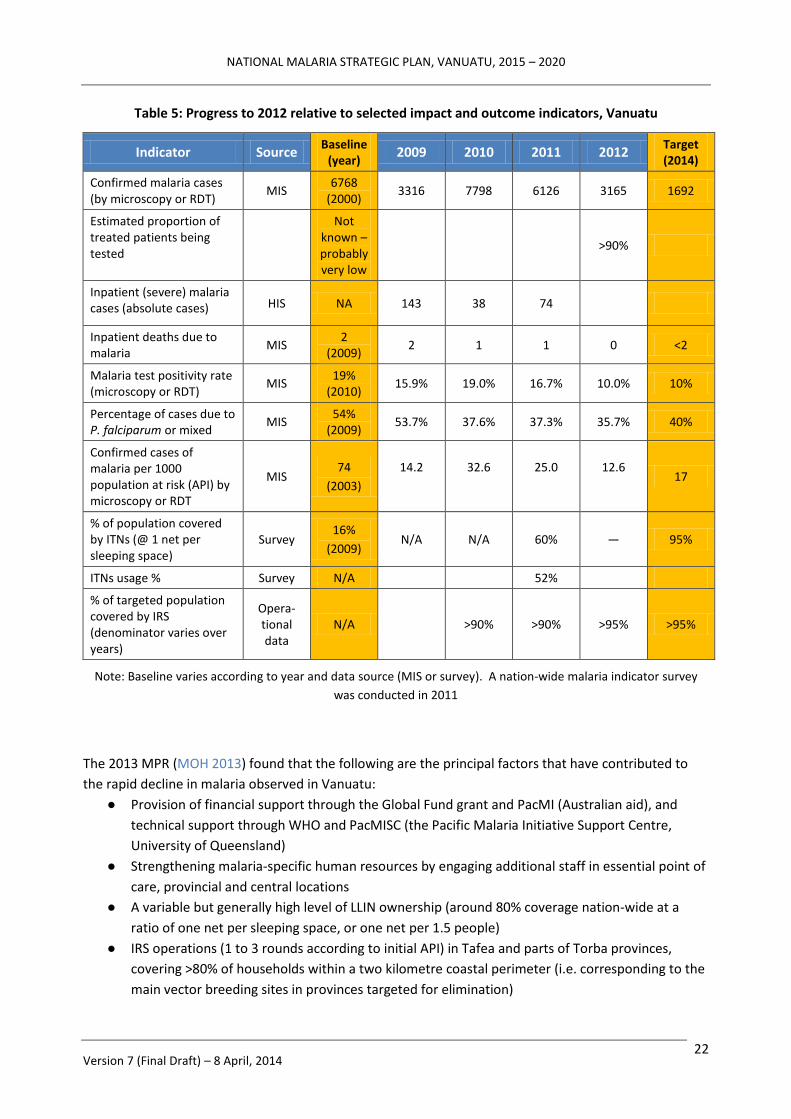
NATIONAL MALARIA STRATEGIC PLAN, VANUATU, 2015 – 2020
Version 7 (Final Draft) – 8 April, 2014 22
Table 5: Progress to 2012 relative to selected impact and outcome indicators, Vanuatu
Indicator Source Baseline
(year) 2009 2010 2011 2012
Target (2014)
Confirmed malaria cases (by microscopy or RDT)
MIS 6768
(2000) 3316 7798 6126 3165 1692
Estimated proportion of treated patients being tested
Not known – probably very low
>90%
Inpatient (severe) malaria cases (absolute cases) HIS NA 143 38 74
Inpatient deaths due to malaria
MIS 2
(2009) 2 1 1 0 <2
Malaria test positivity rate (microscopy or RDT)
MIS 19%
(2010) 15.9% 19.0% 16.7% 10.0% 10%
Percentage of cases due to P. falciparum or mixed
MIS 54%
(2009) 53.7% 37.6% 37.3% 35.7% 40%
Confirmed cases of malaria per 1000 population at risk (API) by microscopy or RDT
MIS 74
(2003)
14.2
32.6
25.0
12.6
17
% of population covered by ITNs (@ 1 net per sleeping space)
Survey 16%
(2009) N/A N/A 60% — 95%
ITNs usage % Survey N/A 52%
% of targeted population covered by IRS (denominator varies over years)
Opera-tional data
N/A >90% >90% >95% >95%
Note: Baseline varies according to year and data source (MIS or survey). A nation-wide malaria indicator survey
was conducted in 2011
The 2013 MPR (MOH 2013) found that the following are the principal factors that have contributed to
the rapid decline in malaria observed in Vanuatu:
● Provision of financial support through the Global Fund grant and PacMI (Australian aid), and
technical support through WHO and PacMISC (the Pacific Malaria Initiative Support Centre,
University of Queensland)
● Strengthening malaria-specific human resources by engaging additional staff in essential point of
care, provincial and central locations
● A variable but generally high level of LLIN ownership (around 80% coverage nation-wide at a
ratio of one net per sleeping space, or one net per 1.5 people)
● IRS operations (1 to 3 rounds according to initial API) in Tafea and parts of Torba provinces,
covering >80% of households within a two kilometre coastal perimeter (i.e. corresponding to the
main vector breeding sites in provinces targeted for elimination)

NATIONAL MALARIA STRATEGIC PLAN, VANUATU, 2015 – 2020
Version 7 (Final Draft) – 8 April, 2014 23
● Free access of patients to microscopy and RDTs followed by free ACT for both P vivax and P
falciparum infections (increasingly administered via directly-observed treatment; DOT) when
needed; this has seen a decrease in the number of patients treated without parasitological
diagnosis
● Strengthening the malaria information system (MIS) using the monthly malaria line listing in an
effort to record all malaria cases identified though the PHC system.
● Engaging leaders, communities students and teachers to help them to understand the nature of
malaria and the Program objectives and activities
● Provision of targeted (long-term and short-term) technical assistance (TA) to the national
Program and the provinces
3.2.2 Vector control
Vector control has been the mainstay of the Program since the arrival of increased donor support, and
was noted by the MPR to be a key factor in the reduction in malaria incidence in Vanuatu (MOH 2013).
Since 2009, an average 70,000 pyrethroid-impregnated polyester LLINs have been distributed each year
through a rotating three-year provincial cycle. The targeted coverage rate is one bed net per sleeping
space per household (one net per 1.25 people; effectively, one net per 1.5 people after allowing for
population movement). Bed net utilisation is good in Tafea (87.9%) and acceptable in most other areas
(68.9%). This has been achieved in spite of significant disbursement delays that slowed distribution
relative to the intended schedule; the effect of these delays may be partially mitigated by the three to 5
years’ net durability reported by the manufacturer.
Vanuatu has now initiated a second cycle of full bed net replacement. However, there is not yet an
agreed policy on disposal or recycling of old nets.
There is a risk that bed net utilisation might decrease with declining malaria incidence, or because of the
perceived additional impact of IRS in targeted areas.
The Program has delivered three rounds of IRS with good coverage of targeted structures on Tanna, two
rounds in higher risk areas of Shefa (including those communities with direct social contact with higher
incidence outer island provinces), and one round in Erromango, Aniwa and the Torres Islands.
Larviciding with methoprene at 3-monthly intervals has been implemented in up to 95 identified
breeding sites in Tanna since 2011. Some communities also undertake clearance of vegetation from
water bodies, while other provinces promote the seeding of standing water bodies with larvivorous fish
for larval source management (LSM). To date, there is no demonstrable evidence of LSM having an
impact in Tanna above what has been achieved through LLIN and three rounds of IRS; similar reductions
in transmission (magnitude and rate) have been observed on other islands of Tafea and in the Torres
islands with LLINs and IRS but without any LSM.
Entomological surveillance capacity is limited; Vanuatu relies on continuing external TA for conducting
even routine vector control monitoring. Vector behaviours, insecticide resistance and other basic
entomological parameters following widespread introduction of LLIN and focal IRS remain unknown.
3.2.3 Diagnosis
Prior to 2009, the only diagnostic test for confirmation of malaria in Vanuatu was microscopy. As
microscopy was only available in 33 (10%) health facilities, diagnosis was frequently on clinical grounds.

NATIONAL MALARIA STRATEGIC PLAN, VANUATU, 2015 – 2020
Version 7 (Final Draft) – 8 April, 2014 24
Since then, the Program has made significant efforts to maintain the network of microscopy services
through the Global Fund grant. However, assessment of malaria microscopists’ competency by the
Australian Army Malaria Institute (AAMI) in 2008, 2010 and 2011 yielded quite poor results: only four of
the 35 participants achieved the Level 1 or 2 standard, with the remainder at Level 3 or 4 proficiency.
None of the four Level 1 or 2 microscopists is currently providing malaria microscopy services.
To improve the standard of microscopy services, a review was undertaken in 2011. Training in
microscopy and quality assurance (QA) was conducted in 2012, and supervisory visits and a microscope
maintenance program were initiated, but no quantitative results are available. The QA program requires
microscopists submit all positive slides and a 10% sample of negative to their Provincial health laboratory
for cross-checking; a program of panel testing (using 10 slides with known results) has just been initiated.
However, the proportion of malaria cases confirmed by microscopy has declined markedly since RDTs
were rolled out to all health facilities in 2009, dramatically improving access to parasitological diagnosis:
in 2011, > 90% of health facilities reported access to microscopy and/or RDT.
Figure 10 shows that the number of RDTs performed in health facilities increased from 11,900 in 2010 to
14,791 in 2012, but with a decreased utilisation of microscopy in favour of RDTs over the same period.
The Figure also shows that, since 2010, both the number of tests performed and the proportion of tests
that are positive have declined due to the decreasing transmission and burden of malaria.
Figure 9: Trends in number of diagnoses by microscopy and RDT (Y1 axis),
and ABER and TPR (Y2 axis), 2008–12, Vanuatu
Table 6 summarises mean microscopy activity by province for 2012. Between 2010 and 2012, the
number of slides taken annually in health facilities decreased from 29,180 to 16,981, with an average of
less than two slides examined per day in 2012 in all but 5 sites.
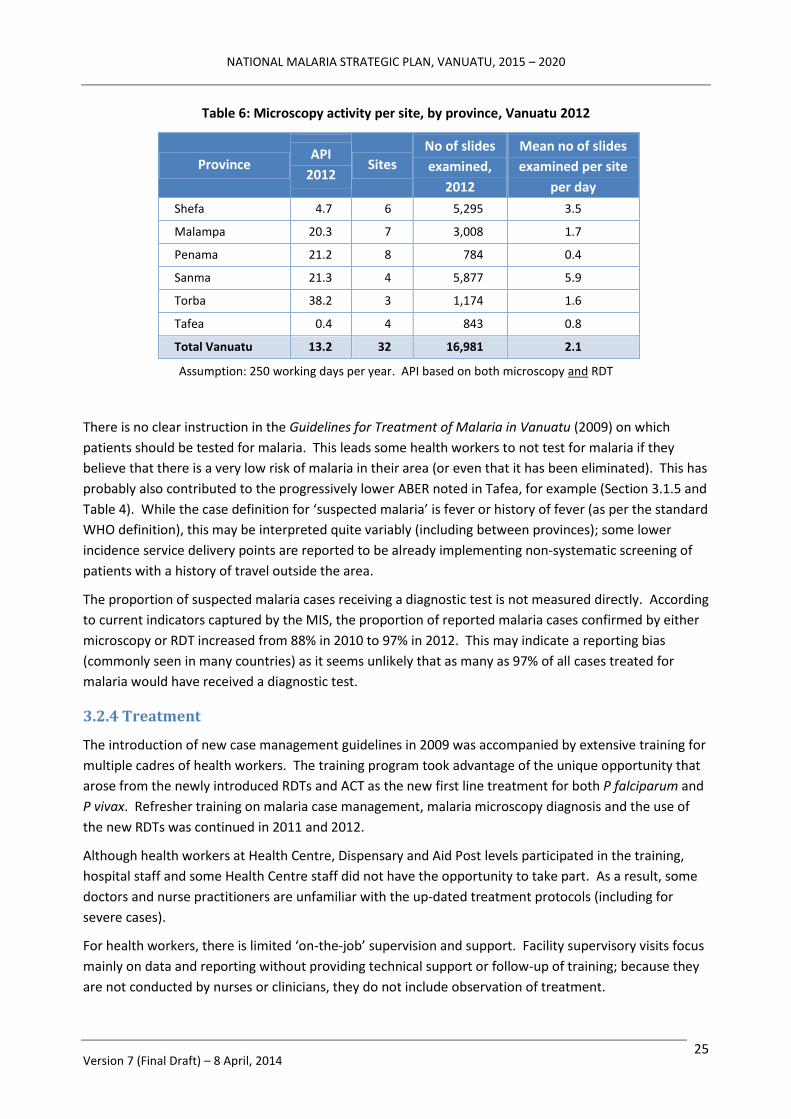
NATIONAL MALARIA STRATEGIC PLAN, VANUATU, 2015 – 2020
Version 7 (Final Draft) – 8 April, 2014 25
Table 6: Microscopy activity per site, by province, Vanuatu 2012
Province API
2012 Sites
No of slides
examined,
2012
Mean no of slides
examined per site
per day
Shefa 4.7 6 5,295 3.5
Malampa 20.3 7 3,008 1.7
Penama 21.2 8 784 0.4
Sanma 21.3 4 5,877 5.9
Torba 38.2 3 1,174 1.6
Tafea 0.4 4 843 0.8
Total Vanuatu 13.2 32 16,981 2.1
Assumption: 250 working days per year. API based on both microscopy and RDT
There is no clear instruction in the Guidelines for Treatment of Malaria in Vanuatu (2009) on which
patients should be tested for malaria. This leads some health workers to not test for malaria if they
believe that there is a very low risk of malaria in their area (or even that it has been eliminated). This has
probably also contributed to the progressively lower ABER noted in Tafea, for example (Section 3.1.5 and
Table 4). While the case definition for ‘suspected malaria’ is fever or history of fever (as per the standard
WHO definition), this may be interpreted quite variably (including between provinces); some lower
incidence service delivery points are reported to be already implementing non-systematic screening of
patients with a history of travel outside the area.
The proportion of suspected malaria cases receiving a diagnostic test is not measured directly. According
to current indicators captured by the MIS, the proportion of reported malaria cases confirmed by either
microscopy or RDT increased from 88% in 2010 to 97% in 2012. This may indicate a reporting bias
(commonly seen in many countries) as it seems unlikely that as many as 97% of all cases treated for
malaria would have received a diagnostic test.
3.2.4 Treatment
The introduction of new case management guidelines in 2009 was accompanied by extensive training for
multiple cadres of health workers. The training program took advantage of the unique opportunity that
arose from the newly introduced RDTs and ACT as the new first line treatment for both P falciparum and
P vivax. Refresher training on malaria case management, malaria microscopy diagnosis and the use of
the new RDTs was continued in 2011 and 2012.
Although health workers at Health Centre, Dispensary and Aid Post levels participated in the training,
hospital staff and some Health Centre staff did not have the opportunity to take part. As a result, some
doctors and nurse practitioners are unfamiliar with the up-dated treatment protocols (including for
severe cases).
For health workers, there is limited ‘on-the-job’ supervision and support. Facility supervisory visits focus
mainly on data and reporting without providing technical support or follow-up of training; because they
are not conducted by nurses or clinicians, they do not include observation of treatment.

NATIONAL MALARIA STRATEGIC PLAN, VANUATU, 2015 – 2020
Version 7 (Final Draft) – 8 April, 2014 26
Some leeway to treat patients with negative tests according to clinical judgment is appropriate when
there is diagnostic uncertainty, but this has led to large variation in actual clinical practices – particularly
in poorly stocked Aid Posts where VHWs have had little (or in some cases no) training, and have few
other treatments to offer a patient. Variable adherence to protocols is also reported from higher level
health facilities, e.g. providing malaria treatment when a malaria-specific test is negative, or providing
antibiotics without further investigation.
Therapeutic efficacy studies (TES) using WHO approved methodology were conducted on Epi in 2011 to
assess the efficacy of artemether-lumefantrine (AL; Coartem®) against both P falciparum and P vivax. No
cases of falciparum were identified. However, 80 P vivax cases were recruited and, among them, only
one subject showed a reappearance of parasites within the 28 days follow-up period (justifying the
continued use of AL as first line treatment for P vivax infection).
Treatment with primaquine for radical cure of P vivax infection is recommended in the treatment
guidelines,10 but is rarely practised and not well documented. The absence of a feasible screening test
for glucose-6-phosphate dehydrogenase (G6PD) precludes the use of 14-day PQ therapy in most cases as
patients will need to be referred to a Health Centre to initiate treatment under clinical supervision. The
MIS indicates that, in the first 6 months of 2013, only 4% (35/847) of reported P vivax cases were
prescribed PQ.
A multi-centre study is currently under way around Lunganville in Santo to assess the efficacy of different
14-day doses of PQ against the strains of P vivax found in Vanuatu, and to measure the efficacy of AL on
P falciparum and P vivax. Unfortunately, not a single P falciparum case has been recruited over a
6 months period. G6PD screening has been made available, and G6PD-deficient individuals are excluded
(meaning the study will not address the crucial issue of PQ safety when used without knowledge of the
patient’s G6PD status). However it will establish the effective dose and adverse effects of PQ in persons
with normal G6PD activity, to guide future policy.
3.2.5 Pilot elimination activities
As noted above, the first pilot elimination activity in Vanuatu commenced in Aneityum in Tafea province
in 1991. Against a baseline prevalence of 10% P falciparum and 15% P vivax, weekly mass drug
administration (MDA) using sulphadoxine-pyrimethamine (SP) and PQ was provided for to the whole
population (718 individuals) for 9 weeks; in addition, 100% coverage with ITNs (by population),
introduction of larvivorous fish (Gambusia species) into a neighbourhood swamp, and screening of
arrivals for malaria at ports of entry (POE) (Kaneko 2000, Kaneko 2010).
A resurgence of local transmission with a small P vivax outbreak occurred in 2002 after an outbreak on
Tanna and Erromango 2001-03. This was managed with a new cycle of MDA using chloroquine (CQ) four
times weekly followed by 14 days of PQ.
A small number of asymptomatic P vivax cases were detected in surveys during 2003-05. A serological
survey in 2009 subsequently found 7 children under the age of 5 years who were seropositive for P vivax.
One case of P vivax was detected through routine malaria surveillance in 2010 in an individual who had
not travelled outside Aneityum. These observations suggest that low level transmission of P vivax may
still be occurring.
10
To minimise the risk of toxicity in the absence of G6PD screening, PQ is prescribed at a lower dose of 0.25mg/Kg/day.

NATIONAL MALARIA STRATEGIC PLAN, VANUATU, 2015 – 2020
Version 7 (Final Draft) – 8 April, 2014 27
In 2009, the whole of Tafea was selected as the first province-wide pilot elimination site in the country,
with the objective of achieving zero local transmission of malaria by the end of 2014 (and sustained
elimination by 2016). Tafea was selected based on the following criteria: a) the relatively low level of
malaria endemicity and transmission (see Sections 2.3 and 3.1.5); b) the absence of malaria transmission
in the island of Futuna; and c) the more recent, successful elimination of malaria transmission and
reservoirs on Aneityum in the 1990s.
The interventions used in Tafea (summarised in Box 1) have been designed to accelerate the reduction in
malaria transmission (API 23.3 per 1,000, TPR 21.7%) and move the province more quickly into an
“elimination phase” strategy according to WHO criteria, shown schematically in Figure 11 (WHO 2007).
Figure 11: Acceleration strategy from control to pre-elimination phase, Tafea province, 2009-12
Box 1: Pilot Malaria Elimination Interventions, Tafea Province, 2009-13
Prevention: Vector Control and Personal Protection
Mass distribution of LLIN, topping-up and replacing nets
IRS x 3 rounds of all households within 2 km of the coast of Tanna, planned and managed
using a sophisticated geo-referencing system
Blanket IRS coverage of Erromango and Aniwa x 1 round, followed by focal spraying
targeting areas of local transmission
Case management: Diagnosis and Treatment
Diagnosis of every fever case using quality assured microscopy or RDT
Treating all P falciparum cases with AL, and all P vivax cases with AL plus 14 days of PQ (as
per national Guidelines)
Administration of all malaria treatment by DOT

NATIONAL MALARIA STRATEGIC PLAN, VANUATU, 2015 – 2020
Version 7 (Final Draft) – 8 April, 2014 28
Vector control
Indicators of individual access to bed nets must be based on household surveys rather than
estimated from distribution records. This will better inform procurement needs in future
planning cycles.
Better evaluation of larval source management interventions is required before this
intervention can be replicated in other areas
Surveillance and Response
Notifying positive cases to the Provincial Malaria Office within 48 hours
Investigating cases
Following-up all cases by microscopy: once a month for 3 months for P falciparum and once
a month for 6 months for P vivax
Conducting selective mass screening and treatment (MaST) where epidemiological data
indicate continuing local transmission
Community surveillance for detecting possible imported cases of malaria
Monitoring and evaluation
Passive case detection at health facilities – entering line listing data onto the MIS and
reporting to the Provincial Malaria Office monthly
Recording case investigation details in the MIS
Recording LLIN distribution and IRS in the MIS
Community mobilisation and system strengthening
Enhancing community participation
Collaboration and coordination with other health programs
The impact to date of those interventions to date is shown in Table 7 and Figure 12. (Note that the
vector control interventions shown in Figure 11 are superimposed on other public health interventions,
i.e. universal access to parasitological diagnosis using microscopy or RDT and the availability of highly
effective treatment using ACT).
Table 7: Progressive impact of interventions by year, based on the Tafea model (2008-12)
PCD = passive case detection; PCD+ = enhanced passive case detection; ACD = active case detection
Pop. Tested ABER Cases TPR % API IRS ITN PHASE2008 32540 3492 11 757 21.7 23.3 — 30% CONTROL MMLL PCD
2009 32540 1809 6 278 15.4 8.5 IRS 3 30% ACCEL MMLL PCD
2010 32906 2765 8 63 2.3 1.9 IRS 2 >85% ACCEL MMLL PCD
2011 33269 1680 5 17 1.0 0.5 IRS 1 >85% PRE-ELIM CASE PCD
2012 33635 1869 6 20 1.1 0.6 — >85% ELIM 1 CASE PCD+ ACD
2013 34006 4 — >85% ELIM 2 CASE FOCI PCD+ ACD
SURVEILLANCE

NATIONAL MALARIA STRATEGIC PLAN, VANUATU, 2015 – 2020
Version 7 (Final Draft) – 8 April, 2014 29
Figure 12: Confirmed malaria cases (Y2 axis) and TPR and API trends (Y1 axis)
in relation to pilot elimination interventions, Tafea province, 2008-12
Table 7 and Figure 12 show that the number of reported cases in Tafea fell from 757 in 2008 to just four
imported cases in 2013 (an additional indigenous case, reported during the strategic planning workshops
in November 2013, is not included in the data). The province passed the WHO-recommended pre-
elimination threshold (TPR < 5%; Figure 9) in 2010 after just one round of IRS. The elimination threshold
(API < 1 per 1,000) was reached in 2011 after two rounds of IRS in all households situated within two
kilometres of the sea (with a coverage of >90% of households sprayed), concurrently with the
achievement of a high coverage of LLINs (93%, with 87% utilisation).
The provincial health service also maintained universal free access to diagnosis by RDT or microscopy
and DOT with ACT through an expanded network of primary care facilities (including increasing the
number of Aid Posts from 20 in 2010 to 31 by the end of 2012), by increasing community and school
engagement, and establishing a team of 17 dedicated malaria staff (including 8 malaria elimination
officers). LSM was undertaken on Tanna but not Erromango or Aniwa.
The API has continued to decline – to 0.4 per 1,000 in 2012 – and is expected to fall below 0.1 per 1,000
in 2013. There have been no reported deaths attributed to malaria since commencement of elimination-
oriented activities.
These achievements can inform a progressive expansion of similar interventions to other islands, and
form the basis of the proposed Strategy for 2015-20. The gradient towards higher transmission in the
northern provinces represents a risk that the strategy may not be as fully effective as in Tafea (Section
3.1.1); however, early results from Torba suggest that the impact will be similar.
93% coverage
87% utilisation

NATIONAL MALARIA STRATEGIC PLAN, VANUATU, 2015 – 2020
Version 7 (Final Draft) – 8 April, 2014 30
3.2.6 Supply chain management
The specifications for RDTs and ACT comply with WHO prequalification and evaluation guidelines; these
commodities are procured through SPC- and WHO-prequalified suppliers.
Lot quality control testing is routinely performed for all arriving batches of RDTs.
Non-air-conditioned store rooms at facilities raise concerns about the validity of RDTs, ACT and other
drugs in the field. There is currently no mechanism for collecting random samples of ACT or RDT from
health facilities for quality testing.
All medical supplies are first stored and then distributed to provinces through the national CMS. The
submission of orders may not be timely, communication between facilities, provincial pharmacies and
the CMS may be inadequate, and provinces and facilities may not receive what has been ordered; on
occasions, the CMS intervenes when the provincial pharmacy does not detect or respond to attempts to
stockpile supplies at the facility level.
Forecasting systems for the quantification of medicine orders need to be adjusted to reflect the reduced
number of cases to be treated – otherwise, oversupply and expiry of ACT will occur in many health
facilities. Stock outs of RDTs are occasionally reported. Quantification of procurement is further
complicated by the relatively short shelf life of both ACT and RDTs (often around two years).
3.2.7 Surveillance and information management
The Malaria Information System, which gathers and consolidates routine essential malaria surveillance
and programmatic data through the MMLL, has been functioning in parallel with the HIS since 2009. At
present, the surveillance and investigation of possible malaria deaths needs to be coordinated manually
between the HIS and MIS.
The possibility of malaria resurgence after reaching very low transmission levels depends on several
factors: human and mosquito movement due to frequent inter-island travel by air and sea through
multiple entry points (importation risk) and the presence of vector mosquitoes and the degree of
immunity in the human population (receptivity). Information on malaria outbreaks is currently very
limited. Anecdotally, outbreaks or higher transmission levels have been reported from: Emae in 1985;
Tanna in 1987 (following Cyclone Uma); Epi in 1988; Tongoa in 1990 (Kaneko 1998); Tanna, Erromango
and Aniwa in 2000 and 2003 (Kaneko 2010); Gaua Island in Torba in 2010; and on Epi Island in Shefa and
Malo Island and North East Santo in Sanma in 2012 (MOH 2013). However there is no written record of
formal investigation and management of these events, or a clear definition of what constitutes an
‘outbreak’.
3.2.8 Interaction with other health system elements
The Strategic Vision states a clear intention for the annual VBDCP work plan to be integrated
progressively with provincial health plans, for operational planning and budgeting to be harmonised, and
for health facilities to become the focal points for community level prevention (e.g. planning and
management of LLIN distribution). This would free up the central VBDCP to focus on higher level
activities to strengthen the implementation of the Program, e.g. operational research, QA, monitoring,
surveillance and response.

NATIONAL MALARIA STRATEGIC PLAN, VANUATU, 2015 – 2020
Version 7 (Final Draft) – 8 April, 2014 31
In practice, the provincial malaria supervisors travel to Port Vila once or twice a year for review and
planning meetings. However, the consolidated MAP is structured by programmatic area and activity –
often reflecting project-based funding sources – rather than by geographic area, and implementation is
centrally managed with little provincial input (MOH 2013).
Operationally, the Program has exercised some leeway to include other health programs (e.g.
immunisation) in community outreach activities), and to include yaws and lymphatic filariasis
surveillance activities in the malaria indicator survey. Those collaborations could be strengthened
further through interventions like integrated vector management (IVM), surveillance and reporting,
preventing or controlling other VBDs in Vanuatu.
The Program interacts constructively with CMS for procurement, supply chain management and logistics,
and with the MOH Finance section for financial program management.
However, around 70% of malaria funding is provided from donor sources, almost 100% of commodities
procurement is externally funded (and managed) and 68 of 82 positions are project-funded (although
managed through GOV systems).
3.2.8 Recommendations of the 2013 MPR
The MPR made many specific recommendations in relation to individual thematic areas of the Program,
plus a number of higher-order strategic directions (summarised in abbreviated form in Box 2).
Box 2: Strategic Recommendations of the Malaria Program Review, 2013
Program management
Malaria Program planning should be directed towards a comprehensive provincial planning,
budgeting and expenditure reporting process and more substantive provincial input.
The VBDCP and the Malaria Steering Committee should resist taking on too many general
health system strengthening tasks; it should focus primarily on its core functions – disease
control and public health aspects of the Program.
Renewed donor support should gradually reduce the reliance on short term outside
technical advisers, encouraging VBDCP instead to focus requests for such assistance on
defined analytic tasks and to capitalise on internal resources and past capacity building
activities.
Case management
In areas where quality-assured malaria microscopy is difficult to establish and sustain, RDT
should be the diagnosis of choice (in both hospitals and Health Centres).
Quality assured microscopy should be maintained in hospitals for monitoring treatment
response in in-patients, and in selected Health Centres.
Primaquine use and any adverse effects should be tracked and reported through the
malaria line list until such time as G6PD testing and/or data on primaquine safety and
efficacy from ongoing studies become available.

NATIONAL MALARIA STRATEGIC PLAN, VANUATU, 2015 – 2020
Version 7 (Final Draft) – 8 April, 2014 32
Vector control
Indicators of individual access to bed nets must be based on household surveys rather than
estimated from distribution records. This will better inform procurement needs in future
planning cycles.
Better evaluation of larval source management interventions is required before this
intervention can be replicated in other areas.
Behaviour change communication and community mobilization
As malaria cases decline, it is critical to continue to engage both the community and health
workers to maintain high levels of bed net utilisation.
Monitoring and evaluation
A strengthened M&E unit within the Program is needed to undertake regular
epidemiological analysis, to guide elimination strategies and to set targets and timelines.
Surveillance in support of elimination
Frequent monitoring of indicators at provincial and health zone level is vital to improve risk
stratification and targeting of interventions. For monthly or quarterly reviews, the Program
should concentrate on a few critical indicators (e.g. incidence and test positivity rate by
species) to guide interventions and relate activities and interventions to impact.
3.3 Introduction of zonal stratification and mapping
Traditionally, other than the north-south gradient in reported incidence (Section 2.3, Figure 1 and Table
4), there have been no officially defined strata of malaria transmission risk in Vanuatu.
The only other form of operational stratification was built on the finding that mosquito breeding and
malaria risk in Tafea were higher within 2 km of the coast, and this guided the geographical coverage of
IRS interventions. However, this 2 km zone does not correspond to any sub-provincial administrative
level for program planning.
Monthly API and TPR data by health zone are now available for 2010, 2011 and 2012; these have been
used to develop zonal transmission risk stratification maps (Annex 1) which, in turn, have been used to
prioritise and target malaria interventions more efficiently in support of the elimination agenda (see
Section 5.1 Thematic Area 1: Vector control). Stratification at even lower levels, e.g. administrative
villages, will eventually allow even better identification of the important foci of transmission.

NATIONAL MALARIA STRATEGIC PLAN, VANUATU, 2015 – 2020
Version 7 (Final Draft) – 8 April, 2014 33
4. Strategic Plan Framework
4.1 Vision
The Vision of the National Malaria Strategic Plan for 2015-20 is: 11
A malaria-free Vanuatu by 2025-28, contributing to the good health and well-being of the population
The Vision acknowledges the likely longer term time frame necessary to achieve sustainable zero malaria
transmission throughout the country, i.e. about 10 years from commencement of the new NMSP.
4.2 Mission and values
4.2.1 Mission statement
The Mission of the NMSP, which clarifies its contribution to the Vision, is:
The Malaria Program aims to progressively control and eliminate malaria in all provinces of Vanuatu.
The Program works in close partnership with provincial health services and local communities to
ensure that universal access to health promotion, prevention with long-lasting insecticidal bed nets,
and quality-assured diagnosis and treatment is maintained. It aims to use indoor residual spraying to
accelerate reduction in malaria transmission in selected areas. It seeks to strengthen and maintain
excellent surveillance and apply new knowledge as it becomes available in order to achieve malaria
elimination and the prevention of reintroduction.
This Mission statement describes the direct contribution of Malaria Strategy to the achievement of the
Vision. Activities supported by the Program are always informed by this Mission statement, and the
Program is accountable for their implementation.
4.2.2 Values
The guiding values of the Strategic Plan are:
Country ownership and leadership through the MOH, the VBDCP, provincial health services and
their partners
Free and universal access to malaria services, increasingly integrated with community PHC
Evidence based, ethical and technically sound interventions
Efficiency and value for money, for both Government and donors, both in relation to malaria
targets and to the overall health system
Partnership with: other health sector programs (e.g. maternal, neonatal and child health [MNCH]
and environmental health); other non-health sector ministries and organisations; academic and
research institutions; private sector entities; and civil society organisations
Increasing community responsibility and leadership for malaria control and elimination (e.g.
through community leaders, zonal elimination committees, and community health and
surveillance committees)
Transparency and accountability
11
The Vision is aligned with the Vanuatu Health Sector Strategy 2010-2016. Should the Health Sector Strategy be updated
during the new NMSP, the vision may need to be updated. This will be assessed at a proposed mid-term review in early 2017.

NATIONAL MALARIA STRATEGIC PLAN, VANUATU, 2015 – 2020
Version 7 (Final Draft) – 8 April, 2014 34
4.3 Overall strategic directions
The guiding direction for the Strategic Plan, agreed at the March 2013 workshop, is progressive (“step-
wise”) transition from control to elimination, province by province.
This will include:
Progressive integration into the Vanuatu health system as part of overall disease surveillance and
control/elimination activities; and
Improved capacity for planning, priority setting and resource allocation at both provincial and
national level.
HIS and malaria information system (MIS) data will be used to guide feasibility analysis and decision-
making.
The MOH and VBDCP will set and pursue Vanuatu’s own goals, which are currently aligned with the
MDGs developments and are likely to remain consistent with the “post-2015 development agenda”.
Noting the importance of continuing technical and financial assistance, the MOH and the Program will
maintain and strengthen key partnerships, including: the Global Fund; WHO and the Global Malaria
Programme; the Asia-Pacific Malaria Elimination Network; and bilateral donors (e.g. Australia, Japan).
4.4 Goal and Objectives
4.4.1 Goal
The Goal of the Strategy is:
By the end of 2020, to reduce the annual parasite incidence rate to < 1 per 1,000 nationally and
maintain zero confirmed deaths from malaria.
A number of intermediate Goals can be used as “progress markers” for the Strategy:
By the end of 2016, to achieve zero local transmission of malaria in one province (Tafea) and reduce
the annual parasite incidence rate to < 5 per 1,000 nationally and maintain zero confirmed deaths
from malaria;
By the end of 2018, to reduce the annual parasite incidence rate to < 2.5 per 1,000 nationally and
reduce the annual parasite incidence rate to < 1 per 1,000 in one additional province (Torba) and
maintain zero confirmed deaths from malaria.
Section 7 (Monitoring and Evaluation) explains how the achievement of these intermediate progress
markers and the overall impact of the Strategy will be measured.
4.4.2 Thematic areas and Strategic Objectives
Under the Strategy, Malaria Program activities are grouped into three thematic operational areas, each
with its own strategic objective. These are shown in diagrammatically in Figure 13 (which also
demonstrates how each of the thematic areas relates to the Vision, Mission and Goal); the logic model
and theory of change are summarised more comprehensively in the diagram on page xiii.
These operational objectives are supported by a specific programmatic management objective, including
the management of technical assistance, which will also be actively monitored (see Section 6).
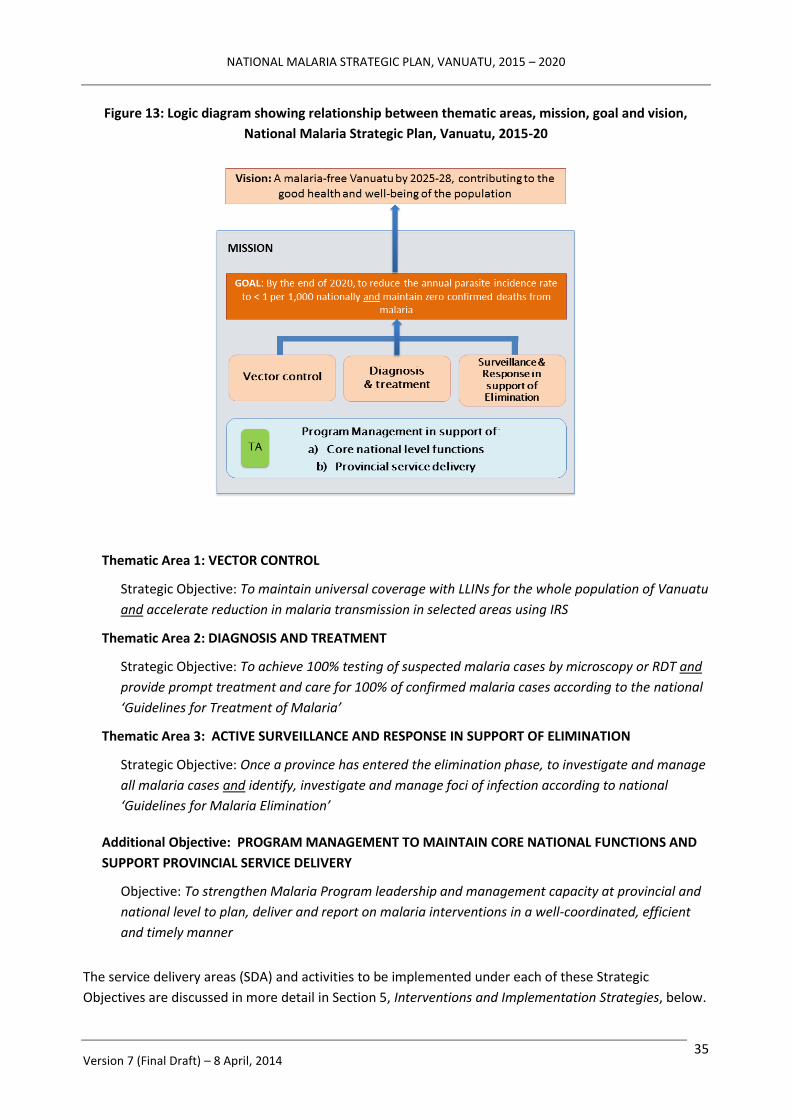
NATIONAL MALARIA STRATEGIC PLAN, VANUATU, 2015 – 2020
Version 7 (Final Draft) – 8 April, 2014 35
Figure 13: Logic diagram showing relationship between thematic areas, mission, goal and vision,
National Malaria Strategic Plan, Vanuatu, 2015-20
Thematic Area 1: VECTOR CONTROL
Strategic Objective: To maintain universal coverage with LLINs for the whole population of Vanuatu
and accelerate reduction in malaria transmission in selected areas using IRS
Thematic Area 2: DIAGNOSIS AND TREATMENT
Strategic Objective: To achieve 100% testing of suspected malaria cases by microscopy or RDT and
provide prompt treatment and care for 100% of confirmed malaria cases according to the national
‘Guidelines for Treatment of Malaria’
Thematic Area 3: ACTIVE SURVEILLANCE AND RESPONSE IN SUPPORT OF ELIMINATION
Strategic Objective: Once a province has entered the elimination phase, to investigate and manage
all malaria cases and identify, investigate and manage foci of infection according to national
‘Guidelines for Malaria Elimination’
Additional Objective: PROGRAM MANAGEMENT TO MAINTAIN CORE NATIONAL FUNCTIONS AND
SUPPORT PROVINCIAL SERVICE DELIVERY
Objective: To strengthen Malaria Program leadership and management capacity at provincial and
national level to plan, deliver and report on malaria interventions in a well-coordinated, efficient
and timely manner
The service delivery areas (SDA) and activities to be implemented under each of these Strategic
Objectives are discussed in more detail in Section 5, Interventions and Implementation Strategies, below.
NATIONAL MALARIA STRATEGIC PLAN, VANUATU, 2015 – 2020
Version 7 (Final Draft) – 8 April, 2014 36
4.4.3 Health promotion
Health promotion is not represented as a separate, stand-alone thematic area under the new Strategy.
Behaviour change communication (BCC) using approaches like CoMBI (community mobilisation for
behavioural impact) and the development of information, education and communication (IEC) materials
are integrated horizontally, where needed, as activities within each of the other thematic areas. Costs
and budgets for BCC activities and development of IEC materials are integrated with the relevant
thematic area rather than as a vertically managed element under Program Management.
A separate advocacy, communication and social mobilisation (ACSM) strategy is currently under
development and will be finalised prior to inception of the new NMSP in 2015. Priority areas of focus will
include advocacy and engagement with political and community leaders, World Malaria Day activities,
community engagement and preparation for IRS operations, community mobilisation for bed net
distribution, utilisation and replacement, and piloting VHW-led activities for recycling and/or disposal of
retired bed nets.
In designated elimination areas, a key activity under the ACSM strategy will be to support community
engagement for local level vigilance and participation (Thematic Area 3). Approaches are being piloted
in Tafea in 2014, and this will inform the evolution of those strategies in other pre-elimination and
elimination provinces and areas.
As capacity within the central MOH Health Promotion Unit allows, malaria-specific health promotion
functions will be progressively integrated as recommended by the MPR (MOH 2013).
4.4.4 Operational research
Similarly, operational research is horizontally integrated at the activity level within each of the other
thematic areas (i.e. rather than existing as a separate menu of inputs managed vertically by an external
agency or through a technical assistance function under Program Management).
Subject to available funding, an operational research plan will be developed prior to inception of the
new NMSP in 2015, and updated within each annual operational plan according to evolving needs and
priorities. Each TAG meeting will review operational research activities and emerging needs. Where
budgets or technical assistance are required, this will be proposed to the MSC for authorisation. These
processes are explained further in Section 6.5.2.
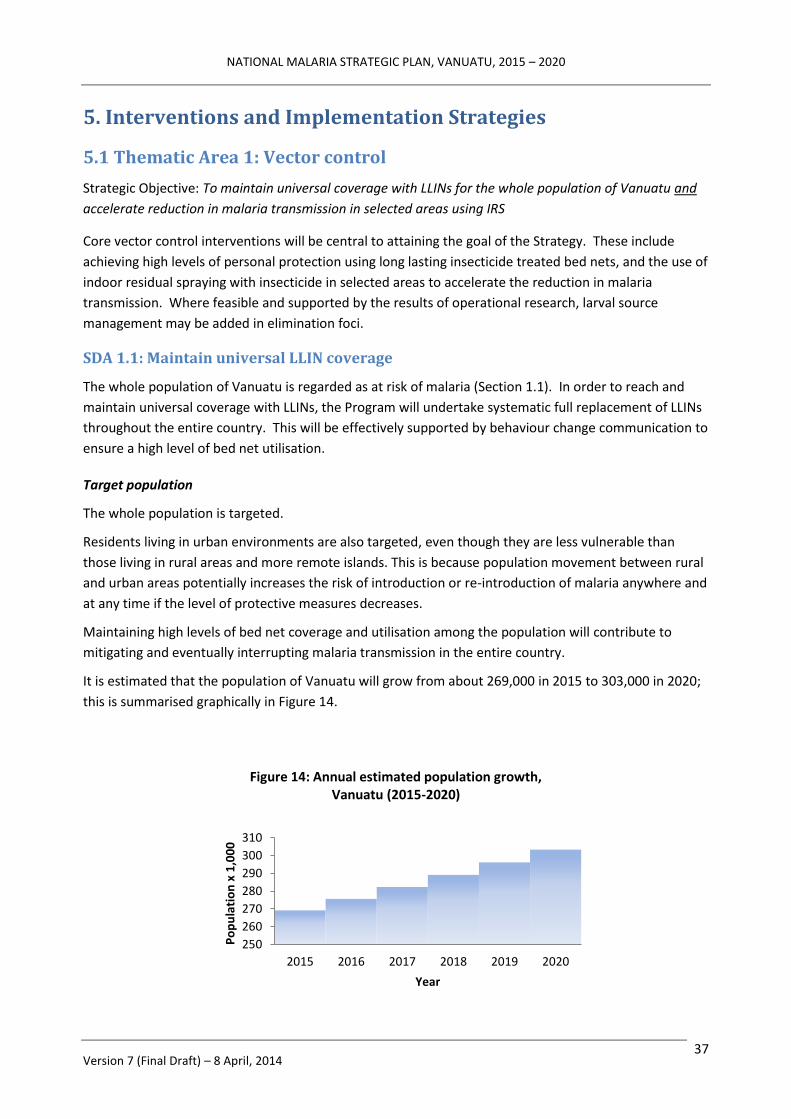
NATIONAL MALARIA STRATEGIC PLAN, VANUATU, 2015 – 2020
Version 7 (Final Draft) – 8 April, 2014 37
5. Interventions and Implementation Strategies
5.1 Thematic Area 1: Vector control
Strategic Objective: To maintain universal coverage with LLINs for the whole population of Vanuatu and
accelerate reduction in malaria transmission in selected areas using IRS
Core vector control interventions will be central to attaining the goal of the Strategy. These include
achieving high levels of personal protection using long lasting insecticide treated bed nets, and the use of
indoor residual spraying with insecticide in selected areas to accelerate the reduction in malaria
transmission. Where feasible and supported by the results of operational research, larval source
management may be added in elimination foci.
SDA 1.1: Maintain universal LLIN coverage
The whole population of Vanuatu is regarded as at risk of malaria (Section 1.1). In order to reach and
maintain universal coverage with LLINs, the Program will undertake systematic full replacement of LLINs
throughout the entire country. This will be effectively supported by behaviour change communication to
ensure a high level of bed net utilisation.
Target population
The whole population is targeted.
Residents living in urban environments are also targeted, even though they are less vulnerable than
those living in rural areas and more remote islands. This is because population movement between rural
and urban areas potentially increases the risk of introduction or re-introduction of malaria anywhere and
at any time if the level of protective measures decreases.
Maintaining high levels of bed net coverage and utilisation among the population will contribute to
mitigating and eventually interrupting malaria transmission in the entire country.
It is estimated that the population of Vanuatu will grow from about 269,000 in 2015 to 303,000 in 2020;
this is summarised graphically in Figure 14.
250
260
270
280
290
300
310
2015 2016 2017 2018 2019 2020
Po
pu
lati
on
x 1
,00
0
Year
Figure 14: Annual estimated population growth, Vanuatu (2015-2020)

NATIONAL MALARIA STRATEGIC PLAN, VANUATU, 2015 – 2020
Version 7 (Final Draft) – 8 April, 2014 38
It is not yet certain for how long universal bed net coverage will need to be maintained after the
achievement of zero transmission. This will be addressed by the Program review scheduled for 2017 (see
Section 7.3, Mid-term and end-of-Strategy evaluations), by which time zero transmission should have
been achieved in Tafea and possibly elsewhere in the country (Figure 20).
Geographic coverage
All villages in all health zones are targeted for bed net replenishment and distribution.
In total, there are 49 health zones across the 6 provinces. The number of health zones in each province
varies according to population distribution and geographic topography. There is a significant variation in
population between health zones (Figure 15); in 2015, for example, the highest population size in a
health zone will be around 77,000 residents while the lowest (in a more scattered, outer island health
zone) will be around 500 residents. (Note, Figure 15 has a logarithmic scale on the Y-axis).
For logistic and operational reasons, and in order to maintain possible highest LLIN coverage, distribution
will need to continue in a phased manner (i.e. by health zone), continuing on from the previous cycles
with particular provinces and health zones targeted each year. Based on the current distribution cycle,
the provincial populations targeted for LLIN implementation are summarised Table 8.
Table 8: Populations targeted for LLIN replacement and distribution,
by year and province, Vanuatu, 2015-20
PROVINCE 2015 2016 2017 2018 2019 2020 TORBA 1,382 9,810 544 1,462 10,380 576
SANMA 8,376 37,320 13,999 8,992 40,073 15,031
PENAMA 5,577 17,998 14,188 5,831 18,820 14,836
MALAMPA 10,211 21,803 11,935 10,584 22,596 12,369
SHEFA 16,488 13,264 84,321 18,386 14,791 94,031
TAFEA 13,203 23,548 1,776 13,642 24,333 1,836
VANUATU 55,236 123,743 126,763 58,898 130,993 138,678
1
10
100
1000
10000
100000
Po
pu
lati
on
(Lo
gsal
e)
Figure 15: Projected population distribution by health zone, Vanuatu, 2015

NATIONAL MALARIA STRATEGIC PLAN, VANUATU, 2015 – 2020
Version 7 (Final Draft) – 8 April, 2014 39
Adequate access policy
The policy for adequate access under the new Strategy has been formulated based on evidence
generated during the present Strategic Vision. The number of nets given to each household should be
proportional to the number of sleeping places in the household. Analysis of data from the 2011 Malaria
Indicator Survey (Annex 2 and Supplement) found that the ratio of people per net used was 1.48.
However, the ratio of available nets to sleeping places was 1.0 (regardless whether or not those sleeping
places were occupied the night of the survey), indicating that the quantity of nets was sufficient for
universal access even in the presence of population movement.
This bed net policy can greatly simplify the field distribution of LLINs, i.e. by basing distribution on
existing sleeping patterns (which inherently reflect the age and gender structure of the household), as
opposed to other, more complex distribution formulae. Coverage can be readily maintained through a
systematic three-year cycle of distribution, in line with the expected three-year lifespan of LLIN (as per
manufacturers’ recommendations and the results of operational research under similar usage patterns.
Distribution channels
Relevant operational guidelines are already is available to the distribution teams, including recording and
reporting tools. A small number of updates will be needed to recognize the new NMSP.
Three interacting distribution channels will be used (Figure 16): house-to-house, boarding schools, and
selected health facilities providing antenatal services (e.g. hospitals, Health Centres with midwives).
Figure 16: Logic diagram showing relationship between various bed net distribution channels,
Vanuatu, 2015-20
House-to-house distribution, extending the current three-year provincial cycle of mass outreach
campaigns, will ensure high access to LLIN is for every household. This distribution approach will deliver
more than 90% of the LLINs targeted for delivery annually.
About 5% of nets targeted for distribution annually will be made available to boarding schools for the
exclusive use of students during the term. The boarding school distribution channel is supplementary to

NATIONAL MALARIA STRATEGIC PLAN, VANUATU, 2015 – 2020
Version 7 (Final Draft) – 8 April, 2014 40
house-to-house delivery as some of residents (students) stay in the boarding schools away from their
family homes during the school term. The nets will remain the property of the school, as a net will have
been distributed and be available for the student’s sleeping space at home during term break.
Distribution through selected health facilities providing antenatal care is a top-up approach to provide
maximum access to LLIN among pregnant women and their new-born baby. This is a passive approach
and, from existing delivery data, will represent less than 5% of annual LLIN distribution. Subject to
logistic demands and performance, bed nets may also be made available at lower levels of health facility
for distribution to positive malaria cases who report that they do not have access to a bed net.
Micro-planning and operational distribution mechanisms
One-third of provinces will be targeted annually. As noted above, this cycle is based on the observed
three-year functional lifespan of the majority of nets under field conditions in Tafea (Dutta 2014) and
procurement and organizational management considerations (which would provide more stable,
regulated coverage than a one-off nationwide distribution once every three years). The VBDCP currently
operates their LLIN interventions based on this. This approach gives a procurement forecast as shown in
Figure 17.
Each operational team at provincial level will be responsible for micro-planning its own LLIN distribution
rounds. The national Program team will provide training, technical assistance and operational guidance
to each provincial team to ensure they are well oriented and skilled in developing, managing, and
implementing their LLIN operational plan. A micro-planning tool has already been developed, but may
need to be revised to make it more user-friendly in the provincial planning context.
The provincial operational team will prepare and organize their team according to the standard
operating procedures (SOP) for LLIN distribution (as revised). Generally, the team will comprise
provincial Malaria Program officers, peripheral health staff if they are available (nurses, HPOs and
VHWs), and volunteers in their respective village as part of community participation and engagement.
Each community operation will be coordinated and monitored by the provincial Malaria Program officer
in charge.
LLIN distribution will take place according to pre-planned schedules. Whenever possible, where LLIN
distribution is scheduled for the same place as IRS, the operational schedules will be combined.
-
20
40
60
80
100
120
2015 2016 2017 2018 2019 2020
# LL
IN x
1,0
00
Figure 17: Forecast number of LLIN to be procured and distributed, by year, Vanuatu, 2015-2020

NATIONAL MALARIA STRATEGIC PLAN, VANUATU, 2015 – 2020
Version 7 (Final Draft) – 8 April, 2014 41
Current experience is that rounds of LLIN distribution may occasionally need to be deferred for financial
or operational reasons. Although this has caused coverage (and coverage-based distribution data) to
fluctuate, it has nevertheless remained at acceptable levels (generally >80% by province; Figure 18).
Procurement and supply management
The quantity of nets for procurement is determined from existing distribution records combined with
population projections and the findings of the 2011 Malaria Indicator Survey. These support the current
distribution policy at one net per sleeping place, which gives an equivalent procurement ratio by
population of one net per 1.25 people. The total quantity of LLIN needed for the period 2015-2020 can
therefore be forecast as follows (Table 8):
Table 8: Procurement (upper) and distribution (lower) projections for LLIN replacement,
by year and province, Vanuatu, 2015-20
PROCUREMENT 2015 2016 2017 2018 2019 2020 VANUATU 45,000 100,000 102,000 48,000 106,000 112,000
DISTRIBUTION 2015 2016 2017 2018 2019 2020 TORBA 1,200 7,900 500 1,200 8,400 500
SANMA 6,800 30,000 11,300 7,300 32,100 11,100
PENAMA 4,600 14,500 11,500 4,800 15,100 12,000
MALAMPA 8,300 17,500 9,700 8,600 18,200 10,000
SHEFA 13,300 10,700 67,500 14,800 11,900 75,300
TAFEA 10,600 18,900 1,500 11,000 19,600 1,500
VANUATU 44,800 99,500 102,000 47,700 105,300 111,400
0
20
40
60
80
100
2009 2010 2011 2012 2013 2014 2015 2016 2017 2018 2019 2020
Co
vera
ge (
%)
Figure 18: LLIN coverage (actual and forecast), by province, Vanuatu, 2009-2020
TORBA SANMA PENAMA MALAMPA
SHEFA TAFEA COUNTRY

NATIONAL MALARIA STRATEGIC PLAN, VANUATU, 2015 – 2020
Version 7 (Final Draft) – 8 April, 2014 42
Currently, LLIN procurement for Vanuatu is outsourced by international tender according to the policies
of the donor (Global Fund). In-country procurement capacity is limited, and would most likely attract
price increases due to the small quantity to be ordered under a single-country model. Collaboration with
neighbouring countries under a pooled procurement approach will be considered (subject to decisions
about a Global Fund submission during 2014).
In-country supply management will use the existing inventory system and sub-national storage depots.
Support for high levels of utilisation
The Program will support and inform effective behaviour change communication at both national and
provincial level to ensure continued high utilisation rates.
Disposal or recycling of expired or ‘retired’ nets
Continued cyclical distribution of large quantities of new nets poses an operational question of what to
do with ‘retired’ nets. The Program will undertake operational research to guide domestic and other re-
use of old nets. Options include using them as window or door-way screens, using them as raw materials
for cottage industries (e.g. to make pillows, sleeping mats), or weaving them into ropes for fishing,
farming and other uses.
Monitoring
The operational success of this intervention will be measured by periodic household surveys, with targets
of at least 80% accessibility and 80% usage at population level.
Dialogue and collaboration with other agencies undertaking household and population based surveys
will be needed at times where a malaria indicator survey is not scheduled, e.g., demographic and health
survey (DHS), multiple indicator cluster survey (MICS), etc.
SDA 1.2: Achieve full coverage of selected populations with IRS
Experience from Tafea province enables the Program to extrapolate and forecast the potential impact of
targeted IRS in selected populations if it were applied in a similar way (assuming similar patterns of
malaria transmission).
Model of accelerated control using IRS
To support this, the Program can strategically classify the population by health zone, using the TPR as the
stratification factor. This enables four strata to be identified, as follows:
Category A: TPR below 1%
Category B: TPR between 1% (inclusive) and 5% (exclusive)
Category C: TPR between 5% (inclusive) and 15% (exclusive)
Category D: TPR above 15% (inclusive)
Based on this approach, and applying the expected cumulative effect of 60%, 80%, and 95% reduction in
TPR from one, two and three rounds of IRS (identified in Tafea and elsewhere, in conjunction with high
background LLIN coverage and other interventions), four likely scenarios to reduce TPR close to 1% can
be forecast as shown in Figure 19.

NATIONAL MALARIA STRATEGIC PLAN, VANUATU, 2015 – 2020
Version 7 (Final Draft) – 8 April, 2014 43
These scenarios can guide the Program on how to strategically target IRS preventive intervention to
achieve an accelerated reduction in malaria transmission, as follows:
Category A – maintain LLIN coverage, but no accelerated IRS intervention needed; ready
to apply surveillance and response interventions according to national elimination policy
and guideline.
Category B – targeted for at least one round of IRS to accelerate reduction in
transmission
Category C – targeted for at least two consecutive rounds of IRS
Category D – targeted for at least three consecutive rounds of IRS
Figure 19: Number of rounds of IRS (+ maintaining high LLIN coverage) needed to reach Test Positivity
Rate < 5 according to initial TPR, based on Tafea experience, Vanuatu
The basis for this mathematical modelling is explained further in Annex 3.
Based on the model, and taking into account the operational feasibility (forecast program workload and
logistics), it appears that targeted IRS should be able to accelerate the reduction in the national malaria
burden to below 1 per 1,000 (as measured by API) or 1% (as measured by TPR) by 2020. This would be
contingent on targeted introduction of supplementary IRS, phased by province as shown in Figure 20.12
Based on the model, it is predicted that the API would decline by province and year as shown in Table 9.
12
Penama and Sanma provinces would lag slightly behind the other provinces in term of reducing the malaria burden below the
average national goal, and would require continued interventions after 2020.

NATIONAL MALARIA STRATEGIC PLAN, VANUATU, 2015 – 2020
Version 7 (Final Draft) – 8 April, 2014 44
Figure 20: Proposed phasing of IRS-based program acceleration, by province,
based on Tafea experience, Vanuatu, 2014-2020
Table 9: Expected reduction in API as a result of targeted IRS (+ high LLIN coverage),
by year and province, Vanuatu, 2015-20
PROVINCE 2015 2016 2017 2018 2019 2020 TORBA 2.4 1.2 0.6 0.4 0.3 0.3
SANMA 6.3 5.0 4.0 3.2 2.6 2.1
PENAMA 9.7 7.7 6.2 5.0 3.0 1.3
MALAMPA 10.9 7.0 4.7 2.4 1.3 0.8
SHEFA 3.2 2.5 2.0 1.3 0.9 0.7
TAFEA --------------- Zero (or very low) transmission ---------------
VANUATU 5.0 4.0 3.01 2.09 1.43 0.97
Targeting by province and health zone
As shown in Figure 21, 7 health zones will be targeted for one round of IRS preventive intervention
(Category B) and 7 health zones will be targeted for two consecutive rounds (Category C). Another five
health zones will be targeted for three consecutive rounds of IRS, and three health zones might require
more than three rounds to reduce transmission below 1 per 1,000 (API) or 1% (TPR) level (all Category
D).
Under this approach, 27 health zones (or 55% of health zones throughout the country, including Tafea)
will continue to be targeted for maintaining high LLIN coverage and utilisation but will not be targeted
for IRS at all between 2015 and 2020.

NATIONAL MALARIA STRATEGIC PLAN, VANUATU, 2015 – 2020
Version 7 (Final Draft) – 8 April, 2014 45
Figure 21: Number of targeted health zones requiring 0, 1, 2, 3 or more rounds of IRS
for acceleration of malaria control (based on Tafea experience), Vanuatu, 2014-2020
Figure 22 summarises the detail of proposed IRS operations by province. The main focus will be on
Malampa, Penama and Shefa provinces. Torba province will be targeted if additional rounds are
required beyond 2015, while Tafea province will no longer require program acceleration through
supplementary IRS preventive interventions.
Figure 22: Projected number of health zones requiring one, two, three or more rounds of IRS,
Vanuatu, 2015-2020
Figure 23 and Table 10 show the expected work load by health zone and by number of households
targeted, by province and year. The work load each year is similar to Tafea in 2011-12, and is deemed to
be feasible.
Monitoring
This intervention will be monitored using operational data, aiming for ≥ 90% of the targeted population
to be covered by IRS.

NATIONAL MALARIA STRATEGIC PLAN, VANUATU, 2015 – 2020
Version 7 (Final Draft) – 8 April, 2014 46
Figure 23: Total number of health zones to be sprayed, by year, Vanuatu, 2015-2020
Table 10: Expected number of households targeted for IRS (upper) and population protected (lower),
by year and province, Vanuatu, 2015-20
HOUSEHOLDS 2015 2016 2017 2018 2019 2020 TORBA 471 484 498 — — —
SANMA — — — — — — PENAMA 2,849 5,764 4,095
MALAMPA 2,348 2,858 4,280 2,849 3,001 583
SHEFA — — 3,075 2,344 — —
TAFEA — — — — — —
VANUATU 2,819 3,342 7,853 8,041 8,764 4,678
POPULATION 2015 2016 2017 2018 2019 2020 TORBA 2,720 2,772 2,824 0 0 0
SANMA 0 0 0 0 0 0
PENAMA 0 0 0 15,047 27,286 18,479
MALAMPA 11,319 13,705 20,700 14,281 13,851 3,201
SHEFA 0 0 13,123 9,691 0 0
TAFEA 0 0 0 0 0 0
VANUATU 14,039 16,477 36,647 39,019 41,137 21,680
Health promotion for vector control interventions
Currently, the Program has expanded its efforts to promote safer behaviours for malaria prevention
through regular and appropriate use of ITNs received, and to promote the acceptability of IRS where
applicable (i.e. in targeted elimination areas, for outbreak response).
Knowledge of the cause and prevention of malaria is well maintained. In the 2011 MIS, up to 99% of
householder respondents mentioned mosquitos as the cause of malaria transmission (although only 84%
reported mosquito nets as an effective preventive method against malaria).
Net utilisation correlated with accessibility. The MIS indicated that, while country-wide bed net coverage
(based on at least one LLIN per household) was 70%, the reported net usage was just 52%. Similar

NATIONAL MALARIA STRATEGIC PLAN, VANUATU, 2015 – 2020
Version 7 (Final Draft) – 8 April, 2014 47
findings also emerged from Tafea, where household coverage was 94% but the reported net usage the
night prior to the survey was 84%. This suggests that, even with saturation levels of bed net access
(100%) based on the operational coverage, the expected usage would not be less than 80%. However, to
maintain knowledge, attitudes, behaviour and practices (KABP) in relation to bed net utilisation, on-going
communication will need to be continued – in particular, looking for any early indication of a relaxing of
bed net utilisation as perceived malaria risk declines.
The Program’s BCC channels currently use mass media broadcasting (mainly radio), printed materials and
interactive communication channels (teaching and community based behavioural change communication
through community health committees). The 2013 MPR found that, in the Vanuatu context, the most
effective means of BCC are through direct (i.e. person-to-person) voice communication.
The Program will work closely with national and provincial HPOs to explore the possibility of integration
with other public health interventions, such as Healthy Island or Primary Health Care package to promote
healthy and safe behaviours.
Health messaging will also be important to prepare communities for IRS, and to ensure good compliance
with management of household items and animals before the spray teams arrive.
Operational research for vector control
Larval site management
Areas where malaria is near the point of elimination (especially if cases are mainly P vivax) could be
suitable for studies to evaluate the effectiveness of LSM strategies to reduce receptivity to malaria. This
may have contributed to the reduction in transmission already seen on Tanna (although there have been
similar reductions in other islands of Tafea and in the Torres group without LSM; Section 3.2.2). It was
agreed during the NMSP consultations to further monitor the results from Erromango and Torba before
including LSM as a routine strategic intervention. LSM will also be considered part of the surveillance
and response intervention, if it is feasible and appropriate, during the elimination phase and the
prevention of re-introduction (see Section 5.3).
LSM initiatives should interlink with ‘village clean-up campaigns’ (as promoted under the Healthy Islands
concept), which are useful for promoting community participation and may be an effective strategy –
direct or indirect – in mosquito control.
Bed net durability studies
Pilot studies will also be undertaken at community level on durability of LLINs and options for recycling of
expired or damaged bed nets.
According to a recent review of LLIN prequalification, it recommended that countries where NetProtect
LLINs have been used should monitor the durability of this product (WHO 2013c). This includes Vanuatu,
and the Program will need to undertake durability monitoring to further inform policy and procurement
decision. A proposed study will commence in 2014 but, as monitoring should continue for at least three
years, will not be complete until 2017 (i.e. into the period of the NMSP 2015-20). The main indicators to
be monitored are physical integrity and residual insecticide effect. 13
13
An emerging option is to use a new Insecticide Quantification Kit (IQK) for cyano-pyrethroids that is about to become
available commercially (Innovative Vector Control Consortium); it can determine the amount of residual insecticide in bed nets
NATIONAL MALARIA STRATEGIC PLAN, VANUATU, 2015 – 2020
Version 7 (Final Draft) – 8 April, 2014 48
Other operational research may look at the use of alternate pesticides to pyrethroids for IRS, and use of
personal repellents where outdoor transmission is a risk (including in occupational settings).
It may also be possible to resume studies of insecticide resistance among mosquitoes – perhaps in
collaboration with the Solomon Islands and a WHO Collaborating Centre.
5.2 Thematic Area 2: Diagnosis and treatment
Strategic Objective: To achieve 100% testing of suspected malaria cases by microscopy or RDT and
provide prompt treatment and care for 100% of confirmed malaria cases according to the national
‘Guidelines for Treatment of Malaria’
Malaria case management is a vital component of malaria control strategies. Quality assured diagnosis
by microscopy or RDT and prompt, effective treatment of P falciparum and P vivax according to the
national Guidelines are the mainstays of case management in Vanuatu. The new Strategy seeks to
maintain universal access to diagnosis and treatment while, at the same time, seeking greater efficiency
for diagnostic processes and QA.
SDA 2.1: Maintain quality assured diagnosis by microscopy or RDT
Target population
The target population for this intervention is all cases of suspected malaria according to the case
definition in the Guidelines for Treatment of Malaria in Vanuatu – essentially, all individuals presenting
to any level of Government health facility with a fever or a recent history of fever. The current definition
of a suspected case is quite restrictive (it allows for exclusion of obvious other causes of fever, thereby
compromising health workers’ ability to detect inter-current malaria infections). All fever patients
should be suspected of having malaria (irrespective of inter-current pathology), and should receive
prompt parasitological confirmation by microscopy or by RDT before treatment is started (WHO 2013b).
Non-immune tourists and other visitors presenting to a private health facility or pharmacy in Port Vila
with fever following a trip to an outer island may be a useful indicator population; the target therefore
includes appropriate referral from the private sector for testing by RDT or microscopy in a public facility.
New guidelines for diagnosis
The national Guidelines for Treatment of Malaria in Vanuatu are due to be revised in 2014; all cadres of
health care worker will be consulted and represented in the revision process. While continuing many
directions of the existing Guidelines, this revision will include the following strategic adjustments for the
diagnosis of malaria and other causes of fever:
The case definition of suspected malaria cases will be aligned with global technical guidance
(WHO 2012a, WHO 2013b) to ensure that all patients presenting with fever or a history of recent
fever receive a parasitological test (RDT or microscopy) and those returning a negative test result
are investigated for other causes of fever (user-friendly flow charts will be developed, suitable
for use in different types of health facility)
(thus providing a measure of duration of efficacy in physically intact nets) and on walls (as a quality control [QC] check for IRS
operations). The IQK uses a standard (visual) colorimetric scale and does not require investment in expensive equipment.

NATIONAL MALARIA STRATEGIC PLAN, VANUATU, 2015 – 2020
Version 7 (Final Draft) – 8 April, 2014 49
Introduction of an Integrated Community Case Management (ICCM) approach for VHWs (Uganda
MOH 2010, Kalyango 2013), using a new algorithm integrating investigation and management of
pneumonia and diarrhoea with malaria diagnosis (user-friendly flow charts will be developed,
suitable for use in different types of health facility)
These revised guidelines and strategies will then be integrated in pre-service and refresher training for
VHWs and other health workers.
Hospital medical staff will be engaged in the revision of the Guidelines, and will be oriented to the
strategic directions of the new NMSP for malaria diagnosis and case ascertainment.
Strategic balance between microscopy and RDTs
The new Strategy responds to the findings and recommendations of the MPR, i.e. that microscopy
services are under-utilised and will become more so as Vanuatu enters a period of steep decline in
malaria incidence nationally (MOH 2013). Experience with RDTs since 2009 has been generally
favourable, and this gives rise to an opportunity to strengthen the efficiency of malaria diagnostic
services and, at the same time, extend their reach into the community.
Extending the reach and maintaining an ABER at or above 15% will be an important part of the strategy
(i.e. ensuring adequate ascertainment and testing of fever cases as many provinces of Vanuatu move
progressively into the pre-elimination and elimination phase and an era of very low malaria incidence).
The following strategic adjustments will be made to the balance between microscopy and RDTs:
Microscopy will be limited mainly to hospitals (where it is important to monitor the severity and
response to treatment of inpatients with severe or complicated malaria) and selected high case
load outpatient settings where it will be cost effective to maintain microscopy services 14
Diagnosis by RDT will be available and consolidated in all community settings, thereby reducing
the time from onset of symptoms to diagnosis and treatment at community level and potentially
accelerating the recognition and reporting of outbreaks
RDTs will be available in hospitals to complement microscopic diagnosis for after-hours
presentations
External QA of sampled microscopy slides will be undertaken by an independent visiting expert
microscopists, with remedial training provided as necessary during the same visit
External QC of sampled used RDTs will be undertaken by comparing them with PCR (annual or
batch sample size to be determined with the help of external technical assistance)
Engagement with the private sector
The Program will explore mechanisms to allocate RDTs within the small private sector in Vanuatu.
Principles will be developed to assist and enable private practitioners to prescribe ACT on the basis of a
positive RDT, in return for reporting positive cases to the national MIS.
14
Cost effectiveness will be guided by the number of slides examined per day and the prospects for existing laboratory workers
and microscopists to either be trained or re-trained to diagnose other conditions, e.g. tuberculosis, intestinal parasites, etc.
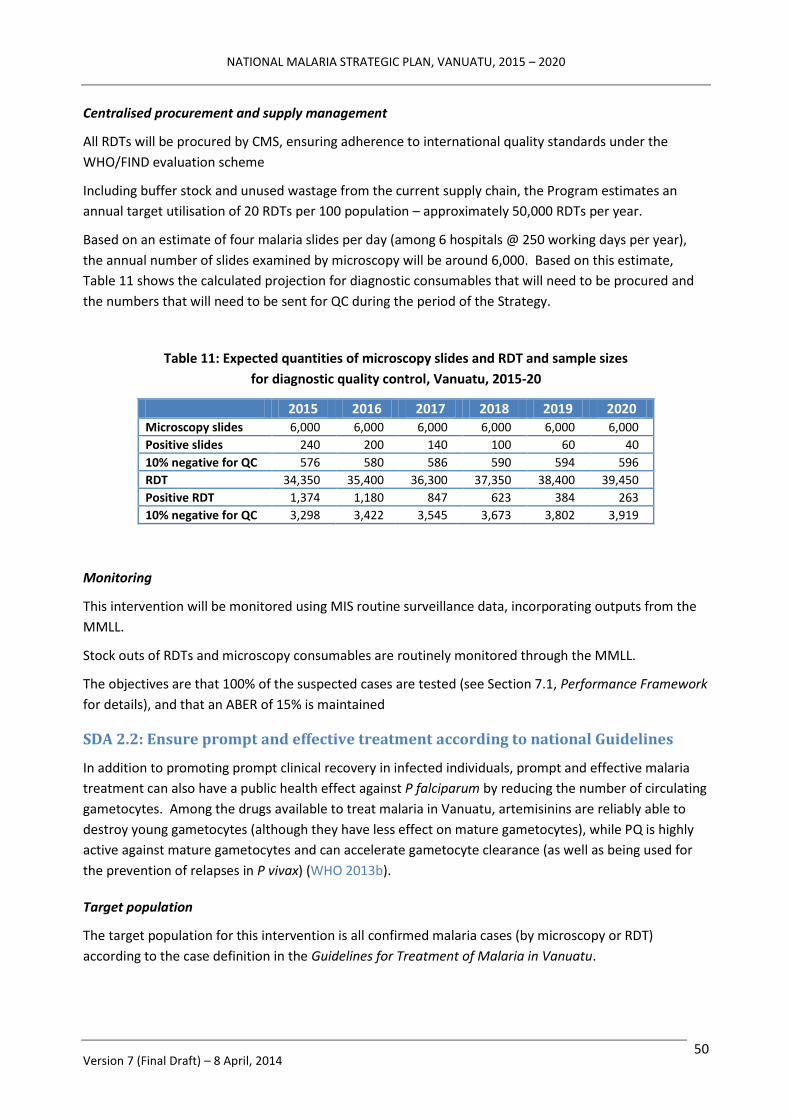
NATIONAL MALARIA STRATEGIC PLAN, VANUATU, 2015 – 2020
Version 7 (Final Draft) – 8 April, 2014 50
Centralised procurement and supply management
All RDTs will be procured by CMS, ensuring adherence to international quality standards under the
WHO/FIND evaluation scheme
Including buffer stock and unused wastage from the current supply chain, the Program estimates an
annual target utilisation of 20 RDTs per 100 population – approximately 50,000 RDTs per year.
Based on an estimate of four malaria slides per day (among 6 hospitals @ 250 working days per year),
the annual number of slides examined by microscopy will be around 6,000. Based on this estimate,
Table 11 shows the calculated projection for diagnostic consumables that will need to be procured and
the numbers that will need to be sent for QC during the period of the Strategy.
Table 11: Expected quantities of microscopy slides and RDT and sample sizes
for diagnostic quality control, Vanuatu, 2015-20
2015 2016 2017 2018 2019 2020 Microscopy slides 6,000 6,000 6,000 6,000 6,000 6,000
Positive slides 240 200 140 100 60 40 10% negative for QC 576 580 586 590 594 596
RDT 34,350 35,400 36,300 37,350 38,400 39,450
Positive RDT 1,374 1,180 847 623 384 263
10% negative for QC 3,298 3,422 3,545 3,673 3,802 3,919
Monitoring
This intervention will be monitored using MIS routine surveillance data, incorporating outputs from the
MMLL.
Stock outs of RDTs and microscopy consumables are routinely monitored through the MMLL.
The objectives are that 100% of the suspected cases are tested (see Section 7.1, Performance Framework
for details), and that an ABER of 15% is maintained
SDA 2.2: Ensure prompt and effective treatment according to national Guidelines
In addition to promoting prompt clinical recovery in infected individuals, prompt and effective malaria
treatment can also have a public health effect against P falciparum by reducing the number of circulating
gametocytes. Among the drugs available to treat malaria in Vanuatu, artemisinins are reliably able to
destroy young gametocytes (although they have less effect on mature gametocytes), while PQ is highly
active against mature gametocytes and can accelerate gametocyte clearance (as well as being used for
the prevention of relapses in P vivax) (WHO 2013b).
Target population
The target population for this intervention is all confirmed malaria cases (by microscopy or RDT)
according to the case definition in the Guidelines for Treatment of Malaria in Vanuatu.

NATIONAL MALARIA STRATEGIC PLAN, VANUATU, 2015 – 2020
Version 7 (Final Draft) – 8 April, 2014 51
New guidelines for treatment
The 2014 revision of the national Guidelines will maintain the following strategies (or strategic
adjustments) for the treatment of malaria and other causes of fever:
ACT (AL) for uncomplicated P falciparum
ACT (AL) for uncomplicated P vivax
Radical cure using a 14-day course of PQ for P vivax cases in patients with no G6PD deficiency
Injectable artesunate for management of severe cases of malaria in hospitals and Health Centres
Artesunate rectocaps as pre-referral treatment in Dispensary and Aid Post settings
Training and supervision
The Strategy has a strong emphasis on maintaining and boosting quality of clinical care through targeted
and corrective supervision of clinical staff – by provincial hospital staff for Health Centre nurse
practitioners, and then cascading though Dispensaries to Aid posts. Supervision will be integrated to
improve case management of other diseases.
Clinical pre-service and in-service training will be adapted according to health facility type.
Hospital medical staff will be provided with the appropriate clinical Guidelines for managing severe and
complicated cases. A Particular area of focus will be new medical graduates returning from Cuba (WHO
and SPC 2013), whose strong PHC focus in their training is likely to see them posted to provincial and
community settings both during and after their internship.
Introduction of G6PD screening
As the number of cases of malaria declines, it becomes increasingly important that the proportion of P
vivax cases adhering to the full 2-week course of PQ increases from the present very low level of
compliance (Section 3.2.4).
Introducing cost-effective screening for G6PD in-country will strengthen the Program’s ability to push for
high levels of compliance with PQ among patients with normal G6PD activity. The Program will therefore
continue to explore mechanisms to introduce testing for G6PD deficiency, initially in one selected
hospital laboratory but with the option of extension to other hospitals and health facilities, with a view
to eventual introduction of point-of-care testing.
In addition, ACT has an incomplete effect on clearing the gametocytes of P falciparum from the
peripheral blood and the policy option of introducing a single gametocytocidal dose of PQ following
three days of ACT needs to be explored.
Discontinuation of preventive therapy
As recommended by the MTR (MOH 2013), preventive chemotherapy for infants and pregnant women
will be discontinued in favour of strengthened preventive strategies and wider availability of diagnosis
and treatment in community settings.
Engagement with the private sector
The Program will explore mechanisms to allocate AL to private practitioners and pharmacies, in return
for their compliance in reporting cases – based on parasitological diagnosis – to the national MIS.

NATIONAL MALARIA STRATEGIC PLAN, VANUATU, 2015 – 2020
Version 7 (Final Draft) – 8 April, 2014 52
Centralised procurement and supply management
All ACT will be procured and distributed by CMS following WHO prequalification standards
Taking in account consumption, progressive coverage of PQ treatment of P vivax, minimum stock and
including buffer stock and unused wastage from the current supply chain, the Program estimates an
annual requirement of the following quantities of drugs (Table 12).
Table 12: Expected quantities of antimalarial formulations to be procured,
by year, Vanuatu, 2015-20
FORMULATION 2015 2016 2017 2018 2019 2020
Coartem (adjusted for age)
8,000 8,000 8,000 8,000 8,000 8,000
Primaquine 7.5 mg tablet
7,000 8,000 8,000 8,500 6,000 5,000
Artesunate Rectocap 200mg
800 — 800 — 800 —
Artesunate Rectocap 50mg
800 — 800 — 800 —
Artesunate Injectable 200 — 200 — 200 —
Monitoring
Stock outs of ACTs are routinely monitored via the MMLL. This intervention will be monitored using MIS
routine surveillance data, incorporating outputs from the MMLL. The objective is that 100% of
confirmed malaria cases receive first line anti-malaria treatment as per the national Guidelines.
Health promotion for case management interventions
The Program will work closely with the national health promotion unit and provincial HPOs to develop a
comprehensive IEC/BCC package targeting communities, health personnel and teachers. The messages
and objective are designed to ensure that every person with a fever seeks care in their nearest health
facility within 24 hours.
Operational research for case management
Batch-testing of RDTs will be undertaken immediately after procurement and, for selected sentinel sites,
after a period of “shelf time” in peripheral health facilities and settings
Attempts to monitor the efficacy of first line treatment (ACT) on P falciparum over the last 2 years using
a standard in vivo study protocol have been unsuccessful (see comments on studies in Epi in 2011 and
Santo in 2013 in Section 3.2.4). The incidence of P falciparum appears to be overestimated by current
routine diagnosis and the minimum number of cases required for TES is unlikely to be identified in any
location in Vanuatu over one year. The current WHO recommendations for TES in every country every
two years can obviously not be applied in Vanuatu. Novel tools to capture in vitro evidence of resistant
strains or molecular markers are likely to become available in the near future (Ariey 2014).

NATIONAL MALARIA STRATEGIC PLAN, VANUATU, 2015 – 2020
Version 7 (Final Draft) – 8 April, 2014 53
To monitor the incidence of malaria among pregnant women, the Program may initiate a screening
program in antenatal care settings in the most highly affected health zones.
5.3 Thematic Area 3: Active surveillance and response in support of
elimination
Strategic Objective: Once a province has entered the elimination phase, to investigate and manage all
malaria cases and identify, investigate and manage foci of infection according to national “Guidelines for
Malaria Elimination”
Under this Strategic Objective, surveillance and response are implemented as an active intervention in
support of malaria elimination activities once a province, health zone or area passes below elimination
thresholds – not simply as routine health system functions. (Routine surveillance and information
management as part of the regular malaria and health system are discussed separately under Section 6).
Based on lessons learned from pilot elimination activities in Tafea province (Section 3.2.5), we aim to use
universal access to LLINs, diagnosis and treatment and targeted IRS to accelerate progression towards
elimination levels (noting that pre-elimination is reached with a TPR <5% and the elimination phase
when the API is <1 per 1000, while maintaining an ABER of at least 10%; Figure 10). The experience from
Tafea (Figure 11) may be extrapolated to a generic population as shown in Figure 24.
Figure 24: Use of high LLIN coverage and up to three rounds of targeted IRS to accelerate progress
towards pre-elimination and elimination phases.
Based on Tafea experience; indicative population of 25,000 with commonly observed TPR, API and ABER
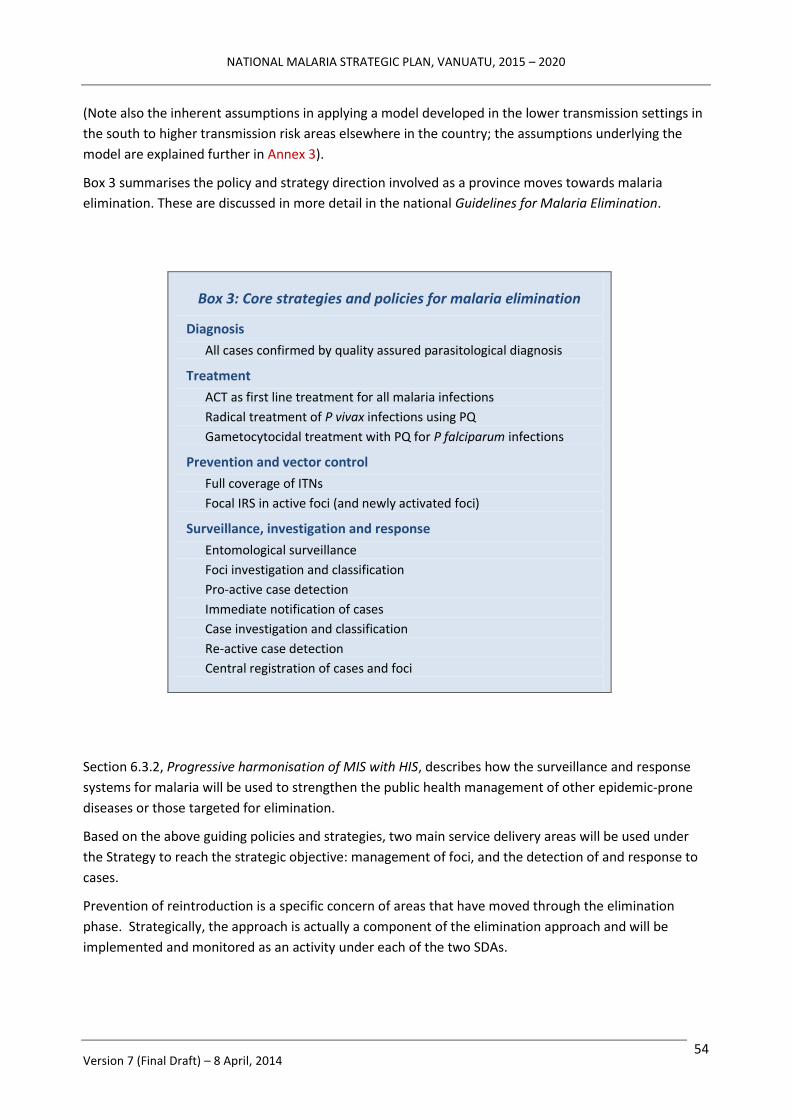
NATIONAL MALARIA STRATEGIC PLAN, VANUATU, 2015 – 2020
Version 7 (Final Draft) – 8 April, 2014 54
(Note also the inherent assumptions in applying a model developed in the lower transmission settings in
the south to higher transmission risk areas elsewhere in the country; the assumptions underlying the
model are explained further in Annex 3).
Box 3 summarises the policy and strategy direction involved as a province moves towards malaria
elimination. These are discussed in more detail in the national Guidelines for Malaria Elimination.
Box 3: Core strategies and policies for malaria elimination
Diagnosis
All cases confirmed by quality assured parasitological diagnosis
Treatment
ACT as first line treatment for all malaria infections
Radical treatment of P vivax infections using PQ
Gametocytocidal treatment with PQ for P falciparum infections
Prevention and vector control
Full coverage of ITNs
Focal IRS in active foci (and newly activated foci)
Surveillance, investigation and response
Entomological surveillance
Foci investigation and classification
Pro-active case detection
Immediate notification of cases
Case investigation and classification
Re-active case detection
Central registration of cases and foci
Section 6.3.2, Progressive harmonisation of MIS with HIS, describes how the surveillance and response
systems for malaria will be used to strengthen the public health management of other epidemic-prone
diseases or those targeted for elimination.
Based on the above guiding policies and strategies, two main service delivery areas will be used under
the Strategy to reach the strategic objective: management of foci, and the detection of and response to
cases.
Prevention of reintroduction is a specific concern of areas that have moved through the elimination
phase. Strategically, the approach is actually a component of the elimination approach and will be
implemented and monitored as an activity under each of the two SDAs.
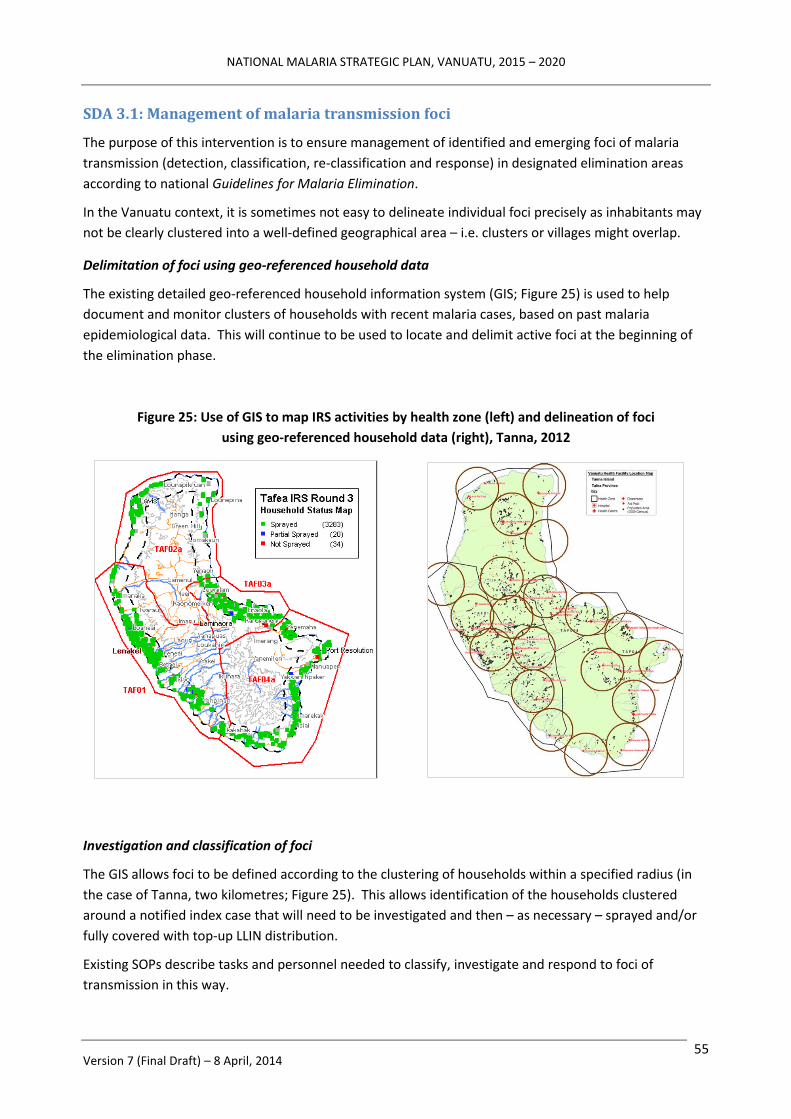
NATIONAL MALARIA STRATEGIC PLAN, VANUATU, 2015 – 2020
Version 7 (Final Draft) – 8 April, 2014 55
SDA 3.1: Management of malaria transmission foci
The purpose of this intervention is to ensure management of identified and emerging foci of malaria
transmission (detection, classification, re-classification and response) in designated elimination areas
according to national Guidelines for Malaria Elimination.
In the Vanuatu context, it is sometimes not easy to delineate individual foci precisely as inhabitants may
not be clearly clustered into a well-defined geographical area – i.e. clusters or villages might overlap.
Delimitation of foci using geo-referenced household data
The existing detailed geo-referenced household information system (GIS; Figure 25) is used to help
document and monitor clusters of households with recent malaria cases, based on past malaria
epidemiological data. This will continue to be used to locate and delimit active foci at the beginning of
the elimination phase.
Figure 25: Use of GIS to map IRS activities by health zone (left) and delineation of foci
using geo-referenced household data (right), Tanna, 2012
Investigation and classification of foci
The GIS allows foci to be defined according to the clustering of households within a specified radius (in
the case of Tanna, two kilometres; Figure 25). This allows identification of the households clustered
around a notified index case that will need to be investigated and then – as necessary – sprayed and/or
fully covered with top-up LLIN distribution.
Existing SOPs describe tasks and personnel needed to classify, investigate and respond to foci of
transmission in this way.

NATIONAL MALARIA STRATEGIC PLAN, VANUATU, 2015 – 2020
Version 7 (Final Draft) – 8 April, 2014 56
Every year (or more frequently) in elimination phase areas, all existing foci will be reclassified (Figure 26
and Table 11) – both routinely and as a result of any confirmed cases being notified.
Active investigation of newly notified cases and entomological surveillance (i.e. searching for active or
suitable breeding sites) are both part of proper foci classification. Interventions like IRS and LLINs will be
implemented as part of the response to newly identified foci (defined as two or more cases occurring in
a single focus over a short period of time).
The response should ideally occur within one week (as per current national Guidelines for Malaria
Elimination.15
Subject to local capacity, cleared-up foci may be managed as non-active if there is continuous presence
of malaria mosquitoes (i.e. suggesting ongoing receptivity to malaria).
Figure 26 (left) and Table 11 (right): Classification of foci of malaria transmission
Source: WHO (2007)
Provincial malaria elimination team
A small Malaria Elimination Team will be established in each province as it transitions from the pre-
elimination to the elimination phase. The Team will receive extensive training on elimination. It will
operate under the leadership of the Provincial Malaria Supervisor and the overall authority of the
provincial Chief Medical Officer (CMO), with strong and regular technical support provided by the
national VBDCP team.
The Elimination Team will work closely with provincial health staff and with community based health
workers (nurse practitioners, nurses and VHWs) to undertake passive and active malaria surveillance
activities; the national VBDCP team will assist with training and orientation of health workers as
required.
15
A “1-3-5” rule may be applied: new case(s) reported within one day of diagnosis, investigated within three days and a
definitive response implemented within 5 days.

NATIONAL MALARIA STRATEGIC PLAN, VANUATU, 2015 – 2020
Version 7 (Final Draft) – 8 April, 2014 57
Proactive case detection
Focal screening and treatment (FSaT) using RDTs, provision of ACTs and top-up distribution of LLINs will
be conducted at least every two years in previously active foci.
Consolidation and updating of classification
The central information unit in the national VBDCP will consolidate and update the classification of foci
and update household mapping on at least an annual basis, based on reports submitted by Provincial
Supervisors from elimination areas. Feedback will be provided via the Provincial Supervisor to
community health staff through annual provincial planning meetings.
SDA 3.2: Detect and respond to individual cases
The purpose of this intervention is to detect and respond to individual cases in designated elimination
areas according to national Guidelines for Malaria Elimination.
Enhanced passive case detection
As soon as a targeted area enters the pre-elimination phase, efforts will be made to increase the
performance of the community level PHC system (including VHWs) to attract and test all fever patients
from communities according to the strategy outlined under SDA 2.2. Monthly supervision of health
facilities down to Aid Post level will take place according to the overall annual provincial supervisory
work plan. Particular attention will be given to health facilities that are either not reporting or
underperforming in case management, surveillance and timely submission of reports.
Those testing positive will be immediately treated according to national Guidelines.
Quality assured diagnosis
All positive RDTs and slides have to be confirmed by external QC using either PCR or second reading by
expert microscopist. A sample of 10% of the negative RDTs and slides is sent to be challenged by second
reading or PCR.
All RDTs and slides are correctly labelled and recorded so that they can be traced back following QC
activities.
Immediate notification and treatment
Those individuals testing positive will be notified immediately to the provincial Malaria Elimination Team
and, through them, to the national VBDCP level. Rapid communication mechanisms will be supported,
including by ensuring that all health staff have access to standard mobile phone communications.
Supervised treatment by DOT will be provided to all positive patients (including radical cure with PQ for P
vivax cases, subject to G6PD screening).
Early case investigation and systematic response
In the event of a case being notified, the Malaria Elimination Team will mobilise a case investigation
within 3 days.
In addition, a systematic response is conducted in at least 50 households around the index case
according to national Guidelines and SOPs including:
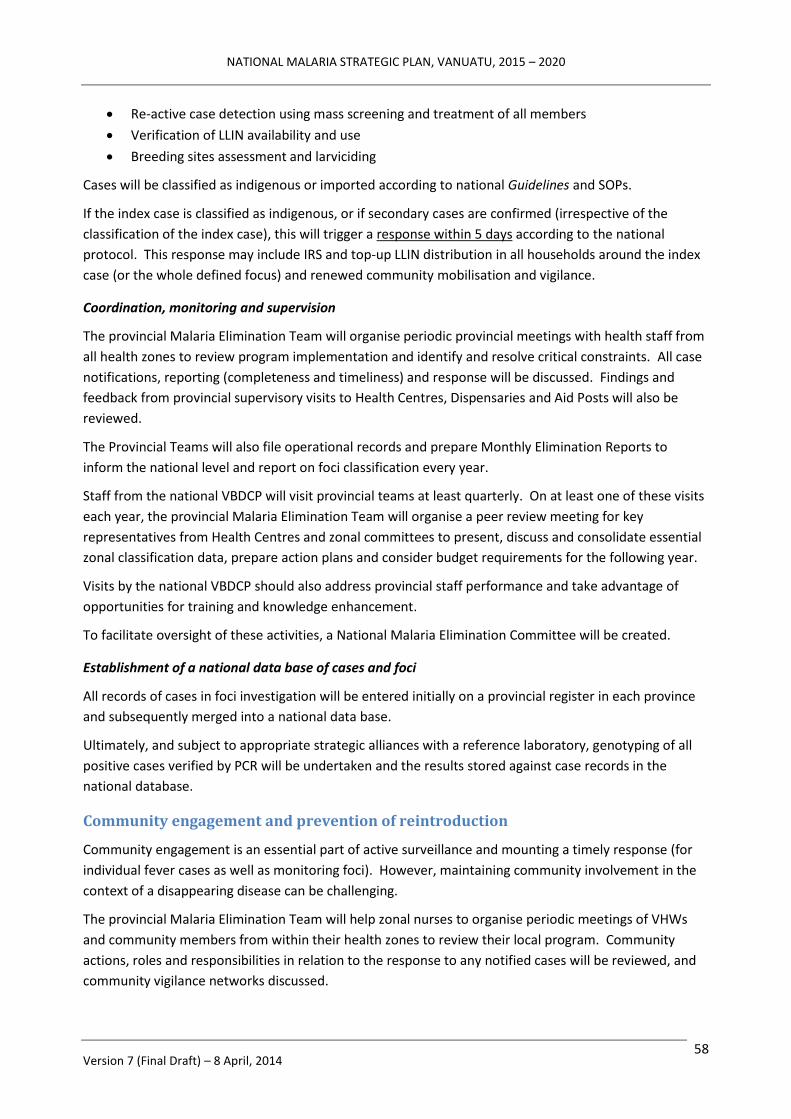
NATIONAL MALARIA STRATEGIC PLAN, VANUATU, 2015 – 2020
Version 7 (Final Draft) – 8 April, 2014 58
Re-active case detection using mass screening and treatment of all members
Verification of LLIN availability and use
Breeding sites assessment and larviciding
Cases will be classified as indigenous or imported according to national Guidelines and SOPs.
If the index case is classified as indigenous, or if secondary cases are confirmed (irrespective of the
classification of the index case), this will trigger a response within 5 days according to the national
protocol. This response may include IRS and top-up LLIN distribution in all households around the index
case (or the whole defined focus) and renewed community mobilisation and vigilance.
Coordination, monitoring and supervision
The provincial Malaria Elimination Team will organise periodic provincial meetings with health staff from
all health zones to review program implementation and identify and resolve critical constraints. All case
notifications, reporting (completeness and timeliness) and response will be discussed. Findings and
feedback from provincial supervisory visits to Health Centres, Dispensaries and Aid Posts will also be
reviewed.
The Provincial Teams will also file operational records and prepare Monthly Elimination Reports to
inform the national level and report on foci classification every year.
Staff from the national VBDCP will visit provincial teams at least quarterly. On at least one of these visits
each year, the provincial Malaria Elimination Team will organise a peer review meeting for key
representatives from Health Centres and zonal committees to present, discuss and consolidate essential
zonal classification data, prepare action plans and consider budget requirements for the following year.
Visits by the national VBDCP should also address provincial staff performance and take advantage of
opportunities for training and knowledge enhancement.
To facilitate oversight of these activities, a National Malaria Elimination Committee will be created.
Establishment of a national data base of cases and foci
All records of cases in foci investigation will be entered initially on a provincial register in each province
and subsequently merged into a national data base.
Ultimately, and subject to appropriate strategic alliances with a reference laboratory, genotyping of all
positive cases verified by PCR will be undertaken and the results stored against case records in the
national database.
Community engagement and prevention of reintroduction
Community engagement is an essential part of active surveillance and mounting a timely response (for
individual fever cases as well as monitoring foci). However, maintaining community involvement in the
context of a disappearing disease can be challenging.
The provincial Malaria Elimination Team will help zonal nurses to organise periodic meetings of VHWs
and community members from within their health zones to review their local program. Community
actions, roles and responsibilities in relation to the response to any notified cases will be reviewed, and
community vigilance networks discussed.
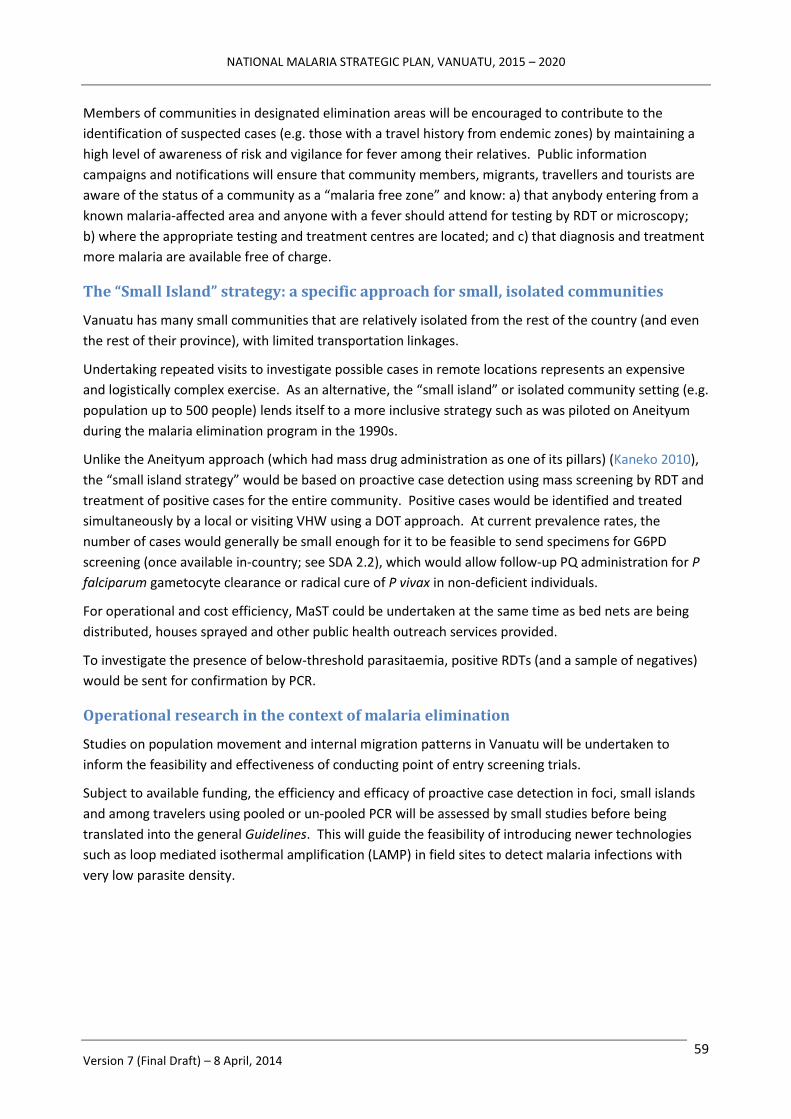
NATIONAL MALARIA STRATEGIC PLAN, VANUATU, 2015 – 2020
Version 7 (Final Draft) – 8 April, 2014 59
Members of communities in designated elimination areas will be encouraged to contribute to the
identification of suspected cases (e.g. those with a travel history from endemic zones) by maintaining a
high level of awareness of risk and vigilance for fever among their relatives. Public information
campaigns and notifications will ensure that community members, migrants, travellers and tourists are
aware of the status of a community as a “malaria free zone” and know: a) that anybody entering from a
known malaria-affected area and anyone with a fever should attend for testing by RDT or microscopy;
b) where the appropriate testing and treatment centres are located; and c) that diagnosis and treatment
more malaria are available free of charge.
The “Small Island” strategy: a specific approach for small, isolated communities
Vanuatu has many small communities that are relatively isolated from the rest of the country (and even
the rest of their province), with limited transportation linkages.
Undertaking repeated visits to investigate possible cases in remote locations represents an expensive
and logistically complex exercise. As an alternative, the “small island” or isolated community setting (e.g.
population up to 500 people) lends itself to a more inclusive strategy such as was piloted on Aneityum
during the malaria elimination program in the 1990s.
Unlike the Aneityum approach (which had mass drug administration as one of its pillars) (Kaneko 2010),
the “small island strategy” would be based on proactive case detection using mass screening by RDT and
treatment of positive cases for the entire community. Positive cases would be identified and treated
simultaneously by a local or visiting VHW using a DOT approach. At current prevalence rates, the
number of cases would generally be small enough for it to be feasible to send specimens for G6PD
screening (once available in-country; see SDA 2.2), which would allow follow-up PQ administration for P
falciparum gametocyte clearance or radical cure of P vivax in non-deficient individuals.
For operational and cost efficiency, MaST could be undertaken at the same time as bed nets are being
distributed, houses sprayed and other public health outreach services provided.
To investigate the presence of below-threshold parasitaemia, positive RDTs (and a sample of negatives)
would be sent for confirmation by PCR.
Operational research in the context of malaria elimination
Studies on population movement and internal migration patterns in Vanuatu will be undertaken to
inform the feasibility and effectiveness of conducting point of entry screening trials.
Subject to available funding, the efficiency and efficacy of proactive case detection in foci, small islands
and among travelers using pooled or un-pooled PCR will be assessed by small studies before being
translated into the general Guidelines. This will guide the feasibility of introducing newer technologies
such as loop mediated isothermal amplification (LAMP) in field sites to detect malaria infections with
very low parasite density.

NATIONAL MALARIA STRATEGIC PLAN, VANUATU, 2015 – 2020
Version 7 (Final Draft) – 8 April, 2014 60
6. Program Management
Management of the Malaria Program will have its own Objective:
To strengthen Malaria Program leadership and management capacity at provincial and national level
to plan, deliver and report on malaria interventions in a well-coordinated, efficient and timely manner
The effectiveness of program management in supporting the achievement of the Program’s three
operational objectives and overall Goal and will be monitored through specific outcomes and selected
higher order outputs (see M&E, Section 7).
6.1 Planning and implementation
6.1.1 Functional delineation – policies, standards and advocacy
The focus of program management under the new strategy will be to deliver and maintain core national
functions – policy and planning, interaction with donors, assurance of quality and standards, capacity
development, cost-effective bulk procurement, and national level monitoring and evaluation – while, at
the same time, supporting stronger provincial service delivery.
A detailed functional analysis of central (national) and peripheral (provincial level and below) functions in
relation to malaria control and elimination has been undertaken and is included at Annex 4.
6.1.2 Annual planning cycle
The Program will deliver efficient and timely malaria operational planning.
Stronger harmonisation between national and provincial health planning processes will be achieved
through consultative planning activities. Each year, between March and June, the national VBDP will
undertake consultations with provincial health teams to review malaria activities and interventions and
examine priorities for the coming year, their likely cost and available resources.
In July, provincial CMOs and Malaria Supervisors will participate in a national malaria review meeting
(“mini-conference”), which donors, development partners and focal points for other public health
programs will also attend. All aspects of the performance of the Malaria Program will be reviewed, and
priorities for the coming year identified.
Immediately following the national “mini-conference”, in consultation with provincial partners, the
Program will develop an integrated annual malaria operational plan and budget (national and for each
province) for the coming year. This will be in a form that can be readily reflected in national (MOH) and
provincial health office business plans.
Based on the findings and outcomes of the national “mini-conference”, the planning meeting will also
review and update relevant policies and guidelines.
6.1.3 Governance structures and partnership coordination
The Program’s existing governance bodies – the TAG and the MSC (Section 2.5.2) – will be retained.
The TAG will continue to provide technical oversight for the Program and technical recommendations for
the MSC to consider, while the MSC will provide higher level inputs on the management and overall
strategic directions of the Program. MSC membership includes donors and non-technical development

NATIONAL MALARIA STRATEGIC PLAN, VANUATU, 2015 – 2020
Version 7 (Final Draft) – 8 April, 2014 61
partners, and so represents a valid forum for partnership coordination and review of financing
mechanisms and decisions.
Figure 27 shows the various relationships and reporting lines for the TAG and MSC. The TAG and
Program Management functions will report to the MSC via a combined Malaria Management Team.
Figure 27: Governance diagram, Malaria Program, Vanuatu
Additional legend: TWG = technical working group, GF PR = Global Fund Principal Recipient
The TAG will explore opportunities to progressively engage with interested potential non-health sector
partners (e.g. the tourism sector).

NATIONAL MALARIA STRATEGIC PLAN, VANUATU, 2015 – 2020
Version 7 (Final Draft) – 8 April, 2014 62
6.1.4 Provincial level coordination
The greater degree of harmonisation with provincial health service functions will need to be actively
managed, and relatively frequent (quarterly) consultations between the central VBDCP team managers
and CMOs and Provincial Malaria Supervisors will be needed. Noting the challenges of implementing this
more integrated approach simultaneously across all provinces, it is proposed that this is undertaken
progressively – i.e. starting with more intensive engagement in one or two provinces and gradually
extending to other provinces in line with the strategic expansion of accelerated control activities (e.g. as
per Figures 11 and 20).
6.2 Financial resource management
6.2.1 Financial management system
As the Program moves towards a more collaborative implementation model with provincial health
offices, harmonisation of work plans will also ensure that available resources are reflected where
relevant in both the national and provincial business plans.
Financial management capacity will be retained within the national VBDCP to ensure that expenditure on
malaria is occurring as per the annual MAP and provincial business plans, and that reporting and
acquittal of expenditure is timely and accurate.
Disbursement for field expenses will gradually migrate from the present “imprest” system to the
proposed decentralised model as Financial Services Bureaux become operational in provincial centres.
Advances for malaria-related activities will need to be jointly authorised by both the VBDCP Manager and
the CMO, according to the national MAP and provincial business plan. Acquittal of field expenses will
follow Ministry of Finance and Economic Management regulations.
The VBDCP Finance Officer will work closely with the MOH Finance Manager. Expenditure tracking
reports for the malaria components of both national and provincial health business plans will be
produced in conjunction with the Finance Manager. Together, they will ensure that donor liaison and
reporting are completed as required.
6.2.2 Trials of innovative service delivery mechanisms
To make more efficient use of both malaria-specific and other MOH resources, the Program will
undertake trials of innovative service delivery options at the community level. This will build on activities
conducted under the present Strategic Vision, where some MNCH and immunisation services were given
the opportunity to use Malaria Program funded transport that was conducting outreach in communities
(e.g. bed net distribution).
Internal efficiencies will be sought by undertaking multiple interventions during community visits (e.g.
bed net distribution combined with IRS, environmental assessment, health promotion and other
community level activities), instead of the current single-purpose community visits.
Under the new Strategy and its greater degree of harmonisation with provincial health services, the
Program’s provincial work plans will also look for opportunities for cost sharing between public health
programs with independently identifiable funding. This will support integrated community outreach
more efficiently and effectively.

NATIONAL MALARIA STRATEGIC PLAN, VANUATU, 2015 – 2020
Version 7 (Final Draft) – 8 April, 2014 63
Examples of integrated primary and preventive care outreach include:
● Malaria related interventions (e.g. bed net distribution, IRS, MaST, targeted community level
treatment, health promotion and community health committee engagement)
● Primary MNCH care (e.g. U5 screening and growth monitoring, immunisation, de-worming, IMCI,
antenatal care and delivery planning)
● Follow-up for other community public health programs (e.g. tuberculosis, yaws, leprosy, oral
health and hygiene)
● Environmental health and hygiene (malaria vector breeding site investigation and evaluation, but
also integrated vector management [IVM] and broader community sanitation and water supply
interventions)
● Animal health interventions modelled on the “one health” principles (e.g. domestic animal de-
worming and fertility control)
While the VBDCP may initially need to take the lead on planning and managing these joint initiatives,
responsibility will be progressively shared with provincial health teams as their capacity improves.
6.3 Surveillance and information systems
6.3.1 Malaria information system
The current MIS will be maintained and strengthened through the addition of one additional officer
based at the national level. The national information management unit will work increasingly closely
with provincial information and surveillance officers, and will contribute to their orientation, training and
supervision.
Data collection from the field will continue through the MMLL, and the completeness and timeliness of
reporting will be strengthened as provincial supervision and communication systems improve.
Provincial health teams and information managers will develop the capacity to produce and interpret
their own monthly data and monitor provincial trends for selected indicators. They will progressively be
able to identify under-performing health zones or facilities for corrective intervention and provide
follow-up supervision.
The Program will generate a comprehensive national annual malaria report, and semi-annual reports at
provincial, health zone and even facility level to guide and support the planning and implementation of
malaria interventions in the community.
The GIS-based register in support of elimination mapping and stratification of interventions will be
maintained, with external technical assistance as required. It can be readily adapted to support mapping
of the incidence of other outbreak-prone diseases, other diseases of public health importance, and
potentially the delivery of services (e.g. immunisation, family planning).
6.3.2 Progressive harmonisation of MIS with HIS
The Program will support closer links between the HIS and MIS though co-location of provincial
information managers. Information will be routinely shared between the two systems to enable cross-
checking of data that may have been supplied to one system but not the other (including suspected
malaria deaths, which will need to be investigated).

NATIONAL MALARIA STRATEGIC PLAN, VANUATU, 2015 – 2020
Version 7 (Final Draft) – 8 April, 2014 64
Increasingly, development of the HIS and selected MIS indicators will be harmonised. In elimination
provinces, the immediate case based malaria notification and investigation can benefit surveillance of
other diseases – especially those that are epidemic prone or targeted for elimination. The more
prominent role of provincial health teams under the new reforms will see monthly MMLL reporting being
directed through provincial HIS managers before being sent to the national Malaria Information
Manager.
An additional malaria information management position will be co-located with the HIS unit with a view
to supporting coordination and increased harmonisation of the two systems (in addition to supporting
the existing MID manager in producing provincial and national level reports).
6.3.3 Supplementary performance information through surveys
Data for some coverage indicators can only be obtained through community surveys. A follow-up
malaria indicator survey is planned for 2016.
In between major survey cycles, VHWs and provincial HPOs may be engaged in ongoing monitoring
activities for selected outcome and coverage indicators.
6.3.4 Move towards village level micro-stratification
As better data become available on malaria incidence at village or community level, the Program will
move towards stratification of transmission risk at that level. This will generate more precise estimates
of API and TPR at the local (rather than zonal) level, allowing more accurate and cost-effective targeting
of IRS during acceleration phase interventions and deciding malaria intervention shifts in malaria free
areas.
The costs of the IRS “acceleration” strategy presented in Section 8 and Annex 6 (Budget) therefore
represent a maximum cost and could ease back if preventive IRS can be more precisely targeted.
6.4 Procurement and supply management system
Under the functional delineation of the Malaria Program (Annex 4), cost-effective commodities
procurement remains a central role. This is because national procurement of large-scale commodities
like LLINs, RDTs and pharmaceuticals can generate significant efficiencies and cost savings compared
with individual provincial procurement. If commodities procurement can be pooled with neighbouring
countries (e.g. Solomon Islands, Papua New Guinea), the economies of scale are likely to be even
greater.
It is therefore proposed that LLIN, RDT and drug procurement arrangements are maintained as they are,
using the tried and proven donor-assisted mechanisms that are currently available through SPC (as
principal recipient [PR] for Global Fund assistance to both Vanuatu and the Solomon Islands) and WHO
(which has existing channels for procurement of WHO pre-qualified anti-malarial drugs, Foundation for
Innovative New Diagnostics [FIND] assessed RDTs, and WHO Pesticide Evaluation Scheme [WHOPES]
approved insecticides).
Other, smaller scale local procurement will be directed through the Assets, Infrastructure and
Procurement unit in the MOH (as per existing arrangements).

NATIONAL MALARIA STRATEGIC PLAN, VANUATU, 2015 – 2020
Version 7 (Final Draft) – 8 April, 2014 65
Distribution of pharmaceuticals, diagnostics and small-scale equipment and infrastructure will follow the
present policy of increasingly using CMS systems (if feasible).
As demand for RDTs and related consumables increases (to maintain ABER) and for microscopy reagents
and drugs reduces (in line with reduced use of community-based microscopy and reduced malaria
incidence), forecasting mechanisms and formulae will be re-evaluated and adjusted. As is currently
being piloted by CMS, the provincial pharmacy officers will be increasingly involved in assessing orders
and quantities of malaria consumables placed from peripheral centres to ensure they are consistent with
projected requirements.
6.5 Human resources and technical assistance
6.5.1 Human resources
This new Strategy places a much stronger focus on integration with the provincial PHC work force at
Health Centre, Dispensary and Aid Post level. In particular, there will be a much stronger engagement
with VHWs as a key resource for fostering community level vigilance and adequate population screening
in designated elimination areas.
The Program will maintain central level support and supervision for provincial health office staff,
including developing tools for their supervisory outreach visits and feed back to staff working in more
peripheral levels.
A medium term malaria work force plan and a strategy for engagement with the broader primary care
work force is overdue, but has been deferred until the final health sector work force has been
determined under the health sector reforms. The plan will be developed during 2014 (i.e. prior to
commencement of the new NMSP) once the work force distribution under health sector reforms is
determined.
The balance between the centrally-located and provincial workforce will be guided by the functional
analysis (Annex 4) and progress with the current health sector reforms. In support of a more prominent
focus on IRS during the “acceleration” phase, stronger skills in entomology and IRS management and
supervision will be needed. The Program will support the progressive placement and up-skilling of IRS
supervisors in each province according to the phased approach shown in Figure 19; two of these
supervisors will be designated and further up-skilled to the level of “master” IRS supervisors – one
covering the northern provinces and once covering the central and southern provinces. Their training
may include participation in the Malaria Management for Field Operations (MMFO) course offered
though the Manila-based Asian Collaborative Training Network for Malaria (ACT-Malaria).
6.5.2 Technical assistance
Ongoing technical assistance (TA) will be available through resident in-country WHO malaria officers and
on-demand visiting technical specialists funded through the Australian aid program’s continuing
agreement with the University of Queensland (UQ) School of Population Health, funded through the
Australian Initiative for the Control and Elimination of Malaria (AICEM).
As part of annual planning processes, the Program will analyse TA needs for the coming year and develop
a technical assistance plan that justifies the placement of long term advisers and the engagement of ad
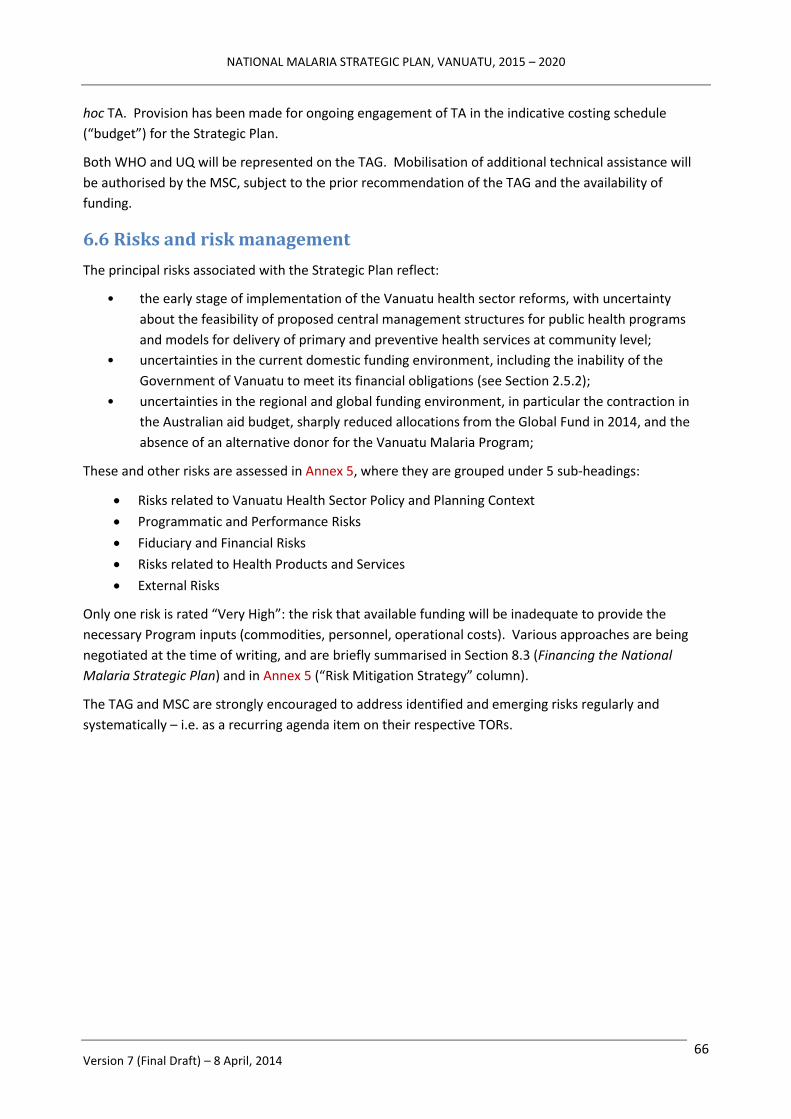
NATIONAL MALARIA STRATEGIC PLAN, VANUATU, 2015 – 2020
Version 7 (Final Draft) – 8 April, 2014 66
hoc TA. Provision has been made for ongoing engagement of TA in the indicative costing schedule
(“budget”) for the Strategic Plan.
Both WHO and UQ will be represented on the TAG. Mobilisation of additional technical assistance will
be authorised by the MSC, subject to the prior recommendation of the TAG and the availability of
funding.
6.6 Risks and risk management
The principal risks associated with the Strategic Plan reflect:
• the early stage of implementation of the Vanuatu health sector reforms, with uncertainty
about the feasibility of proposed central management structures for public health programs
and models for delivery of primary and preventive health services at community level;
• uncertainties in the current domestic funding environment, including the inability of the
Government of Vanuatu to meet its financial obligations (see Section 2.5.2);
• uncertainties in the regional and global funding environment, in particular the contraction in
the Australian aid budget, sharply reduced allocations from the Global Fund in 2014, and the
absence of an alternative donor for the Vanuatu Malaria Program;
These and other risks are assessed in Annex 5, where they are grouped under 5 sub-headings:
Risks related to Vanuatu Health Sector Policy and Planning Context
Programmatic and Performance Risks
Fiduciary and Financial Risks
Risks related to Health Products and Services
External Risks
Only one risk is rated “Very High”: the risk that available funding will be inadequate to provide the
necessary Program inputs (commodities, personnel, operational costs). Various approaches are being
negotiated at the time of writing, and are briefly summarised in Section 8.3 (Financing the National
Malaria Strategic Plan) and in Annex 5 (“Risk Mitigation Strategy” column).
The TAG and MSC are strongly encouraged to address identified and emerging risks regularly and
systematically – i.e. as a recurring agenda item on their respective TORs.

NATIONAL MALARIA STRATEGIC PLAN, VANUATU, 2015 – 2020
Version 7 (Final Draft) – 8 April, 2014 67
7. Monitoring and evaluation
7.1 Performance framework
The following tables summarise the key impact and outcome level indicators that will be used to monitor
progress under the Strategy, plus a small number of selected higher-level output indicators relevant to
monitoring the effectiveness of program management. (A detailed formulation of indicators and data
sources will be undertaken separately from this NMSP).
Table 12 summarises the key outcome indicators and intermediate milestones predicted under the
proposed Strategy.
Table 12: Progressive Impact level indicators, National Malaria Strategic Plan, Vanuatu, 2015-20
Impact Indicator Data Source Intermediate and Final Targets
2016 2018 2020
National API per 1,000 by RDT and Microscopy MIS < 5 < 2.5 < 1
Number of provinces with 0 local transmission MIS 1 1 2
Number of provinces with API < 1 per 1,000 MIS 1 1 3
Number of confirmed malaria deaths MIS, VanPHIS 0 0 0
Note: Provinces expected to reach API < 1 per 1,000 and then zero local transmission are (in order) Tafea, Torba and Shefa.
WHO is working with the Health information Unit to establish a system for mortality audits.
Based on current population projections, Table 13 summarises the expected number of cases, by species
for each of the intermediate API milestones and intervening years across the duration of the Strategy.
Table 13: Expected number of cases, by species, based on annual API target, Vanuatu NMSP, 2015-20
2012 2015 2016 2017 2018 2019 2020
Population (projected) 251,000 269,000 276,000 282,000 289,000 296,000 303,000
Indicator Current Objectives from NSP 2015-2020
API per 1,000 13.2 6 5 3.5 2.5 1.5 1
Confirmed cases 3,300 1,614 1,380 987 723 444 303
% P falciparum or mixed * 50% 40% 35% 30% 20% 15% 10%
Confirmed P falciparum 1,650 646 483 296 145 67 30
Confirmed P vivax 1,650 968 897 691 578 377 273
* Based on assumed declining proportion of P falciparum over time
Table 14 shows core outcome and selected higher-level output indicators and targets for each thematic
area / strategic objective.
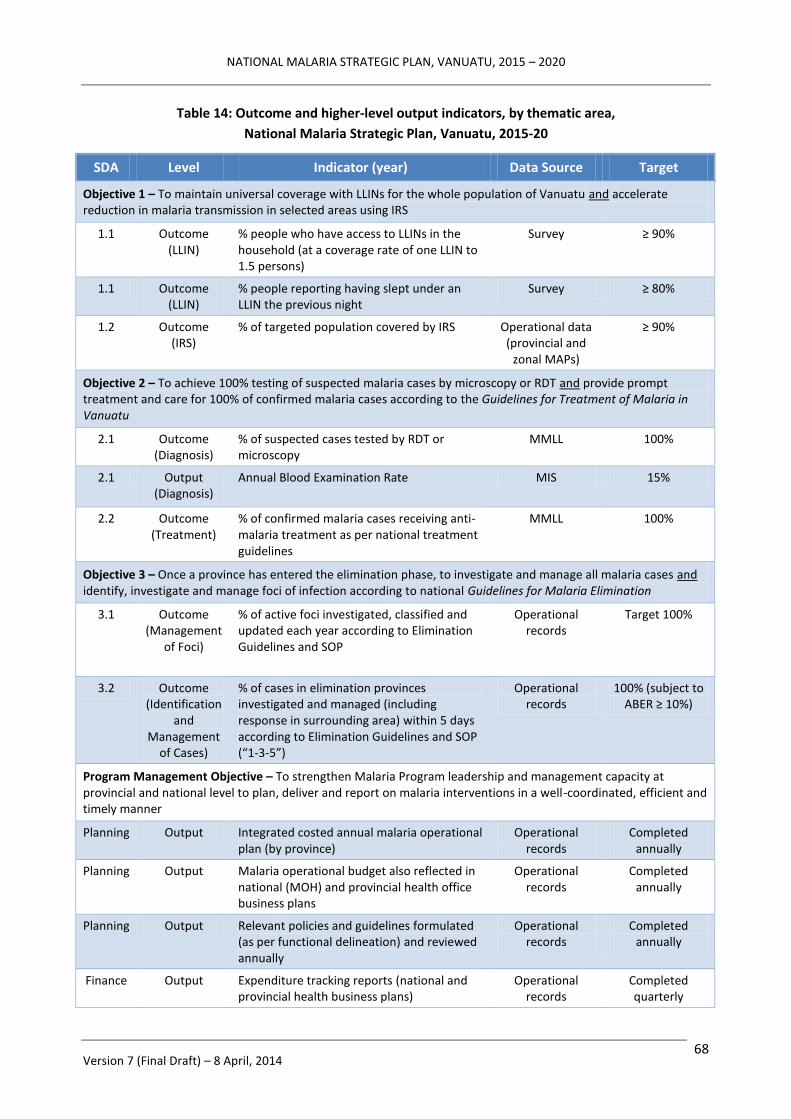
NATIONAL MALARIA STRATEGIC PLAN, VANUATU, 2015 – 2020
Version 7 (Final Draft) – 8 April, 2014 68
Table 14: Outcome and higher-level output indicators, by thematic area,
National Malaria Strategic Plan, Vanuatu, 2015-20
SDA Level Indicator (year) Data Source Target
Objective 1 – To maintain universal coverage with LLINs for the whole population of Vanuatu and accelerate reduction in malaria transmission in selected areas using IRS
1.1 Outcome (LLIN)
% people who have access to LLINs in the household (at a coverage rate of one LLIN to 1.5 persons)
Survey ≥ 90%
1.1 Outcome (LLIN)
% people reporting having slept under an LLIN the previous night
Survey ≥ 80%
1.2 Outcome (IRS)
% of targeted population covered by IRS Operational data (provincial and
zonal MAPs)
≥ 90%
Objective 2 – To achieve 100% testing of suspected malaria cases by microscopy or RDT and provide prompt treatment and care for 100% of confirmed malaria cases according to the Guidelines for Treatment of Malaria in Vanuatu
2.1 Outcome (Diagnosis)
% of suspected cases tested by RDT or microscopy
MMLL 100%
2.1 Output (Diagnosis)
Annual Blood Examination Rate
MIS 15%
2.2 Outcome (Treatment)
% of confirmed malaria cases receiving anti-malaria treatment as per national treatment guidelines
MMLL 100%
Objective 3 – Once a province has entered the elimination phase, to investigate and manage all malaria cases and identify, investigate and manage foci of infection according to national Guidelines for Malaria Elimination
3.1 Outcome (Management
of Foci)
% of active foci investigated, classified and updated each year according to Elimination Guidelines and SOP
Operational records
Target 100%
3.2 Outcome (Identification
and Management
of Cases)
% of cases in elimination provinces investigated and managed (including response in surrounding area) within 5 days according to Elimination Guidelines and SOP (“1-3-5”)
Operational records
100% (subject to ABER ≥ 10%)
Program Management Objective – To strengthen Malaria Program leadership and management capacity at provincial and national level to plan, deliver and report on malaria interventions in a well-coordinated, efficient and timely manner
Planning Output Integrated costed annual malaria operational plan (by province)
Operational records
Completed annually
Planning Output Malaria operational budget also reflected in national (MOH) and provincial health office business plans
Operational records
Completed annually
Planning Output Relevant policies and guidelines formulated (as per functional delineation) and reviewed annually
Operational records
Completed annually
Finance Output Expenditure tracking reports (national and provincial health business plans)
Operational records
Completed quarterly

NATIONAL MALARIA STRATEGIC PLAN, VANUATU, 2015 – 2020
Version 7 (Final Draft) – 8 April, 2014 69
SDA Level Indicator (year) Data Source Target
M&E Outcome % of complete, routine HIS/MIS reports submitted
Operational records
≥ 90% (monthly)
M&E Output Completeness on reaching national VBDCP M&E unit
Tracked at national level
≥ 90% (monthly)
M&E Output Timeliness of reaching provincial health office data encoder
Tracked at health facility and/or provincial level
≥ 90% (monthly)
M&E Output Comprehensive national annual malaria report
Operational records
Completed annually
Logistics Outcome % of health facilities reporting continuous supply (without stock-outs) of ACT and RDTs during reporting period
MMLL, supervisory and
operational records
100% (monthly)
HRH Outcome % of health facilities receiving quarterly supervisory (outreach) visits
Supervisory and operational
records
100% (quarterly, as
scheduled)
7.2 Tools and measurement
The principal data source will be the malaria surveillance and information system (based on the MMLL
and related reports).
Other data sources will include national and provincial operational records and surveillance data
(including for provincial level classification of transmission) and, for certain coverage indicators, specific
surveys. Survey data will be obtained from the malaria indicator survey (scheduled for 2016) and, by
negotiation, other periodic national level surveys such as the DHS and MICS.
To meet the needs of the M&E systems, the capacity of the Malaria Program M&E unit will be increased
by the equivalent of 0.5 of a full-time position (working in collaboration with the MOH Health
information Unit.
7.3 Mid-term and end-of-Strategy evaluations
It will be important to monitor the performance of the Program closely to assess the effectiveness of IRS
as an “acceleration” strategy, the additional efficiencies provided by village or community level
stratification, and the impact of the MOH decentralisation policies and integration of some Malaria
Program functions on community level PHC service delivery and surveillance.
A relatively early mid-term review will therefore be conducted in 2017 (which will also take advantage of
the malaria indicator survey data from 2016).
An end-of-Strategy review will be conducted in late 2019 or early 2020 to prepare for the “end game”
and eventual certification of malaria elimination.
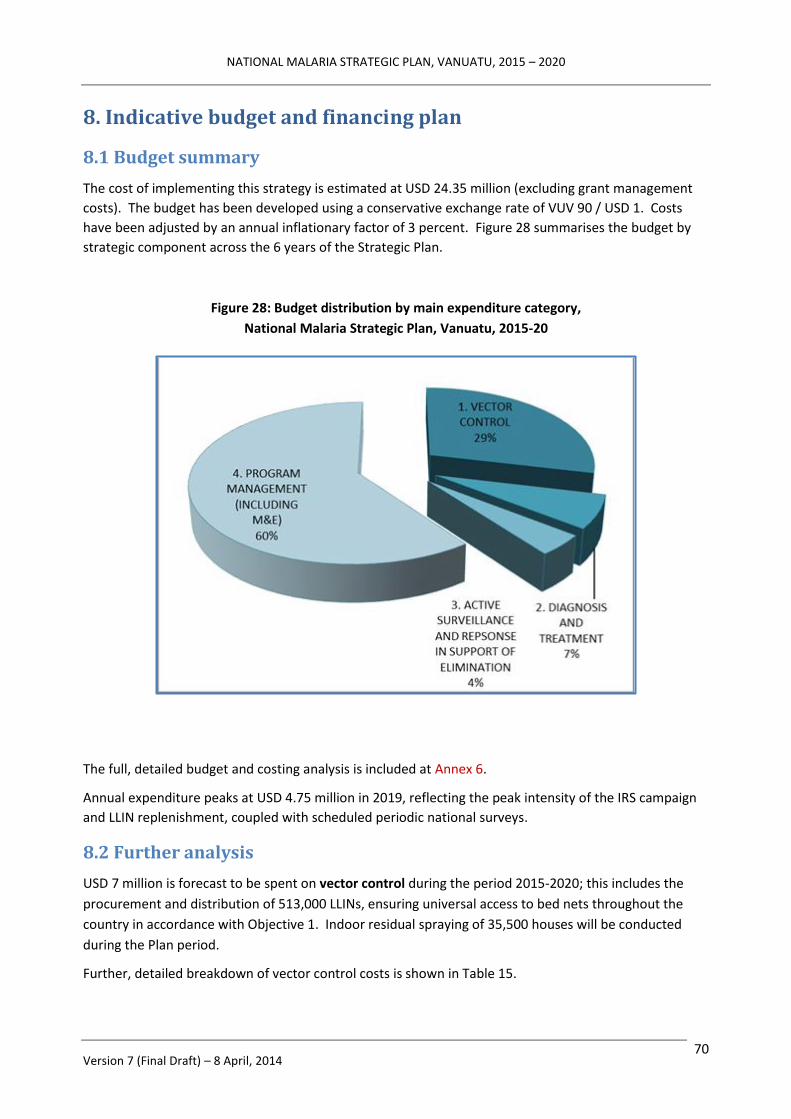
NATIONAL MALARIA STRATEGIC PLAN, VANUATU, 2015 – 2020
Version 7 (Final Draft) – 8 April, 2014 70
8. Indicative budget and financing plan
8.1 Budget summary
The cost of implementing this strategy is estimated at USD 24.35 million (excluding grant management
costs). The budget has been developed using a conservative exchange rate of VUV 90 / USD 1. Costs
have been adjusted by an annual inflationary factor of 3 percent. Figure 28 summarises the budget by
strategic component across the 6 years of the Strategic Plan.
Figure 28: Budget distribution by main expenditure category,
National Malaria Strategic Plan, Vanuatu, 2015-20
The full, detailed budget and costing analysis is included at Annex 6.
Annual expenditure peaks at USD 4.75 million in 2019, reflecting the peak intensity of the IRS campaign
and LLIN replenishment, coupled with scheduled periodic national surveys.
8.2 Further analysis
USD 7 million is forecast to be spent on vector control during the period 2015-2020; this includes the
procurement and distribution of 513,000 LLINs, ensuring universal access to bed nets throughout the
country in accordance with Objective 1. Indoor residual spraying of 35,500 houses will be conducted
during the Plan period.
Further, detailed breakdown of vector control costs is shown in Table 15.

NATIONAL MALARIA STRATEGIC PLAN, VANUATU, 2015 – 2020
Version 7 (Final Draft) – 8 April, 2014 71
Table 15: Overall cost of vector control, by activity (whole-of-strategy level),
National Malaria Strategic Plan, Vanuatu, 2015-20
Activity Cost (USD) Percent
Maintain universal coverage of LLIN 4,156,596 17.1%
Achieve full coverage of selected populations with IRS 2,479,836 10.2%
Entomological Monitoring 15,188 0.1%
Vector Control – human resources 350,698 1.4%
Diagnosis and treatment costs amount to USD 1.6 million, enabling 257,000 tests to be conducted using
either microscopy or RDT, and treatment of 5,451 confirmed cases of malaria.
USD1.0 million (4 percent) is allocated to active surveillance and response in support of elimination,
with the majority of this amount being allocated to management of foci (detection and response) and to
human resources.
Program management costs amount to USD 14.6 million (60 percent) of the total budget, with USD 7.8
million allocated to the provision of short and long term technical assistance in support of the Program.
The procurement of replacement assets, equipment and transportation amounts to USD 0.7 million, a
further USD 1.1 million to routine supervisory visits and USD 1.0 million to program evaluations and
surveys. The breakdown in program management costs by budget sub-heading across the 6 years of the
Strategic Plan is shown in Figure 29.
Figure 29: Program management budget distribution by sub-heading,
National Malaria Strategic Plan, Vanuatu, 2015-20

NATIONAL MALARIA STRATEGIC PLAN, VANUATU, 2015 – 2020
Version 7 (Final Draft) – 8 April, 2014 72
The major expenditure categories across all strategic objectives and the whole Strategy are shown in
Table 16.
Table 16: Expenditure categories, by activity (whole-of-strategy level),
National Malaria Strategic Plan, Vanuatu, 2015-20
Expenditure category Cost (USD) Percent
Human Resources 7,634,278 31.4%
Technical Assistance 4,243,645 17.4%
Training 1,553,873 6.4%
Health Products & Health Equipment 2,196,546 9.0%
Medicines & Pharmaceutical Products 114,141 0.4%
Procurement and Supply Management costs 2,346,439 9.6%
Infrastructure and other equipment 963,507 4.0%
Communications and materials 189,609 0.8%
Monitoring and Evaluation 3,235,457 13.3%
Planning and Administration 1,873,095 7.7%
Total: 24,350,590 100.0%
8.3 Financing the National Malaria Strategic Plan
There have been some significant changes in the donor landscape that has impacted on the projected
availability of funds to support the new NMSP.
The Global Fund has introduced a New Funding Model to replace the traditional country demand driven
rounds based model. Now categorised as a Band 4 country, Vanuatu is considered to be at the limit of
eligibility for Global Fund support, and consequently has been allocated very limited funding through
until 2017. In order to access this funding, Vanuatu is expected to demonstrate a mandatory 40 percent
co-financing of its NMSP through government sources.
The Australian Aid Program Direct Funding Agreement (DFA) budget support has also contracted
significantly compared to previous years.
A financial gap analysis covering the first three years of the NMSP is presented in Table 17. The following
assumptions are used in determining the gap:
● Global Fund funding of USD 1.27 million for the period 2015-2017 will be secured through the
New Funding Model;
● The Australian Aid Program will support the NMSP to the amount of USD 0.6 million per annum;
● MOH direct funding (mainly through support for positions) will continue at current levels as a
minimum; and
● AICEM funding has been aligned to the current contract with Australia’s Department of Foreign
Affairs and Trade, which expires by mid-2016.

NATIONAL MALARIA STRATEGIC PLAN, VANUATU, 2015 – 2020
Version 7 (Final Draft) – 8 April, 2014 73
Table 17: Financial Gap Analysis (USD millions, whole-of-strategy level),
National Malaria Strategic Plan, Vanuatu, first three years (2015-17)
2015 2016 2017
Total Budget $3.41 $3.90 $4.36
GFATM funding (projected)16 $0.42 $0.42 $0.42
Direct Funding Agreement, Australia $0.60 $0.60 $0.60
AICEM 17 $0.80 $0.44 n/a
MOH – Vanuatu (estimate) $0.26 $0.27 $0.28
Funding to be secured (USD millions) $1.33 $2.17 $3.06
A prioritisation exercise has been undertaken to ensure that elements of the Program that are absolutely
indispensable – continued universal access to LLINs, diagnosis, treatment, outbreak detection and
response, and protecting the gains made in Tafea province – can be maintained, albeit with some
unavoidable relaxation in overall elimination targets and achievement dates.
16
Assumes Vanuatu receives approved New Funding Model funding equivalent to 85 percent of USD 1.5 million over 3 years
and is able to achieve the mandatory 40 percent co-financing requirement 17
AICEM funding is only projected through until the end of the current contract in mid-2016

NATIONAL MALARIA STRATEGIC PLAN, VANUATU, 2015 – 2020
Version 7 (Final Draft) – 8 April, 2014 74
References
Ariey F, Witkowski B, Amaratunga C et al (2014). A molecular marker of artemisinin-resistant
Plasmodium falciparum malaria. Nature 505: 50–55.
Beebe NW, Saul A (1995). Discrimination of all members of the Anopheles punctulatus complex by
polymerase chain reaction – restriction fragment length polymorphism analysis. Am J Trop Med Hyg;
53(5): 478–481.
Cooper R, Taleo G, Yaviong J et al (2008). Entomological Baseline Data Surveys on Tanna Is, Tafea
Province, Vanuatu.
Dutta SN, Amon J, Iata H et al (2014). Long-Term Insecticidal Activity and Physical Integrity of Olyset Nets
in Tafea Province, Vanuatu. J Med Entomol 51(1): 164–169 (2014);
DOI: http://dx.doi.org/10.1603/ME13143
Feachem RGA, Phillips AA, Targett GA (Eds) (2009). Shrinking the Malaria Map: A Prospectus on Malaria
Elimination.
Foster M, Condon R, Janovsky K et al (2009). AusAID Office of Development Effectiveness Evaluation of
Australian Aid to Health Service Delivery in Papua New Guinea, Solomon Islands and Vanuatu. Working
Paper 3: Vanuatu Country Report.
Government of Australia, Government of Vanuatu (2009). Australia–Vanuatu Partnership for
Development.
Government of Vanuatu (2010). Vanuatu Health Sector Strategy 2010-2016.
Government of Vanuatu Prime Minister's Department (2010). Millennium Development Goals Report
2010 for Vanuatu.
Government of Vanuatu (2013). New Health Reform Management Structure.
Kalyango JN, Alfven T, Peterson S, et al (2013). Integrated community case management of malaria and
pneumonia increases prompt and appropriate treatment for pneumonia symptoms in children under five
years in Eastern Uganda. Mal J 12: 340. http://www.malariajournal.com/content/12/1/340
Kaneko A, Taleo G, Kalkoa M et al (1998). Malaria epidemiology, glucose 6-phosphate dehydrogenase
deficiency and human settlement in the Vanuatu Archipelago. Acta Tropica; 70: 285–302.
Kaneko A, Taleo G, Kalkoa M et al (2000). Malaria eradication on islands. Lancet; 356: 1560–1564.
Kaneko A (2010). A community-directed strategy for sustainable malaria elimination on islands: short-
term MDA integrated with ITNs and robust surveillance. Acta Tropica; 114: 177–183.
Laverack G, Westberg L (2013). Independent Evaluation of the Village Health Worker Program, Vanuatu.
Ministry of Health (2012). Ministry of Health Annual Report, 2011.
Ministry of Health (2013). Vanuatu Malaria Programme Review, 2013.
Pacific Islands Applied Geoscience Commission (2013). Country Information – Vanuatu.
http://www.pacificwater.org/pages.cfm/country-information/vanuatu.html
Reid H, Vallely A, Taleo G et al (2010). Baseline spatial distribution of malaria prior to an elimination
programme in Vanuatu. Mal J; 9: 150. doi:10.1186/1475-2875-9-150.
Roberts G, Lin S (2012). A situational analysis of the health workforce in Vanuatu [Human Resources for
Health Knowledge Hub publication, UNSW].

NATIONAL MALARIA STRATEGIC PLAN, VANUATU, 2015 – 2020
Version 7 (Final Draft) – 8 April, 2014 75
Russell T, Bryan J, Cooper R et al (2010). Entomological Surveys on Tanna Island, Tafea Province,
Vanuatu.
Secretariat of the Pacific Community (2011). Pacific Island Populations – Estimates and projections of
demographic indicators for selected years.
Secretariat of the Pacific Community (2013). Background of the Global Fund in the Pacific and in
Vanuatu. [Presentation to Vanuatu CCM and stakeholders, Reserve Bank of Vanuatu, 28 October 2013]
Sinka ME, Bangs MJ, Manguin S et al (2011). The dominant Anopheles vectors of human malaria in the
Asia-Pacific region: occurrence data, distribution maps and bionomic précis. Parasit Vectors; 4: 89. doi:
10.1186/1756-3305-4-89.
Toole M, Lynch C, Garcia R (2010). Pacific Malaria Initiative Independent Progress Review.
Uganda Ministry of Health, UNICEF, WHO (2010). Integrated Community Case Management of Childhood
Malaria, Pneumonia and Diarrhoea – Implementation Guidelines.
UNICEF (2012a). Global study on child poverty and disparities: national report Vanuatu.
UNICEF (2012b). Analysis and Costing of Health Related MDGs in Vanuatu.
UNICEF (2013). Vanuatu Statistics. http://www.unicef.org/infobycountry/vanuatu_statistics.html
Vanuatu Meteorological Services (2007). Climate of Vanuatu.
http://www.meteo.gov.vu/VanuatuClimate/tabid/196/Default.aspx
Vector Borne Disease Control Program (2010). National Malaria Strategic Vision 2007–16.
Vector Borne Disease Control Program (2013). Thematic Desk Review Report: Vanuatu Malaria Program
Review.
Wang H, Wang, Dwyer-Lindgren L, Lofgren KT, et al (2012). Age-specific and sex-specific mortality in 187
countries 1970-2010: a systematic analysis for the Global Burden of Disease Study 2010. Lancet; 380:
2071–2094.
World Bank (2010). Solomon Islands Health Financing Options.
World Bank (2012). The Economic Costs of Non-Communicable Diseases in the Pacific Islands: A Rapid
Stocktake of the Situation in Samoa, Tonga and Vanuatu.
World Bank (2013). Health Financing in Vanuatu: Challenges and Options.
World Health Organization (2007). Malaria elimination: a field manual for low and moderate endemic
countries.
World Health Organization (2011). Country Health Information Profile – Vanuatu.
World Health Organization (2012a). Progress towards malaria control and moving towards elimination in
Solomon Islands and Vanuatu.
World Health Organization (2012b). World Malaria Report, 2012.
World Health Organization (2013a). World Health Statistics, 2013.
World Health Organization (2013b). Guidelines for the treatment of malaria [2nd edition].
World Health Organization (2013c). WHO recommended long-lasting insecticidal nets.
World Health Organization, Ministry of Health (2012). Health Service Delivery Profile, Vanuatu.
World Health Organization, Secretariat of the Pacific Community (2013). Tenth Pacific Health Ministers
Meeting, Apia, Samoa. Background Paper: Health Workforce Development in the Pacific.
NATIONAL MALARIA STRATEGIC PLAN, VANUATU, 2015 – 2020
Version 7 (Final Draft) – 8 April, 2014 76
Annexes
1. Provincial API and TPR stratification maps, by health zone, 2012 (from Gerard Kelly report)
2. Data from Malaria Indicator Survey on which LLIN policy is based
Supplement: Estimation of LLIN needs at household level, reflecting ratio of people per net
3. Description of TPR impact modelling used in developing the National Strategic Plan 2015–20
4. Malaria Program functional delineation – national vs. provincial level
5. Risk analysis and management plan
6. Detailed cost estimates, Vanuatu NMSP 2015-20