national mineral resources classification and … introductory remarks geoscience australia (and...
TRANSCRIPT

National Mineral Resources Classification and Reporting Systems and UNFC-2009: An Australian perspective
Ian Lambert, Yanis Miezitis Geoscience Australia

2
Introductory remarks Most countries with significant mining sectors
regularly evaluate their national mineral stocks – To inform policies and decision by providing
information on what is likely to be available for mining Governments cannot undertake resource
assessments for all known mineral deposits – Staffing/expertise limitations and lack of access to
sensitive data on economic viability of deposits National reporting needs to based on company
reports on individual deposits – Companies listed on the Australian Securities
Exchange are required to report publicly, using the Joint Ores Reserves Committee (JORC) Code

3
Introductory remarks
Geoscience Australia (and predecessor organisations) has conducted an annual nation-wide assessment of identified resources for all major and selected minor mineral commodities since 1975 – Published as Australia’s Identified Mineral
Resources (available online)

4
International developments Committee for Mineral Reserves International
Reporting Standards (CRIRSCO) is promulgating its Template for public reporting of mineral reserves and resources
=~ JORC Code Petroleum Resources Management System
(PRMS) is also being promulgated internationally United Nations Framework Classification (UNFC) – Inputs from CRIRSCO and petroleum groups

Outline of presentation
Describes the Australian national minerals resources reporting system and the CRIRSCO [JORC] Template
Maps the national system to CRIRSCO Template and to UNFC-2009
Briefly mentions – How Aùstralia’s petroleum resources are reported – The special case of U resources classification
Considers national reporting under the UNFC – To provide information on resources likely to be
available in short, medium and long time scales

6
mineral inventories: Australia’s system
McKelvey system – (minus undiscovered resources)
Economic Demonstrated
Resources (EDR)

7
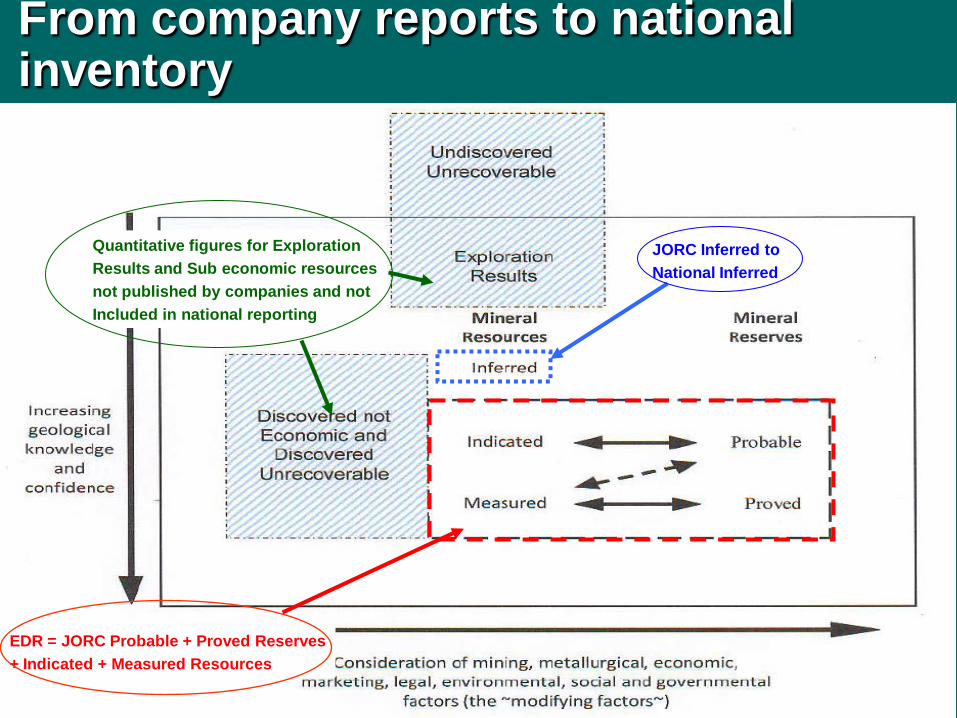
From company reports to national inventory All resources in JORC-compliant reports must
have “reasonable prospects for economic extraction” – JORC Reserves provide commercial (relatively short
term) view of what is to be mined Several JORC categories are aggregated into
the key national reporting category: EDR – To provide longer perspectives of what is likely to be
available for mining – Tonnages of contained metals are added up for
national totals Cannot add grades and tonnages from different
deposits
8 8
From company reports to national inventory
JORC Inferred to National Inferred
EDR = JORC Probable + Proved Reserves + Indicated + Measured Resources
Quantitative figures for Exploration Results and Sub economic resources not published by companies and not Included in national reporting

9
Mapping JORC Code to Australia’s national system
Economic Demonstrated Resources (EDR) = ‘Proved Reserves’ + ‘Probable Reserves’ + ‘Measured Resources’ + ‘Indicated Resources’
‘Subeconomic’ Resources mainly from old reports but include some from current company reports assessed to be “promotional”

10 10
National minerals inventories: Not a precise science
Estimating the total amount of each commodity likely to be available for mining in the longer term is not a precise science – JORC ‘Reserves’, will in general all be mined, but they
only provide a short term view of what is likely to be available for mining
– Most current JORC ‘Measured’ and ‘Indicated’ Resources are likely to be mined
– Some current JORC ‘Inferred’ and ‘Subeconomic’ Resources will also be mined
– New discoveries (including extensions to known deposits) will add to the resource inventory

11
Not all identified resources will be mined in foreseeable future
The relative economic quality of a deposits is important in determining when and whether it will be mined – In an increasingly globalised world, the
development of individual deposits will depend on how they compare with competing deposits elsewhere Projected returns on investment are important

12
EDR = Key indicator
EDR considered to provide a reasonable and objective indication of what is likely to be available for mining in the long term (25 years) – Adding JORC Reserves and Resources is not
considered a problem in this national context Both “inherently economic” EDR “anticipates” movement of Resources to
Reserves In addition to EDR, Geoscience Australia also
reports national Reserves and Inferred Resources

y pp EDR
EDR
EDR
EDR increase reflects inclusion of major proportions of higher cost resources and decrease in cut off grade from 55% to 50% Fe
EDR trends need to be interpreted in the light of production rates and qualities of resources

14
Iron ore production and resource life*
* EDR/Production

Analysis of quality of iron ore resources
Magnetite needs upgrading/pelletizing. Only minor production in Australia to date
Premium Brockman ore only 6%. Resource life 25 yrs at current prodn.

16
Iron ore production and resource life (without magnetite)
Without magnetite

17
What do some other countries report? USGS publishes “Reserves”
– Comparable with EDR Canada publishes Reserves (JORC equivalent)
in operating mines – Except for U (equivalent to EDR) Shorter term perspective on national
resources These differences in national reporting are not
widely appreciated

Outline of national petroleum resources reporting in Australia
No equivalent to JORC “Traditional” Petroleum Industry Classification
– Category 1 comprises current Reserves of those fields which have been declared commercial It includes both Proved and Probable Reserves
– Category 2 comprises estimates of recoverable Reserves which have not yet been declared commercially viable They may be either geologically proved or are awaiting
further appraisal
– Both categories are at “Proved and Probable” level of certainty

Outline of national petroleum resources reporting in Australia
2. McKelvey Classification – Economic Demonstrated Resources Resources judged to be economically extractable and
for which the quantity and quality are computed partly from specific measurements, and partly from extrapolation for a reasonable distance on geological evidence
– Subeconomic Demonstrated Resources Similar to Economic Demonstrated Resources in terms
of certainty of occurrence and, although considered to be potentially economic in the foreseeable future, these resources are judged to be subeconomic at present. They are also at a “proved and probable” level of certainty

Summary outline of national petroleum resources reporting in Australia
Sum of Category 1 and Category 2 Reserves equals the sum of EDR and SDR Resources
EDR “anticipates” movement of Category 2 Reserves to Category 1

21
Mapping to a universal template
It is useful to map the various classification and reporting systems for mineral and energy resources to a common base to – Clarify similarities/differences between the systems – Enable comparisons between countries’ inventories
and better estimates of total world stocks The UNFC-2009 is a universal template
– Broader coverage than CRIRSCO Template – Includes non-commercial and undiscovered – Do not need to use all categories

22
Why we need a universal template
When Australia compares its resource stocks with those of other countries, we are not comparing like with like – This has become clear as we mapped to UNFC
It means that global totals are not reliable indicators of what is likely to be available for mining
Mapping all to UNFC will make these issues clear and provide a basis for addressing them

23
UNFC as universal template
The 2009 version of the UNFC is considerably more developed than its predecessor – Takes account of a range of views
Industry, financial, national and international resource reporting systems are being/should be mapped to UNFC-2009 – To clarify the similarities and differences between
systems in use around the world Many countries already have mandated
commercial reporting systems – These countries will not adopt the UNFC – Other countries may choose to use the UNFC
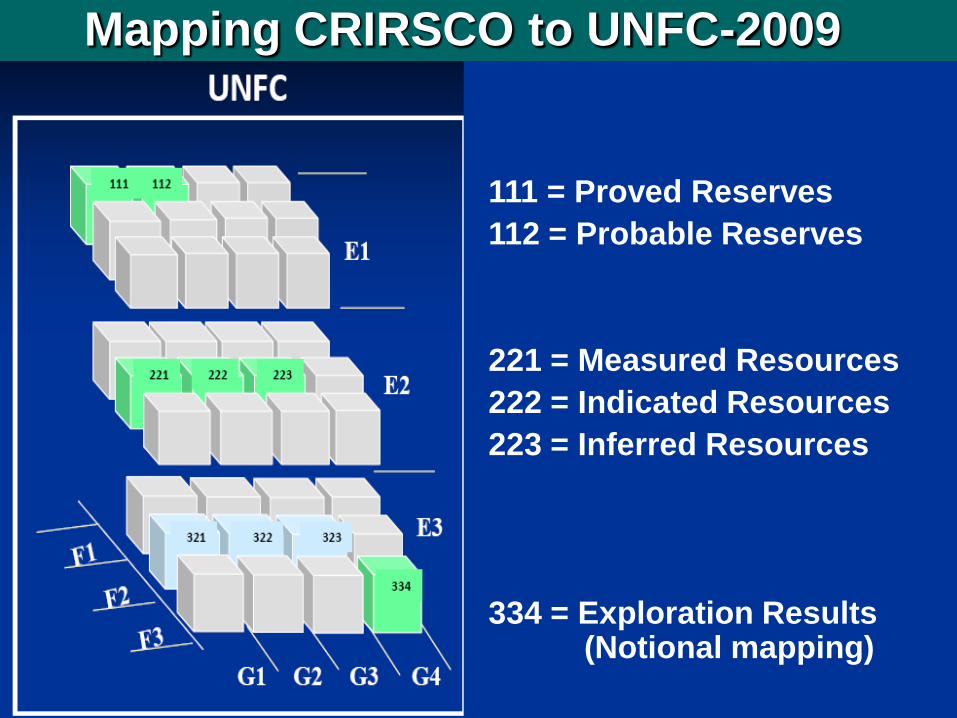
Mapping CRIRSCO to UNFC-2009
111 = Proved Reserves 112 = Probable Reserves 221 = Measured Resources 222 = Indicated Resources 223 = Inferred Resources 334 = Exploration Results (Notional mapping)

Sub-class level mapping: CRIRSCO – UNFC-2009

A different international classification system: Uranium Group classification system (IAEA/OECD-NEA)
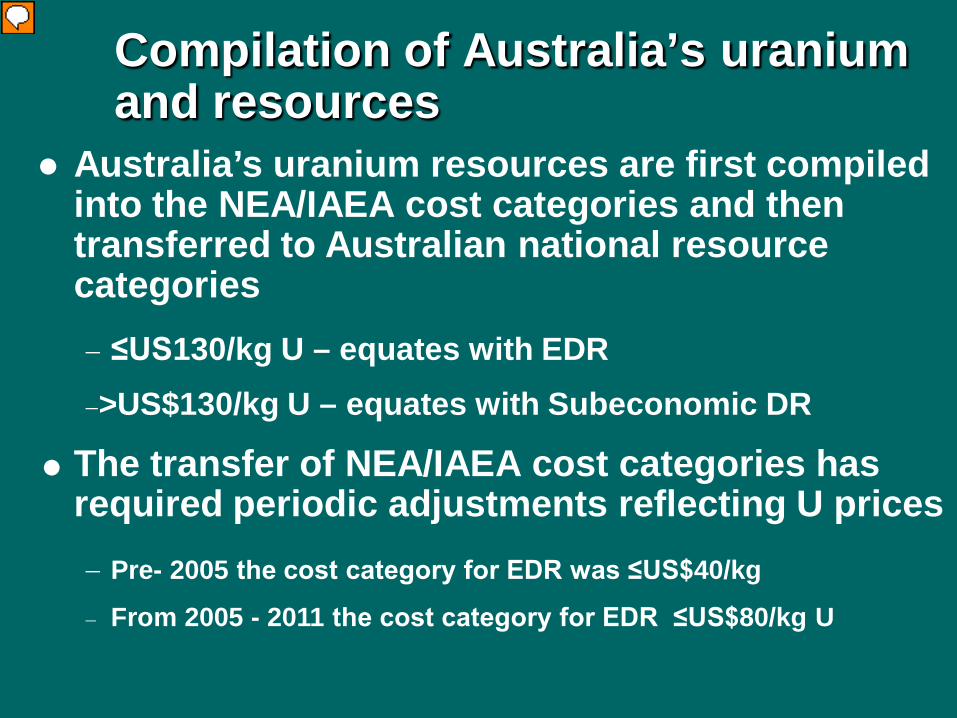
Compilation of Australia’s uranium and resources
Australia’s uranium resources are first compiled into the NEA/IAEA cost categories and then transferred to Australian national resource categories − ≤US130/kg U – equates with EDR −>US$130/kg U – equates with Subeconomic DR
The transfer of NEA/IAEA cost categories has required periodic adjustments reflecting U prices − Pre- 2005 the cost category for EDR was ≤US$40/kg
− From 2005 - 2011 the cost category for EDR ≤US$80/kg U

Proposed correlation of Australia’s uranium resources with UNFC-2009
RAR ≤US$130/
kg U
Inferred ≤ US$130/kg U
Inferred >US$130/ kg U
Subeconomic >US$130/kg U

A special case: In situ leach uranium projects
Leaching uranium from sandstone aquifers – Acid or alkaline fluids extract uranium – Viable projects cannot declare Reserves as level of
knowledge of grades, continuity, recovery rates, diseqilibrium not sufficient
– Can be a problem for financing

Where are we going? Greater granularity of national mineral resources reporting
Australia is trialling further subdivision of EDR to: – Distinguish what is likely to be available in short,
intermediate and longer time frames Based on different levels of assurance of
production – These can readily be mapped to the UNFC
Provide more detail for policy decisions, etc.

Greater granularity of national reporting Economic Resources (“EDR 1”) = Proven and
Probable Ore Reserves (as defined under the JORC Code) [Note this category already published in Australia’s Identified Mineral Resources as JORC Reserves]
Potential Medium Term Economic Resources (“EDR 2”) = Measured and Indicated Mineral Resources in existing mines and undeveloped deposits which have had a positive feasibility study/development has been announced
Potential Long Term Economic Resources (“EDR 3”) = Measured and Indicated Mineral Resources in deposits where their grade and tonnage characteristics are similar to deposits being mined elsewhere, but no positive feasibility study/current consideration of mining
Total EDR = sum of EDR1 + EDR2 + EDR3

EDR subdivisions mapped to UNFC-2009 Short, intermediate and long term national perspectives
Inferred Resources
Paramarginal and Submarginal Resources

Some concluding remarks: National reporting of mineral resources UNFC development has focussed on reporting
at the scale of individual deposits – Now addressing national reporting
National reporting should be based on of data from individual deposits – Only inherently economic/commercial resources
should be included – The national total for a particular commodity should
be derived by reporting the tonnages of that commodity in all deposits for which resources have been estimated
– If there is no requirement for companies/others to report resources under their control, this should be included in lease conditions as soon as possible

National reporting of mineral resources
Categories used for national mineral resources reporting should align with CRIRSCO/UNFC categories – CRIRSCO “Resources” encompass deposits of varying
commercial attractiveness Some deposits likely to be developed in the short to
medium term Others may only be considered for development in
the long term – UNFC sub-classes “Development Pending” and
“Development on Hold” provide a useful subdivsion of the same

National reporting of mineral resources National category/
UNFC Class UNFC Subclass CRIRSCO
category
Commercial
Deposits [EDR1]
On Production
Approved for Production
Justified for
Development
Proved + Probable
Reserves
Potentially
Commercial Projects
Development Pending
[EDR2]
Development on Hold
[EDR3]
Measured and
Indicated Resources
Increasing time fram
e
Resources with lower geological assurance should be reported separately: Indicated Resources/G3

Summary National reporting should be based on
commercial reporting on individual deposits – National totals for mineral commodities derived by
summing contained metals in individual deposits It is up to each country to decide what
categories it reports – Should map its reporting categories to UNFC
To facilitate meaningful comparisons and estimation of global inventories
For major mining nations it is more informative to report national categories which provide short, medium and long term views on what is likely to be available for mining