national oesophago-gastric cancer audit 2018 · an exciting development for the future of the audit...
TRANSCRIPT

Copyright © 2018, Healthcare Quality Improvement Partnership Ltd. (HQIP), National Oesophago-gastric Cancer Audit 2018. All rights reserved. 1
NationalOesophago-GastricCancerAudit2018
An audit of the care received by people with Oesophago-Gastric Cancer in England and Wales2018 Annual Report

Copyright © 2018, Healthcare Quality Improvement Partnership Ltd. (HQIP), National Oesophago-gastric Cancer Audit 2018. All rights reserved. 2
Commissioned by Healthcare Quality Improvement Partnership
The Royal College of Surgeons of England is an independent professional body committed to enabling surgeons to achieve and maintain the highest standards of surgical practice and patient care. As part of this it supports audit and the evaluation of clinical effectiveness for surgery. Registered Charity no: 212808
The Association of Upper GI Surgeons is the speciality society that represents upper gastrointestinal surgeons. It is one of the key partners leading the Audit.
The British Society of Gastroenterology is the speciality society of gastroenterologists. It is one of the key partners leading the Audit.
The Royal College of Radiologists is the professional body for clinical radiologists and clinical oncologists. It is one of the key partners leading the Audit
NHS Digital is the new trading name for the Health and Social Care Information Centre (HSCIC). They provide 'Information and Technology for better health and care'. The Clinical Audit and Registries Management Service of NHS Digital manages a number of national clinical audits in the areas of cancer, diabetes and heart disease. It manages the Audit on behalf of the Royal College of Surgeons of England.
This report was prepared by
Clinical Effectiveness Unit, The Royal College of Surgeons of EnglandMira Varagunam, StatisticianMin Hae Park, Assistant ProfessorSimran Sinha, Clinical FellowDavid Cromwell, Professor of Health Services Research
The Association of Upper GI Surgeons (AUGIS)Nick Maynard, Consultant Surgeon
Royal College of Radiologists (RCR)Tom Crosby, Consultant Clinical Oncologist
British Society of Gastroenterology (BSG)Nigel Trudgill, Consultant Gastroenterologist
NHS DigitalJulie Michalowski / Antoinette Salvador, Project ManagerRose Napper, Audit Coordinator

Copyright © 2018, Healthcare Quality Improvement Partnership Ltd. (HQIP), National Oesophago-gastric Cancer Audit 2018. All rights reserved. 3
NationalOesophago-GastricCancerAudit2018
An audit of the care received by people with Oesophago-Gastric Cancer in England and Wales 2018 Annual Report

Copyright © 2018, Healthcare Quality Improvement Partnership Ltd. (HQIP), National Oesophago-gastric Cancer Audit 2018. All rights reserved. 4
Contents
Acknowledgements 6
Foreword 7
Executive Summary 8
1. Introduction 161.1 Overview of the 2018 Annual Report 171.2 Regional organisation of OG cancer services 171.3 Other sources of information produced by the Audit 201.4 Future of the Audit 20
2. Management of patients with high-grade dysplasia in England 212.1 Introduction 212.2 Indicators of HGD care 212.3 Participation in HGD component and patient characteristics 222.4 Diagnosis of HGD and patient characteristics 232.5 Treatment for HGD 242.6 Short term outcomes of endoscopic treatment 272.7 Outcomes of HGD surveillance 282.8 Key findings and recommendations for HGD 30
3. Participation in the OG cancer prospective audit 313.1 Audit inclusion criteria 313.2 Case ascertainment 313.3 Completeness of submitted surgical records 323.4 Key findings and recommendations 32
4. Patients with OG cancer 33
5. Patterns of care at diagnosis 355.1 Route to diagnosis 355.2 Times from diagnosis to the start of treatment 365.3 Key findings and recommendations 39
6. Staging investigations 406.1 Key findings and recommendations 43
7. Treatment planning 447.1 Planned treatment modality 447.2 Planned curative treatment and surgical records 467.3 Choice of non-curative treatment modality 477.4 Key findings and recommendations 49
8. Use of tri-modal treatment for curative patients in England and Wales 508.1 Use of radiotherapy within the nCRT cohort 508.2 Use of chemotherapy within the nCRT cohort 508.3 Key findings and recommendations 50
9. Curative surgery 519.1 Enhanced recovery after surgery (ERAS) 529.2 Short-term outcomes of curative surgery 539.3 Key findings and recommendations 55
10. Non-curative OG cancer treatment patterns and outcomes 5610.1 Endoscopic/radiological palliative therapy 5610.2 Method used for stent insertion 5610.3 Palliative oncology 5710.4 Variation in use of chemotherapy regimens by age and Cancer Alliance 6010.5 Key findings and recommendations 62

Copyright © 2018, Healthcare Quality Improvement Partnership Ltd. (HQIP), National Oesophago-gastric Cancer Audit 2018. All rights reserved. 5
Annexes 63Annex 1: Organisation of the Audit 63
Annex 2: Audit methods 64
Annex 3: List of regional areas and NHS organisations in England and Wales 66
Annex 4: Management of high-grade dysplasia (HGD) by NHS Trusts (over 2012–2017, 5 years of data) 69
Annex 5: Levels of case ascertainment for English NHS Trusts and Welsh Health Boards (April 2015–March 2017) 70
Annex 6: Data completeness for surgical and pathology records (April 2014–March 2017) 73
Annex 7: Emergency admission by English Cancer Alliances and Welsh Cancer Centres (April 2015–March 2017) 75
Annex 8: Proportion of patients reported to have had an initial staging CT scan by NHS trusts (April 2015–March 2017) 78
Annex 9: Comparative analysis of short term outcomes after curative surgery for NHS Trusts in England and Wales (April 2014–March 2017) 81
Annex 10: Regional variation in non-curative cancer treatments in England and Wales (April 2015–March 2017) 84
References 87
Glossary 88
Copyright © 2018, Healthcare Quality Improvement Partnership Ltd. (HQIP), National Oesophago-gastric Cancer Audit 2018. All rights reserved. 6
Acknowledgements
The National Oesophago-Gastric Cancer Audit is commissioned by the Healthcare Quality Improvement Partnership (HQIP) as part of the National Clinical Audit and Patient Outcomes Programme (NCAPOP). HQIP is led by a consortium of the Academy of Medical Royal Colleges, the Royal College of Nursing, and National Voices. Its aim is to promote quality improvement in patient outcomes, and in particular, to increase the impact that clinical audit, outcome review programmes and registries have on healthcare quality in England and Wales. HQIP holds the contract to commission, manage and develop the National Clinical Audit and Patient Outcomes Programme (NCAPOP), comprising around 40 projects covering care provided to people with a wide range of medical, surgical and mental health conditions. The programme is funded by NHS England, the Welsh Government and, with some individual projects, other devolved administrations and crown dependencies www.hqip.org.uk/national-programmes.
We would like to acknowledge the support of the many hospitals that participated in this Audit and thank them for the considerable time that their staff devoted to collecting and submitting the data.
We would also like to acknowledge the local health boards who contributed on behalf of Wales.
We would particularly like to thank:
• Mr John Taylor and the Oesophageal Patients Association
• The members of the Clinical Reference Group and Project Board (see Annex 1 for full list of members)
• The data linkage team at NHS Digital
The Audit is supported by the Clinical Audit and Registries Management Service (CARMS), Arthur Yelland and Claire Meace, and the Clinical Audit Platform (CAP) development team who provided IT support and technical infrastructure.
Copyright © Healthcare Quality Improvement Partnership, 2018
All rights reserved. Applications for the copyright owner’s written permission to reproduce significant parts of this publication (including photocopying or storing it in any medium by electronic means and whether or not transiently or incidentally to some other use of this publication) should be addressed to the publisher. Brief extracts from this publication may be reproduced without the written permission of the copyright owner, provided that the source is fully acknowledged.
Copyright © 2018, Healthcare Quality Improvement Partnership Ltd. (HQIP), National Oesophago-gastric Cancer Audit 2018. All rights reserved. 7
Foreword
The 2018 Annual Report from the National Oesophago-Gastric (OG) Cancer Audit provides up-to-date information on the quality of OG cancer care provided by NHS organisations in England and Wales. Its results are a reflection of the dedication shown by staff at NHS trusts and Welsh local health boards, as well as the Audit team at NHS Digital and the Clinical Effectiveness Unit. The members of the Clinical Reference Group also deserve thanks for providing expert guidance and advice. Sufficient time has now passed for the Audit to describe trends in patterns of care over a five-year period, between April 2012 and March 2017. During this time, many improvements have been demonstrated. Now, more patients with high-grade dysplasia (HGD) are receiving active treatment compared with five years ago. This report also documents the evolution of staging investigations, with an increased use of PET-CT scans among patients who are candidates for curative treatment. The Audit is also giving us a unique opportunity to see how outcomes have changed over time. Patients’ chances of surviving curative surgery have improved significantly over the last 10 years, although their risk of having a complication has not changed. In addition to these successes, the Audit highlights some areas for improvement. The median waiting time from referral to receiving curative surgery between April 2015 and March 2017 was over 3 months, and the delays for patients going straight to surgery without neo-adjuvant therapy are concerning. It is imperative that commissioners and members of the multidisciplinary team (MDT) review care pathways to minimise delays to treatment. The variation across Cancer Alliances / Welsh regions in the use of PET-CT among patients with planned curative treatment suggests that those with unusually low or high rates should review whether these rates are consistent with current clinical evidence.
For patients receiving palliative treatment, the Audit also reveals regional variations in the choice of treatments. Some patients receiving supportive care or endoscopic therapy could potentially have been eligible for oncological treatments. Improvements in the selection process of patients for palliative treatments are required to ensure that patients receive an appropriately tailored treatment strategy. The Audit has also highlighted considerable variation among Cancer Alliances in the choice of triple or double therapy regimens among older patients. An exciting development for the future of the audit is its merger with the National Bowel Cancer Audit to form the National Gastrointestinal Audit Programme. We look forward to the National OG Cancer Audit continuing to develop under this new programme. “Weighing the pig won’t make it fatter” is a well known phrase in performance management. The golden rules of measurement are, “no measurement without recording, no recording without analysis, and no analysis without action.” A national quality improvement programme for OG cancer surgery is now overdue to disseminate the lessons learned by the best performing teams and thereby stimulate further improvements in outcomes for patients.
Dr Nicola StricklandPresident, The Royal College of Radiologists
Dr Jeanette DicksonVice-President, Clinical Oncology, The Royal College of Radiologists
Dr Cathryn Edwards President, British Society of Gastroenterology
Mr Richard HardwickPresident, Association of Upper Gastrointestinal Surgeons of Great Britain and Ireland

Copyright © 2018, Healthcare Quality Improvement Partnership Ltd. (HQIP), National Oesophago-gastric Cancer Audit 2018. All rights reserved. 8
Executive Summary
The National Oesophago-Gastric Cancer Audit (NOGCA) was established to investigate the quality of care received by patients with oesophago-gastric (OG) cancer in England and Wales. It aims to provide information for NHS cancer services so that they can benchmark their performance and identify areas where aspects of care could be improved. Around 13,000 people are diagnosed with OG cancer in England and Wales annually. It is the fifth most common type of cancer, and patients are often diagnosed with more advanced disease compared with other cancers. Only 15% of people with oesophageal cancer and 19% of people with gastric cancer survive 5 years after diagnosis, compared with 85% for women diagnosed with breast cancer.
NOGCA collects prospective data on adult patients diagnosed in England and Wales with invasive epithelial cancer of the oesophagus, gastro-oesophageal junction (GOJ) or stomach, or high-grade dysplasia (HGD) of the oesophagus. Stakeholder groups, including patient representatives from the Oesophageal Patients Association, have been involved in the development of the Audit.
In this tenth annual report, we focus on the care received by patients diagnosed between 1 April 2015 and 31 March 2017 and their outcomes. All NHS trusts participated in the audit, and tumour case ascertainment was close to 80%. Results are presented at a national level, at regional level (using the Cancer Alliance areas for England) and at individual NHS trust / local health board level. We also describe changes in key indicators of care over the five years since the current audit began.
The report is written for four key audiences, those who deliver, receive, commission and regulate care, and is designed to support quality improvement activities in hospitals as well as the commissioners of cancer services. Data are also provided to the Care Quality Commission (CQC) to inform their inspection packs. In addition to this report, the Audit publishes information on surgical outcomes for individual consultants within English NHS trusts.
This information on clinical outcomes can be found on the following websites.
www.NOGCA.org.ukThis is the Audit’s main website
www.augis.org/outcomes-data-2017Consultant-level surgical outcomes are published each year on the Association of Upper Gastrointestinal Surgeons website
www.nhs.uk/Service-Search/performance/searchInformation is available for the full range of NHS services, including the Audit’s surgical results
https://www.hqip.org.uk/national-programmes/clinical-audit-benchmarking/
HQIP’s National Clinical Audit Benchmarking website provides access to trust-level audit performance data for a range of specialities.
The Audit is commissioned by the Health Quality Improvement Partnership (HQIP), funded by NHS England and the Welsh Government, and delivered by the Royal College of Surgeons of England in partnership with NHS Digital, the Royal College of Radiologists (RCR), the British Society of Gastroenterology (BSG) and the Association of Upper Gastrointestinal Surgeons (AUGIS). The delivery of the Audit is overseen by a Project Board. A Clinical Reference Group (CRG), whose members represent professional medical associations and patient organisations, provides advice to the Audit team on the clinical direction of the Audit, the interpretation of its findings and how these can be disseminated effectively.

Copyright © 2018, Healthcare Quality Improvement Partnership Ltd. (HQIP), National Oesophago-gastric Cancer Audit 2018. All rights reserved. 9
Key Findings & Recommendations
High-grade dysplasia of the oesophagus
Guidance on the diagnosis and management of patients with HGD of the oesophagus was published by the BSG in 2014 [BSG/Fitzgerald et al 20141], which updated NICE clinical guidance on endoscopy treatment for Barrett’s oesophagus [NICE 20102] and provided additional recommendations in relation to diagnosis and treatment. Among the recommendations, clinical standards relating to four key areas of care were identified:
Diagnosis: all cases of suspected HGD should be confirmed by two gastrointestinal pathologists
Planning: all patients with HGD should be discussed by a specialist multi-disciplinary team (MDT)
Treatment: endoscopic therapy for HGD is preferred over oesophagectomy or surveillance
Providers: endoscopic treatment should be performed in high-volume tertiary centres treating at least 15 cases each year.
HGD case ascertainment
Key Finding 1: The Audit received information on 2,059 patients diagnosed with HGD in England between April 2012 and March 2017. The number of HGD records submitted to the Audit has declined each year and the number of cases per million population shows variation across regions, indicating lower case ascertainment in successive years and in some regions of England.
Recommendation
We recommend regular review of cases and submission to the Audit by local teams to improve case ascertainment in regions where it is currently low. To help hospital staff, the Audit team is working with users to improve the ease with which data can be uploaded into the data collection IT system.
HGD diagnosis
Key Finding 2: 86% of patients with HGD had their original diagnosis confirmed by a second pathologist. This proportion remained fairly constant over the three years for which data are available.
Recommendation
Where appropriate, MDTs should ensure that cases of suspected HGD have been confirmed by a second pathologist.
HGD treatment planning
Key Finding 3: 86% of newly diagnosed cases of HGD were discussed at an Upper GI MDT meeting. This proportion did not change between 2012–13 and 2016–17.
Recommendation:
NHS trusts / local health boards should ensure there are clear protocols with neighbouring hospitals for the referral of all cases of HGD to the specialist MDT. Local audits should be undertaken to identify the reasons why cases are not discussed and to take any required action.
HGD treatment
Key Finding 4: Among patients diagnosed between 2012 and 2017, 65% received endoscopic treatment for HGD, 4% had a surgical resection, and 17% were placed on a surveillance regimen. The proportion of patients on surveillance declined from 27% in 2012–13 to 15% in 2016–17. The proportion of patients receiving active treatment for HGD has increased over five years, but shows considerable variation across Cancer Alliances, ranging from 37% to 96%.
Recommendation
MDTs should ensure that all patients with HGD are considered for endoscopic treatment, in line with current recommendations, and Cancer Alliances should set out clear pathways for referral to specialist treatment centres, where necessary. Those with high rates of non-treatment of HGD should consider conducting local audits to explore the reasons for this.
Key Finding 5: The majority of patients undergoing surveillance are seen within 3 months, but some are not seen for more than 6 months. Current recommendations state that patients who are not actively treated should have repeat endoscopy at 3 month (HGD) or 6 month (low-grade dysplasia) intervals.
Recommendation
Patients selected for surveillance should be monitored regularly by the MDT, in accordance with guidance.
1 Available at: https://www.bsg.org.uk/resource/bsg-guidelines-on-the-diagnosis-and-management-of-barrett-s-oesophagus.html 2 Available at: https://www.nice.org.uk/guidance/cg106

Copyright © 2018, Healthcare Quality Improvement Partnership Ltd. (HQIP), National Oesophago-gastric Cancer Audit 2018. All rights reserved. 10
HGD providers
Key Finding 6: In 2016–17, only six NHS trusts (of 38 that submitted endoscopic treatment records) treated at least 15 patients. Of these only one trust treated the recommended minimum number of patients in each audit year. The majority (75%) of trusts provided endoscopic treatment to fewer than five patients.
Recommendation
While small numbers might reflect low case ascertainment in some regions, trusts that treat fewer than five patients with HGD each year should consider referral of these patients to their local specialist centre.
Patients with oesophago-gastric cancer
Case ascertainment
Key Finding 7: All 136 acute non-specialist NHS trusts in England submitted clinical information for 19,769 patients (79% of estimated total) diagnosed with OG cancer between April 2015 and March 2017, while data on 1,263 patients treated in Wales (76% of estimated total) were supplied from the NHS Wales cancer information system (CaNISC). Case ascertainment has not changed significantly over time. The completeness of surgical records submitted to the Audit was 90% in England and 70% in Wales.
Recommendation
We recommend regular review of cases by local teams and submission to the Audit in a timely manner to minimise missing data, particularly for those patients who do not receive further hospital-based treatment. Where a patient has treatment in a cancer centre, it is important that data collection is coordinated between the diagnosing hospital and the specialist cancer centre so that tumour records and treatment records are not missed.
Patterns of care at diagnosis
Patients can be diagnosed with OG cancer after referral to secondary care via three main routes: 1) following a visit to a general practitioner, 2) after an emergency admission, or 3) from a non-emergency hospital setting. Patients diagnosed following an emergency admission are more likely to have late stage disease and therefore are less likely to receive curative therapies than those diagnosed via other routes. The proportion of patients diagnosed with early stage cancer has remained at around 12% over the five years.
Key Finding 8: Among patients diagnosed in 2015–17, 66% were diagnosed following referral from a GP, 13% after emergency admission, and 20% from a non-emergency hospital setting. There was substantial variation in emergency diagnoses by Cancer Alliance / Welsh region (ranging from 5% to 22%), likely due to a combination of patient characteristics and practitioner factors. The rate of diagnoses after emergency admission remained at 13–14% over the five years, and regional variations also persisted over time.
Recommendation
Commissioners, GP practices and NHS trusts / local health boards need to explore ways to improve rates of early diagnosis and, in particular, investigate the reasons for high rates of emergency diagnoses.
Key Finding 9: In the 2015–2017 cohort, the median time from referral to diagnosis of cancer was 14 days. The time from referral to first treatment varied by treatment modality, with patients receiving palliative endoscopic/radiological treatments having the shortest median times from referral to treatment. The distributions of waiting times within the various regions of England and Wales were similar, being much smaller than the range of differences between patients.
Recommendation
Together with commissioners, MDTs should review waiting times through the care pathways and discuss ways to improve the progression of patients from diagnosis through to staging and treatment.
Copyright © 2018, Healthcare Quality Improvement Partnership Ltd. (HQIP), National Oesophago-gastric Cancer Audit 2018. All rights reserved. 11
Staging and treatment planning
Key Finding 10: It is recommended that all patients diagnosed with OG cancer undergo a CT scan to provide an initial assessment and evidence of any metastatic disease. Overall, 90% of patients diagnosed in 2015–17 had an initial CT scan. This proportion increased over five years, from 86% in 2012–13 to 90% in 2016–17. Older patients and those with poorer performance status were less likely to have a CT scan.
Recommendation
NHS trusts / local health boards should examine their use of staging investigations for OG cancer and the submission of data about these investigations where their use is reported to be low. This may require better coordination between MDT team members and data mangers in the NHS trust / local health board so that complete information is submitted to the Audit.
Key Finding 11: Following an initial CT scan, further staging investigations may be required to determine the location and stage of cancer. For patients with oesophageal cancer, endoscopic ultrasound (EUS) is used selectively for staging OG cancers, with PET-CT now recommended for all patients being considered for curative treatment. In the 2015–17 cohort, approximately half of patients with a curative treatment plan for oesophageal cancer had an EUS. In contrast, the reported use of PET-CT increased from 63% to 71%, which is to be welcomed. The use of EUS and PET-CT varied across England and Wales. The proportion of patients who had a laparoscopy remained at around 50% over the five year period.
Recommendation
MDTs should ensure that all OG cancers are appropriately staged according to national recommendations; in particular, MDTs should ensure that patients with oesophageal cancer being considered for radical treatment have a PET-CT scan. MDTs should also ensure that staging laparoscopy is used in appropriate cases.
Key Finding 12: Overall, 39% of patients with OG cancer diagnosed in 2015–17 had a curative treatment plan. The proportion of patients managed with curative intent varied across Cancer Alliances / Welsh regions, but these proportions were generally clustered around the national average. Not all patients with a curative treatment plan go on to receive surgery, and there is regional variation in the proportion of eligible patients who have a surgical record in NOGCA.
Recommendation
NHS organisations with large differences between the number of patients with curative treatment intent and number of surgery records should investigate the reasons for this. MDTs should consider how information about planned treatments is communicated to patients.
Key Finding 13: There was variation in the patterns of planned palliative modality across the regions, with some regions having comparatively high rates of best supportive care.
Recommendation
NHS organisations with comparatively low use of active cancer treatment among palliative patients should examine whether more patients would be suitable for these therapies.
Curative tri-modal treatment (neoadjuvant chemoradiotherapy and surgery)
Key Finding 14: Tri-modal treatment refers to the use of neoadjuvant chemoradiotherapy and surgery. Despite its more widespread use in other countries, only a very small proportion of patients receiving curative treatment in the 2013–15 cohort had tri-modal treatment (6% of all patients who had neoadjuvant therapy prior to curative surgery). More than half of these cases were treated in just five centres, and the majority of patients received dosing regimens used in previous clinical trials.
Recommendation
The upper GI community in the UK should monitor the use of neoadjuvant chemoradiotherapy before curative surgery to ensure both that it is used in suitable candidates and that evidence based recommendations for the radiotherapy and chemotherapy regimens are followed. NHS trusts / health boards are encouraged to support patient recruitment to the NeoAEGIS trial, which aims to assess the value of tri-modal treatment for oesophageal cancer.

Copyright © 2018, Healthcare Quality Improvement Partnership Ltd. (HQIP), National Oesophago-gastric Cancer Audit 2018. All rights reserved. 12
Curative surgery
In the 2015–17 audit period, information about curative surgery was submitted for 4,291 patients (2,658 oesophagectomies and 1,633 gastrectomies). Oesophagectomies were typically performed using the transthoracic approach, while gastrectomies were generally total or distal. The distribution of surgical procedures has remained largely unchanged over five years. In particular, the proportion of open-and-shut/bypass cases has remained at around 4% during this period.
There is increasing evidence for the advantages of using enhanced recovery after surgery (ERAS) protocols, including reduced complications, improved outcomes and shorter length of hospital stay. In particular, it is thought that the adoption of ERAS protocols has contributed to the significant reduction in length of hospital stay after surgery over the last 10 years. Data items relating to ERAS were included for the first time in the 2016–17 audit. Organisations are beginning to use these items but it is too early to understand how widely ERAS is being used and what impact it is having.
Key Finding 15: All NHS trusts and local health boards achieved similar 90-day mortality after curative surgery (overall 90-day mortality rate was 3.9% for oesophagectomies and 3.3% for gastrectomies). There was one centre whose 30-day postoperative mortality rate was slightly higher than expected given the number of operations performed when compared against the national average. There was no statistically significant change in 30-day or 90-day mortality from 2012–13 to 2016–17 for either oesophagectomy or gastrectomy. There has been a steady decrease in the median length of stay in hospital after surgery over the last 10 years.
Key Finding 16: Last year, the Audit introduced results on four new surgical indicators, including the number of lymph nodes excised and examined, and the proportion of patients with a positive resection margin. However, a lack of standardisation in the preparation of surgical specimens in theatre before submission to the pathology department means that organisations cannot yet be benchmarked using these indicators.
Recommendation
Surgeons and pathologists should work towards standardisation of the way surgical specimens are collected, so that benchmarking of organisations using these indicators can be carried out in the future.
Non-curative treatments
Key Finding 17: Nearly two-thirds of patients with OG cancer were managed with palliative intent. Among non-curative treatment options, palliative oncology was most commonly used, but there was large variation in the choice of palliative treatments across the regions in England and Wales. Among patients receiving palliative oncology, chemotherapy was most frequently used (68%). Just over 50% of patients completed the course of treatment, with non-completion being generally due to progressive disease or acute chemotherapy toxicity. Among patients receiving best supportive care (no active treatment beyond conservative measures to achieve symptom control) or endoscopic/radiological therapies, over 50% survived beyond three months and therefore may have been candidates for palliative oncological treatments.
Recommendation
The selection process of patients for palliative chemotherapy requires improvement. In particular, services should explore the reasons why patients chosen to receive this treatment were unable to complete the regimen and why patients who were sufficiently fit to be candidates for chemotherapy received best supportive care.
Current guidelines recommend the use of triplet regimens (including a platinum-based agent, a fluoropyrimidine and an anthracycline) as a first line option for patients being treated with palliative chemotherapy [Allum et al 2011]. These have been shown to improve overall survival compared to doublet regimens (including a platinum-based agent and a fluoropyrimidine), although whether this benefit is outweighed by the risk of greater toxicity has been questioned [Wagner et al 2017].
Key Finding 18: There is considerable regional variation in the use of doublet and triplet regimens, especially among patients aged 80 years and over being treated with palliative oncology.
Recommendation
Attempts should be made to develop a more consistent approach to the use of systemic therapy regimens, especially in older patients with advanced OG cancer, through the development of practice guidelines and/or participation in clinical trials.
Copyright © 2018, Healthcare Quality Improvement Partnership Ltd. (HQIP), National Oesophago-gastric Cancer Audit 2018. All rights reserved. 13
Future of the Audit
The National OG Cancer Audit was re-commissioned in 2018, together with the current National Bowel Cancer Audit (NBOCA), as the three-year National Gastrointestinal (GI) Cancer Audit Programme. The new programme will reflect a change in how the two current Audits are managed and delivered but the new programme will continue to have distinct work streams for bowel and OG cancer, and an audit with a distinct identity will continue to publish information on the delivery of care to patients with OG cancer.
The new GI Audit will introduce more frequent quality reporting, which will be published on the NOGCA and NBOCA websites. The specific format and content of these reports are currently being planned.

Copyright © 2018, Healthcare Quality Improvement Partnership Ltd. (HQIP), National Oesophago-gastric Cancer Audit 2018. All rights reserved. 14
patients in England who were diagnosed with high-grade
dysplasia of the oesophagus between April 2012 and March
2017.
Between 2012-13 and 2016-17, the proportion of patients receiving active treatment (endoscopic or surgical treatment) for high-grade
dysplasia increased from 70% to 75%.
The majority of patients were discussed at a multidsciplinary
team meeting, but this proportion has not changed over time.
High-grade dysplasia
71-610231-21020
25
50
75
100
2,059
Submissions to the Audit
Active treatment
86%
Multidisciplinary team
2012-13 2013-14 2014-15 2015-16 2016-170
20
40
60
Surveillance
Between 2012-13 and 2016-17, the proportion of patients undergoing surveillance for high-grade dysplasia declined from 27% to 15%.
The number of HGD cases submitted to the Audit has declined
over five years. Some regions in England may have very low case
ascertainment.
The Audit received information about
27%
15%

Copyright © 2018, Healthcare Quality Improvement Partnership Ltd. (HQIP), National Oesophago-gastric Cancer Audit 2018. All rights reserved. 15
patients in England & Wales who were diagnosed with oesophago-gastric cancer
between April 2015 and March 2017.
On average, these patients received treatment 94 days after referral, compared to 62 days for
patients undergoing neoadjuvant treatment.
Oesophago-gastric cancer
Waiting times for treatment
The Audit received information about Early diagnosis
of patients were diagnosed with early-stage OG cancer. This proportion has remained unchanged since 2012-13.
of patients were diagnosed following an emergency admission to hospital.
13-14% Staging investigations
90% of patients had an initial CT scan to assess the spread of cancer. This proportion has increased from 86% in 2012-13. 2012-13 2016-17
0
50
100
90%86%
Waiting times were longest for patients having curative surgery.
Outcomes of curative surgery
There has been a steady improvement in the median length of hospital stay after curative surgery, from 10-12 days to 7-9 days.
Mortality rates after curative surgery remain at low levels, with over 96% of patients alive 90 days after surgery. This figure was similar across NHS hospitals in England and Wales.
7-9 days
Palliative treatments
Only 56% of patients undergoing palliative
chemotherapy completed their treatment.
56%

Copyright © 2018, Healthcare Quality Improvement Partnership Ltd. (HQIP), National Oesophago-gastric Cancer Audit 2018. All rights reserved. 16
Figure 1.1Upper gastrointestinal tract
1. Introduction
The National Oesophago-Gastric Cancer Audit (NOGCA) was established to evaluate the care of patients with oesophago-gastric (OG) cancer in England and Wales and to help NHS services identify areas where improvements could be made. In addition, the Audit evaluates the care received by patients with a new diagnosis of oesophageal high-grade dysplasia (HGD) because there is a risk of progression to oesophageal cancer if HGD is left untreated. The Audit is commissioned by the Healthcare Quality Improvement Partnership (HQIP) and is one of five national cancer audits being undertaken in England and Wales.
The Audit is designed to evaluate the care pathway followed by patients once they have been diagnosed with either OG cancer or HGD, and to answer questions related to:
• the pathway of care that patients took to diagnosis
• whether clinical (pre-treatment) staging is performed to the standards specified in national clinical guidelines
• whether decisions about planned treatments are supported by the necessary clinical data (staging, patient fitness, etc)
• access to curative modalities for suitable patients, such as neoadjuvant chemotherapy prior to surgical resection
• the use of oncological and endoscopic/radiological palliative services
• outcomes of care for patients receiving curative and palliative therapies.
OG cancer is the fifth most common type of cancer in the UK, with around 13,000 people diagnosed each year in England and Wales. Over the last 25 years, the incidence of oesophageal cancer in the UK has increased by around 6%, with a particularly notable increase in cancers located at the gastro-oesophageal junction (see Figure 1.1). During the same period, the incidence of stomach cancers has decreased by around 50% [Cancer Research UK, 2018b].
Various clinical guidelines support clinicians in the management of oesophageal and gastric cancer and HGD. These guidelines are used by the Audit to determine which aspects of care to examine and as sources of the standards of care that services should be delivering. New guidance on the management of oesophageal and gastric cancer from the National Institute for Health and Care Excellence (NICE) was published in January 2018 [NICE 2018]. In addition, recommendations on the delivery of care for OG cancer and HGD patients is contained in:
• The clinical guideline published by the Association of Upper Gastrointestinal Surgeons of Great Britain & Ireland, the British Society of Gastroenterology, and the British Association of Surgical Oncology [Allum et al 2011]
• The Scottish Intercollegiate Guideline Network (SIGN) guideline on the management of oesophageal and gastric cancer [SIGN 2006]
• The British Society of Gastroenterology guidelines on the diagnosis and management of Barrett’s oesophagus [BSG/Fitzgerald et al 2014]
• NICE has provided additional guidance on specific aspects of care, notably:
° Referral Guidelines for Suspected Cancer, and the Management of Dyspepsia in Adults in Primary Care.
° Guidance on the use of interventional procedures, such as endoscopic submucosal dissection of oesophageal tumours
Oesophagus
StomachGastro- oesophageal junction

Copyright © 2018, Healthcare Quality Improvement Partnership Ltd. (HQIP), National Oesophago-gastric Cancer Audit 2018. All rights reserved. 17
1.1 Overview of the 2018 Annual Report
The aim of this report is to give an overall picture of the care provided by NHS services to adult patients with OG cancer or oesophageal HGD. Cancer patients were eligible for inclusion if they were diagnosed with invasive epithelial cancer of the oesophagus, gastro-oesophageal junction (GOJ) or stomach (ICD10 codes C15 and C16), and were aged 18 years or over. Patients with endocrine tumours or gastrointestinal stromal tumours (GISTs) were not included in the Audit due to the different behaviour and management of these tumours. In relation to both oesophageal HGD and OG cancer, the report focuses on the experience and outcomes of patients diagnosed between 1 April 2015 and 31 March 2017.
The report is aimed at those who provide, receive, commission and regulate OG cancer care. This includes clinicians and other health care professionals working within hospital cancer units, clinical commissioners, and regulators, as well as patients and the public who are interested in knowing how OG cancer services are delivered within the NHS. A separate Patient Report aimed specifically at people receiving OG cancer care, their families and caregivers will be published on the NOGCA website.
The Audit is run by the Association of Upper Gastrointestinal Surgeons of Great Britain & Ireland (AUGIS), the Royal College of Radiologists (RCR), the British Society of Gastroenterology (BSG), NHS Digital and the Clinical Effectiveness Unit of the Royal College of Surgeons of England. The delivery of the Audit is overseen by a Project Board whose role is to ensure the Audit is well-managed. Advice on the clinical direction of the Audit, the interpretation of its findings and their dissemination is provided by a Clinical Reference Group (CRG), which is formed of members representing professional medical associations as well as the Oesophageal Patients Organisation (see Annex 1 for further details).
The methods used to produce the results in this report are described in Annex 2.
1.2 Regional organisation of OG cancer services
OG cancer services within England and Wales are organised on a regional basis to provide an integrated model of care. In the period up to 2012, services were organised into Cancer Networks, with each containing one or more cancer centres that provide curative surgical treatment and specialist radiology, oncology and palliative services to all patients living in the area. Diagnostic services and non-specialist palliative services continued to be provided by individual NHS trusts (units) within the cancer network areas. The English Cancer Networks were replaced in 2013 with Strategic Clinical Networks, and the Audit has been publishing regional results at this level for the last few years. For Wales, we have been publishing results for two regional cancer networks. These existed until 2016, after which the Welsh cancer networks were merged into a single network with responsibility for implementing the new Welsh cancer strategy.
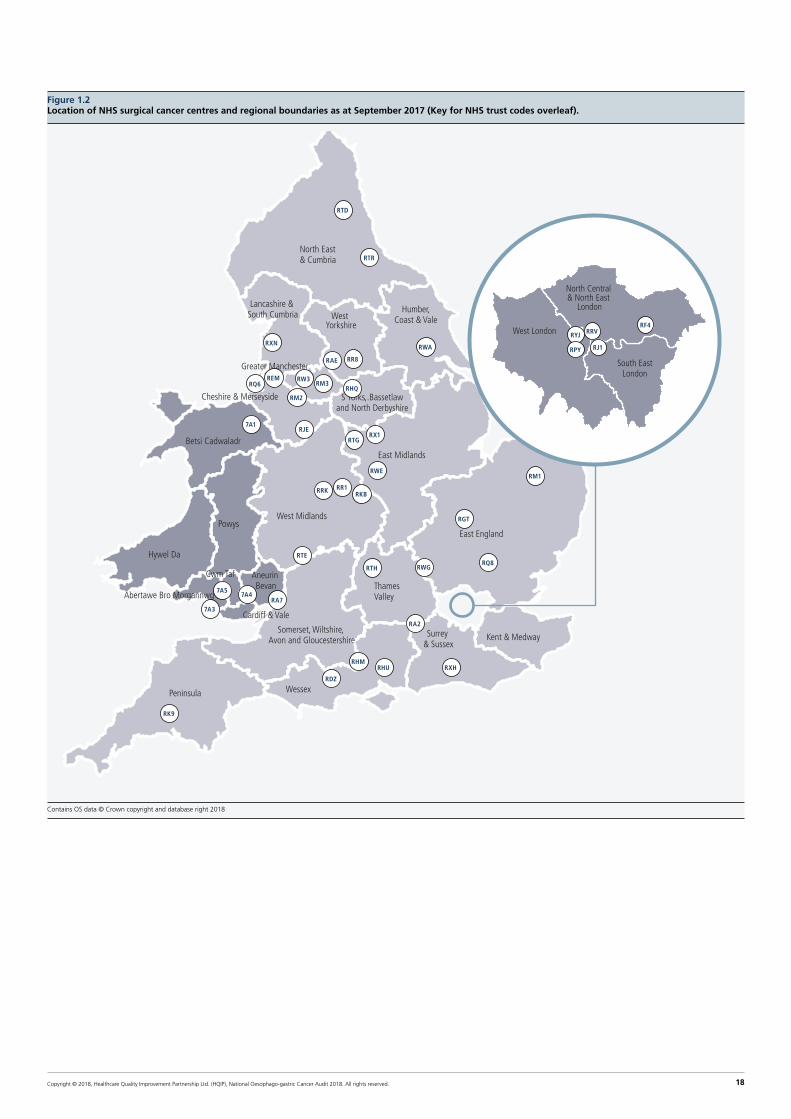
This report presents results for English NHS services with regions using the Cancer Alliance and the National Cancer Vanguards [NHS England 2016]. The Cancer Alliances and Vanguard regions are responsible for organising services across the whole pathways of care for local populations, with the aim of reducing variation in treatment for all people with cancer across the country. For Wales, we have adopted an approach that recognises the three strong regional relationships between services, defining areas labelled as: Abertawe Bro Morgannwg (ABMU), Betsi Cadwaladr (North Wales) and South Wales Cardiff region.
The geographical boundaries of the 19 English Cancer Alliances / Vanguard regions are as shown in Figure 1.2. A list of these regions is provided in Annex 3.
Copyright © 2018, Healthcare Quality Improvement Partnership Ltd. (HQIP), National Oesophago-gastric Cancer Audit 2018. All rights reserved. 18
Figure 1.2Location of NHS surgical cancer centres and regional boundaries as at September 2017 (Key for NHS trust codes overleaf).
Contains OS data © Crown copyright and database right 2018
North East & Cumbria
Peninsula
West Midlands
Hywel Da
Betsi Cadwaladr
Powys
Abertawe Bro Morgannwg
Cwm Taf Aneurin Bevan
Cardiff & Vale
Cheshire & Merseyside
Greater Manchester
S Yorks,.Bassetlawand North Derbyshire
Lancashire & South Cumbria West
Yorkshire
Humber,Coast & Vale
East Midlands
Thames Valley
Kent & Medway
East England
Surrey & Sussex
Somerset, Wiltshire, Avon and Gloucestershire
Wessex
South EastLondon
North Central & North East
London
West London
RTR
RXN
RQ6REM RW3
RM3
RAE
RHQRM2
7A1RJE
RTGRX1
RWE
RKBRR1RRK
RM1
RQ8
RXH
RWGRTH
RTE
RA2
RA77A4
7A5
7A3
RK9
RDZ
RHMRHU
RJ1
RF4
RYJ RRV
RGT
RR8
RWA
RTD
RPY

Copyright © 2018, Healthcare Quality Improvement Partnership Ltd. (HQIP), National Oesophago-gastric Cancer Audit 2018. All rights reserved. 19
Surgical Centres
Code Name Code Name
7A1 Betsi Cadwaladr University Local Health Board RM3 Salford Royal NHS Foundation Trust
7A3 Abertawe Bro Morgannwg University Local Health Board RPY The Royal Marsden NHS Foundation Trust
7A4 Cardiff & Vale University Local Health Board RQ6 Royal Liverpool and Broadgreen University Hospitals NHS Trust
7A5 Cwm Taf University Local Health Board RQ8 Mid Essex Hospital Services NHS Trust
RR1 Heart of England NHS Foundation Trust
RA2 Royal Surrey County Hospital NHS Foundation Trust RR8 Leeds Teaching Hospitals NHS Trust
RA7 University Hospitals Bristol NHS Foundation Trust RRK University Hospitals Birmingham NHS Foundation Trust
RAE Bradford Teaching Hospitals NHS Foundation Trust RRV University College London Hospitals NHS Foundation Trust
RDZ The Royal Bournemouth and Christchurch Hospitals NHS Foundation Trust RTD The Newcastle Upon Tyne Hospitals NHS Foundation Trust
REM Aintree University Hospital NHS Foundation Trust RTE Gloucestershire Hospitals NHS Foundation Trust
RF4 Barking, Havering and Redbridge University Hospitals NHS Trust RTG Derby Hospitals NHS Foundation Trust
RGT Cambridge University Hospitals NHS Foundation Trust RTH Oxford University Hospitals NHS Trust
RHM University Hospital Southampton NHS Foundation Trust RTR South Tees Hospitals NHS Foundation Trust
RHQ Sheffield Teaching Hospitals NHS Foundation Trust RW3 Central Manchester University Hospitals NHS Foundation Trust
RHU Portsmouth Hospitals NHS Trust RWA Hull and East Yorkshire Hospitals NHS Trust
RJ1 Guy’s and St Thomas’ NHS Foundation Trust RWE University Hospitals of Leicester NHS Trust
RJE University Hospitals of North Midlands NHS Trust RWG West Hertfordshire Hospitals NHS Trust
RK9 Plymouth Hospitals NHS Trust RX1 Nottingham University Hospitals NHS Trust
RKB University Hospitals Coventry and Warwickshire NHS Trust RXH Brighton and Sussex University Hospitals NHS Trust
RM1 Norfolk and Norwich University Hospitals NHS Foundation Trust RXN Lancashire Teaching Hospitals NHS Foundation Trust
RM2 University Hospital of South Manchester NHS Foundation Trust RYJ Imperial College Healthcare NHS Trust
Cancer Alliances & Welsh regions
Code Name Code Name
Cheshire Cheshire and Merseyside SE Lon South East London
E Mids East Midlands S Yorks South Yorkshire, Bassetlaw and North Derbyshire
E Engl East of England Surrey Surrey and Sussex
Manc Greater Manchester Thames Thames Valley
Humber Humber, Coast and Vale Wessex Wessex
Kent Kent and Medway W Lon West London
Lancs Lancashire and South Cumbria W Mids West Midlands
NCE Lon North Central and East London W Yorks West Yorkshire
N East North East and Cumbria ABMU Abertawe Bro Morgannwg
Penns Peninsula N Wales North Wales Cancer Centre: Betsi Cadwaladr
Soms Somerset, Wiltshire, Avon and Gloucestershire S Wales South Wales Cancer Centre: Cardiff & Vale, Cwm Taf, Hywel Dda, Aneurin Bevan

Copyright © 2018, Healthcare Quality Improvement Partnership Ltd. (HQIP), National Oesophago-gastric Cancer Audit 2018. All rights reserved. 20
1.3 Other sources of information produced by the Audit
The Audit publishes information on the www.nogca.org.uk website for all NHS trusts / local health boards in England and Wales with OG cancer services. This includes:
• This Annual Report as well as previous versions
• A patient version of the Annual Reports, published shortly after publication of each Annual Report
• Information on the performance of each NHS organisation
• Links to other sources of information about OG cancer such as Cancer Research UK
In addition, as part of NHS England’s “Everyone Counts: Planning for Patients 2013/4” initiative, the Audit has published outcome information for curative surgical procedures by individual consultants currently working at the organisation. This information can be found on the:
• AUGIS website www.augis.org/surgical-outcomes-2018/
• MyNHS website www.nhs.uk/Service-Search/performance/search
The results from the Audit are used by various other national health care organisations. In particular, the Audit has worked with HQIP and the CQC intelligence team to create a dashboard to support CQC inspections.
1.4 Future of the Audit
The National OG Cancer Audit was re-commissioned in 2018 and has evolved into the three-year National Gastrointestinal Cancer Audit Programme. This now covers both oesophago-gastric and bowel cancer services.
While the new programme will change how the two current Audits are managed, it will continue to have a distinct work stream for OG cancer under a recognisable name, which will publish information and recommendations for those who provide, receive, regulate and commission OG cancer care.
The OG cancer workstream of the new audit will continue to be run by a team from the Association of Upper Gastrointestinal Surgeons of Great Britain & Ireland (AUGIS), the Royal College of Radiologists (RCR), the British Society of Gastroenterology (BSG), NHS Digital and the Clinical Effectiveness Unit of the Royal College of Surgeons of England.

Copyright © 2018, Healthcare Quality Improvement Partnership Ltd. (HQIP), National Oesophago-gastric Cancer Audit 2018. All rights reserved. 21
2. Management of patients with high-grade dysplasia in England
2.1 Introduction
Abnormal development of cells (or dysplasia) in the oesophagus is a risk factor for progression to oesophageal cancer. The condition typically develops over time and the most severe form of dysplasia, known as high-grade dysplasia (HGD), is considered a pre-cancerous condition.
The Audit has collected data on patients diagnosed with HGD of the oesophagus in England since April 2012. This chapter describes the management of patients who were diagnosed between April 2012 and March 2017, in the context of recommendations from national guidelines and changes over the five years.
To provide more information on the care received by these patients, the audit data were linked to patients’ records in Hospital Episode Statistics (HES), the routine hospital patient database for England. This was used to describe the sequence of endoscopic procedures that patients underwent in the year after HGD diagnosis, and to identify patients with a cancer diagnosis as they received different treatment modalities.
2.2 Indicators of HGD care
The British Society of Gastroenterology (BSG) guidelines on diagnosis and management of Barrett’s oesophagus include a number of recommendations in relation to patients with HGD [BSG/Fitzgerald et al 2014]. These update NICE clinical guidance on endoscopy treatment for Barrett’s oesophagus [NICE 2010] and provide additional recommendations in relation to diagnosis and treatment.
Box 1Indicators used to assess the care of patients with HGD (source: BSG 2014 guideline)
Recommendation and rationale Indicator
All cases of suspected HGD should be confirmed by two gastrointestinal pathologists
Grading dysplasia involves a degree of subjectivity, and a diagnosis of HGD has important implications for treatment. Studies have shown that the rate of progression to cancer among patients with dysplasia confirmed by two specialist pathologists is higher than among those without consensus diagnosis.
% of patients whose diagnosis was confirmed by a second pathologist
All patients with HGD should be discussed at the specialist multi-disciplinary team (MDT) for oesophago-gastric cancer
As treatment for HGD can involve endoscopic or surgical management, discussion at the MDT ensures that the patient is considered for the most appropriate treatment option
% of patients discussed at the MDT
Endoscopic treatment of HGD (endoscopic mucosal resection of visible lesions and radiofrequency ablation of flat HGD) is preferred over oesophagectomy or surveillance
Compared to surgery, endoscopic treatment is associated with lower morbidity and mortality. There is little evidence to support the use of surveillance.
% of patients who received endoscopic treatment
Endoscopic treatment should be performed in high-volume tertiary referral centres (min. 15 endoscopic mucosal resections per year for HGD or early cancer)
Outcomes of oesophageal surgery are consistently better in high-volume centres. While similar data for endoscopic treatments are lacking, complication rates have been shown to be higher among endoscopists with less experience.
Number of patients with HGD receiving endoscopic treatment at each trust per year

Copyright © 2018, Healthcare Quality Improvement Partnership Ltd. (HQIP), National Oesophago-gastric Cancer Audit 2018. All rights reserved. 22
2.3 Participation in HGD component and patient characteristics
To date, records for 2,059 patients newly diagnosed with HGD between 1 April 2012 and 31 March 2017 have been submitted to the Audit. Data submissions have been limited to English NHS trusts due to the different data collection system used in Wales (CaNISC)3.
The number of HGD records submitted to the Audit has declined each year, from 465 in 2012–13 to 368 in 2016–17. As there is no suggestion that there has been a change in the underlying incidence of HGD in the last five years, this decline is likely to reflect lower case ascertainment in successive years. The Audit’s 2017 User Survey (available at https://www.nogca.org.uk) indicated that a large proportion of users found collecting HGD data difficult, with particular issues relating to the coordination of data collection and submission between organisations.
It is currently not possible to estimate case ascertainment for the HGD component of the Audit because there is no specific ICD-10 code for HGD that can be used to identify patients in hospital IT systems or databases such as Hospital
Episode Statistics (HES) [Chadwick et al 2017]. Instead, we examined the number of cases of HGD submitted to the Audit per million population for each NHS England region, and found a 6-fold variation across regions (4.5-fold variation when restricted to population aged 65+) (Table 2.1). Such wide variation is unlikely to be due to differences in incidence, and suggests that case ascertainment could be as low as 20% in some regions. Work is underway to see if other data sources such as the UK Radiofrequency Ablation Registry4 can provide greater insight into case ascertainment.
The Audit has also undertaken a number of activities to support improvements in case ascertainment, such as compiling case studies from trusts with high numbers of HGD submissions and sharing these examples of best practice with hospitals via the Audit’s regular newsletter. The Audit also conducted a User Survey in 2017 (https://www.nogca.org.uk/reports/nogca-user-survey-2017/), which highlighted technical difficulties that users experienced when coordinating the submission of HGD records across different organisations (e.g. between diagnosing and treating hospitals). These findings are informing further development of the data collection system, and will improve participation and data quality.
3 English NHS trusts submit patient information to NOGCA via its online submission system (Clinical Audit Platform, CAP), while information from Wales is provided by the Cancer Network Information System Cymru (CaNISC). CaNISC only collects information on patients with OG cancer and does not collect information on patients with HGD.
4 The Radiofrequency Ablation (RFA) Registry collects information on RFA procedures for Barrett’s oesophagus that take place in major specialist centres in the UK, and is led by UCLH. More information about the registry can be found here: https://www.ucl.ac.uk/surgery/research/clinical-trials/halo-radiofrequency-ablation-registry
Table 2.1High-grade dysplasia cases submitted to the Audit in 2016-17 per million population in each NHS England region
NHS England Region HGD cases per million population*
In total population In population aged 65+ years
London 2.96 25.46
Central Midlands 3.89 22.07
West Midlands 4.05 23.21
Yorkshire and Humber 4.26 27.12
Greater Manchester 4.34 23.71
Yorkshire and Humber 5.50 30.59
South Central 5.84 29.17
South East 5.99 29.58
Lancashire and South Cumbria 6.60 33.92
North Midlands 10.41 49.68
Wessex 10.64 51.62
East 11.81 60.82
Cheshire and Merseyside 13.02 59.81
South West Cumbria and North East 19.63 100.04
*Mid-2016 population estimates obtained from Office for National Statistics (2017)

Copyright © 2018, Healthcare Quality Improvement Partnership Ltd. (HQIP), National Oesophago-gastric Cancer Audit 2018. All rights reserved. 23
2.4 Diagnosis of HGD and patient characteristics
There were 2,059 patients diagnosed with HGD in 2012–17. Three quarters of patients (n=1,529) were male, and the condition was typically diagnosed in those aged 65 or older. The median age at diagnosis was 71 years (IQR 64 to 79). Around half of all patients were referred to secondary services by a medical practitioner after experiencing symptoms (n=1,001). The other half were diagnosed while undergoing surveillance. These characteristics were similar in each Audit year between 2012 and 2017.
Among patients diagnosed in 2014–17, 37% had at least one significant comorbidity, of which cardiovascular disease was the most common (reported for 22% of patients), followed by diabetes (10% of patients). Multiple comorbidities were reported for 14% of patients.
Among the patients diagnosed with HGD in 2014–2017, 86% had their original diagnosis confirmed by a second pathologist (Table 2.2). This proportion has remained similar over the three years for which data are available. Among patients who underwent a repeat biopsy, 87% had the result confirmed by a second pathologist. Endoscopic findings at the time of HGD diagnosis are presented in Table 2.3. These are generally in keeping with characteristics reported elsewhere with the exception of the type of lesion. The proportion of patients with multifocal disease is larger than expected.
Table 2.2Diagnostic details of patients diagnosed with high-grade dysplasia in England, by year of diagnosis 2014–17
2014–15 2015–16 2016–17 Total
Original biopsy confirmed by a second pathologist, n (%) 272 (82.9) 292 (87.2) 263 (87.4) 827 (85.8)
Missing 60 45 67 172
Repeat biopsy taken, n (%) 207 (56.6) 203 (60.2) 181 (57.8) 591 (58.2)
Missing 22 43 55 120
Repeat biopsy confirmed by a second pathologist, n (%)* 131 (85.0) 170 (89.0) 151 (87.8) 452 (87.4)
Missing 53 12 9 74
Data items on biopsy changed from 2014. *Denominator is number of patients who had a repeat biopsy taken.
Table 2.3Endoscopic findings at time of diagnosis for patients with high-grade dysplasia, by year of diagnosis
2012–13 2013–14 2014–15 2015–16 2016–17 Total
Endoscopic appearance of HGD, n (%)
Flat mucosa 105 (42.5) 99 (36.4) 96 (44.4) 76 (38.2) 94 (48.7) 470 (41.7)
Nodular lesion 135 (54.7) 158 (58.1) 111 (51.4) 118 (59.3) 96 (49.7) 618 (54.8)
Depressed lesion 7 (02.8) 15 (05.5) 9 (04.2) 5 (02.5) 3 (01.6) 39 (03.5)
Missing 218 186 172 181 175 932
Barrett’s segment present, n (%) 279 (76.8) 298 (79.1) 264 (81.0) 256 (79.0) 246 (79.6) 1345 (79.0)
Missing 99 81 62 56 59 357
Type of lesion (pathology report), n (%)
Unifocal 136 (58.4) 155 (69.5) 110 (60.4) 139 (75.1) 113 (68.9) 653 (66.2)
Multifocal 97 (41.6) 68 (30.5) 72 (39.6) 46 (24.9) 51 (31.1) 334 (33.8)
Missing 232 235 206 195 204 1072

Copyright © 2018, Healthcare Quality Improvement Partnership Ltd. (HQIP), National Oesophago-gastric Cancer Audit 2018. All rights reserved. 24
2.5 Treatment for HGD
Between 2012 and 2017, 86% of newly diagnosed cases of HGD were discussed at an upper gastrointestinal MDT meeting. This proportion has not changed over the five-year period (Table 2.4).
Two-thirds of patients diagnosed with HGD between 2012 and 2017 received endoscopic treatment (Table 2.4).
• The most common type of therapy was endoscopic resection, which accounted for three-quarters of initial endoscopic treatments. This proportion increased from 70% in 2012–13 to 80% in 2016–17 (p=0.008).
• Radiofrequency ablation (RFA) represented a fifth of treatments, declining from 27% to 19% (p=0.030). RFA was used more frequently in patients with flat mucosa than in those with lesions (41% versus 12%, p<0.001).
• Oesophagectomy (curative surgical resection) was the initial treatment modality for just 4% of patients. This may include patients with suspected cancers which could not be confirmed by biopsy (e.g. due to sampling issues), rather than cases of HGD.
• Other treatments (including photodynamic therapy, argon plasma coagulation and laser therapy) accounted for just 2% of endoscopic treatments.
In fit patients, multimodal therapy in the form of endoscopic resection followed by RFA every 3 months is recommended for complete eradication of dysplasia [Phoa et al 2016]. We explored the use of multimodal therapy among patients in the Audit using linked HES data on endoscopic procedures. These indicated that 30% of patients (217 of 721) who had endoscopic resection after diagnosis of HGD received RFA within 6 months. The median time from first resection to first RFA was 90 days (IQR 63 to 126).
Despite clinical guidelines recommending active treatment for HGD, 17% of all patients were placed on a surveillance regimen and 8% received no treatment. There have been some changes in these figures over time (Figure 2.1):
• Those receiving active treatment (endoscopic, surgical or other) increased from 70% to 75% (p=0.032).
• The proportion on surveillance declined from 27% in 2012-13 to 15% in 2016–17 (p<0.001). Among these patients, planned timing of next surveillance was within three months for 58% (the recommended interval [BSG 2014], and within six months for a further 30%.
• The proportion of patients receiving no treatment increased from 4% to 11%.
Patients placed on surveillance were on average older than those who received active treatment (mean age 74 versus 69 years, p<0.001), but these groups were similar in terms of reported comorbidities. Patients receiving no treatment were older on average than those receiving active treatment or surveillance (mean age 78 years), and were more likely to have at least one significant comorbidity (57% versus 35%, p<0.001).
The reason for surveillance or no treatment has been collected for the Audit since 2014 (Table 2.4). Lack of fitness was more frequently reported for patients receiving no treatment (65%) than for those placed on surveillance (48%). These findings indicate that patients on surveillance are distinct from those receiving no active treatment, with the latter group representing frailer patients for whom treatment (including surveillance) may be unsuitable.
Figure 2.1Proportion of patients with HGD receiving active treatment, surveillance or no active treatment in 2012–2017, by audit year
0% 10% 20% 30% 40% 50% 60% 70% 80% 90% 100%
2016–17
2015–16
2014–15
2013–14
2012–13
Percentage
Aud
it y
ear
Active treatment(endoscopic, surgical orother)
Surveillance
No active treatment

Copyright © 2018, Healthcare Quality Improvement Partnership Ltd. (HQIP), National Oesophago-gastric Cancer Audit 2018. All rights reserved. 25
Table 2.4Planned treatment for patients diagnosed with high-grade dysplasia in England, by year of diagnosis
2012–13 2013–14 2014–15 2015–16 2016–17 Total
Treatment plan agreed at MDT, n (%) 372 (85.7) 371 (87.5) 329 (85.7) 321 (84.5) 314 (85.3) 1707 (85.8)
Missing 31 34 4 0 0 69
Initial treatment modality, n (%)
Endoscopic treatment 288 (61.9) 282 (61.6) 262 (67.5) 271 (71.3) 236 (64.1) 1339 (65.0)
Curative surgical resection (oesophagectomy) 23 (05.0) 27 (05.9) 16 (04.1) 5 (01.3) 14 (03.8) 85 (04.1)
Surveillance 124 (26.7) 77 (16.8) 50 (12.9) 45 (11.8) 55 (15.0) 351 (17.1)
No treatment 17 (3.7) 35 (7.6) 34 (8.8) 41 (10.8) 39 (10.6) 166 (08.1)
Other – not specified 13 (02.8) 37 (08.1) 26 (06.7) 18 (04.7) 24 (06.5) 118 (05.7)
Type of endoscopic treatment, n (%) †
Endoscopic resection 201 (69.8) 213 (75.5) 200 (76.4) 225 (83.0) 188 (79.7) 1027 (76.7)
Radiofrequency ablation 77 (26.7) 62 (22.0) 60 (22.9) 43 (15.9) 46 (19.5) 288 (21.5)
Other endoscopic treatment 10 (03.5) 7 (02.4) 2 (00.8) 3 (01.1) 2 (00.8) 24 (01.8)
Reason for surveillance, n (%) * ‡
Patient choice NA NA 9 (69.2) 9 (47.4) 7 (43.8) 25 (52.1)
Patient unfit for endoscopic or surgical treatment 4 (30.8) 10 (52.6) 9 (56.3) 23 (47.9)
Missing 37 26 39 102
Reason for no treatment, n (%)* ‡
Patient choice NA NA 5 (26.3) 12 (42.9) 7 (28.0) 24 (33.3)
Patient unfit for endoscopic or surgical treatment 14 (73.7) 15 (53.6) 18 (72.0) 47 (65.3)
Lack of access to endoscopic or surgical treatment 0 1 (03.6) 0 1 (01.4)
Missing 15 13 14 42
Planned timing of next surveillance, n (%) * §
3 months or less NA NA 11 (52.4) 18 (64.3) 22 (56.4) 51 (58.0)
4–6 months 7 (33.3) 7 (25.0) 12 (30.8) 26 (29.5)
More than 6 months 3 (14.3) 3 (10.7) 5 (12.8) 11 (12.5)
Missing 29 17 16 62
*Data only routinely collected after 2014; † Among patients identified as having endoscopic treatment as initial treatment modality;
‡Among patients with surveillance or no active treatment as initial treatment modality;
§ Among patients with surveillance as initial treatment modality.
Variation in active treatment by Cancer Alliance
The proportion of patients receiving active treatment showed considerable variation across Cancer Alliances (Figure 2.2), ranging from 37% in Kent & Medway to 96% in North Central & East London. This variation may be explained in part by the referral of patients to centres in other areas for treatment. For example
• Kent & Medway Cancer Alliance made treatment plans for far fewer patients than they diagnosed (97 cases diagnosed, 38 treatment plans), indicating that they send a substantial proportion of patients to other areas for active treatment.
• North Central & East London Cancer Alliance made treatment plans for more than double the number of patients that they diagnosed, indicating that they treat a large number of patients diagnosed elsewhere.
However, referral to other regions does not appear to explain all of the observed variation. In particular, the proportion of patients receiving active treatment was only 49% in Peninsula despite the Alliance diagnosing and treating similar numbers of patients.

Copyright © 2018, Healthcare Quality Improvement Partnership Ltd. (HQIP), National Oesophago-gastric Cancer Audit 2018. All rights reserved. 26
Figure 2.2Proportion of patients with HGD receiving active treatment, surveillance or no treatment in 2012–2017, by Cancer Alliance of treatment plan
0% 10% 20% 30% 40% 50% 60% 70% 80% 90% 100%
West Yorkshire
West Midlands
West London
Wessex
Thames Valley
Surrey & Sussex
S Yorks., Bassetl. & N Derbys.
South East London
Somerset, Wilts., Av. & Gl.
Peninsula
North East & Cumbria
North Central & East London
Lancashire & South Cumbria
Kent & Medway
Humber, Coast & Vale
Greater Manchester
East England
East Midlands
Cheshire & Merseyside
Percentage of patients
Cancer Alliance
Active treatment(endoscopic, surgical or other)
Surveillance
No treatment
BSG guidelines recommend that endoscopic treatment should be performed in tertiary centres treating at least 15 patients with HGD each year. As described in previous Audit reports, few NHS trusts have met this annual volume of patients, and a similar pattern is observed in the most recent Audit year (2016–17), with just six NHS trusts reporting endoscopic treatment for 15 or more patients (range: 15 to 30 patients per trust) (Table 2.5).
Only one of these trusts treated this minimum number of patients in every year of data collection. Of the other 32 trusts that reported providing endoscopic treatment in 2016–17, the majority (75%) treated fewer than five patients. However, as described previously, low case ascertainment may lead to underestimation of the true number of procedures.
Table 2.5NHS trusts diagnosing and treating patients with HGD in England
Audit year
2012–13 2013–14 2014–15 2015–16 2016–17
Number of trusts diagnosing patients with HGD 105 110 105 104 95
Number of trusts treating patients with HGD* 76 79 79 71 60
Number of trusts providing endoscopic treatment for patients with HGD* 49 52 49 50 38
Number of trusts providing endoscopic treatment to ≥15 patients with HGD* 6 4 6 4 6
Average number of patients receiving endoscopic treatment per trust, median (IQR) 3 (1 to 6) 2.5 (1 to 7.5) 3 (1 to 9) 3 (1 to 7) 3 (1 to 6)* Numbers are based on the hospital of treatment plan, as recorded in Audit treatment record.
Copyright © 2018, Healthcare Quality Improvement Partnership Ltd. (HQIP), National Oesophago-gastric Cancer Audit 2018. All rights reserved. 27
Table 2.6Outcomes of endoscopic resection for patients with high-grade dysplasia in England
Outcome of endoscopic resection 2012–13 2013–14 2014–15 2015–16 2016–17 Total
Complete excision, n (%) 123 (66.9) 136 (66.7) 127 (72.6) 118 (63.4) 102 (66.2) 606 (67.1)
Missing 17 9 25 39 34 124
Post-treatment histology, n (%)
No evidence of HGD or carcinoma 23 (12.5) 25 (12.2) 25 (12.8) 32 (14.2) 37 (19.7) 142 (14.2)
HGD confirmed 97 (52.7) 115 (56.1) 107 (54.9) 127 (56.4) 102 (54.3) 548 (55.0)
Intramucosal carcinoma 50 (27.2) 50 (24.4) 54 (27.7) 52 (23.1) 45 (23.9) 251 (25.2)
Submucosal carcinoma 14 (07.6) 15 (07.3) 9 (04.6) 14 (06.2) 4 (02.1) 56 (05.6)
Missing 17 8 5 0 0 30
Treatment plan after incomplete excision, n (%)
Further EMR/ESD NA NA 8 (21.6) 12 (18.2) 15 (29.4) 35 (22.7)
Further ablative treatment 11 (29.7) 22 (33.3) 10 (19.6) 43 (27.9)
Refer for oesophagectomy 7 (18.9) 7 (10.6) 9 (17.7) 23 (14.9)
Surveillance 11 (29.7) 10 (15.2) 9 (17.7) 30 (19.5)
No further surveillance / treatment 0 15 (22.7) 8 (15.7) 23 (14.9)
Missing 11 2 1 14
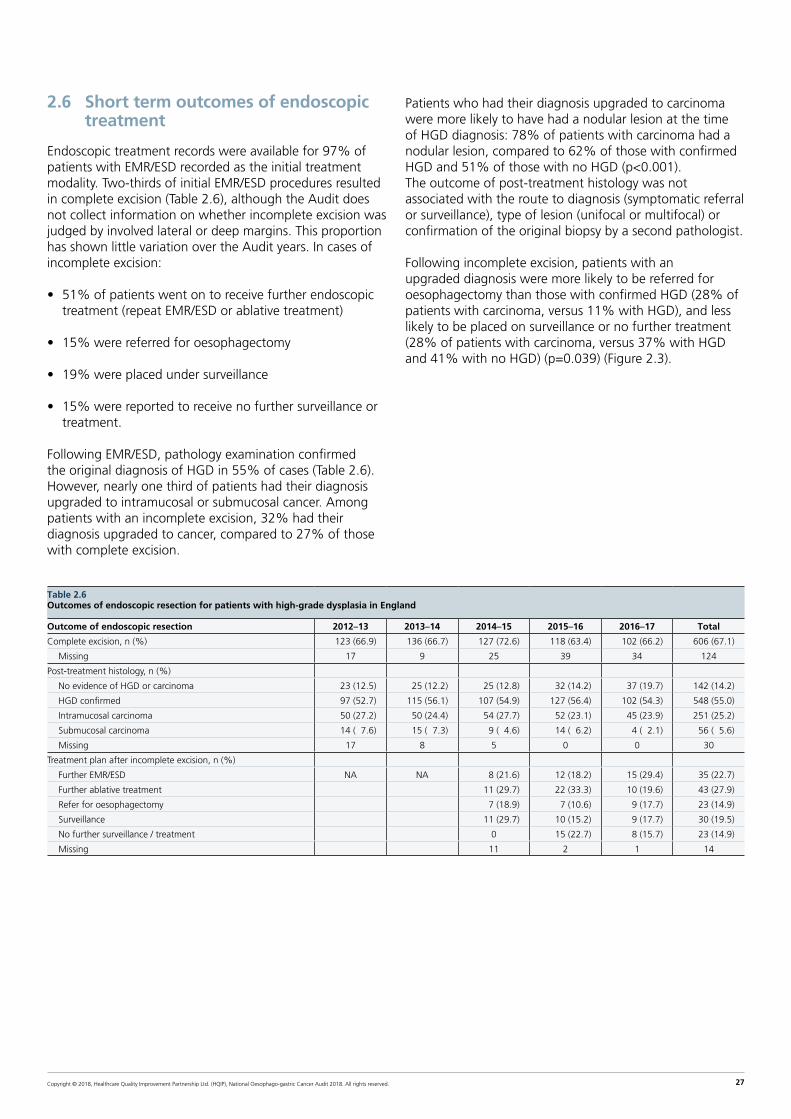
2.6 Short term outcomes of endoscopic treatment
Endoscopic treatment records were available for 97% of patients with EMR/ESD recorded as the initial treatment modality. Two-thirds of initial EMR/ESD procedures resulted in complete excision (Table 2.6), although the Audit does not collect information on whether incomplete excision was judged by involved lateral or deep margins. This proportion has shown little variation over the Audit years. In cases of incomplete excision:
• 51% of patients went on to receive further endoscopic treatment (repeat EMR/ESD or ablative treatment)
• 15% were referred for oesophagectomy
• 19% were placed under surveillance
• 15% were reported to receive no further surveillance or treatment.
Following EMR/ESD, pathology examination confirmed the original diagnosis of HGD in 55% of cases (Table 2.6). However, nearly one third of patients had their diagnosis upgraded to intramucosal or submucosal cancer. Among patients with an incomplete excision, 32% had their diagnosis upgraded to cancer, compared to 27% of those with complete excision.
Patients who had their diagnosis upgraded to carcinoma were more likely to have had a nodular lesion at the time of HGD diagnosis: 78% of patients with carcinoma had a nodular lesion, compared to 62% of those with confirmed HGD and 51% of those with no HGD (p<0.001). The outcome of post-treatment histology was not associated with the route to diagnosis (symptomatic referral or surveillance), type of lesion (unifocal or multifocal) or confirmation of the original biopsy by a second pathologist.
Following incomplete excision, patients with an upgraded diagnosis were more likely to be referred for oesophagectomy than those with confirmed HGD (28% of patients with carcinoma, versus 11% with HGD), and less likely to be placed on surveillance or no further treatment (28% of patients with carcinoma, versus 37% with HGD and 41% with no HGD) (p=0.039) (Figure 2.3).

Copyright © 2018, Healthcare Quality Improvement Partnership Ltd. (HQIP), National Oesophago-gastric Cancer Audit 2018. All rights reserved. 28
Figure 2.3Treatment plan following EMR/ESD resulting in incomplete excision, by outcome of post-treatment histology
0 10 20 30 40 50 60 70 80 90 100
No evidenceof HGD orcarcinoma
HGD confirmed
Carcinoma
Number of patients
Out
com
e of
pos
t-tr
eatm
ent
hist
olog
y
Further endoscopictreatment
Referred foroesophagectomy
Surveillance or no furthertreatment
2.7 Outcomes of HGD surveillance
We investigated the longer-term outcomes of HGD patients who were initially placed on surveillance between 1 April 2012 and 31 March 2016 by using the Audit-HES linked dataset. The HES data were used to describe the sequence of endoscopic procedures of the oesophagus around the time of diagnosis and in the subsequent year. These procedures were categorised as diagnostic or therapeutic (ablation, resection or other treatment). Relevant procedures were identified using OPCS surgical procedure codes recorded in HES (see Annex 2 for full list of codes).
The HES data were also used to identify patients who had a diagnosis of oesophageal cancer recorded in hospital admissions within a year of their HGD diagnosis. We included ICD-10 codes for cancers of the oesophagus (C15x), gastro-oesophageal junction GOJ (C16.0) or unspecified gastric cancers (C16.9, which may include cancers of the GOJ). We excluded patients whose initial treatment modality was recorded as surgery (oesophagectomy) in their audit records because these are likely to include cases of suspected cancer that could not be confirmed at biopsy.
Endoscopic procedures
Linked data were available for 384 HGD patients whose initial treatment plan was identified as surveillance (n=278; 72%) or no active treatment (n=106; 28%). Of these, 9% had a treatment record in the Audit indicating that they underwent endoscopic resection at a later time (Table 2.7). This demonstrates that treatment plans can change over time as patient preference and/or fitness change.
Among patients whose initial treatment plan was identified as surveillance:
• 74% had a diagnostic endoscopic procedure recorded in HES within a year of diagnosis.
• A quarter of patients had a therapeutic endoscopic procedure, more than double the number who had a treatment record in the Audit. The median time from HGD biopsy to the first therapeutic endoscopic procedure was 104 days.
• A fifth of patients had no recorded diagnostic or therapeutic endoscopic procedure. It is not clear whether this is due to coding uncertainties in HES, patients receiving treatment in the private sector, or if patients did not undergo surveillance as originally planned.
Among patients identified as receiving no active treatment, two-thirds underwent a diagnostic or therapeutic endoscopic procedure within the first year after diagnosis. The median time to the first therapeutic procedure was 109 days.

Copyright © 2018, Healthcare Quality Improvement Partnership Ltd. (HQIP), National Oesophago-gastric Cancer Audit 2018. All rights reserved. 29
Figure 2.4Diagnoses of oesophageal and junctional cancer within one year of high-grade dysplasia biopsy among patients diagnosed with high-grade dysplasia between April 2012 and March 2016
Table 2.7Endoscopic procedures of the oesophagus identified in HES during the first year after diagnosis of high-grade dysplasia, among patients diagnosed 2012–16, by initial treatment modality
Planned treatment modality
Surveillance No treatment Endoscopic treatment
N patients 278 106 1092
Endoscopic treatment record in Audit, n (%) 30 (10.8) 5 (04.7) 857 (78.5)
Records in HES
Diagnostic endoscopic procedure, n (%) 205 (73.7) 66 (62.3) 870 (79.7)
Therapeutic endoscopic procedure, n (%) 71 (25.5) 16 (15.1) 962 (88.1)
Any endoscopic procedure (diagnostic or therapeutic), n (%) 216 (77.7) 70 (66.0) 1077 (98.6)
Average number of endoscopic procedures per patient during first year after diagnosis, median (IQR) 2 (1 to 3) 2 (1 to 2) 3 (2 to 4)
Time from HGD biopsy to first therapeutic endoscopic procedure in HES (days), median (IQR) 104 (34 to 194) 109 (69 to 169) 72 (42 to 118)
Diagnosis of cancer n=81 (27%)
Diagnosis of cancer n=42 (33%)
Diagnosis of cancer n=363 (30%) 62
68
58
Cancer diagnoses
Linked data were available for 1,620 patients diagnosed with HGD between April 2012 and March 2016, of whom 74% of patients received active (endoscopic) treatment.
Overall, the proportion of patients who had a diagnosis of oesophageal or GOJ cancer within one year of HGD diagnosis was 30%. This proportion was similar across treatment modalities: 30% in the active treatment group, 27% in the surveillance group, and 33% in the no treatment group (Figure 2.4). The median time from the date of HGD diagnosis to cancer diagnosis was 62.5 days (IQR 20 to 135), and did not vary greatly by treatment modality. Excluding cases of unspecified gastric cancers (C16.9) led to a small reduction in the proportion of cancer diagnoses (from 30% to 28%), but the distribution of cases by treatment modality and time to diagnosis remained unchanged.
The similar proportions of patients with cancer diagnoses across treatment groups suggest that patients undergoing surveillance or no treatment are being reviewed sufficiently to identify incident cancers. Nonetheless, the high proportion of patients who were diagnosed with cancer within a year of HGD diagnosis supports the BSG recommendation of endoscopic treatment as the preferred option for HGD.
SurveillanceN=296 (18%)
No treatmentN=127 (8%)
Active treatmentN=1197 (74%)
Diagnosis of cancer in NOGCA
n=183
Diagnosis of cancer in HES not in NOGCA
n=180
Median time to cancer diagnosis, days
Initial diagnosis of HGDN=1620
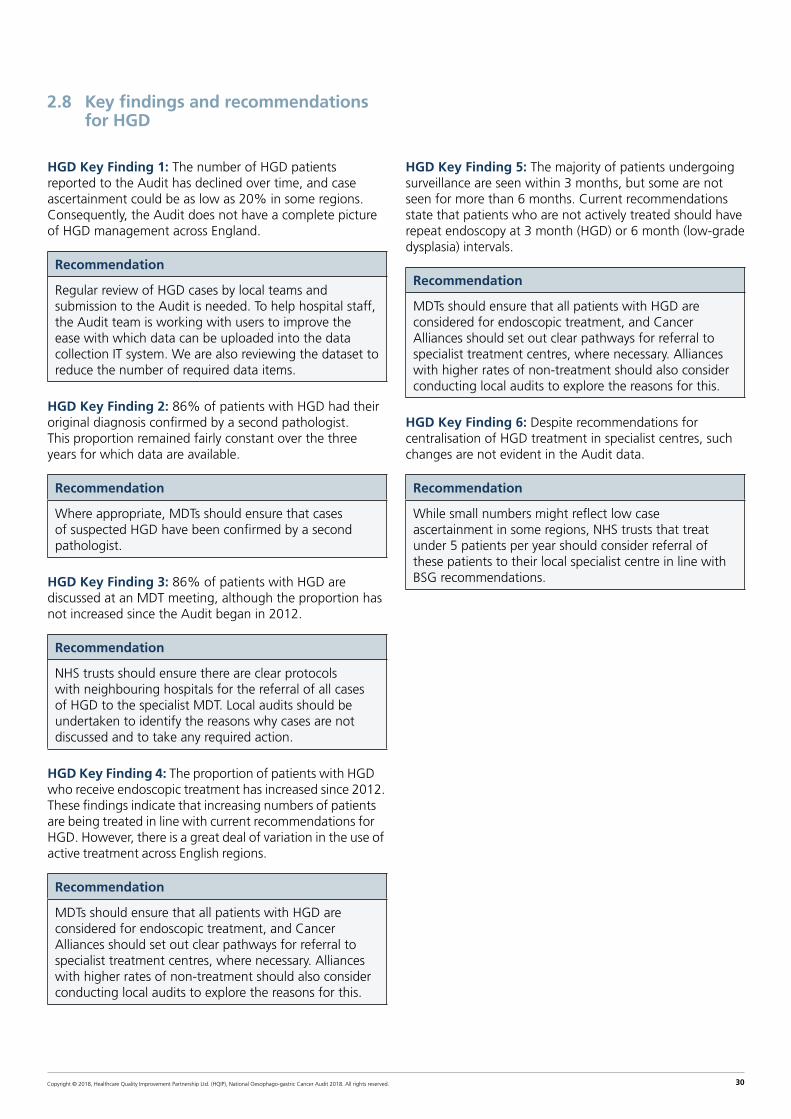
Copyright © 2018, Healthcare Quality Improvement Partnership Ltd. (HQIP), National Oesophago-gastric Cancer Audit 2018. All rights reserved. 30
2.8 Key findings and recommendations for HGD
HGD Key Finding 1: The number of HGD patients reported to the Audit has declined over time, and case ascertainment could be as low as 20% in some regions. Consequently, the Audit does not have a complete picture of HGD management across England.
Recommendation
Regular review of HGD cases by local teams and submission to the Audit is needed. To help hospital staff, the Audit team is working with users to improve the ease with which data can be uploaded into the data collection IT system. We are also reviewing the dataset to reduce the number of required data items.
HGD Key Finding 2: 86% of patients with HGD had their original diagnosis confirmed by a second pathologist. This proportion remained fairly constant over the three years for which data are available.
Recommendation
Where appropriate, MDTs should ensure that cases of suspected HGD have been confirmed by a second pathologist.
HGD Key Finding 3: 86% of patients with HGD are discussed at an MDT meeting, although the proportion has not increased since the Audit began in 2012.
Recommendation
NHS trusts should ensure there are clear protocols with neighbouring hospitals for the referral of all cases of HGD to the specialist MDT. Local audits should be undertaken to identify the reasons why cases are not discussed and to take any required action.
HGD Key Finding 4: The proportion of patients with HGD who receive endoscopic treatment has increased since 2012. These findings indicate that increasing numbers of patients are being treated in line with current recommendations for HGD. However, there is a great deal of variation in the use of active treatment across English regions.
Recommendation
MDTs should ensure that all patients with HGD are considered for endoscopic treatment, and Cancer Alliances should set out clear pathways for referral to specialist treatment centres, where necessary. Alliances with higher rates of non-treatment should also consider conducting local audits to explore the reasons for this.
HGD Key Finding 5: The majority of patients undergoing surveillance are seen within 3 months, but some are not seen for more than 6 months. Current recommendations state that patients who are not actively treated should have repeat endoscopy at 3 month (HGD) or 6 month (low-grade dysplasia) intervals.
Recommendation
MDTs should ensure that all patients with HGD are considered for endoscopic treatment, and Cancer Alliances should set out clear pathways for referral to specialist treatment centres, where necessary. Alliances with higher rates of non-treatment should also consider conducting local audits to explore the reasons for this.
HGD Key Finding 6: Despite recommendations for centralisation of HGD treatment in specialist centres, such changes are not evident in the Audit data.
Recommendation
While small numbers might reflect low case ascertainment in some regions, NHS trusts that treat under 5 patients per year should consider referral of these patients to their local specialist centre in line with BSG recommendations.
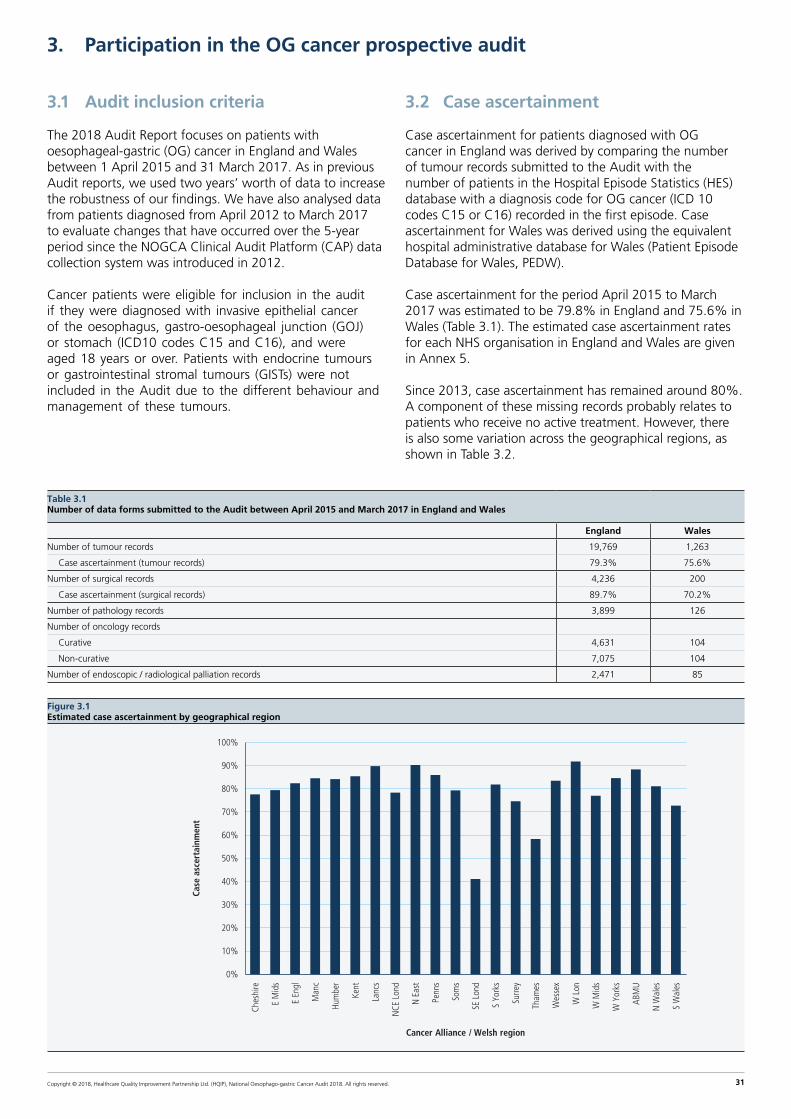
Copyright © 2018, Healthcare Quality Improvement Partnership Ltd. (HQIP), National Oesophago-gastric Cancer Audit 2018. All rights reserved. 31
3. Participation in the OG cancer prospective audit
3.1 Audit inclusion criteria
The 2018 Audit Report focuses on patients with oesophageal-gastric (OG) cancer in England and Wales between 1 April 2015 and 31 March 2017. As in previous Audit reports, we used two years’ worth of data to increase the robustness of our findings. We have also analysed data from patients diagnosed from April 2012 to March 2017 to evaluate changes that have occurred over the 5-year period since the NOGCA Clinical Audit Platform (CAP) data collection system was introduced in 2012.
Cancer patients were eligible for inclusion in the audit if they were diagnosed with invasive epithelial cancer of the oesophagus, gastro-oesophageal junction (GOJ) or stomach (ICD10 codes C15 and C16), and were aged 18 years or over. Patients with endocrine tumours or gastrointestinal stromal tumours (GISTs) were not included in the Audit due to the different behaviour and management of these tumours.
3.2 Case ascertainment
Case ascertainment for patients diagnosed with OG cancer in England was derived by comparing the number of tumour records submitted to the Audit with the number of patients in the Hospital Episode Statistics (HES) database with a diagnosis code for OG cancer (ICD 10 codes C15 or C16) recorded in the first episode. Case ascertainment for Wales was derived using the equivalent hospital administrative database for Wales (Patient Episode Database for Wales, PEDW).
Case ascertainment for the period April 2015 to March 2017 was estimated to be 79.8% in England and 75.6% in Wales (Table 3.1). The estimated case ascertainment rates for each NHS organisation in England and Wales are given in Annex 5.
Since 2013, case ascertainment has remained around 80%. A component of these missing records probably relates to patients who receive no active treatment. However, there is also some variation across the geographical regions, as shown in Table 3.2.
Table 3.1 Number of data forms submitted to the Audit between April 2015 and March 2017 in England and Wales
England Wales
Number of tumour records 19,769 1,263
Case ascertainment (tumour records) 79.3% 75.6%
Number of surgical records 4,236 200
Case ascertainment (surgical records) 89.7% 70.2%
Number of pathology records 3,899 126
Number of oncology records
Curative 4,631 104
Non-curative 7,075 104
Number of endoscopic / radiological palliation records 2,471 85
Figure 3.1Estimated case ascertainment by geographical region
0%
10%
20%
30%
40%
50%
60%
70%
80%
90%
100%
Ches
hire
E M
ids
E En
gl
Man
c
Hum
ber
Kent
Lanc
s
NCE
Lon
d
N E
ast
Penn
s
Som
s
SE L
ond
S Yo
rks
Surre
y
Tham
es
Wes
sex
W L
on
W M
ids
W Y
orks
ABM
U
N W
ales
S W
ales
Cancer Alliance / Welsh region
Case
asc
erta
inm
ent
Copyright © 2018, Healthcare Quality Improvement Partnership Ltd. (HQIP), National Oesophago-gastric Cancer Audit 2018. All rights reserved. 32
3.3 Completeness of submitted surgical records
Annex 6 describes the number of surgical / pathology records and the quality of the data items used to derive the surgical indicators. Excellent data quality on surgical treatment is important because the Audit figures are used to produce consultant-level outcomes as part of the COP initiative as well as to describe organisational performance. In addition, the suite of outcome indicators for curative surgery relies on information in the pathology records. It is important that Cancer Centres ensure they return all pathology records associated with patients undergoing curative surgery as well as the surgical record.
Overall, completeness of surgical records after the second submission deadline was 89.7% in England, a decrease from the 95.7% reported last year. Completeness of surgical records for Wales was 70.2%, compared to 89.3% last year. The fall in completeness is concerning and needs to be examined locally.
3.4 Key findings and recommendations
OGC Key Finding 1: Case ascertainment has not changed significantly over time, but completeness of surgical records has decreased from last year.
Recommendation
NHS trusts and local health boards should continue to upload tumour records and surgical records in a timely manner. Where a patient has treatment in a cancer centre, it is important that data collection is coordinated between the diagnosing hospital and the specialist cancer centre so that tumour records and treatment records are not missed.

Copyright © 2018, Healthcare Quality Improvement Partnership Ltd. (HQIP), National Oesophago-gastric Cancer Audit 2018. All rights reserved. 33
4. Patients with OG cancer
The characteristics of patients diagnosed with OG cancer between 1 April 2015 and 31 March 2017 have stayed relatively stable over time. The disease predominantly affects older people and occurs more frequently in men rather than women (see Table 4.1).
There was a steady shift in the relative distribution of oesophageal and stomach cancer, with oesophageal tumours (upper, middle and lower oesophagus) accounting for a greater proportion in the last five years, rising from 51.7% in 2012/13 to 60.1% in 2016/17 (see Figure 4.1). This shift reflects changes in the prevalence of risk factors (notably rising levels of obesity contributing to increased rates of oesophageal cancer, and reductions in H. pylori infections leading to fewer cases of gastric cancer [Cancer Research UK, 2018b]).
Figure 4.1Oesophageal tumours as a proportion of OG cancers from audit year 2012/13 to 2016/17
51.7% 54.0% 56.0% 56.5%60.1%
0%
10%
20%
30%
40%
50%
60%
70%
80%
90%
100%
2012–13 2013–14 2014–15 2015–16 2016–17
Audit year
Oes
opha
geal
tum
ours
as
% o
f OG
can
cers
Table 4.1Summary of patient characteristics by type of OG tumour in England and Wales
Oes SCC Oes ACA upper / mid Oes ACA lower / SI GOJ SII/SIII Stomach
Number of patients (%) 4422 (21.0) 1360 (6.5) 7553 (35.9) 2225 (10.6) 5472 (26.0)
Proportion of patients who are male 50% 69% 81% 77% 64%
Median age (years) of men 70 72 70 70 75
Median age (years) of women 74 77 74 72.5 76
Performance status (%)
0 30.9 31.8 37.4 37.2 29.2
1 34.6 33.4 34.6 34.5 31.9
2 20.3 18.6 16.6 15.8 20.8
≥3 14.1 16.1 11.4 12.5 18.2
Comorbidities (%)
0 comorbidities 58.3 58.2 55.4 55.4 55.3
1 comorbidities 26.1 25.7 25.7 26.6 26.2
≥2 comorbidities 15.6 16.2 18.9 18.1 18.5
KEY: Oes – oesophageal, SCC – squamous cell carcinoma, ACA – adenocarcinoma, GOJ – gastro-oesophageal junction
Tumours of the GOJ are described using the Siewert classification [Siewert et al 1996]:
I. Adenocarcinoma of the distal oesophagus, the centre of which is within 2-5cm proximal to the anatomical cardia. It may infiltrate the gastro-oesophageal junction from above.
II. True junctional adenocarcinoma, the centre of which is within 2cm above or below of the anatomical cardia.
III. Subcardial gastric adenocarcinoma the centre of which is within the 5cm distal to the anatomical cardia. It may infiltrate the gastro-oesophageal junction from below.

Copyright © 2018, Healthcare Quality Improvement Partnership Ltd. (HQIP), National Oesophago-gastric Cancer Audit 2018. All rights reserved. 34
With the launch of the national “Be Clear on Cancer” campaign in 2015 to raise awareness of the risk factors and early symptoms of OG cancer [Cancer Research UK, 2018b], we assessed whether there had been any changes in the stage of cancer upon presentation. The proportion of patients with early-stage cancer did not change significantly from April 2012 to March 2017, or before and after the launch of the campaign in 2015 (Figure 4.2).
Figure 4.2Proportion of patients diagnosed with stage 0/1 OG cancer (clinical TNM) by Audit year, from April 2012 to March 2017 in England and Wales
11.5% 11.6% 11.7%12.7%
12.1%
0%
2%
4%
6%
8%
10%
12%
14%
16%
18%
20%
2012–13 2013–14 2014–15 2015–16 2016–17
Audit year
% p
atie
nts
diag
nose
d w
ith s
tage
0/1
can
cer

Copyright © 2018, Healthcare Quality Improvement Partnership Ltd. (HQIP), National Oesophago-gastric Cancer Audit 2018. All rights reserved. 35
5. Patterns of care at diagnosis
5.1 Route to diagnosis
Patients can be diagnosed with OG cancer after following a number of different pathways. Typically, an individual may present to their general practitioner (GP) with symptoms that suggest cancer might be a potential cause, and guidelines recommend that GPs refer patients as early as possible [Allum et al 2011]. However, it is also possible that diagnosis occurs after an emergency admission, following referral by another hospital consultant from a non-emergency setting, or as a result of a surveillance gastroscopy. Of these, services are recommended to monitor and seek ways to reduce the chance of patients being diagnosed after emergency admission as these patients are more likely to have late stage disease and, consequently, are less likely to undergo curative therapies than those diagnosed via other routes [Palser et al 2009, 2010].
The routes to diagnosis for the 2015–2017 Audit cohort are summarised in (Table 5.1). The majority of patients (65.6%) were diagnosed following referral by their GP. Of those patients who were referred by their GP, 78.1% were referred on the “two-week wait” suspected cancer pathway.
Table 5.1 Routes to diagnosis among OG cancer patients diagnosed between April 2015 and March 2017 in England and Wales
Route to diagnosis No. of patients %
Emergency admission 2,740 13.3
GP referral* 13,522 65.6
Other hospital consultant 4,022 19.5
Open access endoscopy 0,202 1.0
Barrett’s surveillance 0,126 0.6
Total 21,032
Missing 0,420
*Priority of GP referral
Routine 1,339 9.9
Urgent 1,597 11.9
Two week wait 10,462 78.1
Missing 0,124
The proportion of patients diagnosed after emergency admission was 13.3% in the current cohort, a slight decrease from the 13.7% published in last year’s report. Similar to last year, there was variation in emergency diagnoses by Cancer Alliance / Welsh region (Figure 5.1). Some Alliances have emergency diagnosis rates that are significantly lower than the national average, while others have rates that are much higher. Regional variation may be due to a combination of patient characteristics (such as deprivation) and practitioner factors (such as rate of referral for endoscopy).
The proportion of emergency diagnoses by NHS trust / local health board is given in Annex 7.

Copyright © 2018, Healthcare Quality Improvement Partnership Ltd. (HQIP), National Oesophago-gastric Cancer Audit 2018. All rights reserved. 36
Figure 5.1 Proportion of patients diagnosed with OG cancer following emergency admission between April 2015 and March 2017, by Cancer Alliance/Welsh region
0%
5%
10%
15%
20%
25%
30%
0
1000
2000
3000
4000
5000
6000
Ches
hire
E M
ids
E En
gl
Man
c
Hum
ber
Kent
Lanc
s
NCE
Lon
d
N E
ast
Penn
s
Som
s
SE L
ond
S Yo
rks
Surre
y
Tham
es
Wes
sex
W L
on
W M
ids
W Y
orks
ABM
U
N W
ales
S W
ales
% p
atie
nts
diag
nose
d af
ter
emer
genc
y ad
mis
sion
Cancer Alliance / Welsh region
Num
ber
of p
atie
nts
No of patients in canceralliance/region
National % emergencyadmissions
% emergency admission
Over the five years since 2012, the rate of diagnosis after emergency admissions has not changed greatly nationally in England and Wales from year to year, fluctuating between 13% and 14%. The large regional variations have also been stubborn in their persistence.
5.2 Times from diagnosis to the start of treatment
The NOGCA dataset captures four key dates along the patient pathway:
In the 2017 Audit Report, for the first time we reported on time from diagnosis to first treatment for different treatment modalities across the various geographical regions. We provide similar figures in this report but have expanded the waiting times to include more key points in the patient pathway.
Among patients in the 2015–2017 cohort (Table 5.2):
• Patients who had surgery alone had the longest median waiting times at all key points in the pathway.
• Patients who had palliative endoscopic/radiological treatment had the shortest waiting times, which might reflect the need for rapid treatment to alleviate symptoms.
• Half of patients receiving neoadjuvant treatment/palliative oncology had treatment within 2 months of referral.
Date of first treatment
Referral date
Diagnosis date
Date of MDT meeting

Copyright © 2018, Healthcare Quality Improvement Partnership Ltd. (HQIP), National Oesophago-gastric Cancer Audit 2018. All rights reserved. 37
Table 5.2:Waiting times between key dates in the patient pathway by treatment modality in England and Wales (patients diagnosed between April 2015 and March 2017). Figures provide median and the limits of the interquartile range
Modality No. of patients Time from referral to diagnosis
Time from diagnosis to MDT
Time from MDT to first treatment
Time from referral to first treatment
Surgery only 972 18 (6,39) 28 (10,47) 29 (16,53.5) 94 (63,144)
Neo adjuvant treatment 1748 14 (7,24) 27 (14,38) 20 (12,32) 62 (55, 81)
Palliative oncology 4624 14 (8,25) 14 (06,28) 24 (15,38) 61 (48, 87)
Palliative endoscopic / radiological 2114 14 (7,24) 12 (04,23) 12 (04,54) 50.5 (30,112)NB: Reported on patients with complete treatment records
Among the Cancer Alliance / Welsh regions, most had similar distributions of waiting times for palliative oncology (Figure 5.4) and palliative endoscopic/radiological treatment (Figure 5.5), with median waits close to the national average.
However, there was considerable variation in waiting times for patients who had curative surgery (Figure 5.2).
Figure 5.2Waiting time from referral to surgery for patients diagnosed between April 2015 and March 2017 in England and Wales
0
50
100
150
200
250
Ches
hire
E M
ids
E En
gl
Man
c
Hum
ber
Kent
Lanc
s
NCE
Lon
d
N E
ast
Penn
s
Som
s
SE L
ond
S Yo
rks
Surre
y
Tham
es
Wes
sex
W L
on
W M
ids
W Y
orks
N W
ales
S W
ales
Med
ian
wai
ting
tim
es
Cancer Alliance / Welsh region
Figure 5.3Waiting time from referral to first neoadjuvant treatment for patients diagnosed between April 2015 and March 2017 in England and Wales
0
10
20
30
40
50
60
70
80
90
100
Ches
hire
E M
ids
E En
gl
Man
c
Hum
ber
Kent
Lanc
s
NCE
Lon
d
N E
ast
Penn
s
Som
s
SE L
ond
S Yo
rks
Surre
y
Tham
es
Wes
sex
W L
on
W M
ids
W Y
orks
N W
ales
Med
ian
wai
ting
tim
e
Cancer Alliance / Welsh region

Copyright © 2018, Healthcare Quality Improvement Partnership Ltd. (HQIP), National Oesophago-gastric Cancer Audit 2018. All rights reserved. 38
Figure 5.4Waiting time from referral to first palliative oncology treatment for patients diagnosed between April 2015 and March 2017 in England and Wales
0
20
40
60
80
100
120
140
Ches
hire
E M
ids
E En
gl
Man
c
Hum
ber
Kent
Lanc
s
NCE
Lon
d
N E
ast
Penn
s
Som
s
S Yo
rks
Surre
y
Tham
es
Wes
sex
W L
on
W M
ids
W Y
orks
N W
ales
S W
ales
ABM
U
Med
ian
wai
ting
tim
e (d
ays)
Cancer Alliance / Welsh region
Figure 5.5Waiting time from referral to first palliative endoscopic/radiological treatment for patients diagnosed between April 2015 to March 2017 in England and Wales
0
20
40
60
80
100
120
140
160
180
200
Ches
hire
E M
ids
E En
gl
Man
c
Hum
ber
Kent
Lanc
s
NCE
Lon
d
N E
ast
Penn
s
Som
s
S Yo
rks
Surre
y
Tham
es
Wes
sex
W L
on
W M
ids
W Y
orks
N W
ales
S W
ales
Med
ian
wai
ting
tim
e (d
ays)
Cancer Alliance / Welsh region
Copyright © 2018, Healthcare Quality Improvement Partnership Ltd. (HQIP), National Oesophago-gastric Cancer Audit 2018. All rights reserved. 39
5.3 Key findings and recommendations
OGC Key Finding 2: There was substantial variation in emergency diagnoses by Cancer Alliance / Welsh region (ranging from 5% to 22%), likely due to a combination of patient characteristics and practitioner factors. The rate of emergency diagnoses has remained unchanged over the past five years, and regional variations also persisted over time.
Recommendation
Commissioners, GP practices and NHS trusts / local health boards need to explore ways to improve rates of early diagnosis and, in particular, investigate the reasons for high rates of diagnosis after emergency admission.
OGC Key Finding 3: Waiting for treatment can be an anxious time for patients. Some patients may not receive treatment until several months after referral.
Recommendation
Together with commissioners, MDTs should review waiting times through the care pathways and discuss ways to improve the progression of patients from diagnosis through to staging and treatment.

Copyright © 2018, Healthcare Quality Improvement Partnership Ltd. (HQIP), National Oesophago-gastric Cancer Audit 2018. All rights reserved. 40
6. Staging investigations
Patients with a new diagnosis of OG cancer should undergo appropriate staging investigations to determine whether the disease is potentially amenable to curative therapy. All patients diagnosed with OG cancer are recommended to have an initial CT scan to assess the spread of disease and look for evidence of metastatic disease. If the cancer is localised and the patient is suitable for curative treatment, further staging investigations are done to determine the location and stage of cancer.
The Audit collects information on whether an initial CT scan was performed and the subsequent use of endoscopic ultrasound (EUS), staging laparoscopy, PET/PET-CT scan and other staging investigations.
For patients diagnosed between April 2015 and March 2017, the quality of the data on staging investigations submitted to the Audit varied across NHS organisations.
To prevent data from hospitals with poor levels of data submission adversely affecting the results, we excluded from the analysis those organisations which had a disproportionately low proportion of CT scans (less than 50% of patients) and those that reported no patients with a curative treatment intent having either an EUS (oesophageal tumours) or laparoscopy (gastric tumours).
The proportion of patients who had CT scans in the 2015–2017 cohort was 89.5% overall. There was a small increase in the proportion of patients who had a CT scan over the past 5 years, from 86.3% in 2012/13 to 89.9% in 2016/17 (Figure 6.1). The proportion of patients recorded as having a CT scan was consistently high among most patient groups, but decreased among patients with a performance status of 3 or 4, or who were older than 80 years when diagnosed. The proportion of patients who underwent a CT scan by NHS trust / local health board is given in Annex 8.
Box 2Recommended staging investigations for patients with oesophago-gastric cancer
Recommended staging investigations for oesophageal and gastric cancer [Allum 2011]
• CT scan of chest/abdomen and pelvis to provide an initial assessment, and look for evidence of metastatic spread.
• Endoscopic resection, if there is evidence of T1 disease or nodular high-grade dysplasia, to assess the depth of tumour invasion.
• Endoscopic ultrasound (EUS) for oesophageal, gastro-oesophageal junction (GOJ) and selected gastric cancers to provide more accurate assessment of T-stage and look for evidence of local nodal involvement. The addition of fine-needle aspiration may further improve the diagnostic accuracy.
• Positron emission tomography (PET)-CT to assess for evidence of more distant nodal disease.
• Laparoscopy for all gastric cancers and selected lower oesophageal and GOJ tumours. This allows direct visualisation for low volume hepatic and peritoneal metastases, and assessment of the degree of local spread.

Copyright © 2018, Healthcare Quality Improvement Partnership Ltd. (HQIP), National Oesophago-gastric Cancer Audit 2018. All rights reserved. 41
Figure 6.1Proportion of OG cancer patients who had initial CT scan, by Audit year
75%
80%
85%
90%
95%
100%
2012–13 2013–14 2014–15 2015–16 2016–17
Audit Year
% p
atie
nts
who
had
initi
al C
T sc
an
Figure 6.2Proportion of oesophageal cancer patients with curative treatment intent who had endoscopic ultrasound (EUS) and Positron Emission Tomography (PET), by Audit year
0%
10%
20%
30%
40%
50%
60%
70%
80%
90%
2012–13 2013–14 2014–15 2015–16 2016–17
Audit year
% p
atie
nts
EUS
PET
Among patients with oesophageal cancer who had a curative treatment plan, approximately half were recorded to have EUS, with this falling slightly from 50.5% in 2012/13 to 46.1% in 2016/17. Over the same period, the use of PET for patients with oesophageal cancer increased from 63.2% to 71.0% (Figure 6.2). The changing patterns in the use of EUS and PET reflect the changing clinical evidence on the effectiveness of each procedure. Recent NICE guidance recommends that PET should be offered
to people with oesophageal tumours that are suitable for radical treatment, and EUS should only be offered if it helps guide ongoing management [NICE 2018]. However, there was variation in the recorded use of EUS and PET across the Cancer Alliances and Welsh regions (Figure 6.3).
There was little change in the proportion of patients with gastric cancer recorded as having staging laparoscopy, remaining around 50% over the five year period (Figure 6.4).
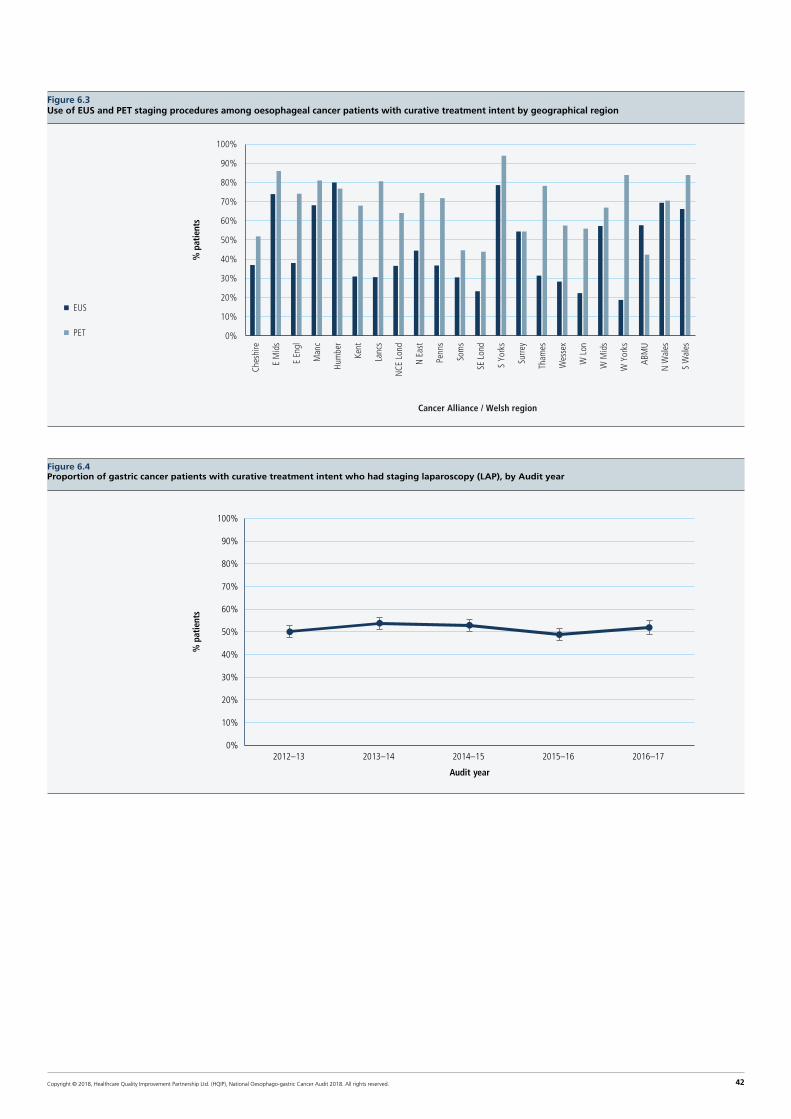
Copyright © 2018, Healthcare Quality Improvement Partnership Ltd. (HQIP), National Oesophago-gastric Cancer Audit 2018. All rights reserved. 42
Figure 6.3Use of EUS and PET staging procedures among oesophageal cancer patients with curative treatment intent by geographical region
0%
10%
20%
30%
40%
50%
60%
70%
80%
90%
100%
Ches
hire
E M
ids
E En
gl
Man
c
Hum
ber
Kent
Lanc
s
NCE
Lon
d
N E
ast
Penn
s
Som
s
SE L
ond
S Yo
rks
Surre
y
Tham
es
Wes
sex
W L
on
W M
ids
W Y
orks
ABM
U
N W
ales
S W
ales
EUS
Cancer Alliance / Welsh region
PET
% p
atie
nts
Figure 6.4Proportion of gastric cancer patients with curative treatment intent who had staging laparoscopy (LAP), by Audit year
0%
10%
20%
30%
40%
50%
60%
70%
80%
90%
100%
2012–13 2013–14 2014–15 2015–16 2016–17
Audit year
% p
atie
nts

Copyright © 2018, Healthcare Quality Improvement Partnership Ltd. (HQIP), National Oesophago-gastric Cancer Audit 2018. All rights reserved. 43
6.1 Key findings and recommendations
OGC Key Finding 4: UK guidelines recommend that all patients with a new diagnosis of OG cancer have a staging CT scan. There has been a small increase in the recording of CT scans from April 2012 to March 2017, and patterns of use are consistent overall with current NICE guidance.
Recommendation
NHS trusts / local health boards should examine their use of staging investigations and the submission of data about these investigations where their use is reported to be low. This may require better coordination between MDT team members and data mangers in the NHS trust / local health board so that complete information is submitted to the Audit.
OGC Key Finding 5: Among patients with oesophageal cancer, the recorded use of EUS has decreased and PET has increased over the same period, which reflects changes in the evidence on the effectiveness of PET scans [Findlay et al 2015] as well as their availability. Nonetheless, there is considerable variation in the recorded use of EUS and PET across the regions. This might reflect different local protocols on how EUS and PET are used given the extent of disease identified by the CT scan.
Recommendation
MDTs should ensure that all OG cancers are appropriately staged according to national recommendations; in particular, MDTs should ensure that patients with oesophageal cancer being considered for radical treatment have a PET-CT scan. MDTs should also ensure that staging laparoscopy is used in appropriate cases.

Copyright © 2018, Healthcare Quality Improvement Partnership Ltd. (HQIP), National Oesophago-gastric Cancer Audit 2018. All rights reserved. 44
7. Treatment planning
Following preliminary staging investigations, the treatment options available for a patient with OG cancer are discussed by the upper gastrointestinal (GI) multidisciplinary team (MDT), which typically includes a gastroenterologist, a surgeon, a pathologist and a radiologist. Treatment decisions take account of both disease stage and patient factors such as comorbidities, general fitness and nutritional status, and patient preference.
Curative treatment options for OG cancer include surgery, oncological therapy (alone or in combination with surgery) and endoscopic therapy:
• Surgery with or without oncological treatment is recommended if there is evidence of the tumour invading deeper than the most superficial submucosal layer as there is a higher risk of lymphatic spread. The use of neoadjuvant oncology and curative surgery is described in detail in Chapters 8 and 9.
• Curative endoscopic treatment is only possible where the disease is limited to the mucosa (or rarely the most superficial sub-mucosal layer). In this situation, the risk of the disease spreading to the lymph nodes is minimal and good long term outcomes can therefore be achieved through localised endoscopic therapy.
Palliative treatment options aim to both reduce the impact of patient symptoms and improve the length and quality of life for patients. Therapeutic options include endoscopic stenting, palliative oncology, palliative surgery and best supportive care (no active treatment). Use of palliative treatment options is described in Chapter 10.
7.1 Planned treatment modality
Approximately two thirds of patients diagnosed between April 2015 and March 2017 had either no active treatment or palliative treatment, and 38.6% of patients had a curative treatment plan (Figure 7.1).
As in previous years, patients with lower oesophageal and junctional tumours were more likely to have a curative treatment plan than those with other types of tumour (Table 7.1). The proportion of patients with a curative treatment intent varied by Cancer Alliance/Welsh region (Figure 7.2).
Figure 7.1Treatment intent of patients diagnosed with OG cancer between April 2015 and March 2017 in England and Wales
Treatment intent knownN=21032
No active treatment (14.8%) Palliative treatment (47.0%)
Palliative oncology (74.3%)
Endoscopic palliation (20.2%)
Palliative surgery (5.5%)
Curative treatment (38.6%)
Surgery only (27.4%)
Chemotherapy and surgery (50%)
Chemoradiotherapy and surgery (2.8%)
Endoscopic mucosal resection (4.3%)
Definitive chemoradiotherapy (12.3%)
Definitive radiotherapy (2.3%)

Copyright © 2018, Healthcare Quality Improvement Partnership Ltd. (HQIP), National Oesophago-gastric Cancer Audit 2018. All rights reserved. 45
Table 7.1 Treatment intent by type of tumour in patients diagnosed with OG cancer between April 2015 and March 2017
Oesophageal SCC Oes ACA upper / mid Oes ACA lower / S1 G-O junction S11/S111 Stomach
Curative 1661 (37.6) 431 (31.7) 3238 (42.9) 957 (43.0) 1831 (33.5)
Palliative 2761 (62.4) 929 (68.3) 4315 (57.1) 1268 (57.0) 3641 (66.5)
Total 4422 1360 7553 2225 5472
KEY: Oes – oesophageal, SCC – squamous cell carcinoma, ACA – adenocarcinoma, GOJ – gastro-oesophageal junction
Tumours of the GOJ are described using the Siewert classification [Siewert et al 1996]:
I. Adenocarcinoma of the distal oesophagus, the centre of which is within 2–5cm proximal to the anatomical cardia. It may infiltrate the gastro-oesophageal junction from above.
II. True junctional adenocarcinoma, the centre of which is within 2cm above or below of the anatomical cardia.
III. Subcardial gastric adenocarcinoma, the centre of which is within the 5cm distal to the anatomical cardia. It may infiltrate the gastro-oesophageal junction from below.
Figure 7.2Proportion of OG cancer patients managed with curative treatment plan by Cancer Alliance/Welsh region in England and Wales
0%
10%
20%
30%
40%
50%
60%
70%
0
1000
2000
3000
4000
5000
6000
ABM
U
SE L
ond
N W
ales
Tham
es
Hum
ber
S W
ales
Kent
Lanc
s
Penn
s
S Yo
rks
NCE
Lon
d
Surre
y
Wes
sex
W Y
orks
Som
s
W L
on
Ches
hire
Man
c
E M
ids
N E
ast
W M
ids
E En
gl
% p
atie
nts
wit
h cu
rati
ve t
reat
men
t pl
an
Num
ber
of p
atie
nts
diag
nose
d
Cancer Alliance / Welsh region
Number of patientsdiagnosed
National average
% with curativetreatment plan(95%CI)
In the 2016 Audit report, we described an increase in the use of planned definitive chemoradiotherapy in patients with oesophageal squamous cell carcinoma (SCC). A year-on-year analysis of planned modality shows that there was a slight increase in the use of definitive chemoradiotherapy over five years, from 44.3% in 2012–13 to 50.7% in 2016–17 (Figure 7.3). This increase is in line with the BSG guideline for oesophageal SCC, which recommends: 1) definitive chemoradiotherapy for proximal oesophageal tumours and 2) chemoradiotherapy alone or combined with surgery for tumours of the middle and lower oesophagus.
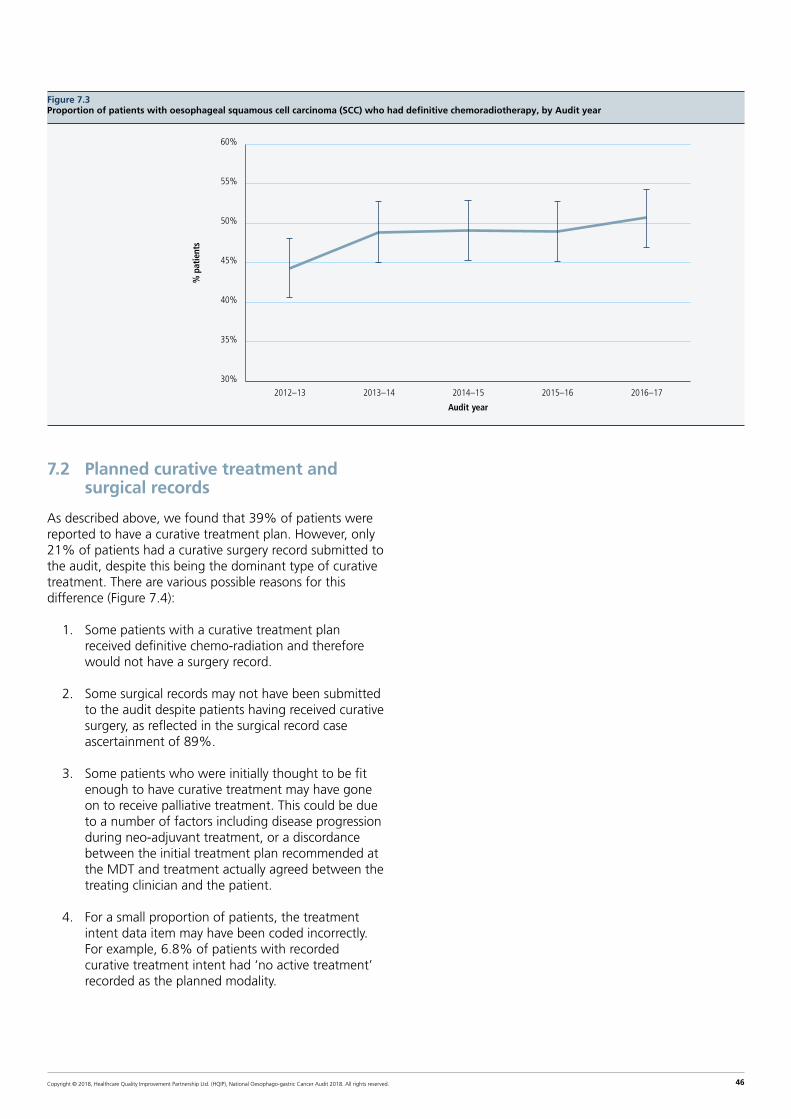
Copyright © 2018, Healthcare Quality Improvement Partnership Ltd. (HQIP), National Oesophago-gastric Cancer Audit 2018. All rights reserved. 46
Figure 7.3Proportion of patients with oesophageal squamous cell carcinoma (SCC) who had definitive chemoradiotherapy, by Audit year
30%
35%
40%
45%
50%
55%
60%
2012–13 2013–14 2014–15 2015–16 2016–17
Audit year
% p
atie
nts
7.2 Planned curative treatment and surgical records
As described above, we found that 39% of patients were reported to have a curative treatment plan. However, only 21% of patients had a curative surgery record submitted to the audit, despite this being the dominant type of curative treatment. There are various possible reasons for this difference (Figure 7.4):
1. Some patients with a curative treatment plan received definitive chemo-radiation and therefore would not have a surgery record.
2. Some surgical records may not have been submitted to the audit despite patients having received curative surgery, as reflected in the surgical record case ascertainment of 89%.
3. Some patients who were initially thought to be fit enough to have curative treatment may have gone on to receive palliative treatment. This could be due to a number of factors including disease progression during neo-adjuvant treatment, or a discordance between the initial treatment plan recommended at the MDT and treatment actually agreed between the treating clinician and the patient.
4. For a small proportion of patients, the treatment intent data item may have been coded incorrectly. For example, 6.8% of patients with recorded curative treatment intent had ‘no active treatment’ recorded as the planned modality.

Copyright © 2018, Healthcare Quality Improvement Partnership Ltd. (HQIP), National Oesophago-gastric Cancer Audit 2018. All rights reserved. 47
Figure 7.4Planned curative treatment and surgical records
12,914 Non-curative intent
1,285 Definitive oncology584 Other
712 records not submitted (estimate based on 88.6% case ascertainment)
1,208 (19.3%) patients
Possible explanations:
• Patients did not go on to receive surgery• Errors in recording of planned treatment
21,032 patients diagnosed with OG cancer April 2015–March 2017
8,118 (38.6%) patients with curative treatment intent
6,249 (29.7%) patients with curative surgery recorded as planned treatment modality
4,329 (20.6%) patients with surgical record
7.3 Choice of non-curative treatment modality
In the 2015–2017 cohort, the choice of non-curative treatment modality varied by cancer site (Table 7.2). As in previous years, the proportion of patients receiving best supportive care was highest in patients with stomach tumours (48.9%). Overall, there was a slight increase in the proportion of patients with a plan for best supportive care, rising from 32.8% in 2012/13 to 35.6% in 2016/17.

Copyright © 2018, Healthcare Quality Improvement Partnership Ltd. (HQIP), National Oesophago-gastric Cancer Audit 2018. All rights reserved. 48
Table 7.2Planned non-curative treatment modality by cancer type for patients diagnosed with OG cancer between April 2015 and March 2017 in England and Wales
Oesophageal SCC Oes ACA Upper / mid Oes ACA Lower / S1 GOJ S11/S111 Stomach
N % N % N % N % N %
Palliative oncology 1338 50.5 462 51.7 2237 53.8 673 55.2 1538 43.0
Palliative surgery 101 3.8 22 2.5 134 03.2 23 1.9 118 3.3
Endoscopic/ radiological palliation 445 16.8 136 15.2 559 13.5 134 11.0 172 4.8
Best supportive care 765 28.9 274 30.6 1226 29.5 390 32.0 1748 48.9
Total 2649 100.0 894 100.0 4156 100.0 1220 100.0 3576 48.9
Missing 112 35 159 48 65
KEY: Oes – oesophageal, SCC – squamous cell carcinoma, ACA – adenocarcinoma, GOJ – gastro-oesophageal junction
Tumours of the GOJ are described using the Siewert classification [Siewert et al 1996]:
I. Adenocarcinoma of the distal oesophagus, the centre of which is within 2-5cm proximal to the anatomical cardia. It may infiltrate the gastro-oesophageal junction from above.
II. True junctional adenocarcinoma, the centre of which is within 2cm above or below of the anatomical cardia.
III. Subcardial gastric adenocarcinoma, the centre of which is within the 5cm distal to the anatomical cardia. It may infiltrate the gastro-oesophageal junction from below.
There was variation in the choice of palliative modality across the geographical regions of England and Wales, with some Cancer Alliances actively treating patients with oncology more than others (Figure 7.5). For example, in Humber, Coast and Vale, 61.6% of patients had oncology as their planned modality. By contrast, in Greater Manchester, this modality was selected for 36.3% of patients.
Figure 7.5Planned non-curative treatment modality by English Cancer Alliance and Welsh region using data on patients diagnosed between 2015-2017
0%
10%
20%
30%
40%
50%
60%
70%
80%
90%
100%
Ches
hire
E M
ids
E En
gl
Man
c
Hum
ber
Kent
Lanc
s
NCE
Lon
d
N E
ast
Penn
s
Som
s
SE L
ond
S Yo
rks
Surre
y
Tham
es
Wes
sex
W L
on
W M
ids
W Y
orks
ABM
U
Nor
th W
ales
Sout
h W
ales
% p
atie
nts
Cancer Alliance / Welsh region
Palliative endoscopy /radiological treatment
Palliative oncology
Palliative surgery
Best supportive care
Copyright © 2018, Healthcare Quality Improvement Partnership Ltd. (HQIP), National Oesophago-gastric Cancer Audit 2018. All rights reserved. 49
7.4 Key findings and recommendations
OGC Key Finding 6: The proportion of patients who are candidates for curative treatments remains around 39%. There are some differences in this proportion by tumour site, with tumours around the lower oesophagus and GOJ more likely to have a curative treatment intent. Although there was some regional variation, the majority of Cancer Alliances / Welsh regions have a proportion of patients treated curatively clustered around the national average. Not all patients with a curative treatment plan go on to receive surgery, and there is regional variation in the proportion of eligible patients who have a surgical record in NOGCA.
Recommendation
NHS organisations with large differences between the number of patients with curative treatment intent and number of surgery records should investigate the reasons for this. MDTs should consider how information about planned treatments is communicated to patients.
OGC Key Finding 7: There was variation in the patterns of planned palliative modality across the regions, with some regions having comparatively high rates of best supportive care.
Recommendation
NHS organisations with comparatively low use of active cancer treatment among palliative patients should examine whether more patients would be suitable for these therapies.

Copyright © 2018, Healthcare Quality Improvement Partnership Ltd. (HQIP), National Oesophago-gastric Cancer Audit 2018. All rights reserved. 50
8. Use of tri-modal treatment for curative patients in England and Wales
Among patients suitable for curative therapy, clinicians in the UK have tended to favour the use of neoadjuvant chemotherapy over neoadjuvant chemoradiotherapy (also known as tri-modal treatment) for patients with OG cancer due to concerns about postoperative morbidity. However, in other countries the use of neoadjuvant chemoradiotherapy (nCRT) is more common.
Evidence for the use of nCRT comes from various studies, notably the CROSS trial conducted in the Netherlands [Shapiro 2015] and the NeoSCOPE trial in the UK [Mukherjee et al 2017]. The CROSS trial reported that nCRT improved overall survival among patients with potentially curable oesophageal or GOJ cancer compared to surgery alone, while NeoSCOPE confirmed that the regimen was associated with acceptable rates of treatment complications. There remains uncertainty as to whether pre-operative chemoradiotherapy is superior to pre-/peri-operative chemotherapy alone. The NeoAEGIS trial, which aims to address this issue, is currently ongoing in the UK (ClinicalTrials Identifier: NCT01726452).
The data items in the Audit records allow us to identify a cohort of patients with documented evidence of nCRT. Moreover, linking the Audit data with the radiotherapy dataset (RTDS) and the chemotherapy dataset (SACT) enables us to derive information on the radiotherapy doses and chemotherapy drugs used in patients who had nCRT. The cohort comprised patients diagnosed between April 2013 and March 2015, as records in RTDS and SACT were only available for patients diagnosed during this period.
Of those patients who had neoadjuvant treatment as part of their curative therapy, 122 (6%) had nCRT. These patients were treated at 23 surgical centres, although the majority (56%) were treated in five centres. The mean age of the patients undergoing nCRT was 62.8 years and 68.9% were male. Just over half (55.7%) were patients with adenocarcinomas, while 43.4% had squamous cell carcinomas. The majority of patients (91.5%) had a pre-treatment TNM stage of 2 or 3.
8.1 Use of radiotherapy within the nCRT cohort
Of the 122 patients who were documented as having nCRT, 110 (90.1%) had linked radiotherapy records. The pattern of prescribed radiotherapy regimens were as follows:
• 30 patients had the CROSS trial regimen (41.4 Gy over 23 fractions)
• 44 patients had the NeoSCOPE trial regimen (45 Gy over 25 fractions)
• 36 patients had another pattern of radiotherapy
8.2 Use of chemotherapy within the nCRT cohort
Of those patients who had nCRT, 110 (90.1%) had a record in the SACT dataset, but we were only able to extract the prescribed chemotherapy regimen for 51 of these patients. Of these patients:
• 11 patients (22%) were reported as being in the NeoSCOPE trial but the drug regimens were not specified
• 16 patients (31%) were given the regimen specified in the CROSS trial
8.3 Key findings and recommendations
OGC Key Finding 8: The Audit data confirm that only a small minority (6%) of patients who had neoadjuvant therapy prior to curative surgery received nCRT between April 2013 and March 2015. The majority of these patients followed the dosing regimens used in the CROSS and Neoscope trials. It is not clear why the standard regimens for nCRT were not being followed in all cases.
Recommendation
The upper GI community in the UK should monitor the use of nCRT to ensure that it is used in suitable candidates and that the evidence based recommendations for the radiotherapy and chemotherapy regimens are followed. NHS trusts / Health Boards are encouraged to support patient recruitment to the NeoAEGIS trial.
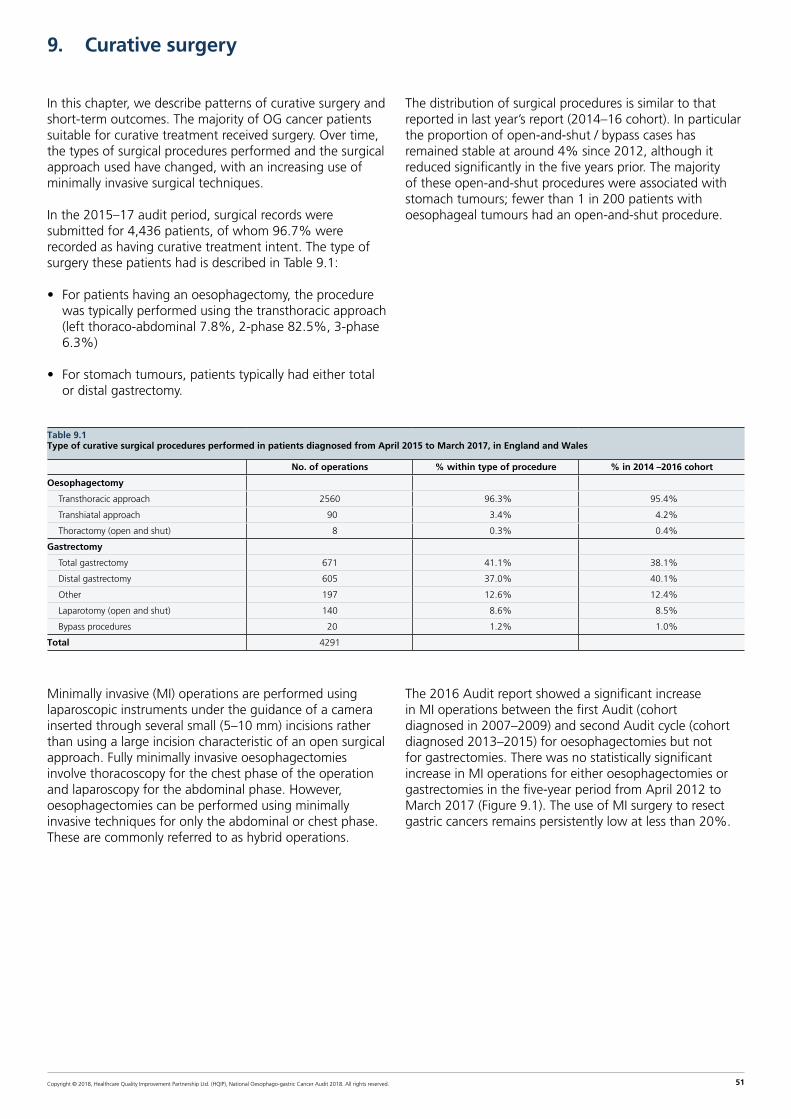
Copyright © 2018, Healthcare Quality Improvement Partnership Ltd. (HQIP), National Oesophago-gastric Cancer Audit 2018. All rights reserved. 51
9. Curative surgery
In this chapter, we describe patterns of curative surgery and short-term outcomes. The majority of OG cancer patients suitable for curative treatment received surgery. Over time, the types of surgical procedures performed and the surgical approach used have changed, with an increasing use of minimally invasive surgical techniques.
In the 2015–17 audit period, surgical records were submitted for 4,436 patients, of whom 96.7% were recorded as having curative treatment intent. The type of surgery these patients had is described in Table 9.1:
• For patients having an oesophagectomy, the procedure was typically performed using the transthoracic approach (left thoraco-abdominal 7.8%, 2-phase 82.5%, 3-phase 6.3%)
• For stomach tumours, patients typically had either total or distal gastrectomy.
The distribution of surgical procedures is similar to that reported in last year’s report (2014–16 cohort). In particular the proportion of open-and-shut / bypass cases has remained stable at around 4% since 2012, although it reduced significantly in the five years prior. The majority of these open-and-shut procedures were associated with stomach tumours; fewer than 1 in 200 patients with oesophageal tumours had an open-and-shut procedure.
Table 9.1Type of curative surgical procedures performed in patients diagnosed from April 2015 to March 2017, in England and Wales
No. of operations % within type of procedure % in 2014 –2016 cohort
Oesophagectomy
Transthoracic approach 2560 96.3% 95.4%
Transhiatal approach 90 3.4% 4.2%
Thoractomy (open and shut) 8 0.3% 0.4%
Gastrectomy
Total gastrectomy 671 41.1% 38.1%
Distal gastrectomy 605 37.0% 40.1%
Other 197 12.6% 12.4%
Laparotomy (open and shut) 140 8.6% 8.5%
Bypass procedures 20 1.2% 1.0%
Total 4291
Minimally invasive (MI) operations are performed using laparoscopic instruments under the guidance of a camera inserted through several small (5–10 mm) incisions rather than using a large incision characteristic of an open surgical approach. Fully minimally invasive oesophagectomies involve thoracoscopy for the chest phase of the operation and laparoscopy for the abdominal phase. However, oesophagectomies can be performed using minimally invasive techniques for only the abdominal or chest phase. These are commonly referred to as hybrid operations.
The 2016 Audit report showed a significant increase in MI operations between the first Audit (cohort diagnosed in 2007–2009) and second Audit cycle (cohort diagnosed 2013–2015) for oesophagectomies but not for gastrectomies. There was no statistically significant increase in MI operations for either oesophagectomies or gastrectomies in the five-year period from April 2012 to March 2017 (Figure 9.1). The use of MI surgery to resect gastric cancers remains persistently low at less than 20%.

Copyright © 2018, Healthcare Quality Improvement Partnership Ltd. (HQIP), National Oesophago-gastric Cancer Audit 2018. All rights reserved. 52
Figure 9.1Proportion of minimally invasive (MI) operations performed in England and Wales from April 2012 to March 2017, by audit year
0%
10%
20%
30%
40%
50%
0%
10%
20%
30%
40%
50%
2012–13 2013–14 2014–15 2015–16 2016–17 2012–13 2013–14 2014–15 2015–16 2016–17
MI/Hybrid operations – oesophagectomy
MI operations – gastrectomy
% p
roce
dure
s
9.1 Enhanced recovery after surgery (ERAS)
There is an increasing evidence base on the advantages of using enhanced recovery after surgery (ERAS) protocols. Studies have reported ERAS can produce reduced rates of complications, improved outcomes and shorter length of stay [Markar et al 2015]. ERAS protocols may include several components to aid early recovery, such as pre-operative nutritional assessment and post-operative prophylaxis for nausea and vomiting. The extent of the use of ERAS protocols in surgical centres in England and Wales is unknown. The Audit introduced two data items last year to capture the use of these protocols for patients diagnosed from April 2017, but some data were also submitted for patients in the current cohort (Table 9.2):
• data on the description of the surgical pathway were submitted for approximately half of patients
• data on the completion of the pathway were submitted for a quarter of patients.
Among patients with complete data on ERAS items, the majority completed the pathway.
Of 37 English surgical centres, six did not complete the questions on the surgical pathway for any patients. The other 31 organisations had information on the pathway for some but not all patients. None of the Welsh surgical centres completed the ERAS items.
Table 9.2ERAS pathway in curative surgical patients diagnosed between April 2016 and March 2017 in England and Wales
Oesophagectomy Gastrectomy
No. of patients 1202 683
What best describes the surgical pathway that this patient followed?
A protocolised enhanced recovery (ERAS) without daily documentation in medical notes? 29 (02.4%) 23 (03.4%)
A protocolised enhanced recovery (ERAS) with daily documentation in medical notes? 318 (26.5%) 132 (19.3%)
A standard (non-ERAS) surgical pathway 340 (28.3%) 192 (28.1%)
Missing 515 (42.9%) 336 (49.2%)
Did the patient complete the ERAS pathway?
Yes 308 (25.6%) 138 (20.2%)
No: but partial completion 19 (01.6%) 9 (01.3%)
No: non-completion 6 (00.5%) 2 (00.3%)
Unknown / not documented 4 (00.3%) 3 (00.4%)
Missing 865 (72.0%) 531 (77.8%)

Copyright © 2018, Healthcare Quality Improvement Partnership Ltd. (HQIP), National Oesophago-gastric Cancer Audit 2018. All rights reserved. 53
9.2 Short-term outcomes of curative surgery
Since 2013, NOGCA has benchmarked surgical outcomes for trusts and consultants, to help patients make an informed decision about where to have surgery. Information on post-operative 30-day and 90-day mortality rates and length of stay after surgery in England (at the level of trust and consultant) have been assessed and published on the AUGIS and NHS Choices websites on an annual basis. Currently, benchmarked outcomes from Wales are not published on public websites as Wales does not formally participate in the COP exercise, but there are plans to pilot the extension of consultant outcome reporting to Wales in the near future.
Figure 9.2 shows that the majority of cancer centres performed as expected for the 30-day mortality outcome given their surgical workload, with the adjusted mortality rate generally falling within the 99.8% control limit. There was one centre which fell outside this control limit, and a commentary about this result from the organisation is included in Annex 9.
All NHS surgical centres performed as expected with respect to the 90-day mortality outcome (Figure 9.3). Both sets of mortality rates were adjusted to remove differences in the mix of patients treated at the different organisations.
Figure 9.2Funnel plot of adjusted 30-day postoperative mortality for patients diagnosed between April 2014 and March 2017 in England and Wales
0
5
10
15
20
25
30
% m
orta
lity
0 50 100 150 200 250 300 350 400
Number of operations
Audit average
95% limits
Mortality rate %
99.8% limits
Figure 9.3Funnel plot of adjusted 90-day postoperative mortality for patients diagnosed between April 2014 and March 2017 in England and Wales
% m
orta
lity
0 50 100 150 200 250 300 350 400
Number of operations
Audit average
95% limits
Mortality rate %
99.8% limits 0
5
10
15
20
25
30

Copyright © 2018, Healthcare Quality Improvement Partnership Ltd. (HQIP), National Oesophago-gastric Cancer Audit 2018. All rights reserved. 54
There was no statistically significant change in either overall 30-day mortality or 90-day mortality in England and Wales from April 2012 to March 2017 for either oesophagectomy or gastrectomy. There has been a steady decrease in the median hospital length of stay over the last 10 years, which has continued in the last audit period.
Table 9.3Outcomes after curative surgery for patients diagnosed from April 2015 to March 2017 in England and Wales, compared with the previous two years
Oesophagectomy Gastrectomy
2015–17 2013–15 2015–17 2013–15
In hospital mortality (95% CI) 2.7 (2.1–3.4) 1.9 (1.5–2.5) 1.6 (1.0–2.4) 2.2 (1.5–3.0)
30-day mortality (95%CI) 2.4 (1.8–3.0) 1.6 (1.2–2.1) 1.3 (1.0–2.0) 1.9 (1.3–2.7)
90–day mortality (95% CI) 3.9 (3.3–4.7) 3.2 (2.6–3.9) 3.3 (2.5–4.4) 4.1 (3.2–5.2)
Length of stay (days) Median (IQR) 9 (11–17) 12 (9–17) 7 (9–13) 10 (7–14)
Last year, the Audit published results on four new surgical indicators by surgical centre. A decision was made not to benchmark trusts based on these indicators as it became apparent that there was wide variation in surgical practice and pathology examination. These variations in practice need to be addressed by the clinical community because, in the current situation, the statistical models used for risk adjustment will not perform adequately across all surgical centres.
We will continue to publish information on these new indicators to encourage discussion among surgeons about working towards standardisation of procedures (Figure 9.4).
Figure 9.4Graphs showing four new surgical indicators by NHS organisation and volume of activity
0%
20%
40%
60%
80%
100%
% p
atie
nts
wit
h ad
equa
te
lym
ph n
odes
exa
min
ed
0 50 100 150 200 250 300 350 400 450
Number of operations
0%
5%
10%
15%
% p
atie
nts
wit
h +
long
itud
inal
m
argi
ns (o
esop
hage
ctom
ies)
0 40 80 120 160 200 240 280
Number of operations
0%
10%
20%
30%
40%
50%
60%
% p
atie
nts
wit
h +
circ
umfe
rent
ial
mar
gins
(oes
opha
gect
omie
s)
0 40 80 120 160 200 240
Number of operations
0%
5%
10%
15%
20%
% p
atie
nts
wit
h +
long
itud
inal
m
argi
ns (g
astr
ecto
mie
s)
0 20 40 60 80 100 120 140 160
Number of operations
KEY: Four indicators are:
1 Proportion of patients with 15 or more lymph nodes examined (oesophagectomies and gastrectomies) - unadjusted
2 Proportion of patients with positive circumferential margins (oesophagectomy) - adjusted for overall TNM, history of neo-adjuvant treatment
3 Proportion of patients with positive longitudinal margins (oesophagectomy) - adjusted for overall TNM, history of neoadjuvant treatment
4 Proportion of patients with positive longitudinal margins (gastrectomy) - adjusted for overall TNM, history of neo-adjuvant treatment
Each dot represents an NHS organisation

Copyright © 2018, Healthcare Quality Improvement Partnership Ltd. (HQIP), National Oesophago-gastric Cancer Audit 2018. All rights reserved. 55
Perspective on the surgical results from Mr Nick Maynard
Consultant Upper GI Surgeon Oxford University Hospitals NHS Foundation Trust
The surgical teams in England and Wales should be congratulated for their excellent surgical outcomes yet again. PET-CT is widely agreed to be an essential staging investigation prior to the radical treatment of oesophageal cancer, and although the overall use of 71% feels about right,
there remains a wide variation between different units. MDTs should review their use of PET-CT to ensure it is appropriately used. There has been a steady increase in the use of minimally invasive surgery to resect oesophageal cancers, but the use of these techniques for gastric cancer remains stubbornly low. It is not clear why this is the case. It is crucial that we use the audit to investigate in greater detail outcome standards and the quality of care our patients receive, and with the increasing amount of data we are collecting, we will be able to analyse different aspects of treatment with respect to both short term and long term outcomes. We hope that the data collected, together with the analyses we provide, will help improve standards throughout England and Wales and eliminate the variation that remains between different units.
9.3 Key findings and recommendations
OGC Key Finding 9: The delivery of surgical curative procedures remains at a high standard overall. Both 30-day and 90-day mortality rates remain at the low levels achieved over the last few audit periods and the length of hospital stay continues to decrease. For the first time in a number of years, there was one surgical centre with a comparatively high mortality rate in the context of the outcomes achieved elsewhere.
OGC Key Finding 10: Although the previous Annual Report highlighted the wide variation in surgical practice related to the pathological examination of excised tumours, we did not identify much change in the results published in last year’s Annual Report. This limits the interpretation of new surgical indicators.
Recommendation
Surgeons and pathologists should work towards standardisation of the way surgical specimens are collected, so that benchmarking of organisations using these indicators can be carried out in the future.

Copyright © 2018, Healthcare Quality Improvement Partnership Ltd. (HQIP), National Oesophago-gastric Cancer Audit 2018. All rights reserved. 56
10. Non-curative OG cancer treatment patterns and outcomes
As mentioned in Chapter 7, most patients with OG cancer were managed with non-curative treatment intent after their diagnosis because they either had incurable disease or were unsuitable for curative treatment. The traditional aims of palliative therapy are symptom control (e.g. relief of pain or difficulty swallowing), improving quality of life and lengthening the duration of survival.
Patients on a non-curative care pathway have various treatment options available to them (see Box 3 below) but whether or not a patient receives a particular therapy will depend upon their condition and preference [Allum et al 2011]. Among these, palliative oncological therapies are the most common. Nonetheless, a common management approach remains “best supportive care”, which is characterised by no active treatment beyond the immediate relief of symptoms.
Box 3Non-curative treatment options for people with oesophago-gastric cancer
Palliative chemotherapy can improve survival in locally advanced gastric cancer by 3–6 months, compared to best supportive care alone. Similar results are seen in oesophageal cancer.
External beam radiotherapy can be used to relieve dysphagia, but its effect is slower to act than the insertion of an oesophageal stent.
Brachytherapy can be used to treat dysphagia symptoms and quality of life in people expected to live more than 3 months.
Endoscopic / radiological therapy
- Stents provide immediate relief of dysphagia and are recommended for people with a short life expectancy.
- Laser therapy and argon plasma coagulation (APC) can both be used to relieve dysphagia particularly when it is due to tumour overgrowth after a stent has been inserted.
10.1 Endoscopic/radiological palliative therapy
Table 10.1 describes the various endoscopic and radiological non-curative procedures recorded for patients in the 2015–17 audit period. Stenting to relieve dysphagia was the single most frequently conducted procedure, being used in 1,995 patients. The absolute numbers of other procedures were relatively small and have decreased since previous years. Stent insertions have increased from representing 91% of all procedures in 2012/13 to 96% in 2016/17. The use of stents across the various types of tumour is described in Table 10.2.
The infrequent use of brachytherapy is likely to be due to a combination of factors related to the more complex delivery compared with the insertion of a stent, with the procedure requiring both an endoscopist as well as an oncologist. Other issues include a lack of training and experience among staff on how to perform brachytherapy, and a limited interest in commissioning this service.
Table 10.1Palliative endoscopic and radiological treatments received by patients diagnosed with OG cancer between 2012 and 2017, by Audit year
Procedure 2012–13 2013–14 2014–15 2015–16 2016–17
Stent insertion 1290 1271 1267 1105 890
Laser ablation (PDT/laser) 32 27 11 16 15
Brachytherapy 27 30 29 8 6
Dilation 57 57 35 26 19
Other (APC / gastrostomy) 15 8 8 11 <5
Only patients with a planned palliative treatment modality and who held endoscopy records were included.
Table 10.2Number of stent procedures by OG cancer site (first recorded procedure in NOGCA), in England and Wales (patients diagnosed between April 2015 and March 2017)
Procedure Oeso-phageal
SCC
Oes ACA Upper/
Mid
Oes ACA Lower/SI
GOJ ACA SII /SIII
Stomach All sites
Stent insertion
610 187 838 172 188 1995
Total 641 196 889 176 195 2097
SCC=squamous cell carcinoma; ACA=adenocarcinoma; SI, SII, SIII= Siewert I, II, III.
10.2 Method used for stent insertion
Oesophageal stents may be inserted under fluoroscopic guidance alone, endoscopic guidance alone or combined endoscopic and fluoroscopic guidance. Over the 2015–2017 audit period, we observed large variation in the types of insertion technique used within the Cancer Alliances (Figure 10.1):
• Four Alliances used fluoroscopy alone as the predominant technique of insertion
• Three Alliances used endoscopy alone in the majority of cases
• Ten Alliances used a combination approach most frequently.
This variation is likely to represent differences in the regional availability of endoscopy and interventional radiology services. No differences in 3 month and 6 month survival were observed by method of stent insertion (Chi squared test, p=0.959, p=0.419 respectively).

Copyright © 2018, Healthcare Quality Improvement Partnership Ltd. (HQIP), National Oesophago-gastric Cancer Audit 2018. All rights reserved. 57
Figure 10.1Stent insertion technique used in OG cancer patients treated with palliative intent, by English Cancer Alliance
0%
10%
20%
30%
40%
50%
60%
70%
80%
90%
100%
Ches
hire
E M
ids
E En
gl
Man
c
Hum
ber
Kent
Lanc
s
NCE
Lon
d
N E
ast
Penn
s
Som
s
SE L
ond
S Yo
rks
Surre
y
Tham
es
Wes
sex
W L
on
W M
ids
W Y
orks
Cancer Alliance
% p
atie
nts
Fluoroscopic and endoscopicguidance
Endoscopic guidance
Fluoroscopic guidance
10.3 Palliative oncology
Among patients with a planned treatment modality of palliative oncology and an oncological record in the Audit, chemotherapy was consistently the most frequent oncological modality between 2012 and 2017 (Table 10.3). This was the case for both oesophageal and gastric cancers. Overall, 68.2% of patients who received palliative oncology had chemotherapy (either alone or in combination with radiotherapy).
External beam radiotherapy was used less frequently than chemotherapy, and this was more pronounced in patients with gastric cancer than oesophageal cancer (19.3% vs 30.9%) (Table 10.4). People who were treated with radiotherapy alone were older than people who received chemotherapy: age (SD) 75.6 (10.6) vs 66.0 (10.6). Chemoradiotherapy was used infrequently in both gastric and oesophageal cancer.

Copyright © 2018, Healthcare Quality Improvement Partnership Ltd. (HQIP), National Oesophago-gastric Cancer Audit 2018. All rights reserved. 58
Table 10.3Palliative oncology regimens received by OG cancer patients with a planned treatment modality of palliative oncology diagnosed between 2012 and 2017, by Audit year
Procedure 2012–13n (%)
2013–14n (%)
2014–15n (%)
2015–16n (%)
2016–17n (%)
Chemoradiotherapy 108 (04.6) 116 (05.0) 103 (04.5) 70 (03.2) 67 (03.6)
Chemotherapy 1537 (66.0) 1518 (65.4) 1546 (67.7) 1504 (68.5) 1281 (67.9)
Radiotherapy 684 (29.4) 688 (29.6) 634 (27.8) 623 (28.4) 538 (28.5)
Table 10.4Palliative oncological treatment received by OG cancer patients diagnosed between 2015 and 2017, by tumour location
Treatment modality Oesophageal SCC n (%)
Oes ACA upper / mid n (%)
Oes ACA Lower / SI n (%)
GOJ SII/IIIn (%)
Stomachn (%)
Total
Chemotherapy 497 (53.9) 180 (61.6) 1087 (69.7) 342 (75.5) 679 (79.2) 2785 (68.2)
Radiotherapy 360 (39.1) 97 (33.2) 435 (27.9) 104 (23.0) 165 (19.3) 1161 (28.4)
Chemo-radiotherapy 65 (07.1) 15 (05.1) 37 (02.4) 7 (01.6) 13 (01.5) 137 (03.4)
Total 922 292 1559 453 857 4083
Only patients for whom palliative oncological treatment was planned and who had an oncology record were included.
Figure 10.2 shows the distribution of palliative oncology therapies used within the various Cancer Alliances for a) oesophageal cancer and b) gastric cancer. The pattern of use showed considerable variation across the Alliances. For example, in the South East London Alliance, all patients with oesophageal cancer received chemotherapy only, in contrast to Peninsula where only half of patients received chemotherapy and the other half received radiotherapy or chemoradiotherapy.

Copyright © 2018, Healthcare Quality Improvement Partnership Ltd. (HQIP), National Oesophago-gastric Cancer Audit 2018. All rights reserved. 59
Figure 10.2Distribution of oncological treatment regimen by Cancer Alliance for oesophageal and gastric cancer. All patients diagnosed between 2015 and 2017 with a planned treatment modality of palliative oncology that held oncology records were included.
Oesophageal cancer
0%
10%
20%
30%
40%
50%
60%
70%
80%
90%
100%
Ches
hire
E M
ids
E En
gl
Man
c
Hum
ber
Kent
Lanc
s
NCE
Lon
d
N E
ast
Penn
s
Som
s
SE L
ond
S Yo
rks
Surre
y
Tham
es
Wes
sex
W L
on
W M
ids
W Y
orks
Cancer Alliance
Chemoradiotherapy
Radiotherapy
Chemotherapy
% p
atie
nts
Gastric cancer
0%
10%
20%
30%
40%
50%
60%
70%
80%
90%
100%
Ches
hire
E M
ids
E En
gl
Man
c
Hum
ber
Kent
Lanc
s
NCE
Lon
d
N E
ast
Penn
s
Som
s
SE L
ond
S Yo
rks
Surre
y
Tham
es
Wes
sex
W L
on
W M
ids
W Y
orks
Cancer Alliance
Chemoradiotherapy
Radiotherapy
Chemotherapy
% p
atie
nts
Completion rates were consistently high (over 95%) for radiotherapy over the 5 year period from 2012 to 2017. Completion was much lower for chemotherapy, being on average 56.1% over the five years. Of patients unable to complete chemotherapy, progressive disease during chemotherapy was the most frequently cited reason
(42.8%) for stopping, followed by acute chemotherapy toxicity (22.0%). People who were able to complete chemotherapy tended to have a better performance status, no comorbidities and a lower tumour stage (Table 10.5). A higher proportion of people unable to complete chemotherapy had metastatic disease.
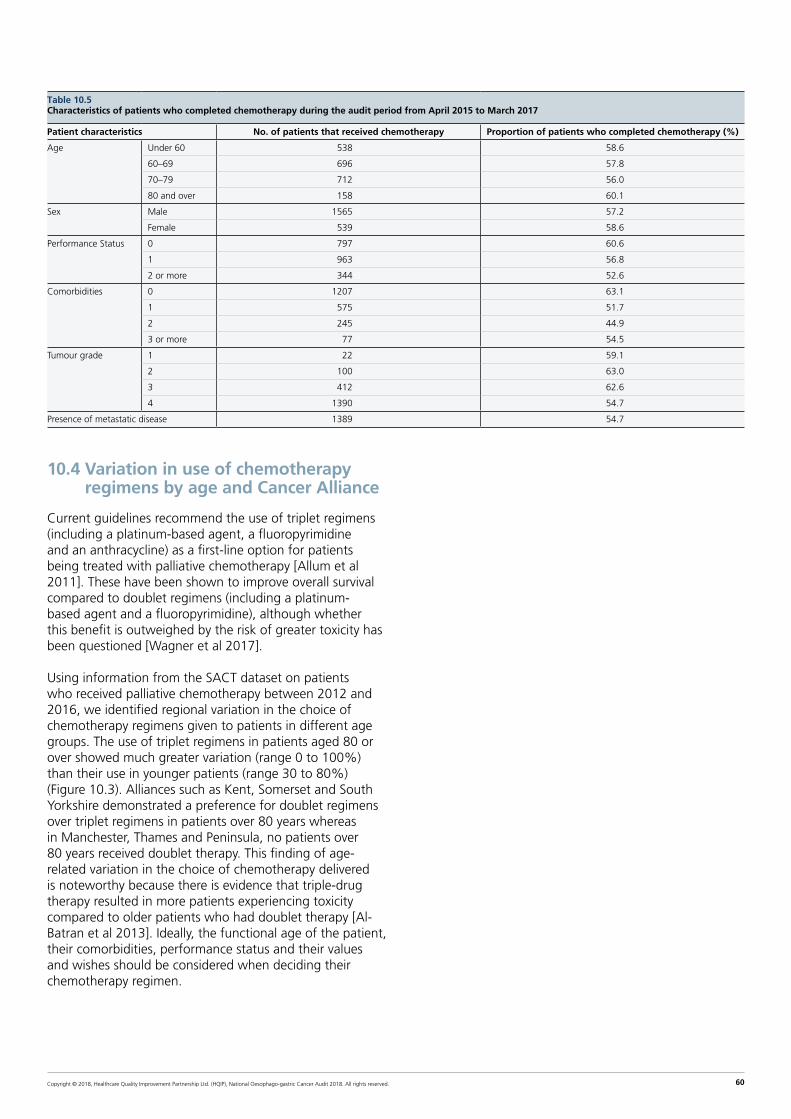
Copyright © 2018, Healthcare Quality Improvement Partnership Ltd. (HQIP), National Oesophago-gastric Cancer Audit 2018. All rights reserved. 60
10.4 Variation in use of chemotherapy regimens by age and Cancer Alliance
Current guidelines recommend the use of triplet regimens (including a platinum-based agent, a fluoropyrimidine and an anthracycline) as a first-line option for patients being treated with palliative chemotherapy [Allum et al 2011]. These have been shown to improve overall survival compared to doublet regimens (including a platinum-based agent and a fluoropyrimidine), although whether this benefit is outweighed by the risk of greater toxicity has been questioned [Wagner et al 2017].
Using information from the SACT dataset on patients who received palliative chemotherapy between 2012 and 2016, we identified regional variation in the choice of chemotherapy regimens given to patients in different age groups. The use of triplet regimens in patients aged 80 or over showed much greater variation (range 0 to 100%) than their use in younger patients (range 30 to 80%) (Figure 10.3). Alliances such as Kent, Somerset and South Yorkshire demonstrated a preference for doublet regimens over triplet regimens in patients over 80 years whereas in Manchester, Thames and Peninsula, no patients over 80 years received doublet therapy. This finding of age-related variation in the choice of chemotherapy delivered is noteworthy because there is evidence that triple-drug therapy resulted in more patients experiencing toxicity compared to older patients who had doublet therapy [Al-Batran et al 2013]. Ideally, the functional age of the patient, their comorbidities, performance status and their values and wishes should be considered when deciding their chemotherapy regimen.
Table 10.5Characteristics of patients who completed chemotherapy during the audit period from April 2015 to March 2017
Patient characteristics No. of patients that received chemotherapy Proportion of patients who completed chemotherapy (%)
Age Under 60 538.0 58.6
60–69 696.0 57.8
70–79 712.0 56.0
80 and over 158.0 60.1
Sex Male 1565.0 57.2
Female 539.0 58.6
Performance Status 0 797.0 60.6
1 963.0 56.8
2 or more 344.0 52.6
Comorbidities 0 1207.0 63.1
1 575.0 51.7
2 245.0 44.9
3 or more 77.0 54.5
Tumour grade 1 22.0 59.1
2 100.0 63.0
3 412.0 62.6
4 1390.0 54.7
Presence of metastatic disease 1389.0 54.7
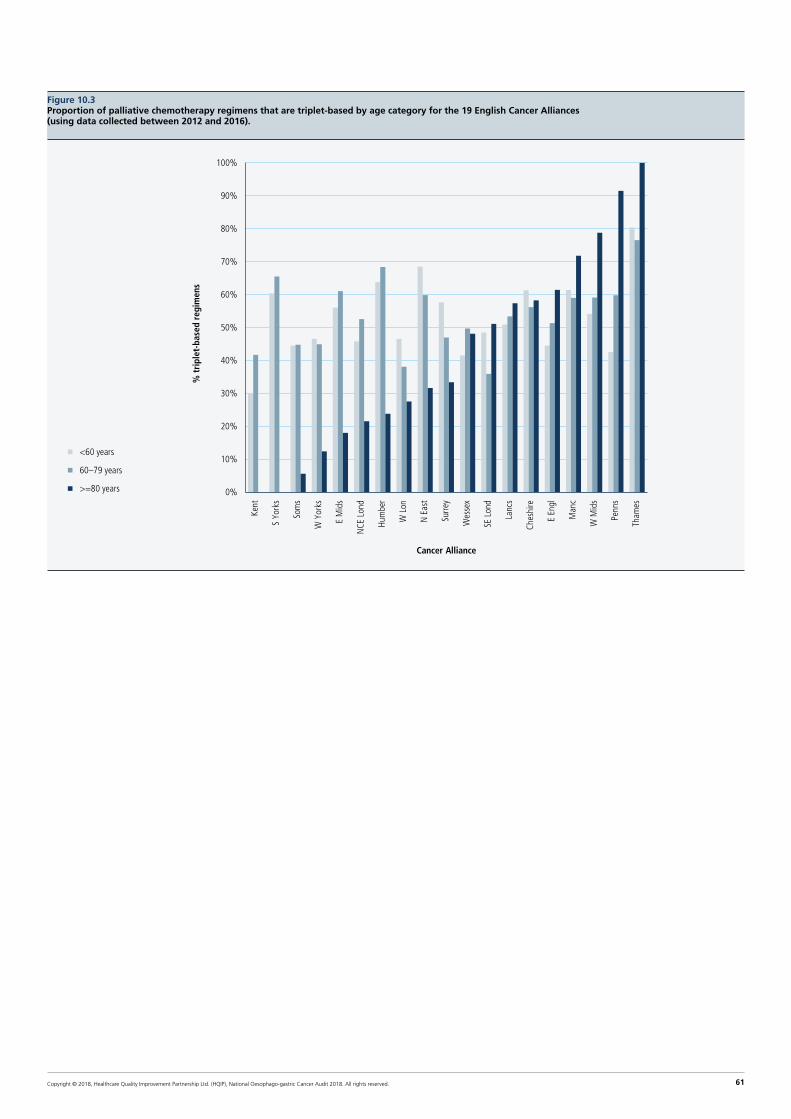
Copyright © 2018, Healthcare Quality Improvement Partnership Ltd. (HQIP), National Oesophago-gastric Cancer Audit 2018. All rights reserved. 61
Figure 10.3Proportion of palliative chemotherapy regimens that are triplet-based by age category for the 19 English Cancer Alliances (using data collected between 2012 and 2016).
0%
10%
20%
30%
40%
50%
60%
70%
80%
90%
100%
Kent
S Yo
rks
Som
s
W Y
orks
E M
ids
NCE
Lon
d
Hum
ber
W L
on
N E
ast
Surre
y
Wes
sex
SE L
ond
Lanc
s
Ches
hire
E En
gl
Man
c
W M
ids
Penn
s
Tham
es
Cancer Alliance
<60 years
60–79 years
>=80 years
% t
ripl
et-b
ased
reg
imen
s

Copyright © 2018, Healthcare Quality Improvement Partnership Ltd. (HQIP), National Oesophago-gastric Cancer Audit 2018. All rights reserved. 62
10.5 Key findings and recommendations
OGC Key Finding 11: Most patients being treated palliatively were planned to receive oncological treatment and this pattern has been consistent between 2012 and 2017. Chemotherapy is used more often than radiotherapy, but 44% of patients were reported to have not completed the original planned course. In 21% of cases, non-completion was reported to be due to the patient dying before the end of treatment. Furthermore, 52% of patients who received best supportive care or palliative endoscopic procedures survive beyond 3 months, suggesting they may have benefited from additional treatments such as palliative radiotherapy.
Recommendation
The selection process of patients for palliative chemotherapy requires improvement. In particular, services should explore the reasons why patients chosen to receive this treatment were unable to complete the regimen and why patients who were sufficiently fit to be candidates for chemotherapy received best supportive care.
OGC Key Finding 12: There is considerable regional variation in the use of doublet and triplet regimens, especially among older patients being treated with palliative oncology.
Recommendation
Attempts should be made to develop a more consistent approach to the use of systemic therapy regimens, especially in older patients with advanced OG cancer, through the development of practice guidelines and/or participation in clinical trials.
Perspective from Dr Tom Crosby
Consultant Clinical Oncologist, Velindre Cancer Centre, Cardiff
The majority of patients with oesophago-gastric cancer present with advanced disease and/or are not suitable for curative treatment. There is a clear need to develop more effective treatments to manage these patients but also a more consistent approach to patient
selection and choice of treatment. It is difficult not to conclude from this data that there are not examples of both under- and over-treatment.
Over 40% of patients are not completing their planned course of palliative chemotherapy, with 15% dying within 3 months of starting treatment. Yet 52% of patients are surviving more than 3 months with endoscopic treatment or best supportive care, suggesting that they might have been suitable for additional anti-cancer therapy.
Lastly, there is significant variation in the treatment regimens used with regard to palliative chemotherapy, radiotherapy (external beam and brachytherapy) and the use of oesophageal stents.
Whilst treatments should be both evidence based and tailored to factors related to the individual patient, their disease and indeed their values, the cause of such regional variation is difficult to understand. There is clearly more work required to generate consensus practice guidelines or participate in high quality research to answer therapeutic uncertainties where these exist.

Copyright © 2018, Healthcare Quality Improvement Partnership Ltd. (HQIP), National Oesophago-gastric Cancer Audit 2018. All rights reserved. 63
Annex 1: Organisation of the Audit
The project is assisted by a Clinical Reference Group (CRG), the membership of which is drawn from clinical groups involved in the management of oesophago-gastric cancer and patient organisations.
The project is overseen by a Project Board, which has senior representatives from the four participating organisations and the funding body.
Members of Clinical Reference Group
Jan van der Meulen (chair) Professor of Clinical Epidemiology London School of Hygiene and Tropical Medicine
Mike Hallisey Consultant Surgeon Birmingham Association of Cancer Surgeons
David McKinlay Programme Manager Healthcare Quality Improvement Partnership (HQIP)
Bill Allum Consultant Surgeon Member of Specialised Cancer Surgery Commissioning Group
James Gossage Consultant Upper Gastrointestinal Surgeon Association of Upper Gastrointestinal Surgeons
Nic Mapstone Consultant Pathologist Royal College of Pathologists
Hans-Ulrich Laasch Consultant Radiologist Royal College of Radiologists
Sam Ahmedzai Emeritus Professor of Supportive Care Medicine Palliative Care Representative
Nick Carroll Consultant Radiologist and Endoscopist UK EUS Users Group
Fiona Huddy Specialist Dietitian British Dietetic Association Oncology Group
Richard Roope RCGP/CRUK Clinical Lead for Cancer Durham University
John Taylor Patient representative Oesophageal Patients Association
with members of the project team
Members of Project Board
Jan van der Meulen (chair) London School of Hygiene and Tropical Medicine
Richard Hardwick Association of Upper GI Surgeons (AUGIS)
Diana Tait Royal College Radiologists (RCR)
Alison Roe NHS Digital
David McKinlay Healthcare Quality Improvement Partnership (HQIP)
Kirsten Windfuhr Healthcare Quality Improvement Partnership (HQIP)
with members of the project team

Copyright © 2018, Healthcare Quality Improvement Partnership Ltd. (HQIP), National Oesophago-gastric Cancer Audit 2018. All rights reserved. 64
Annex 2: Audit methods
Inclusion criteria
The Audit prospectively collects both clinical and demographic details for patients diagnosed with invasive epithelial oesophago-gastric (OG) cancer (ICD-10 codes C15 and C16), or high-grade dysplasia (HGD) of the oesophagus. Patients are eligible for inclusion if they were diagnosed in an NHS hospital in England or Wales, and were aged 18 or over at diagnosis. This information was combined with other available datasets to provide a rich description of the care process and to minimise the burden of data collection on clinical staff.
Data collection
All NHS trusts in England involved in the care of both curative and palliative OG cancer patients are required to upload patient information into the Clinical Audit Platform (CAP) managed by NHS Digital. Information on the care pathway and outcomes are entered prospectively either manually or via a ‘csv’ file generated from other information systems. As many hospitals can be involved in the care of one patient, the hospital responsible for diagnosis or treatment uploads the relevant data, which is then anonymised by NHS Digital. Data for each patient is then collated and analysed by the Clinical Effectiveness Unit (CEU), Royal College of Surgeons. Information on the pro-forma for data collection and the data dictionary are available from www.nogca.org.uk.
Welsh data was provided by the Cancer Network Information System Cymru (CaNISC). This dataset did not provide access to information on surgical complication rates, details of chemotherapy or radiotherapy regimens or on patients diagnosed with oesophageal HGD. Consequently, results requiring these data are not reported for Welsh patients.
Linkage to other datasets
The Audit dataset is linked to various other national datasets. This process reduces the burden of data collection, enables the quality of the data submitted by hospitals to be checked by comparing data items shared by the different datasets, and allows the Audit to derive a richer set of results.
The Audit dataset was linked to extracts from the:
• Office for National Statistics (ONS) Death Register to provide accurate statistics on cancer survival
• Hospital Episode Statistics (HES) to provide additional information on hospital care both before and after the date of diagnosis, and to validate activity data provided by hospitals (eg, dates of procedures)
• Welsh hospital administrative database (Patient Episode Database for Wales (PEDW)
• The national radiotherapy dataset (RTDS) that provides information on the episodes of radiotherapy received by patients
• The national systemic cancer dataset (SACT) that provides information on the regimens of chemotherapy delivered to patients
Data were linked using a hierarchical deterministic approach, which involved matching patient records using various patient identifiers (NHS number, sex, date of birth, and postcode).
Use of Hospital Episode Statistics
Hospitals Episode Statistics (HES) is the national hospital administrative database for all acute NHS trusts in England. Each HES record describes the period during which an admitted patient is under the care of a hospital consultant (an episode). Clinical information is captured using the International Classification of Disease (ICD-10) diagnostic codes and the Classification of Surgical Operations and Procedures (OPCS-4). The records of an individual patient are allocated the same anonymised identifier which enables the care given to patients to be followed over time.
Patients with oesophago-gastric (OG) cancer were identified in HES by searching records for the ICD diagnosis codes C15 and C16 in the first diagnostic field. As it is possible for a patient to have multiple HES episodes during a single admission to hospital, in order to determine the number of OG cancer patients in HES over the relevant timeframe, the date of diagnosis was taken as the admission date of the episode in HES where OG cancer was first recorded in the first diagnostic field.
OPCS-4 procedure codes used to identify relevant endoscopic procedures in patients diagnosed with HGD
OPCS-4 code Description
Diagnostic OGD
G45, G16 Diagnostic endoscopy of upper GI tract/oesophagus
G19.1, G19.8, G19.9 Diagnostic examination of oesophagus using rigid oesophagoscope
Endoscopic ablation of oesophagus
G14.2, G43.2 Laser resection of lesion oesophagus/UGIT
G14.3, G43.3 Cauterisation of lesion oesophagus /UGIT
G14.5, G43.5 Destruction of lesion oesophagus /UGIT
G14.7, G42.2 Photodynamic therapy of lesion oesophagus /UGIT
G17.2, G17.3 Ablation of oesophagus using rigid oesophagoscope
Possible additional ablation
Y11.4, Y13.4 Radiofrequency controlled thermal destruction of organ/lesion of organ (if occurs at time of oesophagogastroduodenoscopy (OGD)
Y13.6 Photodynamic therapy of lesion of organ (if occurs at time of OGD)
Y13.1 Cauterisation of lesion of organ (if occurs at time of OGD)
Y08 Laser excision/destruction of organ/lesion of organ
Endoscopic resection

Copyright © 2018, Healthcare Quality Improvement Partnership Ltd. (HQIP), National Oesophago-gastric Cancer Audit 2018. All rights reserved. 65
OPCS-4 procedure codes used to identify relevant endoscopic procedures in patients diagnosed with HGD
G14.1, G43.1 Snare resection of lesion oesophagus/UGIT
G14.6, G42.1 Submucosal resection of lesion oesophagus/UGIT
G17.1 Resection of oesophagus using rigid oesophagoscope
Other therapeutic OGD
G14.8, G14.9, G42.8, G42.9, G43.8, G43.9
Other endoscopic extirpation of lesion of oesophagus/UGIT
G15.8, G15.9, G44.8, G44.9, G46.8, G46.9
Other therapeutic endoscopic operation on oesophagus/UGIT
G17.8, G17.9 Extirpation of lesion of oesophagus using rigid oesophagoscope
G18.8, G18.9 Other therapeutic endoscopic operation using rigid oesophagoscope
Statistical analysis of data
The results of the Audit are presented at different levels:
1. by Cancer Alliance for England, with Wales considered as three separate areas (Abertawe Bro Morgannwg, North Wales and South Wales), and
2. by English NHS trust / Welsh local health board.
The values of the various process and outcome indicators are typically expressed as rates and are presented as percentages. Averages and rates are typically presented with 95% confidence intervals (CI) to describe their level of precision. When shown graphically, regional rates are plotted against the overall national rate, with regions ordered according to the number of patients on whom data were submitted. English patients were allocated to the Cancer Alliance based on their NHS trust of diagnosis and not by region of residence. Welsh patients were similarly allocated to the region based on the local health board of diagnosis.
In descriptive analyses of continuous variables, the distribution of values is described using appropriate statistics (e.g., mean and standard deviation or median and interquartile range). We follow the Office for National Statistics policy on the publication of small numbers to minimise the risk of patient identification from these aggregate results.
The statistical significance of differences between patient groups or geographical regions were tested using appropriate tests (such as a t-test for the difference between two continuous variables and a chi-squared test for the differences between proportions).
We derived risk-adjusted 30-day and 90-day mortality rates for patients who underwent curative surgery for each NHS trust. The rates were adjusted to take into account differences in the case mix of patients treated at each centre using a flexible parametric survival model. This model was used to estimate the risk of death for each individual having surgery, and these were then summed to calculate the predicted number of deaths for each NHS trust. The regression models included the following patient characteristics: age at diagnosis, gender, comorbidities, performance status, overall stage of tumour, site of tumour and ASA grade.
We present the organisational postoperative mortality rates after curative surgery using funnel plots. Two funnel limits were used that indicate the ranges within which 95.0% (representing a difference of two standard deviations from the national rate) or 99.8% (representing a difference of three standard deviations) would be expected to fall if variation was due only to sampling error. The control limits were calculated using the “exact” binomial method. Following convention, we use the 99.8% limits to identify ‘outliers’ as it is unlikely for an NHS organisation to fall beyond these limits solely by chance.
If the Audit identifies an NHS organisation as an outlier, we follow the process outlined in the Department of Health “Detection and Management of Outliers” policy, published in January 2011. This policy involves giving the organisation an opportunity to review their data to ensure it is complete and free of errors. If the organisation remains an outlier after this review, the Audit will contact the organisation’s clinical governance lead, Medical Director and Chief Executive. The CQC will also be informed.
The results of NHS trusts with a case volume of less than 10 were not included in the funnel plots because such small samples lead to unreliable statistical estimates due to the play of chance.

Copyright © 2018, Healthcare Quality Improvement Partnership Ltd. (HQIP), National Oesophago-gastric Cancer Audit 2018. All rights reserved. 66
Annex 3: List of regional areas and NHS organisations in England and WalesCancer Alliance/Vanguard or Welsh Region NHS Trust/
Health Board codeNHS Trust/Health Board name
Cheshire and Merseyside RBT Mid Cheshire Hospitals NHS Foundation Trust
RJN East Cheshire NHS Trust
RBL Wirral University Teaching Hospital NHS Foundation Trust
RBN St Helens and Knowsley Hospitals NHS Trust
REM Aintree University Hospital NHS Foundation Trust
RJR Countess of Chester Hospital NHS Foundation Trust
RQ6 Royal Liverpool and Broadgreen University Hospitals NHS Trust
RVY Southport and Ormskirk Hospital NHS Trust
RWW Warrington and Halton Hospitals NHS Foundation Trust
REN The Clatterbridge Cancer Centre NHS Foundation Trust
East Midlands RK5 Sherwood Forest Hospitals NHS Foundation Trust
RNQ Kettering General Hospital NHS Foundation Trust
RNS Northampton General Hospital NHS Trust
RTG Derby Hospitals NHS Foundation Trust
RWD United Lincolnshire Hospitals NHS Trust
RWE University Hospitals of Leicester NHS Trust
RX1 Nottingham University Hospitals NHS Trust
East of England RC9 Luton and Dunstable University Hospital NHS Foundation Trust
RWG West Hertfordshire Hospitals NHS Trust
RWH East and North Hertfordshire NHS Trust
RQW The Princess Alexandra Hospital NHS Trust
RD8 Milton Keynes Hospital NHS Foundation Trust
RC1 Bedford Hospital NHS Trust
RCX The Queen Elizabeth Hospital, King’s Lynn, NHS Foundation Trust
RGN Peterborough and Stamford Hospitals NHS Foundation Trust
RGP James Paget University Hospitals NHS Foundation Trust
RGR West Suffolk NHS Foundation Trust
RGT Cambridge University Hospitals NHS Foundation Trust
RM1 Norfolk and Norwich University Hospitals NHS Foundation Trust
RQQ Hinchingbrooke Health Care NHS Trust
RAJ Southend University Hospital NHS Foundation Trust
RDD Basildon and Thurrock University Hospitals NHS Foundation Trust
RDE Colchester Hospital University NHS Foundation Trust
RGQ Ipswich Hospital NHS Trust
RQ8 Mid Essex Hospital Services NHS Trust
Greater Manchester RM2 University Hospital of South Manchester NHS Foundation Trust
RM3 Salford Royal NHS Foundation Trust
RMC Bolton NHS Foundation Trust
RMP Tameside and Glossop Integrated Care NHS Foundation Trust
RRF Wrightington, Wigan and Leigh NHS Foundation Trust
RW3 Central Manchester University Hospitals NHS Foundation Trust
RW6 Pennine Acute Hospitals NHS Trust
RWJ Stockport NHS Foundation Trust
RBV The Christie NHS Foundation Trust
Humber, Coast and Vale RCB York Teaching Hospital NHS Foundation Trust
RJL Northern Lincolnshire and Goole NHS Foundation Trust
RWA Hull and East Yorkshire Hospitals NHS Trust
Kent and Medway RN7 Dartford and Gravesham NHS Trust
RPA Medway NHS Foundation Trust
RVV East Kent Hospitals University NHS Foundation Trust
RWF Maidstone and Tunbridge Wells NHS Trust
Lancashire and South Cumbria RXL Blackpool Teaching Hospitals NHS Foundation Trust
RXN Lancashire Teaching Hospitals NHS Foundation Trust
RXR East Lancashire Hospitals NHS Trust
RTX University Hospitals of Morecambe Bay NHS Foundation Trust

Copyright © 2018, Healthcare Quality Improvement Partnership Ltd. (HQIP), National Oesophago-gastric Cancer Audit 2018. All rights reserved. 67
Cancer Alliance/Vanguard or Welsh Region NHS Trust/Health Board code
NHS Trust/Health Board name
North Central and North East London RAL Royal Free London NHS Foundation Trust
RAP North Middlesex University Hospital NHS Trust
RKE The Whittington Hospital NHS Trust
RRV University College London Hospitals NHS Foundation Trust
R1H Barts Health NHS Trust
RF4 Barking, Havering and Redbridge University Hospitals NHS Trust
RQX Homerton University Hospital NHS Foundation Trust
North East and Cumbria RE9 South Tyneside NHS Foundation Trust
RLN City Hospitals Sunderland NHS Foundation Trust
RNL North Cumbria University Hospitals NHS Trust
RR7 Gateshead Health NHS Foundation Trust
RTD The Newcastle Upon Tyne Hospitals NHS Foundation Trust
RTF Northumbria Healthcare NHS Foundation Trust
RTR South Tees Hospitals NHS Foundation Trust
RVW North Tees and Hartlepool NHS Foundation Trust
RXP County Durham and Darlington NHS Foundation Trust
Peninsula RA9 Torbay and South Devon NHS Foundation Trust
RBZ Northern Devon Healthcare NHS Trust
REF Royal Cornwall Hospitals NHS Trust
RH8 Royal Devon and Exeter NHS Foundation Trust
RK9 Plymouth Hospitals NHS Trust
Somerset, Wiltshire, Avon and Gloucestershire RA3 Weston Area Health NHS Trust
RA4 Yeovil District Hospital NHS Foundation Trust
RA7 University Hospitals Bristol NHS Foundation Trust
RBA Taunton and Somerset NHS Foundation Trust
RD1 Royal United Hospitals Bath NHS Foundation Trust
RVJ North Bristol NHS Trust
RTE Gloucestershire Hospitals NHS Foundation Trust
RNZ Salisbury NHS Foundation Trust
South East London RJ1 Guy’s and St Thomas’ NHS Foundation Trust
RJ2 Lewisham and Greenwich NHS Trust
RJZ King’s College Hospital NHS Foundation Trust
South Yorkshire, Bassetlaw and North Derbyshire RFF Barnsley Hospital NHS Foundation Trust
RFR The Rotherham NHS Foundation Trust
RFS Chesterfield Royal Hospital NHS Foundation Trust
RHQ Sheffield Teaching Hospitals NHS Foundation Trust
RP5 Doncaster and Bassetlaw Hospitals NHS Foundation Trust
Surrey and Sussex RA2 Royal Surrey County Hospital NHS Foundation Trust
RDU Frimley Park Hospital NHS Foundation Trust
RTK Ashford and St Peter’s Hospitals NHS Foundation Trust
RTP Surrey and Sussex Healthcare NHS Trust
RXC East Sussex Healthcare NHS Trust
RXH Brighton and Sussex University Hospitals NHS Trust
RYR Western Sussex Hospitals NHS Foundation Trust
Thames Valley RHW Royal Berkshire NHS Foundation Trust
RN3 Great Western Hospitals NHS Foundation Trust
RTH Oxford University Hospitals NHS Trust
RXQ Buckinghamshire Healthcare NHS Trust
Wessex RBD Dorset County Hospital NHS Foundation Trust
RD3 Poole Hospital NHS Foundation Trust
RDZ The Royal Bournemouth and Christchurch Hospitals NHS Foundation Trust
R1F Isle of Wight NHS Trust
RHM University Hospital Southampton NHS Foundation Trust
RHU Portsmouth Hospitals NHS Trust
RN5 Hampshire Hospitals NHS Foundation Trust
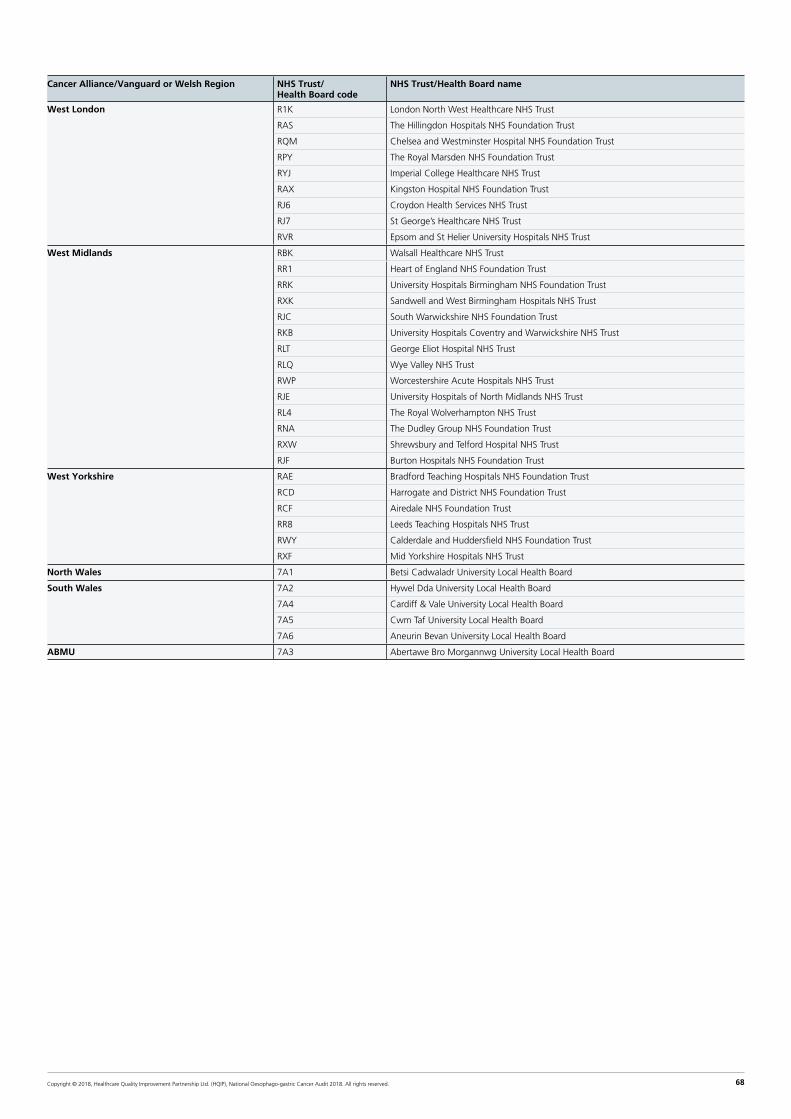
Copyright © 2018, Healthcare Quality Improvement Partnership Ltd. (HQIP), National Oesophago-gastric Cancer Audit 2018. All rights reserved. 68
Cancer Alliance/Vanguard or Welsh Region NHS Trust/Health Board code
NHS Trust/Health Board name
West London R1K London North West Healthcare NHS Trust
RAS The Hillingdon Hospitals NHS Foundation Trust
RQM Chelsea and Westminster Hospital NHS Foundation Trust
RPY The Royal Marsden NHS Foundation Trust
RYJ Imperial College Healthcare NHS Trust
RAX Kingston Hospital NHS Foundation Trust
RJ6 Croydon Health Services NHS Trust
RJ7 St George’s Healthcare NHS Trust
RVR Epsom and St Helier University Hospitals NHS Trust
West Midlands RBK Walsall Healthcare NHS Trust
RR1 Heart of England NHS Foundation Trust
RRK University Hospitals Birmingham NHS Foundation Trust
RXK Sandwell and West Birmingham Hospitals NHS Trust
RJC South Warwickshire NHS Foundation Trust
RKB University Hospitals Coventry and Warwickshire NHS Trust
RLT George Eliot Hospital NHS Trust
RLQ Wye Valley NHS Trust
RWP Worcestershire Acute Hospitals NHS Trust
RJE University Hospitals of North Midlands NHS Trust
RL4 The Royal Wolverhampton NHS Trust
RNA The Dudley Group NHS Foundation Trust
RXW Shrewsbury and Telford Hospital NHS Trust
RJF Burton Hospitals NHS Foundation Trust
West Yorkshire RAE Bradford Teaching Hospitals NHS Foundation Trust
RCD Harrogate and District NHS Foundation Trust
RCF Airedale NHS Foundation Trust
RR8 Leeds Teaching Hospitals NHS Trust
RWY Calderdale and Huddersfield NHS Foundation Trust
RXF Mid Yorkshire Hospitals NHS Trust
North Wales 7A1 Betsi Cadwaladr University Local Health Board
South Wales 7A2 Hywel Dda University Local Health Board
7A4 Cardiff & Vale University Local Health Board
7A5 Cwm Taf University Local Health Board
7A6 Aneurin Bevan University Local Health Board
ABMU 7A3 Abertawe Bro Morgannwg University Local Health Board
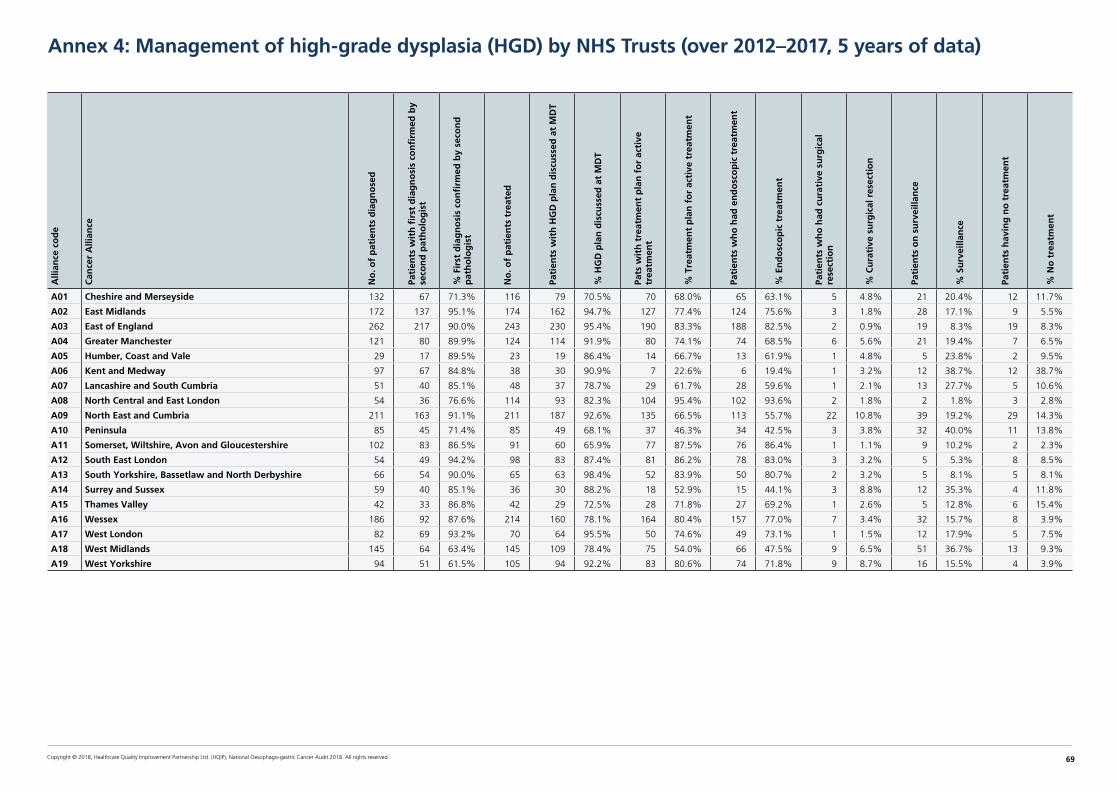
Copyright © 2018, Healthcare Quality Improvement Partnership Ltd. (HQIP), National Oesophago-gastric Cancer Audit 2018. All rights reserved. 69
Annex 4: Management of high-grade dysplasia (HGD) by NHS Trusts (over 2012–2017, 5 years of data)A
llian
ce c
od
e
Can
cer
Alli
ance
No
. of
pat
ien
ts d
iag
no
sed
Pati
ents
wit
h fi
rst
dia
gn
osi
s co
nfi
rmed
by
seco
nd
pat
ho
log
ist
% F
irst
dia
gn
osi
s co
nfi
rmed
by
seco
nd
p
ath
olo
gis
t
No
. of
pat
ien
ts t
reat
ed
Pati
ents
wit
h H
GD
pla
n d
iscu
ssed
at
MD
T
% H
GD
pla
n d
iscu
ssed
at
MD
T
Pats
wit
h t
reat
men
t p
lan
fo
r ac
tive
tr
eatm
ent
% T
reat
men
t p
lan
fo
r ac
tive
tre
atm
ent
Pati
ents
wh
o h
ad e
nd
osc
op
ic t
reat
men
t
% E
nd
osc
op
ic t
reat
men
t
Pati
ents
wh
o h
ad c
ura
tive
su
rgic
al
rese
ctio
n
% C
ura
tive
su
rgic
al r
esec
tio
n
Pati
ents
on
su
rvei
llan
ce
% S
urv
eilla
nce
Pati
ents
hav
ing
no
tre
atm
ent
% N
o t
reat
men
t
A01 Cheshire and Merseyside 132 67 71.3% 116 79 70.5% 70 68.0% 65 63.1% 5 4.8% 21 20.4% 12 11.7%
A02 East Midlands 172 137 95.1% 174 162 94.7% 127 77.4% 124 75.6% 3 1.8% 28 17.1% 9 5.5%
A03 East of England 262 217 90.0% 243 230 95.4% 190 83.3% 188 82.5% 2 0.9% 19 8.3% 19 8.3%
A04 Greater Manchester 121 80 89.9% 124 114 91.9% 80 74.1% 74 68.5% 6 5.6% 21 19.4% 7 6.5%
A05 Humber, Coast and Vale 29 17 89.5% 23 19 86.4% 14 66.7% 13 61.9% 1 4.8% 5 23.8% 2 9.5%
A06 Kent and Medway 97 67 84.8% 38 30 90.9% 7 22.6% 6 19.4% 1 3.2% 12 38.7% 12 38.7%
A07 Lancashire and South Cumbria 51 40 85.1% 48 37 78.7% 29 61.7% 28 59.6% 1 2.1% 13 27.7% 5 10.6%
A08 North Central and East London 54 36 76.6% 114 93 82.3% 104 95.4% 102 93.6% 2 1.8% 2 1.8% 3 2.8%
A09 North East and Cumbria 211 163 91.1% 211 187 92.6% 135 66.5% 113 55.7% 22 10.8% 39 19.2% 29 14.3%
A10 Peninsula 85 45 71.4% 85 49 68.1% 37 46.3% 34 42.5% 3 3.8% 32 40.0% 11 13.8%
A11 Somerset, Wiltshire, Avon and Gloucestershire 102 83 86.5% 91 60 65.9% 77 87.5% 76 86.4% 1 1.1% 9 10.2% 2 2.3%
A12 South East London 54 49 94.2% 98 83 87.4% 81 86.2% 78 83.0% 3 3.2% 5 5.3% 8 8.5%
A13 South Yorkshire, Bassetlaw and North Derbyshire 66 54 90.0% 65 63 98.4% 52 83.9% 50 80.7% 2 3.2% 5 8.1% 5 8.1%
A14 Surrey and Sussex 59 40 85.1% 36 30 88.2% 18 52.9% 15 44.1% 3 8.8% 12 35.3% 4 11.8%
A15 Thames Valley 42 33 86.8% 42 29 72.5% 28 71.8% 27 69.2% 1 2.6% 5 12.8% 6 15.4%
A16 Wessex 186 92 87.6% 214 160 78.1% 164 80.4% 157 77.0% 7 3.4% 32 15.7% 8 3.9%
A17 West London 82 69 93.2% 70 64 95.5% 50 74.6% 49 73.1% 1 1.5% 12 17.9% 5 7.5%
A18 West Midlands 145 64 63.4% 145 109 78.4% 75 54.0% 66 47.5% 9 6.5% 51 36.7% 13 9.3%
A19 West Yorkshire 94 51 61.5% 105 94 92.2% 83 80.6% 74 71.8% 9 8.7% 16 15.5% 4 3.9%

Copyright © 2018, Healthcare Quality Improvement Partnership Ltd. (HQIP), National Oesophago-gastric Cancer Audit 2018. All rights reserved. 70
Annex 5: Levels of case ascertainment for English NHS Trusts and Welsh Health Boards (April 2015–March 2017)
Key
Audit year● >80% ■ 50–80% ▲ <50%
Estimates of the number of patients diagnosed in England and Wales with oesophago-gastric (OG) cancer are derived from the number of patients whose first record with OG cancer (ICD code: C15/C16) in HES / PEDW within the Audit period. HES / PEDW data do not provide a gold standard for comparison,
but can give an indication on major discrepancies between patients submitted in the audit and patients documented to receiving care for OG cancer. NHS trusts / local health boards submitting less than 10 cases in the 2 year period were excluded from the comparison. Note: Three Trusts were not included in the Annex, as they are tertiary treatment centres only
Alli
ance
/W
elsh
reg
ion
Reg
ion
nam
e
NH
S o
rgan
isat
ion
co
de
NH
S o
rgan
isat
ion
nam
e
Exp
ecte
d c
ases
bas
ed o
n H
ES
Tum
ou
r re
cord
s su
bm
itte
d
% C
ase
asce
rtai
nm
ent
rate
(g
rou
ped
)
A01 Cheshire and Merseyside RBL Wirral University Teaching Hospital NHS Foundation Trust 151 to 200 172 >90 ●
RBN St Helens and Knowsley Hospitals NHS Trust 151 to 200 140 81 to 90 ●
RBT Mid Cheshire Hospitals NHS Foundation Trust 101 to 150 112 81 to 90 ●
REM Aintree University Hospital NHS Foundation Trust 201 to 250 184 71 to 80 ■
RJN East Cheshire NHS Trust 51 to 100 95 >90 ●
RJR Countess of Chester Hospital NHS Foundation Trust 101 to 150 62 41 to 50 ▲
RQ6 Royal Liverpool and Broadgreen University Hospitals NHS Trust 251 to 300 249 81 to 90 ●
RVY Southport and Ormskirk Hospital NHS Trust 101 to 150 65 61 to 70 ■
RWW Warrington and Halton Hospitals NHS Foundation Trust 101 to 150 37 0 to 40 ▲
A02 East Midlands RK5 Sherwood Forest Hospitals NHS Foundation Trust 151 to 200 162 81 to 90 ●
RNQ Kettering General Hospital NHS Foundation Trust 101 to 150 128 >90 ●
RNS Northampton General Hospital NHS Trust 151 to 200 115 71 to 80 ■
RTG Derby Hospitals NHS Foundation Trust 301 to 350 256 81 to 90 ●
RWD United Lincolnshire Hospitals NHS Trust 301 to 350 120 0 to 40 ▲
RWE University Hospitals of Leicester NHS Trust 451 to 500 374 81 to 90 ●
RX1 Nottingham University Hospitals NHS Trust 251 to 300 273 >90 ●
A03 East of England RAJ Southend University Hospital NHS Foundation Trust 101 to 150 125 >90 ●
RC1 Bedford Hospital NHS Trust 51 to 100 95 >90 ●
RC9 Luton and Dunstable University Hospital NHS Foundation Trust 101 to 150 112 >90 ●
RCX The Queen Elizabeth Hospital, King’s Lynn, NHS Foundation Trust 151 to 200 140 81 to 90 ●
RD8 Milton Keynes Hospital NHS Foundation Trust 51 to 100 82 81 to 90 ●
RDD Basildon and Thurrock University Hospitals NHS Foundation Trust 101 to 150 79 61 to 70 ■
RDE Colchester Hospital University NHS Foundation Trust 151 to 200 158 >90 ●
RGN Peterborough and Stamford Hospitals NHS Foundation Trust 101 to 150 101 61 to 70 ■
RGP James Paget University Hospitals NHS Foundation Trust 101 to 150 115 81 to 90 ●
RGQ Ipswich Hospital NHS Trust 101 to 150 162 >90 ●
RGR West Suffolk NHS Foundation Trust 51 to 100 98 >90 ●
RGT Cambridge University Hospitals NHS Foundation Trust 251 to 300 172 61 to 70 ■
RM1 Norfolk and Norwich University Hospitals NHS Foundation Trust 301 to 350 221 71 to 80 ■
RQ8 Mid Essex Hospital Services NHS Trust 201 to 250 138 61 to 70 ■
RQQ Hinchingbrooke Health Care NHS Trust 51 to 100 73 >90 ●
RQW The Princess Alexandra Hospital NHS Trust 51 to 100 86 >90 ●
RWG West Hertfordshire Hospitals NHS Trust 151 to 200 132 71 to 80 ■
RWH East and North Hertfordshire NHS Trust 151 to 200 135 81 to 90 ●
A04 Greater Manchester RM2 University Hospital of South Manchester NHS Foundation Trust 101 to 150 111 81 to 90 ●
RM3 Salford Royal NHS Foundation Trust 151 to 200 99 51 to 60 ■
RMC Bolton NHS Foundation Trust 101 to 150 115 >90 ●
RMP Tameside and Glossop Integrated Care NHS Foundation Trust 101 to 150 86 71 to 80 ■
RRF Wrightington, Wigan and Leigh NHS Foundation Trust 151 to 200 134 81 to 90 ●
RW3 Central Manchester University Hospitals NHS Foundation Trust 151 to 200 171 >90 ●
RW6 Pennine Acute Hospitals NHS Trust 301 to 350 306 >90 ●
RWJ Stockport NHS Foundation Trust 101 to 150 128 >90 ●

Copyright © 2018, Healthcare Quality Improvement Partnership Ltd. (HQIP), National Oesophago-gastric Cancer Audit 2018. All rights reserved. 71
Alli
ance
/W
elsh
reg
ion
Reg
ion
nam
e
NH
S o
rgan
isat
ion
co
de
NH
S o
rgan
isat
ion
nam
e
Exp
ecte
d c
ases
bas
ed o
n H
ES
Tum
ou
r re
cord
s su
bm
itte
d
% C
ase
asce
rtai
nm
ent
rate
(g
rou
ped
)
A05 Humber, Coast and Vale RCB York Teaching Hospital NHS Foundation Trust 251 to 300 207 81 to 90 ●
RJL Northern Lincolnshire and Goole NHS Foundation Trust 201 to 250 197 >90 ●
RWA Hull and East Yorkshire Hospitals NHS Trust 251 to 300 230 71 to 80 ■
A06 Kent and Medway RN7 Dartford and Gravesham NHS Trust 101 to 150 102 71 to 80 ■
RPA Medway NHS Foundation Trust 101 to 150 105 81 to 90 ●
RVV East Kent Hospitals University NHS Foundation Trust 301 to 350 305 >90 ●
RWF Maidstone and Tunbridge Wells NHS Trust 201 to 250 175 81 to 90 ●
A07 Lancashire and South Cumbria
RTX University Hospitals of Morecambe Bay NHS Foundation Trust 151 to 200 147 >90 ●
RXL Blackpool Teaching Hospitals NHS Foundation Trust 151 to 200 182 >90 ●
RXN Lancashire Teaching Hospitals NHS Foundation Trust 201 to 250 185 81 to 90 ●
RXR East Lancashire Hospitals NHS Trust 201 to 250 209 >90 ●
A08 North Central and East London
R1H Barts Health NHS Trust 201 to 250 166 61 to 70 ■
RAL Royal Free London NHS Foundation Trust 201 to 250 226 >90 ●
RAP North Middlesex University Hospital NHS Trust 51 to 100 108 >90 ●
RF4 Barking, Havering and Redbridge University Hospitals NHS Trust 201 to 250 222 >90 ●
RKE The Whittington Hospital NHS Trust <50 39 81 to 90 ●
RQX Homerton University Hospital NHS Foundation Trust 51 to 100 47 71 to 80 ■
RRV University College London Hospitals NHS Foundation Trust 201 to 250 88 41 to 50 ▲
A09 North East and Cumbria RE9 South Tyneside NHS Foundation Trust 51 to 100 88 >90 ●
RLN City Hospitals Sunderland NHS Foundation Trust 151 to 200 139 >90 ●
RNL North Cumbria University Hospitals NHS Trust 101 to 150 129 81 to 90 ●
RR7 Gateshead Health NHS Foundation Trust 101 to 150 114 >90 ●
RTD The Newcastle Upon Tyne Hospitals NHS Foundation Trust 301 to 350 238 61 to 70 ■
RTF Northumbria Healthcare NHS Foundation Trust 201 to 250 223 >90 ●
RTR South Tees Hospitals NHS Foundation Trust 251 to 300 253 81 to 90 ●
RVW North Tees and Hartlepool NHS Foundation Trust 151 to 200 171 >90 ●
RXP County Durham and Darlington NHS Foundation Trust 201 to 250 224 >90 ●
A10 Peninsula RA9 Torbay and South Devon NHS Foundation Trust 101 to 150 107 81 to 90 ●
RBZ Northern Devon Healthcare NHS Trust 51 to 100 75 >90 ●
REF Royal Cornwall Hospitals NHS Trust 151 to 200 168 81 to 90 ●
RH8 Royal Devon and Exeter NHS Foundation Trust 201 to 250 190 81 to 90 ●
RK9 Plymouth Hospitals NHS Trust 201 to 250 190 81 to 90 ●
A11 Somerset, Wiltshire, Avon and Gloucestershire
RA3 Weston Area Health NHS Trust 51 to 100 55 51 to 60 ■
RA4 Yeovil District Hospital NHS Foundation Trust 51 to 100 44 61 to 70 ■
RA7 University Hospitals Bristol NHS Foundation Trust 201 to 250 142 61 to 70 ■
RBA Taunton and Somerset NHS Foundation Trust 101 to 150 126 >90 ●
RD1 Royal United Hospitals Bath NHS Foundation Trust 151 to 200 100 61 to 70 ■
RNZ Salisbury NHS Foundation Trust 51 to 100 82 81 to 90 ●
RTE Gloucestershire Hospitals NHS Foundation Trust 301 to 350 286 81 to 90 ●
RVJ North Bristol NHS Trust 101 to 150 144 >90 ●
A12 South East London RJ1 Guy's and St Thomas' NHS Foundation Trust 301 to 350 32 0 to 40 ▲
RJ2 Lewisham and Greenwich NHS Trust 101 to 150 80 51 to 60 ■
RJZ King’s College Hospital NHS Foundation Trust 201 to 250 168 71 to 80 ■
A13 South Yorkshire, Bassetlaw and North Derbyshire
RFF Barnsley Hospital NHS Foundation Trust 51 to 100 98 >90 ●
RFR The Rotherham NHS Foundation Trust 101 to 150 101 >90 ●
RFS Chesterfield Royal Hospital NHS Foundation Trust 101 to 150 149 >90 ●
RHQ Sheffield Teaching Hospitals NHS Foundation Trust 351 to 400 256 61 to 70 ■
RP5 Doncaster and Bassetlaw Hospitals NHS Foundation Trust 201 to 250 196 81 to 90 ●
A14 Surrey and Sussex RA2 Royal Surrey County Hospital NHS Foundation Trust 151 to 200 102 61 to 70 ■
RDU Frimley Park Hospital NHS Foundation Trust 251 to 300 167 61 to 70 ■
RTK Ashford and St Peter's Hospitals NHS Foundation Trust 51 to 100 74 71 to 80 ■
RTP Surrey and Sussex Healthcare NHS Trust 101 to 150 85 81 to 90 ●
RXC East Sussex Healthcare NHS Trust 201 to 250 181 81 to 90 ●
RXH Brighton and Sussex University Hospitals NHS Trust 151 to 200 90 51 to 60 ■
RYR Western Sussex Hospitals NHS Foundation Trust 201 to 250 210 >90 ●

Copyright © 2018, Healthcare Quality Improvement Partnership Ltd. (HQIP), National Oesophago-gastric Cancer Audit 2018. All rights reserved. 72
Alli
ance
/W
elsh
reg
ion
Reg
ion
nam
e
NH
S o
rgan
isat
ion
co
de
NH
S o
rgan
isat
ion
nam
e
Exp
ecte
d c
ases
bas
ed o
n H
ES
Tum
ou
r re
cord
s su
bm
itte
d
% C
ase
asce
rtai
nm
ent
rate
(g
rou
ped
)
A15 Thames Valley RHW Royal Berkshire NHS Foundation Trust 151 to 200 27 0 to 40 ▲
RN3 Great Western Hospitals NHS Foundation Trust 101 to 150 128 >90 ●
RTH Oxford University Hospitals NHS Trust 251 to 300 144 51 to 60 ■
RXQ Buckinghamshire Healthcare NHS Trust 101 to 150 99 71 to 80 ■
A16 Wessex R1F Isle of Wight NHS Trust 51 to 100 62 >90 ●
RBD Dorset County Hospital NHS Foundation Trust 101 to 150 107 >90 ●
RD3 Poole Hospital NHS Foundation Trust 101 to 150 115 >90 ●
RDZ The Royal Bournemouth and Christchurch Hospitals NHS Foundation Trust 151 to 200 127 61 to 70 ■
RHM University Hospital Southampton NHS Foundation Trust 201 to 250 187 81 to 90 ●
RHU Portsmouth Hospitals NHS Trust 251 to 300 214 71 to 80 ■
RN5 Hampshire Hospitals NHS Foundation Trust 151 to 200 132 71 to 80 ■
A17 West London R1K London North West Healthcare NHS Trust 151 to 200 209 >90 ●
RAS The Hillingdon Hospitals NHS Foundation Trust 51 to 100 67 >90 ●
RAX Kingston Hospital NHS Foundation Trust 51 to 100 91 >90 ●
RJ6 Croydon Health Services NHS Trust 51 to 100 86 >90 ●
RJ7 St George's Healthcare NHS Trust 101 to 150 120 >90 ●
RPY The Royal Marsden NHS Foundation Trust 101 to 150 27 0 to 40 ▲
RQM Chelsea and Westminster Hospital NHS Foundation Trust 101 to 150 122 >90 ●
RVR Epsom and St Helier University Hospitals NHS Trust 101 to 150 123 >90 ●
RYJ Imperial College Healthcare NHS Trust 151 to 200 144 71 to 80 ■
A18 West Midlands RBK Walsall Healthcare NHS Trust 101 to 150 39 0 to 40 ▲
RJC South Warwickshire NHS Foundation Trust 51 to 100 48 51 to 60 ■
RJE University Hospitals of North Midlands NHS Trust 401 to 450 255 51 to 60 ■
RJF Burton Hospitals NHS Foundation Trust 101 to 150 116 >90 ●
RKB University Hospitals Coventry and Warwickshire NHS Trust 251 to 300 156 61 to 70 ■
RL4 The Royal Wolverhampton NHS Trust 201 to 250 146 51 to 60 ■
RLQ Wye Valley NHS Trust <50 78 >90 ●
RLT George Eliot Hospital NHS Trust 51 to 100 71 71 to 80 ■
RNA The Dudley Group NHS Foundation Trust 201 to 250 182 81 to 90 ●
RR1 Heart of England NHS Foundation Trust 351 to 400 333 >90 ●
RRK University Hospitals Birmingham NHS Foundation Trust 251 to 300 189 61 to 70 ■
RWP Worcestershire Acute Hospitals NHS Trust 251 to 300 261 81 to 90 ●
RXK Sandwell and West Birmingham Hospitals NHS Trust 51 to 100 176 >90 ●
RXW Shrewsbury and Telford Hospital NHS Trust 201 to 250 172 71 to 80 ■
A19 West Yorkshire RAE Bradford Teaching Hospitals NHS Foundation Trust 151 to 200 136 71 to 80 ■
RCD Harrogate and District NHS Foundation Trust 51 to 100 95 >90 ●
RCF Airedale NHS Foundation Trust 51 to 100 75 >90 ●
RR8 Leeds Teaching Hospitals NHS Trust 301 to 350 248 71 to 80 ■
RWY Calderdale and Huddersfield NHS Foundation Trust 151 to 200 163 81 to 90 ●
RXF Mid Yorkshire Hospitals NHS Trust 201 to 250 230 >90 ●
ABMU ABMU 7A3 Abertawe Bro Morgannwg University Local Health Board 251 to 300 259 81 to 90 ●
BCU North Wales 7A1 Betsi Cadwaladr University Local Health Board 401 to 450 360 81 to 90 ●
Cardiff South Wales 7A2 Hywel Dda University Local Health Board 201 to 250 157 61 to 70 ■
7A4 Cardiff & Vale University Local Health Board 151 to 200 126 71 to 80 ■
7A5 Cwm Taf University Local Health Board 151 to 200 155 81 to 90 ●
7A6 Aneurin Bevan University Local Health Board 251 to 300 206 71 to 80 ■

Copyright © 2018, Healthcare Quality Improvement Partnership Ltd. (HQIP), National Oesophago-gastric Cancer Audit 2018. All rights reserved. 73
Annex 6: Data completeness for surgical and pathology records (April 2014–March 2017)A
llian
ce /
Wel
sh r
egio
n
Reg
ion
nam
e
NH
S o
rgan
isat
ion
co
de
NH
S o
rgan
isat
ion
nam
e
Surg
ical
cas
e as
cert
ain
men
t
No
. of
oes
op
hag
ecto
mie
s
No
. of
gas
trec
tom
ies
Tota
l cas
es
% c
om
ple
te c
ases
fo
r ad
equ
ate
lym
ph
no
des
% c
om
ple
te c
ases
fo
r o
es
lon
git
ud
inal
mar
gin
s
% c
om
ple
te c
ases
fo
r o
es
circ
um
mar
gin
s
% c
om
ple
te c
ases
fo
r g
ast
lon
git
ud
inal
mar
gin
s
A01 Cheshire and Merseyside REM Aintree University Hospital NHS Foundation Trust 81 to 90 65 40 105 80.0% 86.2% 84.6% 65.0%
RQ6 Royal Liverpool and Broadgreen University Hospitals NHS Trust 51 to 60 54 56 110 83.6% 88.9% 88.9% 75.0%
A02 East Midlands RTG Derby Hospitals NHS Foundation Trust >90 94 42 136 100.0% 100.0% 97.9% 95.2%
RWE University Hospitals of Leicester NHS Trust >90 128 44 172 100.0% 100.0% 99.2% 100.0%
RX1 Nottingham University Hospitals NHS Trust >90 227 101 328 98.2% 97.8% 96.5% 98.0%
A03 East of England RGT Cambridge University Hospitals NHS Foundation Trust >90 129 78 207 100.0% 100.0% 100.0% 100.0%
RM1 Norfolk and Norwich University Hospitals NHS Foundation Trust 71 to 80 115 35 150 98.0% 97.4% 97.4% 100.0%
RQ8 Mid Essex Hospital Services NHS Trust 81 to 90 146 48 194 46.9% 49.3% 48.6% 39.6%
RWG West Hertfordshire Hospitals NHS Trust >90 59 41 100 100.0% 98.3% 98.3% 100.0%
A04 Greater Manchester RM2 University Hospital of South Manchester NHS Foundation Trust >90 29 16 45 100.0% 100.0% 96.6% 100.0%
RM3 Salford Royal NHS Foundation Trust >90 135 81 216 100.0% 100.0% 100.0% 100.0%
RW3 Central Manchester University Hospitals NHS Foundation Trust >90 77 49 126 100.0% 100.0% 96.1% 100.0%
A05 Humber, Coast and Vale RWA Hull and East Yorkshire Hospitals NHS Trust 81 to 90 79 42 121 87.6% 92.4% 92.4% 78.6%
A07 Lancashire and South Cumbria RXN Lancashire Teaching Hospitals NHS Foundation Trust 81 to 90 128 65 193 100.0% 100.0% 99.2% 98.5%
A08 North Central and East London RF4 Barking, Havering and Redbridge University Hospitals NHS Trust >90 43 30 73 100.0% 100.0% 0.0% 100.0%
RRV University College London Hospitals NHS Foundation Trust >90 77 94 171 97.7% 98.7% 97.4% 96.8%
A09 North East and Cumbria RTD The Newcastle Upon Tyne Hospitals NHS Foundation Trust >90 230 159 389 100.0% 100.0% N/A 100.0%
RTR South Tees Hospitals NHS Foundation Trust >90 120 77 197 99.0% 94.2% 93.3% 90.9%
A10 Peninsula RK9 Plymouth Hospitals NHS Trust 71 to 80 200 35 235 98.3% 98.5% 98.0% 97.1%
A11 Somerset, Wiltshire, Avon and Gloucestershire RA7 University Hospitals Bristol NHS Foundation Trust 71 to 80 111 47 158 98.1% 96.4% 93.7% 97.9%
RTE Gloucestershire Hospitals NHS Foundation Trust >90 91 51 142 81.0% 81.3% 80.2% 74.5%
A12 South East London RJ1 Guy's and St Thomas' NHS Foundation Trust >90 193 98 291 100.0% 100.0% 100.0% 100.0%
A13 South Yorkshire, Bassetlaw and North Derbyshire RHQ Sheffield Teaching Hospitals NHS Foundation Trust >90 150 89 239 100.0% 99.3% 98.7% 100.0%
A14 Surrey and Sussex RA2 Royal Surrey County Hospital NHS Foundation Trust >90 92 41 133 97.7% 95.7% 94.6% 97.6%
RXH Brighton and Sussex University Hospitals NHS Trust 61 to 70 69 18 87 57.5% 405.8% 50.7% 83.3%
A15 Thames Valley RTH Oxford University Hospitals NHS Trust >90 209 83 292 99.7% 98.6% 98.6% 98.8%
Completeness of data entered by each NHS organisation for key fields needed to calculate the new indicators is given. The data were derived from the extract taken after the 3rd submission deadline for data collection.

Copyright © 2018, Healthcare Quality Improvement Partnership Ltd. (HQIP), National Oesophago-gastric Cancer Audit 2018. All rights reserved. 74
Alli
ance
/W
elsh
reg
ion
Reg
ion
nam
e
NH
S o
rgan
isat
ion
co
de
NH
S o
rgan
isat
ion
nam
e
Surg
ical
cas
e as
cert
ain
men
t
No
. of
oes
op
hag
ecto
mie
s
No
. of
gas
trec
tom
ies
Tota
l cas
es
% c
om
ple
te c
ases
fo
r ad
equ
ate
lym
ph
no
des
% c
om
ple
te c
ases
fo
r o
es
lon
git
ud
inal
mar
gin
s
% c
om
ple
te c
ases
fo
r o
es
circ
um
mar
gin
s
% c
om
ple
te c
ases
fo
r g
ast
lon
git
ud
inal
mar
gin
s
A16 Wessex RDZ The Royal Bournemouth and Christchurch Hospitals NHS Foundation Trust 71 to 80 61 18 79 70.9% 70.5% 65.6% 72.2%
RHM University Hospital Southampton NHS Foundation Trust 81 to 90 116 33 149 100.0% 99.1% 99.1% 100.0%
RHU Portsmouth Hospitals NHS Trust >90 106 46 152 100.0% 99.1% 98.1% 100.0%
A17 West London RPY The Royal Marsden NHS Foundation Trust 81 to 90 70 72 142 100.0% 100.0% 95.7% 100.0%
RYJ Imperial College Healthcare NHS Trust >90 56 62 118 99.2% 100.0% 96.4% 98.4%
A18 West Midlands RJE University Hospitals of North Midlands NHS Trust >90 135 75 210 89.0% 75.6% 75.6% 89.3%
RKB University Hospitals Coventry and Warwickshire NHS Trust >90 116 41 157 99.4% 99.1% 96.6% 100.0%
RR1 Heart of England NHS Foundation Trust >90 77 40 117 100.0% 100.0% 100.0% 100.0%
RRK University Hospitals Birmingham NHS Foundation Trust >90 114 68 182 100.0% 99.1% 99.1% 97.1%
A19 West Yorkshire RAE Bradford Teaching Hospitals NHS Foundation Trust >90 116 60 176 99.4% 99.1% 98.3% 100.0%
RR8 Leeds Teaching Hospitals NHS Trust 81 to 90 120 84 204 100.0% 99.2% 97.5% 100.0%
ABMU ABMU 7A3 Abertawe Bro Morgannwg University Local Health Board 81 to 90 30 19 49 73.5% 70.0% 60.0% 52.6%
BCU North Wales 7A1 Betsi Cadwaladr University Local Health Board 81 to 90 87 52 139 65.5% 66.7% 51.7% 50.0%
Cardiff South Wales 7A4 Cardiff & Vale University Local Health Board 51 to 60 61 43 104 83.7% 65.6% 47.5% 65.1%
7A5 Cwm Taf University Local Health Board >90 8 8 16 87.5% 87.5% 87.5% 87.5%

Copyright © 2018, Healthcare Quality Improvement Partnership Ltd. (HQIP), National Oesophago-gastric Cancer Audit 2018. All rights reserved. 75
Alli
ance
/W
elsh
reg
ion
Reg
ion
nam
e
NH
S o
rgan
isat
ion
co
de
NH
S o
rgan
isat
ion
nam
e
No
. of
pat
ien
ts
No
. of
pat
ien
ts d
iag
no
sed
aft
er
emer
gen
cy a
dm
issi
on
s
% D
iag
no
sed
aft
er e
mer
gen
cy
adm
issi
on
ad
just
ed f
or
age
and
sex
Pati
ents
wit
h u
nkn
ow
n r
efer
ral
sou
rce
% u
nkn
ow
n r
efer
ral s
ou
rce
A01 Cheshire and Merseyside RBL Wirral University Teaching Hospital NHS Foundation Trust 172 39 21.2% 0 0.0%
RBN St Helens and Knowsley Hospitals NHS Trust 140 20 14.4% 0 0.0%
RBT Mid Cheshire Hospitals NHS Foundation Trust 112 14 12.3% 0 0.0%
REM Aintree University Hospital NHS Foundation Trust 184 26 13.9% 0 0.0%
RJN East Cheshire NHS Trust 95 6 5.8% 0 0.0%
RJR Countess of Chester Hospital NHS Foundation Trust 62 4 6.6% 0 0.0%
RQ6 Royal Liverpool and Broadgreen University Hospitals NHS Trust 249 52 21.5% 0 0.0%
RVY Southport and Ormskirk Hospital NHS Trust 65 4 5.9% 1 1.5%
RWW Warrington and Halton Hospitals NHS Foundation Trust 37 5 12.9% 0 0.0%
A02 East Midlands RK5 Sherwood Forest Hospitals NHS Foundation Trust 162 26 16.1% 1 0.6%
RNQ Kettering General Hospital NHS Foundation Trust 128 22 17.3% 1 0.8%
RNS Northampton General Hospital NHS Trust 115 21 17.7% 0 0.0%
RTG Derby Hospitals NHS Foundation Trust 256 36 14.2% 0 0.0%
RWD United Lincolnshire Hospitals NHS Trust 120 13 11.5% 2 1.7%
RWE University Hospitals of Leicester NHS Trust 374 60 16.0% 0 0.0%
RX1 Nottingham University Hospitals NHS Trust 273 36 13.2% 6 2.2%
A03 East of England RAJ Southend University Hospital NHS Foundation Trust 125 24 18.7% 1 0.8%
RC1 Bedford Hospital NHS Trust 95 5 5.6% 6 6.3%
RC9 Luton and Dunstable University Hospital NHS Foundation Trust 112 23 21.4% 4 3.6%
RCX The Queen Elizabeth Hospital, King’s Lynn, NHS Foundation Trust 140 18 12.7% 0 0.0%
RD8 Milton Keynes Hospital NHS Foundation Trust 82 8 10.2% 1 1.2%
RDD Basildon and Thurrock University Hospitals NHS Foundation Trust 79 13 17.0% 3 3.8%
RDE Colchester Hospital University NHS Foundation Trust 158 2 1.3% 1 0.6%
RGN Peterborough and Stamford Hospitals NHS Foundation Trust 101 6 6.2% 4 4.0%
RGP James Paget University Hospitals NHS Foundation Trust 115 20 17.1% 0 0.0%
RGQ Ipswich Hospital NHS Trust 162 23 13.9% 0 0.0%
RGR West Suffolk NHS Foundation Trust 98 15 15.1% 0 0.0%
RGT Cambridge University Hospitals NHS Foundation Trust 172 43 24.3% 0 0.0%
RM1 Norfolk and Norwich University Hospitals NHS Foundation Trust 221 41 18.2% 1 0.5%
RQ8 Mid Essex Hospital Services NHS Trust 138 5 3.8% 0 0.0%
RQQ Hinchingbrooke Health Care NHS Trust 73 7 9.9% 2 2.7%
RQW The Princess Alexandra Hospital NHS Trust 86 8 9.0% 0 0.0%
RWG West Hertfordshire Hospitals NHS Trust 132 3 2.3% 0 0.0%
RWH East and North Hertfordshire NHS Trust 135 17 12.4% 1 0.7%
A04 Greater Manchester RM2 University Hospital of South Manchester NHS Foundation Trust 111 34 31.2% 0 0.0%
RM3 Salford Royal NHS Foundation Trust 99 7 7.6% 3 3.0%
RMC Bolton NHS Foundation Trust 115 12 11.2% 6 5.2%
RMP Tameside and Glossop Integrated Care NHS Foundation Trust 86 4 4.5% 0 0.0%
RRF Wrightington, Wigan and Leigh NHS Foundation Trust 134 8 6.1% 1 0.7%
RW3 Central Manchester University Hospitals NHS Foundation Trust 171 7 4.4% 0 0.0%
RW6 Pennine Acute Hospitals NHS Trust 306 32 10.4% 0 0.0%
RWJ Stockport NHS Foundation Trust 128 0 0.0% 0 0.0%
A05 Humber, Coast and Vale RCB York Teaching Hospital NHS Foundation Trust 207 37 23.3% 51 24.6%
RJL Northern Lincolnshire and Goole NHS Foundation Trust 197 50 25.7% 0 0.0%
RWA Hull and East Yorkshire Hospitals NHS Trust 230 36 15.8% 2 0.9%
Annex 7: Emergency admission by English Cancer Alliances and Welsh Cancer Centres (April 2015–March 2017)
The proportion of data reported as “unknown” for referral source and the adjusted referral rates were calculated for each NHS trust / local health board. Rates were derived from complete data and adjusted for age and gender.
NHS trusts / local health boards submitting fewer than 10 records in the two year period were excluded from comparison.
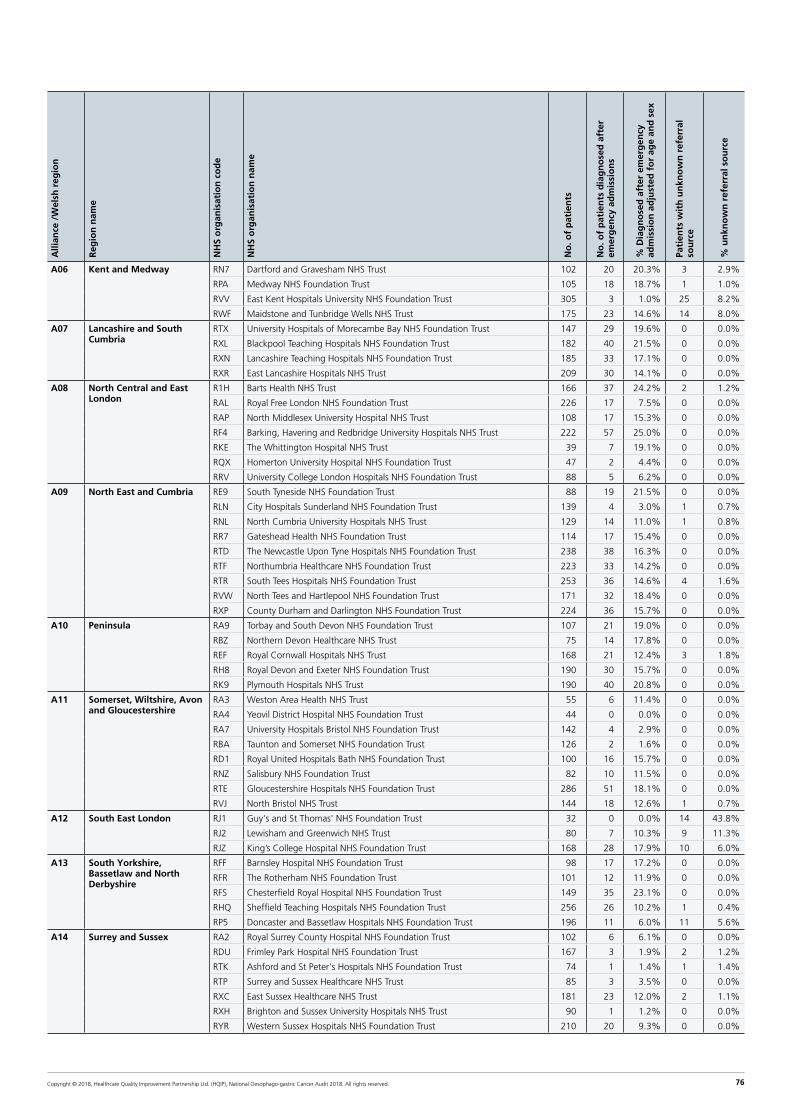
Copyright © 2018, Healthcare Quality Improvement Partnership Ltd. (HQIP), National Oesophago-gastric Cancer Audit 2018. All rights reserved. 76
Alli
ance
/W
elsh
reg
ion
Reg
ion
nam
e
NH
S o
rgan
isat
ion
co
de
NH
S o
rgan
isat
ion
nam
e
No
. of
pat
ien
ts
No
. of
pat
ien
ts d
iag
no
sed
aft
er
emer
gen
cy a
dm
issi
on
s
% D
iag
no
sed
aft
er e
mer
gen
cy
adm
issi
on
ad
just
ed f
or
age
and
sex
Pati
ents
wit
h u
nkn
ow
n r
efer
ral
sou
rce
% u
nkn
ow
n r
efer
ral s
ou
rce
A06 Kent and Medway RN7 Dartford and Gravesham NHS Trust 102 20 20.3% 3 2.9%
RPA Medway NHS Foundation Trust 105 18 18.7% 1 1.0%
RVV East Kent Hospitals University NHS Foundation Trust 305 3 1.0% 25 8.2%
RWF Maidstone and Tunbridge Wells NHS Trust 175 23 14.6% 14 8.0%
A07 Lancashire and South Cumbria
RTX University Hospitals of Morecambe Bay NHS Foundation Trust 147 29 19.6% 0 0.0%
RXL Blackpool Teaching Hospitals NHS Foundation Trust 182 40 21.5% 0 0.0%
RXN Lancashire Teaching Hospitals NHS Foundation Trust 185 33 17.1% 0 0.0%
RXR East Lancashire Hospitals NHS Trust 209 30 14.1% 0 0.0%
A08 North Central and East London
R1H Barts Health NHS Trust 166 37 24.2% 2 1.2%
RAL Royal Free London NHS Foundation Trust 226 17 7.5% 0 0.0%
RAP North Middlesex University Hospital NHS Trust 108 17 15.3% 0 0.0%
RF4 Barking, Havering and Redbridge University Hospitals NHS Trust 222 57 25.0% 0 0.0%
RKE The Whittington Hospital NHS Trust 39 7 19.1% 0 0.0%
RQX Homerton University Hospital NHS Foundation Trust 47 2 4.4% 0 0.0%
RRV University College London Hospitals NHS Foundation Trust 88 5 6.2% 0 0.0%
A09 North East and Cumbria RE9 South Tyneside NHS Foundation Trust 88 19 21.5% 0 0.0%
RLN City Hospitals Sunderland NHS Foundation Trust 139 4 3.0% 1 0.7%
RNL North Cumbria University Hospitals NHS Trust 129 14 11.0% 1 0.8%
RR7 Gateshead Health NHS Foundation Trust 114 17 15.4% 0 0.0%
RTD The Newcastle Upon Tyne Hospitals NHS Foundation Trust 238 38 16.3% 0 0.0%
RTF Northumbria Healthcare NHS Foundation Trust 223 33 14.2% 0 0.0%
RTR South Tees Hospitals NHS Foundation Trust 253 36 14.6% 4 1.6%
RVW North Tees and Hartlepool NHS Foundation Trust 171 32 18.4% 0 0.0%
RXP County Durham and Darlington NHS Foundation Trust 224 36 15.7% 0 0.0%
A10 Peninsula RA9 Torbay and South Devon NHS Foundation Trust 107 21 19.0% 0 0.0%
RBZ Northern Devon Healthcare NHS Trust 75 14 17.8% 0 0.0%
REF Royal Cornwall Hospitals NHS Trust 168 21 12.4% 3 1.8%
RH8 Royal Devon and Exeter NHS Foundation Trust 190 30 15.7% 0 0.0%
RK9 Plymouth Hospitals NHS Trust 190 40 20.8% 0 0.0%
A11 Somerset, Wiltshire, Avon and Gloucestershire
RA3 Weston Area Health NHS Trust 55 6 11.4% 0 0.0%
RA4 Yeovil District Hospital NHS Foundation Trust 44 0 0.0% 0 0.0%
RA7 University Hospitals Bristol NHS Foundation Trust 142 4 2.9% 0 0.0%
RBA Taunton and Somerset NHS Foundation Trust 126 2 1.6% 0 0.0%
RD1 Royal United Hospitals Bath NHS Foundation Trust 100 16 15.7% 0 0.0%
RNZ Salisbury NHS Foundation Trust 82 10 11.5% 0 0.0%
RTE Gloucestershire Hospitals NHS Foundation Trust 286 51 18.1% 0 0.0%
RVJ North Bristol NHS Trust 144 18 12.6% 1 0.7%
A12 South East London RJ1 Guy's and St Thomas' NHS Foundation Trust 32 0 0.0% 14 43.8%
RJ2 Lewisham and Greenwich NHS Trust 80 7 10.3% 9 11.3%
RJZ King’s College Hospital NHS Foundation Trust 168 28 17.9% 10 6.0%
A13 South Yorkshire, Bassetlaw and North Derbyshire
RFF Barnsley Hospital NHS Foundation Trust 98 17 17.2% 0 0.0%
RFR The Rotherham NHS Foundation Trust 101 12 11.9% 0 0.0%
RFS Chesterfield Royal Hospital NHS Foundation Trust 149 35 23.1% 0 0.0%
RHQ Sheffield Teaching Hospitals NHS Foundation Trust 256 26 10.2% 1 0.4%
RP5 Doncaster and Bassetlaw Hospitals NHS Foundation Trust 196 11 6.0% 11 5.6%
A14 Surrey and Sussex RA2 Royal Surrey County Hospital NHS Foundation Trust 102 6 6.1% 0 0.0%
RDU Frimley Park Hospital NHS Foundation Trust 167 3 1.9% 2 1.2%
RTK Ashford and St Peter's Hospitals NHS Foundation Trust 74 1 1.4% 1 1.4%
RTP Surrey and Sussex Healthcare NHS Trust 85 3 3.5% 0 0.0%
RXC East Sussex Healthcare NHS Trust 181 23 12.0% 2 1.1%
RXH Brighton and Sussex University Hospitals NHS Trust 90 1 1.2% 0 0.0%
RYR Western Sussex Hospitals NHS Foundation Trust 210 20 9.3% 0 0.0%

Copyright © 2018, Healthcare Quality Improvement Partnership Ltd. (HQIP), National Oesophago-gastric Cancer Audit 2018. All rights reserved. 77
Alli
ance
/W
elsh
reg
ion
Reg
ion
nam
e
NH
S o
rgan
isat
ion
co
de
NH
S o
rgan
isat
ion
nam
e
No
. of
pat
ien
ts
No
. of
pat
ien
ts d
iag
no
sed
aft
er
emer
gen
cy a
dm
issi
on
s
% D
iag
no
sed
aft
er e
mer
gen
cy
adm
issi
on
ad
just
ed f
or
age
and
sex
Pati
ents
wit
h u
nkn
ow
n r
efer
ral
sou
rce
% u
nkn
ow
n r
efer
ral s
ou
rce
A15 Thames Valley RHW Royal Berkshire NHS Foundation Trust 27 0 0.0% 1 3.7%
RN3 Great Western Hospitals NHS Foundation Trust 128 20 15.6% 0 0.0%
RTH Oxford University Hospitals NHS Trust 144 7 5.2% 2 1.4%
RXQ Buckinghamshire Healthcare NHS Trust 99 5 5.0% 0 0.0%
A16 Wessex R1F Isle of Wight NHS Trust 62 6 9.1% 0 0.0%
RBD Dorset County Hospital NHS Foundation Trust 107 12 11.1% 0 0.0%
RD3 Poole Hospital NHS Foundation Trust 115 15 12.9% 2 1.7%
RDZ The Royal Bournemouth and Christchurch Hospitals NHS Foundation Trust 127 27 20.4% 0 0.0%
RHM University Hospital Southampton NHS Foundation Trust 187 18 9.5% 0 0.0%
RHU Portsmouth Hospitals NHS Trust 214 14 6.4% 0 0.0%
RN5 Hampshire Hospitals NHS Foundation Trust 132 1 0.8% 0 0.0%
A17 West London R1K London North West Healthcare NHS Trust 209 2 1.0% 1 0.5%
RAS The Hillingdon Hospitals NHS Foundation Trust 67 9 13.1% 0 0.0%
RAX Kingston Hospital NHS Foundation Trust 91 20 23.8% 10 11.0%
RJ6 Croydon Health Services NHS Trust 86 20 25.3% 0 0.0%
RJ7 St George's Healthcare NHS Trust 120 35 30.8% 5 4.2%
RPY The Royal Marsden NHS Foundation Trust 27 0 0.0% 12 44.4%
RQM Chelsea and Westminster Hospital NHS Foundation Trust 122 34 30.6% 1 0.8%
RVR Epsom and St Helier University Hospitals NHS Trust 123 27 22.0% 5 4.1%
RYJ Imperial College Healthcare NHS Trust 144 16 11.6% 0 0.0%
A18 West Midlands RBK Walsall Healthcare NHS Trust 39 3 8.7% 0 0.0%
RJC South Warwickshire NHS Foundation Trust 48 2 4.4% 4 8.3%
RJE University Hospitals of North Midlands NHS Trust 255 33 13.4% 3 1.2%
RJF Burton Hospitals NHS Foundation Trust 116 13 11.8% 8 6.9%
RKB University Hospitals Coventry and Warwickshire NHS Trust 156 23 15.8% 2 1.3%
RL4 The Royal Wolverhampton NHS Trust 146 7 5.1% 0 0.0%
RLQ Wye Valley NHS Trust 78 11 13.9% 0 0.0%
RLT George Eliot Hospital NHS Trust 71 8 11.6% 0 0.0%
RNA The Dudley Group NHS Foundation Trust 182 23 12.2% 0 0.0%
RR1 Heart of England NHS Foundation Trust 333 73 21.8% 0 0.0%
RRK University Hospitals Birmingham NHS Foundation Trust 189 22 12.0% 0 0.0%
RWP Worcestershire Acute Hospitals NHS Trust 261 47 17.8% 0 0.0%
RXK Sandwell and West Birmingham Hospitals NHS Trust 176 27 15.0% 0 0.0%
RXW Shrewsbury and Telford Hospital NHS Trust 172 10 6.1% 0 0.0%
A19 West Yorkshire RAE Bradford Teaching Hospitals NHS Foundation Trust 136 6 5.1% 14 10.3%
RCD Harrogate and District NHS Foundation Trust 95 20 20.8% 0 0.0%
RCF Airedale NHS Foundation Trust 75 1 1.4% 3 4.0%
RR8 Leeds Teaching Hospitals NHS Trust 248 12 6.9% 73 29.4%
RWY Calderdale and Huddersfield NHS Foundation Trust 163 4 2.8% 13 8.0%
RXF Mid Yorkshire Hospitals NHS Trust 230 6 2.7% 6 2.6%
ABMU ABMU 7A3 Abertawe Bro Morgannwg University Local Health Board 259 55 20.7% 0 0.0%
BCU North Wales 7A1 Betsi Cadwaladr University Local Health Board 360 57 15.7% 1 0.3%
Cardiff South Wales 7A2 Hywel Dda University Local Health Board 157 28 19.3% 10 6.4%
7A4 Cardiff & Vale University Local Health Board 126 12 10.0% 1 0.8%
7A5 Cwm Taf University Local Health Board 155 35 23.3% 0 0.0%
7A6 Aneurin Bevan University Local Health Board 206 25 13.8% 15 7.3%

Copyright © 2018, Healthcare Quality Improvement Partnership Ltd. (HQIP), National Oesophago-gastric Cancer Audit 2018. All rights reserved. 78
Annex 8: Proportion of patients reported to have had an initial staging CT scan by NHS trusts (April 2015–March 2017)
NHS trusts submitting fewer than 10 tumour records over the two year period were excluded from the comparison.
Alli
ance
/W
elsh
reg
ion
Reg
ion
nam
e
NH
S Tr
ust
co
de
NH
S Tr
ust
nam
e
N w
ith
CT
scan
% C
T sc
an
A01 Cheshire and Merseyside RBL Wirral University Teaching Hospital NHS Foundation Trust 173 90.6% ●
RBN St Helens and Knowsley Hospitals NHS Trust 87 59.6% ▲
RBT Mid Cheshire Hospitals NHS Foundation Trust 31 27.4% ▲
REM Aintree University Hospital NHS Foundation Trust 184 93.4% ●
RJN East Cheshire NHS Trust 66 76.7% ▲
RJR Countess of Chester Hospital NHS Foundation Trust 21 23.6% ▲
RQ6 Royal Liverpool and Broadgreen University Hospitals NHS Trust 154 73.3% ▲
RVY Southport and Ormskirk Hospital NHS Trust 34 70.8% ▲
RWW Warrington and Halton Hospitals NHS Foundation Trust 51 79.7% ▲
A02 East Midlands RK5 Sherwood Forest Hospitals NHS Foundation Trust 162 100.0% ●
RNQ Kettering General Hospital NHS Foundation Trust 114 98.3% ●
RNS Northampton General Hospital NHS Trust 103 92.8% ●
RTG Derby Hospitals NHS Foundation Trust 262 98.9% ●
RWD United Lincolnshire Hospitals NHS Trust 114 89.1% ■
RWE University Hospitals of Leicester NHS Trust 344 95.8% ●
RX1 Nottingham University Hospitals NHS Trust 303 95.9% ●
A03 East of England RAJ Southend University Hospital NHS Foundation Trust 124 99.2% ●
RC1 Bedford Hospital NHS Trust 42 41.2% ▲
RC9 Luton and Dunstable University Hospital NHS Foundation Trust 117 95.1% ●
RCX The Queen Elizabeth Hospital, King’s Lynn, NHS Foundation Trust 108 87.1% ■
RD8 Milton Keynes Hospital NHS Foundation Trust 23 34.8% ▲
RDD Basildon and Thurrock University Hospitals NHS Foundation Trust 118 99.2% ●
RDE Colchester Hospital University NHS Foundation Trust 103 74.1% ▲
RGN Peterborough and Stamford Hospitals NHS Foundation Trust 106 93.8% ●
RGP James Paget University Hospitals NHS Foundation Trust 122 98.4% ●
RGQ Ipswich Hospital NHS Trust 132 91.7% ●
RGR West Suffolk NHS Foundation Trust 67 60.9% ▲
RGT Cambridge University Hospitals NHS Foundation Trust 144 77.0% ▲
RM1 Norfolk and Norwich University Hospitals NHS Foundation Trust 248 90.5% ●
RQ8 Mid Essex Hospital Services NHS Trust 71 94.7% ●
RQQ Hinchingbrooke Health Care NHS Trust 41 67.2% ▲
RQW The Princess Alexandra Hospital NHS Trust 46 100.0% ●
RWG West Hertfordshire Hospitals NHS Trust 56 98.2% ●
RWH East and North Hertfordshire NHS Trust 157 99.4% ●
A04 Greater Manchester RM2 University Hospital of South Manchester NHS Foundation Trust 111 100.0% ●
RM3 Salford Royal NHS Foundation Trust 100 100.0% ●
RMC Bolton NHS Foundation Trust 119 88.8% ■
RMP Tameside and Glossop Integrated Care NHS Foundation Trust 70 87.5% ■
RRF Wrightington, Wigan and Leigh NHS Foundation Trust 119 85.6% ■
RW3 Central Manchester University Hospitals NHS Foundation Trust 150 79.4% ▲
RW6 Pennine Acute Hospitals NHS Trust 276 93.2% ●
RWJ Stockport NHS Foundation Trust 38 31.7% ▲
A05 Humber, Coast and Vale RCB York Teaching Hospital NHS Foundation Trust 175 89.3% ■
RJL Northern Lincolnshire and Goole NHS Foundation Trust 113 53.1% ▲
RWA Hull and East Yorkshire Hospitals NHS Trust 230 97.0% ●
A06 Kent and Medway RN7 Dartford and Gravesham NHS Trust 109 99.1% ●
RPA Medway NHS Foundation Trust 123 97.6% ●
RVV East Kent Hospitals University NHS Foundation Trust 238 96.4% ●
RWF Maidstone and Tunbridge Wells NHS Trust 199 98.0% ●
Key
●≥90% ■80–89% ▲<80%

Copyright © 2018, Healthcare Quality Improvement Partnership Ltd. (HQIP), National Oesophago-gastric Cancer Audit 2018. All rights reserved. 79
Alli
ance
/W
elsh
reg
ion
Reg
ion
nam
e
NH
S Tr
ust
co
de
NH
S Tr
ust
nam
e
N w
ith
CT
scan
% C
T sc
an
A07 Lancashire and South Cumbria RTX University Hospitals of Morecambe Bay NHS Foundation Trust 68 73.9% ▲
RXL Blackpool Teaching Hospitals NHS Foundation Trust 140 88.1% ■
RXN Lancashire Teaching Hospitals NHS Foundation Trust 177 83.1% ■
RXR East Lancashire Hospitals NHS Trust 186 100.0% ●
A08 North Central and East London R1H Barts Health NHS Trust 160 78.0% ▲
RAL Royal Free London NHS Foundation Trust 187 92.6% ●
RAP North Middlesex University Hospital NHS Trust 138 99.3% ●
RF4 Barking, Havering and Redbridge University Hospitals NHS Trust 179 91.8% ●
RKE The Whittington Hospital NHS Trust 60 100.0% ●
RQX Homerton University Hospital NHS Foundation Trust 49 94.2% ●
RRV University College London Hospitals NHS Foundation Trust 93 100.0% ●
A09 North East and Cumbria RE9 South Tyneside NHS Foundation Trust 69 92.0% ●
RLN City Hospitals Sunderland NHS Foundation Trust 109 76.8% ▲
RNL North Cumbria University Hospitals NHS Trust 130 94.2% ●
RR7 Gateshead Health NHS Foundation Trust 101 87.8% ■
RTD The Newcastle Upon Tyne Hospitals NHS Foundation Trust 230 96.6% ●
RTF Northumbria Healthcare NHS Foundation Trust 205 98.1% ●
RTR South Tees Hospitals NHS Foundation Trust 138 53.7% ▲
RVW North Tees and Hartlepool NHS Foundation Trust 152 96.2% ●
RXP County Durham and Darlington NHS Foundation Trust 217 92.3% ●
A10 Peninsula RA9 Torbay and South Devon NHS Foundation Trust 105 93.8% ●
RBZ Northern Devon Healthcare NHS Trust 69 87.3% ■
REF Royal Cornwall Hospitals NHS Trust 133 78.2% ▲
RH8 Royal Devon and Exeter NHS Foundation Trust 185 90.7% ●
RK9 Plymouth Hospitals NHS Trust 184 86.8% ■
A11 Somerset, Wiltshire, Avon and Gloucestershire RA3 Weston Area Health NHS Trust 34 63.0% ▲
RA4 Yeovil District Hospital NHS Foundation Trust 43 74.1% ▲
RA7 University Hospitals Bristol NHS Foundation Trust 110 76.4% ▲
RBA Taunton and Somerset NHS Foundation Trust 97 78.9% ▲
RD1 Royal United Hospitals Bath NHS Foundation Trust 72 87.8% ■
RNZ Salisbury NHS Foundation Trust 70 76.9% ▲
RTE Gloucestershire Hospitals NHS Foundation Trust 240 94.9% ●
RVJ North Bristol NHS Trust 83 65.4% ▲
A12 South East London RJ1 Guy’s and St Thomas’ NHS Foundation Trust 56 100.0% ●
RJ2 Lewisham and Greenwich NHS Trust 112 100.0% ●
RJZ King’s College Hospital NHS Foundation Trust 153 100.0% ●
A13 South Yorkshire, Bassetlaw and North Derbyshire
RFF Barnsley Hospital NHS Foundation Trust 114 94.2% ●
RFR The Rotherham NHS Foundation Trust 86 97.7% ●
RFS Chesterfield Royal Hospital NHS Foundation Trust 135 88.8% ■
RHQ Sheffield Teaching Hospitals NHS Foundation Trust 249 96.9% ●
RP5 Doncaster and Bassetlaw Hospitals NHS Foundation Trust 203 98.1% ●
A14 Surrey and Sussex RA2 Royal Surrey County Hospital NHS Foundation Trust 43 51.2% ▲
RDU Frimley Park Hospital NHS Foundation Trust 81 60.9% ▲
RTK Ashford and St Peter’s Hospitals NHS Foundation Trust 39 45.9% ▲
RTP Surrey and Sussex Healthcare NHS Trust 58 55.8% ▲
RXC East Sussex Healthcare NHS Trust 108 62.4% ▲
RXH Brighton and Sussex University Hospitals NHS Trust 25 24.3% ▲
RYR Western Sussex Hospitals NHS Foundation Trust 183 91.0% ●
A15 Thames Valley RHW Royal Berkshire NHS Foundation Trust 22 95.7% ●
RN3 Great Western Hospitals NHS Foundation Trust 104 88.1% ■
RTH Oxford University Hospitals NHS Trust 191 98.5% ●
RXQ Buckinghamshire Healthcare NHS Trust 114 97.4% ●
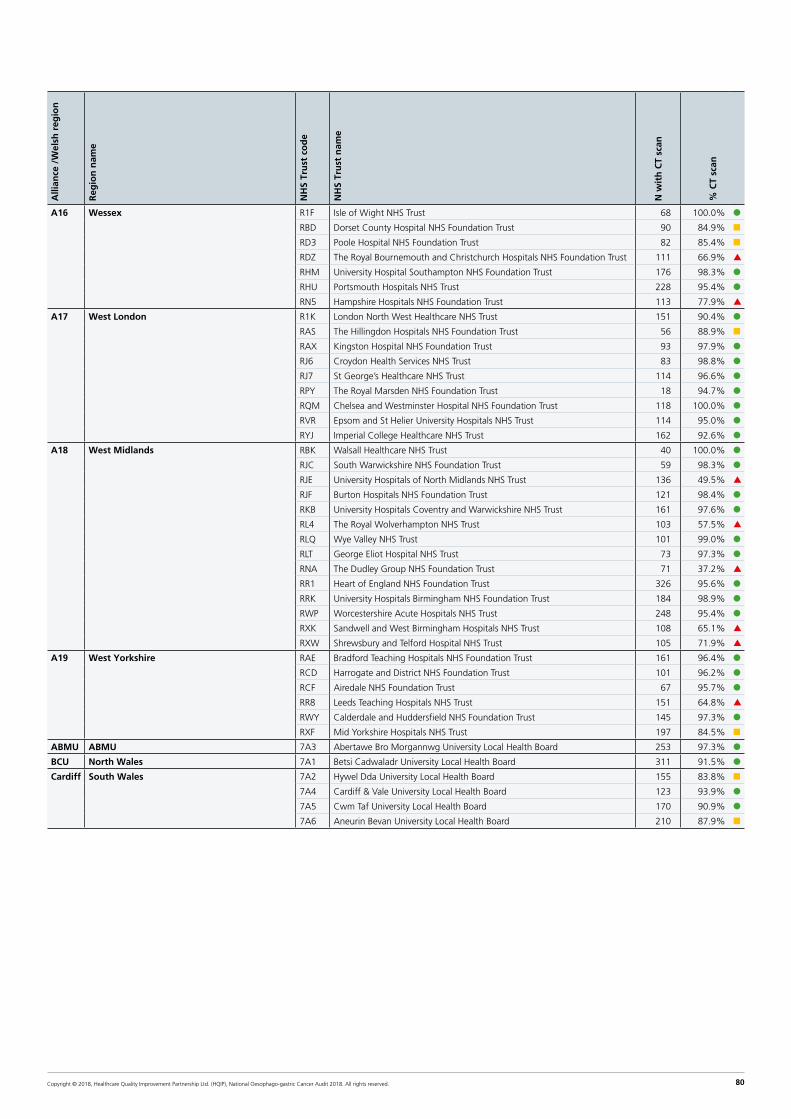
Copyright © 2018, Healthcare Quality Improvement Partnership Ltd. (HQIP), National Oesophago-gastric Cancer Audit 2018. All rights reserved. 80
Alli
ance
/W
elsh
reg
ion
Reg
ion
nam
e
NH
S Tr
ust
co
de
NH
S Tr
ust
nam
e
N w
ith
CT
scan
% C
T sc
an
A16 Wessex R1F Isle of Wight NHS Trust 68 100.0% ●
RBD Dorset County Hospital NHS Foundation Trust 90 84.9% ■
RD3 Poole Hospital NHS Foundation Trust 82 85.4% ■
RDZ The Royal Bournemouth and Christchurch Hospitals NHS Foundation Trust 111 66.9% ▲
RHM University Hospital Southampton NHS Foundation Trust 176 98.3% ●
RHU Portsmouth Hospitals NHS Trust 228 95.4% ●
RN5 Hampshire Hospitals NHS Foundation Trust 113 77.9% ▲
A17 West London R1K London North West Healthcare NHS Trust 151 90.4% ●
RAS The Hillingdon Hospitals NHS Foundation Trust 56 88.9% ■
RAX Kingston Hospital NHS Foundation Trust 93 97.9% ●
RJ6 Croydon Health Services NHS Trust 83 98.8% ●
RJ7 St George’s Healthcare NHS Trust 114 96.6% ●
RPY The Royal Marsden NHS Foundation Trust 18 94.7% ●
RQM Chelsea and Westminster Hospital NHS Foundation Trust 118 100.0% ●
RVR Epsom and St Helier University Hospitals NHS Trust 114 95.0% ●
RYJ Imperial College Healthcare NHS Trust 162 92.6% ●
A18 West Midlands RBK Walsall Healthcare NHS Trust 40 100.0% ●
RJC South Warwickshire NHS Foundation Trust 59 98.3% ●
RJE University Hospitals of North Midlands NHS Trust 136 49.5% ▲
RJF Burton Hospitals NHS Foundation Trust 121 98.4% ●
RKB University Hospitals Coventry and Warwickshire NHS Trust 161 97.6% ●
RL4 The Royal Wolverhampton NHS Trust 103 57.5% ▲
RLQ Wye Valley NHS Trust 101 99.0% ●
RLT George Eliot Hospital NHS Trust 73 97.3% ●
RNA The Dudley Group NHS Foundation Trust 71 37.2% ▲
RR1 Heart of England NHS Foundation Trust 326 95.6% ●
RRK University Hospitals Birmingham NHS Foundation Trust 184 98.9% ●
RWP Worcestershire Acute Hospitals NHS Trust 248 95.4% ●
RXK Sandwell and West Birmingham Hospitals NHS Trust 108 65.1% ▲
RXW Shrewsbury and Telford Hospital NHS Trust 105 71.9% ▲
A19 West Yorkshire RAE Bradford Teaching Hospitals NHS Foundation Trust 161 96.4% ●
RCD Harrogate and District NHS Foundation Trust 101 96.2% ●
RCF Airedale NHS Foundation Trust 67 95.7% ●
RR8 Leeds Teaching Hospitals NHS Trust 151 64.8% ▲
RWY Calderdale and Huddersfield NHS Foundation Trust 145 97.3% ●
RXF Mid Yorkshire Hospitals NHS Trust 197 84.5% ■
ABMU ABMU 7A3 Abertawe Bro Morgannwg University Local Health Board 253 97.3% ●
BCU North Wales 7A1 Betsi Cadwaladr University Local Health Board 311 91.5% ●
Cardiff South Wales 7A2 Hywel Dda University Local Health Board 155 83.8% ■
7A4 Cardiff & Vale University Local Health Board 123 93.9% ●
7A5 Cwm Taf University Local Health Board 170 90.9% ●
7A6 Aneurin Bevan University Local Health Board 210 87.9% ■

Copyright © 2018, Healthcare Quality Improvement Partnership Ltd. (HQIP), National Oesophago-gastric Cancer Audit 2018. All rights reserved. 81
Annex 9: Comparative analysis of short term outcomes after curative surgery for NHS Trusts in England and Wales (April 2014–March 2017)
Alli
ance
/W
elsh
reg
ion
Reg
ion
nam
e
NH
S o
rgan
isat
ion
co
de
NH
S o
rgan
isat
ion
nam
e
No
. of
oes
op
hag
ecto
mie
s
No
. of
gas
trec
tom
ies
Tota
l cas
es
30 d
ay m
ort
alit
y ra
te
90 d
ay m
ort
alit
y ra
te
Len
gth
of
stay
(d
ays)
% w
ith
ad
equ
ate
lym
ph
no
des
ex
amin
ed
% o
es p
osi
tive
lon
git
ud
inal
mar
gin
s
% o
es p
osi
tive
cir
cum
fere
nci
al m
arg
ins
% g
ast
po
siti
ve lo
ng
itu
din
al m
arg
ins
A01 Cheshire and Merseyside REM Aintree University Hospital NHS Foundation Trust 65 40 105 1.2% 1.1% 11 88.1% 1.8% 20.6% 20.4%
RQ6 Royal Liverpool and Broadgreen University Hospitals NHS Trust 54 56 110 0.0% 0.9% 12 83.7% 4.0% 37.7% 7.4%
A02 East Midlands RTG Derby Hospitals NHS Foundation Trust 94 42 136 0.8% 2.3% 11 85.3% 4.2% 23.0% 14.7%
RWE University Hospitals of Leicester NHS Trust 128 44 172 2.2% 3.7% 14 69.8% 1.6% 32.1% 4.3%
RX1 Nottingham University Hospitals NHS Trust 227 101 328 2.7% 3.8% 11 76.4% 3.6% 32.6% 7.8%
A03 East of England RGT Cambridge University Hospitals NHS Foundation Trust 129 78 207 0.0% 1.5% 10 85.5% 0.8% 19.4% 4.9%
RM1 Norfolk and Norwich University Hospitals NHS Foundation Trust 115 35 150 0.6% 2.8% 7 95.9% 0.0% 18.1% 2.5%
RQ8 Mid Essex Hospital Services NHS Trust 146 48 194 3.6% 6.6% 9 86.8% 12.5% 24.1% 8.6%
RWG West Hertfordshire Hospitals NHS Trust 59 41 100 5.1% 5.9% 13 96.0% 1.5% 26.6% 12.5%
A04 Greater Manchester RM2 University Hospital of South Manchester NHS Foundation Trust 29 16 45 0.0% 2.8% 12 73.3% 10.5% 42.2% 0.0%
RM3 Salford Royal NHS Foundation Trust 135 81 216 0.8% 2.3% 12 75.5% 2.4% 19.8% 15.0%
RW3 Central Manchester University Hospitals NHS Foundation Trust 77 49 126 3.4% 3.3% 14 76.2% 5.5% 39.9% 4.5%
A05 Humber, Coast and Vale RWA Hull and East Yorkshire Hospitals NHS Trust 79 42 121 3.8% 6.7% 11.5 65.1% 6.2% 21.2% 15.4%
A07 Lancashire and South Cumbria RXN Lancashire Teaching Hospitals NHS Foundation Trust 128 65 193 1.4% 2.0% 12 45.6% 3.2% 47.0% 11.6%
A08 North Central and East London RF4 Barking, Havering and Redbridge University Hospitals NHS Trust 43 30 73 0.0% 0.0% 10 72.6% 0.0% N/A 0.0%
RRV University College London Hospitals NHS Foundation Trust 77 94 171 0.7% 1.3% 12 79.0% 2.7% 25.8% 6.1%
A09 North East and Cumbria RTD The Newcastle Upon Tyne Hospitals NHS Foundation Trust 230 159 389 1.6% 1.8% 9 97.9% 3.2% N/A 8.1%
RTR South Tees Hospitals NHS Foundation Trust 120 77 197 2.3% 3.3% 13 75.4% 8.8% 33.0% 13.6%
A10 Peninsula RK9 Plymouth Hospitals NHS Trust 200 35 235 1.4% 4.5% 10 87.4% 2.4% 31.3% 5.2%
A11 Somerset, Wiltshire, Avon and Gloucestershire RA7 University Hospitals Bristol NHS Foundation Trust 111 47 158 4.4% 4.3% 11 88.4% 8.0% 26.5% 9.2%
RTE Gloucestershire Hospitals NHS Foundation Trust 91 51 142 2.9% 2.8% 11 86.1% 3.8% 13.2% 19.6%
A12 South East London RJ1 Guy's and St Thomas' NHS Foundation Trust 193 98 291 0.3% 0.3% 10 85.6% 3.6% 32.1% 5.8%
A13 South Yorkshire, Bassetlaw and North Derbyshire RHQ Sheffield Teaching Hospitals NHS Foundation Trust 150 89 239 0.4% 2.5% 9 74.1% 2.8% 29.3% 3.8%
A14 Surrey and Sussex RA2 Royal Surrey County Hospital NHS Foundation Trust 92 41 133 4.1% 3.9% 10 97.7% 3.8% 10.8% 4.7%
RXH Brighton and Sussex University Hospitals NHS Trust 69 18 87 0.0% 1.7% 10 28.0% 5.2% 13.1% 6.3%
A15 Thames Valley RTH Oxford University Hospitals NHS Trust 209 83 292 0.9% 1.8% 10 92.8% 2.5% 14.2% 4.2%
Organisations submitting fewer than 10 cases for the relevant outcome or with 10 or more cases but with less than 50% complete cases in the 3 year period are not shown (N/A).

Copyright © 2018, Healthcare Quality Improvement Partnership Ltd. (HQIP), National Oesophago-gastric Cancer Audit 2018. All rights reserved. 82
Alli
ance
/W
elsh
reg
ion
Reg
ion
nam
e
NH
S o
rgan
isat
ion
co
de
NH
S o
rgan
isat
ion
nam
e
No
. of
oes
op
hag
ecto
mie
s
No
. of
gas
trec
tom
ies
Tota
l cas
es
30 d
ay m
ort
alit
y ra
te
90 d
ay m
ort
alit
y ra
te
Len
gth
of
stay
(d
ays)
% w
ith
ad
equ
ate
lym
ph
no
des
ex
amin
ed
% o
es p
osi
tive
lon
git
ud
inal
mar
gin
s
% o
es p
osi
tive
cir
cum
fere
nci
al m
arg
ins
% g
ast
po
siti
ve lo
ng
itu
din
al m
arg
ins
A16 Wessex RDZ The Royal Bournemouth and Christchurch Hospitals NHS Foundation Trust 61 18 79 2.1% 4.1% 12 89.3% 2.5% 19.7% 12.2%
RHM University Hospital Southampton NHS Foundation Trust 116 33 149 0.6% 0.6% 9 87.9% 0.9% 11.4% 0.0%
RHU Portsmouth Hospitals NHS Trust 106 46 152 2.5% 5.6% 11 79.6% 2.7% 17.2% 8.5%
A17 West London RPY The Royal Marsden NHS Foundation Trust 70 72 142 2.1% 2.8% 11 94.4% 1.5% 19.8% 2.8%
RYJ Imperial College Healthcare NHS Trust 56 62 118 1.1% 2.2% 10 100.0% 0.0% 3.9% 0.0%
A18 West Midlands RJE University Hospitals of North Midlands NHS Trust 135 75 210 3.9% 6.5% 12 87.7% 3.5% 31.0% 12.0%
RKB University Hospitals Coventry and Warwickshire NHS Trust 116 41 157 3.5% 6.4% 10 85.3% 8.5% 39.1% 7.6%
RR1 Heart of England NHS Foundation Trust 77 40 117 0.9% 1.7% 14 88.9% 2.8% 26.8% 10.1%
RRK University Hospitals Birmingham NHS Foundation Trust 114 68 182 0.5% 1.0% 12 93.4% 1.6% 20.1% 6.6%
A19 West Yorkshire RAE Bradford Teaching Hospitals NHS Foundation Trust 116 60 176 2.5% 4.5% 15 90.9% 4.9% 34.8% 5.6%
RR8 Leeds Teaching Hospitals NHS Trust 120 84 204 0.0% 3.8% 11 79.9% 8.2% 43.6% 15.1%
ABMU ABMU 7A3 Abertawe Bro Morgannwg University Local Health Board 30 19 49 2.9% 2.8% 11.5 50.0% 8.5% 15.1% 8.4%
BCU North Wales 7A1 Betsi Cadwaladr University Local Health Board 92 62 154 6.9% 8.0% 9 75.8% 1.8% 23.4% 6.4%
Cardiff South Wales 7A4 Cardiff & Vale University Local Health Board 61 43 104 2.5% 3.6% 12 49.4% 0.0% 45.6% 11.5%
7A5 Cwm Taf University Local Health Board 8 8 16 0.0% 8.8% 15.5 28.6% N/A N/A N/A
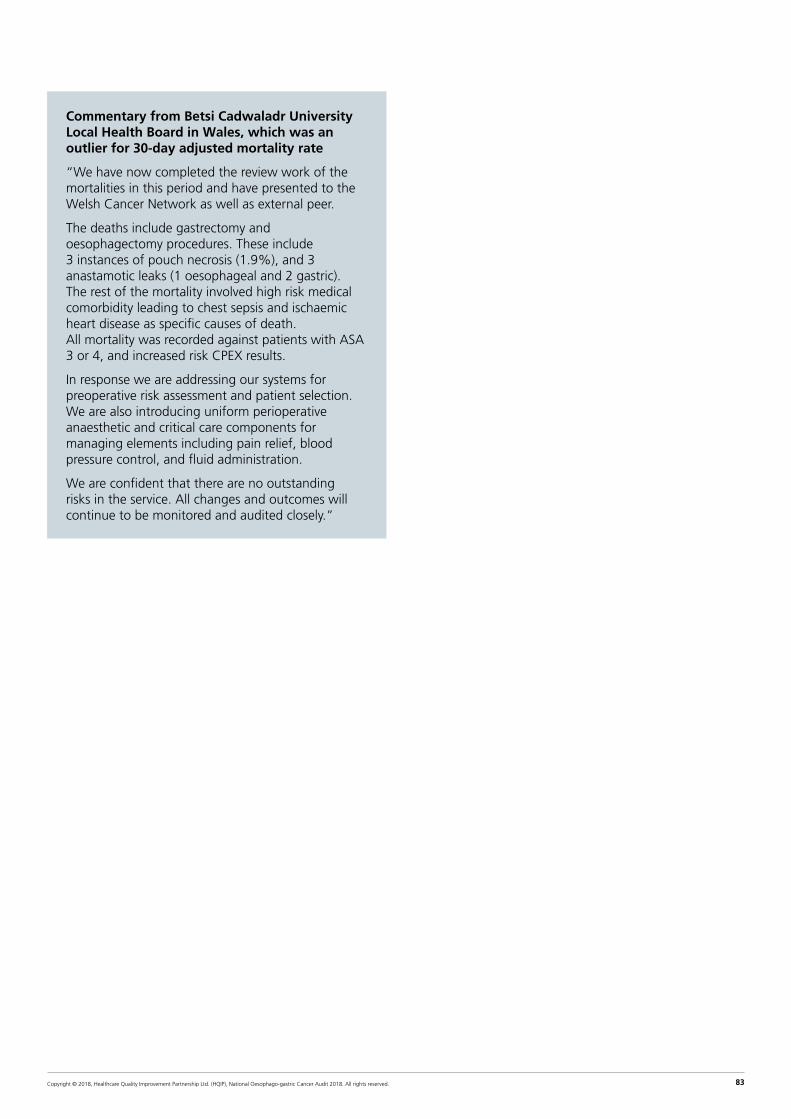
Copyright © 2018, Healthcare Quality Improvement Partnership Ltd. (HQIP), National Oesophago-gastric Cancer Audit 2018. All rights reserved. 83
Commentary from Betsi Cadwaladr University Local Health Board in Wales, which was an outlier for 30-day adjusted mortality rate
“We have now completed the review work of the mortalities in this period and have presented to the Welsh Cancer Network as well as external peer.
The deaths include gastrectomy and oesophagectomy procedures. These include 3 instances of pouch necrosis (1.9%), and 3 anastamotic leaks (1 oesophageal and 2 gastric). The rest of the mortality involved high risk medical comorbidity leading to chest sepsis and ischaemic heart disease as specific causes of death. All mortality was recorded against patients with ASA 3 or 4, and increased risk CPEX results.
In response we are addressing our systems for preoperative risk assessment and patient selection. We are also introducing uniform perioperative anaesthetic and critical care components for managing elements including pain relief, blood pressure control, and fluid administration.
We are confident that there are no outstanding risks in the service. All changes and outcomes will continue to be monitored and audited closely.”

Copyright © 2018, Healthcare Quality Improvement Partnership Ltd. (HQIP), National Oesophago-gastric Cancer Audit 2018. All rights reserved. 84
Annex 10: Regional variation in non-curative cancer treatments in England and Wales (April 2015–March 2017)
Alli
ance
/W
elsh
reg
ion
Reg
ion
nam
e
NH
S o
rgan
isat
ion
co
de
NH
S o
rgan
isat
ion
nam
e
Pats
hav
ing
pal
liati
ve t
reat
men
t
% p
allia
tive
tre
atm
ent
Pats
hav
ing
pal
liati
ve o
nco
log
y
% r
ecei
vin
g p
allia
tive
on
colo
gy
A01 Cheshire and Merseyside RBL Wirral University Teaching Hospital NHS Foundation Trust 103 59.88% 46 44.66%
RBN St Helens and Knowsley Hospitals NHS Trust 98 70.00% 43 43.88%
RBT Mid Cheshire Hospitals NHS Foundation Trust 65 58.04% 33 50.77%
REM Aintree University Hospital NHS Foundation Trust 100 54.35% 61 61.00%
RJN East Cheshire NHS Trust 75 78.95% 52 69.33%
RJR Countess of Chester Hospital NHS Foundation Trust 29 46.77% 10 34.48%
RQ6 Royal Liverpool and Broadgreen University Hospitals NHS Trust 132 53.01% 46 34.85%
RVY Southport and Ormskirk Hospital NHS Trust 50 76.92% 23 46.00%
RWW Warrington and Halton Hospitals NHS Foundation Trust 18 48.65% 8 44.44%
A02 East Midlands RK5 Sherwood Forest Hospitals NHS Foundation Trust 92 56.79% 55 60.44%
RNQ Kettering General Hospital NHS Foundation Trust 87 67.97% 27 31.03%
RNS Northampton General Hospital NHS Trust 75 65.22% 42 56.00%
RTG Derby Hospitals NHS Foundation Trust 165 64.45% 50 31.06%
RWD United Lincolnshire Hospitals NHS Trust 21 17.50% 11 55.00%
RWE University Hospitals of Leicester NHS Trust 234 62.57% 111 47.44%
RX1 Nottingham University Hospitals NHS Trust 145 53.11% 74 54.01%
A03 East of England RAJ Southend University Hospital NHS Foundation Trust 90 72.00% 36 40.00%
RC1 Bedford Hospital NHS Trust 62 65.26% 16 25.81%
RC9 Luton and Dunstable University Hospital NHS Foundation Trust 71 63.39% 38 54.29%
RCX The Queen Elizabeth Hospital, King's Lynn, NHS Foundation Trust 82 58.57% 36 43.90%
RD8 Milton Keynes Hospital NHS Foundation Trust 20 24.39% 8 40.00%
RDD Basildon and Thurrock University Hospitals NHS Foundation Trust 52 65.82% 24 46.15%
RDE Colchester Hospital University NHS Foundation Trust 96 60.76% 61 66.30%
RGN Peterborough and Stamford Hospitals NHS Foundation Trust 66 65.35% 36 54.55%
RGP James Paget University Hospitals NHS Foundation Trust 68 59.13% 34 50.00%
RGQ Ipswich Hospital NHS Trust 125 77.16% 69 55.20%
RGR West Suffolk NHS Foundation Trust 60 61.22% 28 46.67%
RGT Cambridge University Hospitals NHS Foundation Trust 116 67.44% 42 36.21%
RM1 Norfolk and Norwich University Hospitals NHS Foundation Trust 136 61.54% 68 50.00%
RQ8 Mid Essex Hospital Services NHS Trust 69 50.00% 35 50.72%
RQQ Hinchingbrooke Health Care NHS Trust 44 60.27% 24 54.55%
RQW The Princess Alexandra Hospital NHS Trust 58 67.44% 46 79.31%
RWG West Hertfordshire Hospitals NHS Trust 79 59.85% 49 66.22%
RWH East and North Hertfordshire NHS Trust 92 68.15% 39 42.39%
A04 Greater Manchester RM2 University Hospital of South Manchester NHS Foundation Trust 83 74.77% 40 48.19%
RM3 Salford Royal NHS Foundation Trust 54 54.55% 25 49.02%
RMC Bolton NHS Foundation Trust 58 50.43% 18 31.58%
RMP Tameside and Glossop Integrated Care NHS Foundation Trust 61 70.93% 20 32.79%
RRF Wrightington, Wigan and Leigh NHS Foundation Trust 79 58.96% 34 43.59%
RW3 Central Manchester University Hospitals NHS Foundation Trust 103 60.23% 60 58.25%
RW6 Pennine Acute Hospitals NHS Trust 209 68.30% 44 21.26%
RWJ Stockport NHS Foundation Trust 96 75.00% 33 34.38%
A05 Humber, Coast and Vale RCB York Teaching Hospital NHS Foundation Trust 125 60.39% 2 5.00%
RJL Northern Lincolnshire and Goole NHS Foundation Trust 124 62.94% 83 66.94%
RWA Hull and East Yorkshire Hospitals NHS Trust 154 66.96% 125 81.17%
A06 Kent and Medway RN7 Dartford and Gravesham NHS Trust 72 70.59% 56 77.78%
RPA Medway NHS Foundation Trust 56 53.33% 46 88.46%
RVV East Kent Hospitals University NHS Foundation Trust 205 67.21% 96 50.00%
RWF Maidstone and Tunbridge Wells NHS Trust 96 54.86% 18 41.86%
A07 Lancashire and South Cumbria RTX University Hospitals of Morecambe Bay NHS Foundation Trust 95 64.63% 66 69.47%
RXL Blackpool Teaching Hospitals NHS Foundation Trust 126 69.23% 53 42.40%
RXN Lancashire Teaching Hospitals NHS Foundation Trust 134 72.43% 57 42.54%
RXR East Lancashire Hospitals NHS Trust 152 72.73% 71 46.71%
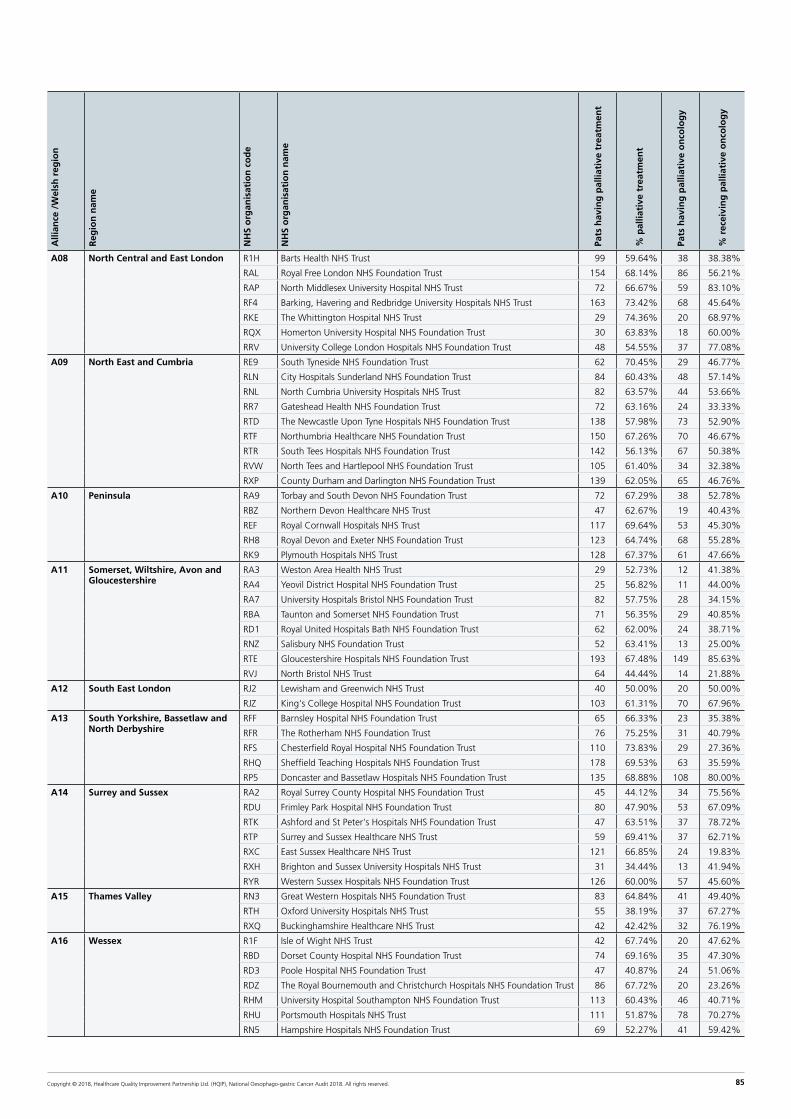
Copyright © 2018, Healthcare Quality Improvement Partnership Ltd. (HQIP), National Oesophago-gastric Cancer Audit 2018. All rights reserved. 85
Alli
ance
/W
elsh
reg
ion
Reg
ion
nam
e
NH
S o
rgan
isat
ion
co
de
NH
S o
rgan
isat
ion
nam
e
Pats
hav
ing
pal
liati
ve t
reat
men
t
% p
allia
tive
tre
atm
ent
Pats
hav
ing
pal
liati
ve o
nco
log
y
% r
ecei
vin
g p
allia
tive
on
colo
gy
A08 North Central and East London R1H Barts Health NHS Trust 99 59.64% 38 38.38%
RAL Royal Free London NHS Foundation Trust 154 68.14% 86 56.21%
RAP North Middlesex University Hospital NHS Trust 72 66.67% 59 83.10%
RF4 Barking, Havering and Redbridge University Hospitals NHS Trust 163 73.42% 68 45.64%
RKE The Whittington Hospital NHS Trust 29 74.36% 20 68.97%
RQX Homerton University Hospital NHS Foundation Trust 30 63.83% 18 60.00%
RRV University College London Hospitals NHS Foundation Trust 48 54.55% 37 77.08%
A09 North East and Cumbria RE9 South Tyneside NHS Foundation Trust 62 70.45% 29 46.77%
RLN City Hospitals Sunderland NHS Foundation Trust 84 60.43% 48 57.14%
RNL North Cumbria University Hospitals NHS Trust 82 63.57% 44 53.66%
RR7 Gateshead Health NHS Foundation Trust 72 63.16% 24 33.33%
RTD The Newcastle Upon Tyne Hospitals NHS Foundation Trust 138 57.98% 73 52.90%
RTF Northumbria Healthcare NHS Foundation Trust 150 67.26% 70 46.67%
RTR South Tees Hospitals NHS Foundation Trust 142 56.13% 67 50.38%
RVW North Tees and Hartlepool NHS Foundation Trust 105 61.40% 34 32.38%
RXP County Durham and Darlington NHS Foundation Trust 139 62.05% 65 46.76%
A10 Peninsula RA9 Torbay and South Devon NHS Foundation Trust 72 67.29% 38 52.78%
RBZ Northern Devon Healthcare NHS Trust 47 62.67% 19 40.43%
REF Royal Cornwall Hospitals NHS Trust 117 69.64% 53 45.30%
RH8 Royal Devon and Exeter NHS Foundation Trust 123 64.74% 68 55.28%
RK9 Plymouth Hospitals NHS Trust 128 67.37% 61 47.66%
A11 Somerset, Wiltshire, Avon and Gloucestershire
RA3 Weston Area Health NHS Trust 29 52.73% 12 41.38%
RA4 Yeovil District Hospital NHS Foundation Trust 25 56.82% 11 44.00%
RA7 University Hospitals Bristol NHS Foundation Trust 82 57.75% 28 34.15%
RBA Taunton and Somerset NHS Foundation Trust 71 56.35% 29 40.85%
RD1 Royal United Hospitals Bath NHS Foundation Trust 62 62.00% 24 38.71%
RNZ Salisbury NHS Foundation Trust 52 63.41% 13 25.00%
RTE Gloucestershire Hospitals NHS Foundation Trust 193 67.48% 149 85.63%
RVJ North Bristol NHS Trust 64 44.44% 14 21.88%
A12 South East London RJ2 Lewisham and Greenwich NHS Trust 40 50.00% 20 50.00%
RJZ King's College Hospital NHS Foundation Trust 103 61.31% 70 67.96%
A13 South Yorkshire, Bassetlaw and North Derbyshire
RFF Barnsley Hospital NHS Foundation Trust 65 66.33% 23 35.38%
RFR The Rotherham NHS Foundation Trust 76 75.25% 31 40.79%
RFS Chesterfield Royal Hospital NHS Foundation Trust 110 73.83% 29 27.36%
RHQ Sheffield Teaching Hospitals NHS Foundation Trust 178 69.53% 63 35.59%
RP5 Doncaster and Bassetlaw Hospitals NHS Foundation Trust 135 68.88% 108 80.00%
A14 Surrey and Sussex RA2 Royal Surrey County Hospital NHS Foundation Trust 45 44.12% 34 75.56%
RDU Frimley Park Hospital NHS Foundation Trust 80 47.90% 53 67.09%
RTK Ashford and St Peter's Hospitals NHS Foundation Trust 47 63.51% 37 78.72%
RTP Surrey and Sussex Healthcare NHS Trust 59 69.41% 37 62.71%
RXC East Sussex Healthcare NHS Trust 121 66.85% 24 19.83%
RXH Brighton and Sussex University Hospitals NHS Trust 31 34.44% 13 41.94%
RYR Western Sussex Hospitals NHS Foundation Trust 126 60.00% 57 45.60%
A15 Thames Valley RN3 Great Western Hospitals NHS Foundation Trust 83 64.84% 41 49.40%
RTH Oxford University Hospitals NHS Trust 55 38.19% 37 67.27%
RXQ Buckinghamshire Healthcare NHS Trust 42 42.42% 32 76.19%
A16 Wessex R1F Isle of Wight NHS Trust 42 67.74% 20 47.62%
RBD Dorset County Hospital NHS Foundation Trust 74 69.16% 35 47.30%
RD3 Poole Hospital NHS Foundation Trust 47 40.87% 24 51.06%
RDZ The Royal Bournemouth and Christchurch Hospitals NHS Foundation Trust 86 67.72% 20 23.26%
RHM University Hospital Southampton NHS Foundation Trust 113 60.43% 46 40.71%
RHU Portsmouth Hospitals NHS Trust 111 51.87% 78 70.27%
RN5 Hampshire Hospitals NHS Foundation Trust 69 52.27% 41 59.42%

Copyright © 2018, Healthcare Quality Improvement Partnership Ltd. (HQIP), National Oesophago-gastric Cancer Audit 2018. All rights reserved. 86
Alli
ance
/W
elsh
reg
ion
Reg
ion
nam
e
NH
S o
rgan
isat
ion
co
de
NH
S o
rgan
isat
ion
nam
e
Pats
hav
ing
pal
liati
ve t
reat
men
t
% p
allia
tive
tre
atm
ent
Pats
hav
ing
pal
liati
ve o
nco
log
y
% r
ecei
vin
g p
allia
tive
on
colo
gy
A17 West London R1K London North West Healthcare NHS Trust 115 55.02% 56 65.12%
RAS The Hillingdon Hospitals NHS Foundation Trust 41 61.19% 17 41.46%
RAX Kingston Hospital NHS Foundation Trust 51 56.04% 41 80.39%
RJ6 Croydon Health Services NHS Trust 54 62.79% 37 68.52%
RJ7 St George's Healthcare NHS Trust 82 68.33% 35 43.21%
RPY The Royal Marsden NHS Foundation Trust 14 51.85% 11 78.57%
RQM Chelsea and Westminster Hospital NHS Foundation Trust 65 53.28% 50 76.92%
RVR Epsom and St Helier University Hospitals NHS Trust 78 63.41% 43 55.13%
RYJ Imperial College Healthcare NHS Trust 79 54.86% 39 49.37%
A18 West Midlands RJC South Warwickshire NHS Foundation Trust 25 52.08% 13 52.00%
RJE University Hospitals of North Midlands NHS Trust 143 56.08% 83 58.04%
RJF Burton Hospitals NHS Foundation Trust 73 62.93% 58 81.69%
RKB University Hospitals Coventry and Warwickshire NHS Trust 81 51.92% 38 48.72%
RL4 The Royal Wolverhampton NHS Trust 74 50.68% 38 51.35%
RLQ Wye Valley NHS Trust 44 56.41% 27 61.36%
RLT George Eliot Hospital NHS Trust 36 50.70% 20 55.56%
RNA The Dudley Group NHS Foundation Trust 94 51.65% 22 23.40%
RR1 Heart of England NHS Foundation Trust 241 72.37% 92 38.33%
RRK University Hospitals Birmingham NHS Foundation Trust 126 66.67% 55 45.83%
RWP Worcestershire Acute Hospitals NHS Trust 175 67.05% 85 48.57%
RXK Sandwell and West Birmingham Hospitals NHS Trust 118 67.05% 48 40.68%
RXW Shrewsbury and Telford Hospital NHS Trust 104 60.47% 58 55.77%
A19 West Yorkshire RAE Bradford Teaching Hospitals NHS Foundation Trust 64 47.06% 24 46.15%
RCD Harrogate and District NHS Foundation Trust 57 60.00% 22 39.29%
RCF Airedale NHS Foundation Trust 53 70.67% 23 46.00%
RR8 Leeds Teaching Hospitals NHS Trust 162 65.32% 74 60.66%
RWY Calderdale and Huddersfield NHS Foundation Trust 103 63.19% 34 44.74%
RXF Mid Yorkshire Hospitals NHS Trust 145 63.04% 67 46.85%
ABMU ABMU 7A3 Abertawe Bro Morgannwg University Local Health Board 166 64.09% 95 63.76%
BCU North Wales 7A1 Betsi Cadwaladr University Local Health Board 211 58.61% 89 44.06%
Cardiff South Wales 7A2 Hywel Dda University Local Health Board 107 68.15% 55 55.00%
7A4 Cardiff & Vale University Local Health Board 82 65.08% 31 41.89%
7A5 Cwm Taf University Local Health Board 92 59.35% 41 46.07%
7A6 Aneurin Bevan University Local Health Board 148 71.84% 67 47.18%

Copyright © 2018, Healthcare Quality Improvement Partnership Ltd. (HQIP), National Oesophago-gastric Cancer Audit 2018. All rights reserved. 87
References
Al-Batran S-E, Pauligk C, Homann N, et al. The feasibility of triple-drug chemotherapy combination in older adult patients with oesophagogastric cancer: A randomised trial of the Arbeitsgemeinschaft Internistische Onkologie (FLOT65+). European Journal of Cancer. 2013;49(4):835–42.
Allum W, Blazeby J, Griffin S, et al. Guidelines for the management of oesophageal and gastric cancer. GUT 2011; 60(11): 1449–72.
AUGIS. The provision of services for upper gastrointestinal surgery. 2016; Available from: http://www.augis.org/wp-content/uploads/2016/06/Provision-of-Services-June-2016.pdf.
Best LM, Mughal M, Gurusamy KS. Non-surgical versus surgical treatment for oesophageal cancer. Cochrane Database Syst Rev. 2016. Mar 29; 3: CD011498.
BSG / Fitzgerald RC, di Pietro M, Ragunath K, et al. British Society of Gastroenterology guidelines on the diagnosis and management of Barrett's oesophagus. Gut. 2014; 63(1): 7–42.
Cancer Research UK (2018a). Oesophageal cancer risk factors. [Accessed May 2018]; Available from: http://www.cancerresearchuk.org/health-professional/cancer-statistics/statistics-by-cancer-type/oesophageal-cancer/risk-factors.
Cancer Research UK (2018b). Stomach cancer risk factors. [Accessed May 2018]; Available from: http://www.cancerresearchuk.org/health-professional/cancer-statistics/statistics-by-cancer-type/stomach-cancer/risk-factors.
Cancer Research UK (2018c). Oesophago-gastric cancers campaign: Overview. [Accessed May 2018]; Available from: http://www.cancerresearchuk.org/health-professional/early-diagnosis-activities/be-clear-on-cancer/oesophago-gastric-cancers-campaign/campaign-overview.
Cancer Research UK. Cancer waiting times definitions by country. 2015. Available from: http://www.cancerresearchuk.org/sites/default/files/cs_report_cwt.pdf.
Chadwick G, Groene O, Cromwell D et al. National Oesophago-Gastric Cancer Audit. An audit of the care received by people with Oesophago-gastric Cancer in England and Wales. Annual Report 2013. London: NHS Information Centre, 2013.
Chadwick G, Varagunam M, Brand C, et al. Coding of Barrett’s oesophagus with high-grade dysplasia in national administrative databases: a population-based cohort study. BMJ Open 2017; 7: e014281.
Markar, S.R., A. Karthikesalingam, and D.E. Low, Enhanced recovery pathways lead to an improvement in postoperative outcomes following esophagectomy: systematic review and pooled analysis. Diseases of the Esophagus, 2015. 28(5): p. 468–475.
Mukherjee, S., et al., NEOSCOPE: a randomised Phase II study of induction chemotherapy followed by oxaliplatin/capecitabine or carboplatin/ paclitaxel based pre-operative chemoradiation for resectable oesophageal adenocarcinoma. Eur J Cancer, 2017. 74:48–46.
NHS England. Delivering World-Class Cancer Outcomes: Guidance for Cancer Alliances and the National Cancer Vanguard. 2016; Available from: https://www.england.nhs.uk/wp-content/uploads/2017/02/cancer-alliance-guidance.pdf.
NHS England. Cancer waiting times. 2016 [Accessed Sept 2017]; Available from: https://www.england.nhs.uk/statistics/statistical-work-areas/cancer-waiting-times/.
National Institute for Health and Care Excellence. Oesophago-gastric cancer: assessment and management in adults: NICE guideline NG83. London: NICE, 2018.
National Institute for Health and Clinical Excellence. Barrett’s Oesophagus: ablative therapy: NICE clinical guideline CG106. London: NICE, 2010.
Office for National Statistics. Mid-2016 Clinical Commissioning Group Mid-Year Population Estimates (National Statistics). 2017 [accessed May 2018]
Palser T, Cromwell D, Van der Meulen J, et al. The National Oesophago-Gastric Cancer Audit. An audit of the care received by people with Oesophago-gastric Cancer in England and Wales. Second Annual Report 2009. London: NHS Information Centre, 2009.
Palser T, Cromwell D, Van der Meulen J, et al. The National Oesophago-Gastric Cancer Audit. An audit of the care received by people with Oesophago-gastric Cancer in England and Wales. Third Annual Report 2010. London: NHS Information Centre, 2010.
Phoa, K.N., et al., Multimodality endoscopic eradication for neoplastic Barrett oesophagus: results of a European multicentre study (EURO-II). Gut, 2016. 65(4): p. 555–562.
Shapiro, J et al., Neoadjuvant chemoradiotherapy plus surgery versus surgery alone for oesophageal or junctional cancer (CROSS): long-term results of a randomised controlled trial. The Lancet Oncology, 2015;16(9):1090–1098
Siewert JR and Stein HJ. Carcinoma of the cardia: carcinoma of the gastroesophageal junction – classification, pathology and extent of resection. Dis Esophagus 1996. 9: 173–82.
SIGN. Management of oesophageal and gastric cancer. 2006; Available from: http://sign.ac.uk/guidelines/fulltext/87/index.html.
Wagner AD, Syn N, Moehler M, Grothe W, Yong W, Tai B, et al. Chemotherapy for advanced gastric cancer (Review ). Cochrane database Syst Rev. 2017;(8).
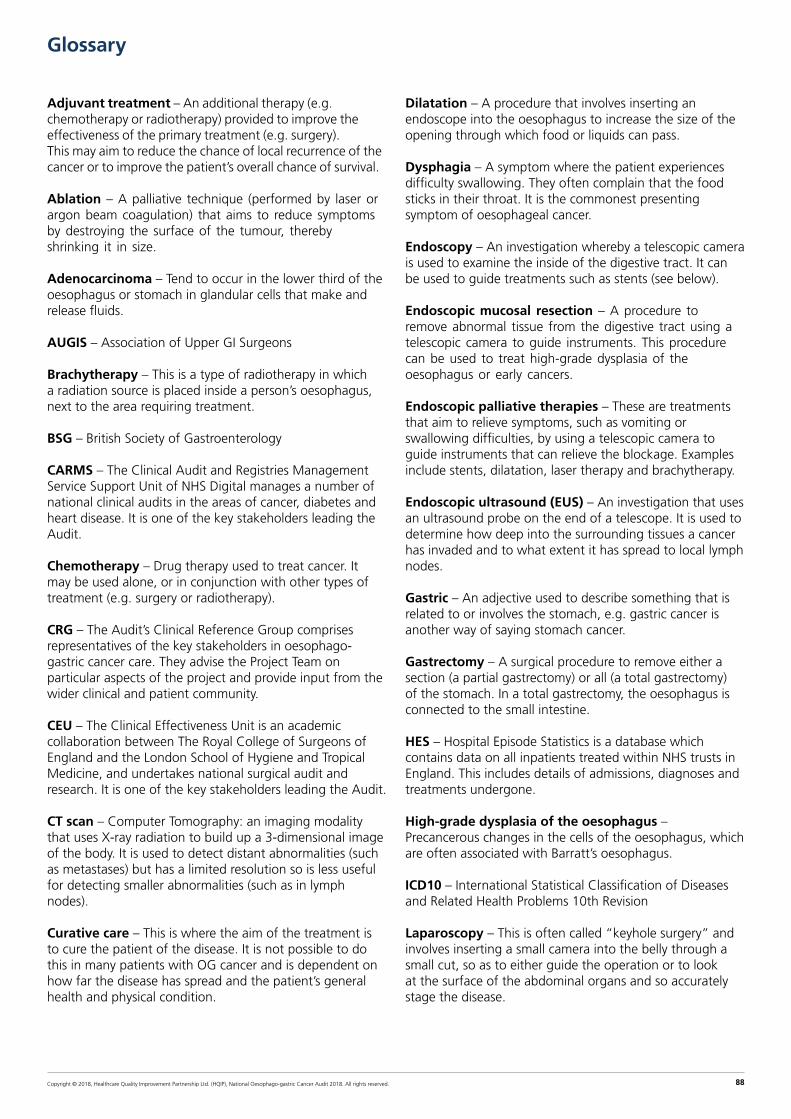
Copyright © 2018, Healthcare Quality Improvement Partnership Ltd. (HQIP), National Oesophago-gastric Cancer Audit 2018. All rights reserved. 88
Glossary
Adjuvant treatment – An additional therapy (e.g. chemotherapy or radiotherapy) provided to improve the effectiveness of the primary treatment (e.g. surgery). This may aim to reduce the chance of local recurrence of the cancer or to improve the patient’s overall chance of survival.
Ablation – A palliative technique (performed by laser or argon beam coagulation) that aims to reduce symptoms by destroying the surface of the tumour, thereby shrinking it in size.
Adenocarcinoma – Tend to occur in the lower third of the oesophagus or stomach in glandular cells that make and release fluids.
AUGIS – Association of Upper GI Surgeons
Brachytherapy – This is a type of radiotherapy in which a radiation source is placed inside a person’s oesophagus, next to the area requiring treatment.
BSG – British Society of Gastroenterology
CARMS – The Clinical Audit and Registries Management Service Support Unit of NHS Digital manages a number of national clinical audits in the areas of cancer, diabetes and heart disease. It is one of the key stakeholders leading the Audit.
Chemotherapy – Drug therapy used to treat cancer. It may be used alone, or in conjunction with other types of treatment (e.g. surgery or radiotherapy).
CRG – The Audit’s Clinical Reference Group comprises representatives of the key stakeholders in oesophago-gastric cancer care. They advise the Project Team on particular aspects of the project and provide input from the wider clinical and patient community.
CEU – The Clinical Effectiveness Unit is an academic collaboration between The Royal College of Surgeons of England and the London School of Hygiene and Tropical Medicine, and undertakes national surgical audit and research. It is one of the key stakeholders leading the Audit.
CT scan – Computer Tomography: an imaging modality that uses X-ray radiation to build up a 3-dimensional image of the body. It is used to detect distant abnormalities (such as metastases) but has a limited resolution so is less useful for detecting smaller abnormalities (such as in lymph nodes).
Curative care – This is where the aim of the treatment is to cure the patient of the disease. It is not possible to do this in many patients with OG cancer and is dependent on how far the disease has spread and the patient’s general health and physical condition.
Dilatation – A procedure that involves inserting an endoscope into the oesophagus to increase the size of the opening through which food or liquids can pass.
Dysphagia – A symptom where the patient experiences difficulty swallowing. They often complain that the food sticks in their throat. It is the commonest presenting symptom of oesophageal cancer.
Endoscopy – An investigation whereby a telescopic camera is used to examine the inside of the digestive tract. It can be used to guide treatments such as stents (see below).
Endoscopic mucosal resection – A procedure to remove abnormal tissue from the digestive tract using a telescopic camera to guide instruments. This procedure can be used to treat high-grade dysplasia of the oesophagus or early cancers.
Endoscopic palliative therapies – These are treatments that aim to relieve symptoms, such as vomiting or swallowing difficulties, by using a telescopic camera to guide instruments that can relieve the blockage. Examples include stents, dilatation, laser therapy and brachytherapy.
Endoscopic ultrasound (EUS) – An investigation that uses an ultrasound probe on the end of a telescope. It is used to determine how deep into the surrounding tissues a cancer has invaded and to what extent it has spread to local lymph nodes.
Gastric – An adjective used to describe something that is related to or involves the stomach, e.g. gastric cancer is another way of saying stomach cancer.
Gastrectomy – A surgical procedure to remove either a section (a partial gastrectomy) or all (a total gastrectomy) of the stomach. In a total gastrectomy, the oesophagus is connected to the small intestine.
HES – Hospital Episode Statistics is a database which contains data on all inpatients treated within NHS trusts in England. This includes details of admissions, diagnoses and treatments undergone.
High-grade dysplasia of the oesophagus – Precancerous changes in the cells of the oesophagus, which are often associated with Barratt’s oesophagus.
ICD10 – International Statistical Classification of Diseases and Related Health Problems 10th Revision
Laparoscopy – This is often called “keyhole surgery” and involves inserting a small camera into the belly through a small cut, so as to either guide the operation or to look at the surface of the abdominal organs and so accurately stage the disease.

Copyright © 2018, Healthcare Quality Improvement Partnership Ltd. (HQIP), National Oesophago-gastric Cancer Audit 2018. All rights reserved. 89
Lymph nodes – Lymph nodes are small oval bits of tissue that form part of the immune system. They are distributed throughout the body and are usually the first place to which cancers spread.
Metastases – Metastases are deposits of cancer that occur when the cancer has spread from the place in which it started to other parts of the body. These are commonly called secondary cancers. Disease in which this has occurred is known as metastatic disease.
MDT – The multi-disciplinary team is a group of professionals from diverse specialties that works to optimise diagnosis and treatment throughout the patient pathway.
Minimally invasive surgery – A procedure performed through the skin or anatomical opening using a laparoscopic instrument rather than through an opening. Full minimally invasive oesophagectomies involve thoracoscopy for the chest phase of the operation and laparoscopy for the abdominal phase. Oesophagectomies using minimally invasive techniques for only the abdominal or chest phase are commonly referred to as hybrid operations.
NCEPOD – National Confidential Enquiry into Patient Outcome and Death. NCEPOD is an independent, government-funded body whose remit is to examine medical and surgical care, often by undertaking confidential surveys and research.
Neo-adjuvant chemotherapy – Chemotherapy given before another treatment, usually surgery. This is usually given to reduce the size, grade or stage of the cancer and therefore improve the effectiveness of the surgery performed.
Neoplasm – A neoplasm or tumour is an abnormal mass of tissue that results when cells divide more than they should or do not die when they should. Neoplasms may be benign (not cancerous), or malignant (cancerous).
NHS Digital – A special health authority that provides facts and figures to help the NHS and social services run effectively. The Clinical Audit and Registries Management Service (CARMS) is one of its key components.
NICE – The National Institute of Health and Care Excellence is an independent organisation responsible for providing national guidance on the promotion of good health and the prevention and treatment of ill health.
Oesophagus – The portion of the digestive tract that carries food from the bottom of the throat to the top of the stomach. It is also known as the gullet or the foodpipe.
Oesophagectomy – The surgical removal of all or part of the oesophagus. The procedure can be performed by opening the thorax (a trans-thoracic oesophagectomy) or through openings in the neck and abdomen (a trans-hiatal oesophagectomy).
Oncology – The branch of medicine which deals with the non-surgical treatment of cancer, such as chemotherapy and radiotherapy.
ONS – The Office for National Statistics (ONS) is the government department responsible for collecting and publishing official statistics about the UK’s society and economy. This includes cancer registration data.
Pathology – The branch of medicine that deals with tissue specimens under a microscope to determine the type of disease and how far a cancer has spread within the specimen (i.e. whether a tumour has spread to the edges of the specimen or lymph nodes).
Palliative care – Palliative care is the care given to patients whose disease cannot be cured. It aims to improve quality of life rather than extend survival and concentrates on relieving physical and psychological distress.
PET – An imaging technique that detects cancer spread or metastases by looking at how fast radioactive sugar molecules are used by different parts of the body. Cancer cells use sugar at a very high rate so show up brightly on this test.
PEDW – Patient Episode Database for Wales (PEDW) is an administrative database which contains data on all inpatients treated within NHS hospitals in Wales. This includes details of admissions, diagnoses and treatments undergone.
Radiology – The branch of medicine that involves the use of imaging techniques (such as X-rays, CT scans and PET scans) to diagnose and stage clinical problems.
Radiotherapy – A treatment that uses radiation to kill tumour cells and so shrink the tumour. In most cases, it is a palliative treatment but it can be used together with surgery or chemotherapy in a small number of patients as part of an attempt at cure.
RCS – The Royal College of Surgeons of England is an independent professional body committed to enabling surgeons to achieve and maintain the highest standards of surgical practice and patient care. As part of this it supports audit and the evaluation of clinical effectiveness for surgery.
Squamous cell carcinoma – A tumour that is located in the cells lining the oesophagus and tends to occur in the upper or middle of the oesophagus.
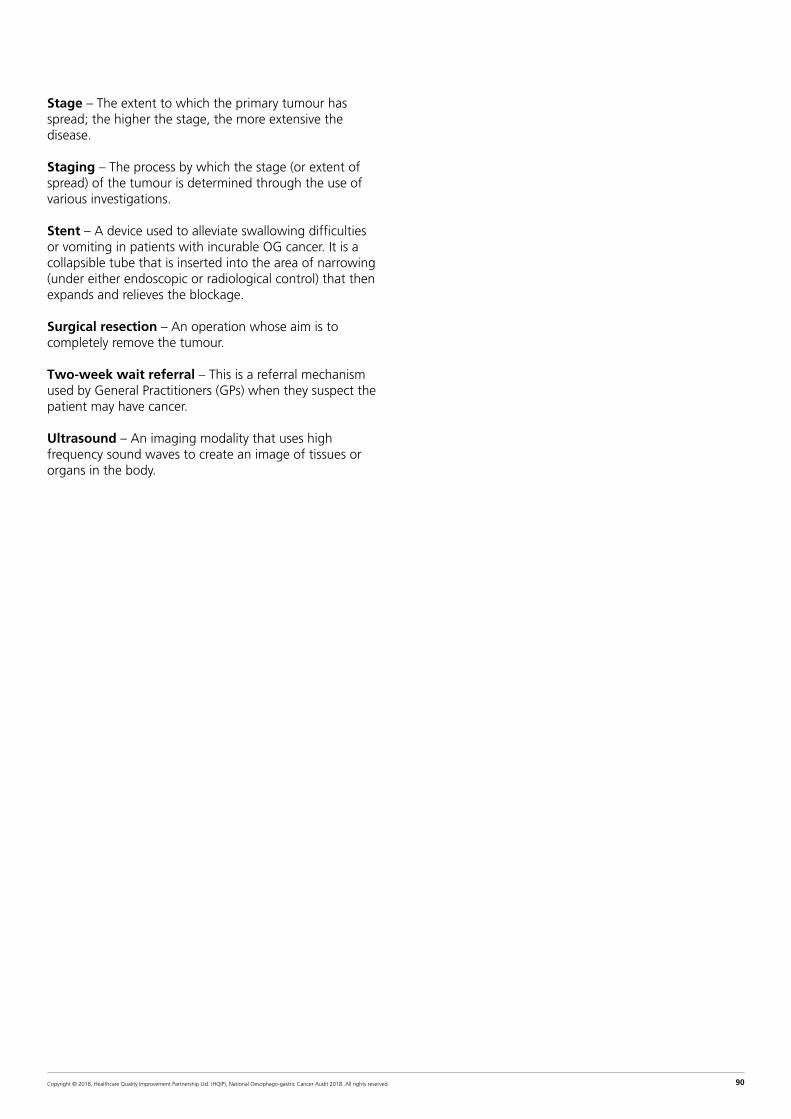
Copyright © 2018, Healthcare Quality Improvement Partnership Ltd. (HQIP), National Oesophago-gastric Cancer Audit 2018. All rights reserved. 90
Stage – The extent to which the primary tumour has spread; the higher the stage, the more extensive the disease.
Staging – The process by which the stage (or extent of spread) of the tumour is determined through the use of various investigations.
Stent – A device used to alleviate swallowing difficulties or vomiting in patients with incurable OG cancer. It is a collapsible tube that is inserted into the area of narrowing (under either endoscopic or radiological control) that then expands and relieves the blockage.
Surgical resection – An operation whose aim is to completely remove the tumour.
Two-week wait referral – This is a referral mechanism used by General Practitioners (GPs) when they suspect the patient may have cancer.
Ultrasound – An imaging modality that uses high frequency sound waves to create an image of tissues or organs in the body.